Attached files
| file | filename |
|---|---|
| 8-K - 8-K - WHITE MOUNTAINS INSURANCE GROUP LTD | wtm2015annualinvestormeeti.htm |

White Mountains Insurance Group, Ltd. Annual Investor Meeting June 12, 2015 Exhibit 99.1

2 Forward-Looking Statements This presentation contains, and management may make, certain statements that are not historical facts but that are forward-looking statements within the meaning of Section 27A of the Securities Act of 1933 and Section 21E of the Securities Exchange Act of 1934. All statements, other than statements of historical facts, included or referenced in this presentation which address activities, events or developments which White Mountains expects or anticipates will or may occur in the future are forward-looking statements. Please see our discussion on page 109 of our 2014 report on Form 10-K and on page 67 of OneBeacon’s 2014 report on Form 10-K for a more detailed discussion of the types of expressions that may identify forward-looking statements. Such statements are subject to risks and uncertainties, many of which are difficult to predict and generally beyond our control, that could cause actual results to differ materially from those expressed in, or implied or projected by, the forward-looking information and statements. In connection with the “safe harbor” provisions of the Private Securities Litigation Reform Act of 1995, we provide the following cautionary remarks regarding important risks and uncertainties which, among others, could cause our actual results to differ materially from our expectations, including those reflected in our forward-looking statements. These risks and uncertainties include, but are not limited to: (i) the risks associated with Item 1A of the Company’s and OneBeacon’s 2014 reports on Form 10-K; (ii) claims arising out of catastrophic events, such as hurricanes, earthquakes, floods, fires, terrorist attacks or severe winter weather; (iii) the continued availability of capital and financing; (iv) general economic, market or business conditions; (v) business opportunities (or lack thereof) that may be presented to us and pursued; (vi) competitive forces, including the conduct of other property and casualty insurers and reinsurers; (vii) changes in domestic or foreign laws or regulations, or their interpretation, applicable to us, our competitors or our clients; (viii) an economic downturn or other economic conditions adversely affecting our financial position; (ix) recorded loss reserves subsequently proving to have been inadequate; (x) actions taken by rating agencies from time to time, such as financial strength or credit ratings downgrades or placing ratings on negative watch; and (xi) other factors, most of which are beyond our control. Consequently, all of the forward-looking statements made in this presentation are qualified by these cautionary statements, and there can be no assurance that the actual results or developments anticipated by us will be realized or, even if substantially realized, they will have the expected consequences to, or effects on our business or operations. Our forward-looking statements speak only as of the date of this presentation and we assume no obligation to update publicly any such forward-looking statements, whether as a result of new information, future events or otherwise. Non-GAAP Financial Measures Within this presentation, we use the following non-GAAP financial measures: (i) Adjusted Shareholders’ Equity and Adjusted Book Value Per Share (ABVPS); (ii-iv) Investments Total Return, Fixed Income Total Return, and Risk Assets Total Return; (v) Sirius Group’s Adjusted Book Value (ABV); (vi) Symetra Operating ROE; (vii) Symetra Carrying Value; (viii) OneBeacon Accident Year Loss and LAE Ratio; (ix) OneBeacon Adjusted Book Value; and (x) Risk Asset Exposure. Please see the appendix at the end of the presentation for an explanation of each such non- GAAP financial measure and a reconciliation of the measure to its most closely comparable GAAP financial measure. An electronic copy of this presentation can be found at our website: www.whitemountains.com

WTM – Annual Investor Meeting Ray Barrette: Introduction and Highlights Allocation of Capital HG Global/BAM Allan Waters: Sirius Group Michael Miller: OneBeacon Rob Seelig: Insurance Services Reid Campbell / David Linker: Investments David Foy: Symetra Capital Ray Barrette: Final Comments and Q&A 3
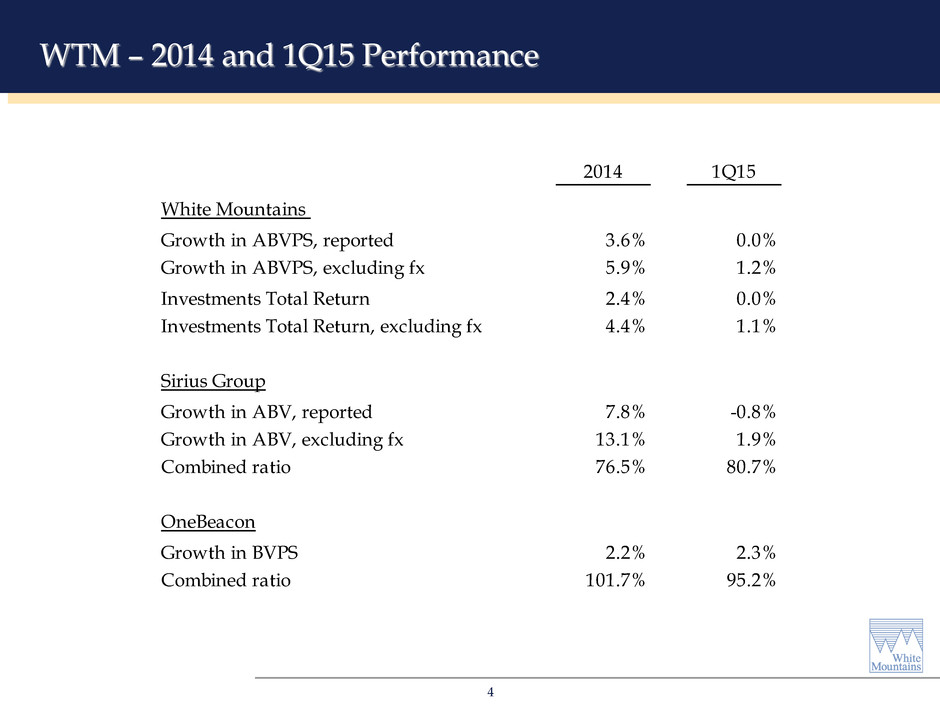
WTM – 2014 and 1Q15 Performance 4 2014 1Q15 White Mountains Growth in ABVPS, reported 3.6% 0.0% Growth in ABVPS, excluding fx 5.9% 1.2% Investments Total Return 2.4% 0.0% Investments Total Return, excluding fx 4.4% 1.1% Sirius Group Growth in ABV, reported 7.8% -0.8% Growth in ABV, excluding fx 13.1% 1.9% Combined ratio 76.5% 80.7% OneBeacon Growth in BVPS 2.2% 2.3% Combined ratio 101.7% 95.2%

Closed the sale of the OneBeacon runoff business Transition from Prospector Partners / David Linker - CIO HG Global/BAM continues to execute well in a tough environment Insurance Services Businesses: − Low capital, high potential insurance marketing/technology investments around the world − Total committed capital of $340 million − At least three great businesses (~60% of the committed capital) – one miss (small) Symetra had a good year with 10% Operating ROE; good start to 2015 Life Re runoff continues as expected, contracts expire June 2016 Net undeployed capital of about $600 million/low leverage WTM – 2014 and 1Q15 Performance 5

WTM – Allocation of Equity Capital ($ in billions) 6 Sirius Group 1.7$ OneBeacon 0.8 HG Global/BAM 0.7 Symetra 0.4 Insurance Services 0.3 Parent/Other 0.6 Elimination (0.6) 3.9$

WTM – Our Track Record Since (growth including dividends) 1-year 5-year 10-year 15-year WTM IPO White Mountains - ABVPS 3.6% 10.0% 7.7% 12.8% 14.1% S&P 500 13.7% 15.3% 7.6% 4.2% 10.8% Berkshire Hathaway - BVPS 8.3% 11.6% 10.1% 9.4% 16.8% Return Period Ended December 31, 2014 7

HG Global/BAM 8
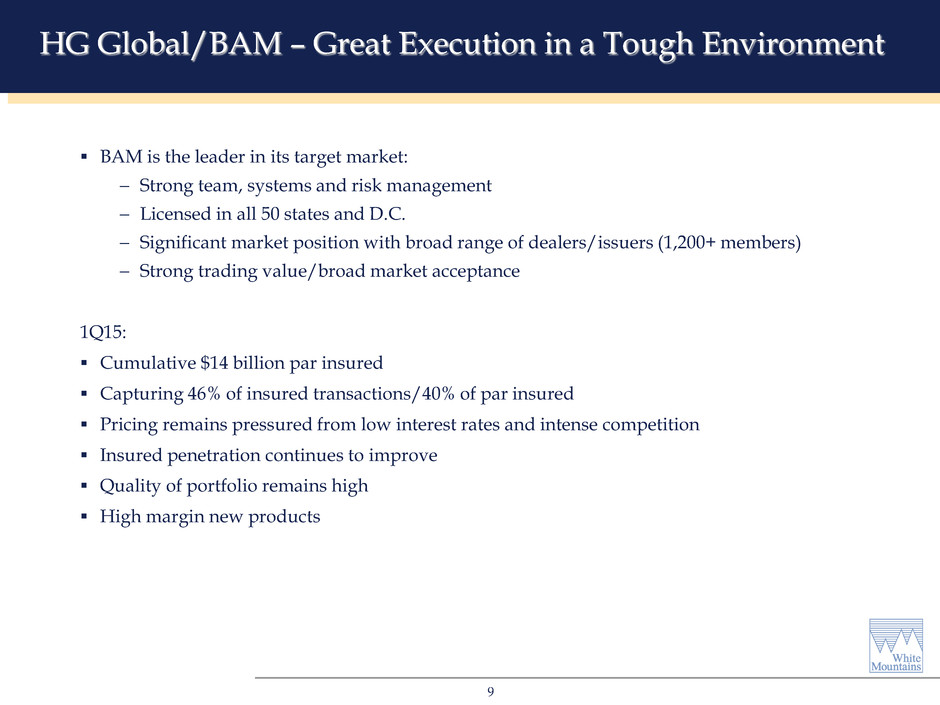
HG Global/BAM – Great Execution in a Tough Environment BAM is the leader in its target market: − Strong team, systems and risk management − Licensed in all 50 states and D.C. − Significant market position with broad range of dealers/issuers (1,200+ members) − Strong trading value/broad market acceptance 1Q15: Cumulative $14 billion par insured Capturing 46% of insured transactions/40% of par insured Pricing remains pressured from low interest rates and intense competition Insured penetration continues to improve Quality of portfolio remains high High margin new products 9
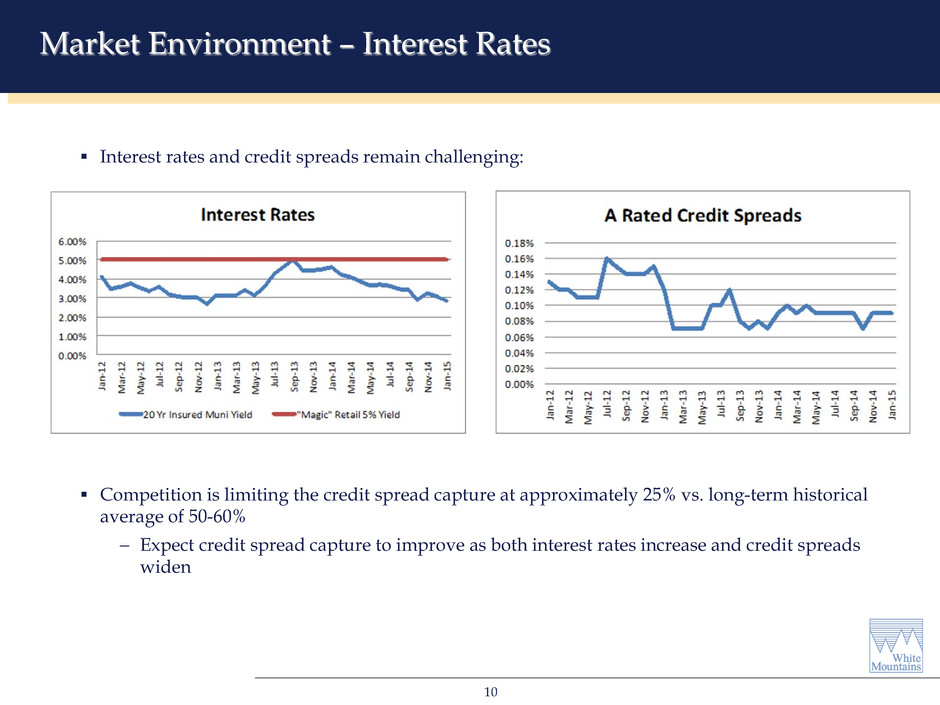
Market Environment – Interest Rates Interest rates and credit spreads remain challenging: Competition is limiting the credit spread capture at approximately 25% vs. long-term historical average of 50-60% − Expect credit spread capture to improve as both interest rates increase and credit spreads widen 10

PRIVATE CAPITAL MUTUAL CAPITAL Time HG Global/BAM - The Capital Advantage 4-6% RoC WTM economics derived from: − Interest on surplus notes − Repayment of surplus notes − Reinsurance premiums and float − Long-term franchise value 2-4% RoC 10-15% RoC Surplus Note Repayment 11

HG Global/BAM – BUILT TO LAST Current environment: − Credit quality is on target − Market share is high − Issuance volume and insured penetration growing − Pricing is below target (low rates/spreads – competition) Drivers of further success are: − Higher interest rates/spread − Pricing discipline (Puerto Rico/rating agencies) BAM’s CLEAN BALANCE SHEET NO PUERTO RICO WILL WIN OVER TIME BETTER CAPITAL STRUCTURE UNDERWRITING DISCIPLINE/TEAM 12

Sirius Group 13
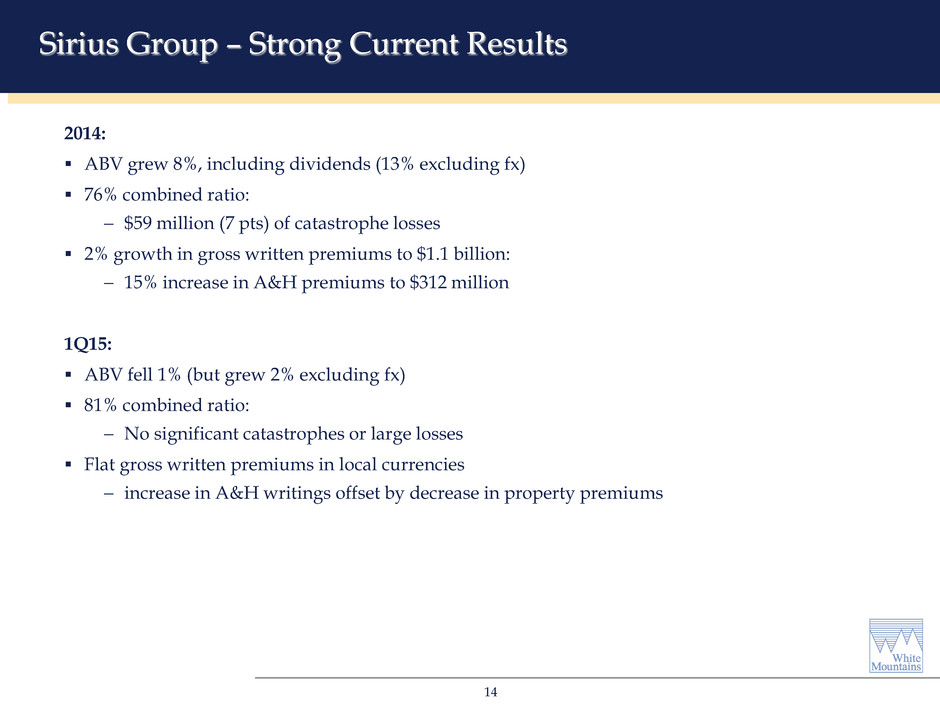
Sirius Group – Strong Current Results 2014: ABV grew 8%, including dividends (13% excluding fx) 76% combined ratio: − $59 million (7 pts) of catastrophe losses 2% growth in gross written premiums to $1.1 billion: − 15% increase in A&H premiums to $312 million 1Q15: ABV fell 1% (but grew 2% excluding fx) 81% combined ratio: − No significant catastrophes or large losses Flat gross written premiums in local currencies − increase in A&H writings offset by decrease in property premiums 14

Sirius Group – Long-Term Improvement 15

Unique global (re)insurance franchise Highly diversified portfolio carefully assembled over 70 years Written from 11 global offices run by local managers with deep experience Core book focused on local & regional relationships – over 1,700 clients in 145 countries ≈ 10,000 treaties and accounts ≈ 1/3 of book has been with us 20+ years ; ≈ 2/3 10+ years Profit driven underwriting – we walk the walk = Consistently & significantly outperformed the industry for over two decades Sirius Group – The Advantage 16

Sirius International – Long-Term Outperformance Reported Combined Ratio Note: Sirius International excludes reinsurance with affiliates. Includes Sirius America from 2012 and forward. Industry results are from S&P Global reinsurance highlights 1993-2013. 2014 Industry CR is a preliminary estimate from Swiss Re. 17

Sirius Group - 2015 Outlook (Re)insurance industry excess capital & capacity continue - Pressing rates, terms & conditions - But this isn’t 1999 (or 1984) M&A activity is accelerating - Is bigger always better? Is a bottom at hand? June Insurance Insider headlines: - “June 1st US property cat covers re-price” - “Retro market tightens” - “Re-coupling as balance tilts in US cat” Sirius Group’s long-term partnerships and diversification are serving us well 18

OneBeacon 19
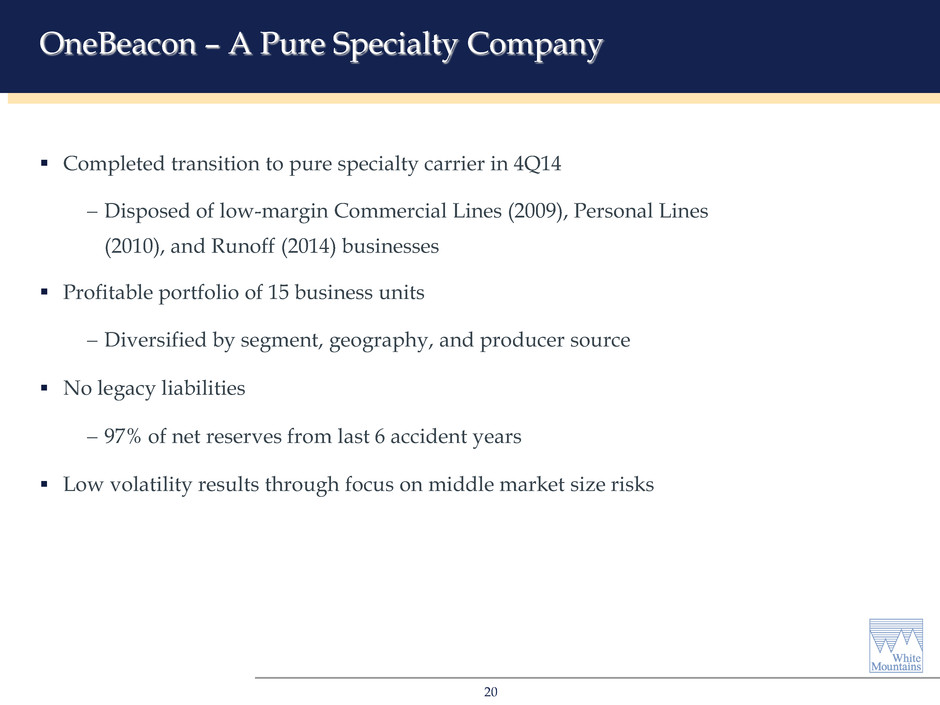
OneBeacon – A Pure Specialty Company Completed transition to pure specialty carrier in 4Q14 − Disposed of low-margin Commercial Lines (2009), Personal Lines (2010), and Runoff (2014) businesses Profitable portfolio of 15 business units − Diversified by segment, geography, and producer source No legacy liabilities − 97% of net reserves from last 6 accident years Low volatility results through focus on middle market size risks 20

2014: A Pivot Point Reserve charge masked strong results across most of our business units − Handful produced sub-90s combined ratios, despite an increasingly competitive marketplace Exited Lawyers Liability market through renewal rights sale Streamlined management oversight of underwriting operations − Moved to a single I/T platform Full attention on go forward Specialty-only business 21

0% 10% 20% 30% 40% 50% 60% 70% 2010 2011 2012 2013 2014 Strength in Underwriting Strong, consistent underlying accident years 60.2% five-year average loss and LAE ratio 22 59.5% 61.2% 58.4%60.4% 61.6% Accident year loss and LAE ratios calculated using reported loss data and development to ultimate (as of Dec-31-14) from the 10-year table reported in OneBeacon’s Form 10-K. Reflects combination of Specialty Industries and Specialty Products reportable segments as defined in OneBeacon’s 2014 Form 10-K. Accident Year Loss & LAE Ratio

Diverse Book of Business $1.2 Billion IMU Healthcare Technology Accident Govt. Risks Excludes $16 million of premiums assumed under a quota share agreement with Star & Shield Insurance Exchange, which expired on December 31, 2014. 23 Established Businesses International Marine Underwriters $ 193 Healthcare Group 181 Technology Insurance 133 Accident Group 113 Government Risks 82 Tuition Reimbursement (Dewar) 71 Specialty Property 32 Developing Businesses Entertainment 89 Other Professional 80 Management Liability 50 Financial Services 41 Environmental 21 New Businesses Programs 51 Crop Insurance 35 Surety Group 29 2014 NWP ($ in millions)

Growing Book Value Per Share 6.6% annualized growth in book value per share since IPO while executing transformation to pure specialty carrier − 8.1% annualized rate excluding losses from discontinued operations − 7.5% S&P 500 return over same period Book value through Dec-07 is adjusted to reflect economic defeasance of mandatorily redeemable preferred stock. Sep-06 book value is calculated from proforma financial statements. 24 $- $5.00 $10.00 $15.00 $20.00 $25.00 Book Value Per Share Cumulative Dividends Paid
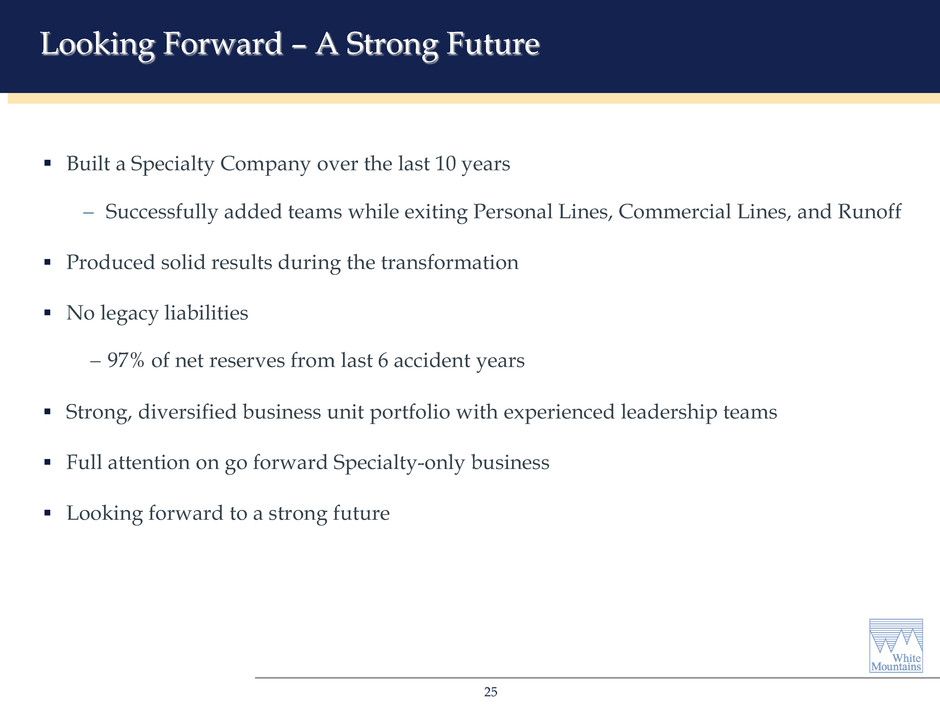
Looking Forward – A Strong Future 25 Built a Specialty Company over the last 10 years − Successfully added teams while exiting Personal Lines, Commercial Lines, and Runoff Produced solid results during the transformation No legacy liabilities − 97% of net reserves from last 6 accident years Strong, diversified business unit portfolio with experienced leadership teams Full attention on go forward Specialty-only business Looking forward to a strong future

Insurance Services 26

Insurance Services – A Growing Focus Alternative to “traditional” insurance balance sheet transactions − Lower capital / strong free cash flows − High potential Thematic investments: − Insurance marketing / technology − Price comparison − Specialization Current portfolio: − 10 investments around the world − $340 million capital committed 27

Insurance Services – Current Portfolio 28 Capital Domicile Committed Ownership ($ in millions) Insurance Marketing / Technology Tranzact U.S. 133$ 63% MediaAlpha U.S. 36 58% PassportCard Israel/Intl 21 50% Valen U.S. 2 10% Price Comparison Compare.com U.S. 20 21% Wobi Israel 29 91% durchblicker Austria 12 45% Specialization Star & Shield U.S. 23 100% Enlightenment U.S. 50 15% OneTitle U.S. 13 20% Investment
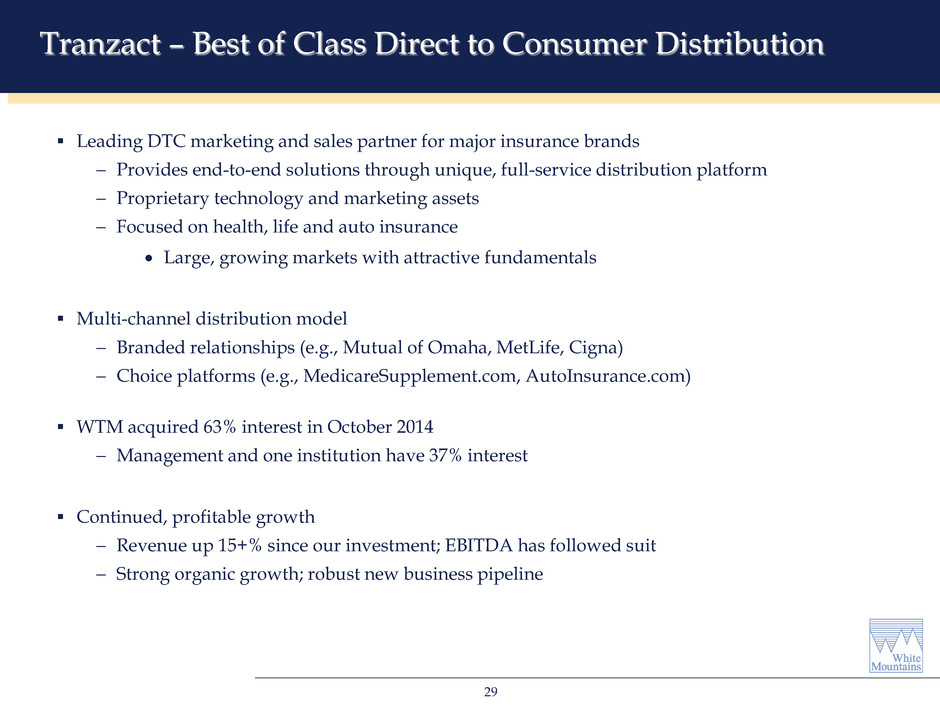
Tranzact – Best of Class Direct to Consumer Distribution Leading DTC marketing and sales partner for major insurance brands − Provides end-to-end solutions through unique, full-service distribution platform − Proprietary technology and marketing assets − Focused on health, life and auto insurance • Large, growing markets with attractive fundamentals Multi-channel distribution model − Branded relationships (e.g., Mutual of Omaha, MetLife, Cigna) − Choice platforms (e.g., MedicareSupplement.com, AutoInsurance.com) WTM acquired 63% interest in October 2014 − Management and one institution have 37% interest Continued, profitable growth − Revenue up 15+% since our investment; EBITDA has followed suit − Strong organic growth; robust new business pipeline 29

MediaAlpha – A Growth Story MediaAlpha Exchange => superior platform for buying & selling insurance leads Now holds the leading position in auto insurance − Launched new verticals for health, life, home, motorcycle and renter insurance 110 publishers and 100 advertisers actively participating on the platform − Up from 35 publishers and 40 advertisers at the time of our investment Strong, profitable growth − Exchange transactions up 12x over the past two years − Revenue up more than 2x since our investment − Strong free cash flow; paying cash dividends WTM acquired 58% interest in March 2014 (fully converted) − Founders maintain the balance 30

Wobi – A Local Market Breakthrough Leading price comparison business in Israel − Small but attractive market − Auto and other p&c insurance verticals: launched in 2013 − Pension vertical: launched in March 2015 − Health insurance vertical: will launch later in 2015 Significant growth since our investment − 58% unaided brand awareness − New auto policy sales up 10x since last year − Strong initial response to pension WTM initially acquired 61% interest in February 2014 (fully converted) − Has since acquired an additional 30% interest (fully converted) − Founder/CEO has 9% interest (fully converted) 31

Investments 32
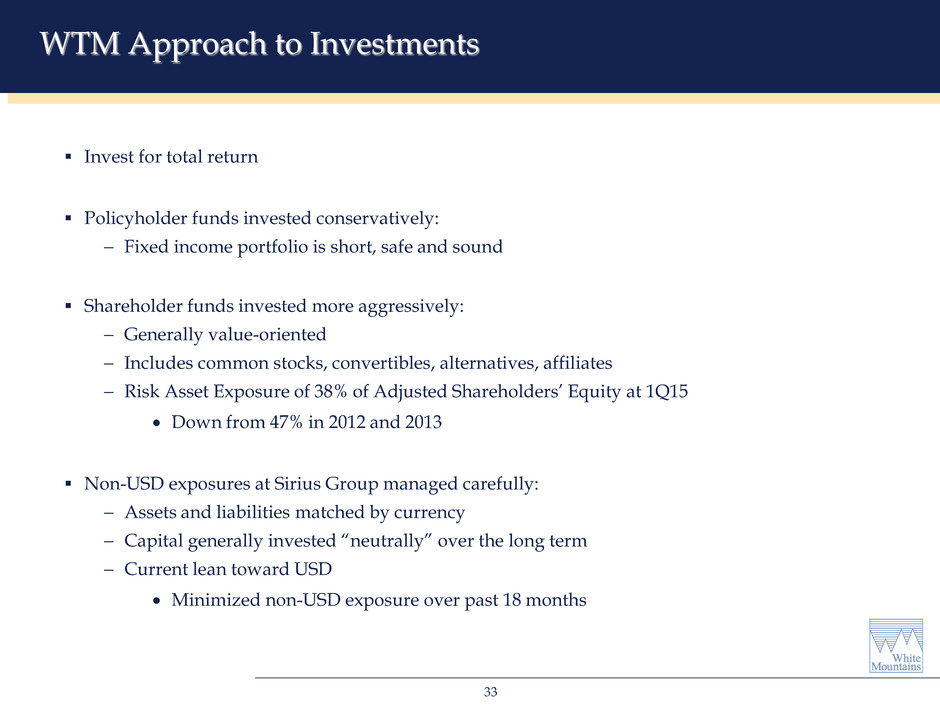
WTM Approach to Investments Invest for total return Policyholder funds invested conservatively: − Fixed income portfolio is short, safe and sound Shareholder funds invested more aggressively: − Generally value-oriented − Includes common stocks, convertibles, alternatives, affiliates − Risk Asset Exposure of 38% of Adjusted Shareholders’ Equity at 1Q15 • Down from 47% in 2012 and 2013 Non-USD exposures at Sirius Group managed carefully: − Assets and liabilities matched by currency − Capital generally invested “neutrally” over the long term − Current lean toward USD • Minimized non-USD exposure over past 18 months 33

Good Long-Term Track Record 34 1Q15 1-year 5-year 14-year fixed income, ex currency 0.9% 2.6% 2.7% 4.5% risk assets, ex currency 1.9% 9.3% 9.4% 9.1% total, ex currency 1.1% 4.4% 4.4% 5.3% currency -1.1% -2.0% -0.3% -0.1% total portfolio 0.0% 2.4% 4.1% 5.2% benchmarks: B barclays U.S. intermediate aggregate 1.3% 4.1% 3.7% 4.9% S s&p 500 1.0% 13.7% 15.5% 5.3% 10 BAML 10Y US treasury 2.6% 10.7% 6.1% 5.4% Total Return (periods ending 12/31/14)

Risk Asset Exposure at Comfortable Levels 35 0% 10% 20% 30% 40% 50% 60% 70% 80% 90% 100% 2011 2012 2013 2014 1Q15 Risk Asset Exposure and Mix ($ in billions, percent) Affiliated risk asset investments Alternative investments Convertible bonds & preferred stocks Common stocks, reits & high yield Risk asset exposure $1.5 $1.9 $2.0 $1.6 $1.6
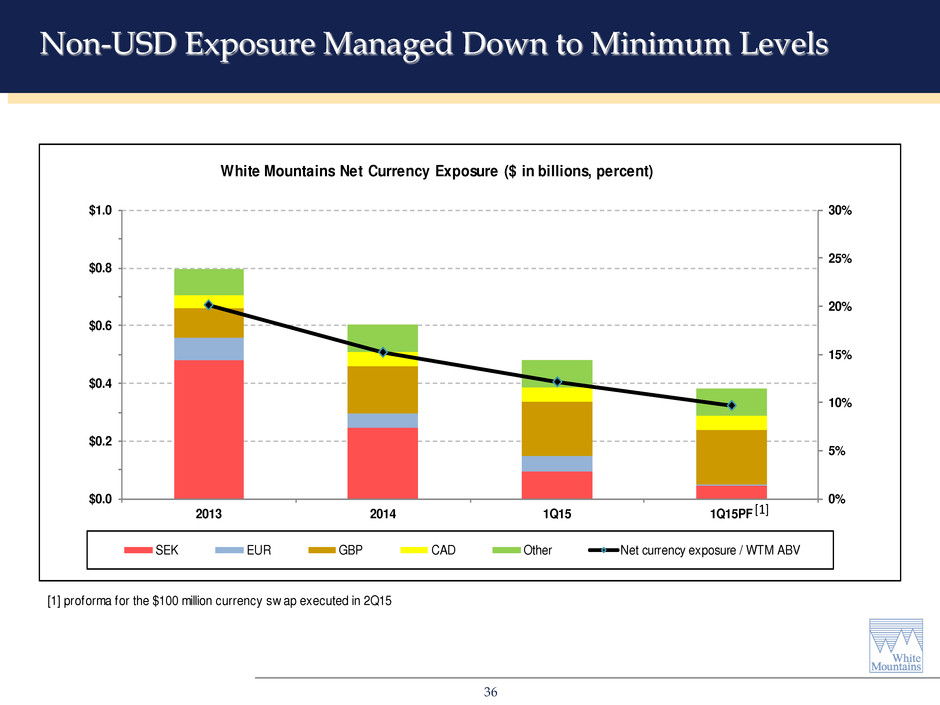
Non-USD Exposure Managed Down to Minimum Levels 36 [1] proforma for the $100 million currency sw ap executed in 2Q15 0% 5% 10% 15% 20% 25% 30% $0.0 $0.2 $0.4 $0.6 $0.8 $1.0 2013 2014 1Q15 1Q15PF White Mountains Net Currency Exposure ($ in billions, percent) SEK EUR GBP CAD Other Net currency exposure / WTM ABV [1]

Risk Asset Playbook for 2015 Equity valuations are elevated − Global QE encouraging purchases of risk assets − Equity markets have roughly doubled in past five years Equity valuations appear reasonable relative to fixed income − Corporate balance sheets in good shape − Low rates on bonds; negative rates across Europe − Potential for negative price returns on bonds We have dry powder should equities trade off Careful management of existing risk asset portfolio: − Rotated Prospector accounts into liquid broad market ETFs (e.g. S&P 500, Russell 1000) − Patiently consider additional sub-advisors following our value-oriented/bottom-up approach to investing − Maintain a high hurdle rate for new alternative assets 37
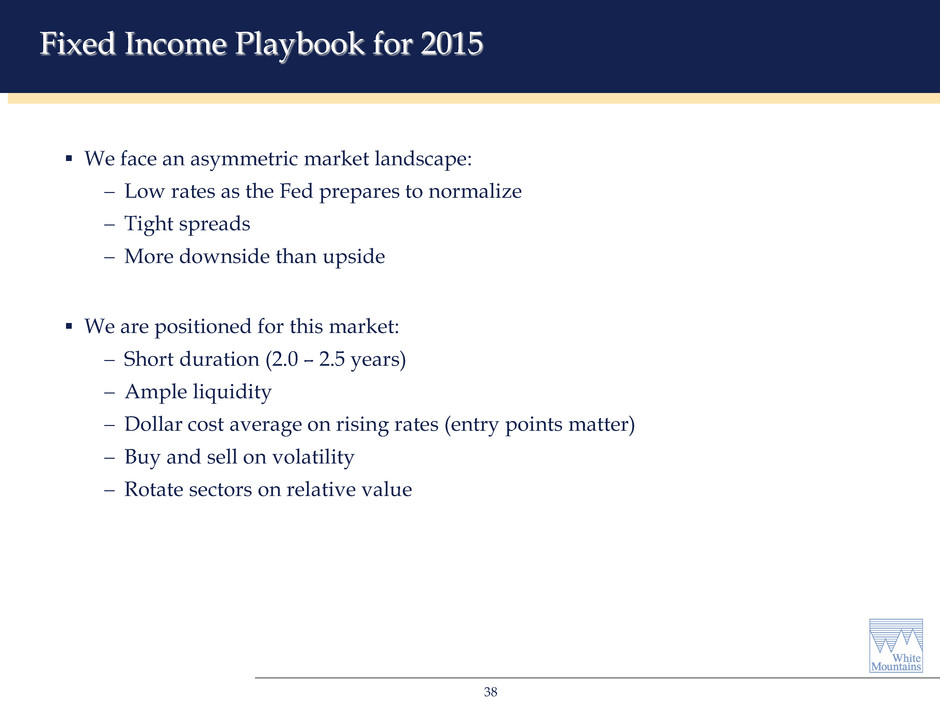
Fixed Income Playbook for 2015 We face an asymmetric market landscape: − Low rates as the Fed prepares to normalize − Tight spreads − More downside than upside We are positioned for this market: − Short duration (2.0 – 2.5 years) − Ample liquidity − Dollar cost average on rising rates (entry points matter) − Buy and sell on volatility − Rotate sectors on relative value 38

Symetra 39

Symetra WTM invested $195 million as lead investor in August 2004 acquisition Symetra went public in January 2010 Total current carrying value of WTM’s investment = $514 million ($605 million at market) − Includes $135 million of cumulative dividends received Inception to date returns on WTM’s investment through 1Q15: − Carrying Value 11.4% − SYA ABV 12.1% − SYA Market Value 13.2% − S&P 500 8.0% − S&P Financials 0.6% 40

Capital 41

Consolidated Capitalization ($ in millions) 2013 2014 1Q15 Debt 676$ 747$ 750$ Non-controlling interest - SIG preference shares 250 250 250 Non-controlling interest - OneBeacon 274 258 259 Non-controlling interest - Other, excluding mutuals/reciprocals 66 169 160 Adjusted shareholders' equity 3,946 3,961 3,947 Total adjusted capital 5,212$ 5,385$ 5,366$ Debt to total adjusted capital 13% 14% 14% Debt and preferred to total adjusted capital 18% 19% 19% 42

What to Expect Growth in adjusted book value per share Commitment to our operating principles: − Underwriting comes first − Maintain a disciplined balance sheet − Invest for total return − Think like owners Capital management Opportunistic approach to the business 43

Wise Words... Benjamin Graham “In the short run, the market is a voting machine, but in the long run it is a weighing machine.” Benjamin Graham 44

Q&A 45

Appendix 46

Appendix i White Mountains Insurance Group, Ltd. Reconciliation of GAAP book value per share to adjusted book value per share ($ in millions, except per share amounts; shares in thousands) Numerator 2013 2014 1Q15 GAAP common shareholders' equity (GAAP book value per share numerator) $ 3,906 $ 3,996 $ 4,011 equity in net unrealized losses (gains) from Symetra's fixed maturity portfolio, net of applicable taxes 40 (35) (64) adjusted book value per share numerator (adjusted shareholders' equity) $ 3,946 $ 3,961 $ 3,947 Denominator common shares outstanding (GAAP book value per share denominator) 6,177 5,986 5,992 unearned restricted shares (33) (26) (43) adjusted book value per share denominator 6,144 5,961 5,948 GAAP book value per share (BVPS) $ 632 $ 667 $ 669 adjusted book value per share (ABVPS) $ 642 $ 665 $ 664 growth in GAAP BVPS, including dividends [1] 5.7% 0.4% growth in ABVPS, including dividends [1] 3.6% 0.0% fx impact on adjusted book value per share $ 0 $ (15) $ (8) growth in ABVPS excluding fx, including dividends [1] 5.9% 1.2% [1] White Mountains declared $1.00 per share dividend in the first quarter of each period shown.

Appendix ii White Mountains Insurance Group, Ltd. Reconciliation of GAAP investment returns to total return, fixed income total return and risk assets total return Investment Return Reconciliation - 2014 GAAP Adjusting Return Return Items Return ex currency fixed income 0.5% -0.3% [1] 0.2% 2.6% risk assets 7.1% 1.3% [2] 8.4% 9.3% total return 1.9% 0.5% 2.4% 4.4% [1] Difference primarily attributable to consolidation under GAAP of fixed income investments held by HG Global and BAM, the inclusion of OneBeacon's pension plan fixed income investments, and the impact of time value weighting of capital flows. [2] Difference primarily attributable to consolidation under GAAP of investments held by certain limited parterships, the inclusion of OneBeacon's pension plan equity investments, the inclusion of Symetra common stock at adjusted carrying value, the exclusion of OBIC surplus notes, and the impact of time value weighting of capital flows.

Appendix iii White Mountains Insurance Group, Ltd. Reconciliation of GAAP investment returns to total return, fixed income total return and risk assets total return Investment Return Reconciliation - 1Q15 GAAP Adjusting Return Return Items Return ex currency fixed income -0.4% -0.1% [1] -0.5% 0.9% risk assets 1.0% 0.8% [2] 1.8% 1.9% total return -0.1% 0.1% 0.0% 1.1% [1] Difference primarily attributable to consolidation under GAAP of fixed income investments held by BAM, the inclusion of OneBeacon's pension plan fixed income investments, and the impact of time value weighting of capital flows. [2] Difference primarily attributable to consolidation under GAAP of investments held by certain limited parterships, the inclusion of OneBeacon's pension plan equity investments, the inclusion of Symetra common stock at adjusted carrying value, the inclusion of insurance services invested assets, the exclusion of OBIC surplus notes, and the impact of time value weighting of capital flows.

Appendix iv White Mountains Insurance Group, Ltd. Reconciliation of GAAP investment returns over 5-year and 14-year periods to total return, fixed income total return and risk assets total return GAAP Adjusting Total Return Total Return Items [1] ex Currency 5-year 3.8% 0.6% 4.4% 14-year 4.8% 0.5% 5.3% Fixed Income GAAP Adjusting Total Return Fixed Income Return Items [1] ex Currency 5-year 2.4% 0.3% 2.7% 14-year 4.3% 0.2% 4.5% Risk Assets GAAP Adjusting Total Return Risk Assets Return Items [1] ex Currency 5-year 9.4% 0.0% 9.4% 14-year 8.0% 1.1% 9.1% [1] Difference primarily attributable to the (i) inclusion of investment results of OneBeacon's pension plan and certain investments that under GAAP are accounted for as investments in unconsolidated affiliates, (ii) exclusion of investment results of reciprocal insurance exchanges, HG Global and BAM, (iii) impact of consolidation of certain entities consolidated under GAAP, (iv) inclusion of investment income resulting from interest credited on funds withheld by ceding companies, (v) impact of time value weighting of capital flows and certain intra-portfolio reclassifications when calculating investment returns, and (vi) the impact of foreign currency translation on investment results.

Appendix v White Mountains Insurance Group, Ltd. Reconciliation of Sirius Group's GAAP book value to adjusted book value (ABV) ($ in millions) 2013 2014 1Q15 GAAP common shareholder's equity $ 1,627 $ 1,763 $ 1,777 equity in net unrealized (gains) losses from Symetra's fixed maturity portfolio, net of applicable taxes 36 (30) (53) ABV - legal entity $ 1,663 $ 1,733 $ 1,724 remove investment in OneBeacon (164) (159) (159) ABV - segment $ 1,499 $ 1,574 $ 1,565 growth in GAAP BV, including dividends [1] 11.4% 0.8% growth in segment ABV, including dividends [1] 7.8% -0.8% fx impact on adjusted book value $ (78) $ (41) growth in ABV excluding fx, including dividends [1] 13.1% 1.9% [1] Sirius Group declared $50 million of dividends in 2014; no dividends were declared in 1Q15.

Appendix vi White Mountains Insurance Group, Ltd. Reconciliation of Symetra's GAAP ROE to operating ROE ($ in millions) 2014 Numerator GAAP net income $ 254 less: certain net realized gains (27) adjusted operating income $ 227 Denominator GAAP average common shareholders' equity $ 3,260 less: average AOCI (858) average adjusted book value $ 2,402 GAAP ROE 8% operating ROE 10%

Appendix vii White Mountains Insurance Group, Ltd. Reconciliation of GAAP carrying value and inception to date returns on White Mountains's investment in Symetra to an adjusted basis which excludes White Mountains's share of unrealized gains/losses from Symetra's fixed maturity portfolio. Impact of Removing Carrying GAAP SFAS 115 Value WTM investment in Symetra common shares $ 447 $ 68 $ 379 Inception to date returns: Using WTM's carrying value as terminal value 12.8% -1.4% 11.4% Using Symetra's adjusted book value as terminal value 15.5% -3.4% 12.1%

Appendix viii White Mountains Insurance Group, Ltd. Reconciliation of OneBeacon's reported loss and loss adjustment expenses to accident year loss and loss adjustment expense ratios ($ in millions) 2010 2011 2012 2013 2014 Numerator [1]: Reported loss and loss adjustment expenses $ 540 $ 548 $ 650 $ 622 $ 815 Less: fav/(unfav) prior year loss reserve development recorded in then-current calendar year [2] 28 30 7 - (90) Add: (fav)/unfav loss reserve development recorded in subsequent calendar years [2] 15 42 27 32 - Accident year loss and loss adjustment expenses $ 583 $ 620 $ 684 $ 655 $ 725 Denominator [1]: Net earned premium $ 979 $ 1,012 $ 1,132 $ 1,120 $ 1,177 Ratio: Reported loss and loss adjustment expense ratio 55.1% 54.2% 57.4% 55.5% 69.2% Accident year loss and loss adjustment expense ratio 59.5% 61.2% 60.4% 58.4% 61.6% [1] Reflects combination of Specialty Industries and Specialty Products reportable segments as defined in OneBeacon's 2014 Annual Report on Form 10-K. [2] Calculated using information included in the 10-year table published on page 10 of OneBeacon's 2014 Annual Report on Form 10-K.

Appendix ix White Mountains Insurance Group, Ltd. Reconciliation of OneBeacon's reported book value and book value per share to adjusted book value and adjusted book value per share. ($ in millions, except per share amounts) 2006 2007 Numerator: Reported book value $ 1,777 $ 1,907 Less: remaining adjustment of subsidiary preferred stock to face value (58) (22) Adjusted book value $ 1,720 $ 1,885 Denominator: Common shares outstanding (millions) 100 99 Value: Reported book value per share 17.77$ 19.36$ Adjusted book value per share 17.20$ 19.14$
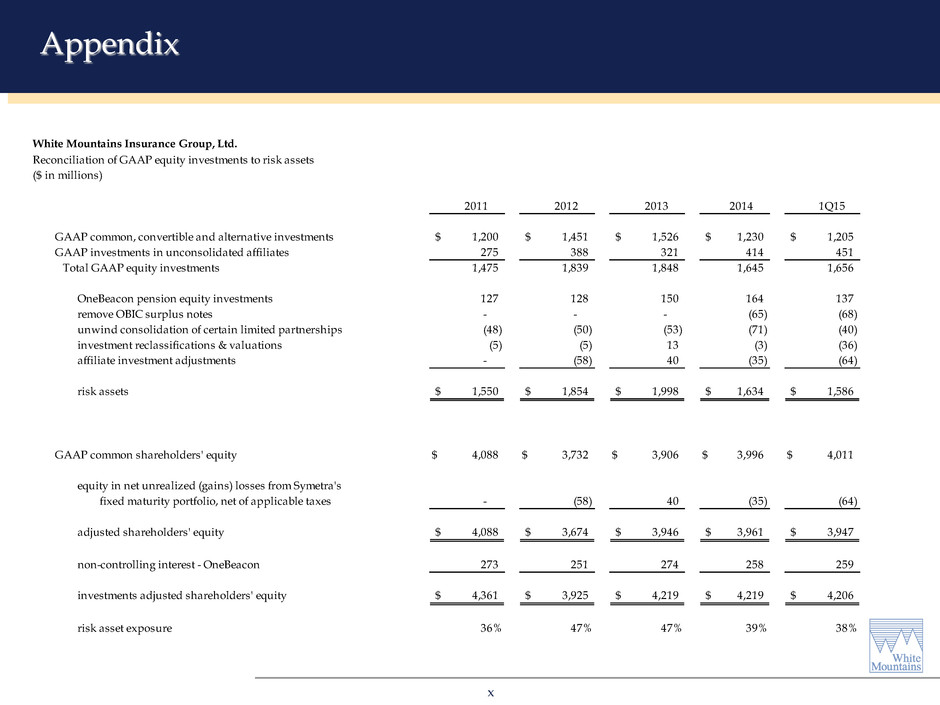
Appendix x White Mountains Insurance Group, Ltd. Reconciliation of GAAP equity investments to risk assets ($ in millions) 2011 2012 2013 2014 1Q15 GAAP common, convertible and alternative investments $ 1,200 $ 1,451 $ 1,526 $ 1,230 $ 1,205 GAAP investments in unconsolidated affiliates 275 388 321 414 451 Total GAAP equity investments 1,475 1,839 1,848 1,645 1,656 OneBeacon pension equity investments 127 128 150 164 137 remove OBIC surplus notes - - - (65) (68) unwind consolidation of certain limited partnerships (48) (50) (53) (71) (40) investment reclassifications & valuations (5) (5) 13 (3) (36) affiliate investment adjustments - (58) 40 (35) (64) risk assets $ 1,550 $ 1,854 $ 1,998 $ 1,634 $ 1,586 GAAP common shareholders' equity $ 4,088 $ 3,732 $ 3,906 $ 3,996 $ 4,011 equity in net unrealized (gains) losses from Symetra's fixed maturity portfolio, net of applicable taxes - (58) 40 (35) (64) adjusted shareholders' equity $ 4,088 $ 3,674 $ 3,946 $ 3,961 $ 3,947 non-controlling interest - OneBeacon 273 251 274 258 259 investments adjusted shareholders' equity $ 4,361 $ 3,925 $ 4,219 $ 4,219 $ 4,206 risk asset exposure 36% 47% 47% 39% 38%
