Attached files
| file | filename |
|---|---|
| 8-K - FORM 8-K - Discover Financial Services | d939513d8k.htm |
 William Blair Growth Stock Conference
David Nelms Chairman & Chief Executive Officer June 10, 2015 1 Exhibit 99.1 |
 Notice The following slides are part of a presentation by Discover Financial Services (the "Company") and are intended to be viewed as part of
that presentation. No representation is made that the information in these
slides is complete. Throughout these materials, we refer to
direct-to-consumer deposits, or DTC deposits. DTC deposits include deposit products that we offer to customers through direct marketing, internet origination and affinity relationships. DTC deposits include certificates of deposits, money
market accounts, online savings and checking accounts, and IRA
certificates of deposit. The information provided herein includes certain
non-GAAP financial measures. The reconciliations of such measures to the comparable GAAP figures are included at the end of this presentation, which is available on the Company’s website at www.discover.com and the SEC’s website. The presentation contains forward-looking statements. You are cautioned not to place undue reliance on forward-looking statements, which
speak only as of the date on which they are made, which reflect
management’s estimates, projections, expectations or beliefs at that time, and which are subject to risks and uncertainties that may cause actual results to differ materially. For a discussion of certain risks and
uncertainties that may affect the future results of the Company, please
see "Special Note Regarding Forward-Looking Statements," "Risk Factors," "Business – Competition," "Business – Supervision and Regulation" and "Management’s Discussion and Analysis of Financial Condition and Results of
Operations" in the Company’s Annual Report on Form 10-K for the year ended
December 31, 2014 and "Management’s Discussion and Analysis of
Financial Condition and Results of Operations" in the Company’s Quarterly Report on Form 10-Q for the quarter ended March 31, 2015 which is filed with the SEC and available at the SEC's website (www.sec.gov). The Company does not undertake to update or revise forward-looking
statements as more information becomes available.
We own or have rights to use the trademarks, trade names and service marks that we use
in conjunction with the operation of our business,
including, but not limited to: Discover®, PULSE®, Cashback Bonus®, Discover Cashback Checking®, Discover it®, Freeze It SM , Discover® Network and Diners Club International®. All other trademarks, trade names and service marks included in this presentation are the property of their respective owners. 2 |
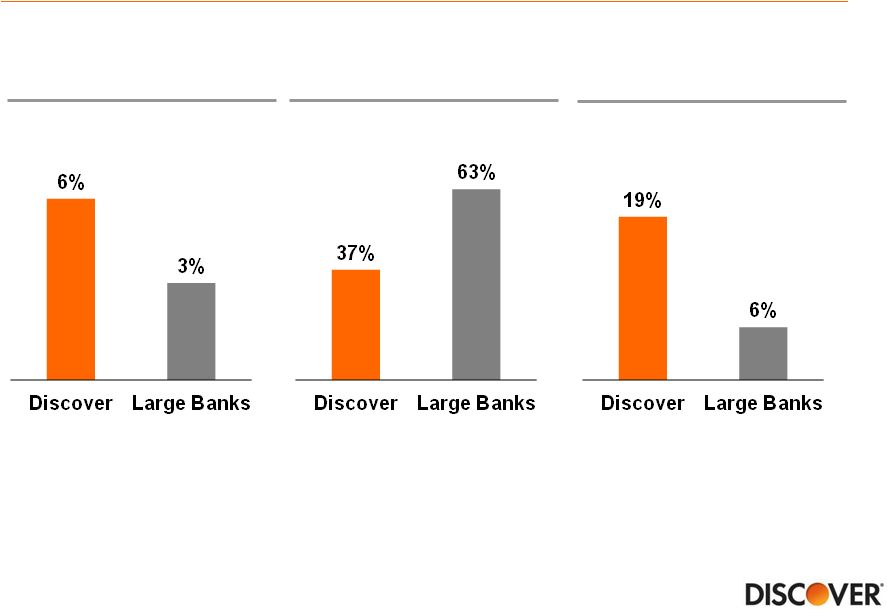
 Positioned as the leading direct bank & payments partner
Note(s) Balances as of March 31, 2015; pre-tax profit and volume based on the trailing four quarters ending 1Q15; direct-to-consumer deposits
includes affinity deposits Direct Banking
(98% of DFS Pre-Tax Profit)
Payment Services (2% of DFS Pre-Tax Profit) Card Issuing • $53Bn in card receivables • $116Bn card sales volume • Leading cash rewards program • 1 in 4 U.S. households Lending and Deposits • $14Bn personal loans and private student loans • $29Bn direct-to-consumer deposits • Cashback checking • Home loan originations • Home equity installment loans • $10Bn volume • 10+ network alliances • $165Bn volume • 3,700+ issuers • $27Bn volume • 80+ licensees • 185+ countries / territories Network Partners 3 |
 Executive
Summary Attractive business model with a solid record of
success •
Delivering strong card growth
Driven by more new accounts, wallet share gain, industry low attrition
rate and great credit results
(1) Aided by proprietary network impact on brand, acceptance and rewards • Utilizing consumer unsecured lending and marketing capabilities to grow non-card assets • Leveraging a payments partnership strategy to position the business for growth • Creating shareholder value through effective capital management Note(s) 1. Argus Information and Advisory Services, LLC used for attrition rate data 4 – – |
 Direct
Banking – Faster loan growth, better efficiencies and higher
returns 2009-2014 Average
Efficiency Ratio (1) 2009-2014 Average Return on Equity 2009-2014 CAGR Total Loan Growth (%) (2) Note(s) 1. Non-interest expense divided by total revenue (net interest income and noninterest income)
2. Bank holding companies participating in the 2015 Comprehensive Capital Analysis and Review (CCAR); excludes Synchrony Financial, Santander
Holdings USA, Goldman Sachs, BMO Financial, HSBC USA and Deutsche Bank
from some metrics due to limited information; excludes Discover
3. 2009 adjusted to exclude $1.4 billion ($0.9 billion after taxes) Visa and MasterCard settlement
(3) (2) Source SNL, regulatory reports; Discover (2) (3) 5 |
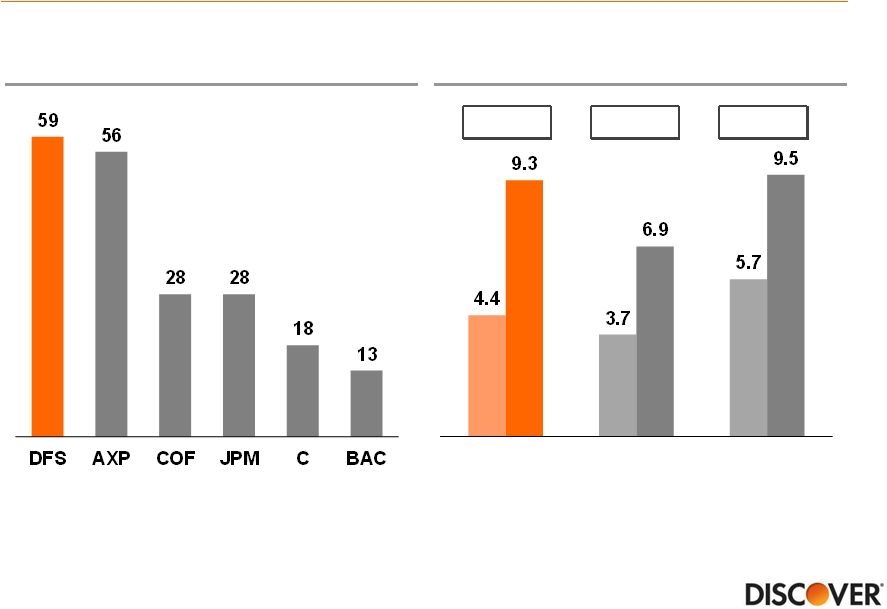
 Card
- Outperforming peers in loan growth and credit
performance Card Loan Growth (%YOY)
Note(s) 1. Includes weighted average card loan growth for American Express (U.S. Card), Bank of America (U.S. Card), Capital One (U.S. Card adjusted for
portfolio acquisitions and divestitures and excludes installment loans),
Citi (Citi-branded Cards N.A.), JPMorgan Chase (Card Services) and Wells Fargo (Consumer Credit Card 1Q12-1Q15) 2. Weighted average rate; includes U.S. card net charge-off rates for American Express (U.S. Card), Bank of America (U.S. Card), Capital One (U.S. Card), Citi (Citi-branded Cards N.A.), JPMorgan Chase (Card Services) and Wells Fargo (1Q11-1Q15) (1) Card Net Charge-off Rate (%) (2) Source Public company data 6 |
 Proprietary network drives brand recognition and increasing
acceptance Domestic Acceptance 2014 Average Unaided Card Brand Awareness Source 2014 Millward Brown Brand Tracking Study Source The Nilson Report, February 2005 and February 2015 issues 2004 2014 2004 2014 2004 2014 +111% +86% +67% Discover American Express Visa / MasterCard 7 |
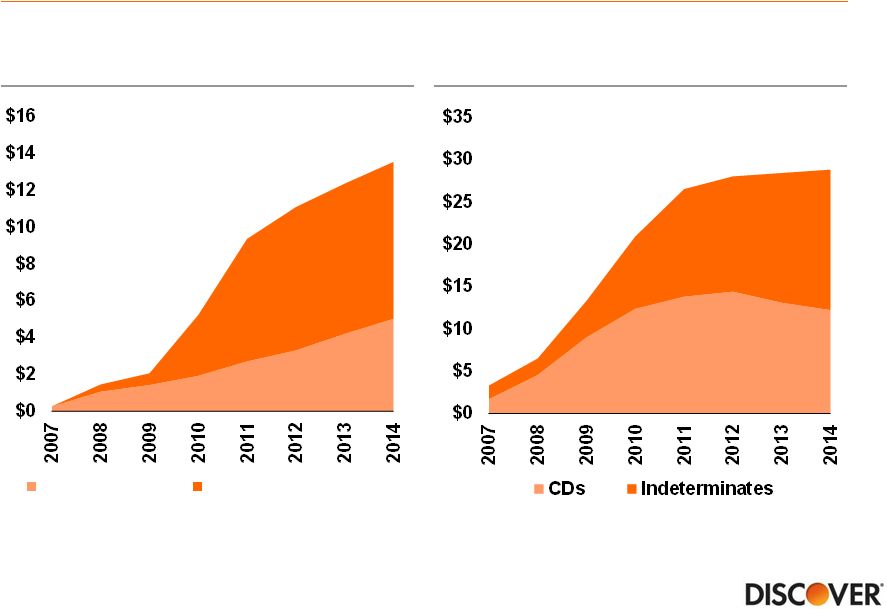 Growing
non-card loan balances and funding channels Non-Card
Loans ($Bn)
(1) Direct-to-Consumer Deposits ($Bn) (2) Note(s) 1. Excludes federal student loans, majority of which were sold in 2010 with a subsequent sale of the remaining portfolio in 2012
2. Includes affinity deposits 3. Indeterminates include savings, money market and checking balances 42% of funding at 12/31/14 20% of total loans at 12/31/14 8 (3) Personal Loans Private Student Loans |
 Strong
capital level allows for significant capital returns Note(s)
1. Common Equity Tier 1 Capital Ratio (Basel III fully phased-in) is calculated using Basel III fully phased-in common equity tier 1
capital, a non-GAAP measure. The Company believes that the
common equity tier 1 capital ratio based on fully phased-in Basel III rules is an important complement to the existing capital ratios and for comparability to other financial institutions. For the corresponding reconciliation of common equity tier 1 capital and risk weighted assets calculated
under fully phased-in Basel III rules to common equity tier 1 capital
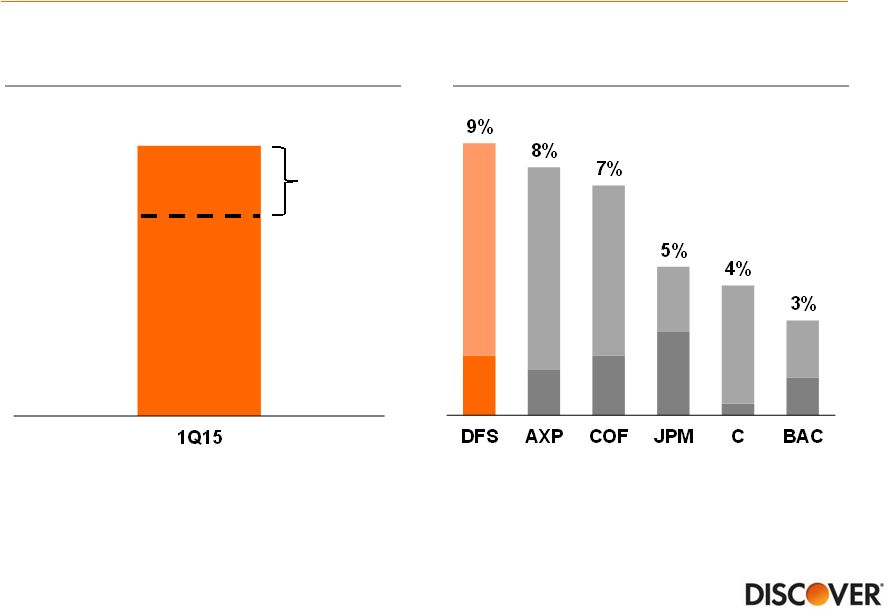
and risk weighted assets calculated under Basel III transition rules, see appendix 2. CCAR announced capital actions (buybacks and dividends) pro-rated for four quarters ending 1Q16 divided by market capitalization as of 5/29/15 DFS Common Equity Tier 1 Ratio (1) Estimated Dividend and Buyback Yield (2) 11% Target $2.5Bn+/- 14.7% 9 Source Public Company Disclosures |
 Appendix |
 Reconciliation of GAAP to non-GAAP data
11 Note(s) 1. Adjustments related to capital components for fully phased-in Basel III include the phase-in of the intangible asset
exclusion 2.
Key differences under fully phased-in Basel III rules in the calculation of
risk-weighted assets include higher risk weighting for past due loans and unfunded commitments 3. As of January 1, 2015 regulatory capital ratios are calculated under Basel III rules subject to transition provisions. We reported under
Basel I at December 31, 2014, September 30, 2014, June 30, 2014 and March
31, 2014 4.
Common equity tier 1 capital ratio (Basel III fully phased-in) is calculated using
common equity tier 1 capital (Basel III fully phased-in), a non-GAAP measure, divided by risk weighted assets (Basel III fully phased-in) Quarter Ended (unaudited, $ in millions) 3/31/15 Common equity Tier 1 capital (Basel III transition) $10,497 Adjustments related to capital componentes during transition (1) (87) Common equity Tier 1 capital (Basel III fully phased-in) $10,410 Risk weighted assets (Basel III transition) $70,864 Risk weighted assets (Basel III fully phased-in) (2) $70,757 Common equity Tier 1 capital (Basel III transition) (3) 14.8% Common equity Tier 1 capital (Basel III fully phased-in) (3,4) 14.7% |