Attached files
| file | filename |
|---|---|
| 8-K - FORM 8-K - AV Homes, Inc. | d940894d8k.htm |
| EX-2.1 - EX-2.1 - AV Homes, Inc. | d940894dex21.htm |
| EX-99.1 - EX-99.1 - AV Homes, Inc. | d940894dex991.htm |
| Exhibit 99.2
|
HOMESTM
Investor Presentation
June 2015
|
|
Disclaimer
Forward-Looking Statements
This Investor Presentation contains “forward-looking statements” within the meaning of the U.S. federal securities laws, which statements may include information regarding the plans, intentions, expectations, future financial performance, or future operating performance of the Company and Bonterra. These statements include, but are not limited to, those relating to the timing and likelihood of consummation of the Bonterra acquisition, the calculation of the purchase price for the Bonterra acquisition, and the benefits of the Bonterra acquisition to AV Homes, Inc. (“AVHI” or the “Company”). Forward-looking statements are based on the expectations, estimates, or projections of management as of the date of this Investor Presentation. Although our management believes these expectations, estimates, or projections to be reasonable as of June 10, 2015, forward-looking statements are inherently subject to significant business risks, economic and competitive uncertainties, and other contingencies which could cause our actual results or performance to differ materially from what may be expressed or implied in the forward-looking statements. Such factors include, among others: the occurrence of any event, change or other circumstances that could give rise to the termination of the Bonterra Agreement; the inability to complete the acquisition of Bonterra?s business due to the failure to satisfy the conditions to completion of the transactions, including any inability to secure financing or third-party consents; unexpected costs or unexpected liabilities that may arise from the Bonterra transaction, whether or not consummated; the outcome of any legal proceedings relating to the acquisition or the Bonterra Agreement; risks to consummation of the acquisition, including the risks that the acquisition will not be consummated within the expected time period or at all, the risk that we will be unable to recognize the expected benefits of the proposed transaction and the risk that the proposed transaction disrupts current plans and operations. Other important factors that could cause our actual results or performance to differ materially from our forward- looking statements include those set forth in the “Risk Factors” section of our Annual Report on Form 10-K for the year ended December 31, 2014, and in our other filings with the Securities and Exchange Commission (the “SEC”), which filings are available on www.sec.gov. Readers are cautioned not to place undue reliance on any forward-looking statements contained herein, which reflect management?s opinions only as of the date hereof. The Company disclaims any intention or obligation to update or revise any forward-looking statements to reflect subsequent events and circumstances, except to the extent required by applicable law.
*Information in this Investor Presentation is as of March 31, 2015 unless otherwise stated
| 2 |
|
|
|
Transaction Overview
AV Homes Company Update
|
|
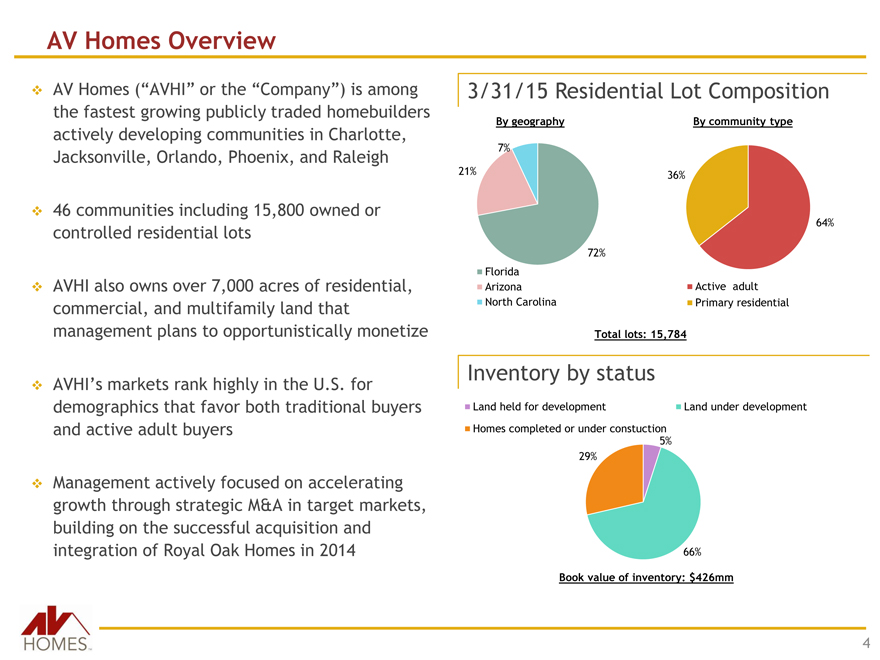
AV Homes Overview
AV Homes (“AVHI” or the “Company”) is among the fastest growing publicly traded homebuilders 3/31/15 Residential Lot Composition actively developing communities in Charlotte, Jacksonville, Orlando, Phoenix, and Raleigh
46 communities including 15,800 owned or controlled residential lots
AVHI also owns over 7,000 acres of residential, commercial, and multifamily land that management plans to opportunistically monetize
21%
By geography
7%
Florida
Arizona
North Carolina
36%
72%
Total lots: 15,784
By community type
Active adult
Primary residential
64%
AVHI?s markets rank highly in the U.S. for demographics that favor both traditional buyers and active adult buyers
Inventory by status
Land held for development Land under development
Homes completed or under constuction
5%
Management actively focused on accelerating growth through strategic M&A in target markets, building on the successful acquisition and integration of Royal Oak Homes in 2014
29%
66%
Book value of inventory: $426mm
| 4 |
|
|
|
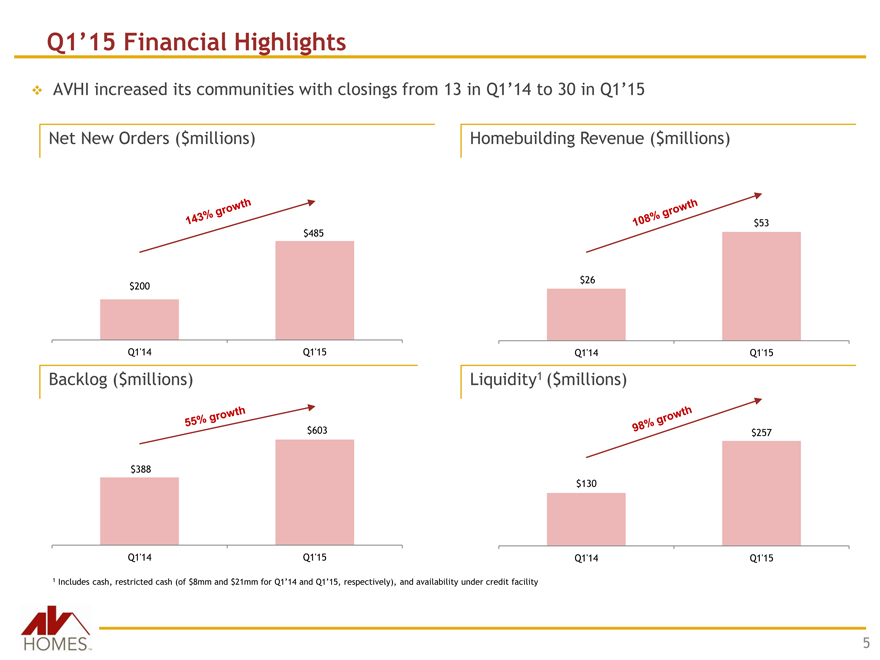
Q1’15 Financial Highlights
AVHI increased its communities with closings from 13 in Q1?14 to 30 in Q1?15
Net New Orders ($millions) Homebuilding Revenue ($millions)
$485
$53
$200
$26
Q1’14 Q1’15
Backlog ($millions)
Q1’14 Q1’15
Liquidity1 ($millions)
$603
$257
$388
$130
Q1’14 Q1’15
Q1’14 Q1’15
1 Includes cash, restricted cash (of $8mm and $21mm for Q1?14 and Q1?15, respectively), and availability under credit facility
| 5 |
|
|
|
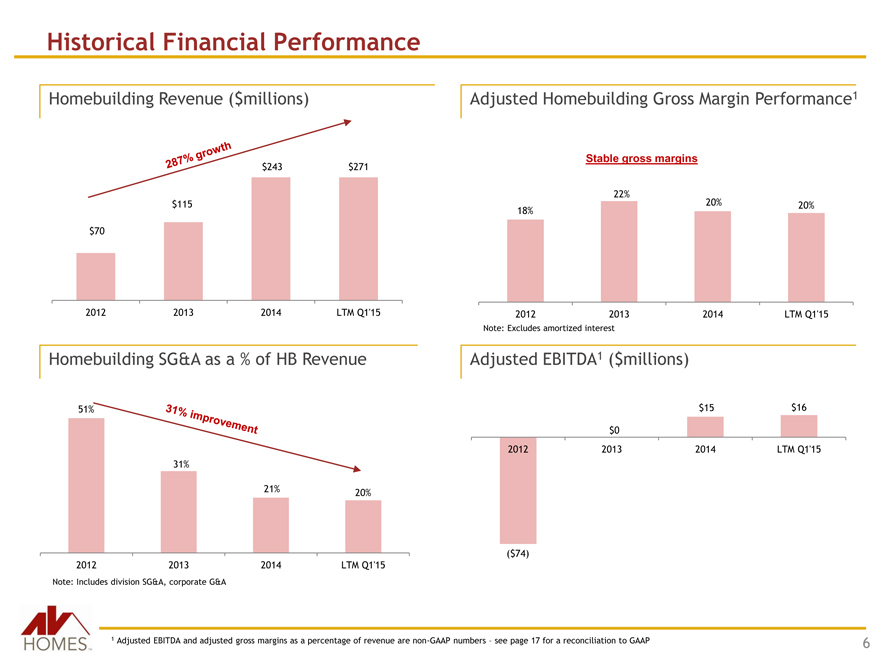
Historical Financial Performance
Homebuilding Revenue ($millions)
Adjusted Homebuilding Gross Margin Performance1
$243 $271
Stable gross margins
$115
18%
22%
20% 20%
$70
2012 2013 2014 LTM Q1’15
2012 2013 2014 LTM Q1’15
Note: Excludes amortized interest
Homebuilding SG&A as a % of HB Revenue
Adjusted EBITDA1 ($millions)
51%
$15 $16
$0
31%
21% 20%
2012 2013 2014 LTM Q1’15
2012 2013 2014 LTM Q1’15
Note: Includes division SG&A, corporate G&A
($74)
1 Adjusted EBITDA and adjusted gross margins as a percentage of revenue are non-GAAP numbers – see page 17 for a reconciliation to GAAP
| 6 |
|
|
|
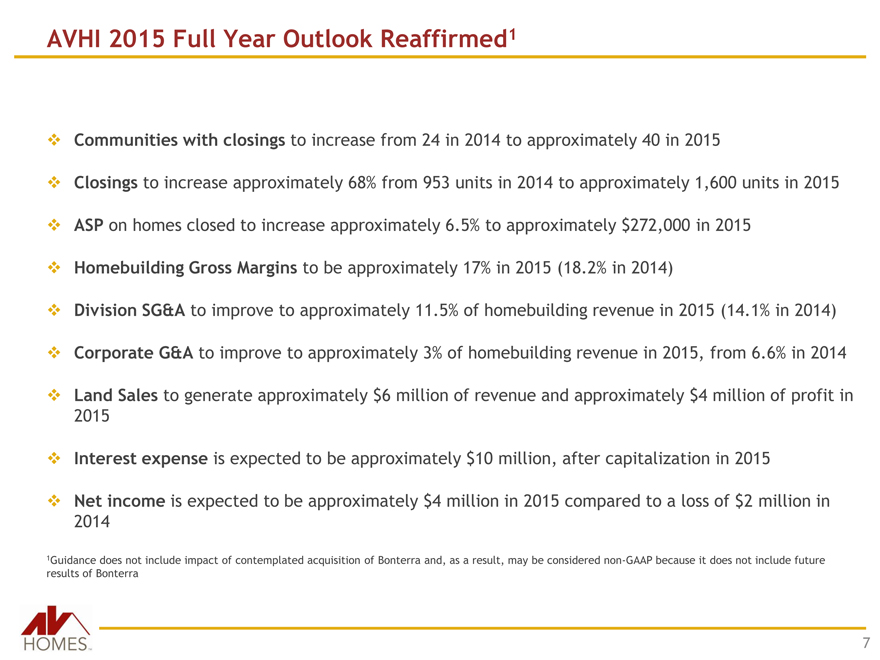
AVHI 2015 Full Year Outlook Reaffirmed1
Communities with closings to increase from 24 in 2014 to approximately 40 in 2015
Closings to increase approximately 68% from 953 units in 2014 to approximately 1,600 units in 2015
ASP on homes closed to increase approximately 6.5% to approximately $272,000 in 2015
Homebuilding Gross Margins to be approximately 17% in 2015 (18.2% in 2014)
Division SG&A to improve to approximately 11.5% of homebuilding revenue in 2015 (14.1% in 2014)
Corporate G&A to improve to approximately 3% of homebuilding revenue in 2015, from 6.6% in 2014
Land Sales to generate approximately $6 million of revenue and approximately $4 million of profit in
2015
Interest expense is expected to be approximately $10 million, after capitalization in 2015
Net income is expected to be approximately $4 million in 2015 compared to a loss of $2 million in
2014
1Guidance does not include impact of contemplated acquisition of Bonterra and, as a result, may be considered non-GAAP because it does not include future results of Bonterra
| 7 |
|
|
|
AHOM-Es-.
Bonterra Builders Acquisition
|
|
Bonterra Builders Overview
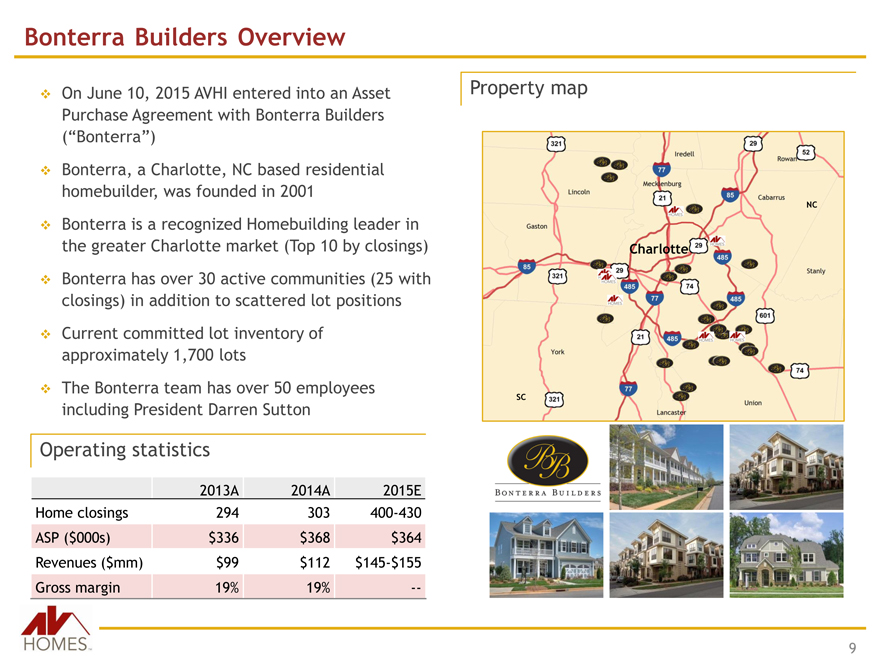
On June 10, 2015 AVHI entered into an Asset Purchase Agreement with Bonterra Builders (“Bonterra”)
Bonterra, a Charlotte, NC based residential homebuilder, was founded in 2001
Bonterra is a recognized Homebuilding leader in the greater Charlotte market (Top 10 by closings)
Bonterra has over 30 active communities (25 with
closings) in addition to scattered lot positions
Current committed lot inventory of approximately 1,700 lots
The Bonterra team has over 50 employees including President Darren Sutton
Property map
NC
This map is saved CinhDaerallowtotreks folder 1827797-001
Charlotte
SC
Operating statistics
2013A 2014A 2015E
Home closings 294 303 400-430
ASP ($000s) $336 $368 $364
Revenues ($mm) $99 $112 $145-$155
Gross margin 19% 19% —
9
|
|
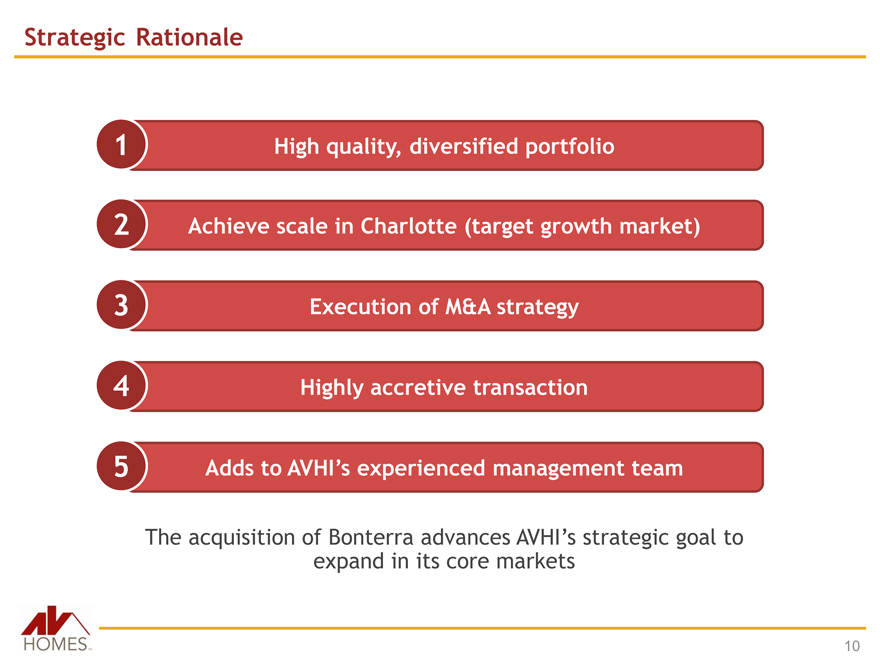
Strategic Rationale
| 1 |
|
High quality, diversified portfolio |
| 2 |
|
Achieve scale in Charlotte (target growth market) |
| 3 |
|
Execution of M&A strategy |
| 4 |
|
Highly accretive transaction |
| 5 |
|
Adds to AVHI’s experienced management team |
The acquisition of Bonterra advances AVHI?s strategic goal to
expand in its core markets
10
|
|
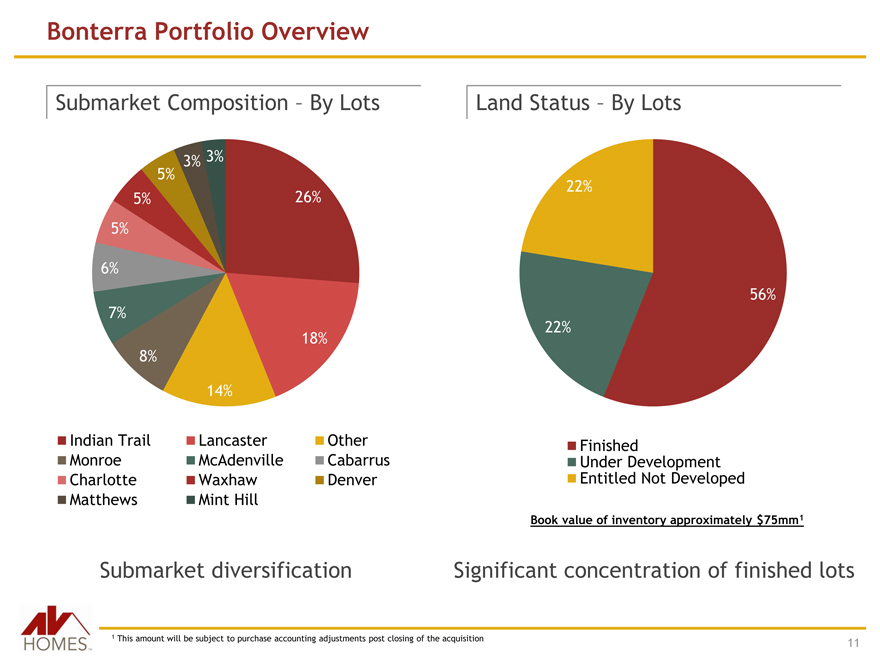
Bonterra Portfolio Overview
Submarket Composition – By Lots
Land Status – By Lots
3% 3%
5%
5%
7%
8%
26%
18%
22%
22%
56%
14%
Indian Trail Lancaster Other Monroe McAdenville Cabarrus Charlotte Waxhaw Denver Matthews Mint Hill
Finished
Under Development
Entitled Not Developed
Book value of inventory approximately $75mm1
Submarket diversification
Significant concentration of finished lots
| 1 |
|
This amount will be subject to purchase accounting adjustments post closing of the acquisition |
11
|
|
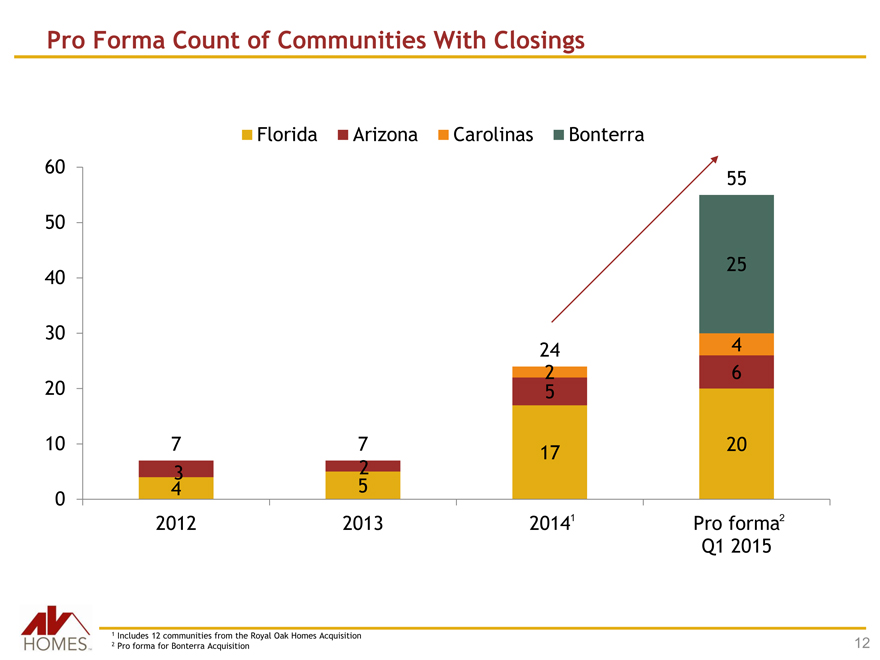
Pro Forma Count of Communities With Closings
Florida Arizona Carolinas Bonterra
60 55
50
25
40
30
24 4
| 2 |
|
6 |
20 5
10 7 7
| 3 |
|
2 |
0 4 5
17 20
2012 2013 20141
Pro forma2
Q1 2015
| 1 |
|
Includes 12 communities from the Royal Oak Homes Acquisition |
| 2 |
|
Pro forma for Bonterra Acquisition |
12
|
|
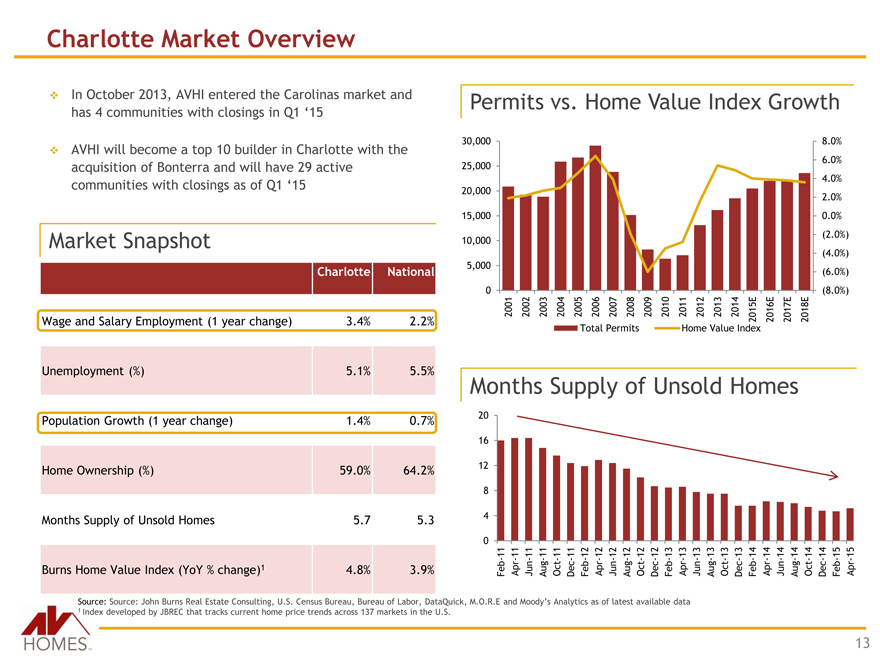
Charlotte Market Overview
In October 2013, AVHI entered the Carolinas market and has 4 communities with closings in Q1 „15
Permits vs. Home Value Index Growth
AVHI will become a top 10 builder in Charlotte with the acquisition of Bonterra and will have 29 active communities with closings as of Q1 „15
Market Snapshot
Charlotte National
Wage and Salary Employment (1 year change) 3.4% 2.2%
30,000
25,000
20,000
15,000
10,000
5,000
0
2001
2002
2003
2004
2005
2006
2007
2008
2009
2010
2011
2012
2013
2014
2015E
2016E
2017E
2018E
Total Permits Home Value Index
8.0%
6.0%
4.0%
2.0%
0.0% (2.0%) (4.0%) (6.0%) (8.0%)
Unemployment (%) 5.1% 5.5% Population Growth (1 year change) 1.4% 0.7% Home Ownership (%) 59.0% 64.2% Months Supply of Unsold Homes 5.7 5.3
Burns Home Value Index (YoY % change)1 4.8% 3.9%
Months Supply of Unsold Homes
20
16
12
| 8 |
|
| 4 |
|
0
Feb-11
Apr-11
Jun-11
Aug-11
Oct-11
Dec-11
Feb-12
Apr-12
Jun-12
Aug-12
Oct-12
Dec-12
Feb-13
Apr-13
Jun-13
Aug-13
Oct-13
Dec-13
Feb-14
Apr-14
Jun-14
Aug-14
Oct-14
Dec-14
Feb-15
Apr-15
Source: Source: John Burns Real Estate Consulting, U.S. Census Bureau, Bureau of Labor, DataQuick, M.O.R.E and Moody?s Analytics as of latest available data
| 1 |
|
Index developed by JBREC that tracks current home price trends across 137 markets in the U.S. |
13
|
|
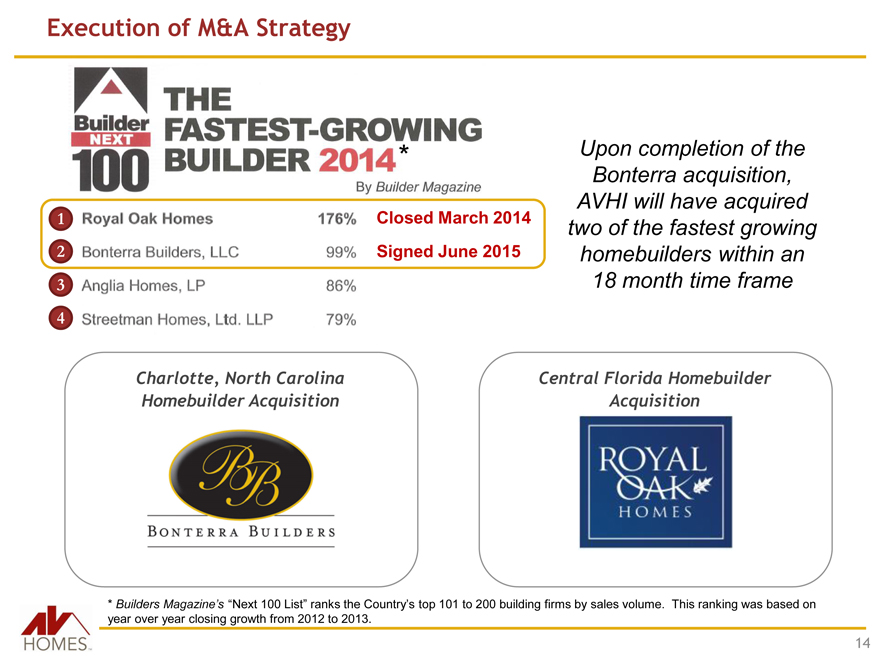
Execution of M&A Strategy
| * |
|
| 1 |
|
Closed March 2014 |
| 2 |
|
Signed June 2015 |
| 3 |
|
| 4 |
|
Upon completion of the Bonterra acquisition, AVHI will have acquired two of the fastest growing homebuilders within an 18 month time frame
Charlotte, North Carolina
Homebuilder Acquisition
Central Florida Homebuilder
Acquisition
* Builders Magazine’s “Next 100 List” ranks the Country’s top 101 to 200 building firms by sales volume. This ranking was based on year over year closing growth from 2012 to 2013.
14
|
|
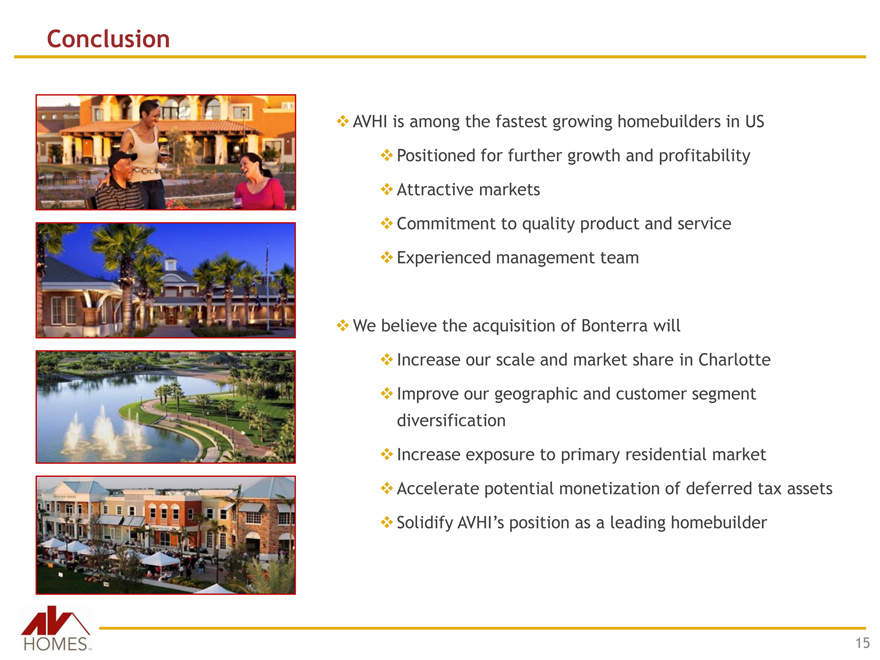
Conclusion
AVHI is among the fastest growing homebuilders in US
Positioned for further growth and profitability
Attractive markets
Commitment to quality product and service
Experienced management team
We believe the acquisition of Bonterra will
Increase our scale and market share in Charlotte
Improve our geographic and customer segment diversification
Increase exposure to primary residential market
Accelerate potential monetization of deferred tax assets
Solidify AVHI?s position as a leading homebuilder
15
TBU: Company to provide new picture if desired
|
|
Portfolio Overview
Non-GAAP reconciliations
|
|
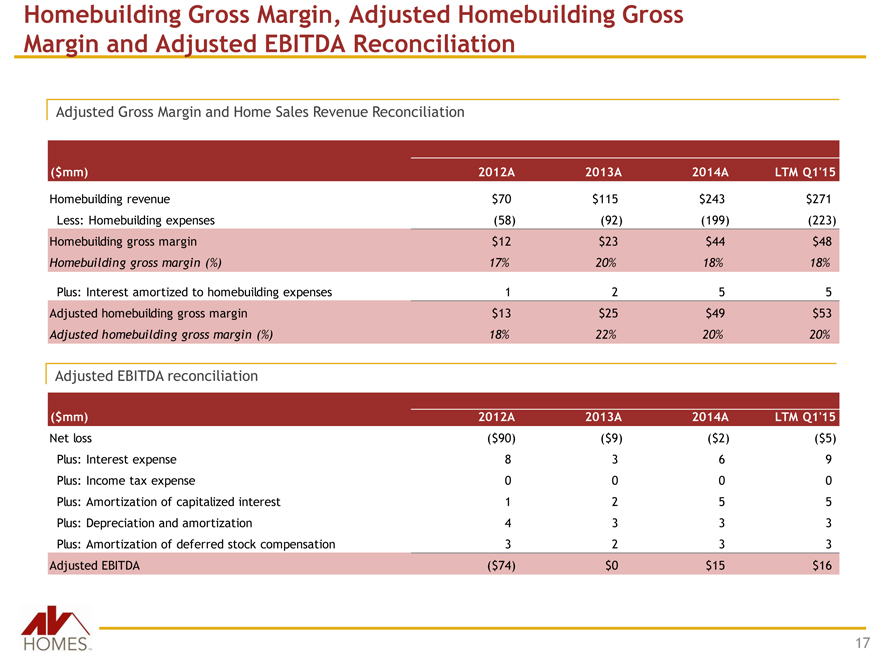
Homebuilding Gross Margin, Adjusted Homebuilding Gross
Margin and Adjusted EBITDA Reconciliation
Adjusted Gross Margin and Home Sales Revenue Reconciliation
($mm)
2012A
2013A
2014A
LTM Q1’15
Homebuilding revenue
$70
$115
$243
$271
Less: Homebuilding expenses (58) (92) (199) (223)
Homebuilding gross margin $12 $23 $44 $48
Homebuilding gross margin (%) 17% 20% 18% 18%
Plus: Interest amortized to homebuilding expenses
| 1 |
|
| 2 |
|
| 5 |
|
| 5 |
|
Adjusted homebuilding gross margin $13 $25 $49 $53
Adjusted homebuilding gross margin (%) 18% 22% 20% 20%
Adjusted EBITDA reconciliation
($mm) 2012A 2013A 2014A LTM Q1’15
Net loss ($90) ($9) ($2) ($5)
Plus: Interest expense 8 3 6 9
Plus: Income tax expense 0 0 0 0
Plus: Amortization of capitalized interest 1 2 5 5
Plus: Depreciation and amortization 4 3 3 3
Plus: Amortization of deferred stock compensation 3 2 3 3
Adjusted EBITDA ($74) $0 $15 $16
17