Attached files
| file | filename |
|---|---|
| 8-K - FORM 8-K - CareTrust REIT, Inc. | d939656d8k.htm |
 Investor Presentation
June 2015 Exhibit 99.1 |
 This presentation contains forward-looking statements within the meaning of the Private Securities Litigation Reform Act of 1995. These forward-looking statements include all statements that are not historical statements of fact and those regarding our intent, belief or expectations, including, but not limited to, statements regarding future financing plans, business strategies, growth prospects and operating and financial performance; expectations regarding the making of distributions and the payment of dividends; and compliance with and changes in governmental regulations. Words such as "anticipate(s)," "expect(s)," "intend(s)," "plan(s)," "believe(s)," "may," "will," "would," "could," "should," "seek(s)" and similar expressions, or the negative of these terms, are intended to identify such forward-looking statements. These statements are based on Management's current expectations and beliefs, and are subject to a number of risks and uncertainties that could lead to actual results differing materially from those projected, forecasted or expected. Although Management believes that the assumptions underlying the forward-looking statements are reasonable, they are not guarantees and CareTrust can give no assurance that its expectations will be attained. Factors which could have a material adverse effect on CareTrust's operations and future prospects or which could cause actual results to differ materially from expectations include, but are not limited to: (i) the ability to achieve some or all of the expected benefits from the completed spin-off and to successfully conduct CareTrust's business following the spin-off; (ii) the ability and willingness of Ensign to meet and/or perform its obligations under the contractual arrangements that it entered into with CareTrust in connection with the spin-off, including the Ensign Master Leases, and any of its obligations to indemnify, defend and hold CareTrust harmless from and against various claims, litigation and liabilities; (iii) the ability and willingness of CareTrust's tenants to (a) comply with laws, rules and regulations in the operation of the properties CareTrust leases to them, and (b) renew their leases with CareTrust upon expiration, or in the alternative, (c) CareTrust's ability to reposition and re-let its properties on the same or better terms in the event of nonrenewal or replacement of an existing tenant and any obligations, including indemnification obligations, that CareTrust may incur in replacing an existing tenant; (iv) the availability of, and the ability to identify and acquire, suitable acquisition opportunities and lease the same to reliable tenants on accretive terms; (v) the ability to generate sufficient cash flows to service CareTrust's outstanding indebtedness; (vi) access to debt and equity capital markets; (vii) fluctuating interest rates; (viii) the ability to retain and properly incentivize key management personnel; (ix) the ability to qualify or maintain CareTrust's status as a REIT; (x) changes in the U.S. tax laws and other state, federal or local laws, whether or not specific to REITs; (xi) other risks inherent in the real estate business, including potential liability relating to environmental matters and illiquidity of real estate investments; and (xii) any additional factors included in this presentation and any included in the section entitled "Risk Factors" in CareTrust's Form 10-K and in Item 1A of Part II of CareTrust's most recently filed Form 10-K. Forward-looking statements speak only as of the date made. Except in the normal course of CareTrust's public disclosure obligations, CareTrust expressly disclaims any obligation to release publicly any updates or revisions to any forward-looking statements to reflect any change in its expectations or any change in events, conditions or circumstances on which any statement is based. . Reconciliations of certain non-GAAP financial measures used in this presentation, including a reconciliation of our net income (loss) per GAAP to EBITDA, Adjusted EBITDA, FFO, normalized FFO, FAD and normalized FAD, are included in this presentation. The definitions of our non-GAAP measures used in this presentation are included in our press release dated February 11, 2015, which is incorporated herein by reference and available on our website at investor.caretrustreit.com. Safe Harbor Statement 2 |
 • Initial portfolio of 97 quality assets with Ensign as initial tenant except for three facilities operated by CareTrust • “Platform” tenant initially has attractive 1.85x rent coverage supported by long- term, triple-net lease structures • Focus is on broadening geographic reach, diversifying tenant base and expanding asset classes • Management team with deep real estate and healthcare industry expertise Transaction Overview 3 Spin-Off On June 1, 2014, The Ensign Group split into two publicly traded companies through a tax-free spin-off transaction. Operations Real Estate • A leading provider of skilled nursing care and assisted living services • Strong financial performance with dependable cash flows and liquidity • Long-tenured and successful management team |
 Strong
Rent Coverage
Experienced Management Team Growth & Diversification Opportunities Conservative Payout Ratio New Platform for Growth 4 Financially Secure “Platform” Tenant Triple-Net Lease Structure |
 Greg
Stapley CEO
Strong Healthcare Operating Background
5 Bill Wagner CFO Dave Sedgwick VP Operations • 28 years of experience in the acquisition, development and disposition of real estate • Co-Founder of Ensign, instrumental in assembling the real estate portfolio now owned by CareTrust • Previously the General Counsel of a 192-location national retailer and partner at a Jennings Strouss & Salmon, a large law firm in Phoenix, AZ • 22 years of accounting and finance experience, primarily in real estate, including 11 years with publicly-traded REITs • Served as SVP and CAO of Nationwide Health Properties, Inc. and Sunstone Hotel Investors, Inc. • Ernst & Young Kenneth Leventhal Real Estate Group • 12 years of experience in skilled nursing operations • Trained over 100 Ensign nursing home administrators as Ensign’s Chief Human Capital Officer • Led five SNFs as Administrator/ CEO; developed Ensign’s approach to cultural, clinical and financial performance Mark Lamb Director of Investments • Three years as Director of Investments at Nationwide Health Properties, underwriting over $1 billion of new investments across the Seniors Housing and Skilled Nursing sectors • Led three SNFs as Administrator for Plum Healthcare & North American Health Care in California • Investment Associate at The Bascom Group, a private equity real estate investment firm |
 Acquisition & Operational Experience
The CareTrust Team brings its
Experience, Relationships & Track Record
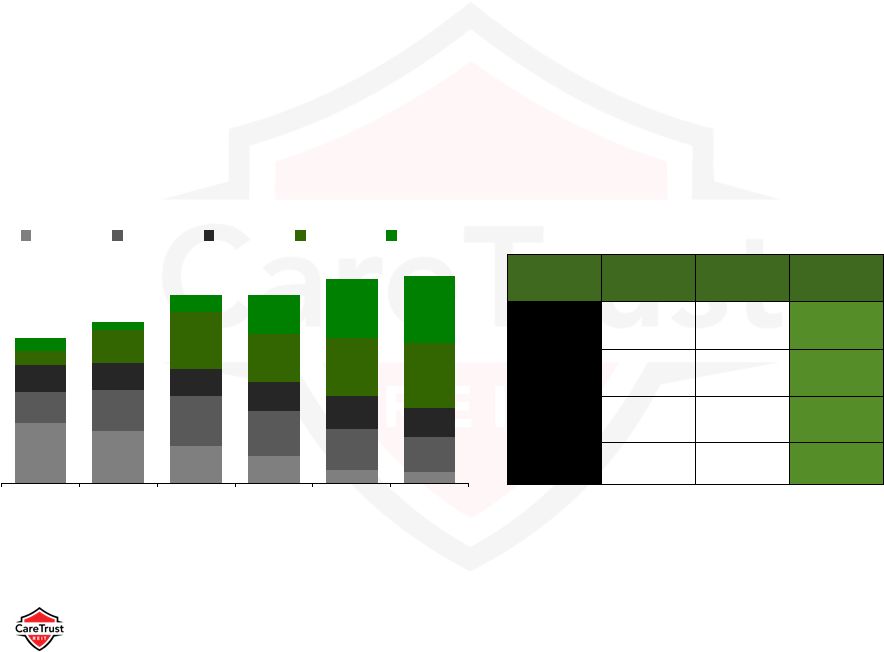
from Ensign 6 Ensign Pre-Spin Annual Facilities Growth Ensign Pre-Spin Historical Asset Acquisitions & CareTrust’s First-Year Growth ($ in millions) 57 61 63 77 82 102 108 119 4 2 14 5 20 6 11 6 30 50 70 90 110 130 2007 2008 2009 2010 2011 2012 2013 Q1 '14 $40 $25 $21 $61 $21 $130 $43 $45 $48 $67 $0 $20 $40 $60 $80 $100 $120 2006 2007 2008 2009 2010 2011 2012 2013 Avg. '06-'13 CTRE 1st 12 Months |
 Growing
Portfolio 7 |
 Strong
Liquidity for Growth 8
Cash on hand as of March 31, 2015
$13.6 million
Undrawn Senior Secured Credit Facility with
approximately $112 million of availability ($84 million currently available plus $28 million for assets recently acquired). $150 million Plus access to public equity and debt markets, and other forms of long-term capital. $500 million Shelf registration filed June 1, 2015 (currently subject to SEC review) |
 Healthcare Real Estate Ownership
Real Estate Asset Breakdown
Note: Healthcare Real Estate Ownership Breakdown and Real Estate Asset Breakdown from
Stifel Nicolaus industry analysis Roll –
Up Opportunity Healthcare Real Estate Market Estimated at Over $1 Trillion 9 Deal Size Tenant Size Large REITs focused on larger acquisitions - Outpatient/ MOB, 39% Life Science/ Biotech, 5% Skilled Nursing, 10% Hospitals/ LTACHs, 31% Senior Housing (ALF, ILF, Memory Care), 15% Privately Owned, 79% Public REIT Owned , 21% |
 Mining
an Underserved Market 10
Fragmented market, underserved by capital providers Limited access to capital and liquidity for local and regional operators Limited competition for SNFs and mid-market senior housing assets Large competitors chasing compressed cap rate deals Apply healthcare operating experience to underwriting process Target quality one-off, small & mid-sized portfolios Leverage growing number of operator relationships Identify superior operators focused on post –acute care delivery Accretive investments with strong operating partners/tenants 100% lease financing attracts up and coming operators Attractive investment spreads over cost of capital Substantial growth potential through smaller and off-market deals Market Backdrop CareTrust Role Results |
 Disciplined Investment Strategy
Focused on Accretive Deals
11 Senior Housing Facilities (ALF, ILF, MC) Skilled Nursing Facilities Medical Office Buildings Acute Care Net Lease Core Core Opportunistic Opportunistic Mortgage Debt Relationship Relationship Opportunistic Opportunistic Development Funding Relationship Relationship RIDEA Opportunistic |
 Total
LTM EBITDAR Tenant Rent Coverage * Represents facility EBITDAR coverage
for the twelve months ending September 30, 2014 ** Represents
facility EBITDAR coverage for LTC’s skilled nursing portfolio ***
Rent coverage is calculated as operating cash flow from SNH tenants’ operations of SNH properties, before subordinated charges, divided by rents payable to SNH Source: Company filings, as of 12/31/13 for AVIV, LTC, and SBRA, and 9/30/13 for SNH and OHI.
Leading Tenant Rent Coverage
12 1.91x 1.68x 1.60x 1.50x 1.44x 1.33x CTRE* LTC** AVIV OHI SNH*** SBRA |
 31
34 35 37 39 47 55 64 72 78 81 1990 1995 2000 2005 2010 2015 2020E 2025E 2030E 2035E 2040E Attractive Industry Dynamics for SNF Operators 13 Numbers in millions Relative Costs of Treatment Across Care Providers SNF IRF LTAC Source: AHCA, CMS OSCAR data, U.S. Census Bureau, Medpac Number of Skilled Nursing Facilities Age 65+ Population 16,715 16,554 16,441 16,256 16,066 15,965 15,861 15,772 15,771 15,679 15,669 15,655 15,667 15,666 2000 2001 2002 2003 2004 2005 2006 2007 2008 2009 2010 2011 2012 2013 US SNF Properties $10,501 $26,051 $26,051 $115,463 $7,897 $74,689 $6,165 $17,135 $67,104 $10,618 $18,487 $44,633 $8,905 $34,196 $31,496 Tracheotomy with Vent Respiratory with Vent Joint Replacement Hip Fracture Stroke |
 Skilled
Nursing Reimbursement Rates: Stable and Increasing Over Time
14 Source: Eljay LLC and composite of CMS, AHCA, AQNHC and Avalere Group Data; ENSG company filings Skilled Nursing Reimbursement Rates (2000-2013) 4.2% 4.0% 3.4% CAGR In May 2014, CMS proposed a 2% aggregate increase for 2015 SNF payments $109 $118 $124 $129 $142 $145 $150 $156 $164 $172 $174 $176 $179 $287 $312 $325 $301 $336 $349 $363 $385 $408 $432 $454 $505 $469 $478 $446 $451 $524 $560 $574 $618 $555 $564 2000 2001 2002 2003 2004 2005 2006 2007 2008 2009 2010 2011 2012 2013 Avg. SNF Medicaid Rate Per Day Avg. SNF Medicare Rate Per Day ENSG Same Facility Medicare Rate per Day |
 “THE” Platform Tenant
15 As of March 31, 2015, Ensign operated 143 facilities, 13 home health and 12 hospice operations, two home care businesses, one transitional care management company,16 urgent care centers and a mobile x-ray diagnostic company, all located in 12 states Ensign has a strong track record of integrating turnaround opportunities – Improves operations through increased occupancy, quality mix and acuity shift Long-tenured and successful management team has been an integral part of Ensign’s business strategy Ensign Operated Facilities SNFs, ALFs & ILFs Home Health & Hospice Urgent Care Clinics Note: EBITDAR is a non-GAAP measure and represents net income before (a) interest expense, net, (b) provision for income taxes, (c) depreciation and (d) facility rent expense. See Ensign’s public filings for a reconciliation of EBITDAR to GAAP and additional
information on Ensign’s performance.
Revenue (in millions) Ensign Business Overview 0 30 60 90 120 150 180 2007 2008 2009 2010 2011 2012 2013 Q1 2014 Millions $ Adjusted EBITDAR A n n u a l i z e d 650 825 0 200 400 600 800 1,000 1,200 2007 2008 2009 2010 2011 2012 2013 Q1 2014 Millions $ 411 469 542 758 905 60 73 87 107 130 142 149 39 |
 Turnaround Track Record
Acquisition Track Record based on an average for all SNF
acquisitions from 2001 through October 1, 2012 measuring
five quarters of operating performance.
4-Quarter Performance Q1 Q5 Improvement EBITDAR Margin 11.3% 14.5% 322 bps Occupancy 70.9% 74.0% 316 bps Skilled Mix (Rev) 31.3% 38.7% 732 bps Quality Mix (Rev) 48.4% 51.6% 321 bps Ensign Track Record Operational Excellence 16 Recognized Skilled Nursing Facility Quality 31 27 19 14 7 6 16 21 26 23 21 18 14 14 14 15 17 15 7 17 29 25 30 33 7 4 9 20 30 35 Q4 2009 Q4 2010 Q4 2011 Q4 2012 Q4 2013 Q1 2014 1-Star 2-Star 3-Star 4-Star 5-Star CMS Star ratings as reported on cms.gov http://www.medicare.gov/nursinghomecompare/ |
 DEAL
SUMMARY 17
Investments Tenant Acquisition Period Location Type Amount Yield Rent/Revenue (Annual) 2014 Acquisitions Cross Healthcare 4Q 2014 Idaho Senior Housing $ 12,000,000 8.50% $ 1,020,000 Signature Senior Living 4Q 2014 Colorado Senior Housing $ 7,500,000 12.00% $ 900,000 20 Management 4Q 2014 Virginia Senior Housing $ 6,600,000 8.25% $ 544,500 Prelude 4Q 2014 Minnesota Senior Housing $ 7,205,088 8.25% $ 594,420 2015 Acquisitions Bethany Rehab 1Q 2015 Colorado SNF $ 17,950,000 9.65% $ 1,732,175 Mira Vista Care Center 2Q 2015 Washington SNF $ 9,100,000 9.50% $ 864,500 Shoreline Health & Rehab 2Q 2015 Washington SNF $ 6,740,636 9.90% $ 667,323 Total $ 67,095,724 9.42% $ 6,322,918 |
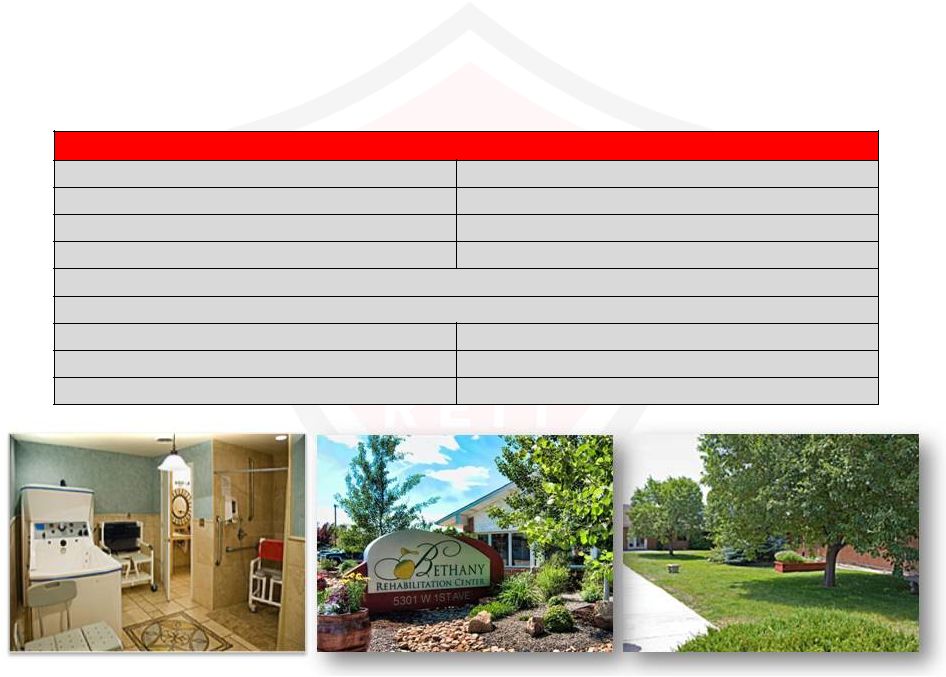 18 #1 BETHANY REHAB (CLOSED IN Q1 2015) TRANSACTION SUMMARY Type Purchase / Net Lease Price $17,950,000 # of Units/Beds 170 beds Price/Bed $105,588 # of Buildings 1 Quality Mix 5% Location CO Occupancy 96% Transaction Closing LEASE SUMMARY Initial Yield 9.65% EBITDARM Coverage 1.64x Initial Rent $1,732,500 EBITDAR Coverage 1.29x Security Deposit 2 months rent Lease Term 15 years w/ extensions February 1 , 2015 st |
 19 #2 MIRA VISTA CARE CENTER (CLOSED POST Q1 2015) TRANSACTION SUMMARY Type Purchase / Net Lease Price $9,100,000 # of Beds 94 Price/Bed $117,647 # of Buildings 1 Quality Mix 37% Location Mt. Vernon, WA Occupancy 87% Transaction Closing LEASE SUMMARY Initial Yield 9.50% EBITDARM Coverage 1.73x Initial Rent $866,142 EBITDAR Coverage 1.26x Security Deposit 3 months rent Lease Term 15 year with extensions April 1 , 2015 st |
 20 #3 SHORELINE HEALTH AND REHABILITATION CENTER (CLOSED POST Q1 2015) TRANSACTION SUMMARY Type Purchase / Net Lease Price $6,740,636
# of Beds 105 Price/Bed $63,095 # of Buildings 1 Quality Mix 24% Location Shoreline, WA Occupancy 81% Transaction Closing LEASE SUMMARY Initial Yield 9.9% EBITDARM Coverage 1.79x Initial Rent $667,323 EBITDAR Coverage 1.25x Security Deposit 3 months rent Lease Term 15 years with extensions June 1st, 2015 |
 FINANCIAL SUMMARY 21 |
 2015
Guidance 22
CareTrust’s 2015 guidance as of May 12, 2015 is based on the following: • $56 million in rent from Ensign and $4.4 million from all investments closed post-Spin through May 12, 2015 • $0.9 million in interest income from the $7.5 million preferred equity investment at 12% • $0.3 million in NOI from the 3 ILFs that we own and operate • $24 million in interest expense • $6.2 million to $6.9 million in G&A expense (1) Includes approximately $2.2 million in amortization of deferred financing costs. (2) Includes approximately $1.0 million of non-cash stock-based compensation expense. 1 2 |
 Guidance RECONCILIATION OF NET INCOME TO NON-GAAP FINANCIAL MEASURES 23 Guidance 2015 Low High Net income per share $ 0.28
$
0.30 Real estate
related depreciation and amortization
0.70
0.70
Funds from Operations (FFO) per share
0.98
1.00
Normalized FFO per share
$
0.98
$
1.00 Net income per
share
$
0.28
$
0.30 Real estate
related depreciation and amortization
0.70
0.70
Amortization of deferred financing costs
0.07
0.07
Amortization of stock-based
compensation 0.03
0.03
Funds Available for Distribution (FAD) per
share 1.08
1.10
Normalized FAD per share
$
1.08
$
1.10 Weighted
average shares outstanding:
Diluted
31,565
31,565 |
 APPENDIX 24 |
 25 2015 Financial Summary CARETRUST REIT, INC. CONDENSED CONSOLIDATED BALANCE SHEETS (in thousands) (unaudited) March 31, December 31, 2015 2014 Assets Real estate investments, net $ 448,841
$
436,215 Other real estate
investments 7,755
7,532
Cash and cash equivalents
13,594
25,320
Accounts receivable
2,011
2,291
Prepaid expenses and other assets
713
809
Deferred financing costs, net
9,872
10,405
Total assets
$
482,786
$
482,572 Liabilities and
Equity Senior unsecured notes
payable
$
260,000
$
260,000 Mortgage notes
payable 97,520
98,205
Accounts payable and accrued liabilities
9,400
6,959
Dividends payable
5,050
3,946
Total liabilities
371,970
369,110
Equity:
Common stock
314
313
Additional paid-in capital
246,406
246,041
Cumulative distributions in excess of
earnings (135,904)
(132,892)
Total equity
110,816
113,462
Total liabilities and equity
$
482,786
$
482,572 |
 26 2015 Financial Summary CARETRUST REIT, INC. DEBT SUMMARY (in thousands) (unaudited) Interest Rate/ Maturity March 31, 2015 Debt Collateral Spread Date Balance Fixed Rate Debt Senior unsecured notes payable Unsecured 5.875% 2021 $ 260,000
GECC mortgage notes payable
(1) 10 properties
7.252%
2017
47,212
Mortgage note payable
1 property
6.000%
2019
533
307,745
Floating Rate Debt
GECC mortgage notes payable (1)
10 properties
L + 3.35%
2017
49,775
Senior secured revolving credit facility
(2) 11 properties
L + 2%-2.5%
2018
-
49,775
Total Debt
$
357,520 Debt Statistics % Fixed Rate Debt 86.1% % Floating Rate Debt 13.9% Total 100.0% Weighted Average Interest Rates: Fixed 6.1% Floating 3.9% Blended 5.8% (1) The fixed rate portion of the GECC mortgage notes payable converts to the floating rate in June 2016.
The floating rate rate portion is subject
to a Libor floor of 0.50%. The note has two, 12 month extension options. (2) Borrowings available under the senior secured revolving credit facility totaled $84.2 million at March 31,
2015. Funds can also be borrowed at the
Base Rate (as defined) plus 1.0% to 1.5%. |
 27 2015 Financial Summary CARETRUST REIT, INC. CONSOLIDATED STATEMENTS OF INCOME (in thousands, except per share data) (unaudited) One Month Quarter Quarter Quarter Ended Ended Ended Ended June 30, 2014 September 30, 2014 December 31, 2014 March 31, 2015 Revenues: Rental income $
4,667
$
14,000 $
14,139
$
14,842 Tenant reimbursement 396 1,228 1,230 1,258 Independent living facilities 211 646 663 635 Interest and other income - 10 45 223 Total revenues 5,274 15,884 16,077 16,958 Expenses: Depreciation and amortization 1,794 5,362 5,369 5,599 Interest expense 1,967 5,943 5,900 5,901 Property taxes 396 1,228 1,230 1,258 Acquisition costs - - 47 - Independent living facilities 161 586 559 602 General and administrative 500 798 2,342 1,560 Total expenses 4,818 13,917 15,447 14,920 Net income $
456
$
1,967 $
630
$
2,038 Diluted earnings per share $
0.02
$
0.09 $
0.03
$
0.06 Diluted weighted average shares outstanding 22,436 22,436 24,586 31,317 |
 28 2015 Financial Summary CARETRUST REIT, INC. RECONCILIATIONS OF NET INCOME TO NON-GAAP FINANCIAL MEASURES
(in thousands, except per share)
(unaudited)
One Month
Quarter
Quarter
Quarter
Ended
Ended
Ended
Ended
June 30, 2014
September 30, 2014
December 31, 2014
March 31, 2015
Net income
$
456 $
1,967
$
630 $
2,038 Depreciation and
amortization 1,794
5,362
5,369
5,599
Interest expense
1,967
5,943
5,900
5,901
Amortization of stock-based
compensation -
-
154
366
EBITDA
4,217
13,272
12,053
13,904
Acquisition costs
-
-
47
-
Costs associated with the Spin-Off
254
30
168
-
Adjusted EBITDA
$
4,471 $
13,302
$
12,268 $
13,904 Net income
$
456 $
1,967
$
630 $
2,038 Real estate related
depreciation and amortization
1,794
5,362
5,365
5,593
Funds from Operations (FFO)
2,250
7,329
5,995
7,631
Acquisition costs
-
-
47
-
Costs associated with the Spin-Off
254
30
168
-
Normalized FFO
$
2,504 $
7,359
$
6,210 $
7,631 Net income
$
456 $
1,967
$
630 $
2,038 Real estate related
depreciation and amortization
1,794
5,362
5,365
5,593
Amortization of deferred financing costs
175
533
553
547
Amortization of stock-based
compensation -
-
154
366
Funds Available for Distribution (FAD)
2,425
7,862
6,702
8,544
Acquisition costs
-
-
47
-
Costs associated with the Spin-Off
254
30
168
-
Normalized FAD
$
2,679 $
7,892
$
6,917 $
8,544 FFO per share
$
0.10 $
0.33
$
0.24 $
0.24 Normalized FFO per
share
$
0.11 $
0.33
$
0.25 $
0.24 FAD per
share
$
0.11 $
0.35
$
0.27 $
0.27 Normalized FAD per
share
$
0.12 $
0.35
$
0.28 $
0.27 Diluted weighted
average shares outstanding (1)
22,436
22,436
24,586
31,420
(1) For the quarter ended March 31, 2015, the diluted
weighted average shares includes unvested restricted stock awards as the effect is more dilutive. |
 Varying
Deal Size (One-Offs to
Portfolios) Multiple
Operator Partnerships No Geographic Constraints Promising & Stabilized SNF/ALF Assets Future Diversification into MOB, Acute Care and Life Sciences Wider Investment Parameters 29 Cluster Ready Local Leader Pipeline Geographic Limits Turnaround Opportunities Ensign Strategy Note: For one year after the spin-off, CareTrust was subject to the Opportunities Agreement with Ensign, which afforded Ensign
certain rights of first refusal to some of CareTrust’s investment opportunities.
That agreement expired on May 31, 2015. CareTrust Strategy
|
 Total Skilled Nursing Facilities Multi-Specialty Campuses Assisted Living and Independent Living Facilities Independent Living Facilities Operated by CareTrust State Properties Beds/Units Facilities Beds Campuses SNF Beds ALF Units ILF Units Facilities Units Facilities Units California 18 1,991 14 1,465 2 158 121 24 2 223 --- --- Texas 27 3,241 22 2,699 1 123 77 20 2 115 2 207 Arizona 10 1,327 7 799 1 162 100 --- 2 266 --- --- Utah 12 1,305 9 907 1 235 37 --- 1 69 1 57 Colorado 6 633 4 380 --- --- --- --- 2 253 --- --- Idaho 9 579 5 408 1 45 24 --- 3 102 --- --- Washington 6 555 5 453 --- --- --- --- 1 102 --- --- Nevada 3 304 1 92 --- --- --- --- 2 212 --- --- Nebraska 5 366 3 220 2 105 41 --- --- --- --- --- Iowa 5 356 3 185 2 109 62 --- --- --- --- --- Minnesota 1 30 --- --- --- --- --- --- 1 30 Virginia 1 39 --- --- --- --- --- --- 1 39 Total 103 10,726 73 7,608 10 937 462 44 17 1,411 3 264 (1) All facility and bed/unit counts are as of 3/30/2015 (2) The initial portfolio of four ILFs includes one that is leased to and operated by Ensign and three owned and operated by
CareTrust CareTrust Geographic Detail
30 1 2 2 |