Attached files
| file | filename |
|---|---|
| 8-K - 8-K - CHRISTOPHER & BANKS CORP | a15-13592_18k.htm |
Exhibit 99.1
|
|
Charting Our Path to Long-Term Growth and Profitability June 2015 |

|
|
Certain statements on the slides which follow may be forward-looking statements about Christopher & Banks Corporation (the “Company”). Such forward-looking statements involve risks and uncertainties which may cause actual results to differ. These forward-looking statements may be identified by such terms as “will”, “expect”, “believe”, “anticipate”, “outlook”, “target”, “plan”, “initiatives”, “estimated”, “strategy” and similar terms. You are directed to the cautionary statements regarding risks or uncertainties described in the Company’s filings with the Securities and Exchange Commission, including our most recent Annual Report on Form 10-K and other SEC filings made since the date of that 10-K report. Participants are cautioned not to place undue reliance on such forward-looking statements, which reflect management’s views only as of June 9, 2015. The Company undertakes no obligation to update or revise the forward-looking statements. Safe Harbor 2 |
|
|
Specialty women's apparel retailer catering to missy, petite, and women customers Currently operate approximately 515 stores in 43 states plus an eCommerce website Target women 45-60 years Avg. household income $70k-$75k 70% work outside of the home Two-thirds married Purchasing behavior Purchases approximately 3.5 times annually On average, spends $49 per visit Approximately 28% of customers shop multiple sizes (missy, petite, women) Approximately 10% of customers shop across both web and stores, representing 22% of sales About Us and Our Core Customer 3 |
|
|
Our Vision & Mission Vision To be her trusted brand by delivering style and value every day Mission To provide our customer with: style and versatility that reflects who she is, lasting quality and affordable value that she expects, and personalized attention that she deserves 4 |
|
|
Uniquely positioned to address niche customers who are largely underserved including the growing petite and plus size customer segments Increasing sales per square foot driven by MPW migration and outlet store expansion as well as cost efficiencies driving higher operating margin Merchandising strategy and inventory discipline centered around driving higher store productivity and gross margin expansion Evolving Omni-Channel strategy - “Customer First” Disciplined investments to drive long-term growth and profitability Investment Highlights 5 |
|
|
Name Title Year Joined CBK Experience LuAnn Via President and CEO 2012 30+ Peter Michielutti EVP, COO and CFO 2012 25+ Monica Dahl SVP, Marketing, Omni-Channel & PR 2004 20+ Lynn Derry SVP, General Merchandise Manager 2014 30+ Luke Komarek SVP, General Counsel 2007 25+ Michelle Rice SVP, Store Operations 2008 20+ Cindy Stemper SVP, Human Resources 2010 25+ Experienced Executive Team 6 |
|
|
Name Position Year Joined Board Other Public Boards Mark A. Cohn President and Chief Executive Officer of Aspirity Energy 2006 1 Edwin J. Holman Former CEO of Macy’s Central, a Division of Macy’s, Inc 2015 1 Anne L. Jones CEO of Jones Consulting Group, Inc. 2000 -- David A. Levin President and CEO of Destination XL Group, Inc. 2012 -- William F. Sharpe, III Partner and Managing Director of Quetico Partners, LLC 2012 -- Paul L. Snyder Chair of the Board; Former Midwest Area Managing Partner for KPMG 2010 -- Patricia A. Stensrud President of A&H Manufacturing 2012 1 LuAnn Via President & CEO of Christopher & Banks 2012 1 Lisa W. Wardell EVP & COO of The RLJ Companies 2011 2 Experienced Board of Directors 7 |
|
|
Experienced Board of Directors Diverse mix of seasoned executives from various fields Retail Marketing Accounting Finance The Board is 45% female 50% of its independent members are based outside of Minnesota Three directors have been recognized by the National Associate of Corporate Directors (leading board association) Board size is in line with direct peer group average of 8.5 (Ascena: 7, Chico’s: 8, ANN: 9, NY&Co: 10) Average Board tenure is 5 years 8 |
|
|
Management Team Led Successful Turnaround Sales per square foot rose from $150 to $190 – an improvement of 27% - driven by enhanced merchandising strategy and impactful targeted marketing programs(1) Gross margin went from 24.4% in fiscal 2011 to 36.2%(2) in fiscal 2014; this is attributable to improved sell through, better inventory flow and a disciplined markdown strategy Operating margin went from (17.4%) in fiscal 2011 to +3.1%(2) for fiscal 2014, stemming from cost efficiencies, lower occupancy and payroll costs and SG&A leverage Leveraged sourcing while increasing direct imports from 16% in fiscal 2011 to 39% in fiscal 2014 (1) Amounts represent average sales per square foot (“SPSF”) for the 52 weeks ended 1/28/12 and SPSF for the 52 weeks ended 1/31/15, respectively. (2) Excludes impact of correction of an immaterial error in the fourth quarter of fiscal 2014 related to lease accounting 9 |
|
|
Store Base Migration * FY12 represents 48 weeks ended 1/28/12 ** FY15 counts are projected to year end 775 686 608 560 518 527 518 |
|
|
Christopher & Banks 2000 Braun’s changes name to Christopher & Banks 2009 Peak store count at 548 stores Projected (end of fiscal 2015) 61 stores C.J. Banks 2000 First CJ Banks store opens – catering to plus size 2009 Peak store count at 267 stores Projected (end of fiscal 2015) 53 stores 11 |
|
|
2009 Dual Brand store opened in Moosic, PA 2013-2014 Tested current MPW format Projected (end of fiscal 2015) 335 stores Future Potential 100% of store base MPW Stores Designed to provide women of all sizes with apparel and accessories that reflect who she is, with value that she can appreciate in a shopping environment that engages her. 12 |
|
|
2010 Opened 1st stores - Kansas Legends and Albertville, MN Projected (end of fiscal 2015) 78 stores Future Potential 100 stores Outlet Stores Offer a full range of sizes including base store merchandise, exclusive made-for-outlet styles and clearance. 13 |
|
|
Consistent Execution of Core Strategies Balanced Merchandise Assortments Maximizing Special Sizes Targeted Messaging and Marketing Compelling & Easy to Shop Store Experience Operational Excellence Strategic Initiatives in Place for Next Stage of Growth Omni-Channel Capabilities = Customer First 14 Migration to MPW (Missy, Petite, Women) Format |
|
|
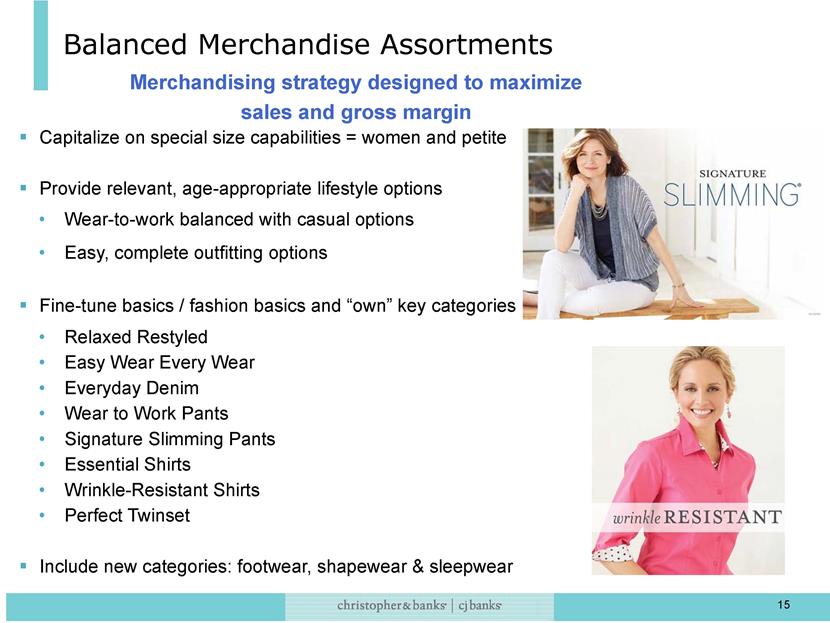
Balanced Merchandise Assortments Merchandising strategy designed to maximize sales and gross margin Capitalize on special size capabilities = women and petite Provide relevant, age-appropriate lifestyle options Wear-to-work balanced with casual options Easy, complete outfitting options Fine-tune basics / fashion basics and “own” key categories Relaxed Restyled Easy Wear Every Wear Everyday Denim Wear to Work Pants Signature Slimming Pants Essential Shirts Wrinkle-Resistant Shirts Perfect Twinset Include new categories: footwear, shapewear & sleepwear 15 |
|
|
Refine store assortments: By channel (MPW, Outlets, E-Commerce) Tailored and tiered by store Right-size breath vs. depth Utilizing new analytical tools to adjust assortments by store Consistently deliver on quality Provide attractive opening price points in all categories Continue to offer a well-balanced good / better / best product mix Plan promotional buys to maximize margins Balanced Merchandise Assortments 16 |
|
|
Continue investment in direct marketing (direct mail & email) Increase investments in social media and PR Refine digital marketing strategy to include acquisition of new customers Support new store formats with enhanced grand opening events Capitalize on markets where other specialty women’s retailers have exited Strategic Targeted Marketing Programs 17 Marketing programs designed to increase market share through retention of existing customers while capturing new |
|
|
Leverage Customer Relationship Management (CRM) Program Enhanced CRM system capabilities Fall FY15 as part of omni-channel initiative Friendship Rewards Loyalty Program 4.4 million members with 2.1 million Active generating 97% of LTM sales as of Q1FY15 Refreshed program anticipated Fall FY15 – geared toward increasing engagement including increased certificate issuance and redemption Private Label Credit Card Program Cardholders represent 28% of active customers Card purchases continue to grow & represented 36% of sales for Q1FY15 Cardholders spend approximately 155% more than non-card holders annually with more frequent visits and higher transaction value Efforts to increase engagement include exclusive offers, increased pulse events & open to buy communication CRM and PLCC Drive High ROI 18 |
|
|
Enhance Merchandise Presentation Reconfiguring product placement and store layout of missy, petite and women sizes Create destination shoppes by lifestyle and categories Improved visual presentation through updated fixturing and props Maintain Strong Personal Relationships with Our “Friends” Leverage clientelling as key differentiator Maximize seasonal events like Fashion Event Support grassroots opportunities - women’s conventions, leadership conferences and women’s clubs Continue Upgrading Talent and “Selling with Care” program Align store personnel capabilities with real estate strategy Enhance on-boarding program Refine selling techniques through additional videos and tools Compelling and Easy-to-Shop Store Experience 19 Highly loyal customer base largely attributable to friendly shopping environment and highly engaged sales associates |
|
|
MPW stores are strategically merchandised to make our missy, women’s and petite customers feel like the stores were tailored for them MPW stores generate greater sales productivity and higher profitability than standalone CB and CJ stores with: Higher sales per square foot Higher gross margin Higher four-wall operating margin Operated 304 MPW stores at the end of first quarter of fiscal 2015, representing: 98 Collapse/Combine locations 185 Add CJ or CB locations 21 New MPW locations Long term potential - 100% of stores will be in MPW format MPW Format Drives Real Estate Strategy 20 |
|
|
MPW Types New: Open a MPW in a new market or an additional store in an existing market Collapse/Combine (C/C): Combine CB & CJ into 1 of the 2 existing spaces Collapse/Combine Relocation: Combine existing CB & CJ into a NEW store within the same center Add CJ Relocation: There is an existing CB in the center and we relocate to a larger space to create an MPW Conversions: Existing CB store where CJ merchandise can be added 21 |
|
|
Evolving Omni-Channel Experience “CUSTOMER FIRST” Move from selling via any channel (Multi-Channel) to providing a seamless, consistent and integrated experience across ALL customer touch points (Omni-Channel) store, web, social, mobile, direct mail, email and digital Improved integration of all business aspects Single view of the customer and inventory across the company Involves CRM, POS & Web Platform System Implementations Two-year project – fiscal 2015-2016 Estimated investment of $8M-$10M 22 |
|
|
Financial Highlights |

|
|
3-Year Financial Highlights – First Quarter 24 13 Weeks Ended 13 Weeks Ended 13 Weeks Ended May 2, 2015* May 3, 2014* May 4, 2013* Net Sales $91.6 $103.4 $108.5 Gross Margin 35.2% 36.7% 34.2% SG&A as % of sales 34.9% 31.2% 30.1% Operating Income (Loss) ($2.5) $2.8 $0.8 Net Income (Loss) ($1.4) $2.6 $0.6 Diluted EPS ($0.04) $0.07 $0.02 *Dollar amounts are shown in millions except EPS |
|
|
3-Year Financial Highlights – Annual Results 25 52 Weeks Ended 52 Weeks Ended 53 Weeks Ended January 31, 2015* February 1, 2014* February 2, 2013* Net Sales $418.6 $435.8 $430.3 Gross Margin** 35.3% 34.7% 29.4% SG&A as % of sales 30.2% 29.6% 30.0% Operating Income (Loss)*** $9.4 $8.9 ($16.0) Net Income (Loss)*** $47.1 $8.7 ($16.1) Diluted EPS $1.24 $0.23 ($0.45) *Dollar amounts are shown in millions except EPS **For the year ended January 31, 2015, gross margin included a $3.6 million, or 86 bps, negative impact for correction of an immaterial error related to lease accounting. ***For the year ended February 1, 2013, operating loss included a $5.2 million pre-tax non-cash benefit and net income (loss) included a $5.4 million after-tax, non-cash benefit related to restructuring charges. For the year ended January 31, 2015, net income included a $41.3 million reversal of the valuation allowance on our deferred tax assets. |
|
|
(Unaudited) May 2, 2015 (In millions) January 31, 2015 (In millions) Cash and Investments $38.2 $55.3 Merchandise Inventories 50.8 45.3 Property and Equipment, net 51.3 45.1 Total Assets $195.5 $196.0 Long -Term Debt — — Stockholders’ Equity $135.0 $135.9 Balance Sheet and Cash Flow Summary No outstanding borrowings under revolving credit facility Merchandise inventories – Investment in key basic programs and expanded MPW formats 26 |
|
|
Total Stores and Comp Store Base as of May 2, 2015 27 Type of Store Total # of Stores # of Comp Stores Percentage Christopher & Banks 88 88 100% CJ Banks 75 75 100% MPW 304 64 21% Outlet 51 31 61% Total 518 258 50% |
|
|
Strategic Plan Remains Intact Committed to Delivering Improved Financial Results Sales growth slower than original 3-year growth plan Continued mall traffic declines Acceleration of C/C causes near-term reduction in total sales MPW performance consistent with expectations CJ+ stores gaining traction but at a slower rate in the aggregate than anticipated in locations where there were no prior CJ stores Outlets exceeding expectations Continued Gross Margin Expansion Achieving improved results faster than expected Leverage SG&A Sales decline has had negative implications 2%-3% Annual Net Square Footage Growth Remains Long-Term Goal 28 |
|
|
[LOGO] |