Attached files
| file | filename |
|---|---|
| 8-K - 8-K - Braemar Hotels & Resorts Inc. | ahpinvestorpresentation8-k.htm |

1 NAREIT - June 2015

2 Safe Harbor In keeping with the SEC's "Safe Harbor" guidelines, certain statements made during this presentation could be considered forward-looking and subject to certain risks and uncertainties that could cause results to differ materially from those projected. When we use the words "will likely result," "may," "anticipate," "estimate," "should," "expect," "believe," "intend," or similar expressions, we intend to identify forward- looking statements. Such forward-looking statements include, but are not limited to, our business and investment strategy, our understanding of our competition, current market trends and opportunities, projected operating results, and projected capital expenditures. These forward-looking statements are subject to known and unknown risks and uncertainties, which could cause actual results to differ materially from those anticipated including, without limitation: general volatility of the capital markets and the market price of our common stock; changes in our business or investment strategy; availability, terms and deployment of capital; availability of qualified personnel; changes in our industry and the market in which we operate, interest rates or the general economy, and the degree and nature of our competition. These and other risk factors are more fully discussed in the Company's filings with the Securities and Exchange Commission. Historical results are not indicative of future performance. EBITDA is defined as net income before interest, taxes, depreciation and amortization. EBITDA yield is defined as trailing twelve month EBITDA divided by the purchase price. A capitalization rate is determined by dividing the property's net operating income by the purchase price. Net operating income is the property's funds from operations minus a capital expense reserve of either 4% or 5% of gross revenues. Hotel EBITDA flow-through is the change in Hotel EBITDA divided by the change in total revenues. EBITDA, FFO, AFFO, CAD and other terms are non-GAAP measures, reconciliations of which have been provided in prior earnings releases and filings with the SEC. This overview is for informational purposes only and is not an offer to sell, or a solicitation of an offer to buy or sell, any securities of Ashford Hospitality Prime, Inc. or any of its respective affiliates, and may not be relied upon in connection with the purchase or sale of any such security.

Compelling Opportunity 3

4 Well-Defined Strategy Invest in high quality, high RevPAR hotels (RevPAR > 2x the national average) located in gateway & resort markets Conservative leverage with target (Net Debt + Preferred Equity) / EBITDA of 5.0x or less

5 Compelling Opportunity High quality portfolio predominantly located in gateway & resort markets Low leverage strategy in line with peers Highly-aligned management team Portfolio is in great physical condition after recent renovations Recently announced 100% increase in common dividend Attractive industry fundamentals with demand growth exceeding supply growth

6 Portfolio Hotel Market Rooms Marriott Seattle Waterfront Seattle, WA 358 Rooms Courtyard Seattle Downtown Seattle, WA 250 Rooms Courtyard Downtown San Francisco, CA 405 Rooms Hilton La Jolla Torrey Pines La Jolla, CA, 394 Rooms Marriott Plano Legacy Plano, TX 404 Rooms Sofitel Water Tower Chicago, IL 415 Rooms Courtyard Downtown Philadelphia, PA 498 Rooms Capital Hilton Washington, D.C. 544 Rooms Renaissance International Plaza Tampa, FL 293 Rooms Pier House Resort Key West, FL. 142 Rooms Ashford Prime Portfolio Ashford Prime Assets Courtyard San Francisco Downtown Hilton La Jolla Torrey Pines Marriott Seattle Waterfront Courtyard Seattle Downtown Sofitel Chicago Water Tower Marriott Plano Legacy Renaissance Tampa Pier House Resort Key West Capital Hilton Courtyard Philadelphia Downtown

Aligned Management & Strong Performance 7

Highly-Aligned Management 8 • With insider ownership* of approximately 14% for AHP, management is highly-aligned with shareholder interests Publicly-Traded Hotel REIT Insider Ownership Public Lodging REITs include: BEE, CHSP, CLDT, DRH, FCH, HST, HT, INN, LHO, PEB, RLJ, SHO Source: Company filings. * Insider ownership for Ashford entities includes direct & indirect interests & interests of related parties 15%* 14%* 5% 4% 3% 3% 2% 2% 2% 2% 1% 1% 1% 1% 0.5% 0% 2% 4% 6% 8% 10% 12% 14% 16%

Strong RevPAR Growth 9 FY 2014 RevPAR Growth Source: Company filings. • Ashford Prime has delivered strong RevPAR growth versus its peers 11.6% 9.2% 8.8% 8.3% 6.8% 6.3% 5.9% 0.0% 2.0% 4.0% 6.0% 8.0% 10.0% 12.0% 14.0% DRH PEB LHO AHP SHO BEE CHSP Q1 2015 RevPAR Growth 11.0% 10.8% 7.9% 7.0% 5.4% 3.6% 3.0% 0.0% 2.0% 4.0% 6.0% 8.0% 10.0% 12.0% BEE AHP DRH SHO LHO PEB CHSP

10 2013 2014 Var Q1 2014 Q1 2015 Var RevPAR $158.26 $171.35 8.3% $147.49 $163.35 10.8% Hotel Revenue $294,250 $314,583 6.9% $70,275 $77,749 10.6% Hotel EBITDA $96,321 $104,798 8.8% $20,217 $23,523 16.4% EBITDA Flow 41.7% 44.2% The above table assumes the 10 properties owned and included in continuing operations as of March 31, 2015 were owned as of the beginning of each of the periods shown Revenue and EBITDA figures displayed in $000's Strong Asset Performance 53.7% 90.3% 63.7% 55.7% 38.8% 41.7% 44.2% 0.0% 10.0% 20.0% 30.0% 40.0% 50.0% 60.0% 70.0% 80.0% 90.0% 100.0% 2009 2010 2011 2012 2013 2014 Q1 2015 Hotel EBITDA Flow-Through

Conservative Capital Structure 11 Balance Sheet Initiatives Debt Maturities - - 394.0 8.1 - 80.0 - 50.0 100.0 150.0 200.0 250.0 300.0 350.0 400.0 450.0 2015 2016 2017 2018 2019 De b t ( $ i n m il li o n s) Fixed-Rate Floating-Rate • Target (Net Debt + Preferred)/EBITDA < 5.0x • Maintain mix of fixed and floating rate debt – currently 54.6% fixed/45.4% floating* • Ladder debt maturities • All debt is property-level and non-recourse *As of 3/31/15

Significant Liquidity 12 Net Working Capital (1) (2) Enterprise Value • Maintain excess cash balance to capitalize on opportunities • Significant additional value through net working capital balance (1) Ashford Prime's pro rata share (2) As of 3/31/15 $ in millions Cash and cash equivalents $158.3 Restricted cash 25.8 Accounts receivable, net 12.4 Prepaid expenses 3.4 Due from affiliates, net (1.9) Due from 3rd party hotel managers, net 5.4 Total current assets $203.4 Accounts payable, net & accrued expenses $26.8 Dividends payable 1.4 Total current liabilities $28.2 Net working capital $175.2 $ in millions except per share data Stock Price (as of 6/5/15) $15.62 Fully diluted shares outstanding (mm) (2) 32.4 Equity value $506.1 Debt (1) (2) 715.0 Total Market Capitalization $1,221.1 Less: Net working capital (1) (2) (175.2) Total Enterprise Value $1,045.9

Strong Industry Fundamentals 13

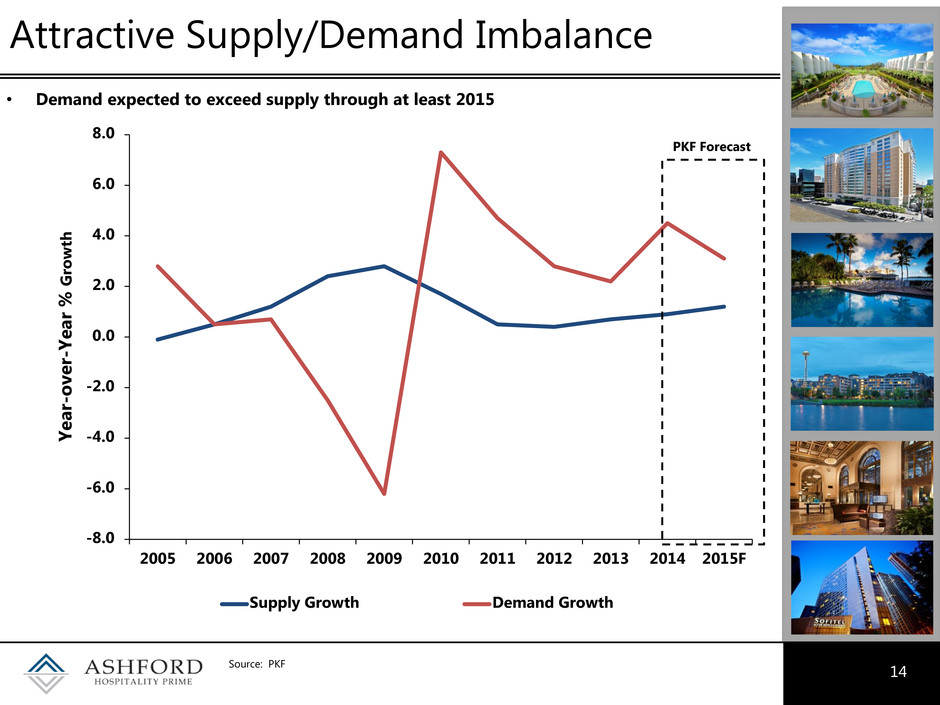
• Demand expected to exceed supply through at least 2015 14 Attractive Supply/Demand Imbalance Source: PKF -8.0 -6.0 -4.0 -2.0 0.0 2.0 4.0 6.0 8.0 2005 2006 2007 2008 2009 2010 2011 2012 2013 2014 2015F Supply Growth Demand Growth Yea r- o v e r- Year % Gro w th PKF Forecast

15 Source: PKF 7.7% 6.1% -2.0% -16.7% 5.4% 8.2% 6.8% 5.4% 8.3% 7.2% 6.8% -20.0% -15.0% -10.0% -5.0% 0.0% 5.0% 10.0% Historical RevPAR Growth Forecasted RevPAR Growth PKF RevPAR Growth Forecasts

16 Potential Industry EBITDA Growth Rates *Based on PKF RevPAR/ADR/Occupancy projections and EBITDA growth resulting from PKF EBITDA change regression equation. • With strong potential RevPAR gains, those companies with reasonable flow-throughs could experience significant EBITDA growth • PKF estimates 2-year cumulative EBITDA growth of about 29%* COMPOUNDED 2-YEAR REVPAR GROWTH RATE COMPOUNDED 2-YEAR REVPAR GROWTH RATE 29.0% 6.0% 6.5% 7.0% 7.5% 8.0% 20.0% 10.7% 11.2% 11.6% 12.0% 12.4% 25.0% 13.4% 14.0% 14.5% 15.0% 15.6% 30.0% 16.1% 16.7% 17.4% 18.0% 18.7% 35.0% 18.8% 19.5% 20.3% 21.0% 21.8% 40.0% 21.5% 22.3% 23.2% 24.0% 24.9% 45.0% 24.2% 25.1% 26.1% 27.0% 28.0% 50.0% 26.8% 27.9% 29.0% 30.1% 31.1% 55.0% 29.5% 30.7% 31.9% 33.1% 34.2% 60.0% 32.2% 33.5% 34.8% 36.1% 37.3% 65.0% 34.9% 36.3% 37.7% 39.1% 40.5% 70.0% 37.6% 39.1% 40.6% 42.1% 43.6% 2- YE AR EB IT DA FL OW % CUMULATIVE 2-YEAR EBITDA GROWTH

• Historically, attractive returns remain for investors from this point in the lodging cycle 17 Historical Industry Stock Returns Index includes AHT, BEE, DRH, FCH, HST, HT, LHO, and SHO. Companies are included in the data from the time of their IPO Current data as of May 31, 2015 % 50% 100% 150% 200% 250% 300% 350% 0 12 24 36 48 60 72 84 96 108 T S R Months from Peak to Peak 1989-1997 1997-2007 2007-Current

Growth & Acquisition Strategy 18

19 Highly quantitative approach focused on long-term accretion Proven track record of value-creating acquisitions Disciplined capital allocation Multiple ways to grow platform: Unique built-in pipeline via right-of-first-offer hotels from Ashford Trust Targeted acquisitions consistent with investment guidelines Internal growth from asset performance Growth & Acquisition Strategy

Accretive Growth 20 - Ashford Prime management is focused on accretive growth - Our definition of accretion: the 5-year Total Return (TR) post-transaction must be greater than the 5-year Total Return pre-transaction - Transactions are modeled on a leverage-neutral basis Base Model Transaction (Leverage-Neutral) Combined Model 5-year TR 5-year TR Combined 5-year TR > Base 5-year TR

21 Ashford Prime Recent Developments Q1 2015 marks three consecutive quarters of double-digit RevPAR growth In May, the Company announced a 100% increase in its common dividend Q1 2015 RevPAR up 10.8%, Hotel EBITDA up 16.4% and EBITDA flow-through was 44%

22 NAREIT - June 2015
