Attached files
| file | filename |
|---|---|
| 8-K - SUMMIT HOTEL PROPERTIES, INC. 8-K - Summit Hotel Properties, Inc. | a51118958.htm |
| EX-99.1 - EXHIBIT 99.1 - Summit Hotel Properties, Inc. | a51118958ex99_1.htm |
Exhibit 99.2

Summit Hotel Properties Investor Presentation June 2015
FORWARD LOOKING STATEMENTS We make forward-looking statements in this presentation that are subject to risks and uncertainties. These forward-looking statements include information about possible or assumed future results of our business, financial condition, liquidity, results of operations, plans and objectives. When we use the words “believe,” “expect,” “anticipate,” “estimate,” “plan,” “continue,” “intend,” “should,” “may” or similar expressions, we intend to identify forward-looking statements. Statements regarding the following subjects, among others, may be forward-looking by their nature: • our ability to increase our dividend per share of common stock; • the state of the U.S. economy generally or in specific geographic regions in which we operate, and the effect of general economic conditions on the lodging industry and our business in particular; • market trends in our industry, interest rates, real estate values and the capital markets; • our business and investment strategy and, particularly, our ability to identify and complete hotel acquisitions; • our projected operating results; • actions and initiatives of the U.S. government and changes to U.S. government policies and the execution and impact of these actions, initiatives and policies; • our ability to manage our relationships with our management companies and franchisors; • our ability to maintain our existing and future financing arrangements; • changes in the value of our properties; • impact of and changes in governmental regulations, tax law and rates, accounting guidance and similar matters; • our ability to satisfy the requirements for qualification as a REIT under the U.S. Tax Code; • our ability to repay or refinance our indebtedness as it matures or becomes callable by lenders; • availability of qualified personnel; • our ability to make distributions to our stockholders in the future; • general volatility of the market price of our securities; and • degree and nature of our competition. The forward-looking statements are based on our beliefs, assumptions and expectations of our future performance, taking into account information currently available to us. You should not place undue reliance on these forward-looking statements. These beliefs, assumptions and expectations can change as a result of many possible events or factors, not all of which are known to us. These factors are discussed under “Item 1A. Risk Factors” in our Annual Report on Form 10-K for the year ended December 31, 2014 and in other documents we have filed with the Securities and Exchange Commission. If a change occurs, our business, financial condition, liquidity and results of operations may vary materially from those expressed in our forward-looking statements. Any forward-looking statement speaks only as of the date on which it is made. New risks and uncertainties arise over time, and it is not possible for us to predict those events or how they may affect us. Except as required by law, we are not obligated to, and do not intend to, publicly update or revise any forward-looking statements, whether as a result of new information, future events or otherwise. This presentation may contain statistics and other data that may have been obtained from or compiled from information made available by third-parties.
SUMMIT HIGHLIGHTS • Recently Announced Portfolio Sale • Unique Focus on Premium Select-Service • Portfolio Transformation Driving Growth • Recycling Capital to Improve Portfolio Quality • Attractive Dividend Yield • Strong, Conservative Balance Sheet 1
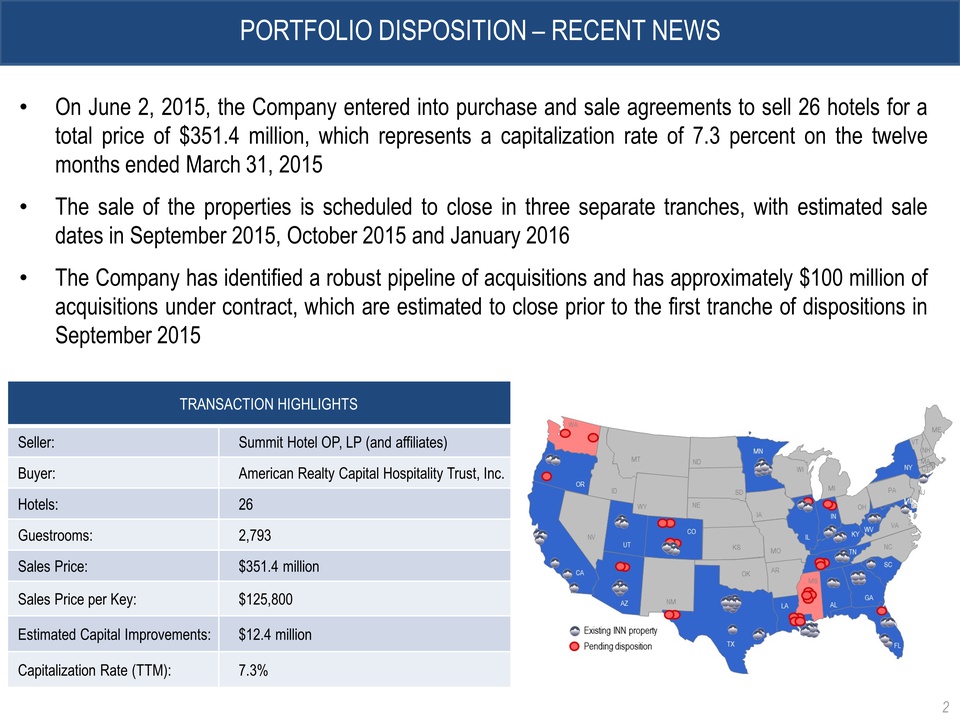
PORTFOLIO DISPOSITION – RECENT NEWS TRANSACTION HIGHLIGHTS Seller: Summit Hotel OP, LP (and affiliates) Buyer: American Realty Capital Hospitality Trust, Inc. Hotels: 26 Guestrooms: 2,793 Sales Price: $351.4 million Sales Price per Key: $125,800 Estimated Capital Improvements: $12.4 million Capitalization Rate (TTM): 7.3% • On June 2, 2015, the Company entered into purchase and sale agreements to sell 26 hotels for a total price of $351.4 million, which represents a capitalization rate of 7.3 percent on the twelve months ended March 31, 2015 • The sale of the properties is scheduled to close in three separate tranches, with estimated sale dates in September 2015, October 2015 and January 2016 • The Company has identified a robust pipeline of acquisitions and has approximately $100 million of acquisitions under contract, which are estimated to close prior to the first tranche of dispositions in September 2015 2
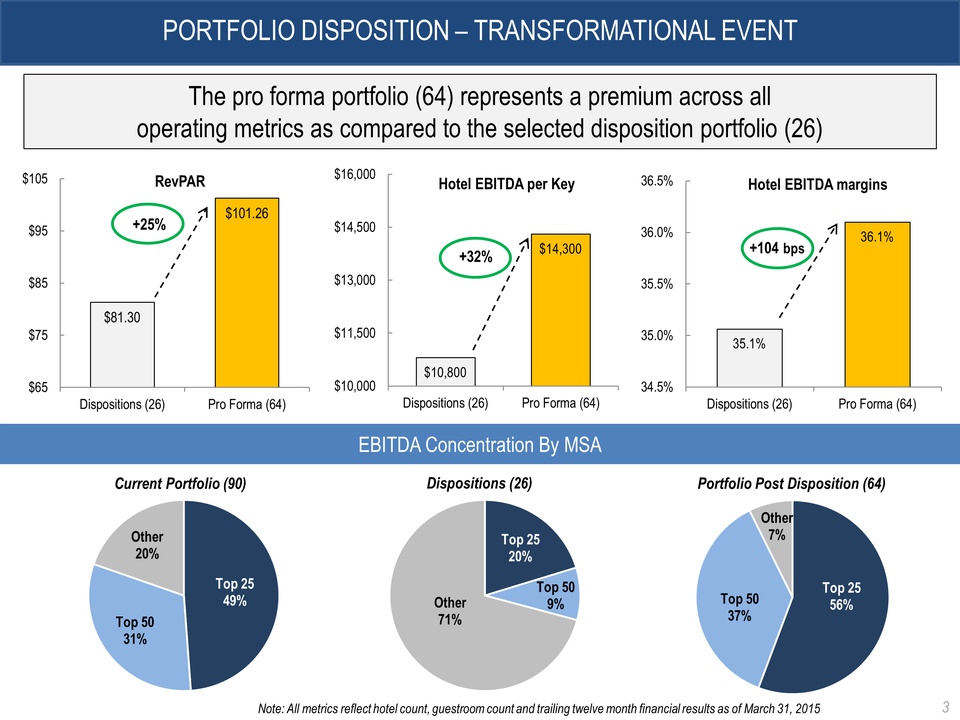
PORTFOLIO DISPOSITION – TRANSFORMATIONAL EVENT The pro forma portfolio (64) represents a premium across all operating metrics as compared to the selected disposition portfolio (26) $81.30 $101.26 $65 $75 $85 $95 $105 Dispositions (26) Pro Forma (64) RevPAR +25% 3 Top 25 Top 50 56% 37% Other 7% Current Portfolio (90) EBITDA Concentration By MSA Dispositions (26) Portfolio Post Disposition (64) Top 25 49% Top 50 31% Other 20% $10,800 $14,300 $10,000 $11,500 $13,000 $14,500 $16,000 Dispositions (26) Pro Forma (64) Hotel EBITDA per Key +32% 35.1% 36.1% 34.5% 35.0% 35.5% 36.0% 36.5% Dispositions (26) Pro Forma (64) Hotel EBITDA margins +104 bps Top 25 20% Top 50 Other 9% 71% Note: All metrics reflect hotel count, guestroom count and trailing twelve month financial results as of March 31, 2015 3
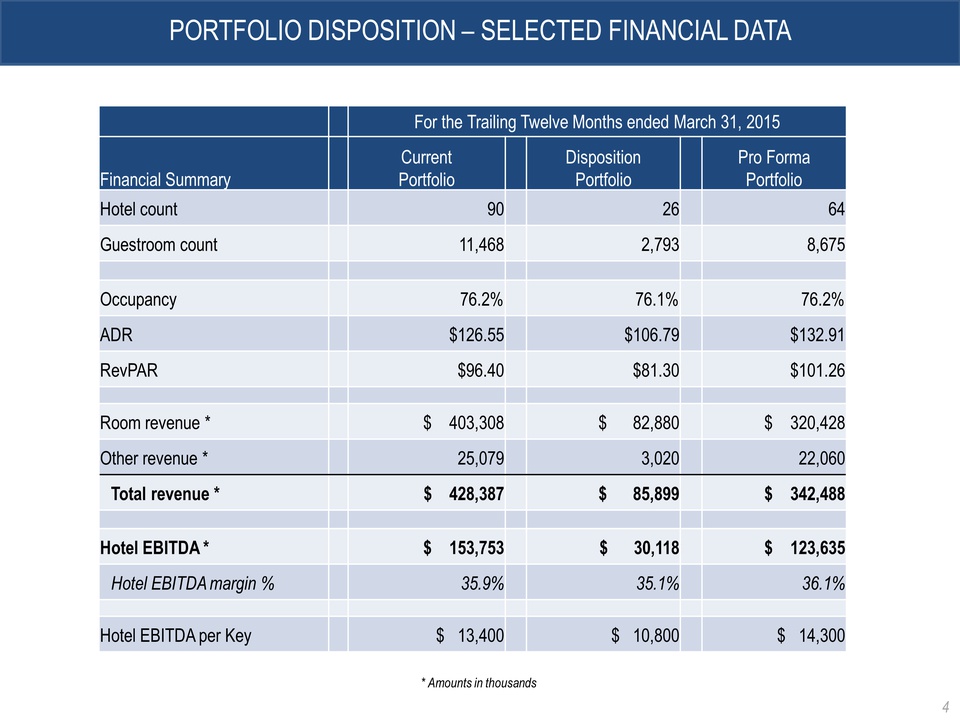
PORTFOLIO DISPOSITION – SELECTED FINANCIAL DATA For the Trailing Twelve Months ended March 31, 2015 Financial Summary Current Portfolio Disposition Portfolio Pro Forma Portfolio Hotel count 90 26 64 Guestroom count 11,468 2,793 8,675 Occupancy 76.2% 76.1% 76.2% ADR $126.55 $106.79 $132.91 RevPAR $96.40 $81.30 $101.26 Room revenue * $ 403,308 $ 82,880 $ 320,428 Other revenue * 25,079 3,020 22,060 Total revenue * $ 428,387 $ 85,899 $ 342,488 Hotel EBITDA * $ 153,753 $ 30,118 $ 123,635 Hotel EBITDA margin % 35.9% 35.1% 36.1% Hotel EBITDA per Key $ 13,400 $ 10,800 $ 14,300 * Amounts in thousands 4
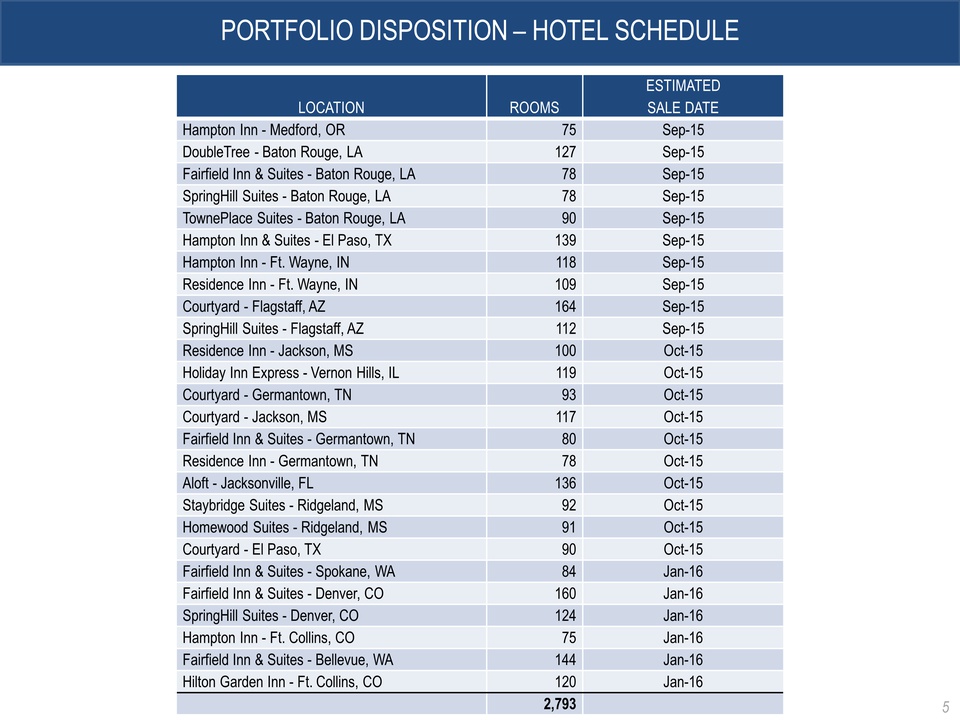
PORTFOLIO DISPOSITION – HOTEL SCHEDULE LOCATION ROOMS ESTIMATED SALE DATE Hampton Inn - Medford, OR 75 Sep-15 DoubleTree - Baton Rouge, LA 127 Sep-15 Fairfield Inn & Suites - Baton Rouge, LA 78 Sep-15 SpringHill Suites - Baton Rouge, LA 78 Sep-15 TownePlace Suites - Baton Rouge, LA 90 Sep-15 Hampton Inn & Suites - El Paso, TX 139 Sep-15 Hampton Inn - Ft. Wayne, IN 118 Sep-15 Residence Inn - Ft. Wayne, IN 109 Sep-15 Courtyard - Flagstaff, AZ 164 Sep-15 SpringHill Suites - Flagstaff, AZ 112 Sep-15 Residence Inn - Jackson, MS 100 Oct-15 Holiday Inn Express - Vernon Hills, IL 119 Oct-15 Courtyard - Germantown, TN 93 Oct-15 Courtyard - Jackson, MS 117 Oct-15 Fairfield Inn & Suites - Germantown, TN 80 Oct-15 Residence Inn - Germantown, TN 78 Oct-15 Aloft - Jacksonville, FL 136 Oct-15 Staybridge Suites - Ridgeland, MS 92 Oct-15 Homewood Suites - Ridgeland, MS 91 Oct-15 Courtyard - El Paso, TX 90 Oct-15 Fairfield Inn & Suites - Spokane, WA 84 Jan-16 Fairfield Inn & Suites - Denver, CO 160 Jan-16 SpringHill Suites - Denver, CO 124 Jan-16 Hampton Inn - Ft. Collins, CO 75 Jan-16 Fairfield Inn & Suites - Bellevue, WA 144 Jan-16 Hilton Garden Inn - Ft. Collins, CO 120 Jan-16 2,793 5
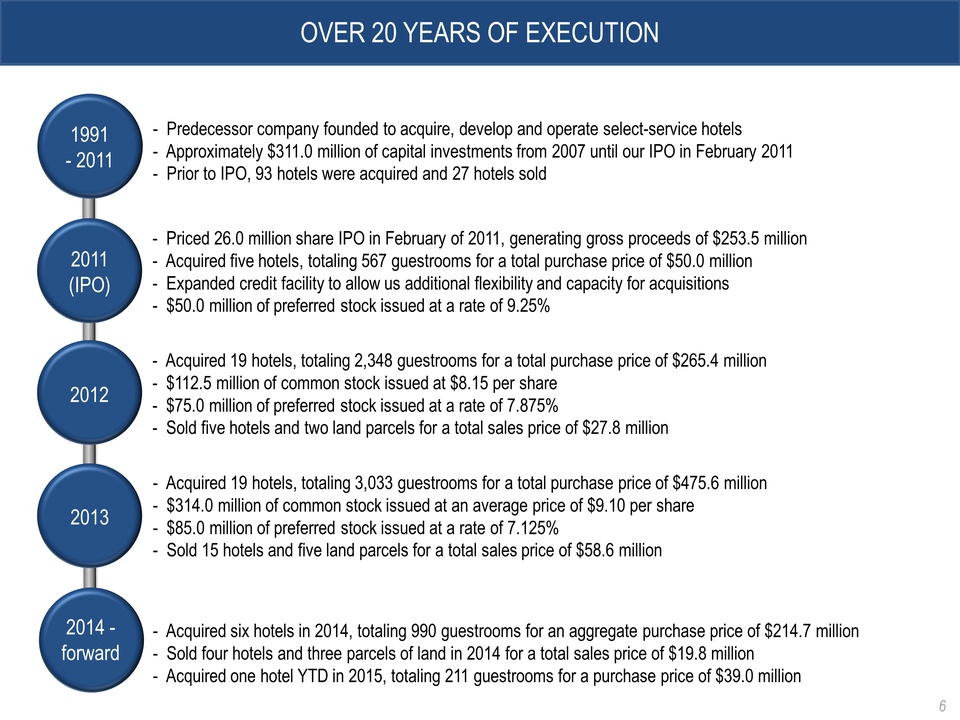
OVER 20 YEARS OF EXECUTION 2011 (IPO) 2014 - forward 2012 2013 1991 - 2011 2011 (IPO) 2012 2013 2014 - forward - Predecessor company founded to acquire, develop and operate select-service hotels - Approximately $311.0 million of capital investments from 2007 until our IPO in February 2011 - Prior to IPO, 93 hotels were acquired and 27 hotels sold - Priced 26.0 million share IPO in February of 2011, generating gross proceeds of $253.5 million - Acquired five hotels, totaling 567 guestrooms for a total purchase price of $50.0 million - Expanded credit facility to allow us additional flexibility and capacity for acquisitions - $50.0 million of preferred stock issued at a rate of 9.25% - Acquired 19 hotels, totaling 2,348 guestrooms for a total purchase price of $265.4 million - $112.5 million of common stock issued at $8.15 per share - $75.0 million of preferred stock issued at a rate of 7.875% - Sold five hotels and two land parcels for a total sales price of $27.8 million - Acquired 19 hotels, totaling 3,033 guestrooms for a total purchase price of $475.6 million - $314.0 million of common stock issued at an average price of $9.10 per share - $85.0 million of preferred stock issued at a rate of 7.125% - Sold 15 hotels and five land parcels for a total sales price of $58.6 million - Acquired six hotels in 2014, totaling 990 guestrooms for an aggregate purchase price of $214.7 million - Sold four hotels and three parcels of land in 2014 for a total sales price of $19.8 million - Acquired one hotel YTD in 2015, totaling 211 guestrooms for a purchase price of $39.0 million 6
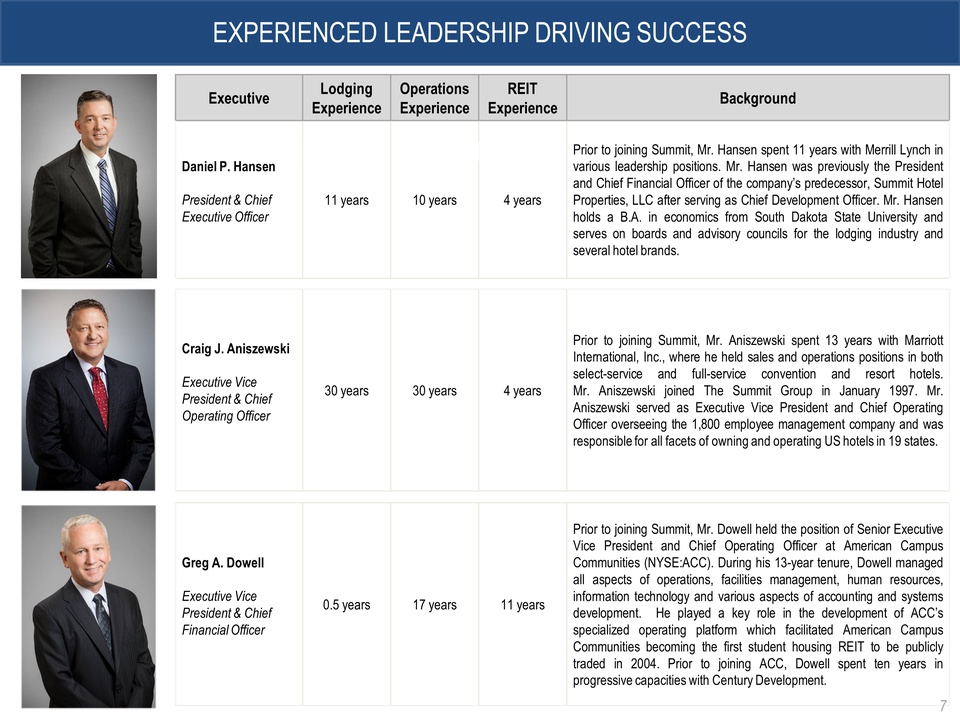
EXPERIENCED LEADERSHIP DRIVING SUCCESS Executive Lodging Experience Operations Experience REIT Experience Background Daniel P. Hansen President & Chief Executive Officer 11 years 10 years 4 years Prior to joining Summit, Mr. Hansen spent 11 years with Merrill Lynch in various leadership positions. Mr. Hansen was previously the President and Chief Financial Officer of the company’s predecessor, Summit Hotel Properties, LLC after serving as Chief Development Officer. Mr. Hansen holds a B.A. in economics from South Dakota State University and serves on boards and advisory councils for the lodging industry and several hotel brands. Craig J. Aniszewski Executive Vice President & Chief Operating Officer 30 years 30 years 4 years Prior to joining Summit, Mr. Aniszewski spent 13 years with Marriott International, Inc., where he held sales and operations positions in both select-service and full-service convention and resort hotels. Mr. Aniszewski joined The Summit Group in January 1997. Mr. Aniszewski served as Executive Vice President and Chief Operating Officer overseeing the 1,800 employee management company and was responsible for all facets of owning and operating US hotels in 19 states. Greg A. Dowell Executive Vice President & Chief Financial Officer 0.5 years 17 years 11 years Prior to joining Summit, Mr. Dowell held the position of Senior Executive Vice President and Chief Operating Officer at American Campus Communities (NYSE:ACC). During his 13-year tenure, Dowell managed all aspects of operations, facilities management, human resources, information technology and various aspects of accounting and systems development. He played a key role in the development of ACC’s specialized operating platform which facilitated American Campus Communities becoming the first student housing REIT to be publicly traded in 2004. Prior to joining ACC, Dowell spent ten years in progressive capacities with Century Development. 7
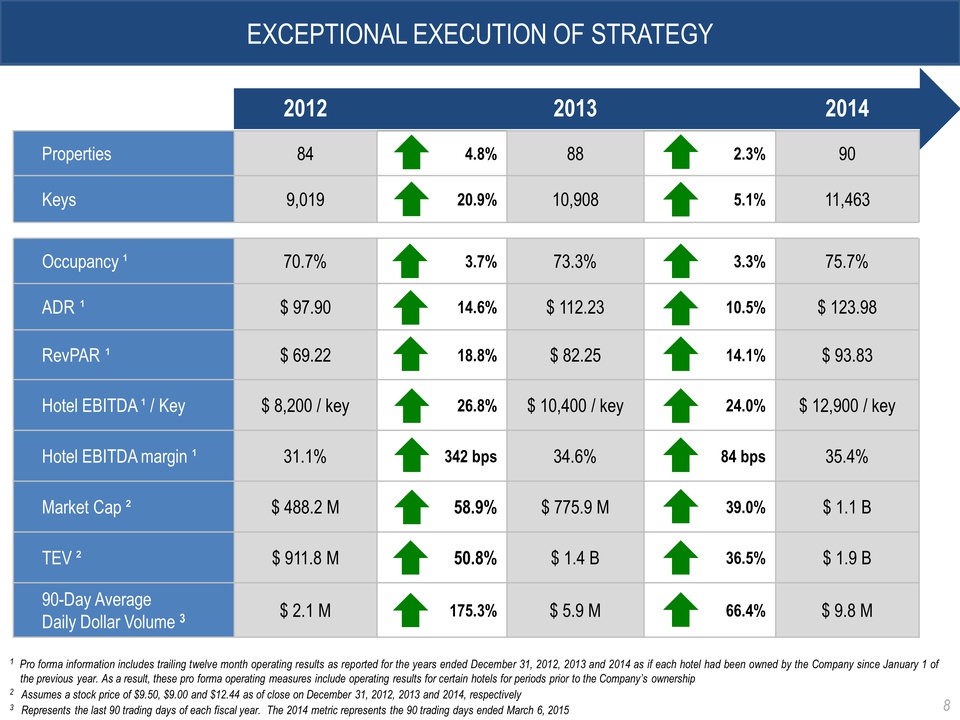
EXCEPTIONAL EXECUTION OF STRATEGY 2011 (IPO) 2012 2012 2013 2014 Properties 84 4.8% 88 2.3% 90 Keys 9,019 20.9% 10,908 5.1% 11,463 Occupancy ¹ 70.7% 3.7% 73.3% 3.3% 75.7% ADR ¹ $ 97.90 14.6% $ 112.23 10.5% $ 123.98 RevPAR ¹ $ 69.22 18.8% $ 82.25 14.1% $ 93.83 Hotel EBITDA ¹ / Key $ 8,200 / key 26.8% $ 10,400 / key 24.0% $ 12,900 / key Hotel EBITDA margin ¹ 31.1% 342 bps 34.6% 84 bps 35.4% Market Cap ² $ 488.2 M 58.9% $ 775.9 M 39.0% $ 1.1 B TEV ² $ 911.8 M 50.8% $ 1.4 B 36.5% $ 1.9 B 90-Day Average Daily Dollar Volume 3 $ 2.1 M 175.3% $ 5.9 M 66.4% $ 9.8 M 1 Pro forma information includes trailing twelve month operating results as reported for the years ended December 31, 2012, 2013 and 2014 as if each hotel had been owned by the Company since January 1 of the previous year. As a result, these pro forma operating measures include operating results for certain hotels for periods prior to the Company’s ownership 2 Assumes a stock price of $9.50, $9.00 and $12.44 as of close on December 31, 2012, 2013 and 2014, respectively 3 Represents the last 90 trading days of each fiscal year. The 2014 metric represents the 90 trading days ended March 6, 2015 8
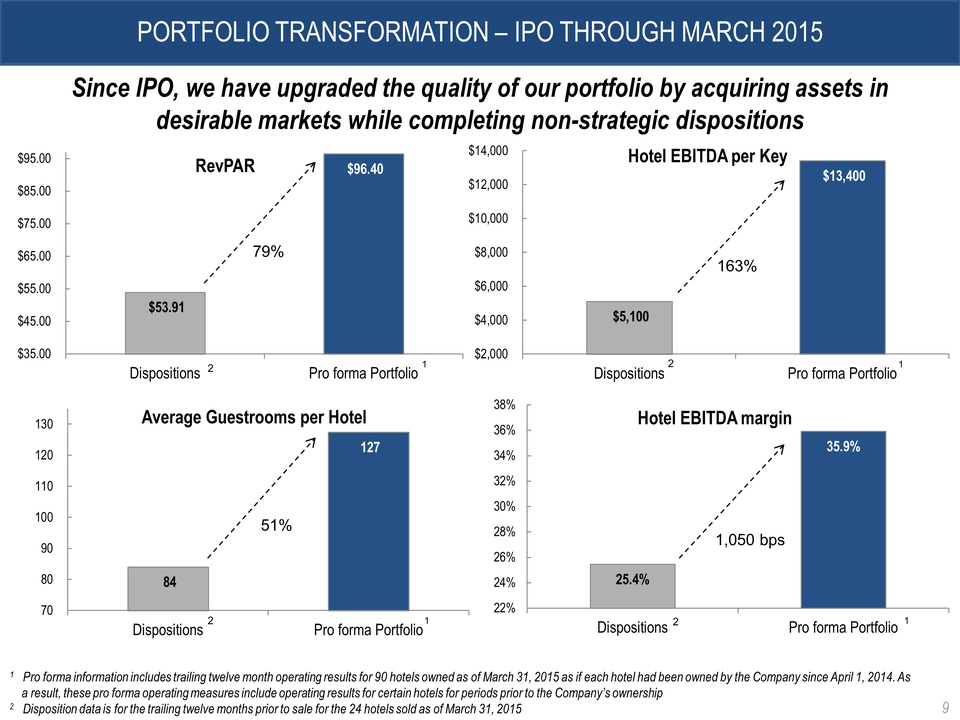
PORTFOLIO TRANSFORMATION – IPO THROUGH MARCH 2015 Since IPO, we have upgraded the quality of our portfolio by acquiring assets in desirable markets while completing non-strategic dispositions 84 127 70 80 90 100 110 120 130 Dispositions Pro forma Portfolio Average Guestrooms per Hotel $53.91 $96.40 $35.00 $45.00 $55.00 $65.00 $75.00 $85.00 $95.00 Dispositions Pro forma Portfolio RevPAR $5,100 $13,400 $2,000 $4,000 $6,000 $8,000 $10,000 $12,000 $14,000 Dispositions Pro forma Portfolio Hotel EBITDA per Key 25.4% 35.9% 22% 24% 26% 28% 30% 32% 34% 36% 38% Dispositions Pro forma Portfolio Hotel EBITDA margin 1,050 bps 163% 79% 1 1 2 1 2 1 2 2 51% 1 Pro forma information includes trailing twelve month operating results for 90 hotels owned as of March 31, 2015 as if each hotel had been owned by the Company since April 1, 2014. As a result, these pro forma operating measures include operating results for certain hotels for periods prior to the Company’s ownership 2 Disposition data is for the trailing twelve months prior to sale for the 24 hotels sold as of March 31, 2015 9
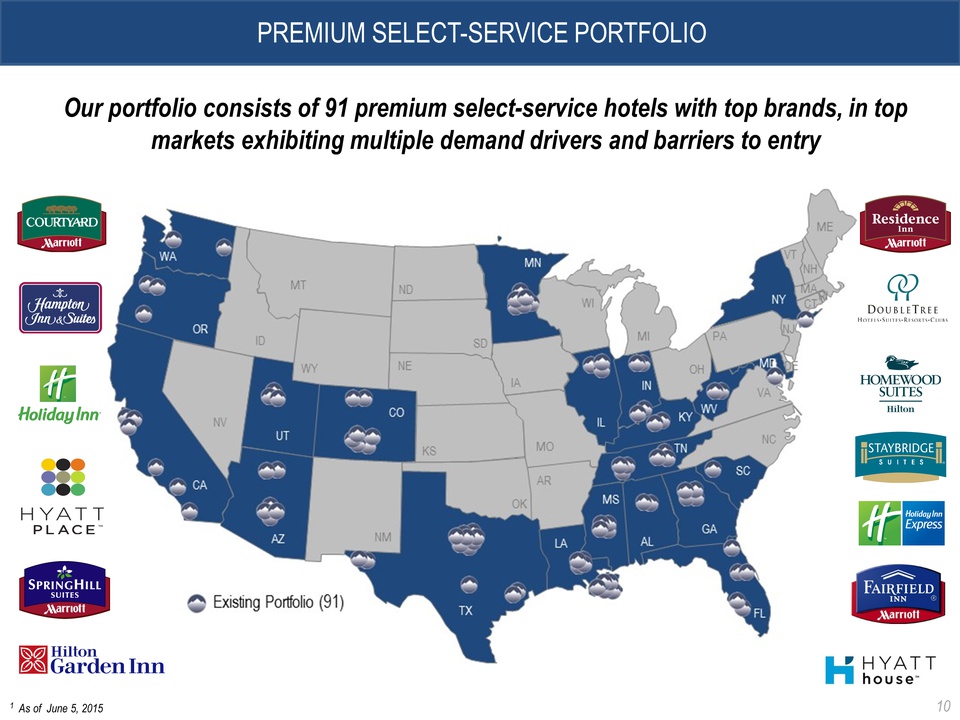
PREMIUM SELECT-SERVICE PORTFOLIO 1 As of June 5, 2015 10 Our portfolio consists of 91 premium select-service hotels with top brands, in top markets exhibiting multiple demand drivers and barriers to entry 10
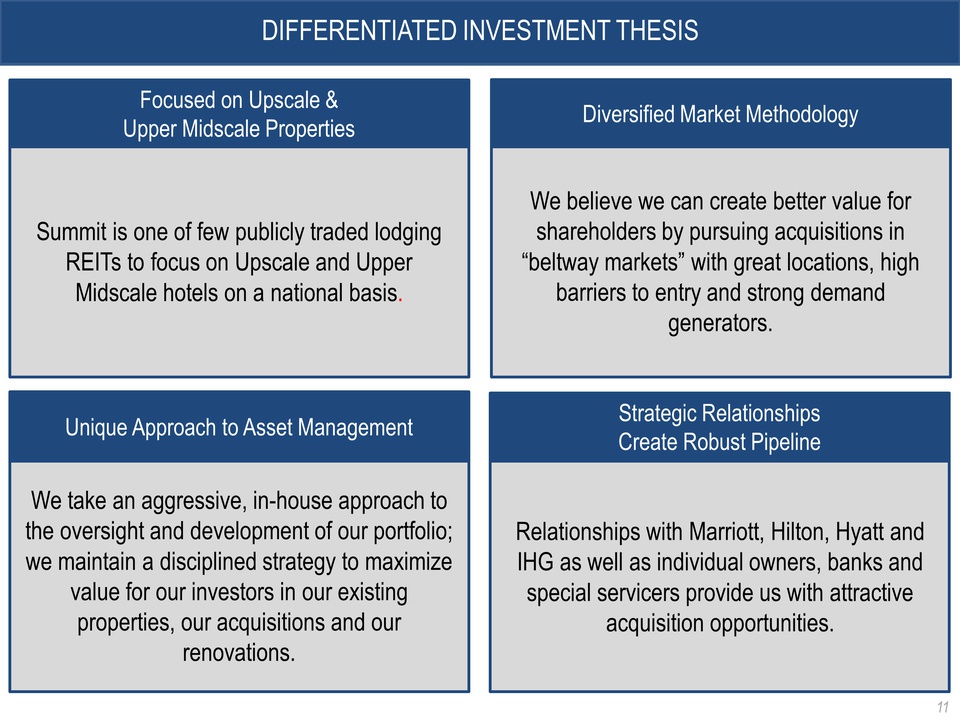
DIFFERENTIATED INVESTMENT THESIS Unique Approach to Asset Management Strategic Relationships Create Robust Pipeline Focused on Upscale & Diversified Market Methodology Upper Midscale Properties Summit is one of few publicly traded lodging REITs to focus on Upscale and Upper Midscale hotels on a national basis. We believe we can create better value for shareholders by pursuing acquisitions in “beltway markets” with great locations, high barriers to entry and strong demand generators. Relationships with Marriott, Hilton, Hyatt and IHG as well as individual owners, banks and special servicers provide us with attractive acquisition opportunities. We take an aggressive, in-house approach to the oversight and development of our portfolio; we maintain a disciplined strategy to maximize value for our investors in our existing properties, our acquisitions and our renovations. 11
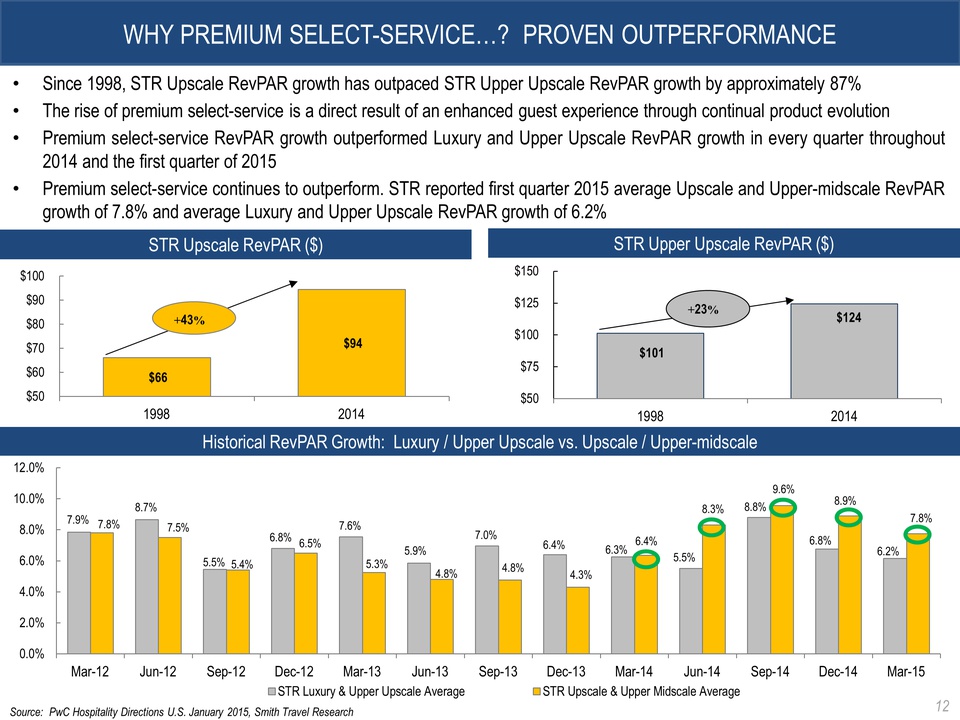
WHY PREMIUM SELECT-SERVICE…? PROVEN OUTPERFORMANCE Historical RevPAR Growth: Luxury / Upper Upscale vs. Upscale / Upper-midscale $66 $94 $50 $60 $70 $80 $90 $100 1998 2014 +43% STR Upscale RevPAR ($) $101 $124 $50 $75 $100 $125 $150 1998 2014 +23% STR Upper Upscale RevPAR ($) • Since 1998, STR Upscale RevPAR growth has outpaced STR Upper Upscale RevPAR growth by approximately 87% • The rise of premium select-service is a direct result of an enhanced guest experience through continual product evolution • Premium select-service RevPAR growth outperformed Luxury and Upper Upscale RevPAR growth in every quarter throughout 2014 and the first quarter of 2015 • Premium select-service continues to outperform. STR reported first quarter 2015 average Upscale and Upper-midscale RevPAR growth of 7.8% and average Luxury and Upper Upscale RevPAR growth of 6.2% 7.9% 8.7% 5.5% 6.8% 7.6% 5.9% 7.0% 6.4% 6.3% 5.5% 8.8% 6.8% 6.2% 7.8% 7.5% 5.4% 6.5% 5.3% 4.8% 4.8% 4.3% 6.4% 8.3% 9.6% 8.9% 7.8% 0.0% 2.0% 4.0% 6.0% 8.0% 10.0% 12.0% Mar-12 Jun-12 Sep-12 Dec-12 Mar-13 Jun-13 Sep-13 Dec-13 Mar-14 Jun-14 Sep-14 Dec-14 Mar-15 STR Luxury & Upper Upscale Average STR Upscale & Upper Midscale Average Source: PwC Hospitality Directions U.S. January 2015, Smith Travel Research 12
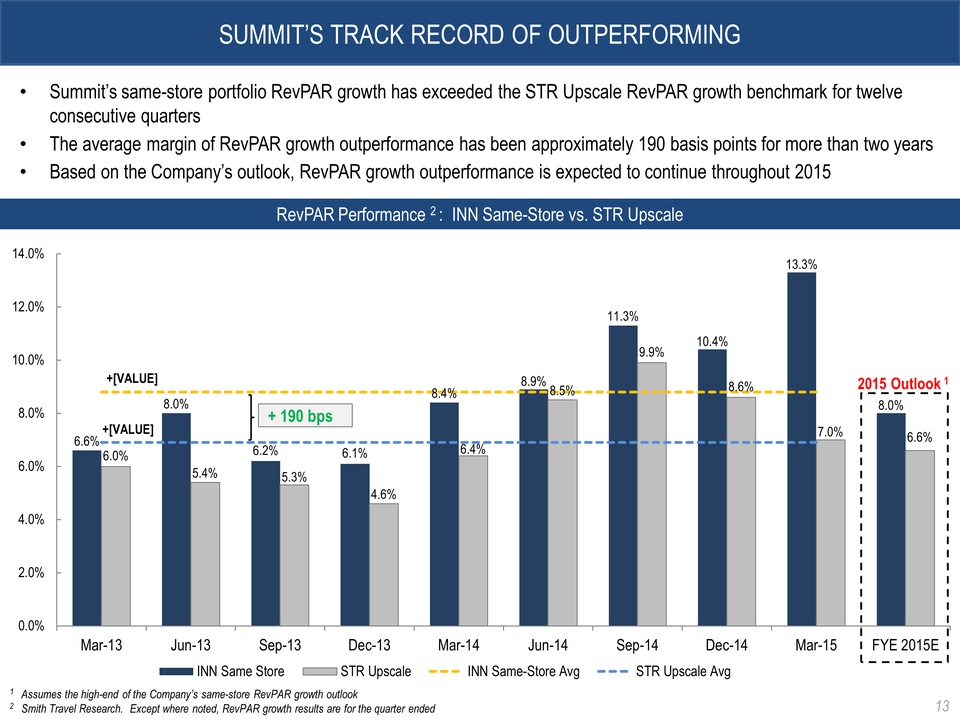
SUMMIT’S TRACK RECORD OF OUTPERFORMING RevPAR Performance 2 : INN Same-Store vs. STR Upscale • Summit’s same-store portfolio RevPAR growth has exceeded the STR Upscale RevPAR growth benchmark for twelve consecutive quarters • The average margin of RevPAR growth outperformance has been approximately 190 basis points for more than two years • Based on the Company’s outlook, RevPAR growth outperformance is expected to continue throughout 2015 6.6% 8.0% 6.2% 6.1% 8.4% 8.9% 11.3% 10.4% 13.3% 8.0% 6.0% 5.4% 5.3% 4.6% 6.4% 8.5% 9.9% 8.6% 7.0% 6.6% +[VALUE] +[VALUE] 0.0% 2.0% 4.0% 6.0% 8.0% 10.0% 12.0% 14.0% Mar-13 Jun-13 Sep-13 Dec-13 Mar-14 Jun-14 Sep-14 Dec-14 Mar-15 FYE 2015E INN Same Store STR Upscale INN Same-Store Avg STR Upscale Avg 2015 Outlook 1 + 190 bps 1 Assumes the high-end of the Company’s same-store RevPAR growth outlook 2 Smith Travel Research. Except where noted, RevPAR growth results are for the quarter ended 13
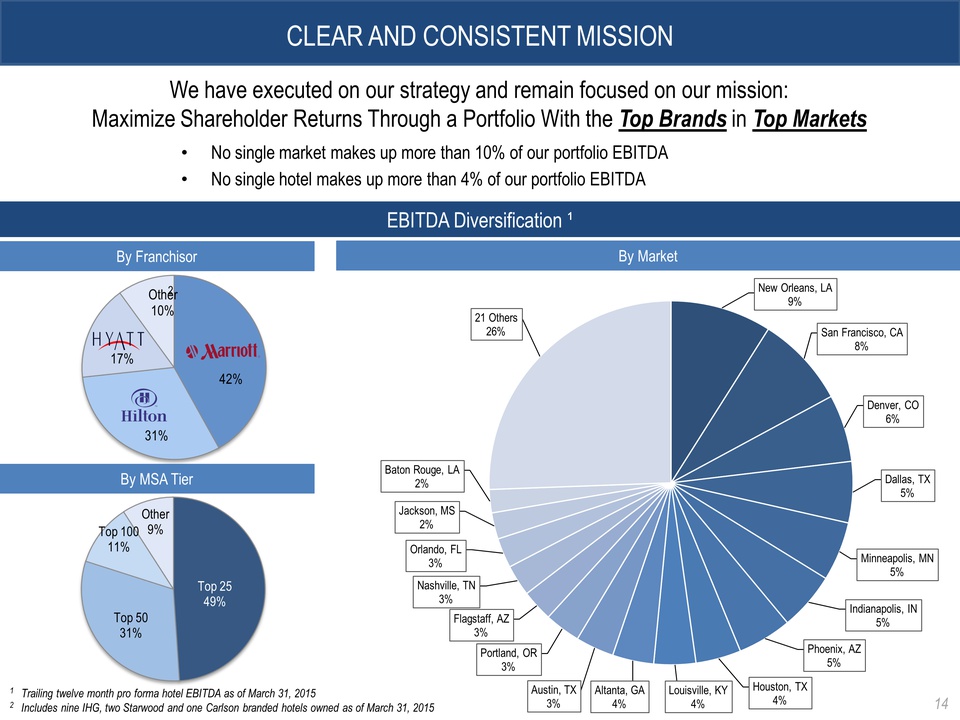
CLEAR AND CONSISTENT MISSION New Orleans, LA 9% San Francisco, CA 8% Denver, CO 6% Dallas, TX 5% Minneapolis, MN 5% Indianapolis, IN 5% Phoenix, AZ 5% Houston, TX 4% Louisville, KY 4% Altanta, GA 4% Austin, TX 3% Portland, OR 3% Flagstaff, AZ 3% Nashville, TN 3% Orlando, FL 3% Jackson, MS 2% Baton Rouge, LA 2% 21 Others 26% 1 Trailing twelve month pro forma hotel EBITDA as of March 31, 2015 2 Includes nine IHG, two Starwood and one Carlson branded hotels owned as of March 31, 2015 14
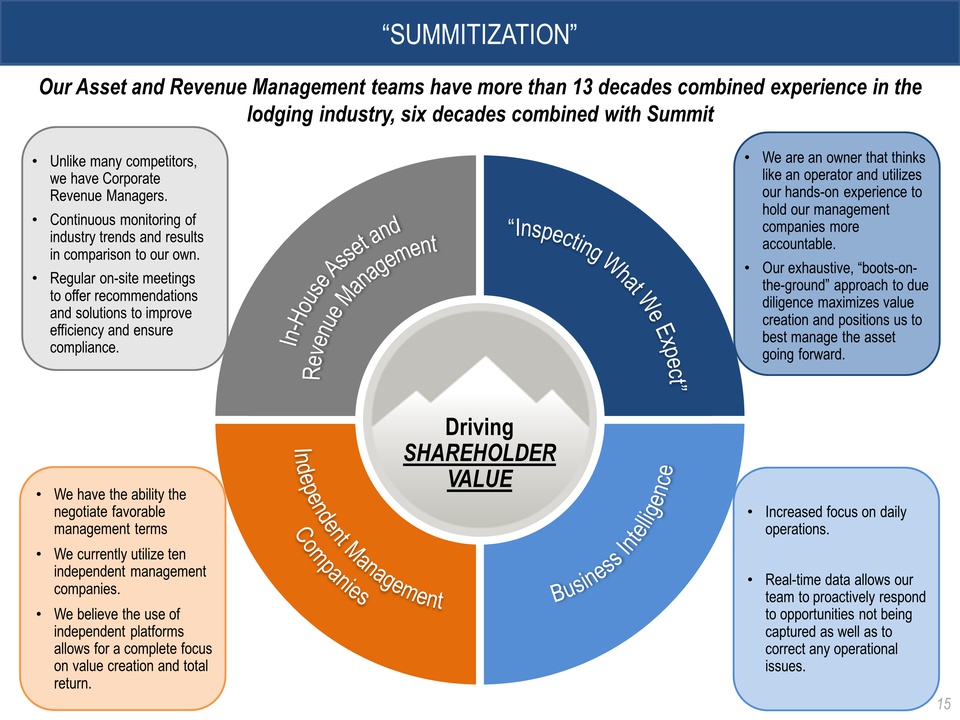
“SUMMITIZATION” By MSA Tier By Franchisor We have executed on our strategy and remain focused on our mission: Maximize Shareholder Returns Through a Portfolio With the Top Brands in Top Markets EBITDA Diversification ¹ By Market • No single market makes up more than 10% of our portfolio EBITDA • No single hotel makes up more than 4% of our portfolio EBITDA [PER CENT AGE] 31% 17% Other 10% [CATEG ORY NAME] [PERCE NTAGE] [CATEG ORY NAME] [PERCE NTAGE] [CATEG ORY NAME] [PERCE NTAGE] [CATEG ORY NAME] [PERCE NTAGE] 2 15 Our Asset and Revenue Management teams have more than 13 decades combined experience in the lodging industry, six decades combined with Summit • Unlike many competitors, we have Corporate Revenue Managers. • Continuous monitoring of industry trends and results in comparison to our own. • Regular on-site meetings to offer recommendations and solutions to improve efficiency and ensure compliance. • We are an owner that thinks like an operator and utilizes our hands-on experience to hold our management companies more accountable. • Our exhaustive, “boots-onthe- ground” approach to due diligence maximizes value creation and positions us to best manage the asset going forward. • Increased focus on daily operations. • Real-time data allows our team to proactively respond to opportunities not being captured as well as to correct any operational issues. • We have the ability the negotiate favorable management terms • We currently utilize ten independent management companies. • We believe the use of independent platforms allows for a complete focus on value creation and total return. Driving SHAREHOLDER VALUE 16
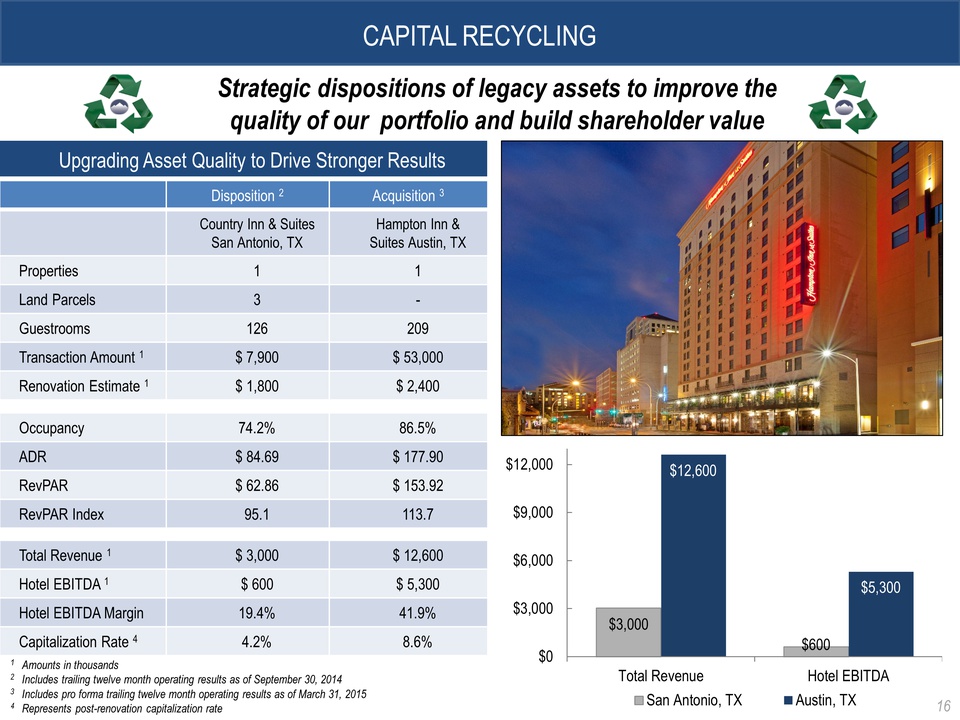
CAPITAL RECYCLING Upgrading Asset Quality to Drive Stronger Results Strategic dispositions of legacy assets to improve the quality of our portfolio and build shareholder value $3,000 $600 $12,600 $5,300 $0 $3,000 $6,000 $9,000 $12,000 Total Revenue Hotel EBITDA San Antonio, TX Austin, TX 1 Amounts in thousands 2 Includes trailing twelve month operating results as of September 30, 2014 3 Includes pro forma trailing twelve month operating results as of March 31, 2015 4 Represents post-renovation capitalization rate Disposition 2 Acquisition 3 Country Inn & Suites San Antonio, TX Hampton Inn & Suites Austin, TX Properties 1 1 Land Parcels 3 - Guestrooms 126 209 Transaction Amount 1 $ 7,900 $ 53,000 Renovation Estimate 1 $ 1,800 $ 2,400 Occupancy 74.2% 86.5% ADR $ 84.69 $ 177.90 RevPAR $ 62.86 $ 153.92 RevPAR Index 95.1 113.7 Total Revenue 1 $ 3,000 $ 12,600 Hotel EBITDA 1 $ 600 $ 5,300 Hotel EBITDA Margin 19.4% 41.9% Capitalization Rate 4 4.2% 8.6% 16
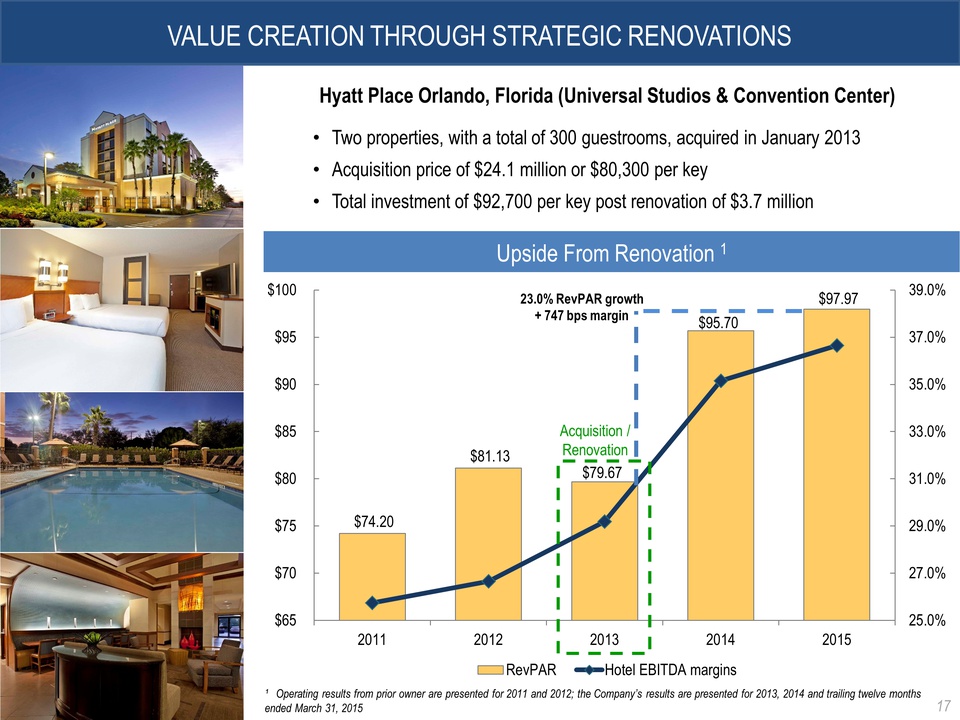
VALUE CREATION THROUGH STRATEGIC RENOVATIONS $74.20 $81.13 $79.67 $95.70 $97.97 25.0% 27.0% 29.0% 31.0% 33.0% 35.0% 37.0% 39.0% $65 $70 $75 $80 $85 $90 $95 $100 2011 2012 2013 2014 2015 RevPAR Hotel EBITDA margins 17 ¹ Operating results from prior owner are presented for 2011 and 2012; the Company’s results are presented for 2013, 2014 and trailing twelve months ended March 31, 2015 Acquisition / Renovation Hyatt Place Orlando, Florida (Universal Studios & Convention Center) • Two properties, with a total of 300 guestrooms, acquired in January 2013 • Acquisition price of $24.1 million or $80,300 per key • Total investment of $92,700 per key post renovation of $3.7 million 23.0% RevPAR growth + 747 bps margin 17
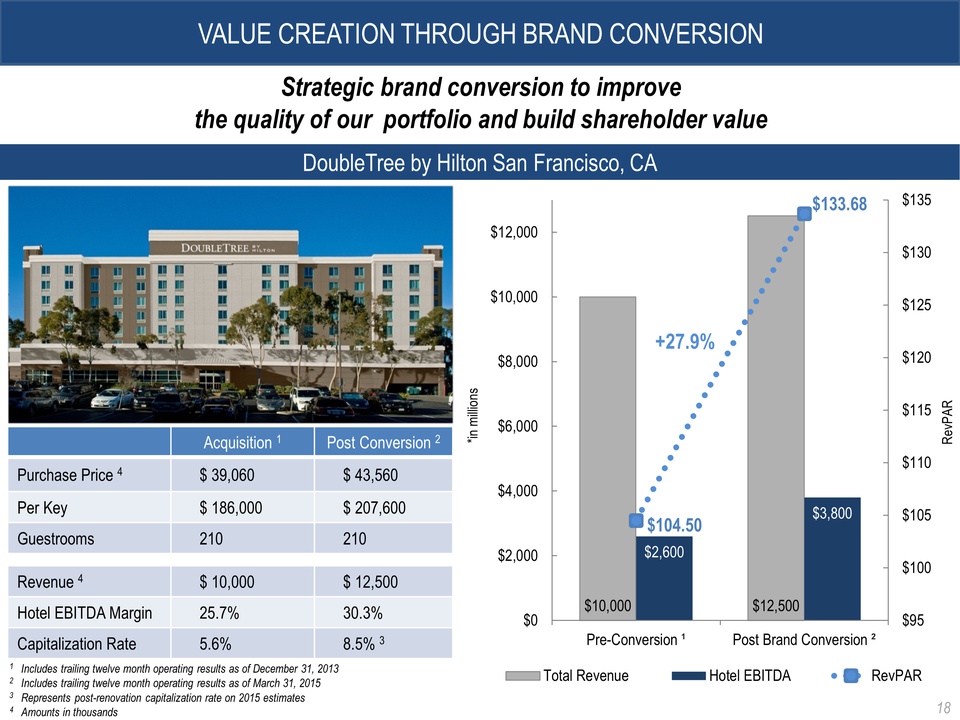
VALUE CREATION THROUGH BRAND CONVERSION Upside From Renovation 1 $10,000 $12,500 $2,600 $3,800 $104.50 $133.68 $95 $100 $105 $110 $115 $120 $125 $130 $135 $0 $2,000 $4,000 $6,000 $8,000 $10,000 $12,000 Pre-Conversion ¹ Post Brand Conversion ² RevPAR *in millions Total Revenue Hotel EBITDA RevPAR 18 DoubleTree by Hilton San Francisco, CA 1 Includes trailing twelve month operating results as of December 31, 2013 2 Includes trailing twelve month operating results as of March 31, 2015 3 Represents post-renovation capitalization rate on 2015 estimates 4 Amounts in thousands Acquisition 1 Post Conversion 2 Purchase Price 4 $ 39,060 $ 43,560 Per Key $ 186,000 $ 207,600 Guestrooms 210 210 Revenue 4 $ 10,000 $ 12,500 Hotel EBITDA Margin 25.7% 30.3% Capitalization Rate 5.6% 8.5% 3 Strategic brand conversion to improve the quality of our portfolio and build shareholder value +27.9% 18
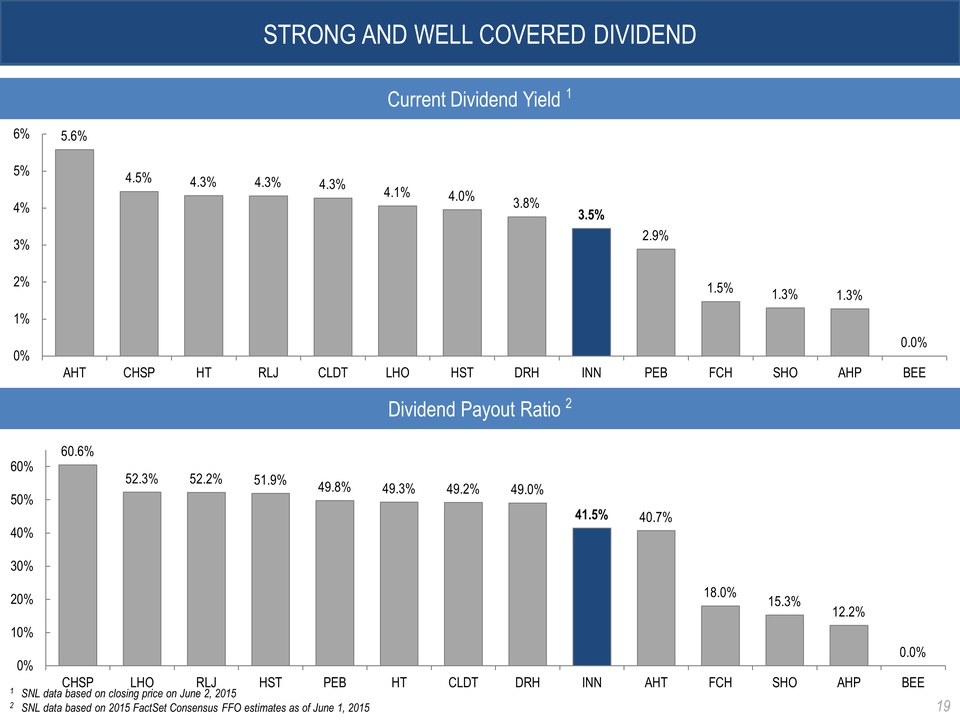
STRONG AND WELL COVERED DIVIDEND 1 SNL data based on closing price on June 2, 2015 2 SNL data based on 2015 FactSet Consensus FFO estimates as of June 1, 2015 Current Dividend Yield 1 Price per Key Valuation 3 5.6% Total Enterprise Value / 2015E EBITDA 1 4.5% 4.3% 4.3% 4.3% 4.1% 4.0% 3.8% 3.5% 2.9% 1.5% 1.3% 1.3% 0.0% 0% 1% 2% 3% 4% 5% 6% AHT CHSP HT RLJ CLDT LHO HST DRH INN PEB FCH SHO AHP BEE 60.6% 52.3% 52.2% 51.9% 49.8% 49.3% 49.2% 49.0% 41.5% 40.7% 18.0% 15.3% 12.2% 0.0% 0% 10% 20% 30% 40% 50% 60% CHSP LHO RLJ HST PEB HT CLDT DRH INN AHT FCH SHO AHP BEE 100% 100% 96% 92% 90% 78% 74% 61% 56% 55% 51% 50% 46% 40% 2% 0% 10% 20% 30% 40% 50% 60% 70% 80% 90% 100% AHP RLJ LHO HT AHT BEE SHO DRH FCH PEB RHP INN HST CHSPCLDT - - - $26 $10 - - - - - $3 $90 $8 - $94 $50 $12 - $109 - $19 - - $75 - - - - - - - $140 - $25 - $- $25 $50 $75 $100 $125 $150 $175 $200 19
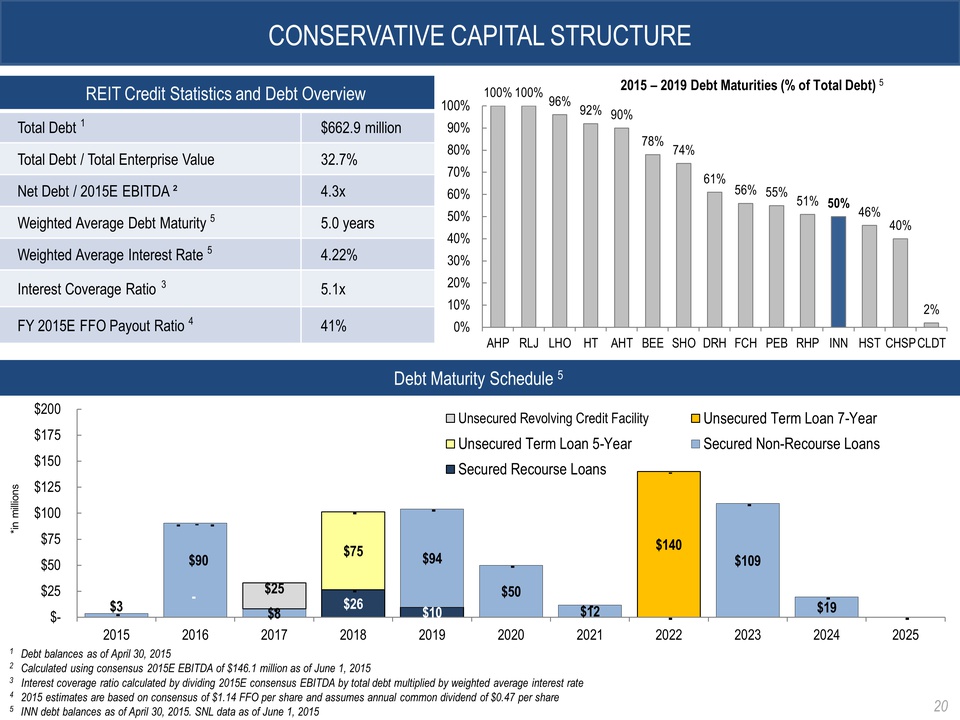
CONSERVATIVE CAPITAL STRUCTURE 2015 2016 2017 2018 2019 2020 2021 2022 2023 2024 2025 Unsecured Revolving Credit Facility Unsecured Term Loan 7-Year Unsecured Term Loan 5-Year Secured Non-Recourse Loans Secured Recourse Loans Debt Maturity Schedule 5 REIT Credit Statistics and Debt Overview Total Debt 1 $662.9 million Total Debt / Total Enterprise Value 32.7% Net Debt / 2015E EBITDA ² 4.3x Weighted Average Debt Maturity 5 5.0 years Weighted Average Interest Rate 5 4.22% Interest Coverage Ratio 3 5.1x FY 2015E FFO Payout Ratio 4 41% 1 Debt balances as of April 30, 2015 2 Calculated using consensus 2015E EBITDA of $146.1 million as of June 1, 2015 3 Interest coverage ratio calculated by dividing 2015E consensus EBITDA by total debt multiplied by weighted average interest rate 4 2015 estimates are based on consensus of $1.14 FFO per share and assumes annual common dividend of $0.47 per share 5 INN debt balances as of April 30, 2015. SNL data as of June 1, 2015 20 2015 – 2019 Debt Maturities (% of Total Debt) 5 *in millions 20

Summit Hotel Properties NYSE:INN