Attached files
| file | filename |
|---|---|
| EX-23.2 - EXHIBIT 23.2 - Patheon N.V. | s000936x1_ex23-2.htm |
| EX-99.2 - EXHIBIT 99.2 - Patheon N.V. | s000936x1_ex99-2.htm |
| EX-23.1 - EXHIBIT 23.1 - Patheon N.V. | s000936x1_ex23-1.htm |
| EX-99.5 - EXHIBIT 99.5 - Patheon N.V. | s000936x1_ex99-5.htm |
| EX-99.6 - EXHIBIT 99.6 - Patheon N.V. | s000936x1_ex99-6.htm |
| EX-99.3 - EXHIBIT 99.3 - Patheon N.V. | s000936x1_ex99-3.htm |
| EX-99.4 - EXHIBIT 99.4 - Patheon N.V. | s000936x1_ex99-4.htm |
| EX-99.1 - EXHIBIT 99.1 - Patheon N.V. | s000936x1_ex99-1.htm |
| EX-23.3 - EXHIBIT 23.3 - Patheon N.V. | s000936x1_ex23-3.htm |
As filed with the Securities and Exchange Commission on June 8, 2015
Registration No. 333-
UNITED STATES
SECURITIES AND EXCHANGE COMMISSION
Washington, D.C. 20549
FORM S-1
REGISTRATION STATEMENT
UNDER
THE SECURITIES ACT OF 1933
PATHEON HOLDINGS COÖPERATIEF U.A.*
(Exact Name of Registrant as Specified in Its Charter)
| The Netherlands | 2834 | 98-1153534 |
|
(State or Other Jurisdiction of Incorporation or Organization) |
(Primary Standard Industrial Classification Code Number) |
(I.R.S. Employer Identification Number) |
Herengracht 483
1017BT, Amsterdam
The Netherlands
+31 (0)20 622 3243
(Address, Including Zip Code, and Telephone Number, Including Area Code, of Registrant’s Principal Executive Offices)
Eric Sherbet
General Counsel and Secretary
111 Speen St, Suite 550
Framingham, Massachusetts 01701
(508) 620-2510
(Name, Address, Including Zip Code, and Telephone Number, Including Area Code, of Agent For Service)
Copies to:
|
Andrea Nicolas Skadden, Arps, Slate, Meagher & Flom LLP Four Times Square New York, New York 10036 (212) 735-3000 |
Deanna Kirkpatrick Davis, Polk & Wardwell LLP 450 Lexington Avenue New York, New York 10017 (212) 450-4000 |
Approximate date of commencement of proposed sale to the public: As soon as practicable after the effective date of this Registration Statement.
If any of the securities being registered on this form are to be offered on a delayed or continuous basis pursuant to Rule 415 under the Securities Act of 1933, check the following box. o
If this form is filed to register additional securities for an offering pursuant to Rule 462(b) under the Securities Act, check the following box and list the Securities Act registration statement number of the earlier effective registration statement for the same offering. o
If this form is a post-effective amendment filed pursuant to Rule 462© under the Securities Act, check the following box and list the Securities Act registration statement number of the earlier effective registration statement for the same offering. o
If this form is a post-effective amendment filed pursuant to Rule 462(d) under the Securities Act, check the following box and list the Securities Act registration statement number of the earlier effective registration statement for the same offering. o
Indicate by check mark whether the registrant is a large accelerated filer, an accelerated filer, a non-accelerated filer, or a smaller reporting company. See the definitions of “large accelerated filer,” “accelerated filer” and “smaller reporting company” in Rule 12b-2 of the Exchange Act.
| Large accelerated filer o | Accelerated filer o | |
| Non-accelerated filer ☒ | (Do not check if a smaller reporting company) | Smaller reporting company o |
CALCULATION OF REGISTRATION FEE
Title of Each Class of Securities to be Registered |
Proposed Maximum Aggregate Offering Price(1)(2) |
Amount of Registration Fee |
||||
| Common Stock, par value €0.01 per share | $ | 100,000,000 | $ | 11,620 | ||
| (1) | Estimated solely for the purpose of computing the amount of the registration fee pursuant to Rule 457(o) under the Securities Act. |
| (2) | Includes offering price of shares that the underwriters have the option to purchase. |
The Registrant hereby amends this Registration Statement on such date or dates as may be necessary to delay its effective date until the Registrant shall file a further amendment which specifically states that this Registration Statement shall thereafter become effective in accordance with Section 8(a) of the Securities Act of 1933 or until the Registration Statement shall become effective on such date as the Commission, acting pursuant to said Section 8(a), may determine.
* Prior to the closing of this offering, Patheon Holdings Coöperatief U.A. will undergo a corporate reorganization, as a part of which it will convert from a Dutch cooperative with excluded liability for its members (coöperatie met uitgesloten aansprakelijkheid) into a Dutch public limited company (naamloze vennootschap) and change its corporate name to Patheon N.V.
The information in this preliminary prospectus is not complete and may be changed. We may not sell these securities until the registration statement filed with the Securities and Exchange Commission is effective. This prospectus is not an offer to sell these securities and we are not soliciting offers to buy these securities in any jurisdiction where the offer or sale is not permitted.
Subject to completion, dated June 8, 2015
Preliminary Prospectus
Shares
![]()
Common Stock
This is an initial public offering of shares of common stock of Patheon N.V. Patheon N.V. is offering shares. The selling shareholders identified in this prospectus are offering shares. Patheon N.V. will not receive any of the proceeds from the sale of the shares being sold by the selling shareholders.
Prior to this offering, there has been no public market for our common stock. The estimated initial public offering price is between $ and $ per share.
We intend to apply to list our common stock on the under the symbol “PTHN.”
Per Share |
Total |
|||||
| Initial public offering price | $ | $ | ||||
| Underwriting discounts and commissions | $ | $ | ||||
| Proceeds to us, before expenses | $ | $ | ||||
| Proceeds to selling shareholders, before expenses | $ | $ | ||||
We and certain of the selling shareholders have granted the underwriters the right to purchase up to an additional shares of common stock at the initial public offering price less the underwriting discounts and commissions.
Investing in our common stock involves a high degree of risk. See “Risk factors” beginning on page 14 to read about factors you should consider before buying shares of our common stock.
Neither the Securities and Exchange Commission nor any state securities regulators has approved or disapproved these securities or disapproved of these securities or passed on the adequacy or accuracy of this prospectus. Any representation to the contrary is a criminal offense.
The underwriters expect to deliver the shares of common stock to purchasers on , 2015.
| J.P. Morgan | Morgan Stanley | Jefferies | UBS Investment Bank |
, 2015
TABLE OF CONTENTS
We were incorporated in The Netherlands on December 24, 2013, in the form of a Dutch cooperative with excluded liability for its members (coöperatie met uitgesloten aansprakelijkheid), by a partnership between JLL and DSM, (each as defined below) in connection with the acquisition of Patheon Inc., a Canadian company listed on the Toronto Stock Exchange, for approximately $1.4 billion in cash. In connection with the acquisition, which we refer to collectively with the related financing as the DPP Acquisition, DSM agreed to contribute its pharmaceutical business, or DPP, to us, JLL agreed to contribute, among other things, approximately $400 million in cash to us and certain employees of JLL and members of our management invested more than $90 million in us. Following the DPP Acquisition, which was consummated on March 11, 2014, Patheon Inc. and DPP became our wholly owned indirect subsidiaries.
Prior to the completion of this offering, Patheon Holdings Coöperatief U.A. will consummate a corporate conversion pursuant to which it will be converted from a Dutch cooperative with excluded liability for its members (coöperatie met uitgesloten aansprakelijkheid) into a Dutch public limited company (naamloze vennootschap) and its corporate name will be changed to Patheon N.V. Unless otherwise indicated or the context otherwise requires, all references in this prospectus to “Patheon,” the “Company,” “we,” “our,” “us” or similar terms refer to (i) prior to the DPP Acquisition Patheon Inc., and its subsidiaries, (ii) prior to the corporate conversion, Patheon Holdings Coöperatief U.A. and its subsidiaries and (iii) after the corporate conversion, Patheon N.V. and its subsidiaries. “DSM” refers to Koninklijke DSM N.V. and “JLL” refers to JLL Partners, Inc. and its affiliates.
All references in this prospectus to “$,” “US$,” “U.S. dollars,” “dollars” and “USD” mean U.S. dollars and all references to “€” and “euros,” means euros, unless otherwise noted.
We, the selling shareholders and the underwriters have not authorized anyone to provide any information or to make any representations other than those contained in this prospectus, any amendment or supplement to this prospectus or in any free writing prospectuses prepared by or on behalf of us or to which we have referred you. We, the selling shareholders and the underwriters take no responsibility for, and can provide no assurance as to the reliability of, any other information that others may give you. Neither the delivery of this prospectus nor the sale of our common stock means that information contained in this prospectus is correct after the date of this prospectus. This prospectus is an offer to sell only the shares offered hereby, but only under circumstances and in jurisdictions where it is lawful to do so.
i
Industry and market data
A portion of the market data and certain other statistical information used throughout this prospectus is based on independent industry publications, government publications or other published independent sources. Although we believe these third-party sources are reliable and that the information is accurate and complete, we have not independently verified the information. Certain data are also based on our good faith estimates and our management’s understanding of industry conditions. While we are not aware of any misstatements regarding our market, industry or similar data presented herein, such data involve risks and uncertainties and are subject to change based on various factors, including but not limited to those discussed under “Risk factors” and elsewhere in this prospectus.
Statements in this prospectus describing us as being a provider of pharmaceutical manufacturing services or pharmaceutical development services relate to us as being a provider of such services to the global pharmaceutical industry. Statements in this prospectus referring to the development and production of active pharmaceutical ingredients, or APIs, and final drug products refer to APIs developed and produced based on chemical and biotechnological means (mammalian and microbial technologies). In this prospectus, we define the market for pharmaceutical development services to include: (i) early development; (ii) pre-formulation, formulation and development of dosage forms; (iii) the manufacturing of development-stage products during the regulatory drug approval process, including the manufacturing of pilot batches; (iv) scale-up and technology transfer services designed to validate commercial-scale drug manufacturing processes; and (v) the development of analytical methods and delivery of analytical services. We do not include clinical packaging revenue in our definition of the pharmaceutical development services market. In this prospectus, “specialty pharmaceutical companies” refer to pharmaceutical companies that typically (i) operate in a particular niche segment; (ii) focus on in-licensing or acquiring development stage drugs rather than engaging in new drug discovery; and/or (iii) develop new delivery methods for existing compounds.
References to the top 100 developmental stage drugs are based on potential revenues for such products, as reported by Evaluate Pharma.
Financial statements
Our fiscal year ends on October 31 of each year. References to any fiscal year refer to the year ended October 31 of the calendar year specified. Our financial information contained in this prospectus includes (i) our consolidated financial statements as of October 31, 2014 and 2013 and for the three years ended October 31, 2014, which have been audited by Ernst & Young LLP, independent registered public accounting firm, as stated in their report included elsewhere in this prospectus; (ii) the consolidated financial statements of Gallus BioPharmaceuticals, LLC as of December 31, 2013 and for the year then ended, which have been audited by Ernst & Young LLP, as set forth in their report thereon, included elsewhere in this prospectus; and (iii) the financial statements of DSM Pharmaceutical Products Group, or DPP, which have been audited by Ernst & Young Accountants LLP, independent auditors, as set forth in their report thereon, included elsewhere in this prospectus.
Trademarks
Patheon®, Banner®, Banner Life Sciences®, Banner Pharmacaps® and other trademarks, trade names or service marks of the Company appearing in this prospectus, including Patheon Advantage®, are our property. DSM Pharmaceutical Products and other trademarks, trade names or service marks of DSM and its subsidiaries appearing in this prospectus are the property of DSM. Any trademarks, trade names or service marks of other companies appearing herein are, to our knowledge, the property of their respective owners. Solely for convenience, certain trademarks, service marks and trade names referred to in this prospectus are listed without the ® and ™ symbols, but such references are not intended to indicate in any way that we will not assert, to the fullest extent under applicable law, our rights to these trademarks, service marks and trade names.
ii
This summary highlights information contained elsewhere in this prospectus and does not contain all of the information that you should consider in making your investment decision. Before investing in our common stock, you should carefully read this entire prospectus, including our consolidated financial statements and the related notes thereto and the information set forth under the sections “Risk factors,” “Management’s discussion and analysis of financial condition and results of operations” and the historical financial statements and related notes, in each case included in this prospectus. Some of the statements in this prospectus constitute forward-looking statements. See “Cautionary note regarding forward-looking statements.”
Our company
Patheon is a leading global provider of outsourced pharmaceutical development and manufacturing, or CDMO, services. We provide a comprehensive, integrated and highly customizable range of active pharmaceutical ingredient, or API, and finished drug product services to our customers, from formulation development to clinical and commercial-scale manufacturing, packaging, and lifecycle management. Our services address both small molecule and large molecule biological drugs. We are the only end-to-end integrated provider of such services, which, combined with our scientific and regulatory expertise and specialized capabilities, allows our customers to partner with a single outsourced provider to address their most complex development and manufacturing needs. We believe we have the broadest technological capabilities in our industry, across the full spectrum of development and manufacturing, to support our end-to-end integrated platform.
We believe we are a critical partner for our customers who increasingly rely on our customized formulation, development and manufacturing expertise to address growing drug complexity, cost pressures and regulatory scrutiny. We partner with many of our customers early in the drug development process, providing us the opportunity to continue to expand our relationship as molecules progress through the clinical phase and into commercial manufacturing. This results in long-term relationships with our customers and a recurring revenue stream. We believe our breadth of services, reliability and scale addresses our customers’ increasing need to outsource and desire to reduce the number of supply chain partners while maintaining a high quality of service.
Through our end-to-end integrated service offering, known as “Patheon OneSource”, we provide our customers with comprehensive solutions for both small molecule and large molecule biological pharmaceuticals across our three main segments, including development and manufacturing services for API (Drug Substance Services, or DSS), formulation development and pre-clinical and clinical drug product manufacturing (Pharmaceutical Development Services, or PDS), and commercial drug product manufacturing and packaging (Drug Product Services, or DPS).
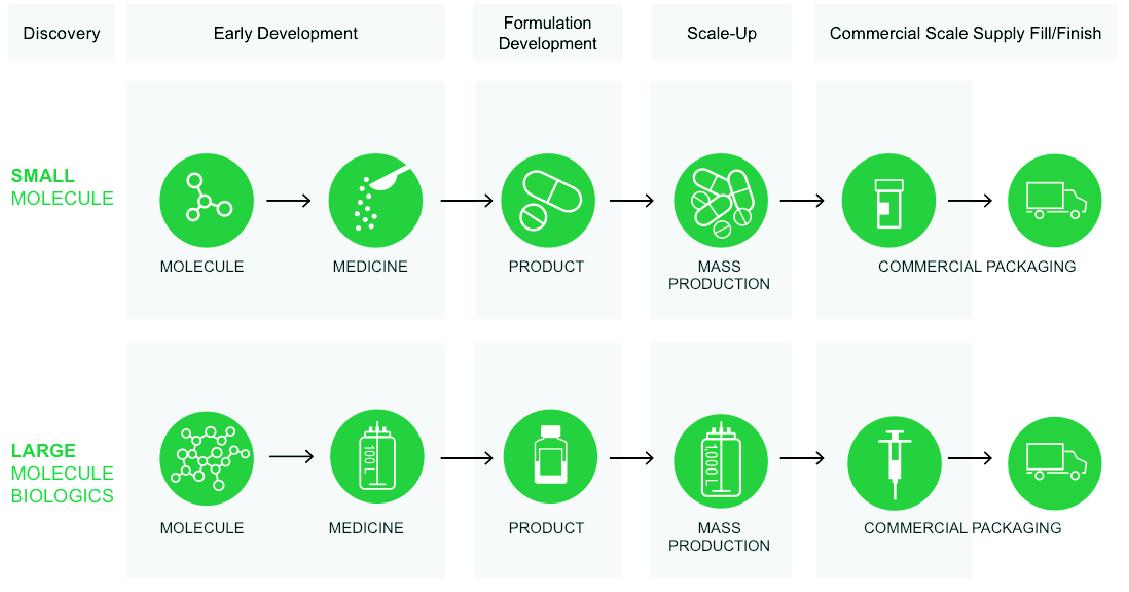
Our end-to-end integrated service offering allows us to provide a comprehensive suite of capabilities across different drug formulations to address our customers’ needs. Our specialized capabilities address 75% of all pharmaceutical dosage forms, with expertise and specialized capacity in high potency, controlled substances, low-solubility, sterile, modified release and softgel
1
technologies. We are the number one global provider of PDS with capabilities spanning the full breadth of advanced scientific services from discovery to regulatory approval, including formulation development across approximately 40 dosage forms, analytical services, and lifecycle management. In DPS, we believe we are among the largest providers of aseptic “fill-finish” services for finished dose biological drug products, and a leader in the highly complex development and manufacturing of biological drug substance through our four biological API facilities.
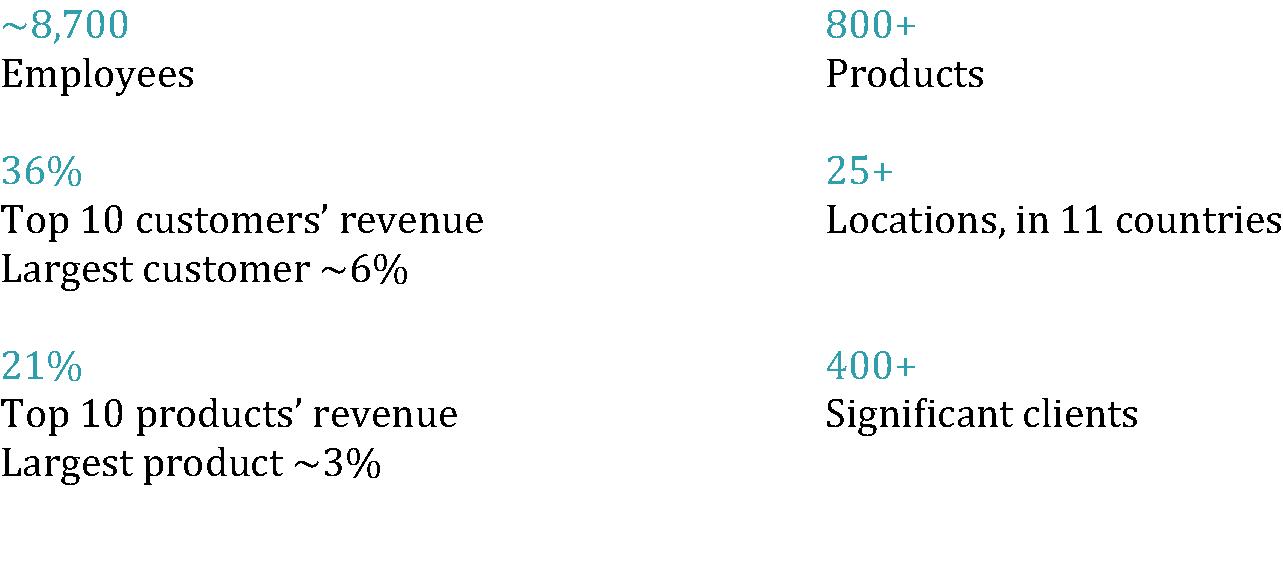
We provide development and manufacturing services for more than 800 products and molecules, and produce 24 billion solid doses and 150 million sterile doses annually, many of which address central nervous system, oncological and other life-threatening conditions. We believe we are the clear partner of choice for the pharmaceutical industry. Over the last decade, we have developed and manufactured 86 newly approved drugs, including 11 in 2014, which is more than twice the number of any other CDMO service provider. This represents 41% of the total outsourced approvals during this period. We serve a highly diverse, blue chip customer base comprised of more than 400 significant customers in over 60 countries, including all of the top 20 largest pharmaceutical companies, seven of the 10 largest biotechnology companies and seven of the world’s 10 largest specialty pharmaceutical companies.
We employ approximately 8,700 people, including 634 scientists, at more than 25 locations in the U.S., Canada, Europe, Australia, Japan and China. For the year ended October 31, 2014, our reported revenues were $1.7 billion.
The evolution of Patheon
In early 2011, James C. Mullen, who was previously the Chief Executive Officer of Biogen Idec Inc., one of the world’s largest biotech companies, joined Patheon as Chief Executive Officer, and assembled a leadership team that brought extensive pharmaceutical and healthcare sector experience, as well as a customer perspective to our business. Over the last four years, we have transformed our business into a global, end-to-end integrated service provider, and significantly enhanced our operating performance and growth potential. We made substantial investments in a broad range of technologies that provide our customers advanced development services, and operations systems that enable us to execute customer projects on-time and on-budget, while maintaining excellence in quality. As a result, we have positioned our business to meet the rapidly evolving development and manufacturing needs of our customers while continuing to deliver strong financial performance.
These strategic investments and operational changes implemented since 2011 have significantly improved our financial performance and provide the foundation for our future growth. These changes include:
| • | Implementing operational excellence initiatives throughout the company. Since 2011, we have implemented a series of continuous improvement projects as part of our company-wide operational excellence program, or OE Program, to enhance our manufacturing and operational processes. The program relies on several key levers, including Lean and Six Sigma principles, visual management tools and performance boards to monitor key indicators, and employee engagement and empowerment. Examples of actions that we have taken as a part of our OE Program include enhancing our labor productivity, improving our manufacturing yield through streamlining floor operations, consolidating procurement activities, and rationalizing facilities. Our OE Program is deeply ingrained in our corporate culture and significantly reduces production costs, improves productivity of our operating assets and employees, and drives an industry-leading customer experience. We rely on our OE Program to drive key customer metrics, such as right-first-time, or RFT, and on-time-delivery, or OTD, which improve efficiency, reduce costs, enhance execution of client projects, and support growth by increasing manufacturing capacity and throughput. Our organization-wide focus on RFT and OTD, coupled with our technical capabilities and regulatory and scientific expertise, provides substantial value to our |
2
customers, allowing them to bring better products to market faster while reducing their manufacturing costs. This, in turn, drives our customer retention, new business wins and higher profitability. We apply our OE Program to our entire existing manufacturing network, as well as to businesses that we acquire.
| • | Establishing a global end-to-end integrated platform by investing $1.4 billion in five M&A transactions to expand the range of development and manufacturing services offered to our customers. Since 2012, we have acquired and integrated five companies: Banner Pharmacaps, DSM Pharmaceutical Products, Gallus BioPharmaceuticals, Agere Pharmaceuticals and IRIX Pharmaceuticals. Through our acquisitions, we have added attractive and differentiated capabilities and technologies for developing and manufacturing a broad array of complex small molecules and large molecule biologics, including capabilities in softgel, development and commercial scale biological and small molecule API, North American sterile capacity, and low-solubility dispersion technology. We have developed a system for integrating acquisitions based on our operational excellence capabilities that ensures seamless transition into Patheon and rapid realization of operating efficiencies, which translate into revenue and cost synergies. We believe our expertise in integrating acquisitions positions Patheon to lead the consolidation of the fragmented CDMO industry and add capabilities to further strengthen our value proposition to our customers. |
| • | Enhancing our sales and marketing strategy and management team to facilitate strategic, solutions-based relationships with customers across multiple molecules and spanning a drug’s entire life cycle. Our global sales force is deeply embedded with our current customers and brings to bear the full resources and expertise of the Patheon organization to expand existing customer relationships and generate sales with new customers. We engage our senior management in the sales and marketing process to build strategic relationships and to enhance our customers’ experience. As a result of these efforts and our expanded capabilities, the number and value of our new business proposals have grown, our win rates and retention rates have increased significantly, and we continuously generate new business. |
These changes have transformed Patheon into a global business with a diversified revenue and customer base, and strong revenue and margin growth. From fiscal 2011 to fiscal 2014, our revenues have grown from $698 million to $1,705 million, and from fiscal 2011 to the quarter ended January 31, 2015, our gross margin expanded by 9%. In addition, we have diversified our customer base, with our top 10 customers accounting for 36% of revenues in the quarter ended January 31, 2015 versus 54% in fiscal 2011.
3
The chart below highlights key information about our business.
Our industry and customer trends
The global pharmaceutical industry is a large, growing market. We serve all key sectors of the industry across both small molecules and large molecule biologics, through solid dose forms, sterile products and other complex products such as controlled substances. Revenue for the pharmaceutical industry was $742 billion in 2014 and is expected to grow to $1 trillion in 2020, representing a compounded annual growth rate of 5.1%. This growth is driven by global, secular trends, including increasing demand for pharmaceuticals because of expanded insurance coverage in key markets, an aging population and increased life expectancy rates, a growing middle class in emerging markets and growth in specialty pharmaceuticals. We believe these factors will continue to drive unit growth and complexity, benefiting CDMOs such as Patheon.
The outsourcing of API and drug product development and manufacturing by the pharmaceutical and biotechnology industries is an important driver of growth in our business. In 2014, the pharmaceutical industry spent approximately $140 billion on formulation, development and manufacturing, according to Evaluate Pharma, and approximately $40 billion is expected to be outsourced to CDMOs such as Patheon in 2015, according to Root Analysis. Currently, only 25% to 30% of pharmaceutical industry spending on formulation, development and manufacturing is outsourced, and in the future it is expected that our customer base will expand the use of outsourcing to CDMOs because of changing industry dynamics, driving growth in our market. Industry sources indicate that the CDMO industry’s annual growth rate is expected to be higher than the growth rate in the overall pharmaceutical industry, with overall CDMO growth in the mid- to high single digits, and higher for finished dosage formulation services, specialized technologies such as solubility solutions, and pharmaceuticals requiring sterile production such as biological drugs, capabilities in which Patheon has extensive experience.
The key industry dynamics underlying CDMO industry growth include:
| • | Growing pricing and competitive pressures are forcing pharmaceutical and biotechnology companies to reduce fixed costs, reduce time to market for their new drugs, simplify historically complex supply chains and streamline vendor management, while ensuring reliability and quality. |
| • | Complex formulation challenges presented by many new products require expertise that is costly or impractical for pharmaceutical and biotechnology companies to build and operate in-house. For example, 60% to 90% of all new compounds entering development will need specialized manufacturing and/or molecular profile modification according to industry research in the American Pharmaceutical Review. |
| • | Growth in the number of drugs developed by emerging and mid-sized companies, which currently represents an estimated 80% of the drug pipeline. In 2014, approximately $40 billion of capital was raised to fund the development of drug pipelines of emerging biotechnology companies. For many of these companies, outsourcing to CDMOs such as Patheon is a critical component of their business model because they lack in-house formulation capabilities as well as the experience and infrastructure to manufacture the products themselves. |
4
| • | Increasing regulatory complexity and focus on compliance. The industry is highly regulated with oversight by the U.S. Food and Drug Administration, or FDA, and its counterparts globally. We believe this represents an opportunity for qualified and global CDMOs to expand market share as companies are looking for a partner such as Patheon with a track record of quality excellence and deep regulatory capabilities, in order to avoid the consequences of manufacturing and quality issues and regulator-ordered shutdowns, such as drug shortages and lost revenue and earnings. |
We serve the entire spectrum of customers, including large, mid-size and specialty pharmaceutical and biotechnology companies, emerging biotechnology companies, and generic pharmaceutical companies, as well as customers in other related areas, such as consumer or over-the-counter, nutritional and animal health companies, each with a distinct outsourcing dynamic:
| • | Large pharmaceutical and biotechnology companies are actively shrinking their fixed asset base and focusing on their core activities of research and development, or R&D, and sales and marketing. These companies are increasingly recognizing that development and manufacturing are a non-core activity and deciding to outsource instead of investing substantial capital in building specialized capabilities in-house to address their increasingly complex pipeline. |
| • | Mid-size or specialty pharmaceutical and biotechnology companies are increasingly focused on sales, marketing, and late stage clinical development, as opposed to manufacturing and R&D, and as a result have limited internal capacity and capabilities and are outsourcing significant portions of their value chain. |
| • | Emerging pharmaceutical and biotechnology companies are being driven by venture and other investors to adopt virtual models that rely heavily on outsourcing through clinical proof-of-concept, and licensing to or acquisition by larger companies for late stage clinical development and commercialization. Due to the significant cost and time involved in switching service providers, companies such as Patheon with end-to-end integrated offerings are well-positioned to retain a molecule whether or not it is licensed or sold. |
| • | Generic pharmaceutical companies increasingly seek to outsource development and manufacturing of complex products they cannot produce with their existing infrastructure to third parties with such specialized capabilities given the importance of speed-to-market for these companies (for example, 180-day marketing exclusivity period for generic companies that are “first-to-file” under a patent challenge). |
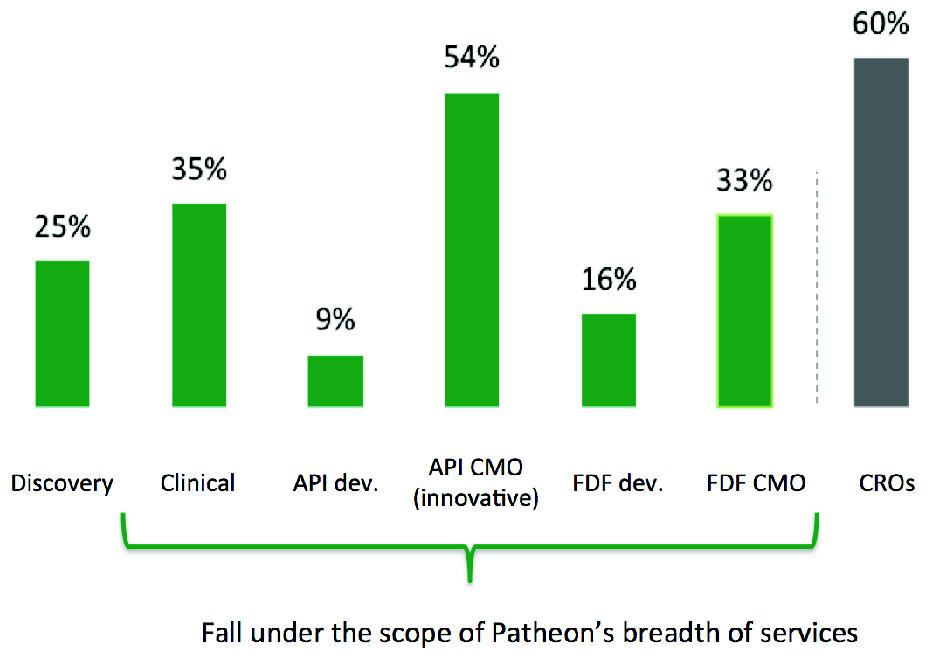
Relative to the outsourcing rate for the contract research organization, or CRO, industry, the CDMO industry is underpenetrated in most of its sub-segments, creating significant growth opportunities for a CDMO with an end-to-end integrated offering such as Patheon due to a growing propensity by biopharmaceutical companies to outsource. We believe our sector will follow a similar trajectory to the CRO industry.
Current outsourcing penetration
5
In addition, the CDMO industry is highly fragmented, with more than 600 companies worldwide, many of which specialize in a single capability or are too small to achieve economies of scale and benefit from customer or product diversification. As a result of growing customer demand for scale providers with a broader range of services throughout the drug lifecycle, we believe there will be opportunities for a company such as Patheon to consolidate the industry through strategic acquisitions and to take market share from sub-scale competitors.
Our competitive strengths
We believe the following competitive strengths provide the foundation for our position as the leading provider of CDMO services:
| • | Sector-leading performance driven by continuous operational excellence improvement. Over the last four years we have implemented a major initiative to drive operational efficiencies across our global network of facilities and rapidly and effectively integrate acquisitions. These improvements, which are deeply embedded in our operations and culture, are aimed at aligning our operations and incentives around the key customer metrics of RFT and OTD. As a result, our on-time performance for delivering customer projects increased from 86% in 2011 to 93% in 2014, to which our customers ascribe significant value. In addition, through efficiency gains we have increased capacity by 21% over this period without significant capital investments and generated substantial cost savings from improvements to both existing operations and acquired businesses. We believe these continuous efforts will continue to unlock capacity, reduce costs and help drive margin improvements annually. |
| • | End-to-end integrated capabilities. We provide a comprehensive, integrated and highly customizable range of API and finished drug product services to customers, from formulation development to clinical and commercial-scale manufacturing, packaging, and lifecycle management. Our services address both small molecule and large molecule biological drugs. We believe we are further differentiated by the wide range of formulation and manufacturing services we provide to our customers, which encompass 75% of the all pharmaceutical dosage forms, and by providing specialized capabilities our customers are increasingly seeking such as high potency, controlled substances, low-solubility, aseptic manufacturing, modified release and softgel formulations. Our breadth of technologies spanning development and manufacturing further support our end-to-end integrated platform, increasing product development speed and reducing costs for our customers by avoiding the time, regulatory burden and cost required to transfer a molecule to other service providers. |
| • | Extensive and long-term relationships with our customers from development through commercial manufacturing drives a recurring, highly-visible revenue stream. Our end-to-end integrated platform allows us to capture customer molecules early in the development process and retain them through full-scale commercial manufacturing, while efficiently and reliably maintaining quality in a complex supply chain. Over the last three years, 33% of our commercial manufacturing new product launches originated from our formulation and development projects. Since 2013, of the 27 PDS projects that received regulatory approval, 74% remained with Patheon for commercial manufacturing. Our drug product commercial manufacturing contracts generally extend five or more years and at least 90% of the products we currently manufacture are under contract through 2017. |
| • | Industry-leading reputation for quality and reliability across our global network. We are an industry leader in product quality and regulatory compliance. We have a culture of continuous improvement in quality, with internal standards and targets that exceed regulatory rules and customers’ internal standards. As a result, we believe we have one of the best track records in the industry for both pharmaceutical companies and outsourced providers. The increased regulatory scrutiny has resulted in industry supply disruptions or facility shutdowns, contributing to the recent record levels of drug shortages, including for numerous life-saving drugs. As regulatory requirements have become more stringent, many pharmaceutical companies have migrated to CDMO providers with a demonstrated ability to consistently meet quality and compliance standards. Patheon complements its industry-leading quality systems with a global network, |
6
which allows us to validate our customers’ products across multiple lines within a facility and across multiple facilities within our network to ensure supply security. In addition, our focus on RFT and OTD metrics underpin our industry-leading position for customer service.
| • | Proven management team. Our management team is highly experienced, possesses deep industry knowledge and is operationally focused. The senior team, including our Chief Executive Officer, James C. Mullen, has incorporated the customer perspective from extensive careers in the pharmaceutical industry. Under Mr. Mullen’s leadership, we have repositioned our business by executing on our operational excellence initiatives and undertaking five acquisitions to establish Patheon as the only end-to-end integrated provider of CDMO services. |
Our growth strategy
Our strategy is to grow top-line revenues organically, increase margins through operational efficiency initiatives and operating leverage from incremental revenue, and acquire and integrate companies that complement our existing platform. The key elements of our growth strategy are:
| • | Leverage our end-to-end platform and global scale to extend our position as the leading integrated CDMO. The highly customizable services we provide throughout the product life cycle afford us significant opportunities to respond to growing customer demand for supply chain simplicity, development and manufacturing speed, and quality. Our PDS capabilities allow us to partner with our customers early in the development process of their molecules, providing a pipeline of molecules for our commercial manufacturing services as the molecules progress through the clinical phase and into commercial manufacture. In fiscal 2014, we had PDS projects for 618 drugs in clinical development, including 235 Phase 1 projects, 110 Phase 2 projects and 203 Phase 3 projects. During our evolution over the past four years, we have aligned our sales, marketing and management functions, on all organizational levels, to cross-sell the breadth of our capabilities and market the “Patheon OneSource” service offering. We believe this strategy will continue to drive business across all customer segments, and represents a high-dollar value, high-margin growth opportunity. |
| • | Continue operational excellence initiatives to optimize capacity and efficiency, reduce costs and drive outstanding financial performance. Our organization-wide operational excellence efforts focus on improving manufacturing efficiency and quality, driving cost savings, increasing capacity and creating value throughout the manufacturing chain. We intend to continue maximizing revenue growth and margin expansion through our resulting expanded capacity and facility utilization. For example, we have increased capacity by 21% since 2011, and our current utilization of 49% allows us to continue to launch new projects without significant investment in new facilities. We believe that this continuous focus on operational excellence will drive margin improvements and support robust revenue growth on an annual basis, which should result in significant operating leverage. |
| • | Target high-growth, high-value areas of the pharmaceutical and biotechnology industries. Our customers increasingly seek complex drug formulations and delivery technologies that exceed their own in-house capabilities. We intend to use our broad range of specialized dosage and formulation solutions, which include high potency, softgel, controlled substance, modified release and sterile dosage forms, to serve this market segment. For example, our acquisition of Gallus Biopharmaceuticals provided us with capabilities for complex clinical and commercial scale biologics manufacturing in the key U.S. market. We believe our expertise in these areas and the breadth of services we provide are differentiators for Patheon. |
| • | Selectively pursue strategic investments and acquisitions to support expanding customer needs and complement our existing platform. As a customer-driven company we have invested in new specialized technologies, expanded capacity in high-demand capabilities, and broadened our capabilities in high value-added product and service offerings in response to market demand. For example, in response to growing demand for pre-filled syringes to deliver biological molecules, we completed construction of a new production line in a European sterile facility in late 2013. In addition, we have acquired five companies since 2012, including three acquisitions between |
7
September 2014 and March 2015, each of which provided new or expanded capabilities and scale for our end-to-end integrated offering. We plan to continue adding complementary, high-value technological and operational capabilities and service offerings to meet customer needs through investment, acquisitions and collaborations. We expect Patheon will continue to be an active, disciplined consolidator of the fragmented CDMO industry to complement our organic growth strategy.
Formation of our Company
We were incorporated in The Netherlands on December 24, 2013, in the form of a Dutch cooperative with excluded liability for its members (coöperatie met uitgesloten aansprakelijkheid), by a partnership between JLL and DSM in connection with the acquisition of Patheon Inc., a Canadian company listed on the Toronto Stock Exchange, for approximately $1.4 billion in cash. In connection with the acquisition, which we refer to collectively with the related financing as the DPP Acquisition, DSM agreed to contribute its pharmaceutical business, or DPP, to us, JLL agreed to contribute, among other things, approximately $400 million in cash to us and certain employees of JLL and members of our management invested more than $90 million in our Company. Following the DPP Acquisition, which was consummated on March 11, 2014, Patheon Inc. and DPP became our wholly owned indirect subsidiaries. From an accounting standpoint, Patheon Inc. was the acquirer and as such all financial information prior to March 11, 2014 is related to Patheon Inc.
In connection with this offering, we will convert from a Dutch cooperative with excluded liability for its members into a Dutch public limited company and will change our name from Patheon Holdings Coöperatief U.A. to Patheon N.V.
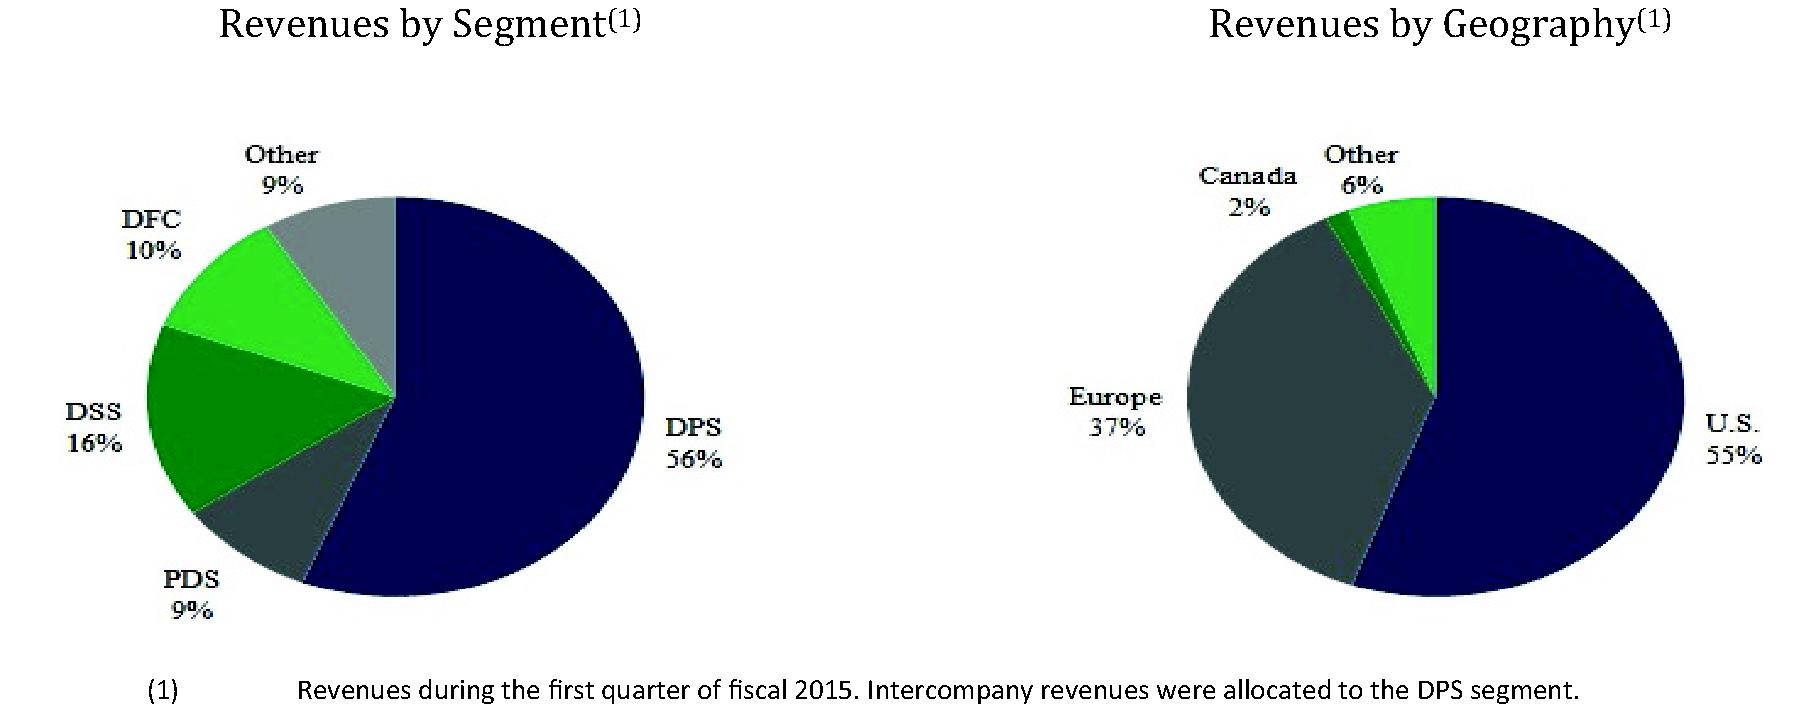
We currently operate in four reportable business segments:
| • | Drug Product Services, or DPS, which provides manufacturing and packaging for approved prescription, OTC, and nutritional products and accounted for 60% of our total revenues in fiscal 2014. |
| • | Pharmaceutical Development Services, or PDS, which provides a wide spectrum of advanced formulation, production and technical services from the early stages of a product’s development to regulatory approval and beyond, as well as for new formulations of approved products for lifecycle extension and accounted for 10% of our total revenues in fiscal 2014. |
| • | Drug Substance Services, or DSS, which provides development and manufacturing for the biologically active component of a pharmaceutical product from early development through commercial production and accounted for 11% of our total revenues in fiscal 2014. |
| • | DPx Fine Chemicals, or DFC, which provides synthesis services to customers in the agricultural chemical industry and maleic anhydride and many specialty esters used in a broad range of industries and specialty products. Our DFC segment generated revenues of $167.8 million and accounted for 10% of our total revenues in fiscal 2014. |
Our principal executive offices are located at Herengracht 483, 1017BT, Amsterdam, The Netherlands, and our phone number is +31 (0)20 622 3243. Our website is www.patheon.com. Information contained in or accessible through our website does not constitute a part of this prospectus.
Our principal shareholders
JLL Partners
JLL is a leading middle-market private equity firm with a 27-year track-record of adding value to complex investments through financial and operational expertise. Since its founding in 1988, JLL Partners has invested approximately $4.5 billion across seven funds and has completed 39 platform investments as well as more than 50 add-on acquisitions. The firm is comprised of 22 investment professionals. Since inception, JLL has remained an active healthcare investor, with deep experience in the outsourced pharmaceutical services industry. Examples of investments in this sector include PharmNet (CRO) and BioClinica (outsourced clinical trial management services).
8
Koninklijke DSM N.V.
DSM is a global science-based company active in health, nutrition and performance materials organized in The Netherlands. Ordinary shares of DSM are listed with and traded on the Euronext Amsterdam.
Risk factors
Investing in our common stock involves risks. You should carefully consider the risks described in “Risk factors” beginning on page 14 before making a decision to invest in our common stock. If any of these risks actually occurs, our business, financial condition or results of operations could be materially adversely affected. In such case, the trading price of our common stock would likely decline, and you may lose all or part of your investment. The following is a summary of some of the principal risks we face.
| • | We are dependent on our customers’ spending on and demand for our manufacturing and development services. |
| • | The consumers of the products we manufacture for our customers may significantly influence our business, results of operations and financial condition. |
| • | Our services and offerings are highly complex, and if we are unable to provide quality and timely offerings to our customers, our business could suffer. |
| • | Our pharmaceutical development services projects are typically for a shorter term than our pharmaceutical manufacturing projects, and any failure by us to maintain a high volume of pharmaceutical development services projects, including due to lower than expected success rates of the products for which we provide services, could have a material adverse effect on our business. |
| • | Because a significant portion of our revenues comes from a limited number of customers, any decrease in sales to these customers could have a material adverse effect on our business, results of operations and financial condition. For the year ended October 31, 2014, our top 10 customers and products accounted for 39% and 24%, respectively, of our revenues. No customer accounted for more than 7% of our revenue for the year ended October 31, 2014. |
| • | We rely on our customers to supply many of the necessary ingredients for our products, and for other ingredients we rely on other third parties. Our inability to obtain the necessary materials or ingredients for the products we manufacture on behalf of our customers could have a material adverse effect on our business. |
| • | We are dependent on key management. |
| • | Our failure to comply with existing and future regulatory requirements, which include the operating and security standards of the U.S. Drug Enforcement Agency, or the DEA, the FDA and other comparable agencies, could adversely affect our results of operations and financial condition. |
| • | We are subject to environmental, health, safety and other laws and regulations, which could subject us to liabilities, increase our costs or restrict our operations in the future. |
| • | We and our customers depend on trademarks, patents, trade secrets, copyrights and other forms of intellectual property protections, but these protections may not be adequate. |
| • | Upon the listing of our shares the , we will be a “controlled company” within the meaning of the rules of and, as a result, will qualify for, and intend to rely on, exemptions from certain corporate governance requirements. You will not have the same protections afforded to shareholders of companies that are subject to such requirements. |
| • | We have identified a material weakness in our internal control over financial reporting, and if we are unable to achieve and maintain effective internal control over financial reporting, this could have a material adverse effect on our business. |
9
The offering
We will not receive any proceeds from the sale of shares of common stock by the selling shareholders.
We intend to use approximately $ million of the net proceeds we receive from this offering to repay all or a portion of our $550 million aggregate principal amount of 8.75%/9.50% Senior Notes due May 1, 2020 that were privately offered by our subsidiary in a transaction consummated in May 2015, or the Senior PIK Toggle Notes, and pay related fees and expenses.
See “Use of proceeds.”
The number of shares of our common stock to be outstanding after this offering is based on shares of our common stock outstanding as of , 2015. This number excludes shares of common stock reserved for issuance under our omnibus equity incentive plan as of , 2015.
10
Unless otherwise indicated, the information in this prospectus assumes the following:
| • | the effectiveness of our amended and restated articles of association, the form of which will be filed as an exhibit to the registration statement of which this prospectus forms a part; |
| • | an initial public offering price of $ per share of common stock, which is the mid-point of the estimated initial public offering price range set forth on the cover page of this prospectus; and |
| • | no exercise by the underwriters of their option to purchase additional shares. |
11
Summary historical and pro forma financial data
The following tables present our summary consolidated historical and pro forma financial data as of the dates and for the periods presented. Our consolidated statement of operations data and balance sheet data as of and for the year ended October 31, 2014, have been derived from our audited consolidated financial statements included elsewhere in this prospectus. The consolidated historical financial data as of and for the three months ended January 31, 2015 are derived from our unaudited interim consolidated financial statements included elsewhere in this prospectus. We have prepared our interim consolidated financial statements on the same basis as our audited consolidated financial statements and, in our opinion, have included all adjustments, which include only normal recurring adjustments, necessary to present fairly in all material respects our financial position and results of operations. The results for any interim period are not necessarily indicative of the results that may be expected for the full year. Additionally, our historical results are not necessarily indicative of the results expected for any future period.
The unaudited pro forma financial data presented below have been derived by the application of pro forma adjustments to the consolidated historical financial statements included elsewhere in this prospectus. See “Unaudited pro forma consolidated financial information.” The unaudited summary pro forma financial data are presented for illustrative purposes only and are not necessarily indicative of the operating results or financial position that would have occurred if the relevant transactions had been consummated on the date indicated, nor are such data indicative of future operating results.
You should read this information together with the information included under the headings “Risk factors,” “Capitalization,” “Unaudited pro forma consolidated financial information,” “Selected consolidated financial data,” “Management’s discussion and analysis of financial condition and results of operations” and the historical financial statements and related notes included elsewhere in this prospectus.
12
Pro Forma(1) |
Historical |
Pro Forma(1) |
Historical |
|||||||||
Three Months ended January 31, |
Year ended October 31, |
|||||||||||
| (in millions of dollars) | 2015 | 2015 | 2014 | 2014 | ||||||||
| Statement of operations data: |
||||||||||||
| Revenues | $ | 472.6 | $ | 488.8 | $ | 1,976.8 | $ | 1,704.8 | ||||
| Cost of goods sold | 349.6 | 352.4 | 1,575.2 | 1,281.2 | ||||||||
| Gross profit | 123.0 | 136.4 | 401.6 | 423.6 | ||||||||
| Selling, general and administrative expenses | 71.9 | 77.2 | 272.3 | 261.5 | ||||||||
| Research and development | 1.4 | 3.9 | 4.8 | 15.1 | ||||||||
| Repositioning expenses(3) | 16.8 | 17.8 | 54.9 | 53.5 | ||||||||
| Acquisition and integration costs(4) | 1.4 | 6.1 | 0.6 | 60.4 | ||||||||
| Impairment charge(5) | — | — | 202.6 | 22.1 | ||||||||
| Gain on sale of capital assets | (0.1 | ) |
(0.1 | ) |
(0.1 | ) |
(0.1 | ) |
||||
| Operating income (loss) | 31.6 | 31.5 | (133.5 | ) |
11.1 | |||||||
| Interest expense, net | 40.5 | 28.0 | 167.6 | 90.4 | ||||||||
| Foreign exchange loss, net | 4.1 | 3.9 | 8.4 | 8.7 | ||||||||
| Refinancing expenses(6) | — | — | — | 28.2 | ||||||||
| Other expenses, net | (0.1 | ) |
(0.1 | ) |
(1.9 | ) |
(1.1 | ) |
||||
| Loss before income taxes | (12.9 | ) |
(0.3 | ) |
(307.6 | ) |
(115.1 | ) |
||||
| Provision for income taxes |
6.0 | 5.8 | 7.3 | 4.1 | ||||||||
| Net loss | $ | (18.9 | ) |
$ | (6.1 | ) |
$ | (314.9 | ) |
$ | (119.2 | ) |
Historical |
Pro Forma As Adjusted(2) |
|||||
| (in millions of dollars) | January 31, 2015 | January 31, 2015 | ||||
| Balance sheet data: |
||||||
| Cash and cash equivalents | $ | 67.0 | $ | |||
| Total assets | 2,246.3 | |||||
| Total debt | 1,954.6 | |||||
| Total liabilities | 2,674.6 | |||||
| Total members’ deficit | (428.3 | ) |
||||
(1) Represents statement of operations data on a pro forma basis to reflect the transactions described in “Unaudited pro forma consolidated financial information.”
(2) Represents balance sheet data on a pro forma as adjusted basis to give effect to (i) the transactions described in “Unaudited pro forma consolidated financial information”; (ii) the Second Additional Term Loan Facilities, which are comprised of a $20.0 million U.S. dollar-denominated term loan and a €155.0 million euro-denominated term loan, and were used to finance the IRIX Acquisition and for working capital and general corporate purposes; and (iii) the issuance and sale of common stock in this offering at an assumed initial public offering price of $ per share (the mid-point of the range on the cover of this prospectus) and the use of the proceeds therefrom received by us as described in “Use of proceeds,” after deducting underwriting discounts and commissions and estimated offering expenses payable by us.
(3) Repositioning expenses, which include employee severance and contract cancellation costs, were incurred in connection with the DPP Acquisition integration activities, the shutdown of the Venlo, The Netherlands and Caguas, Puerto Rico facilities, outsourcing of certain back-office functions and other operational initiatives.
(4) Acquisition and integration costs reflect those incurred in connection with the DPP Acquisition, Gallus Acquisition and the recently completed IRIX Acquisition and Agere Acquisition.
(5) The 2014 impairment charge is associated with the Capua facility as well as additional in-process research and development projects acquired in connection with our acquisition of Sobel USA Inc., a Delaware corporation, and Banner Pharmacaps Europe B.V., a private limited company organized under the laws of The Netherlands, or collectively Banner, for a net aggregate cash purchase price of approximately $269.0 million, which we refer to as the Banner Acquisition.
(6) Refinancing expenses were incurred in connection with the DPP Acquisition and Gallus Acquisition in 2014 and the related debt financings.
13
Investing in our common stock involves a high degree of risk. You should consider carefully the risks and uncertainties described below and the other information contained in this prospectus, including the financial statements and the related notes, before you decide whether to purchase our common stock.
Risks related to our business
We are dependent on our customers’ spending on and demand for our manufacturing and development services. A reduction in spending or demand could have a material adverse effect on our business.
The amount of customer spending on pharmaceutical development and manufacturing, particularly the amount our customers choose to spend on outsourcing these services, has a large impact on our sales and profitability. The outcomes of our customers’ research and development activities also have an impact on the amount that our customers choose to spend on our services and offerings. Our customers determine the amounts that they will spend based upon, among other things, available resources, access to capital, and their need to develop new products, which, in turn, are dependent upon a number of factors, including their competitors’ research, development and product initiatives and the anticipated market uptake, and clinical and reimbursement scenarios for specific products and therapeutic areas. Consolidation in the pharmaceutical industry may impact such spending as customers integrate acquired operations, including research and development departments and manufacturing operations.
Any reduction in customer spending on pharmaceutical development and related services as a result of these and other factors could have a material adverse effect on our business, results of operations and financial condition.
Furthermore, demand for our Drug Product Services, or DPS, business is driven, in part, by products we develop for customers of our Pharmaceutical Development Services, or PDS, business. Due to the long lead times associated with obtaining regulatory approvals for many of these products, particularly dosage forms, and the competitive advantage that may result from gaining early approval, it is important that we maintain a sufficiently large portfolio of pharmaceutical products and that such products are brought to market on a timely basis. If our customers reduce their research and development activities, any resulting decrease in activity in our PDS business could also negatively affect activity levels in our DPS business. Any such decline in demand for our services could have a material adverse effect on our business, results of operations and financial condition.
The consumers of the products we manufacture for our customers may significantly influence our business, results of operations and financial condition.
We are dependent on, and have no control over, consumer demand for the products we manufacture for our customers. Consumer demand for our customers’ products could be adversely affected by, among other things, delays in health regulatory approval, the loss of patent and other intellectual property rights protection, the emergence of competing products, including generic drugs, the degree to which private and government drug plans subsidize payment for a particular product and changes in the marketing strategies for such products.
The healthcare industry has changed significantly over time, and we expect the industry to continue to evolve. Some of these changes, such as ongoing healthcare reform, adverse changes in government or private funding of healthcare products and services, legislation or regulations governing the privacy of patient information or patient access to care, or the delivery, pricing or reimbursement of pharmaceuticals and healthcare services or mandated benefits, may cause healthcare industry participants to reduce the number of our services and products that they purchase from us or the price they are willing to pay for our services and products. For example, the recent passage of healthcare reform legislation in the United States changes laws and regulations governing healthcare service providers and specifically includes certain cost containment measures that may have a material adverse effect on some or all of our customers and thus may have a
14
material adverse effect on our business. Changes in the healthcare industry’s pricing, selling, inventory, distribution or supply policies or practices could also significantly reduce our revenue and profitability. In particular, volatility in individual product demand may result from changes in public or private payer reimbursement or coverage.
If the products we manufacture for our customers do not gain market acceptance, our revenues and profitability may be adversely affected. The degree of market acceptance of our customers’ products will depend on a number of factors, including:
| • | the ability of our customers to publicly establish and demonstrate the efficacy and safety of such products, including favorably comparing such products to competing products; |
| • | regulatory approval of, or regulatory actions taken with respect to, such products; |
| • | the costs to potential consumers of using such products and the cost of competing products; |
| • | marketing and distribution support for such products; and |
| • | public perception of our customers and our customers’ industry. |
If production volumes of key products that we manufacture for our customers and related revenues are not maintained, we may suffer a material adverse effect on our business, results of operations and financial condition. Additionally, any changes in product mix due to market acceptance of our customers’ products may have a material adverse effect on our margins.
Our services and offerings are highly complex, and if we are unable to provide quality and timely offerings to our customers, our business could suffer.
The services we offer are highly exacting and complex, due in part to strict regulatory requirements. See “—Risks related to regulatory and legal matters—Failure to comply with existing and future regulatory requirements could adversely affect our results of operations and financial condition.” Our operating results depend on our ability to execute and, when necessary, improve our quality management strategy and systems, and our ability to effectively train and maintain our employee base with respect to quality management. A failure of our quality control systems in our new and existing business units and facilities could result in problems with facility operations or preparation or provision of products. In each case, such problems could arise for a variety of reasons, including equipment malfunction, failure to follow specific protocols and procedures, problems with raw materials or environmental factors and damage to, or loss of, manufacturing operations. Such problems could affect production of a particular batch or series of batches of products, requiring the destruction of such products or a halt of facility production altogether.
In addition, our failure to meet required quality standards may result in our failure to timely deliver products to our customers, which in turn could damage our reputation for quality and service. Any such failure could, among other things, lead to increased costs, lost revenue, reimbursement to customers for lost drug product, registered intermediates, registered starting materials, and APIs, damage to and possibly termination of existing customer relationships, time and expense spent investigating the cause and, depending on the cause, similar losses with respect to other batches or products. Production problems in our drug and biologic manufacturing operations could be particularly significant because the cost of raw materials for such manufacturing is often higher than in our other businesses. If problems in preparation or manufacture of a product or failures to meet required quality standards for that product are not discovered before such product is released to the market, we may be subject to adverse regulatory actions, including product recalls, product seizures, injunctions to halt manufacture and distribution, restrictions on our operations, civil sanctions, including monetary sanctions, and criminal actions. In addition, such problems or failures could subject us to litigation claims, including claims from our customers for reimbursement for the cost of lost or damaged APIs, the cost of which could be significant.
15
Our pharmaceutical development services projects are typically for a shorter term than our pharmaceutical manufacturing projects, and any failure by us to maintain a high volume of pharmaceutical development services projects, including due to lower than expected success rates of the products for which we provide services, could have a material adverse effect on our business, results of operations and financial condition.
Unlike our pharmaceutical manufacturing services business, where our contracts typically have durations of multiple years, our pharmaceutical development services business contracts are generally shorter in term and typically require us to provide development services within a designated scope. Since our pharmaceutical development services business focuses on products that are still in developmental stages, their viability depends on the ability of such products to reach their respective subsequent development phases. In many cases, such products do not reach subsequent development phases and, as a result, the profitability of the related pharmaceutical development service project may be limited. Even if a customer wishes to proceed with a project, the product we are developing on such customer’s behalf may fail to receive necessary regulatory approval or may have its development hindered by other factors, such as the development of a competing product.
If we are unable to continue to obtain new projects from existing and new customers, our pharmaceutical development services business could be adversely affected. Furthermore, although our outsourced pharmaceutical development services business acts as a pipeline for our outsourced pharmaceutical manufacturing services business, we cannot predict the conversion rate of our outsourced pharmaceutical development services projects to commercial manufacturing services projects, or how successful we will be in winning new projects that lead to a viable product. As such, an increase in the turnover rate of our outsourced pharmaceutical development services projects may negatively affect our outsourced pharmaceutical manufacturing services business at a later time. In addition, the discontinuation of a project as a result of our failure to satisfy a customer’s requirements may also affect our ability to obtain future projects from such customer, as well as from new customers. Any failure by us to maintain a high volume of outsourced pharmaceutical development services projects could also have a material adverse effect on our outsourced pharmaceutical development services businesses and, as a result, could have a material adverse effect on our business, results of operations and financial condition.
Our operations outside the United States are subject to a number of economic, political and regulatory risks.
Patheon is an international company organized in The Netherlands with facilities and offices in 12 countries as of January 31, 2015. For the fiscal year ended October 31, 2014, approximately 45% of our revenues was attributable to customers located outside the United States. Our operations or our customers outside the United States could be substantially affected by foreign economic, political and regulatory risks. These risks include but are not limited to:
| • | fluctuations in currency exchange rates; |
| • | the difficulty of enforcing agreements and collecting receivables through certain foreign legal systems; |
| • | customers in certain foreign countries potentially having longer payment cycles; |
| • | changes in local tax laws, tax rates in certain countries that may exceed those of the United States and lower earnings due to withholding requirements or the imposition of tariffs, exchange controls or other restrictions; |
| • | seasonal reductions in business activity; |
| • | the credit risk of local customers and distributors; |
| • | unexpected changes in legal, regulatory or tax requirements; |
| • | local laws related to, and relationships with, local labor unions and works councils; |
16
| • | the risk that certain governments may adopt regulations or take other actions that would have a direct or indirect adverse impact on our business and market opportunities, including nationalization of private enterprise; |
| • | non-compliance with applicable currency exchange control regulations, transfer pricing regulations or other similar regulations; |
| • | violations of the Foreign Corrupt Practices Act by acts of agents and other intermediaries over whom we have limited or no control; |
| • | violations of regulations enforced by the U.S. Department of The Treasury’s Office of Foreign Asset Control, or OFAC; and |
| • | general economic and political conditions. |
Our operations are also subject to the effects of global competition, including potential competition from API or fine chemicals manufacturers in low-cost jurisdictions such as India and China.
While some of these risks can be hedged using derivatives or other financial instruments and some are insurable, such attempts to mitigate these risks are costly and not always successful. If any of these economic or political risks materialize and we have failed to anticipate and effectively manage them, we may suffer a material adverse effect on our business and results of operations. If we do not remain in compliance with current regulatory requirements or fail to comply with future regulatory requirements, then such non-compliance may subject us to liability or other restrictions upon our operations and could have a material adverse effect on our business and results of operations.
From time to time, we may seek to restructure our operations and may divest non-strategic businesses or assets, which may require us to incur restructuring charges, and we may not be able to achieve the cost savings that we expect from any such restructuring efforts or divestitures.
To improve our profitability, we restructured our Puerto Rican operations as part of our efforts to eliminate operating losses and develop a long-term plan for our business in early 2014 and announced the closure of our facility in Venlo, The Netherlands on July 2, 2014. As part of our restructuring efforts, we incurred $53.5 million in repositioning expenses in fiscal 2014 which related to the DPP integration activities, the shutdown of the Venlo, The Netherlands and Caguas, Puerto Rico facilities, reduction of workforce at our Swindon, U.K. facility, outsourcing of certain back-office functions and other operational initiatives. In fiscal 2013 we incurred $15.8 million in repositioning expenses, of which $5.2 million related to the closure of the Olds, Alberta, Canada facility that was acquired as part of the Banner Acquisition and the shutdown of the Caguas, Puerto Rico facility, with the remainder related to the plan of termination associated with the Swindon, U.K. facility. We may adopt additional restructuring plans in order to improve our operational efficiency. Going forward, we expect to evaluate our restructuring plans from time to time pursuant to our operational excellence program.
We may not be able to achieve the level of benefit that we expect to realize from these or any future restructuring activities, within expected timeframes, or at all. Furthermore, upon the closure of any facilities in connection with our restructuring efforts, we may not be able to divest such facilities at fair prices or in a timely manner. In addition, as part of any plant closure and the transfer of production to another facility, we are required to obtain the consents of our customers and the relevant regulatory agencies, which we may not be able to obtain. Changes in the amount, timing and character of charges related to our current and future restructurings and the failure to complete, or a substantial delay in completing, any current or future restructuring plan could have a material adverse effect on our business.
We may also seek to sell some of our assets in connection with the divestiture of a non-strategic business or as part of internal restructuring efforts. Divesting non-strategic businesses may result in lower revenue and lower cash flows from operations. In addition, subject to the limits imposed by our existing and future debt instruments, we have broad discretion in how we choose to apply the proceeds we receive from asset sales in connection with the divestiture of non-strategic businesses.
17
We sold the Caguas, Puerto Rico facility in February 2013, and the Olds, Alberta, Canada facility was closed and subsequently sold on November 1, 2013 and, in fiscal 2013, we recorded $11.8 million in impairment charges relating to the closure. To the extent that we are not successful in completing our planned divestitures or restructuring efforts, we may have to expend substantial amounts of cash, incur debt and continue to absorb loss-making or under-performing divisions. Any divestitures that we are unable to complete may involve a number of risks, including diversion of management’s attention, a negative impact on our customer relationships, costs associated with retaining the targeted divestiture, closing and disposing of the impacted business or costs associated with transferring business to other facilities.
Fluctuations in exchange rates could have a material adverse effect on our results of operations and financial performance.
As a company with numerous international entities, we have certain revenues, assets and liabilities that are denominated in currencies other than the U.S. dollar. Our most significant transaction exposures arise in our Canadian operations. In addition, approximately 90% of the revenues of our Canadian operations and approximately 10% of our operating expenses are transacted in U.S. dollars. As a result, we may experience transaction exposures because of volatility in the exchange rate between the Canadian and U.S. dollar. Based on our current U.S. dollar denominated net inflows, as of October 31, 2014 and January 31, 2015, respectively, an increase or decrease of 10% in the currency exchange rate between the Canadian and U.S. dollar would have an annual increase or decrease on earnings (loss) from continuing operations before taxes of approximately $19.1 million and $3.6 million (without accounting for hedging activities), respectively. In addition, the exchange-rate risk of our European operations could be affected by changes in the amounts of U.S. dollar-denominated revenue and raw material procurement costs.
The objective of our foreign exchange risk management activities is to minimize transaction exposures and any resulting volatility of our earnings. To mitigate exchange-rate risk, we utilize foreign exchange forward contracts and collars in certain circumstances to lock in exchange rates, with the objective of offsetting the loss or gain that results from the transaction or transactions being hedged with the gain or loss on the forward contracts and collars. As of October 31, 2014, we had entered into foreign exchange forward contracts and collars to cover approximately 81% of our expected Canadian-U.S. dollar cash flow exposures for fiscal 2015.
We include translation gains and losses related to certain foreign currency denominated intercompany loans as part of the net investment in certain foreign subsidiaries and in accumulated other comprehensive income in shareholders’ equity. We do not currently hedge translation exposures but may do so in the future.
In addition, we conduct a significant portion of our business using the euro. Appreciation of the U.S. dollar against the euro adversely affects our consolidated revenue as revenue, billed in euros is translated into U.S. dollars at a lower rate, though we also tend to incur costs in the same currency in which the related operations realize revenue, largely mitigating the effect on operating income and operating cash. However, if the U.S. dollar appreciates significantly, future revenue, operating income and operating cash flows could be affected to a greater extent. In addition, the appreciation of the U.S. dollar relative to foreign currencies reduces the U.S. dollar value of cash balances held in those currencies.
While we attempt to mitigate our foreign exchange risk by engaging in foreign currency hedging activities using derivative financial instruments, we may not be successful. We may not be able to engage in hedging transactions in the future, and if we do, we may not be able to eliminate foreign currency risk, and foreign currency fluctuations could have a material adverse effect on our results of operations and financial performance.
We are, or may be, party to certain derivative financial instruments, and our results of operations may be negatively affected in the event of non-performance by the counterparties to such instruments.
From time to time, we enter into interest rate swaps and foreign exchange forward contracts and collars to limit our exposure to changes in variable interest rates and foreign exchange rates. Such
18
instruments may result in economic losses if exchange rates decline to a point lower than our fixed rate commitments. When we enter into such swaps and contracts, we are exposed to credit-related losses, which could impact our results of operations and financial condition in the event of non-performance by the counterparties to such instruments. For more information about our foreign currency risks, please see “Management’s discussion and analysis of financial condition and results of operations—Quantitative and qualitative disclosures about market risk.”
Because a significant portion of our revenues comes from a limited number of customers, any decrease in sales to these customers could have a material adverse effect on our business, results of operations and financial condition.
For the year ended October 31, 2014, our top 10 customers and products accounted for 39% and 24%, respectively, of our revenues. While no customer accounted for more than 7% of our revenue for the year ended October 31, 2014, we have customer concentration that increases credit risk and other risks associated with particular customers and particular products, including risks related to market demand for customer products and regulatory and other operating risks. Disruptions in the production of major products could damage our customer relationships and adversely impact our results of operations in the future. Revenues from customers that have accounted for significant sales in the past, either individually or as a group, may not reach or exceed historical levels in any future period. The loss or a significant reduction of business from any of our major customers could have a material adverse effect on our business, results of operations and financial condition.
Contract delays, cancellations and non-renewals may adversely affect our business.
Although we have many long-term contracts, the volume under each contract is subject to change, sometimes significantly based on the expected forecast volume required by our customers. In addition, certain of our contracts may be cancelled or delayed by customers for any reason upon short notice. Many of our outsourced pharmaceutical development services contracts are terminable by the customer upon 30 to 90 days’ notice. Multiple cancellations, non-renewals, or renewals on less favorable terms of significant contracts could have a material adverse effect on our business, results of operations and financial condition.
We operate in a market that is highly competitive. We compete to provide outsourced pharmaceutical development and manufacturing services to pharmaceutical and biotechnology companies around the world.
Our competition in the pharmaceutical manufacturing services market includes full-service pharmaceutical outsourcing companies; contract manufacturers focusing on a limited number of dosage forms; contract manufacturers providing multiple dosage forms; and large pharmaceutical companies offering third-party manufacturing services to fill their excess capacity. In addition, in Europe, there is a large number of privately owned, dedicated outsourcing companies that serve only their local or national markets. Also, large pharmaceutical companies have been seeking to divest portions of their manufacturing capacity, and any such divested businesses may compete with us in the future. Other pharmaceutical companies may elect to provide their own development and manufacturing services internally rather than outsourcing those functions to us or any of our competitors. We compete primarily on the basis of the security of supply (quality, regulatory compliance and financial stability), service (on-time delivery, manufacturing flexibility and solid track record) and cost-effective manufacturing (prices and a commitment to continuous improvement).
Our competition in the outsourced development services market includes a large number of laboratories that offer only a limited range of developmental services, generally at a small scale; providers focused on specific technologies and/or dosage forms; and several fully integrated companies that can provide the full complement of services necessary to develop, scale-up and manufacture a wide range of dosage forms. We also compete in the outsourced development services market with major pharmaceutical and chemical companies, specialized contract research organizations, research and development firms, universities and other research institutions. We may also compete with the internal operations of pharmaceutical companies that choose to develop
19
their products internally. We compete primarily on the basis of scientific expertise, knowledge and experience in dosage form development, availability of a broad range of equipment, technology availability (e.g., chemical and biotechnology means), on-time delivery of clinical materials, compliance with cGMPs, or current Good Manufacturing Practices, regulatory compliance, cost-effective services and financial stability.
Some of our competitors may have substantially greater financial, marketing, technical or other resources than we do. Greater financial, marketing, technical or other resources may allow our competitors to respond to changes in market demand more quickly with new, alternative or emerging technologies. Changes in the nature or extent of our customer requirements may render our service and product offerings obsolete or non-competitive, which could have a material adverse effect on our business, results of operations and financial condition.
One factor causing increased competition is that a number of companies in Asia, particularly India, which have been entering the outsourced pharmaceutical development and manufacturing services sector over the past few years, have begun obtaining approval from the FDA for certain of their facilities and have acquired additional facilities in Europe and North America. One or more of these companies may become a significant competitor to us. Competition may, among other things, result in a decrease in the fees paid for our services and reduced demand for outsourced pharmaceutical development and manufacturing services, which could have a material adverse effect on our business, results of operations and financial condition.
We may not be able to successfully offer new services.
In order to successfully compete, we will need to offer and develop new services. Without the timely introduction of enhanced or new services, our services and capabilities may become obsolete over time, in which case, our revenues and operating results would suffer. The related development costs may require a substantial investment before we can determine their commercial viability, and we may not have the financial resources to fund such initiatives.
In addition, the success of enhanced or new services will depend on several factors, including but not limited to our ability to:
| • | properly anticipate and satisfy customer needs, including increasing demand for lower cost services; |
| • | enhance, innovate, develop and manufacture new offerings in an economical and timely manner; |
| • | differentiate our offerings from competitors’ offerings; |
| • | achieve positive clinical outcomes for our customers’ new products; |
| • | meet quality requirements and other regulatory requirements of government agencies; |
| • | obtain valid and enforceable intellectual property rights; and |
| • | avoid infringing the proprietary rights of third parties. |
Even if we were to succeed in creating enhanced or new services, those services may not result in commercially successful offerings or may not produce revenues in excess of the costs of development and capital investment and may be quickly rendered obsolete by changing customer preferences or by technologies or features offered by our competitors. In addition, innovations may not be accepted quickly in the marketplace due to, among other things, entrenched patterns of clinical practice, the need for regulatory clearance and uncertainty over market access or government or third-party reimbursement. Moreover, the integration of our recent and future acquisitions could compound the challenges of integrating complementary products, services and technologies and developing and offering new services.
20
We rely on our customers to supply many of the necessary ingredients for our products, and for other ingredients, we rely on other third parties. Our inability to obtain the necessary materials or ingredients for the products we manufacture on behalf of our customers could have a material adverse effect on our business, results of operations and financial condition.
Our DPS operations require various API components, compounds, raw materials and energy supplied primarily by third parties, including our customers. Our customers specify the components, raw materials and packaging materials required for their products and, in some cases, specify the suppliers from which we must purchase these inputs. In most cases, the customers supply the APIs to us at no cost pursuant to our standard services agreements.
We generally source our components, compounds and raw materials locally, and most of the materials required by us for our outsourced pharmaceutical manufacturing services business are readily available from multiple sources.
In some cases, we manage the supply chain for our customers, including the sourcing of certain ingredients and packaging material from third-party suppliers. In certain instances, such ingredients or packaging material can only be supplied by a limited number of suppliers or in limited quantities. If our customers or third-party suppliers do not supply APIs or other raw materials on a timely basis, we may be unable to manufacture products for our customers. A sustained disruption in the supply chain involving multiple customers or vendors at one time could have a material adverse effect on our results of operations.
Furthermore, customers or third-party suppliers may fail to provide us with raw materials and other components that meet the qualifications and standards required by us or our customers. If third-party suppliers are not able to provide us with products that meet our or our customers’ specifications on a timely basis, we may be unable to manufacture products, or products may be available only at a higher cost or after a long delay, which could prevent us from delivering products to our customers within required timeframes. Any such inability to manufacture or delay in delivering our products may create liability for us to our customers for breach of contract or cause us to experience order cancellations and loss of customers. In the event that we produce products with inferior quality components and raw materials, we may become subject to product liability or warranty claims caused by defective raw materials or components from a third-party supplier or from a customer, or our customer may be required to recall its products from the market.
It is also possible that any of our supplier relationships could be interrupted due to natural disasters, international supply disruptions caused by geopolitical issues or other events or could be terminated in the future. Any sustained interruption in our receipt of adequate supplies could have an adverse effect on our business and financial results. In addition, while we have supply chain processes intended to reduce volatility in component and material pricing, we may not be able to successfully manage price fluctuations. Price fluctuations or shortages could have a material adverse effect on our results of operations and financial condition.
Technological change may cause our offerings to become obsolete over time. A decrease in our customers’ purchases of our offerings could have a material adverse effect on our business, results of operations and financial condition.
The healthcare industry is characterized by rapid technological change. Demand for our services may change in ways that we may not anticipate because of evolving industry standards or as a result of evolving customer needs that are increasingly sophisticated and varied or because of the introduction by competitors of new services and technologies. In addition, we require capital and resources to support the maintenance and improvement of our facilities, including replacing or repairing aging production equipment and updating overall facility master plans. If we are unable to maintain and improve our facilities, we may experience unscheduled equipment downtime and unpredicted machinery failure and become unable to supply our customers with products or services which may affect business continuity. Any such incident or disruption in business continuity could have a material adverse effect on our business, results of operations and financial condition.
21
We are dependent on key management.
We are dependent upon the continued support and involvement of our key management, including James C. Mullen, our Chief Executive Officer. The majority of our key management have employment agreements with us that impose noncompetition and nonsolicitation restrictions following cessation of employment. Because our ability to manage our business activities and, hence, our success, depends in large part on the collective efforts of such personnel, our inability to continue to attract, retain or motivate such personnel could have a material adverse effect on our business. Moreover, retaining and motivating key personnel from our recent acquisitions who will be instrumental in integrating our businesses will be important to our ability to successfully achieve our business objectives.
Certain of our pension plans are underfunded, and additional cash contributions may be required, which may reduce the cash available for our business.
Certain of our employees in Canada, France and the United Kingdom are participants in defined benefit pension plans that we sponsor. In addition, employees at our facility in The Netherlands are covered by a defined benefit pension plan and certain employees of DPP in Germany, the United States and Austria are covered by defined benefit pension plans. As of October 31, 2014, the unfunded pension liability on our pension plans was approximately $77.3 million in the aggregate. The amount of future contributions to our defined benefit plans will depend upon asset returns and a number of other factors and, as a result, the amounts we will be required to contribute to such plans in the future may vary. Such cash contributions to the plans will reduce the cash available for our business.
In relation to our U.K. pension plan, the trustees are authorized to accelerate the required payment of future contribution obligations if they have received actuarial advice that the plan is incapable of paying all the benefits that have or will become due for payment as they become due. If the trustees of our U.K. pension plan were to be so advised and took such a step, our U.K. subsidiary would be required to meet the full balance of the cost of securing the benefits provided by the plan through the purchase of annuities from an insurance company, to the extent that it was able to do so. The cost would be likely to exceed the amount of any deficit under the plan while the plan was ongoing.
Any failure of our information systems, such as from data corruption, cyber-based attacks or network security breaches, could have a material adverse effect on our business and results of operations.
We rely on information systems in our business to obtain, rapidly process, analyze and manage data to:
| • | facilitate the manufacture and distribution of thousands of inventory items to and from our facilities; |
| • | receive, process and ship orders on a timely basis; |
| • | manage the accurate billing of, and collections from, our customers; |
| • | manage the accurate accounting for, and payment to, our vendors; and |
| • | schedule and operate our global network of manufacturing and development facilities. |
Security breaches of this infrastructure can create system disruptions, shutdowns or unauthorized disclosure of confidential information. If we are unable to prevent such breaches, our operations could be disrupted, or we may suffer financial damage or loss because of lost or misappropriated information. We cannot be certain that advances in criminal capabilities, new discoveries in the field of cryptography or other developments will not compromise or breach the technology protecting the networks that access our products and services. If these systems are interrupted, damaged by unforeseen events or fail for any extended period of time, including due to the actions of third parties, then we may not be able to effectively manage our business, and this could have a material adverse effect on our results of operations.
22
Our use of chemicals and chemical processes is subject to inherent risk.
We use chemical ingredients in the manufacture of certain of our products. Due to the nature of the manufacturing process itself, there is a risk of incurring liability for damages caused by or during the storage or manufacture of both the chemical ingredients and the finished products. For example, the DPx Fine Chemicals business relies on reaction chemistries for producing its products. Reaction chemistries utilize or create heat and pressure to either initiate or enhance the reaction and involve the use of solvents. Reaction chemistries are associated with different risks than those associated with the manufacture of finished dosage products. Risks associated with reaction chemistries include those associated with high temperatures (steam utilization), high pressures (pressure rated vessels), hazardous chemicals such as solvents, and risks associated with handling such materials such as spills both within secondary containment and outside of secondary containment. The processes used in DPx Fine Chemicals’ facilities typically involve large volumes of solvents and chemicals, creating the potential for larger spills and impacts. If any of these risks materialize, it could result in significant remediation and other costs, potential adverse regulatory actions and liabilities, any of which could have a material adverse effect on our business, results of operations and financial condition.
We may in the future engage in acquisitions and joint ventures. We may not be able to complete such transactions, and such transactions, if executed, pose significant risks.
Our future success may depend on our ability to acquire other businesses or technologies or enter into joint ventures that could complement, enhance or expand our current business or offerings and services or that might otherwise offer us growth opportunities. We may face competition from other companies in pursuing acquisitions and joint ventures. Our ability to enter into such transactions may also be limited by applicable antitrust laws and other regulations in the United States, The Netherlands and other jurisdictions in which we do business. To the extent that we are successful in making acquisitions, we may have to expend substantial amounts of cash, incur debt and assume loss-making divisions. We may not be able to complete such transactions due to a failure to secure financing. Any future acquisitions we undertake may be financed through cash provided by operating activities, borrowings under our credit facilities and/or other debt or equity financing. All of these could reduce our cash available for other purposes. For example, we incurred additional indebtedness to fund the Banner Acquisition, and this additional debt consumed a significant portion of our pre-DPP Acquisition ability to borrow. In addition, we also incurred additional indebtedness to fund the DPP Acquisition, the Gallus Acquisition, the IRIX Acquisition and the Agere Acquisition.
Any transactions that we are able to identify and complete may involve a number of risks, including but not limited to:
| • | the diversion of management’s attention to negotiate the transaction and then integrate the acquired businesses or joint ventures; |
| • | the possible adverse effects on our operating results during the negotiation and integration process; |
| • | significant costs, charges or write-downs; |
| • | the potential loss of customers or employees of the acquired business; |
| • | delays or reduction in realizing expected synergies; |
| • | unexpected liabilities relating to a joint venture or acquired business; and |
| • | our potential inability to achieve our intended objectives for the transaction. |
In addition, we may be unable to maintain uniform standards, controls, procedures and policies with respect to an acquired business, and this may lead to operational inefficiencies. To the extent that we are successful in making acquisitions, we may have to expend substantial amounts of cash, incur debt and assume loss-making divisions.
23
Certain of our executive officers will continue to provide management services for BLS.
In connection with the expected spin-off of BLS, we expect to enter into agreements with BLS to continue to provide commercial manufacturing services and management services, including strategic management, finance, information technology and legal support services, after the spin-off. We expect that certain of our executive officers will provide the management services. If BLS requires more time from these executive officers than is currently anticipated or BLS grows faster than anticipated, these executive officers may not be able to devote sufficient time to our business, which may limit our ability to achieve our business objectives.
Our substantial indebtedness could adversely affect our ability to raise additional capital to fund our operations, limit our ability to react to changes in the economy or in our industry, expose us to interest rate risk to the extent of our variable rate debt and prevent us from meeting our obligations under our indebtedness.
Following this offering, we will continue to have a significant amount of debt. As of January 31, 2015, on an as-adjusted basis giving effect to this offering and the use of proceeds therefrom as described under “Use of proceeds,” we would have had approximately $ billion of indebtedness. In addition, we would have had approximately $ million of availability under our $200.0 million revolving credit facility, which we refer to as the Revolving Credit Facility. If the proceeds of this offering are not sufficient to repay our Senior PIK Toggle Notes and pay related fees and expenses, our indebtedness may be higher.
Our high degree of indebtedness could have important consequences for us, including:
| • | increasing our vulnerability to adverse economic, industry or competitive developments; |
| • | exposing us to the risk of increased interest rates because certain of our borrowings are at variable rates of interest; |
| • | exposing us to the risk of fluctuations in exchange rates because certain of our borrowings are denominated in euros; |
| • | making it more difficult for us to satisfy our obligations with respect to our indebtedness, and any failure to comply with the obligations of any of our debt instruments, including restrictive covenants and borrowing conditions, could result in an event of default under the governing our indebtedness; |
| • | restricting us from making strategic acquisitions or causing us to make non-strategic divestitures; |
| • | limiting our ability to obtain additional financing for working capital, capital expenditures, product development, debt service requirements, acquisitions and general corporate or other purposes; and |
| • | limiting our flexibility in planning for, or reacting to, changes in our business or market conditions and placing us at a disadvantage relative to our competitors with less debt and who, therefore, may be able to take advantage of opportunities that our indebtedness prevents us from exploiting. |
Any of the foregoing consequences could have a material impact on our business, financial condition and results of operations.
Despite our existing indebtedness level, we may still be able to incur significant additional amounts of debt, which could further exacerbate the risks associated with our substantial indebtedness.
Despite our existing level of indebtedness, we may be able to incur substantial additional indebtedness in the future. Although the agreements governing our indebtedness contain restrictions on the incurrence of additional indebtedness, these restrictions are subject to a number of significant qualifications and exceptions and, under certain circumstances, the amount of indebtedness that could be incurred in compliance with these restrictions could be substantial. See “Management’s discussion and analysis of financial condition and results of operations—Financing arrangements.”
24
Our debt agreements contain restrictions that limit our flexibility in operating our business.
On March 11, 2014, we completed the refinancing of our existing credit facility, or the Refinancing, pursuant to which we entered into a credit agreement, or the Credit Agreement, documenting a new credit facility, or the Credit Facility, which we amended in September 2014. Our Credit Agreement contains various covenants that limit our ability to engage in specified types of transactions. These covenants limit our ability to, among other things:
| • | incur additional indebtedness; |
| • | pay certain dividends on, repurchase or make distributions in respect of capital stock or make other restricted payments; |
| • | issue or sell capital stock of restricted subsidiaries; |
| • | guarantee certain indebtedness; |
| • | make certain investments; |
| • | sell or exchange assets; |
| • | enter into certain transactions with affiliates; |
| • | create certain liens; and |
| • | consolidate, merge or transfer all or substantially all of our assets and the assets of our subsidiaries on a consolidated basis. |
A breach of any of these covenants could result in a default under the Credit Agreement, including as a result of cross default provisions, and, in the case of our Credit Facility, permit the lenders to cease making loans to us. See “Management’s discussion and analysis of financial condition and results of operations—Financing arrangements.”
Risks related to regulatory and legal matters
Our failure to comply with existing and future regulatory requirements could adversely affect our results of operations and financial condition.
The healthcare industry is highly regulated. We are subject to various local, state, federal, foreign and transnational laws and regulations, which include the operating and security standards of the DEA, FDA, various state boards of pharmacy, state health departments, the U.S. Department of Health and Human Services, or the DHHS, the European Medicines Agency, or EMA, in Europe, the EU member states and other comparable agencies and, in the future, any changes to such laws and regulations could adversely affect us. In particular, we are subject to laws and regulations concerning good manufacturing practices and drug safety. Our subsidiaries may be required to register for permits and/or licenses with, and may be required to comply with the laws and regulations of the DEA, the FDA, the DHHS, foreign agencies including the EMA, and other various state boards of pharmacy, state health departments and/or comparable state agencies as well as certain accrediting bodies depending upon the type of operations and location of product distribution, manufacturing and sale.
The manufacture, distribution and marketing of our offerings for use in our customers’ products are subject to extensive ongoing regulation by the FDA, the DEA, the EMA, and other equivalent local, state, federal and foreign regulatory authorities. In addition, like all commercial drug manufacturers, we are subject to inspections by these regulatory authorities. Upon completion of an inspection, the FDA issues any inspectional observations on a Form 483. We are required to respond to the observations in writing and the FDA will close out the inspection once it is satisfied with our response. Currently, FDA inspections that resulted in observations at our Greenville, North Carolina, Ferentino, Italy and Monza, Italy facilities are not yet closed out. Failure by us or by our customers to comply with the requirements of these regulatory authorities, including without limitation, remediating any inspectional observations to the satisfaction of these regulatory authorities, could result in warning letters, product recalls or seizures, monetary sanctions, injunctions to halt manufacture and distribution, restrictions on our operations, civil or criminal
25
sanctions, or withdrawal of existing or denial of pending approvals, including those relating to products or facilities. In addition, such a failure could expose us to contractual or product liability claims as well as contractual claims from our customers, including claims for reimbursement for lost or damaged active pharmaceutical ingredients, the cost of which could be significant.
In addition, any new offerings or products must undergo lengthy and rigorous clinical testing and other extensive, costly and time-consuming procedures mandated by the FDA, the EMA and other equivalent local, state, federal and foreign regulatory authorities. We or our customers may elect to delay or cancel anticipated regulatory submissions for current or proposed new products for any number of reasons.
Although we believe that we are in compliance in all material respects with applicable laws and regulations, there can be no assurance that a regulatory agency or tribunal would not reach a different conclusion concerning the compliance of our operations with applicable laws and regulations. In addition, there can be no assurance that we will be able to maintain or renew existing permits, licenses or any other regulatory approvals or obtain, without significant delay, future permits, licenses or other approvals needed for the operation of our businesses. Any noncompliance by us with applicable laws and regulations or the failure to maintain, renew or obtain necessary permits and licenses could have an adverse effect on our results of operations and financial condition.
We are subject to environmental, health and safety laws and regulations, which could subject us to liabilities, increase our costs or restrict our operations in the future.
Our facilities and operations are subject to a variety of environmental, health and safety laws and regulations in each of the jurisdictions in which we operate. These laws and regulations govern, among other things, air emissions, wastewater discharges, the use, handling and disposal of hazardous and other regulated substances and wastes, soil and groundwater contamination and employee health and safety. We are also subject to laws and regulations governing the destruction and disposal of raw materials and non-compliant products, the handling of regulated material that is included in our offerings and the disposal of our offerings at the end of their useful life. In some jurisdictions the chemical components of some of our products are also subject to regulation, and from time to time we may be required to change product formulations to comply with such requirements. In addition, increasing efforts to control emissions of greenhouse gases, or GHG, may impact our operations, and compliance with future requirements to reduce GHG emissions may cause us to incur additional capital and operational expenditures. Environmental, health and safety laws and regulations have increasingly become more stringent, and we may incur additional expenses to ensure compliance with existing or new requirements in the future. Any failure by us to comply with environmental, health and safety requirements could result in the limitation or suspension of our operations. We also could incur monetary fines, civil or criminal sanctions, third-party claims or cleanup or other costs or damages pursuant to such requirements. Although we maintain insurance coverage for certain environmental liabilities, the costs of environmental remediation and other liabilities may exceed the amount of such coverage or may not be covered by such insurance. In addition, compliance with environmental, health and safety requirements could restrict our ability to expand our facilities or require us to acquire costly pollution control equipment, incur other significant expenses or modify our manufacturing processes.
Our manufacturing facilities, in varying degrees, use, store and dispose of hazardous and other regulated substances in connection with their processes. In some cases, the volume of regulated substances used in these processes or the manner in which they are used result in a potential for large spills or other impacts. At some of our facilities, these substances are stored in underground storage tanks or used in refrigeration systems. Some of our facilities, including our current and former facilities in Puerto Rico, have been utilized over a period of years as manufacturing facilities, with operations that may have included on-site landfilling or other waste disposal activities, and have certain known or potential conditions that may require remediation in the future; and several of these have undergone remediation activities in the past by former owners or operators. In addition, a number of our facilities are currently undergoing assessment, remediation or monitoring, including at our sites in Greenville, NC and Capua, Italy. While we maintain accruals for
26
ongoing remediation at certain of our sites, these accruals may not fully capture all future costs necessary to perform any required corrective action. Any costs above what we have previously accrued could have a significant impact on our results and ongoing operations. In addition, some of our facilities are located near third-party industrial sites and may be impacted by contamination migrating from such sites, or are located on multi-company campuses with shared utilities, infrastructure and permits, with the potential for other companies to impact our operations or the infrastructure used to support our operations, such as wastewater treatment facilities or consolidated environmental permits. A number of our facilities use groundwater from onsite wells for process and potable water, and if these onsite sources became contaminated or otherwise unavailable for future use, we could incur expenses for obtaining water from alternative sources. In addition, our operations have grown through acquisitions, and it is possible that facilities that we have acquired may expose us to environmental liabilities associated with historical site conditions that have not yet been discovered. We have also sold or closed some facilities, and may remain or become obligated to address past environmental contamination relating to such locations. Some environmental laws impose liability for contamination on current and former owners and operators of affected sites, regardless of fault. If remediation costs or potential claims for personal injury or property or natural resource damages resulting from contamination arise, they may be material and may not be recoverable under any contractual indemnity or otherwise from prior owners or operators or any insurance policy. Additionally, we may not be able to successfully enforce any such indemnity or insurance policy in the future. In the event that new or previously unknown contamination is discovered or new cleanup obligations are otherwise imposed in connection with any of our currently or previously owned or operated facilities, we may be required to take additional, unplanned remedial measures and incur costs for which no reserves have been recorded.
We are subject to product and other liability risks that could have a material adverse effect on our results of operations and financial condition.
We may be named as a defendant in product liability lawsuits, which may allege that products or services we, or any newly acquired businesses, have provided have resulted or could result in an unsafe condition or injury to consumers. We may also be exposed to other liability lawsuits, such as other tort, regulatory or intellectual property claims. Such lawsuits could be costly to defend and could result in reduced sales, significant liabilities and diversion of management’s time, attention and resources. Even claims without merit could subject us to adverse publicity and require us to incur significant legal fees. Furthermore, product liability claims and lawsuits, regardless of their ultimate outcome, could have a material adverse effect on our operations and financial condition and reputation and on our ability to attract and retain customers.
Historically, we have sought to manage this risk through the combination of product liability insurance and contractual indemnities and liability limitations in our agreements with customers and vendors. The availability of product liability insurance for companies in the pharmaceutical industry is generally more limited than insurance available to companies in other industries. Insurance carriers providing product liability insurance to those in the pharmaceutical and biotechnology industries generally limit the amount of available policy limits, require larger deductibles and exclude coverage for certain products and claims. We currently maintain insurance coverage for product and other liability claims. If our existing liability insurance is inadequate or we are not able to maintain such insurance, there may be claims asserted against us that are not covered by such insurance. A partially or completely uninsured claim, if successful and of sufficient magnitude, could have a material adverse effect on our results of operations and financial condition.
We and our customers depend on trademarks, patents, trade secrets, copyrights and other forms of intellectual property protections, but these protections may not be adequate.
We rely on a combination of trademark, patent, trade secret, copyright and other intellectual property laws and nondisclosure and other contractual provisions in the United States, Canada and other countries. We have applied in the United States and in certain foreign countries for registration of a limited number of trademarks and patents, some of which have been registered or
27
issued. There can be no assurance that these protections will prove meaningful against competitive offerings or otherwise be commercially valuable or that we will be successful in obtaining additional intellectual property or enforcing our intellectual property rights against unauthorized users. Our applications may not be approved by the applicable governmental authorities, and third parties may seek to oppose or otherwise challenge our registrations or applications. We also rely on unregistered proprietary rights, including know-how and trade secrets related to our outsourced pharmaceutical development and manufacturing services. Although we require our employees and other third parties, such as clients, to enter into confidentiality agreements prohibiting them from disclosing our proprietary information or technology, these agreements may not provide meaningful protection for our trade secrets and proprietary know-how. In addition, intellectual property enforcement may be unavailable in some foreign countries. Further, third parties who are not party to our confidentiality agreements may obtain access to our trade secrets or know-how, and others may independently develop similar or equivalent trade secrets or know-how. The use of our technology or similar technology by others could reduce or eliminate any competitive advantage we have developed, cause us to lose sales or otherwise harm our business. If our proprietary information is divulged to third parties, including our competitors, or our intellectual property rights are otherwise misappropriated or infringed, our competitive position could be harmed.
If we are unable to protect the confidentiality of our customers’ proprietary information, we may be subject to claims.
Many of the formulations used by us in manufacturing or developing products to customer specifications are subject to trade secret protection, patents or other protections owned or licensed by the relevant customer. We take significant efforts to protect our customer’s proprietary and confidential information, including requiring our employees to enter into agreements protecting such information. If, however, any of our employees breaches the non-disclosure provisions in such agreements, or if our customers make claims that their proprietary information has been disclosed, this could have a material adverse effect on our business.
Our services and our customers’ products may infringe on or misappropriate the intellectual property rights of third parties.
We cannot be certain that we do not infringe on the intellectual rights of third parties. Any claims that our services infringe third parties’ rights, including claims arising from our contracts with our customers, regardless of their merit or resolution, could be costly and may divert the efforts and attention of our management and technical personnel. We may not prevail in such proceedings given the complex technical issues and inherent uncertainties in intellectual property litigation. If such proceedings result in an adverse outcome, we could be required, among other things, to pay substantial damages (potentially treble damages in the United States), discontinue the use of the infringing technology, expend significant resources to develop non-infringing technology, license such technology from the third party claiming infringement (which license may not be available on commercially reasonable terms or at all) and/or cease the manufacture, use or sale of the infringing processes or offerings, any of which could have a material adverse effect on our business.
In addition, our customers’ products may be subject to claims of intellectual property infringement and such claims could materially affect our business if their products cease to be manufactured and they have to discontinue the use of the infringing technology which we may provide. Any of the foregoing could affect our ability to compete or could have a material adverse effect on our business, financial condition and results of operations.
Tax legislation initiatives or challenges to our tax positions could have a material adverse effect on our results of operations and financial condition.
We are a multinational business with global operations. As such, we are subject to the tax laws and regulations of The Netherlands, Canada, the United States and many international jurisdictions. From time to time, various legislative initiatives may be proposed that could have a material adverse effect on our effective tax rate or tax payments. In addition, tax laws and regulations are extremely
28
complex and subject to varying interpretations. If our tax positions are challenged by relevant tax authorities, we may not be successful in defending such a challenge and this could have a material adverse effect on our results of operations and financial condition.
Further changes in the tax laws of the foreign jurisdictions in which we operate could arise as a result of the base erosion and profit sharing, or BEPS, project being undertaken by the Organisation for Economic Co-operation and Development, or OECD. The OECD, which represents a coalition of member countries that encompass most of the jurisdictions in which we operate, is contemplating changes to numerous long principles through its BEPS project, which is focused on a number of issues, including the shifting of profits between affiliated entities in different tax jurisdictions. It is possible that jurisdictions in which we do business could react to the BEPS initiative by enacting tax legislation that could adversely affect our shareholders through increasing tax liabilities.
Tax assessments by various tax authorities could be materially different than the amounts we have provided for in our consolidated financial statements. We are regularly audited by various tax authorities. From time to time, these audits could result in proposed assessments. While we believe that we have adequately provided for any such assessments, future settlements could be materially different than we have provided for and thereby have a material adverse effect on our earnings and cash flows. We operate in various tax jurisdictions, and although we believe that we have provided for income and other taxes in accordance with the relevant regulations, if the applicable regulations were ultimately interpreted differently by a taxing authority, we could be exposed to additional tax liabilities. While we believe our tax positions, including, among others, intercompany transfer pricing policies, are consistent with the tax laws in the jurisdictions in which we conduct our business, it is possible that these positions may be challenged by jurisdictional tax authorities and could have a significant impact on our tax position.
We are subject to labor and employment laws and regulations, which could increase our costs and restrict our operations in the future.
We employ approximately 8,700 employees and contractors worldwide, including 5,100 employees in North America, 3,525 in Europe and 75 in the Asia-Pacific region. Certain of our employees are represented by labor organizations, and national works councils and/or labor organizations are active at our European facilities consistent with labor environments/laws in European countries. Similar relationships with labor organizations or national works councils exist at all of our facilities in the United Kingdom, France, Italy, The Netherlands, Austria and Germany. Our management believes that our employee relations are satisfactory. However, further organizing activities or collective bargaining may increase our employment-related costs and we may be subject to work stoppages and other labor disruptions. Moreover, as employers are subject to various employment-related claims, such as individual and class actions relating to alleged employment discrimination, wage-hour and labor standards issues, such actions, if brought against us and successful in whole or in part, may affect our ability to compete or have a material adverse effect on our business, financial condition and results of operations.
Risks related to this offering and our common stock
You will experience immediate and substantial dilution in the book value of your common stock.
The initial public offering price of our common stock is substantially higher than the pro forma net tangible book value per share of our common stock. Pro forma net tangible book value represents the amount of our tangible assets on a pro forma basis, less our pro forma total liabilities. As a result, you will incur immediate dilution of $ per share (based on an initial public offering price of $ per share, the mid-point of the range on the cover of this prospectus). For more information, see “Dilution.”
There may not be an active trading market for shares of our common stock, which may cause our common stock to trade at a discount from its initial offering price and make it difficult to sell the shares you purchase.
Prior to this offering, there has been no public trading market for shares of our common stock. It is possible that, after this offering, an active trading market will not develop or continue, which would make it difficult for you to sell your shares of common stock at an attractive price or at all.
29
The initial public offering price per share of our common stock will be determined by agreement among us and the representatives of the underwriters, and may not be indicative of the price at which the shares of our common stock will trade in the public market after this offering.
The historical and pro forma financial information in this prospectus may not permit you to predict our costs of operations.
The historical financial information in this prospectus does not reflect the added costs we expect to incur as a public company or the resulting changes that will occur in our capital structure and operations. In addition, the estimates we used in our pro forma financial information may not be similar to our actual experience as a public company. For more information on our historical and pro forma financial information, see “Unaudited pro forma consolidated financial information,” “Management’s discussion and analysis of financial condition and results of operations” and the historical financial statements and related notes included elsewhere in this prospectus.
If securities analysts do not publish research or reports about our business or if they downgrade our company or our sector, the price of our common stock could decline.
The trading market for our common stock will depend in part on the research and reports that industry or financial analysts publish about us or our business. We do not control these analysts. Furthermore, if one or more of the analysts who do cover us downgrades our company or our industry, or the stock of any of our competitors, the price of our common stock could decline. If one or more of these analysts ceases coverage of our company, we could lose visibility in the market, which in turn could cause the price of our common stock to decline.
Our share price may decline due to the large number of shares eligible for future sale and for exchange.
The market price of our common stock could decline as a result of sales of a large number of shares of common stock in the market after this offering or the perception that such sales could occur. These sales, or the possibility that these sales may occur, also might make it more difficult for us to sell equity securities in the future at a time and at a price that we deem appropriate. After the consummation of this offering, we will have outstanding shares of common stock. All of the shares of our common stock sold in this offering, or shares of our common stock assuming the underwriters exercise in full their option to purchase additional shares of our common stock, will be freely tradable without restriction or further registration under the Securities Act by persons other than our “affiliates.” See “Shares eligible for future sale.”
The remaining shares of our common stock outstanding held by our pre-IPO owners will be “restricted securities” within the meaning of Rule 144 under the Securities Act and may not be sold in the absence of registration under the Securities Act unless an exemption from registration is available, including the exemptions contained in Rule 144. We will enter into a registration rights agreement that will require us to register these shares under the Securities Act. See “Shares eligible for future sale—Registration rights” and “Certain relationships and related person transactions—Registration rights agreement.”
We intend to file one or more registration statements on Form S-8 under the Securities Act to register common stock issued or reserved for issuance under our omnibus equity incentive plan. Any such Form S-8 registration statement will automatically become effective upon filing. Accordingly, shares registered under such registration statement will be available for sale in the open market, unless such shares are subject to vesting restrictions with us or the lock-up restrictions described below. We expect that the registration statement on Form S-8 will cover shares.
We have agreed with the underwriters not to dispose of or hedge any of our common stock, subject to specified exceptions, during the period from the date of this prospectus continuing through the date 180 days after the date of this prospectus, except with the prior written consent of the representatives of the underwriters. See “Underwriting.” Subject to these agreements, we may issue and sell in the future additional shares of common stock.
30
The market price of our common stock may be volatile, which could cause the value of your investment to decline.
Securities markets worldwide experience significant price and volume fluctuations. This market volatility, as well as general economic, market or political conditions, could reduce the market price of our common stock in spite of our operating performance. In addition, our operating results could be below the expectations of public market analysts and investors, and in response, the market price of our common stock could decrease significantly. You may be unable to resell your shares of our common stock at or above the initial public offering price.
Upon the listing of our shares on the , we will be a “controlled company” within the meaning of the rules of the and, as a result, will qualify for, and intend to rely on, exemptions from certain corporate governance requirements. You will not have the same protections afforded to shareholders of companies that are subject to such requirements.
Upon completion of this offering, JLL and DSM will enter into a shareholders agreement with us, pursuant to which each of JLL and DSM will be entitled to nominate a certain number of designees for election to our board of directors and will agree to vote in favor of each other’s nominees. As a result, we will be a “controlled company” under the rules of the . Under these rules, a company of which more than 50% of the voting power is held by an individual, group or another company is a “controlled company” and may elect not to comply with certain corporate governance standards, including the requirements that (i) a majority of our board of directors consist of independent directors and (ii) that our board of directors have compensation and nominating and corporate governance committees composed entirely of independent directors, as independence is defined in Rule 10A-3 of the Securities Exchange Act of 1934, as amended, which we refer to as the Exchange Act, and under the listing standards.
For at least some period following this offering, we intend to utilize these exemptions. As a result, although we will have a fully independent audit committee, immediately following this offering we do not expect that the majority of our directors will be independent. Accordingly, although we may transition to a board with a majority of independent directors prior to the time we cease to be a “controlled company,” for such period of time you will not have the same protections afforded to shareholders of companies that are subject to all of these corporate governance requirements. In the event that we cease to be a “controlled company” and our shares continue to be listed on the , we will be required to comply with these provisions within the applicable transition periods.
The obligations associated with being a public company will require significant resources and management attention, which will increase our costs of operations and may divert focus from our business operations.
As a result of this offering, we will become subject to the reporting requirements of the Exchange Act and the Sarbanes-Oxley Act of 2002, or Sarbanes-Oxley Act. The Exchange Act requires that we file annual, quarterly and current reports with respect to our business and financial condition. The Sarbanes-Oxley Act requires, among other things, that we establish and maintain effective internal controls and procedures for financial reporting. As a result, we will incur significant legal, accounting and other expenses that we did not previously incur. Once established, these controls may not achieve their intended objectives. Control processes that involve human diligence and compliance, such as our disclosure controls and procedures and internal control over financial reporting, are subject to lapses in judgment and breakdowns resulting from human failures. Controls can also be circumvented by collusion or improper management override. Because of such limitations, there are risks that material misstatements due to error or fraud may not be prevented or detected and that information may not be reported on a timely basis. If our controls are not effective, it could have a material adverse effect on our results of operations, financial condition, and market for our common stock, and could subject us to regulatory scrutiny.
Furthermore, the need to establish the corporate infrastructure demanded of a public company may divert management’s attention from implementing our growth strategy, which could prevent us from improving our business, results of operations and financial condition. We have made, and will
31
continue to make, changes to our internal controls and procedures for financial reporting and accounting systems to meet our reporting obligations as a stand-alone public company. However, the measures we take may not be sufficient to satisfy our obligations as a public company. In addition, we cannot predict or estimate the amount of additional costs we may incur in order to comply with these requirements.
We have identified a material weakness in our internal controls over financial reporting, and if we are unable to achieve and maintain effective internal control over financial reporting, this could have a material effect on our business.
Section 404 of the Sarbanes-Oxley Act requires management to make an annual assessment of the effectiveness of our internal control over financial reporting. In addition, a report by our independent registered public accounting firm on the effectiveness of our internal control over financial reporting will also be required. Effective internal controls over financial reporting are necessary for us to provide reliable financial reports and, together with adequate disclosure controls and procedures, are designed to prevent fraud or material error. Any failure to implement current internal controls or required new or improved controls, or difficulties encountered in their implementation could have a material adverse effect on our business and share price.
A material weakness is a deficiency, or a combination of deficiencies, in internal control over financial reporting such that there is a reasonable possibility that a material misstatement of our financial statements will not be prevented or detected on a timely basis. A significant deficiency is a deficiency, or a combination of deficiencies, in internal control over financial reporting that is less severe than a material weakness, yet important enough to merit attention by those responsible for oversight of our financial reporting.
In connection with the preparation of our consolidated financial statements for the year ended October 31, 2014, we identified a material weakness in our financial statement closing process. Specifically, a material adjustment was identified and recorded by management in order to properly state a restructuring accrual balance for our Venlo facility as of fiscal year-end. We have taken action to remediate this issue and will test the effectiveness of the remediation during our regular internal audit testing. However, if we do not successfully remediate this issue or if we fail to design and operate effective internal controls in the future, it could result in material misstatements in our financial statements, impair our ability to increase revenue, result in the loss of investor confidence in the reliability of our financial statements and subject us to regulatory scrutiny and sanctions, which in turn could harm the market value of our common stock.
In connection with the implementation of the necessary procedures and practices related to internal control over financial reporting, we may identify additional deficiencies that we may not be able to remediate in time to meet the deadline imposed by the Sarbanes-Oxley Act for compliance with the requirements of Section 404. Additionally, the existence of any future material weakness or significant deficiency, or the failure to remediate an existing material weakness or significant deficiency, requires management to devote substantial time and incur significant expense to remediate any such material weakness or significant deficiency and management may not be able to remediate any such material weaknesses or significant deficiency in a timely manner. Undetected material weaknesses in our internal controls could lead to financial statement restatements, which could have a material adverse effect on our business, financial condition and results of operations.
Provisions of our articles of association or Dutch corporate law might deter acquisition bids for us that might be considered favorable and prevent or frustrate any attempt to replace or remove our board.
Certain provisions of our articles of association may make it more difficult for a third party to acquire control of us or effect a change in our board. These provisions include: staggered three-year terms of our board members; a provision that our board may only be removed by the general meeting by a two-thirds majority of votes cast representing more than 50% of our outstanding share capital (unless the removal was proposed by the board); and a requirement that certain matters, including an amendment of our articles of association, may only be brought to our shareholders for a vote upon a proposal by our board that has been approved by our board.
32
Holders of our common stock outside The Netherlands may not be able to exercise preemptive rights.
In the event of an increase in our share capital, holders of our common stock are generally entitled under Dutch law to full preemptive rights, unless these rights are excluded either by a resolution of the general meeting, or by a resolution of the board (if the board has been designated by the general meeting for this purpose). See “Description of capital stock—Preemptive rights.” Certain holders of our common stock outside The Netherlands, in particular U.S. holders of our common stock, may not be able to exercise preemptive rights unless a registration statement under the Securities Act of 1933, as amended, or Securities Act, is declared effective with respect to our common stock issuable upon exercise of such rights or an exemption from the registration requirements is available.
Upon the consummation of this offering, we will be a Dutch public company with limited liability. The rights of our shareholders may be different from the rights of shareholders in companies governed by the laws of U.S. jurisdictions.
Upon the consummation of this offering, we will be a Dutch public company with limited liability (naamloze vennootschap). Our corporate affairs are governed by our articles of association and by the laws governing companies incorporated in The Netherlands. The rights of shareholders and the responsibilities of members of our board may be different from the rights and obligations of shareholders in companies governed by the laws of U.S. jurisdictions. In the performance of its duties, our board are required by Dutch law to consider the interests of our company, its shareholders, its employees and other stakeholders, in all cases with due observation of the principles of reasonableness and fairness. It is possible that some of these parties will have interests that are different from, or in addition to, your interests as a shareholder. See “Description of capital stock.”
We are not obligated to and do not comply with all of the best practice provisions of the Dutch Corporate Governance Code. This may affect your rights as a shareholder.
As a Dutch company we are subject to the Dutch Corporate Governance Code, or DCGC. The DCGC contains both principles and best practice provisions for boards, shareholders and general meetings, financial reporting, auditors, disclosure, compliance and enforcement standards. The DCGC is based on a “comply or explain” principle. Accordingly, public companies are required to disclose in their annual reports, filed in The Netherlands, whether they comply with the provisions of the DCGC. If they do not comply with those provisions (for example, because of a conflicting requirement), the company is required to give the reasons for such noncompliance. The DCGC applies to all Dutch companies listed on a government-recognized stock exchange, whether in The Netherlands or elsewhere. The principles and best practice provisions apply to our board (in relation to role and composition, conflicts of interest and independency requirements, board committees and remuneration), shareholders and the general meeting (for example, regarding anti-takeover protection and our obligations to provide information to its shareholders) and financial reporting (such as external auditor and internal audit requirements). We do not comply with all the best practice provisions of the DCGC. See “Description of capital stock—General meeting.” This may affect your rights as a shareholder and you may not have the same level of protection as a shareholder in a Dutch company that fully complies with the DCGC.
Our declaration of dividends is within the discretion of our board and subject to certain limitations under Dutch law, and there can be no assurance that we will pay dividends.
Our dividend policy is within the discretion of our board and will depend upon various factors, including our results of operations, financial condition, capital requirements and investment opportunities. We can provide no assurance that we will pay dividends on our common stock. No dividends on our common stock will accrue in arrears. In addition, Dutch law contains certain restrictions on a company’s ability to pay cash dividends, and we can provide no assurance that those restrictions will not prevent us from paying a dividend in future periods. See “Dividend policy.”
33
It may be difficult for you to obtain or enforce judgments against us or some of our executive officers and directors and some of our named experts in the United States or The Netherlands.
We were formed under the laws of The Netherlands. A significant portion of our assets are located outside the United States. As such, the rights of holders of our common stock and the civil liability of our directors will be governed by the laws of The Netherlands and our amended and restated articles of association and it may not be possible for investors to effect service of process within the United States upon such persons or to enforce against them or us in U.S. courts, including judgments predicated upon the civil liability provisions of the federal securities laws of the United States. Some of the named experts referred to in this prospectus are not residents of the United States and some of our directors and executive officers and some of our assets and some of the assets of our directors and executive officers are located outside the United States.
In the absence of an applicable convention between the United States and The Netherlands providing for the reciprocal recognition and enforcement of judgments (other than arbitration awards and divorce decrees) in civil and commercial matters, a judgment rendered by a court in the United States will not automatically be recognized by the courts of The Netherlands. In principle, the courts of The Netherlands will be free to decide, at their own discretion, if and to what extent a judgment rendered by a court in the United States should be recognized in The Netherlands. In general terms, Dutch courts will generally recognize and give effect to the judgment insofar as it finds that:
| • | the judgment was rendered by the foreign court that was (based on internationally accepted grounds) competent to take cognizance of the matter; |
| • | the judgment is the outcome of a proper judicial procedure (behoorlijke rechtspleging); |
| • | the judgment is not manifestly incompatible with the public policy (openbare orde) of The Netherlands; and |
| • | the judgment is not irreconcilable with a judgment of a Dutch court or an earlier judgment of a foreign court that is capable of being recognized in The Netherlands. |
Without prejudice to the above, in order to obtain enforcement of a judgment rendered by a United States court in The Netherlands, a claim against the relevant party on the basis of such judgment should be brought before the competent court of The Netherlands. During the proceedings such court will assess, when requested, whether a foreign judgment meets the above conditions. In the affirmative, the court may order that substantive examination of the matter shall be dispensed with. In such case, the court will confine itself to an order reiterating the foreign judgment against the party against whom it had been obtained.
Otherwise, a new substantive examination will take place in the framework of the proceedings. In all of the above situations, when applying the law of any jurisdiction (including The Netherlands), Dutch courts may give effect to the mandatory rules of the laws of another country with which the situation has a close connection, if and insofar as, under the law of the latter country, those rules must be applied regardless of the law applicable to the contract or legal relationship. In considering whether to give effect to these mandatory rules of such third country, regard shall be given to the nature, purpose and the consequences of their application or non-application. Moreover, a Dutch court may give effect to the rules of the laws of The Netherlands in a situation where they are mandatory irrespective of the law otherwise applicable to the documents or legal relationship in question. The application of a rule of the law of any country that otherwise would govern an obligation may be refused by the courts of The Netherlands if such application is manifestly incompatible with the public policy (openbare orde) of The Netherlands.
Under our amended and restated articles of association, we will indemnify and hold our officers and directors harmless against all claims and suits brought against them, subject to limited exceptions. Under our amended and restated articles of association, to the extent allowed by law, the rights and obligations among or between us, any of our current or former directors, officers and employees and any current or former shareholder will be governed exclusively by the laws of The Netherlands and subject to the jurisdiction of Dutch courts, unless those rights or obligations do not
34
relate to or arise out of their capacities listed above. Although there is doubt as to whether U.S. courts would enforce such provision in an action brought in the United States under U.S. securities laws, this provision could make judgments obtained outside of The Netherlands more difficult to have recognized and enforced against our assets in The Netherlands or jurisdictions that would apply Dutch law. Insofar as a release is deemed to represent a condition, stipulation or provision binding any person acquiring our common stock to waive compliance with any provision of the Securities Act or of the rules and regulations of the U.S. Securities and Exchange Commission, or SEC, such release will be void.
35
Cautionary note regarding forward-looking statements
This prospectus contains forward-looking statements, which reflect our current views with respect to, among other things, our operations and financial performance. You can identify these forward-looking statements by the use of words such as “outlook,” “believes,” “expects,” “potential,” “continues,” “may,” “will,” “should,” “seeks,” “approximately,” “predicts,” “intends,” “plans,” “estimates,” “anticipates” or the negative version of these words or other comparable words. Such forward-looking statements are subject to various risks and uncertainties. Accordingly, there are or will be important factors that could cause actual outcomes or results to differ materially from those indicated in these statements. These factors include, but are not limited to, those described under “Risk factors.” These factors should not be construed as exhaustive and should be read in conjunction with the other cautionary statements that are included in this prospectus. We undertake no obligation to publicly update or review any forward-looking statement, whether as a result of new information, future developments or otherwise, except as required by applicable law.
36
We estimate that the net proceeds from the sale of shares of our common stock that we are selling in this offering will be approximately $ , based on an initial public offering price of $ per share (which is the mid-point of the range on the cover of this prospectus), and after deducting underwriting discounts and commissions and estimated offering expenses payable by us. If the underwriters’ option to purchase additional shares from us is exercised in full, we estimate that we will receive additional net proceeds of approximately $ after deducting the estimated underwriting discounts and commissions and estimated offering expenses payable by us.
We intend to use approximately $ million of the net proceeds we receive from this offering to repay all or a portion of our Senior PIK Toggle Notes and pay related fees and expenses. The net proceeds from the offering of the Senior PIK Toggle Notes were used to pay a dividend of approximately $539.1 million to our shareholders and certain related transaction fees and expenses related to the offering of the Senior PIK Toggle Notes. The Senior PIK Toggle Notes mature on May 1, 2020 and the interest rate thereon is 8.75% per annum if interest is paid in cash or 9.50% per annum if interest is paid in the form of additional notes.
This expected use of net proceeds from this offering represents our intentions based upon our current plans and business conditions, which could change in the future as our plans and business conditions evolve. The amounts and timing of our actual expenditures may vary significantly depending on numerous factors, including any proposed acquisitions. As a result, our management will retain broad discretion over the uses of the net proceeds in this offering and, as of the date of this prospectus, we cannot specify with certainty all of the particular uses for the net proceeds.
We will not receive any proceeds from the sale of shares by the selling shareholders, including if the underwriters exercise their option to purchase additional shares from the selling shareholders.
A $1.00 increase (decrease) in the assumed initial public offering price per share would increase (decrease) the estimated net proceeds to us by approximately $ (or approximately $ if the underwriters exercise in full their option to purchase additional shares of common stock), assuming that the number of shares of common stock sold by us, as set forth on the cover page of this prospectus, remains the same and after deducting the underwriting discounts and commissions and estimated offering expenses payable by us. Similarly, each increase (decrease) of 100,000 shares in the number of shares of common stock offered by us would increase (decrease) the net proceeds to us from this offering by approximately $ , assuming that the assumed initial public offering price remains the same, and after deducting the underwriting discounts and commissions.
37
Following completion of this offering, our board of directors does not currently intend to pay dividends on our common stock. We intend to retain all available funds and any future earnings to fund the development and expansion of our business and debt service. Any future determination to pay dividends will be at the discretion of our board of directors and will depend upon a number of factors, including our results of operations, financial condition, future prospects, contractual restrictions, restrictions imposed by applicable law and other factors our board of directors deems relevant.
We can provide no assurance that we will pay dividends on our common stock. No dividends on our common stock will accrue in arrears.
Under Dutch law, we may only pay distributions if our shareholders’ equity (eigen vermogen) exceeds the sum of the paid-up and called-up share capital plus the reserves required to be maintained by Dutch law or by our articles of association. Pursuant to our articles of association our board of directors may decide that part of the profits realized during a financial year can be set aside to increase and/or constitute reserves. The part of the profits not so allocated to reserves is at the free disposal of the general meeting which can decide that a distribution of such profit be made. Interim distribution can be made pursuant to a resolution of our board of directors, subject to the limitations relating to payments of preferential dividends described above and legal restrictions.
Interim distribution can be made pursuant to a resolution of our board of directors, subject to the limitations relating to payments of preferential dividends described above and legal restrictions. Should it be determined that any distribution made was not permitted, the shareholders or any other person entitled to profits must repay the dividends declared to the extent such shareholder or person was or ought to have been aware that the distribution was not permitted.
38
The following table sets forth our cash and cash equivalents and capitalization as of January 31, 2015, as follows:
| • | on an actual basis; |
| • | on a pro forma basis to reflect the transactions described in “Unaudited pro forma consolidated financial information”; and |
| • | on a pro forma as adjusted basis to give effect to (i) the transactions described in “Unaudited pro forma consolidated financial information”; (ii) a $20.0 million U.S. dollar-denominated term loan and a €155.0 million euro-denominated term loan, or the Second Additional Term Loan Facilities, which were used to finance the IRIX Acquisition and for working capital and general corporate purposes; and (iii) the issuance and sale of common stock in this offering at an assumed initial public offering price of $ per share (the mid-point of the range on the cover of this prospectus) and the use of the proceeds therefrom received by us as described in “Use of proceeds,” after deducting underwriting discounts and commissions and estimated offering expenses payable by us. |
You should read this table in conjunction with the sections entitled “Unaudited pro forma consolidated financial information,” “Management’s discussion and analysis of financial condition and results of operations” and the historical financial statements and related notes included elsewhere in this prospectus.
As of January 31, 2015 |
|||||||||
| (in thousands, except share amounts) | Actual | Pro Forma | Pro Forma As Adjusted |
||||||
| Cash and cash equivalents | $ | 67.0 | $ | 60.1 | $ | ||||
| Long-term debt: |
|||||||||
| Term loan facilities(1)(2) | $ | 1,498.6 | $ | 1,498.6 | $ | ||||
| Revolving credit facility(3) | — | — | |||||||
| Senior unsecured notes(4) | 450.0 | 450.0 | |||||||
| Senior PIK Toggle Notes(5) | — | 550.0 | |||||||
| Other debt(6) | 20.3 | 20.3 | |||||||
| Total long-term debt | $ | 1,968.9 | $ | 2,518.9 | $ | ||||
| Equity: |
|||||||||
| Members’ deficit: |
|||||||||
| Membership interest | $ | 542.6 | $ | 542.6 | $ | ||||
| Common stock, €0.01 par value per share: nil shares authorized, issued and outstanding, actual; nil shares authorized, issued and outstanding, pro forma; shares authorized, shares issued and outstanding, pro forma as adjusted | — | — | |||||||
| Additional paid-in capital | — | — | |||||||
| Accumulated deficit | (898.2 | ) |
(1,437.3 | ) |
|||||
| Accumulated other comprehensive loss | (72.7 | ) |
(72.7 | ) |
|||||
| Total members’ deficit | $ | (428.3 | ) |
$ | (967.4 | ) |
$ | ||
| Total capitalization | $ | 1,540.6 | $ | 1,551.5 | $ | ||||
(1) The $1,330.0 million Initial Term Loan Facilities will mature on March 11, 2021 and are guaranteed on a senior secured basis by certain of our subsidiaries. Our Additional Term Loan Facilities will mature on March 11, 2021 and are issued or guaranteed on a senior secured basis by certain of our subsidiaries. The Additional Term Loan Facilities were fully drawn on September 29, 2014 and the proceeds and cash on hand were used to finance the Gallus Acquisition. The Additional Term Loan Facilities are comprised of a $160.0 million U.S. dollar-denominated term loan and a €70.0 million euro-denominated term loan. The Second Additional Term Loan Facilities will mature on March 11, 2021 and are guaranteed on a senior secured basis by certain of our subsidiaries. The Second
39
Additional Term Loan Facilities were fully drawn on March 31, 2015 and the proceeds were used to finance the IRIX Acquisition and for working capital and general corporate purposes. The Second Additional Term Loan Facilities comprise a $20.0 million U.S. dollar-denominated term loan and a €155.0 million euro-denominated term loan.
(2) Excludes original issue discount of $14.3 million.
(3) The $200.0 million Revolving Credit Facility will mature on March 11, 2019 and is issued or guaranteed on a senior secured basis by certain of our subsidiaries. As of January 31, 2015 we would have had $185.1 million available for borrowings thereunder (after giving effect to approximately $14.9 million of letters of credit that were outstanding as of January 31, 2015).
(4) Represents $450.0 million aggregate principal amount of 7.5% senior unsecured notes due 2022 issued by our wholly-owned subsidiary in February 2014.
(5) Our subsidiary issued $550.0 million aggregate principal amount of Senior PIK Toggle Notes on May 6, 2015.
(6) Other debt consists of loans arranged or provided by (i) the Italian government in an aggregate principal amount of $7.6 million and (ii) the Austrian government in an aggregate principal amount of $4.9 million, in each case to finance business activities in those countries as well as a non-interest bearing seller financing incurred by Gallus in an aggregate principal amount of $4.0 million. Also includes Austria and Bourgoin capital leases for building and equipment of $1.4 million and insurance premium financing of $2.4 million.
A $1.00 increase (decrease) in the assumed initial public offering price of $ per share, would increase (decrease) the as adjusted amount of each of cash and cash equivalents, additional paid-in capital, and total capitalization by approximately $ million and decrease total shareholders’ deficit by approximately $ million, assuming that the number of shares offered by us, as set forth on the cover page of this prospectus, remains the same and after deducting underwriting discounts and commissions and estimated offering expenses payable by us.
40
If you invest in our common stock, your interest will be diluted to the extent of the difference between the initial public offering price per share of our common stock and the pro forma net tangible book value per share of our common stock after this offering. Dilution results from the fact that the per share offering price of the common stock is substantially in excess of the book value per share attributable to the existing equityholders.
Our pro forma net tangible book as of , 2015 was approximately $ million, or $ per share of our common stock. Pro forma net tangible book value represents the amount of total tangible assets less total liabilities and pro forma net tangible book value per share represents pro forma net tangible book value divided by the number of shares of common stock outstanding.
After giving effect to the sale of shares of common stock in this offering at an assumed initial public offering price of $ per share (which is the mid-point of the range on the cover of this prospectus) our pro forma net tangible book value would have been $ million, or $ per share. This represents an immediate increase in net tangible book value (or a decrease in net tangible book deficit) of $ per share to existing equityholders and an immediate dilution in net tangible book value of $ per share to new investors.
The following table illustrates this dilution on a per share basis assuming the underwriters do not exercise their option to purchase additional shares:
| Assumed initial public offering price per share | $ | |||||
| Pro forma net tangible book value per share as of , 2015 | $ | |||||
| Increase in pro forma net tangible book value per share attributable to new investors in this offering | ||||||
| Pro forma net tangible book value per share after this offering | ||||||
| Dilution in pro forma net tangible book value per share to new investors in this offering | $ |
A $1.00 increase (decrease) in the assumed initial public offering price of $ per share would increase (decrease) our total pro forma tangible book value by $ million, or $ per share, assuming that the number of shares of common stock offered, as set forth on the cover of this prospectus, remains the same and after deducting the estimated underwriting discounts and offering expenses payable by us.
The following table summarizes, on the same pro forma basis as of , 2015, the total number of shares of common stock purchased from us, the total cash consideration paid to us and the average price per share paid by the existing equityholders and by new investors purchasing shares in this offering:
Shares Purchased |
Total Consideration |
Average Price Per Share |
|||||||||||||
Number |
% |
Amount |
% |
||||||||||||
| Existing equityholders | $ | $ | |||||||||||||
| New investors | |||||||||||||||
| Total | 100 | % |
$ | 100 | % |
$ | |||||||||
41
Unaudited pro forma consolidated financial information
The following unaudited pro forma consolidated statements of operations for the fiscal year ended October 31, 2014 of Patheon Holdings Coöperatief U.A. have been prepared to give effect to the DPP Acquisition on March 10, 2014 and the Gallus Acquisition on September 29, 2014 in accordance with Accounting Standards Codification, or ASC, 805 “Business Combinations,” or ASC 805, as if each transaction had been consummated on November 1, 2013, and after giving effect to the adjustments described in the notes to the pro forma financial statements. The unaudited pro forma consolidated statement of operations for the fiscal year ended October 31, 2014, the unaudited pro forma consolidated statement of operations for the three months ended January 31, 2015 and the unaudited pro forma consolidated balance sheet as of January 31, 2015 below also give effect to the sale of our Banner Pharmacap’s facility in Mexico, or Banner Mexico, on May 12, 2015 and the expected spin-off of the BLS business, which was approved by our Board of Directors on March 31, 2015. In addition, the unaudited pro forma consolidated statement of operations for the fiscal year ended October 31, 2014, the unaudited pro forma consolidated statement of operations for the three months ended January 31, 2015 and the unaudited pro forma consolidated balance sheet as of January 31, 2015 below give effect to the issuance and sale on May 7, 2015 of the Senior PIK Toggle Notes by our indirect subsidiary, the net proceeds from which were used to pay a dividend of $539.1 million to our shareholders and $10.9 million in certain related transaction fees and expenses related to the offering. The Senior PIK Toggle Notes will be repaid with a portion of the net proceeds from this offering. See “Use of proceeds.”
The pro forma financial statements do not purport to represent what our results of operations or financial position would have been if the DPP Acquisition, the Gallus Acquisition, the sale of Banner Pharmacaps, the spin-off of the BLS business or the issuance of the Senior PIK Toggle Notes and the application of proceeds therefrom had occurred on the dates indicated above, nor do they purport to project our results of operations or financial position for any future period or as of any future date. The historical financial data has been adjusted to give pro forma effect to events that are (1) directly attributable to the transactions, (2) factually supportable, and (3) with respect to the statements of operations, expected to have a continuing impact on the consolidated results. The pro forma financial statements do not reflect any anticipated synergies or dis-synergies, operating efficiencies or cost savings that may be achieved.
The unaudited pro forma consolidated statement of operations for the fiscal year ended October 31, 2014 was prepared by combining our audited consolidated statement of operations for the year ended October 31, 2014 with (i) the pro forma adjustments reflecting the results of DPP from November 1, 2013 to March 10, 2014, and (ii) with the pro forma adjustments reflecting the results of Gallus from November 1, 2013 through September 29, 2014. Because the consolidated financial statements of DPP were prepared in accordance with International Financial Reporting Standards, or IFRS, they are not directly comparable to our financial statements, which are prepared in accordance with Generally Accepted Accounting Principles in the United States, or U.S. GAAP. As a result, we have made adjustments to conform DPP’s consolidated financial statements with U.S. GAAP, as described in Note 3 below.
The unaudited consolidated pro forma financial statements are based upon assumptions and adjustments that we believe are reasonable. Such assumptions and adjustments are subject to change as future events materialize, and such changes may be material.
The unaudited pro forma consolidated financial statements should be read together with:
| • | the accompanying notes to the unaudited pro forma consolidated financial statements; |
| • | our audited historical consolidated financial statements and accompanying notes as of October 31, 2014 and 2013 and for the three years ended October 31, 2014, included elsewhere in this prospectus; |
| • | our unaudited historical consolidated financial statements and accompanying notes as of and for the three months ended January 31, 2015 and for the three months ended January 31, 2014, included elsewhere in this prospectus; |
42
| • | DPP’s separate audited historical consolidated financial statements and accompanying notes as of December 31, 2013 and 2012 and for the three years then ended, included elsewhere in this prospectus; and |
| • | Gallus’s separate unaudited historical consolidated financial statements and accompanying notes as of June 30, 2014 and for the six months ended June 30, 2014 and 2013, as well as Gallus’s separate audited consolidated financial statements and accompanying notes as of and for year ended December 31, 2013, included elsewhere in this prospectus. |
Unaudited pro forma consolidated statements of operations
Fiscal year ended October 31, 2014 |
||||||||||||||||||||||||
| (in millions of dollars) | Consolidated Patheon Holdings Coöperatief U.A.)(1) |
DPP Business (for the period from November 1, 2013 to March 10, 2014) |
Gallus (for the period from November 1, 2013 to September 29, 2014) |
Acquisition Related Adjustments |
Banner Mexico Disposition |
BLS Spin-off |
Debt Offering Adjustments |
Pro Forma Consolidated Patheon Holdings Coöperatief U.A. |
||||||||||||||||
| Revenues | $ | 1,704.8 | $ | 280.0 | $ | 66.7 | $ | — | $ | (34.4 | ) |
$ | (40.3 | ) |
$ | — | $ | 1,976.8 | ||||||
| Cost of goods sold (a)(b) | 1,281.2 | 272.4 | 64.7 | (15.3 | ) |
(26.3 | ) |
(1.5 | ) |
— | 1,575.2 | |||||||||||||
| Gross profit | 423.6 | 7.6 | 2.0 | 15.3 | (8.1 | ) |
(38.8 | ) |
— | 401.6 | ||||||||||||||
| Selling, general and administrative expenses (c)(d) | 261.5 | 13.5 | 7.0 | 12.8 | (9.2 | ) |
(13.3 | ) |
— | 272.3 | ||||||||||||||
| Research and development | 15.1 | 0.5 | — | — | (1.2 | ) |
(9.6 | ) |
— | 4.8 | ||||||||||||||
| Repositioning expenses | 53.5 | 1.4 | — | — | — | — | — | 54.9 | ||||||||||||||||
| Acquisition and integration costs (e) | 60.4 | — | — | (59.7 | ) |
(0.1 | ) |
— | — | 0.6 | ||||||||||||||
| Impairment charges | 22.1 | 185.9 | — | — | — | (5.4 | ) |
— | 202.6 | |||||||||||||||
| Gain on sale of fixed assets | (0.1 | ) |
— | — | — | — | — | — | (0.1 | ) |
||||||||||||||
| Operating income (loss) | 11.1 | (193.7 | ) |
(5.0 | ) |
62.2 | 2.4 | (10.5 | ) |
— | (133.5 | ) |
||||||||||||
| Interest expense, net (f) | 90.4 | 0.5 | 1.1 | 25.5 | 0.2 | — | 49.9 | 167.6 | ||||||||||||||||
| Foreign exchange loss, net | 8.7 | — | — | — | (0.1 | ) |
(0.2 | ) |
— | 8.4 | ||||||||||||||
| Refinancing expenses (f) | 28.2 | — | — | (28.2 | ) |
— | — | — | — | |||||||||||||||
| Other income, net | (1.1 | ) |
(0.2 | ) |
(0.6 | ) |
— | — | — | — | (1.9 | ) |
||||||||||||
| Loss from operations before income taxes (g) |
(115.1 | ) |
(194.0 | ) |
(5.5 | ) |
64.9 | 2.3 | (10.3 | ) |
(49.9 | ) |
(307.6 | ) |
||||||||||
| Provision for (benefit from) income taxes | 4.1 | (13.1 | ) |
(2.1 | ) |
21.8 | 0.4 | (3.8 | ) |
— | 7.3 | |||||||||||||
| Net loss | $ | (119.2 | ) |
$ | (180.9 | ) |
$ | (3.4 | ) |
$ | 43.1 | $ | 1.9 | $ | (6.5 | ) |
$ | (49.9 | ) |
$ | (314.9 | ) |
||
(1) Includes DPP Business and Gallus from the respective dates of acquisition. See “Prospectus summary—Formation of our Company”.
43
Three months ended January 31, 2015 |
||||||||||||||||||
| (in millions of dollars) | Consolidated Patheon Holdings Coöperatief U.A. |
Acquisition Related Adjustments |
Banner Mexico Disposition |
BLS Spin-off |
Debt Offering Adjustments |
Pro forma Consolidated Patheon Holdings Coöperatief U.A. |
||||||||||||
| Revenues | $ | 488.8 | $ | — | $ | (8.0 | ) |
$ | (8.2 | ) |
$ | — | $ | 472.6 | ||||
| Cost of goods sold | 352.4 | — | (5.7 | ) |
2.9 | — | 349.6 | |||||||||||
| Gross profit | 136.4 | — | (2.3 | ) |
(11.1 | ) |
— | 123.0 | ||||||||||
| Selling, general and administrative expenses | 77.2 | — | (1.8 | ) |
(3.5 | ) |
— | 71.9 | ||||||||||
| Research and development | 3.9 | — | (0.2 | ) |
(2.3 | ) |
— | 1.4 | ||||||||||
| Repositioning expenses | 17.8 | — | — | (1.0 | ) |
— | 16.8 | |||||||||||
| Acquisition and integration costs | 6.1 | (4.7 | ) |
— | — | — | 1.4 | |||||||||||
| Gain on sale of fixed assets | (0.1 | ) |
— | — | — | — | (0.1 | ) |
||||||||||
| Operating income (loss) | 31.5 | 4.7 | (0.3 | ) |
(4.3 | ) |
— | 31.6 | ||||||||||
| Interest expense, net | 28.0 | — | — | — | 12.5 | 40.5 | ||||||||||||
| Foreign exchange loss, net | 3.9 | — | 0.2 | — | — | 4.1 | ||||||||||||
| Other income, net | (0.1 | ) |
— | — | — | — | (0.1 | ) |
||||||||||
| Loss from operations before income taxes | (0.3 | ) |
4.7 | (0.5 | ) |
(4.3 | ) |
(12.5 | ) |
(12.9 | ) |
|||||||
| Provision for (benefit from) income taxes | 5.8 | 1.8 | — | (1.6 | ) |
— | 6.0 | |||||||||||
| Net loss | $ | (6.1 | ) |
$ | 2.9 | $ | (0.5 | ) |
$ | (2.7 | ) |
$ | (12.5 | ) |
$ | (18.9 | ) |
|
44
Unaudited pro forma consolidated balance sheet
As of January 31, 2015 |
|||||||||||||||
| (in millions of dollars) | Consolidated Patheon Holdings Coöperatief U.A. (a) |
Banner Mexico Disposition (b) |
BLS Spin-off (b) |
Debt Offering (c) |
Pro forma Consolidated Patheon Holdings Coöperatief U.A. |
||||||||||
| Assets |
|||||||||||||||
| Current |
|||||||||||||||
| Cash and cash equivalents | $ | 67.0 | $ | (3.7 | ) |
$ | (3.2 | ) |
$ | — | $ | 60.1 | |||
| Accounts receivable, net | 339.1 | (7.9 | ) |
(31.2 | ) |
— | 300.0 | ||||||||
| Inventories | 413.9 | (6.2 | ) |
(3.4 | ) |
— | 404.3 | ||||||||
| Income taxes receivable | 1.3 | (0.1 | ) |
— | — | 1.2 | |||||||||
| Prepaid expenses and other | 19.6 | (0.7 | ) |
(0.4 | ) |
— | 18.5 | ||||||||
| Deferred tax assets - short-term | 21.1 | (0.9 | ) |
— | — | 20.2 | |||||||||
| Current assets held for sale | — | 34.2 | 61.8 | — | 96.0 | ||||||||||
| Total current assets | 862.0 | 14.7 | 23.6 | — | 900.3 | ||||||||||
| Capital assets | 867.3 | (6.2 | ) |
(2.3 | ) |
— | 858.8 | ||||||||
| Intangible assets | 248.6 | (6.0 | ) |
(10.2 | ) |
— | 232.4 | ||||||||
| Deferred financing costs | 64.4 | — | — | 10.9 | 75.3 | ||||||||||
| Deferred tax assets | 3.1 | 0.4 | — | — | 3.5 | ||||||||||
| Goodwill | 166.8 | (2.7 | ) |
(11.1 | ) |
— | 153.0 | ||||||||
| Investments | 14.3 | — | — | — | 14.3 | ||||||||||
| Other long-term assets | 19.8 | (0.2 | ) |
— | — | 19.6 | |||||||||
| Total assets | $ | 2,246.3 | $ | — | $ | — | $ | 10.9 | $ | 2,257.2 | |||||
| Liabilities and members’ deficit |
|||||||||||||||
| Current |
|||||||||||||||
| Short-term borrowings | $ | 2.4 | $ | — | $ | — | $ | — | $ | 2.4 | |||||
| Accounts payable and accrued liabilities | 408.4 | (4.1 | ) |
(35.8 | ) |
— | 368.5 | ||||||||
| Income taxes payable | 4.5 | — | — | — | 4.5 | ||||||||||
| Deferred revenues - short-term | 103.8 | — | (0.5 | ) |
— | 103.3 | |||||||||
| Deferred tax liabilities - short-term | 1.1 | — | 1.1 | ||||||||||||
| Current portion of long-term debt | 23.3 | — | — | — | 23.3 | ||||||||||
| Current liabilities related to assets held for sale |
— | 5.5 | 41.5 | — | 47.0 | ||||||||||
| Total current liabilities | 543.5 | 1.4 | 5.2 | — | 550.1 | ||||||||||
| Long-term debt | 1,928.9 | — | — | 550.0 | 2,478.9 | ||||||||||
| Deferred revenues | 53.2 | — | (0.8 | ) |
— | 52.4 | |||||||||
| Deferred tax liabilities | 50.9 | (0.5 | ) |
(4.4 | ) |
— | 46.0 | ||||||||
| Other long-term liabilities | 98.1 | (0.9 | ) |
— | — | 97.2 | |||||||||
| Total liabilities | 2,674.6 | — | — | 550.0 | 3,224.6 | ||||||||||
| Commitments and contingencies |
|||||||||||||||
| Members’ deficit: |
|||||||||||||||
| Membership interest | 542.6 | — | — | — | 542.6 | ||||||||||
| Accumulated deficit | (898.2 | ) |
— | — | (539.1 | ) |
(1,437.3 | ) |
|||||||
| Accumulated other comprehensive loss | (72.7 | ) |
— | — | — | (72.7 | ) |
||||||||
| Total members’ deficit | (428.3 | ) |
— | — | (539.1 | ) |
(967.4 | ) |
|||||||
| Total liabilities and members’ deficit | $ | 2,246.3 | $ | — | $ | — | $ | 10.9 | $ | 2,257.2 | |||||
45
Notes to the unaudited pro form consolidated financial information
1. Pro forma adjustments to the unaudited consolidated statement of operations
The information included in the Patheon Holdings Coöperatief U.A. column reflects our historical statement of operations, prepared under U.S. GAAP and denominated in U.S. dollars, for the year ended October 31, 2014 and the three months ended January 31, 2015. The information included in the DPP column reflects its historical unaudited consolidated statement of operations for the period from November 1, 2013 through March 10, 2014, after the following adjustments:
| • | Adjustments to derive U.S. GAAP amounts under Patheon Holdings Coöperatief U.A. presentation from the historical statement of operations of DPP prepared under IFRS, as further described in Note 3. |
| • | Conversion of the statement of operations of DPP, as adjusted to U.S. GAAP, from euros to U.S. dollars at rates ranging from $1.33 to $1.37 U.S. dollars per euro. |
The historical financial information included in the Gallus column reflects its historical statement of operations prepared under U.S. GAAP and denominated in U.S. dollars for the period from November 1, 2013 to September 29, 2014.
The historical financial information in the BLS and Banner Mexico columns reflect their historical statements of operations prepared under U.S. GAAP and denominated in U.S. dollars for the fiscal year ended October 31, 2014, and the three months ended January 31, 2015.
The following adjustments were made to our consolidated fiscal 2014 and three months ended January 31, 2015 statements of operations which were prepared under U.S. GAAP and denominated in U.S. dollars:
| a. | Represents the reversal of fair value adjustments to inventory that was recorded in connection with the DPP purchase price allocation of $11.8 million, which was recorded as additional cost of goods sold within the statements of operations during the fiscal year ended October 31, 2014 as that inventory was sold during fiscal 2014. |
| b. | Represents a net $3.5 million reduction in cost of goods sold resulting from a net decrease in depreciation expense related to the fair value adjustments to the acquired property and equipment of the DPP Business of $4.0 million, net of an additional $0.5 million of depreciation expense resulting from the increase in carrying value for Gallus property and equipment as a result of the fair value adjustments recorded in purchase accounting. |
| c. | Represents the elimination of stock-based compensation and directors’ share unit expense of $5.1 million for fiscal 2014 related to the acceleration of vesting of Patheon Inc. stock options that occurred in connection with the DPP Acquisition offset by an increase in stock-based compensation expense of $8.5 million related to the management equity incentive plan, or MEIP. The Patheon Inc. stock option plan was terminated. |
| d. | Represents $9.4 million in additional amortization of identifiable intangible assets acquired in fiscal 2014 in connection with the DPP Acquisition and Gallus Acquisition. |
| e. | Represents the removal of acquisition-related costs incurred as a result of the DPP Acquisition and Gallus Acquisition for fiscal 2014 and the three months ended January 31, 2015. |
| f. | Represents the pro forma adjustments resulting from the DPP Acquisition and the Senior PIK Toggle Notes, which consist of the following: |
| • | An increase in interest expense and amortization of deferred borrowings/issuance costs of $44.4 million for fiscal 2014, related to the DPP Acquisition; |
| • | A decrease in interest expense and amortization of deferred issuance costs of $18.9 million for fiscal 2014 related to the debt extinguished in connection with the DPP Acquisition; |
46
| • | Removal of refinancing costs related to third-party and creditor fees expensed in connection with financing of the acquisitions; and |
| • | Addition of interest and amortization of deferred financing costs relating to the $550.0 million in Senior PIK Toggle Notes offered on May 6, 2015 of $49.9 million for fiscal 2014 and $12.5 million for the three months ended January 31, 2015. |
| g. | Represents the tax impact of the pro forma adjustments listed in (a) through (f) above, based upon the applicable statutory rates by jurisdictions unless that jurisdiction was in a full valuation allowance position in which case there is no assumed tax impact. |
2. Pro forma adjustments to the unaudited consolidated balance sheet
| a. | The January 31, 2015 historical balance sheet for Patheon Holdings Cooperatief U.A. includes the financial position of DPP and Gallus prepared under U.S. GAAP and denominated in U.S. dollars. |
| b. | Reflects the amounts of assets and liabilities expected to be reclassified to assets and liabilities held for sale at cost or to be spun off and excluded from subsequent results. The assets held for sale are classified as short-term since the Banner Mexico disposition was completed on May 12, 2015 and the BLS spin-off transaction is expected to be completed within a twelve-month period. |
| c. | Represents the $550.0 million in Senior PIK Toggle Notes due 2020 issued on May 6, 2015 along with transaction costs of $10.9 million and the use of $539.1 million to pay a dividend to the parent company as if they had occurred on January 31, 2015. |
3. U.S. GAAP adjustments to unaudited DPP historical financial statements
| (in millions of dollars) | DPP Business for the period from November 1, 2013 through March 10, 2014 IFRS |
U.S. GAAP and Reclassification Adjustments for the period from November 1, 2013 through March 10, 2014 |
DPP Business for the period from November 1, 2013 through March 10, 2014 U.S. GAAP |
||||||
| Revenue (a)(e) | $ | 284.3 | $ | (4.3 | ) |
$ | 280.0 | ||
| Cost of goods sold (a)(e)(f)(g) | 474.1 | (201.7 | ) |
272.4 | |||||
| Gross profit | (189.8 | ) |
197.4 | 7.6 | |||||
| Selling, general and administrative expenses (g)(j) | 5.2 | 8.3 | 13.5 | ||||||
| Research and development | 0.5 | — | 0.5 | ||||||
| Repositioning expenses (b) | — | 1.4 | 1.4 | ||||||
| Impairment charges (f) | — | 185.9 | 185.9 | ||||||
| Operating loss | (195.5 | ) |
1.8 | (193.7 | ) |
||||
| Interest expense (income), net (d)(h) | 4.9 | (4.4 | ) |
0.5 | |||||
| Other (income) expense, net (c) | 1.1 | (1.3 | ) |
(0.2 | ) |
||||
| Loss from continuing operations before income taxes | (201.5 | ) |
7.5 | (194.0 | ) |
||||
| (Benefit from) provision for income taxes (j) | (14.9 | ) |
1.8 | (13.1 | ) |
||||
| Net loss | $ | (186.6 | ) |
$ | 5.7 | $ | (180.9 | ) |
|
47
The information in the above table illustrates the conversion of the DPP statement of operations for the period from November 1, 2013 through March 10, 2014 from IFRS to U.S. GAAP. The DPP statement of operations for the period was converted from euros into U.S. dollars at rates ranging from $1.33 to $1.37 U.S. dollars per euro. The information included in the “U.S. GAAP and Reclassification Adjustments for the period from November 1, 2013 through March 10, 2014” column reflects the following adjustments:
| • | Adjustments to derive U.S. GAAP amounts from the historical statement of operations, prepared under IFRS, which include the following: |
| a. | Under IFRS, DPP recognized revenue on certain transactions subject to bill-and-hold arrangements. Under U.S. GAAP, the criterion to recognize revenue on such transactions is more restrictive. As such, revenue was added to this period for U.S. GAAP reporting purposes when it was recorded in prior periods under IFRS. The impact was an increase to revenues of $3.1 million and an increase in cost of goods sold of $2.7 million for the period from November 1, 2013 through March 10, 2014. |
| b. | Under IFRS, DPP recognized certain restructuring costs upfront at the time of approval whereas the timing of the recognition of certain elements of these costs should be recording during the period from November 1, 2013 through March 10, 2014 under U.S. GAAP. As such, restructuring expenses were added to this period for U.S. GAAP whereas it was recorded in prior periods under IFRS. |
| c. | Represents the following components: |
| • | The elimination of amortization recorded for certain internally developed intangible assets held by an equity method investee of DPP, net of tax, of $0.9 million for the period from November 1, 2013 through March 10, 2014. Under IFRS, DPP capitalized development costs related to certain internally developed intangible assets and amortized such assets over their estimated useful lives. Under U.S. GAAP, such costs are expensed as incurred. |
| • | The reclassification of other expense, net to benefit from income taxes of $0.4 million for the fiscal 2014. Under IFRS, DPP presented the expense from income taxes related to an investment in an unconsolidated subsidiary in ‘Other expense, net.’ Under U.S. GAAP, such income tax expense must be presented in the benefit from income taxes within the statement of operations. |
| d. | Under IFRS, all actuarial gains and losses are recognized in the statement of comprehensive income as they occur and the accumulated balance remains in the equity portion of the balance sheet; as such the gains/losses do not impact our profits and losses. In accordance with U.S. GAAP and our accounting policies, a portion of the gains/losses deferred in accumulated other comprehensive income was amortized to the profits and losses, in accordance with the accounting prescribed by the “corridor” approach. |
| e. | Related to the reclassification of revenues from the sale of steam from revenues to cost of goods sold as this item is a reimbursement of costs from a shared DPP manufacturing facility rather than a part of Patheon Holdings Coöperatief U.A.’s core business. The impact of this reclassification was approximately $7.4 million for the period from November 1, 2013 through March 10, 2014. |
| f. | Related to the reclassification of the December 2013 impairment of goodwill and capital assets totaling $185.9 million from cost of goods sold to impairment charges on the statement of operations for fiscal 2014. |
| g. | Related to the reclassification of certain costs such as site costs for operating their information technology, finance and human resources departments from cost of goods sold to selling, general and administrative expenses to comply with Patheon Holdings Coöperatief U.A. policy. The impact was approximately $11.1 million for the period from November 1, 2013 through March 10, 2014. |
48
| h. | Adjustment to remove interest on intercompany debt with DSM that was not acquired as a result of the DPP Acquisition. |
| i. | Relates to a reimbursement of certain restructuring charges by DSM of $2.8 million during the period November 1, 2013 through March 10, 2014. |
| j. | Represents the impact of the pro forma adjustments listed above on the provision for income taxes for the period from November 1, 2013 through March 10, 2014 based on various statutory rates. |
49
Selected consolidated historical financial data
The following table presents our selected consolidated historical financial data as of the dates and for the periods presented. The selected consolidated historical financial data as of October 31, 2014 and 2013 and for the years ended October 31, 2014, 2013 and 2012 have been derived from our consolidated financial statements included elsewhere in this prospectus. From an accounting standpoint, Patheon Inc. was the acquirer and as such all financial information prior to March 11, 2014 is related to Patheon Inc. The balance sheet data as of January 31, 2014, October 31, 2012, 2011 and 2010 and the statement of operations data for the years ended October 31, 2011 and 2010 are derived from consolidated financial statements not included in this prospectus. The selected consolidated historical financial statements as of January 31, 2015 and for the three months ended January 31, 2015 and 2014 are derived from our interim consolidated financial statements included elsewhere in this prospectus. We have prepared our interim consolidated financial statements on the same basis as our annual consolidated financial statements and, in our opinion, have included all adjustments, which include only normal recurring adjustments, necessary to present fairly in all material respects our financial position and results of operations. The results for any interim period are not necessarily indicative of the results that may be expected for the full year. Additionally, our historical results are not necessarily indicative of the results expected for any future period.
You should read this information together with the information included under the headings “Risk factors,” “Capitalization,” “Unaudited pro forma consolidated financial information,” “Management’s discussion and analysis of financial condition and results of operations” and the consolidated financial statements and related notes included elsewhere in this prospectus.
We were incorporated in The Netherlands on December 24, 2013, in the form of a Dutch cooperative with excluded liability for its members (coöperatie met uitgesloten aansprakelijkheid), by a partnership between JLL and DSM in connection with the acquisition of Patheon Inc., a Canadian company listed on the Toronto Stock Exchange, for approximately $1.4 billion in cash. Following the DPP Acquisition, which was consummated on March 11, 2014, Patheon Inc. and DPP became our wholly owned indirect subsidiaries. From an accounting standpoint, Patheon Inc. was the acquirer and as such all financial information prior to March 11, 2014 is related to Patheon Inc.
Three months ended January 31, |
Year ended October 31, |
||||||||||||||||||||
| (in millions of dollars) | 2015 | 2014 | 2014 | 2013 | 2012 | 2011 | 2010 | ||||||||||||||
| Statement of operations data: |
|||||||||||||||||||||
| Revenues | $ | 488.8 | $ | 262.2 | $ | 1,704.8 | $ | 1,019.7 | $ | 748.0 | $ | 697.6 | $ | 668.7 | |||||||
| Cost of goods sold | 352.4 | 197.5 | 1,281.2 | 772.0 | 589.1 | 566.4 | 533.7 | ||||||||||||||
| Gross profit | 136.4 | 64.7 | 423.6 | 247.7 | 158.9 | 131.2 | 135.0 | ||||||||||||||
| Selling, general and administrative expenses | 77.2 | 46.3 | 261.5 | 163.6 | 128.6 | 120.2 | 110.6 | ||||||||||||||
| Research and development | 3.9 | 2.8 | 15.1 | 10.9 | — | — | — | ||||||||||||||
| Repositioning expenses(1) | 17.8 | 0.7 | 53.5 | 15.8 | 6.1 | 7.0 | 6.8 | ||||||||||||||
| Acquisition and integration costs(2) | 6.1 | 4.9 | 60.4 | 13.1 | 3.2 | — | — | ||||||||||||||
| Impairment charge(3) | — | — | 22.1 | 13.1 | 57.9 | — | 3.6 | ||||||||||||||
| (Gain) loss on sale of capital assets | (0.1 | ) |
(0.4 | ) |
(0.1 | ) |
(1.3 | ) |
0.4 | 0.2 | 0.2 | ||||||||||
| Operating income (loss) | 31.5 | 10.4 | 11.1 | 32.5 | (37.3 | ) |
3.8 | 13.8 | |||||||||||||
| Interest expense, net | 28.0 | 12.9 | 90.4 | 47.8 | 26.5 | 25.6 | 19.6 | ||||||||||||||
| Foreign exchange loss (gain), net | 3.9 | 1.2 | 8.7 | 0.8 | 0.5 | (1.6 | ) |
(1.5 | ) |
||||||||||||
| Refinancing expenses(4) | — | — | 28.2 | 27.3 | — | — | 12.2 | ||||||||||||||
| Other income, net | (0.1 | ) |
(1.4 | ) |
(1.1 | ) |
(2.0 | ) |
(1.3 | ) |
(5.4 | ) |
(0.8 | ) |
|||||||
| Loss from continuing operations before income taxes | (0.3 | ) |
(2.3 | ) |
(115.1 | ) |
(41.4 | ) |
(63.0 | ) |
(14.8 | ) |
(15.7 | ) |
|||||||
| Provision for (benefit from) income taxes | 5.8 | 1.3 | 4.1 | (5.5 | ) |
43.7 | 1.3 | (13.8 | ) |
||||||||||||
| Loss from continuing operations | (6.1 | ) |
(3.6 | ) |
(119.2 | ) |
(35.9 | ) |
(106.7 | ) |
(16.1 | ) |
(1.9 | ) |
|||||||
| Loss from discontinued operations | — | — | — | (0.2 | ) |
(0.3 | ) |
(0.6 | ) |
(1.7 | ) |
||||||||||
| Net loss | $ | (6.1 | ) |
$ | (3.6 | ) |
$ | (119.2 | ) |
$ | (36.1 | ) |
$ | (107.0 | ) |
$ | (16.7 | ) |
$ | (3.6 | ) |
50
January 31, |
October 31, |
||||||||||||||||||||
| (in millions of dollars) | 2015 | 2014 | 2014 | 2013 | 2012 | 2011 | 2010 | ||||||||||||||
| Balance sheet data: |
|||||||||||||||||||||
| Cash and cash equivalents | $ | 67.0 | $ | 45.8 | $ | 84.6 | $ | 61.6 | $ | 39.4 | $ | 33.4 | $ | 53.5 | |||||||
| Total assets | 2,246.3 | 1,039.1 | 2,369.3 | 1,077.1 | 746.0 | 823.2 | 814.0 | ||||||||||||||
| Total liabilities | 2,674.6 | 935.0 | 2,761.7 | 952.5 | 618.3 | 586.8 | 566.0 | ||||||||||||||
| Total members’ (deficit) / shareholders’ equity | (428.3 | ) |
104.1 | (392.4 | ) |
124.6 | 122.7 | 236.4 | 248.0 | ||||||||||||
(1) Repositioning expenses, which include employee severance and contract cancellation costs, were incurred in connection with the DPP Acquisition, Banner Acquisition, closure of the Caguas, Puerto Rico, Olds, Alberta, Canada and Venlo, The Netherlands facilities, the reduction of workforce at our Swindon facility in the U.K. and other operational initiatives throughout the network.
(2) Acquisition and integration costs reflect those incurred in connection with the Banner Acquisition, the DPP Acquisition, the Gallus Acquisition and the recently completed IRIX Acquisition and Agere Acquisition.
(3) Asset impairment charges were associated with closure of the Olds, Alberta, Canada facility that was acquired as part of the Banner Acquisition and the write-off of certain in process research and development projects acquired in the Banner Acquisition as well as the winding down of production and PDS in our Swindon, U.K. facilities. The 2014 asset impairment charges are associated with the Capua, Italy facility as well as additional in process research and development projects acquired in the Banner Acquisition.
(4) Refinancing expenses were incurred in connection with the Banner Acquisition completed in December 2012 and related debt and equity financings as well as the DPP Acquisition and Gallus Acquisition in 2014 and the related debt refinancing.
51
Management’s discussion and analysis of financial condition
and results of operations
The following discussion and analysis of our financial condition and results of operations should be read in conjunction with our “Selected historical financial data” and our historical financial statements and related notes included elsewhere in this prospectus. This discussion contains forward-looking statements that involve risks and uncertainties. Our actual results could differ materially from the forward-looking statements below. Factors that could cause or contribute to such differences include, but are not limited to, those identified below and those discussed in the section entitled “Risk factors” and elsewhere in this prospectus.
Overview
Our company
Patheon is a leading global provider of outsourced pharmaceutical development and manufacturing, or CDMO, services. We provide a comprehensive, integrated and highly customizable range of active pharmaceutical ingredient, or API, and finished drug product services to our customers, from formulation development to clinical and commercial-scale manufacturing, packaging, and lifecycle management. Our services address both small molecule and large molecule biological drugs. We are the only end-to-end integrated provider of such services, which, combined with our scientific and regulatory expertise and specialized capabilities, allows our customers to partner with a single outsourced provider to address their most complex development and manufacturing needs. We believe we have the broadest technological capabilities in our industry, across the full spectrum of development and manufacturing, to support our end-to-end integrated platform.
We believe we are a critical partner for our customers who increasingly rely on our customized formulation, development and manufacturing expertise to address growing drug complexity, cost pressures and regulatory scrutiny. We partner with many of our customers early in the drug development process, providing us the opportunity to continue to expand our relationship as molecules progress through the clinical phase and into commercial manufacturing. This results in long-term relationships with our customers and a recurring revenue stream. We believe our breadth of services, reliability and scale addresses our customers’ increasing need to outsource and desire to reduce the number of supply chain partners while maintaining a high quality of service.
We currently operate in four reportable business segments:
| • | Drug Product Services, or DPS, which provides manufacturing and packaging for approved prescription, OTC, and nutritional products and accounted for 60% of our total revenues in fiscal 2014. |
| • | Pharmaceutical Development Services, or PDS, which provides a wide spectrum of advanced formulation, production and technical services from the early stages of a product’s development to regulatory approval and beyond, as well as for new formulations of approved products for lifecycle extension and accounted for 10% of our total revenues in fiscal 2014. |
| • | Drug Substance Services, or DSS, which provides development and manufacturing for the biologically active component of a pharmaceutical product from early development through commercial production and accounted for 11% of our total revenues in fiscal 2014. |
| • | DPx Fine Chemicals, or DFC, which provides synthesis services to customers in the agricultural chemical industry and maleic anhydride and many specialty esters used in a broad range of industries and specialty products. Our DFC segment generated revenues of $167.8 million and accounted for 10% of our total revenues in fiscal 2014. |
We include in “Other” our Biosolutions business, which produces a variety of microorganisms and anti-infective, enzyme, and pharmaceutical protein products and our Banner Life Sciences, or BLS, business, our proprietary products business. Since the completion of the DPP Acquisition in the second quarter of fiscal 2014, the Biosolutions business has experienced a reduction in customer
52
contracts that we expect to result in a reduction in revenues going forward, and we are considering new strategic options for the Biosolutions business, including selling the business. In Addition, on March 31, 2015, our board of directors approve a spin-off of the BLS business.
We employ approximately 8,700 people, including 634 scientists, at more than 25 locations in the U.S., Canada, Europe, Australia, Japan and China. For the year ended October 31, 2014, our reported revenues were $1.7 billion. In fiscal 2014, approximately 56%, 36% and 2% of our revenues were attributable to the United States, Europe and Canada, respectively.
In early 2011, James C. Mullen, who was previously the Chief Executive Officer of Biogen Idec Inc., one of the world’s largest biotech companies, joined Patheon Inc., a Canadian company listed on the Toronto Stock Exchange, as Chief Executive Officer, and assembled a leadership team that brought extensive pharmaceutical and healthcare sector experience, as well as a customer perspective to our business. Over the last four years, we have transformed our business into a global, end-to-end integrated platform, and significantly enhanced our operating performance and growth potential. We made substantial investments in a broad range of technologies that provide our customers advanced development services, and operations systems that enable us to execute customer projects on-time and on-budget, while maintaining excellence in quality. As a result, we have positioned our business to meet the rapidly evolving development and manufacturing needs of our customers while continuing to deliver strong financial performance.
We were incorporated in The Netherlands on December 24, 2013, in the form of a Dutch cooperative with excluded liability for its members (coöperatie met uitgesloten aansprakelijkheid), by a partnership between JLL and DSM in connection with the acquisition of Patheon Inc., a Canadian company listed on the Toronto Stock Exchange, for approximately $1.4 billion in cash. In connection with the acquisition, which we refer to collectively with the related financing as of the DPP Acquisition, DSM agreed to contribute its pharmaceutical business, or DPP, to us, JLL agreed to contribute, among other things, approximately $400 million in cash to us and certain employees of JLL and members of our management invested more than $90 million in our Company. Following the DPP Acquisition, which was consummated on March 11, 2014, Patheon Inc. and DPP became our wholly owned indirect subsidiaries.
In addition to the DPP Acquisition, since 2011 we acquired various companies to enhance our end-to-end integrated service offerings:
| • | On March 31, 2015, we acquired IRIX Pharmaceuticals, Inc., or IRIX, a company that specializes in difficult-to-manufacture active pharmaceutical ingredient needs for drugs from early and late development stages through commercial manufacturing, which enhances our service offerings in the DSS segment, for an aggregate purchase price of approximately $160.6 million, which we refer to as the IRIX Acquisition. We funded the purchase price through equity and the raising of additional debt. |
| • | On March 20, 2015, we acquired Agere Pharmaceuticals, Inc., or Agere, a recognized leader in complex solubility technology, to expand our early stage pharmaceutical development capabilities, which enhances our service offerings in the PDS segment, for an aggregate purchase price of approximately $26 million, which we refer to as the Agere Acquisition. We funded the purchase price through the use of available cash and equity. |
| • | On September 29, 2014, we acquired Gallus BioPharmaceuticals, LLC, or Gallus, a leading contract manufacturing company specializing in biologics, which enhances our service offerings in the DSS segment, for a cash purchase price of $259.1 million, which we refer to as the Gallus Acquisition. The Gallus Acquisition is a strategic acquisition that will further support the needs of our customers by providing flexibility, leading technology solutions, commercial operations and an expanded footprint with two U.S. sites. |
| • | On December 14, 2012, we acquired Sobel USA Inc., a Delaware corporation, and Banner Pharmacaps Europe B.V., a private limited company organized under the laws of The Netherlands, or collectively Banner, for a net aggregate cash purchase price of approximately $269.0 million |
53
which we refer to as the Banner Acquisition. The Banner Acquisition enhanced our PDS segment product development capabilities with soft gel formulation technology and our DPS segment manufacturing platform with softgel manufacturing capabilities.
We plan to continue to evaluate and pursue strategic investments and acquisitions to support expanding customer needs, complement our existing platform and broaden our capabilities in high value-added product and services offerings in response to market demand.
In addition, we streamlined and rationalized our business:
| • | On May 12, 2015, we sold Banner Mexico, which manufactures softgel OTC products. |
| • | On March 31, 2015, our board of directors approved a spin-off of the BLS business. |
| • | We have certain Transition Services Agreements, or the TSAs, with DSM resulting from the DPP Acquisition whereby DSM performs certain shared service functions on our behalf. In December 2014 we decided not to extend a majority of the service agreements covered by the TSAs beyond December 31, 2014. This triggered an €11.4 million expense for termination costs and an additional €2.1 million expense associated with certain R&D contracts and other costs associated with the service agreement transition. A total of €13.5 million ($16.3 million) was recognized during the three months ended January 31, 2015. |
| • | On July 2, 2014, we closed our facility in Venlo, The Netherlands and transferred any remaining business to other DFC facilities. Because the business in the Venlo facility is being transferred within the existing site network, its results of operations will be included in continuing operations in the consolidated financial statements. |
| • | We completed the consolidation of our Caguas operations into Manati during the first quarter of fiscal 2014 and vacated the Caguas facility as of January 31, 2014. Because the business in the Caguas facility transferred within the existing site network, its results of operations are included in continuing operations in the consolidated financial statements. |
| • | At the end of fiscal 2013, we closed the Olds, Alberta, Canada facility that was acquired as part of the Banner Acquisition and sold the facility to a third party on November 1, 2013. |
| • | In 2012, we announced a plan of termination to reduce our workforce across our global operations, which primarily consisted of headcount reductions associated with the transfer of the PDS and non-cephalosporin commercial production from our Swindon, U.K. facility to other facilities along with additional repatriation of other commercial contracts from the facility. |
As a result of the rationalization and streamlining of our business described above and other initiatives, we incurred repositioning expenses, and impairment charges of $17.8 million in the first quarter of fiscal 2015 and $75.6 million, $28.9 million and $64.0 million in fiscal 2014, 2013 and 2012 respectively. Currently, we do not anticipate any additional material repositioning expenses to be incurred.
Factors impacting our results of operations
Operational Excellence
Since 2011, we have implemented a series of continuous improvement projects as part of our company-wide operational excellence program, or OE Program, to enhance our manufacturing and operational processes. Our OE Program is deeply ingrained in our corporate culture and significantly reduces production costs, improves productivity of our operating assets and employees, and drives an industry-leading customer experience. In addition, our OE Program serves as a critical tool to rapidly and seamlessly integrate acquired businesses and achieve cost synergies. Our OE Program is centered on a commitment to delivering services and products to our customers RFT and OTD, which in turn drives customer retention and new business wins. This has directly improved our operating performance, increased our capacity within our existing facility network and enhanced our operating efficiencies, which has resulted in enhanced operating margins.
54
Opportunities and trends
Our target markets include the highly fragmented global markets for the manufacture of finished pharmaceutical dosage forms, pharmaceutical development services, chemical API manufacturing, biologic pharmaceutical contract manufacturing, and crop protection and chemical industries. The outsourcing of product development by the pharmaceutical industry is an important driver of growth in our business. In 2014, the pharmaceutical industry spent approximately $140 billion on formulation, development and manufacturing, according to Evaluate Pharma, and approximately $40 billion is expected to be outsourced to CDMOs such as Patheon in 2015, according to Root Analysis. Currently, only 25-30% of pharmaceutical industry spending on formulation, development and manufacturing is outsourced, and in the future it is expected that our customer base will expand the use of outsourcing to CDMOs because of changing industry dynamics, driving growth of our market. Industry resources indicate that the outsourced pharmaceutical manufacturing market is expected to grow at approximately 7-8% annually. We believe the market for products requiring specialized capabilities (e.g., sterile production, solubility solutions) is growing at a higher rate than the overall market. Furthermore, 60% to 90% of all new compounds entering development will require specialized manufacturing and/or molecular profile modification, according to industry research. According to Boston Consulting Group, a global management consulting firm and advisor on business strategy, the API small molecule market for chemical API manufacturing totaled approximately €20.0 billion in 2012 and may experience growth of approximately 7.9% annually through 2016. According to Datamonitor, a business intelligence information provider, the API large molecule market for biologics pharmaceutical contract manufacturing totaled approximately €1.9 billion in 2012 and may experience growth of approximately 9.4% annually through 2017. According to Phillips McDougal, an agrochemical and petrochemical industry market data provider, the market for crop protection/chemical industries totaled approximately €7.1 billion in 2012 and may experience growth of 2.6% to 5% annually through 2017.
Results of operations
Three months ended January 31, 2015 compared to three months ended January 31, 2014
The following table summarizes the consolidated historical results of operations of our Company for the three months ended January 31, 2015 and January 31, 2014. From an accounting standpoint, Patheon Inc. was the acquirer and as such all financial information prior to March 11, 2014 is related to Patheon Inc.
Three months ended January 31, |
||||||||||||
| (in millions of dollars) | 2015 | 2014 | Change ($) | Change (%) | ||||||||
| Revenues | 488.8 | 262.2 | 226.6 | 86.4 | ||||||||
| Cost of goods sold | 352.4 | 197.5 | 154.9 | 78.4 | ||||||||
| Gross profit | 136.4 | 64.7 | 71.7 | 110.8 | ||||||||
| Selling, general and administrative expenses | 77.2 | 46.3 | 30.9 | 66.7 | ||||||||
| Research and development | 3.9 | 2.8 | 1.1 | 39.3 | ||||||||
| Repositioning expenses | 17.8 | 0.7 | 17.1 | nm | * |
|||||||
| Acquisition and integration costs | 6.1 | 4.9 | 1.2 | 24.5 | ||||||||
| Gain on sale of capital assets | (0.1 | ) |
(0.4 | ) |
0.3 | (75.0 | ) |
|||||
| Operating income | 31.5 | 10.4 | 21.1 | 202.9 | ||||||||
| Interest expense, net | 28.0 | 12.9 | 15.1 | 117.1 | ||||||||
| Foreign exchange loss, net | 3.9 | 1.2 | 2.7 | 225.0 | ||||||||
| Other income, net | (0.1 | ) |
(1.4 | ) |
1.3 | (92.9 | ) |
|||||
| Loss before income taxes | (0.3 | ) |
(2.3 | ) |
2.0 | (87.0 | ) |
|||||
| Provision for income taxes | 5.8 | 1.3 | 4.5 | 346.2 | ||||||||
| Net loss | (6.1 | ) |
(3.6 | ) |
(2.5 | ) |
69.4 | |||||
*not meaningful
Operating income summary
Revenues for the three months ended January 31, 2015 increased $226.6 million, or 86.4%, to $488.8 million, from $262.2 million for the three months ended January 31, 2014. On a constant
55
currency basis revenue increased $238.3 million, or 90.9% quarter over quarter. DPS revenues for the three months ended January 31, 2015 increased $90.5 million, or 42.3%, to $304.3 million, from $213.8 million for the three months ended January 31, 2014 as a result of revenue growth across legacy Patheon sites, and $71.1 million from the DPP Acquisition. PDS revenues for the three months ended January 31, 2015 increased $5.4 million, or 13.8%, to $44.5 million, from $39.1 million for the three months ended January 31, 2014. DSS and DFC revenues for the three months ended January 31, 2015 were $76.9 million and $50.5 million, respectively both as a result of the DPP Acquisition. Other revenue for the three months ended January 31, 2015, which includes the company’s BLS and Biosolutions business, increased $10.3 million or 31.7% to $42.8 million from $32.5 million for the three months ended January 31, 2014 primarily through incremental BLS revenue. The results above include approximately $30.2 million of intercompany revenue between DPS and BLS.
Gross profit for the three months ended January 31, 2015 increased $71.7 million, or 110.8%, to $136.4 million, from $64.7 million for the three months ended January 31, 2014. The increase in gross profit was primarily due to higher volumes and an increase in margin from 24.7% for the three months ended January 31, 2014 to 27.9% for the three months ended January 31, 2015. Legacy Patheon margin of 33.7% was 7.9 points better than the margin for the three month period ended January 31, 2014. The increase in gross profit margin was driven by higher volumes, and savings from our operational excellence initiatives, partially offset by an unfavorable foreign exchange impact of $0.7 million. The DPP Business contributed approximately $39.0 million in gross margin for the three months ended January 31, 2015.
Selling, general and administrative expenses for the three months ended January 31, 2015 increased $30.9 million, or 66.7%, to $77.2 million, from $46.3 million for the three months ended January 31, 2014. Selling, general and administrative expenses were higher primarily due to several factors such as the DPP Business and Gallus selling, general and administrative costs of $24.4 million, higher stock based compensation as a result of the management equity incentive plan grants of $3.3 million, higher intangible assets amortization $4.6 million, with the balance primarily a result of higher salaries and benefits, and DSM transaction service agreement costs partially offset by lower legal bills associated with the Procaps litigation of $2.1 million. Foreign exchange rates had a favorable impact of $1.7 million on selling, general and administrative expenses in the three months ended January 31, 2015 versus the same period in the prior year.
Research and development expenses for the three months ended January 31, 2015 increased $1.1 million to $3.9 million, from $2.8 million for the three months ended January 31, 2014. The year over year increase is primarily a result of the DPP Acquisition that accrued on March 11, 2014 for $0.8 million. The research and development expenses relate to proprietary research and development efforts and consist of salaries and benefits, supplies, outside services, and other costs.
Repositioning expenses for the three months ended January 31, 2015 increased $17.1 million, to $17.8 million, from $0.7 million for the three months ended January 31, 2014. The increase from the three months ended January 31, 2014 is primarily related to the TSAs, a majority of which were not extended by the Company beyond December 31, 2014, which triggered a liability of $16.3 million, as well as the business process outsourcing initiative during the three months ended January 31, 2015.
Acquisition and integration costs for the three months ended January 31, 2015 increased $1.2 million to $6.1 million from $4.9 million for the three months ended January 31, 2014. Acquisition and integration costs during the three months ended January 31, 2014 related to the DPP Acquisition while these costs primarily to the continued integration of the DPP Business and Gallus during the three months ended January 31, 2015. The nature of the costs include consultants, system and customer conversions, and other integration-related costs. These costs are recognized as operating expenses as incurred.
Operating income for the three months ended January 31, 2015 increased $21.1 million to $31.5 million, from $10.4 million for the three months ended January 31, 2014 as a result of the factors discussed above.
56
Interest expense, net
Interest expense for the three months ended January 31, 2015 was $28.0 million compared to $12.9 million for the three months ended January 31, 2014. The increase in interest expense is a result of the refinancing that occurred in early fiscal 2014 as further discussed below in the “Liquidity and capital resources” section.
Loss before income taxes
We reported a loss before income taxes of $0.3 million for the three months ended January 31, 2015, compared to a loss before income taxes of $2.3 million for the three months ended January 31, 2014. The operating items discussed above were the primary drivers of the year over year variance.
Income taxes
Income taxes were an expense of $5.8 million for the three months ended January 31, 2015, compared to an expense of $1.3 million for the three months ended January 31, 2014. The increase in tax expense is a result of acquisitions during fiscal 2014 partially driven by a mix of income and losses from operations and pre-tax losses in some entities for which no tax benefits were recognized in fiscal 2014.
Net loss
We recorded a net loss of $6.1 million for the three months ended January 31, 2015 compared to a net loss of $3.6 million for the three months ended January 31, 2014.
Revenues and Adjusted EBITDA by business segment
The Company evaluates the performance of its segments based on segment Adjusted EBITDA. The Company’s Adjusted EBITDA is income (loss) from continuing operations before repositioning expenses, interest expense, foreign exchange losses reclassified from other comprehensive income (loss), refinancing expenses, acquisition and integration costs (including certain product returns and inventory write-offs recorded in gross profit), gains and losses on sale of capital assets, income taxes, impairment charges, depreciation and amortization, stock-based compensation expense, consulting costs related to our operational initiatives, purchase accounting adjustments, acquisition-related litigation expenses and other income and expenses. Our management uses Adjusted EBITDA as one of several metrics we use to measure segment operating performance as well as compensation expenses.
57
The following provides certain information regarding our business segments for the three months ended January 31, 2015 and 2014. From an accounting standpoint, Patheon Inc. was the acquirer and as such all financial information prior to March 11, 2014 is related to Patheon Inc.
Three months ended January 31, |
||||||||||||
| (in millions of dollars) | 2015 | 2014 | Change ($) | Change (%) | ||||||||
| Revenues |
||||||||||||
| Drug Product Services | 304.3 | 213.8 | 90.5 | 42.3 | ||||||||
| Pharmaceutical Development Services | 44.5 | 39.1 | 5.4 | 13.8 | ||||||||
| Drug Substance Services | 76.9 | — | 76.9 | — | ||||||||
| DPx Fine Chemical | 50.5 | — | 50.5 | — | ||||||||
| Other | 42.8 | 32.5 | 10.3 | 31.7 | ||||||||
| Inter-segment Revenue Eliminations | (30.2 | ) |
(23.2 | ) |
(7.0 | ) |
30.2 | |||||
| Total Revenues | 488.8 | 262.2 | 226.6 | 86.4 | ||||||||
| Adjusted EBITDA |
||||||||||||
| Drug Product Services | 71.7 | 29.9 | 41.8 | 139.8 | ||||||||
| Pharmaceutical Development Services | 14.0 | 11.4 | 2.6 | 22.8 | ||||||||
| Drug Substance Services | 10.7 | — | 10.7 | — | ||||||||
| DPx Fine Chemical | 9.8 | — | 9.8 | — | ||||||||
| Other | (18.7 | ) |
(9.0 | ) |
(9.7 | ) |
107.8 | |||||
| Total Adjusted EBITDA | 87.5 | 32.3 | 55.2 | 170.9 | ||||||||
| Adjusted EBITDA Margin | 17.9 | % |
12.3 | % |
||||||||
Drug Product Services
DPS revenues for the three months ended January 31, 2015 increased $90.5 million, or 42.3%, to $304.3 million, from $213.8 million for the three months ended January 31, 2014. On a constant currency basis revenue increased by $100.9 million, or 47.2%. Approximately $71.1 million of the increase came from the DPP Acquisition. The remaining increase came from strong revenue growth across most legacy Patheon sites. DPS includes intercompany revenue of $30.2 million in the three month period ended January 31, 2015 compared to $23.2 million in the same period prior year.
DPS Adjusted EBITDA for the three months ended January 31, 2015 increased $41.8 million to $71.7 million, from $29.9 million for the three months ended January 31, 2014. On a constant currency basis Adjusted EBITDA increased $40.9 million. This represents an Adjusted EBITDA margin of 23.6% for the three months ended January 31, 2015 compared to 14.0% for the three months ended January 31, 2014. Approximately $13.5 million of the increase in Adjusted EBITDA came from the DPP Business. The increase in Adjusted EBITDA margin was driven by higher volume and improved margins driven by our operational excellence initiatives including the closure of the Caguas, Puerto Rico facility. Consistent with management’s definition of Adjusted EBITDA, total DPS Adjusted EBITDA for the three months ended January 31, 2015 excludes repositioning costs of $6.6 million.
Pharmaceutical Development Services
Total PDS revenues for the three months ended January 31, 2015 increased by $5.4 million, or 13.8%, to $44.5 million, from $39.1 million for the three months ended January 31, 2014. On a constant currency basis revenue increased by $6.2 million, or 15.9%. This growth was primarily due to higher development activities from new contracts across all sites with the exception of Toronto and Swindon and the introduction of PDS into our DPP Business facility in Greenville, NC, $3.1 million.
Total PDS Adjusted EBITDA for the three months ended January 31, 2015 increased $2.6 million, or 22.8%, to $14.0 million, from $11.4 million for the three months ended January 31, 2014. On a constant currency basis Adjusted EBITDA increased by $2.3 million, or 20.0%. This represents an
58
Adjusted EBITDA margin of 31.5% for the three months ended January 31, 2015 compared to 29.2% for the three months ended January 31, 2014. Top line growth along with continued focus on cost containment and impacts from our operational excellence initiatives contributed to the year over year growth.
Drug Substance Services
Total DSS revenues, for the three months ended January 31, 2015 were $76.9 million compared to nil for the three months ended January 31, 2014 as a result of the DPP Acquisition.
Total DSS had Adjusted EBITDA of $10.7 million for the three months ended January 31, 2015 compared to nil for the three months ended January 31, 2014 as a result of the DPP Acquisition. Consistent with management’s definition of Adjusted EBITDA, total DSS Adjusted EBITDA for the three months ended January 31, 2015 excludes repositioning costs of $5.0 million.
DPx Fine Chemicals
Total DFC had revenue of $50.5 million for the three months ended January 31, 2015 compared to nil for the three months ended January 31, 2014 as a result of the DPP Acquisition.
Total DFC had Adjusted EBITDA of $9.8 million for the three months ended January 31, 2015 compared to nil for the three months ended January 31, 2014 as a result of the DPP Acquisition. Consistent with management’s definition of Adjusted EBITDA, total DFC Adjusted EBITDA for the three months ended January 31, 2015 excludes repositioning costs of $3.7 million.
Other
Total Other revenues, which include the BLS and Biosolutions business, for the three months ended January 31, 2015 increased by $10.3 million, or 31.7%, to $42.8 million, from $32.5 million for the three months ended January 31, 2014. The increase was due to higher BLS revenue from new product launches and higher volumes along with $4.2 million in revenue from the DPP Acquisition.
Total Other Adjusted EBITDA, which includes BLS, Biosolutions and Corporate, for the three months ended January 31, 2015 decreased by $9.7 million or 107.8% to $(18.7) million from $(9.0) million to the three months ended January 31, 2014. Losses from the Biosolutions business, were offset by the growth in BLS business, with the balance of the loss attributable to Corporate. Consistent with management’s definition of Adjusted EBITDA, total Other Adjusted EBITDA for the three months ended January 31, 2015 excludes acquisition and integration costs of $5.7 million, Procaps litigation expenses of $1.0 million, and repositioning expenses of $2.5 million.
A reconciliation of Adjusted EBITDA to net loss is set forth below:
Three months ended January 31, |
||||||
| (in millions of dollars) | 2015 | 2014 | ||||
| Total Adjusted EBITDA | 87.5 | 32.3 | ||||
| Depreciation and amortization | (29.7 | ) |
(12.5 | ) |
||
| Repositioning expenses | (17.8 | ) |
(0.7 | ) |
||
| Acquisition and integration costs | (6.1 | ) |
(4.9 | ) |
||
| Interest expense, net | (28.0 | ) |
(12.9 | ) |
||
| Gain on sale of capital assets | 0.1 | 0.4 | ||||
| Provision for income taxes | (5.8 | ) |
(1.3 | ) |
||
| Operational initiatives related consulting costs | (1.5 | ) |
(1.4 | ) |
||
| Acquisition-related litigation expenses | (1.0 | ) |
(3.1 | ) |
||
| Stock-based compensation expense | (4.1 | ) |
(0.8 | ) |
||
| Other | 0.3 | 1.3 | ||||
| Net loss | (6.1 | ) |
(3.6 | ) |
||
59
Year ended October 31, 2014 compared to year ended October 31, 2013
The following table summarizes the consolidated historical results of operations of our Company for the years ended October 31, 2014 and 2013. From an accounting standpoint, Patheon Inc. was the acquirer and as such all financial information prior to March 11, 2014 is related to Patheon Inc.
Fiscal years ended October 31, |
||||||||||||
| (in millions of dollars) | 2014 | 2013 | Change ($) | Change (%) | ||||||||
| Revenues | 1,704.8 | 1,019.7 | 685.1 | 67.2 | ||||||||
| Cost of goods sold | 1,281.2 | 772.0 | 509.2 | 66.0 | ||||||||
| Gross profit | 423.6 | 247.7 | 175.9 | 71.0 | ||||||||
| Selling, general and administrative expenses | 261.5 | 163.6 | 97.9 | 59.8 | ||||||||
| Research and development | 15.1 | 10.9 | 4.2 | 38.5 | ||||||||
| Repositioning expenses | 53.5 | 15.8 | 37.7 | 238.6 | ||||||||
| Acquisition and integration costs | 60.4 | 13.1 | 47.3 | 361.1 | ||||||||
| Impairment charge | 22.1 | 13.1 | 9.0 | 68.7 | ||||||||
| Gain on sale of capital assets | (0.1 | ) |
(1.3 | ) |
1.2 | (92.3 | ) |
|||||
| Operating income | 11.1 | 32.5 | (21.4 | ) |
(65.8 | ) |
||||||
| Interest expense, net | 90.4 | 47.8 | 42.6 | 89.1 | ||||||||
| Foreign exchange loss, net | 8.7 | 0.8 | 7.9 | 987.5 | ||||||||
| Refinancing expenses | 28.2 | 27.3 | 0.9 | 3.3 | ||||||||
| Other income, net | (1.1 | ) |
(2.0 | ) |
0.9 | (45.0 | ) |
|||||
| Loss from continuing operations before income taxes | (115.1 | ) |
(41.4 | ) |
(73.7 | ) |
178.0 | |||||
| Provision for (benefit from) income taxes | 4.1 | (5.5 | ) |
9.6 | (174.5 | ) |
||||||
| Loss from continuing operations | (119.2 | ) |
(35.9 | ) |
(83.3 | ) |
232.0 | |||||
| Loss from discontinued operations | — | (0.2 | ) |
0.2 | — | |||||||
| Net loss | (119.2 | ) |
(36.1 | ) |
(83.1 | ) |
230.2 | |||||
Operating income summary
Revenues for fiscal 2014 increased $685.1 million, or 67.2% , to $1,704.8 million, from $1,019.7 million for fiscal 2013. Had local currency exchange rates remained constant to the rates of fiscal 2013, revenues for fiscal 2014 would have been approximately $7.0 million lower. DPS revenues for fiscal 2014 increased $276.7 million, or 33.0%, to $1,115.9 million, from $839.2 million for fiscal 2013 as a result of revenue growth across legacy Patheon sites, $179.7 million from the DPP Acquisition, and incremental DPS revenue due to the timing of the Banner Acquisition in the first quarter of fiscal 2013. PDS revenues for fiscal 2014 increased $17.6 million, or 11.9%, to $165.2 million, from $147.6 million for fiscal 2013. DSS revenues for fiscal 2014 were $188.9 million resulting from the DPP Acquisition. DFC revenues for fiscal 2014 were $167.8 million resulting from the DPP Acquisition and the Gallus Acquisition. Other revenue for fiscal 2014, which includes the company’s BLS and Biosolutions segments, increased $46.2 million or 41.6% to $157.3 million from $111.1 million for fiscal 2013 including $19.1 million from the DPP Acquisition and incremental BLS revenue due to the timing of the Banner Acquisition in the first quarter of fiscal 2013. The segment results above include approximately $90.3 million of intercompany revenue between DPS and BLS.
Gross profit for fiscal 2014 increased $175.9 million, or 71.0%, to $423.6 million, from $247.7 million for fiscal 2013. The increase in gross profit was primarily due to higher volumes and a small increase in margin from 24.3% for fiscal 2013 to 24.8% for fiscal 2014. Patheon’s legacy business gross margin of 30.4% was 4.5 percentage points higher than the gross margin for fiscal 2013. The increase in gross profit margin of Patheon’s legacy business was driven by higher volumes, savings from our operational excellence initiatives, plant closure savings, as well as a favorable foreign exchange impact of $8.3 million. In addition, in fiscal 2013 we experienced a manufacturing problem at BLS related to a change in raw materials and operational processes qualified prior to the
60
Banner Acquisition that did not perform as expected, which led to $3.0 million of inventory write-offs and product returns from a packaging site of $3.2 million, which reduced our gross profit margin in fiscal 2013. The DPP Acquisition contributed approximately $77.1 million in gross profit including additional depreciation and amortization of purchase price adjustments for fiscal 2014.
Selling, general and administrative expenses for fiscal 2014 increased $97.9 million, or 59.8%, to $261.5 million, from $163.6 million for fiscal 2013. Selling, general and administrative expenses were higher primarily due to the inclusion of the DPP Business’s selling, general and administrative costs of $60.0 million, higher bonus expense of $10.7 million due to stronger performance in fiscal 2014 and a reversal of bonus accrual in 2013, $8.2 million in consulting costs relating to our strategic and operational initiatives and other consulting/recruitment costs for legacy Patheon business, $4.4 million in higher stock based compensation due to accelerated vesting associated with the DPP Acquisition and the implementation of a new management equity incentive plan in fiscal 2014, higher legal expenses of $3.8 million associated with the Pro caps litigation, with the balance primarily resulting from higher salaries and benefits, advertising and promotion, and travel and entertainment. Foreign exchange rates had a favorable impact of $1.0 million on selling, general and administrative expenses in fiscal 2014 versus the same period in the prior fiscal year.
Research and development expenses for fiscal 2014 increased $4.2 million to $15.1 million, from $10.9 million for fiscal 2013. The year over year increase is primarily a result of $3.4 million related to the DPP Acquisition that occurred on March 11, 2014 and the Banner Acquisition that occurred on December 14, 2012, which was mid-way through the first quarter of fiscal 2013 as compared to a full twelve month of results included in fiscal 2014. The research and development expenses relate to proprietary research and development efforts and consist of salaries and benefits, supplies, outside services, and other costs.
Repositioning expenses for fiscal 2014 increased $37.7 million, to $53.5 million, from $15.8 million for fiscal 2013. Organization alignment activities across several sites within our business as a result of the DPP Acquisition and outsourcing of certain back-office support functions to an outsourced vendor, along with Venlo closure for fiscal 2014 were partially offset by the Banner Acquisition related repositioning expenses incurred in fiscal 2013.
Acquisition and integration costs for fiscal 2014 increased $47.3 million to $60.4 million from $13.1 million for fiscal 2013. Expenses incurred for fiscal 2014 related to activities connected with the DPP Acquisition that closed on March 11, 2014 and Gallus Acquisition that closed on September 29, 2014 consisted of consultant, system, customer conversion, and other integration-related costs while the expenses incurred for fiscal 2013 related to the Banner Acquisition. In connection with the DPP Acquisition and the Gallus Acquisition, we expect to incur, additional acquisition and integration costs. These costs are recognized as operating expenses as incurred.
The impairment charge of $22.1 million incurred for fiscal 2014 related to the impairment of long-term assets in our Biosolutions business as well as intangible impairments on some of our intellectual property R&D assets from our BLS and DPS businesses compared to an impairment charge of $13.1 million for fiscal 2013 that related to the closure of our Olds, Alberta, Canada facility that was acquired as part of the Banner Acquisition and some intangible intellectual property R&D impairment from our BLS business. The Olds facility was closed by the end of fiscal 2013 and sold to an external third party on November 1, 2013.
Operating income for fiscal 2014 decreased $21.4 million to $11.1 million, from an operating income of $32.5 million for fiscal 2013 as a result of the factors discussed above.
Interest expense, net
Interest expense for fiscal 2014 was $90.4 million compared to $47.8 million for fiscal 2013. The increase in interest expense is a result of the refinancing that occurred in early fiscal 2014 as further discussed in below in the “Liquidity and capital resources” section.
61
Foreign exchange loss, net
Foreign exchange loss, net for fiscal 2014 was $8.7 million compared to $0.8 million for fiscal 2013. The fiscal 2014 loss was primarily from a combination of both hedge losses and operating exposures while fiscal 2013 losses were primarily from operating exposures, partially offset by hedge gains.
Refinancing expenses
Refinancing expense for fiscal 2014 was $28.2 million compared to $27.3 million for fiscal 2013. The increase in refinancing expense is a result of the refinancing that occurred in fiscal 2014 as further discussed in below in the “Liquidity and capital resources” section.
Loss before income taxes
We reported loss before income taxes of $115.1 million for fiscal 2014, compared to a loss before income taxes of $41.4 million for fiscal 2013. The operating items discussed above were the primary drivers of the year over year variance.
Income taxes
Income taxes were an expense of $4.1 million for fiscal 2014, compared to a benefit of $5.5 million for fiscal 2013. The increase in tax expense was partially driven by a mix of income and losses from operating units and pre-tax losses in some entities for which no tax benefits were recognized in 2014.
Loss from continuing operations
We recorded a loss from continuing operations for fiscal 2014 of $119.2 million, compared to a $35.9 million loss for fiscal 2013.
Revenues and Adjusted EBITDA by business segment
The following provides certain information regarding our business segments for fiscal 2014 and 2013. From an accounting standpoint, Patheon Inc. was the acquirer and as such all financial information prior to March 11, 2014 is related to Patheon Inc.
Fiscal year ended October 31, |
||||||||||||
| (in millions of dollars) | 2014 | 2013 | Change ($) | Change (%) | ||||||||
| Revenues |
||||||||||||
| Drug Product Services | 1,115.9 | 839.2 | 276.7 | 33.0 | ||||||||
| Pharmaceutical Development Services | 165.2 | 147.6 | 17.6 | 11.9 | ||||||||
| Drug Substance Services | 188.9 | — | 188.9 | — | ||||||||
| DPx Fine Chemical | 167.8 | — | 167.8 | — | ||||||||
| Other | 157.3 | 111.1 | 46.2 | 41.6 | ||||||||
| Inter-segment Revenue Eliminations | (90.3 | ) |
(78.2 | ) |
(12.1 | ) |
15.5 | |||||
| Total Revenues | 1,704.8 | 1,019.7 | 685.1 | 67.2 | ||||||||
| Adjusted EBITDA |
||||||||||||
| Drug Product Services | 231.2 | 138.9 | 92.3 | 66.5 | ||||||||
| Pharmaceutical Development Services | 51.2 | 40.5 | 10.7 | 26.4 | ||||||||
| Drug Substance Services | 3.2 | — | 3.2 | — | ||||||||
| DPx Fine Chemicals | 31.9 | — | 31.9 | — | ||||||||
| Other | (44.1 | ) |
(34.5 | ) |
(9.6 | ) |
(27.8 | ) |
||||
| Total Adjusted EBITDA | 273.4 | 144.9 | 128.5 | 88.7 | ||||||||
| Adjusted EBITDA Margin | 16.0 | % |
14.2 | % |
||||||||
Drug Product Services
DPS revenues for fiscal 2014 increased $276.7 million, or 33.0%, to $1,115.9 million, from $839.2 million for fiscal 2013. Had local currency exchange rates remained constant to the rates of fiscal 2013, DPS revenues for fiscal 2014 would have been approximately $7.0 million lower.
62
Approximately $179.7 million of the increase came from the DPP Acquisition along with incremental DPS volumes due to the timing of the Banner Acquisition in the first quarter of fiscal 2013. The remaining increase came from strong revenue growth across almost all legacy sites. DPS includes intercompany revenue of $90.3 million in fiscal 2014 compared to $78.2 million in the same period prior fiscal year.
DPS Adjusted EBITDA for fiscal 2014 increased $92.3 million to $231.2 million, from $138.9 million for fiscal 2013. This represents an Adjusted EBITDA margin of 20.7% for fiscal 2014 compared to 16.6% for fiscal 2013. Approximately $43.7 million of the increase in Adjusted EBITDA came from the DPP Business with minimal impact from the timing of the Banner Acquisition. Had local currency exchange rates and foreign exchange gains and losses remained constant to those of fiscal 2013, DPS Adjusted EBITDA for fiscal 2014 would have been approximately $2.8 million lower. The increase in Adjusted EBITDA margin was driven by higher volume and improved margins driven by our operational excellence initiatives and BLS synergy savings which includes the closure of the Olds, Alberta, Canada facility as well as the closure of the Caguas, Puerto Rico facility. Consistent with management's definition of Adjusted EBITDA, total DPS Adjusted EBITDA for fiscal 2014 excludes repositioning costs of $14.9 million and acquisition, integration costs of $9.8 million, and consulting costs relating to our operational excellence initiatives of $6.9 million.
Pharmaceutical Development Services
PDS revenues for fiscal 2014 increased by $17.6 million, or 11.9%, to $165.2 million, from $147.6 million for fiscal 2013. This growth was primarily due to higher development activities from new contracts across all sites with the exception of Whitby and Swindon. Had the local currency exchange rates remained constant to fiscal 2013, PDS revenues for fiscal 2014 would have been approximately $0.6 million lower.
PDS Adjusted EBITDA for fiscal 2014 increased $10.7 million, or 26.4%, to $51.2 million, from $40.5 million for fiscal 2013. Had local currency exchange rates remained constant to those of fiscal 2013, PDS Adjusted EBITDA for fiscal 2014 would have been approximately $0.2 million higher. This represents an Adjusted EBITDA margin of 31.0% for fiscal 2014 compared to 27.4% for fiscal 2013. Top line growth along with continued focus on cost containment and impacts from our operational excellence initiatives contributed to the year over year growth.
Drug Substance Services
DSS had revenue of $188.9 million for fiscal 2014 compared to nil for fiscal 2013 as a result of the DPP Acquisition and the Gallus Acquisition.
DSS had Adjusted EBITDA of $3.2 million for fiscal 2014 compared to nil for fiscal 2013 as a result of the DPP Acquisition. Consistent with management's definition of Adjusted EBITDA, total DSS Adjusted EBITDA for fiscal 2014 excludes repositioning expenses of $34.0 million primarily relating to the Venlo closure, and $7.2 million in acquisition integration costs.
DPx Fine Chemicals
DFC had revenue of $167.8 million for fiscal 2014 compared to nil for fiscal 2013 as a result of the DPP Acquisition.
DFC had Adjusted EBITDA of $31.9 million for fiscal 2014 compared to nil for fiscal 2013 as a result of the DPP Acquisition.
Other
Other revenues, which include the BLS and Biosolutions business, for fiscal 2014 increased by $46.2 million, or 41.6%, to $157.3 million, from $111.1 million for fiscal 2013. The increase was due to higher BLS revenue from new product launches and lower returns and the timing of the Banner Acquisition in the first quarter of fiscal 2013 along with $19.1 million in revenue from the DPP Acquisition.
63
Other Adjusted EBITDA, which includes BLS, Biosolutions and Corporate, for fiscal 2014 decreased by $(9.6) million or 27.8%, to $(44.1) million from $(34.5) million for fiscal 2013. Losses from the Biosolutions business and Corporate expenses were partially offset by the growth in BLS business. Consistent with management's definition of Adjusted EBITDA, total Other Adjusted EBITDA for fiscal 2014 excludes acquisition and integration costs of $43.1 million, refinancing costs of $25.7 million, Procaps litigation expenses of $10.2 million, and repositioning expenses of $4.1 million.
A reconciliation of Adjusted EBITDA to loss from continuing operations is set forth below:
Fiscal years ended October 31, |
||||||
| (in millions of dollars) | 2014 | 2013 | ||||
| Total Adjusted EBITDA | 273.4 | 144.9 | ||||
| Depreciation and amortization | (92.9 | ) |
(48.6 | ) |
||
| Repositioning expenses | (53.5 | ) |
(15.8 | ) |
||
| Acquisition and integration costs | (60.4 | ) |
(20.2 | ) |
||
| Interest expense, net | (90.4 | ) |
(47.8 | ) |
||
| Impairment charge | (22.1 | ) |
(13.1 | ) |
||
| Gain on sale of capital assets | 0.1 | 1.3 | ||||
| (Provision for) benefit from income taxes | (4.1 | ) |
5.5 | |||
| Refinancing expenses | (28.2 | ) |
(27.3 | ) |
||
| Operational initiatives related consulting costs | (10.1 | ) |
(2.3 | ) |
||
| Acquisition-related litigation expenses | (10.2 | ) |
(6.4 | ) |
||
| Stock-based compensation expense | (10.0 | ) |
(3.2 | ) |
||
| Purchase accounting adjustments | (11.8 | ) |
(5.0 | ) |
||
| Other | 1.0 | 2.1 | ||||
| Loss from continuing operations | (119.2 | ) |
(35.9 | ) |
||
Year ended October 31, 2013 compared to year ended October 31, 2012
The following table summarizes the consolidated historical results of operations of our Company for the year ended October 31, 2013 and October 31, 2012.
Fiscal years ended October 31, |
||||||||||||
| (in millions of dollars) | 2013 | 2012 | Change ($) | Change (%) | ||||||||
| Revenues | 1,019.7 | 748.0 | 271.7 | 36.3 | ||||||||
| Cost of goods sold | 772.0 | 589.1 | 182.9 | 31.0 | ||||||||
| Gross profit | 247.7 | 158.9 | 88.8 | 55.9 | ||||||||
| Selling, general and administrative expenses | 163.6 | 128.6 | 35.0 | 27.2 | ||||||||
| Research and development | 10.9 | — | 10.9 | — | ||||||||
| Repositioning expenses | 15.8 | 6.1 | 9.7 | 159.0 | ||||||||
| Acquisition and integration costs | 13.1 | 3.2 | 9.9 | 309.4 | ||||||||
| Impairment charge | 13.1 | 57.9 | (44.8 | ) |
(77.4 | ) |
||||||
| (Gain) loss on sale of capital assets | (1.3 | ) |
0.4 | (1.7 | ) |
(425.0 | ) |
|||||
| Operating income (loss) | 32.5 | (37.3 | ) |
69.8 | (187.1 | ) |
||||||
| Interest expense, net | 47.8 | 26.5 | 21.3 | 80.4 | ||||||||
| Foreign exchange loss, net | 0.8 | 0.5 | 0.3 | 60.0 | ||||||||
| Refinancing expenses | 27.3 | — | 27.3 | — | ||||||||
| Other income, net | (2.0 | ) |
(1.3 | ) |
(0.7 | ) |
53.8 | |||||
| Loss from continuing operations before income taxes | (41.4 | ) |
(63.0 | ) |
21.6 | (34.3 | ) |
|||||
| (Benefit from) provision for income taxes | (5.5 | ) |
43.7 | (49.2 | ) |
(112.6 | ) |
|||||
| Loss from continuing operations | (35.9 | ) |
(106.7 | ) |
70.8 | (66.4 | ) |
|||||
| Loss from discontinued operations | (0.2 | ) |
(0.3 | ) |
0.1 | (0.3 | ) |
|||||
| Net loss | (36.1 | ) |
(107.0 | ) |
70.9 | (66.3 | ) |
|||||
64
Operating income (loss) summary
Revenues for fiscal 2013 increased $271.7 million, or 36.3%, to $1,019.7 million, from $748.0 million for fiscal 2012. On a constant currency basis, revenue increased $266.4 million or 35.6% year over year, $217.2 million of the increase was due to the Banner Acquisition. DPS revenues for fiscal 2013 increased $229.6 million, or 37.7%, to $839.2 million, from $609.6 million for fiscal 2012. The increase was across most Patheon legacy sites, with the exception of Bourgoin and Swindon. PDS revenues for fiscal 2013 increased $9.2 million, or 6.6%, to $147.6 million, from $138.4 million for fiscal 2012, primarily driven by stronger results across all of our sites except Swindon.
Gross profit for fiscal 2013 increased $88.8 million, or 55.9%, to $247.7 million, from $158.9 million for fiscal 2012. Gross profit margin increased from 21.2% in fiscal 2012 to 24.3% in fiscal 2013. The increase in gross profit margin was driven by higher volumes and savings from our OE initiatives, partially offset by higher inventory write-offs of $3.2 million, increased costs of goods sold related to the fair value mark up of inventory from the Banner Acquisition of $5.0 million. In addition, we experienced a manufacturing problem at Banner related to a change in raw materials and operational processes qualified prior to the Banner Acquisition that did not perform as expected, which led to an additional $3.0 million of inventory write-offs and product returns from a packaging site of $3.2 million, which reduced our gross profit margin in fiscal 2013. Approximately $40.0 million of the gross profit increase over prior year was due to the Banner Acquisition. Foreign exchange rates had a positive impact of $3.5 million on gross profit in fiscal 2013 versus prior year.
Selling, general and administrative expenses for fiscal 2013 increased $35.0 million, or 27.2%, to $163.6 million, from $128.6 million for fiscal 2012. The increase was primarily a result of BLS’s selling, general and administrative costs of $36.7 million along with other variances on travel, compensation, promotion, and supplies and maintenance, partially offset by lower consulting costs in the current year. Foreign exchange rates had a favorable impact of $0.2 million on selling, general and administrative expenses in fiscal 2013 versus the prior year.
Research and development costs of $10.9 million in fiscal 2013 were a result of the Banner Acquisition. These expenses relate to proprietary research and development efforts and consist of salaries and benefits, supplies and other costs.
Repositioning expenses of $15.8 million were incurred in fiscal 2013 versus $6.1 million in fiscal 2012 primarily driven by $9.9 million of restructuring charges relating to Banner Acquisition including the closure of the Olds, Alberta, Canada facility.
Acquisition and integration costs for fiscal 2013 and 2012 were $13.1 million and $3.2 million. These expenses are associated with the Banner Acquisition and related integration activities for fiscal 2012 and fiscal 2013, with the exception of $2.4 million in fiscal 2013 costs relating to activities connected with the DPP Acquisition. In connection with such transaction, we incurred additional acquisition and integration costs consisting of consultants, system and customer conversions, and other integration-related costs.
Impairment charges for fiscal 2013 were $13.1 million related to the closure and sale of our recently acquired Olds, Alberta, Canada facility for $11.8 million, and a $1.3 million for three intellectual property projects that were curtailed at our BLS, High Point facility. Impairment charges for fiscal 2012 were $57.9 million relating to winding down or transferring PDS and non-cephalosporin commercial production from our Swindon, U.K. facility to other facilities.
Operating income for fiscal 2013 increased $69.8 million, to an income of $32.5 million from a loss of $37.3 million for fiscal 2012 as a result of the factors discussed above.
Interest expense, net
Interest expense for fiscal 2013 was $47.8 million, compared to $26.5 million for fiscal 2012 The increase in fiscal 2013 was primarily due to the refinancing completed in conjunction with the Banner Acquisition.
65
Foreign exchange loss, net
Foreign exchange loss for fiscal 2013 was $0.8 million, compared to a loss of $0.5 million for fiscal 2012. The foreign exchange loss for fiscal 2013 was primarily due to hedging gains more than offset by operating exposures. The foreign exchange loss for fiscal 2012 was primarily due to operating exposures partially offset by hedging gains.
Refinancing expenses
During fiscal 2013, we incurred $27.3 million of refinancing expenses comprised of a $23.8 million early redemption penalty related to the repayment of the Notes, $3.4 million related to the write-off of deferred financing costs on the Notes and an asset-backed loan, and $0.1 million in other related charges.
On December 14, 2012, we completed the Refinancing, pursuant to which we entered into the Credit Agreement governing the Credit Facility, which is comprised of the Secured Term Loan in the amount of $575.0 million and the Secured Revolving Credit Facility of up to $85.0 million. For additional information regarding the Credit Facility and Refinancing, please refer to “Note 8–Long–Term Debt” and “Note 18–Refinancing Expenses” to our consolidated financial statements.
Loss from continuing operations before income taxes
We reported a loss from continuing operations before income taxes of $41.4 million for fiscal 2013 compared to a loss of $63.0 million for fiscal 2012. The operating items discussed above were the primary drivers of the year over year variance.
Income taxes
The benefit from income taxes was $5.5 million for fiscal 2013, compared to a provision for income taxes of $43.7 million for fiscal 2012. The tax benefit in fiscal 2013 was primarily driven by the pre-tax loss from our operating units in North America, offset by pre-tax income in Europe. The provision for income taxes in fiscal 2012 was primarily driven by the recording of a valuation allowance against our Canadian deferred tax assets.
Loss from continuing operations
We recorded a loss from continuing operations for fiscal 2013 of $35.9 million, compared to a $106.7 million loss for fiscal 2012.
Revenues and Adjusted EBITDA by business segment
Fiscal years ended October 31, |
||||||||||||
| (in millions of dollars) | 2013 | 2012 | Change ($) | Change (%) | ||||||||
| Revenues |
||||||||||||
| Drug Product Services | 839.2 | 609.6 | 229.6 | 37.7 | ||||||||
| Pharmaceutical Development Services | 147.6 | 138.4 | 9.2 | 6.6 | ||||||||
| Drug Substance Services | — | — | — | — | ||||||||
| DPx Fine Chemicals | — | — | — | — | ||||||||
| Other | 111.1 | — | 111.1 | — | ||||||||
| Inter-segment Revenue Eliminations | (78.2 | ) |
— | (78.2 | ) |
— | ||||||
| Total Revenues | 1,019.7 | 748.0 | 271.7 | 36.3 | ||||||||
| Adjusted EBITDA |
||||||||||||
| Drug Product Services | 138.9 | 92.2 | 46.7 | 50.7 | ||||||||
| Pharmaceutical Development Services | 40.5 | 30.7 | 9.8 | 31.9 | ||||||||
| Drug Substance Services | — | — | — | — | ||||||||
| DPx Fine Chemicals | — | — | — | — | ||||||||
| Other | (34.5 | ) |
(35.7 | ) |
1.2 | 3.4 | ||||||
| Total Adjusted EBITDA | 144.9 | 87.2 | 57.7 | 66.2 | ||||||||
| Adjusted EBITDA, Margin | 14.2 | % |
11.7 | % |
||||||||
66
Drug Product Services
DPS revenues for fiscal 2013 increased $229.6 million, or 37.7%, to $839.2 million, from $609.6 million for fiscal 2012. On a constant currency basis, revenue increased $224.6 million or 36.8% year over year. Increases in customer demand serviced by the company’s North American and Italian sites generated a portion of the revenue increase. Also, approximately $191.4 million of the total year over year DPS growth resulted from the Banner Acquisition.
DPS Adjusted EBITDA for fiscal 2013 increased $46.7 million, or 50.7%, to $138.9 million, from $92.2 million for fiscal 2012. This represents an Adjusted EBITDA margin of 16.7% for fiscal 2013 compared to 15.1% for fiscal 2012. On a constant currency basis, Adjusted EBITDA increased $44.4 million or 48.2% year over year. The Adjusted EBITDA increase was driven primarily by higher volumes at the company’s North American and Italian sites, improved margins driven by the company’s operational excellence initiative as well as a $14.8 million impact resulting from the Banner Acquisition. Consistent with management's definition of Adjusted EBITDA, total DPS Adjusted EBITDA for fiscal 2013 excludes $11.8 million of impairment charges related to the closure of the facility in Olds, Alberta, Canada, and $10.2 million of global repositioning charges.
Pharmaceutical Development Services
PDS revenues for fiscal 2013 increased by $9.2 million, or 6.6%, to $147.6 million, from $138.4 million for fiscal 2012. On a constant currency basis, revenue increased $9.0 million, or 6.5% year over year. Excluding the impact of the Clinical Packaging business that was sold in fiscal 2012, the PDS revenues grew by 9.8% over the prior year. Higher development activities from new contracts across all sites with the exception of Swindon contributed to the improved performance.
PDS Adjusted EBITDA for fiscal 2013 increased by $9.8 million, or 31.9%%, to $40.5 million, from $30.7 million for fiscal 2012. On a constant currency basis, Adjusted EBITDA increased $8.7 million, or 28.3% year over year. This represents an Adjusted EBITDA margin of 27.4% for fiscal 2013 compared to 22.2% for fiscal 2012. Higher revenue, positive impact from our operational excellence initiatives, and cost controls contributed to the year over year growth. Consistent with management's definition of Adjusted EBITDA, total PDS Adjusted EBITDA for fiscal 2013 excludes repositioning expenses of $1.8 million.
Other
Other had revenue of $111.1 million for fiscal 2013 compared to nil for fiscal 2012 as a result of the Banner Acquisition.
Other Adjusted EBITDA for fiscal 2013 increased by $1.2 million or 3.4%, to $(34.5) million, from $(35.7) million for fiscal 2012. Included in Other Adjusted EBITDA are professional fees of $3.1 million along with $6.3 million in BLS-related general and administrative costs which contributed to the year over year increase. Consistent with management's definition of Adjusted EBITDA, total Other Adjusted EBITDA for fiscal 2013 excludes repositioning expenses of $3.8 million, acquisition transaction costs of $9.4 million, refinancing costs of $24.2 million, stock-based compensation expense of $3.2 million, and acquisition related litigation costs of $6.4 million.
Revenues and adjusted EBITDA by business segment
A reconciliation of Adjusted EBITDA to loss from continuing operations is set forth below:
Fiscal years ended October 31, |
||||||
| (in millions of dollars) | 2013 | 2012 | ||||
| Total Adjusted EBITDA | 144.9 | 87.2 | ||||
| Depreciation and amortization | (48.6 | ) |
(41.0 | ) |
||
| Repositioning expenses | (15.8 | ) |
(6.1 | ) |
||
| Acquisition and integration costs | (20.2 | ) |
(3.2 | ) |
||
| Interest expense, net | (47.8 | ) |
(26.5 | ) |
||
| Impairment charge | (13.1 | ) |
(57.9 | ) |
||
67
Fiscal years ended October 31, |
||||||
| (in millions of dollars) | 2013 | 2012 | ||||
| Gain (loss) on sale of capital assets | 1.3 | (0.4 | ) |
|||
| Benefit from (provision for) income taxes | 5.5 | (43.7 | ) |
|||
| Refinancing expenses | (27.3 | ) |
— | |||
| Operational initiatives related consulting costs | (2.3 | ) |
(13.3 | ) |
||
| Acquisition-related litigation expenses | (6.4 | ) |
— | |||
| Stock-based compensation expense | (3.2 | ) |
(3.1 | ) |
||
| Purchase accounting adjustments | (5.0 | ) |
— | |||
| Other | 2.1 | 1.3 | ||||
| Net loss from continuing operations | (35.9 | ) |
(106.7 | ) |
||
Liquidity and capital resources
Overview
Cash and cash equivalents totaled $67.0 million at January 31, 2015 and $84.6 million at October 31, 2014. Our total debt was $1,954.6 million at January 31, 2015 and $2,000.7 million at October 31, 2014.
We intend to use approximately $ million of the net proceeds we receive from this offering to repay all or a portion of our Senior PIK Toggle Notes and pay related fees and expenses. The net proceeds from the offering of the Senior PIK Togle Notes were used to pay a dividend of approximately $539.1 million to our shareholders and certain related transaction fees and expenses related to the offering of the Senior PIK Toggle Notes.
On March 31, 2015, the Company entered into the Second Additional Term Loan Facilities, comprised of a $20.0 million U.S. dollar-denominated term loan and a €155.0 million euro-denominated term loan, which were used to finance the IRIX Acquisition.
Our primary source of liquidity is cash flow from operations and borrowings under our credit arrangements. Our principal uses of cash have been for operating expenditures, capital expenditures, repositioning expenditures, debt servicing requirements, integration costs associated with our acquisitions and employee benefit obligations. We expect cash flow from operations, cash on hand and available borrowing under our current revolver to be sufficient to fund our existing level of operating expenses, capital expenditures, and interest expense for at least the next 12 months. We funded the purchase price for the acquisition of IRIX and Agere through the issuance of additional debt, equity, and available cash. In addition we expect to incur approximately $10 million in IPO-related costs, of which 50% will be expensed, as well as $10 million in integration costs related to the IRIX Acquisition and the Agere Acquisition in fiscal 2015.
From time to time, we evaluate strategic opportunities, including potential acquisitions, divestitures or investments in complementary businesses, and we anticipate continuing to make such evaluations. We may also access capital markets through the issuance of debt or equity securities in connection with the acquisition of complementary businesses or other significant assets or for other strategic opportunities. Our ability to make acquisitions, divestitures and investments and to issue debt is restricted by the Credit Agreement.
If our cash flow is not sufficient to service our debt and adequately fund our business, we may be required to seek further additional financing or refinancing or dispose of assets. We may not be able to affect any of these alternatives on satisfactory terms or at all. In addition, our financial leverage could adversely affect our ability to raise additional capital to fund our operations, could impair our ability to respond to operational challenges, changing business and economic conditions and new business opportunities and may make us vulnerable in the event of a downturn in our business.
68
Cash flows
The following table summarizes our cash flows for the periods indicated:
Three months ended January 31, |
Fiscal years ended October 31, |
||||||||||||||
| (in millions of dollars) | 2015 | 2014 | 2014 | 2013 | 2012 | ||||||||||
| Cash provided by operating activities of continuing operations | $ | $ | $ | 25.0 | $ | 13.2 | $ | 33.4 | |||||||
| Cash used in operating activities of discontinued operations | — | (0.2 | ) |
(0.4 | ) |
||||||||||
| Cash provided by operating activities | 20.6 | 1.2 | 25.0 | 13.0 | 33.0 | ||||||||||
| Cash (used in) investing activities | (32.9 | ) |
(16.8 | ) |
(466.5 | ) |
(299.3 | ) |
(51.9 | ) |
|||||
| Cash (used in) provided by financing activities | (5.3 | ) |
0.8 | 467.9 | 306.9 | 26.3 | |||||||||
| Effect of exchange rate changes on cash and cash equivalents | — | (1.0 | ) |
(3.4 | ) |
1.6 | (1.4 | ) |
|||||||
| Net (decrease) increase in cash and cash equivalents during the period | $ | (17.6 | ) |
$ | (15.8 | ) |
$ | 23.0 | $ | 22.2 | $ | 6.0 | |||
Cash provided by operating activities
Cash provided by operating activities for the three months ended January 31, 2015 increased $19.4 million, to $20.6 million, from $1.2 million for the three months ended January 31, 2014. The favorable impact in the current year was driven primarily by an increase in deferred revenues and improved operating performance partially offset by working capital performance. Prior year activity was primarily due to operating performance partially offset by working capital performance.
Cash provided by operating activities for fiscal 2014 increased $12.0 million, to $25.0 million, from $13.0 million for fiscal 2013. The favorable impact in the current year was driven primarily by an increase in deferred revenues partially offset by the DPP Acquisition and Gallus Acquisition and integration expenses, refinancing expenses, and repositioning payouts. Fiscal 2013 cash from operations was driven by deferred revenues and improved working capital performances partially offset by refinancing expenses, Banner Acquisition-related costs, and negative working capital performance. Fiscal 2012 cash provided by operations was primarily due to improved operating performance, partially offset by consulting and repositioning expense payments.
Cash used in investing activities
The following table summarizes the cash used in investing activities for the periods indicated:
Three months ended January 31, |
Fiscal years ended October 31, |
||||||||||||||
| (in millions of dollars) | 2015 | 2014 | 2014 | 2013 | 2012 | ||||||||||
| Cash used in investing activities | $ | (32.9 | ) |
$ | (16.8 | ) |
$ | (466.5 | ) |
$ | (299.3 | ) |
$ | (51.9 | ) |
Cash used in investing activities from continuing operations for the three months ended January 31, 2015 increased $16.1 million, to $32.9 million, from $16.8 million for the three months ended January 31, 2014. The $32.9 million for the three months ended January 31, 2015 primarily consists of project-related capital expenditures. The $16.8 million in cash used in investing activities for the three months ended January 31, 2014 consisted of project-related capital expenditures partially offset by the proceeds from the sale of our Olds, Alberta, Canada facility.
Cash used in investing activities from continuing operations for the twelve months ended October 31, 2014 increased $167.2 million, to $466.5 million, from $299.3 million for the twelve months ended October 31, 2013. The $466.5 million for the twelve months ended October 31, 2014 primarily consists of the cash amounts paid for the DPP Acquisition and the Gallus Acquisition on September 29, 2014, and capital expenditures. The $299.3 million in cash used in investing activities for the twelve months ended October 31, 2013 consisted of the cash purchase for the Banner
69
Acquisition that occurred in December 2012 and capital expenditures. The $51.9 million in cash used in investing activities for the twelve months ended October 31, 2012 primarily consisted of capital expenditures on customer projects and capacity enhancements.
Our principal ongoing investment activities are project-related and sustaining capital programs at our network of sites. The majority of our capital allocation is normally invested in project-related programs, which are defined as outlays that will generate growth in capacity and revenues, while sustaining expenditures related to the preservation of existing assets and capacity.
Cash provided by financing activities
The following table summarizes the cash (used in) provided by financing activities for the periods indicated:
Three months ended January 31, |
Fiscal years ended October 31, |
||||||||||||||
| (in millions of dollars) | 2015 | 2014 | 2014 | 2013 | 2012 | ||||||||||
| Decrease in short-term borrowings | — | 13.0 | — | — | (3.8 | ) |
|||||||||
| Proceeds from long-term borrowings, net of original issue discount | 5.3 | — | 2,092.0 | 647.0 | 40.9 | ||||||||||
| Increase in deferred financing costs | — | — | (60.9 | ) |
(22.7 | ) |
— | ||||||||
| Repayment of debt, net of original issue discount in 2014 and penalty payment in 2013 | (10.6 | ) |
(12.2 | ) |
(674.0 | ) |
(353.5 | ) |
(11.1 | ) |
|||||
| Share issuance costs | — | — | — | (0.8 | ) |
— | |||||||||
| Proceeds on issuance of restricted voting shares | — | — | — | 35.9 | 0.3 | ||||||||||
| Excess tax benefit from share-based payment arrangements | — | — | — | 1.0 | — | ||||||||||
| Cash paid to acquire Patheon shares, net | — | — | (889.2 | ) |
— | — | |||||||||
| Cash (used in) provided by financing activities | (5.3 | ) |
0.8 | 467.9 | 306.9 | 26.3 | |||||||||
Cash used in financing activities for the three months ended January 31, 2015 was $5.3 million compared to cash provided by financing activities of $0.8 million for the three months ended January 31, 2014.
Cash provided by financing activities for the twelve months ended October 31, 2014 was $467.9 million compared $306.9 million for the twelve months ended October 31, 2013. The cash flow for the twelve months ended October 31, 2014 was primarily due to the refinancing and equity recapitalization activities in connection with the DPP Acquisition and the Gallus Acquisition. The cash flow for the twelve months ended October 31, 2012 was primarily from borrowings on our then-existing asset-backed loan.
Financing arrangements
Current credit arrangements
2014 term loans and revolving credit facility
On March 11, 2014, we completed the refinancing of our existing credit facility, or the Refinancing, pursuant to which we entered into a credit agreement, or the Credit Agreement, documenting a new credit facility, or the Credit Facility, for a U.S. dollar-denominated secured term loan in the amount of $985.0 million and a euro-denominated secured term loan in the amount of €250 million, or $345.0 million, (together, with the incremental term loans described below, or the Secured Term Loans, and a secured multi-currency revolving line in the amount of $200.0 million, or the Secured Revolving Facility. Up to $75.0 million of the Secured Revolving Facility is available for letters of credit. The Secured Term Loans mature on March 10, 2021, and the Secured Revolving Facility matures on March 10, 2019. The USD denominated Secured Term Loan bears interest at a
70
rate per annum equal to, at our option, a base rate plus 2.25% or the London Interbank Offered Rate, or LIBOR, with a floor of 1% plus 3.25%. The Euro denominated Secured Term Loan bears interest at a rate per annum equal to, at our option, a base rate plus 2.50% or LIBOR with a floor of 1% plus 3.50%. Borrowings under the Secured Revolving Facility bear interest for eurodollar loans at LIBOR with a floor of 1% plus 3.25%, Canadian prime rate loans at the Canadian prime rate plus 2.25%, and base rate loans at the base rate plus 2.25%. We will also pay a commitment fee of 0.50% per annum on the unused portion of the Secured Revolving Facility with a step down to 0.375% when the First Lien Leverage Ratio (as defined below) is less than or equal to 3.00 to 1.00.
On September 29, 2014, we entered into Amendment No. 1 to the Credit Agreement which added two incremental term loans to the Credit Facility; a USD denominated term loan in the amount of $160.0 million, and a Euro denominated term loan in the amount of €70.0 million, or $88.7 million. We used the proceeds for these two incremental term loans to fund a portion of the purchase price for the Gallus Acquisition. The other material terms of the incremental term loans are identical to those of the initial term loans. As of January 31, 2015, there were no borrowings outstanding under the Revolving Credit Facility.
Under the Secured Revolving Facility, we are required to maintain a First Lien Leverage Ratio below a certain amount for each of the Testing Periods as set forth in the Credit Agreement after such time as we have borrowed 25% or $50.0 million under the Secured Revolving Facility. For purposes of the Credit Agreement, a Testing Period means a single period consisting of the most recent four consecutive fiscal quarters ending on the covenant determination date. As of January 31, 2015, we were not required to calculate the First Lien Leverage Ratio as there were no borrowings outstanding under the Secured Revolving Facility. The following table discloses the maximum permitted First Lien Leverage Ratios permitted under the Credit Agreement:
| Testing Period Ending | Maximum Ratio |
| April 30, 2014 through October 31, 2014 | 6.75 to 1.00 |
| November 1, 2014 through October 31, 2015 | 6.50 to 1.00 |
| November 1, 2015 through October 31, 2016 | 6.25 to 1.00 |
| November 1, 2016 through October 31, 2017 | 6.00 to 1.00 |
| November 1, 2017 and thereafter | 5.75 to 1.00 |
Because we have not to date borrowed 25% or $50 million under the Secured Revolving Facility, we were not required to comply with the First Lien Leverage Ratio covenant described above at any time during three months ended January 31, 2015.
“First Lien Leverage Ratio” is generally defined in the Credit Agreement as the ratio of (i) the sum of the aggregate principal amount of our and our restricted subsidiaries’ indebtedness for borrowed money, principal amount of capital lease obligations and debt obligations evidenced by bonds, promissory notes, debentures or debt securities that is secured by a first priority lien on the collateral minus unrestricted cash and cash equivalents held by us and our restricted subsidiaries in each case set forth in the Credit Agreement to (ii) Consolidated EBITDA. Consolidated EBITDA is generally defined in the Credit Agreement as income (loss) from continuing operations before repositioning expenses, interest expense, foreign exchange losses reclassified from other comprehensive income (loss), refinancing expenses, acquisition-related costs, gains and losses on sale of capital assets, income taxes, asset impairment charges, depreciation and amortization, stock-based compensation expense, consulting costs related to our operational initiatives, purchase accounting adjustments, other income and expenses, non-cash charges, expenses related to the acquisitions pro forma cost savings from operational excellence initiatives and plant consolidations, pro forma synergies from the acquisitions among other adjustments. Consolidated EBITDA is not equivalent to Adjusted EBITDA, which, as discussed in Note 6, is our measure of segment performance.
We are required to make the following mandatory prepayments in respect of the Secured Term Loans: (i) 50% of Excess Cash Flow (as defined in the Credit Agreement) when we maintain a First Lien Leverage Ratio of greater than 4.00 to 1.00, with step downs to (a) 25% when we maintain a
71
First Lien Leverage Ratio of less than or equal to 4.00 to 1.00 but greater than 3.50 to 1.00 and (b) 0% when we maintain a First Lien Leverage Ratio of less than or equal to 3.50 to 1.00; (ii) 100% of the net cash proceeds of certain asset sales (including insurance and condemnation proceeds), subject to thresholds, reinvestment rights and certain other exceptions; and (iii) 100% of the net cash proceeds of issuances of debt obligations, subject to certain exceptions and thresholds. “Excess Cash Flow” is generally defined as Consolidated EBITDA (as defined in the Credit Agreement) plus, (i) decreases in working capital, (ii) extraordinary or nonrecurring income or gains and (iii) certain other adjustments, minus, (a) increases in working capital, (b) cash interest, (c) cash taxes, (d) cash capital expenditures (e) scheduled debt amortization and (f) certain other adjustments. No Excess Cash Flow payment was required for fiscal 2014. As the Excess Cash Flow calculation is performed annually, no payment is due for the three months ended January 31, 2015. We may voluntarily repay borrowings under the Credit Facility at any time. Any prepayment or repricing of Term Loans prior to March 29, 2015, is subject to a prepayment fee equal to 1.00% of the principal prepaid or repriced.
If we fail to maintain the applicable First Lien Leverage Ratio, we may nevertheless avoid a default by (i) repaying outstanding borrowings under the Revolving Credit Facility in an amount sufficient to avoid triggering the First Lien Leverage Ratio for that fiscal quarter or (ii) accepting a cash contribution of qualified equity in an amount which, if treated as Consolidated EBITDA, would bring us into compliance with the applicable First Lien Leverage Ratio for that fiscal quarter, in each case during the 11 business days following the deadline for delivery of our compliance certificate for that fiscal quarter. In addition, maintenance of the First Lien Leverage Ratio is required only with respect to the Revolving Credit Facility; the Term Loans do not directly benefit from the financial covenant and, until the Revolving Credit Facility is terminated and all outstanding borrowings thereunder are accelerated, will remain unaffected by a default under the Revolving Credit Facility that arises from our failure to maintain the applicable First Lien Coverage Ratio.
The Credit Agreement contains other customary terms, including (i) representations, warranties and affirmative covenants, (ii) negative covenants (in addition to the limitation on distributions and the requirement to maintain the First Lien Leverage Ratio levels as described above), such as limitations on indebtedness, liens, mergers, acquisitions, asset sales, investments, prepayments of subordinated debt, and transactions with affiliates, in each case subject to baskets, thresholds and other exceptions, and (iii) events of default, such as for non-payment, breach of other covenants, misrepresentations, cross default to other debt, change in control, bankruptcy events, ERISA events, unsatisfied judgments and actual or asserted invalidity of guarantees or security documents.
As of January 31, 2015, we were in compliance with the covenants in the Credit Facility.
Provided that we are in compliance with the First Lien Leverage Ratio test and no default under the Credit Agreement is continuing or would result therefrom, the covenant in the Credit Agreement that limits our ability to pay dividends or make other distributions to our shareholders generally permits (with certain exceptions and qualifications) us to pay dividends or make such distributions in an aggregate amount, when taken together with the aggregate amount of any prepayment, repurchase, redemption or defeasance of subordinated indebtedness, not to exceed the greater of (x) 3.00% of our consolidated total assets and (y) $65.0 million and (ii) in aggregate amount not to exceed the available amount (as defined in the Credit Agreement) at such time. Other than the return of capital discussed in Note 5, we historically have not paid dividends on our restricted voting shares.
The Credit Facility is guaranteed by certain of our wholly owned subsidiaries and secured by a first priority pledge on substantially all of our assets and the subsidiary guarantors, in each case subject to certain exceptions.
Consolidated EBITDA, which we refer to as Pro Forma Adjusted EBITDA, is based on the definition in the Credit Agreement, is not defined under U.S. GAAP and is subject to important limitations. We have included the calculation of Pro Forma Adjusted EBITDA, and associated reconciliations, for the
72
period presented below as Pro Forma Adjusted EBITDA is a component of certain covenants under the Credit Agreement. Because not all companies use identical calculations, our presentation of Pro Forma Adjusted EBITDA may not be comparable to other similarly titled measures of other companies.
Our Pro Forma Adjusted EBITDA for the last four fiscal quarters ended January 31, 2015 and October 31, 2014 based on the definition in our Credit Agreement, is calculated as follows:
Twelve Months Ended January 31, 2015 |
Twelve Months Ended October 31, 2014 |
|||||
| (in millions of U.S. dollars) | $ | $ | ||||
| Pro Forma Adjusted EBITDA | 456.2 | 427.2 | ||||
| Less: Trailing adjusted EBITDA from acquisitions | (4.9 | ) |
(23.2 | ) |
||
| Pro forma cost savings | (117.0 | ) |
(128.5 | ) |
||
| Other | (5.7 | ) |
(2.1 | ) |
||
| Adjusted EBITDA | 328.6 | 273.4 | ||||
| Adjusted EBITDA | 328.6 | 273.4 | ||||
| Depreciation and amortization | (110.1 | ) |
(92.9 | ) |
||
| Repositioning expenses | (70.6 | ) |
(53.5 | ) |
||
| Acquisition and integration costs | (61.6 | ) |
(60.4 | ) |
||
| Interest expense, net | (105.5 | ) |
(90.4 | ) |
||
| Impairment charge | (22.1 | ) |
(22.1 | ) |
||
| Gain on sale of capital assets | (0.2 | ) |
0.1 | |||
| Benefit from income taxes | (8.6 | ) |
(4.1 | ) |
||
| Refinancing expenses | (28.2 | ) |
(28.2 | ) |
||
| Operational initiatives related consulting costs | (10.2 | ) |
(10.1 | ) |
||
| Acquisition-related litigation expenses | (8.1 | ) |
(10.2 | ) |
||
| Stock-based compensation expense | (13.3 | ) |
(10.0 | ) |
||
| Purchase accounting adjustments | (11.8 | ) |
(11.8 | ) |
||
| Other | — | 1.0 | ||||
| Loss from continuing operations | (121.7 | ) |
(119.2 | ) |
||
| Add (deduct): |
||||||
| Depreciation and amortization | 110.1 | 92.9 | ||||
| Impairment charge | 22.1 | 22.1 | ||||
| Stock-based compensation | 13.3 | 10.0 | ||||
| Net change in non-cash working capital | (18.7 | ) |
9.7 | |||
| Net change in deferred revenues | 50.9 | 31.1 | ||||
| Non-cash interest | 26.2 | 24.8 | ||||
| Other, primarily changes in long-term assets and liabilities and deferred taxes | (37.9 | ) |
(46.4 | ) |
||
| Cash flows from operating activities | 44.3 | 25.0 | ||||
| Cash flows from investing activities | (482.6 | ) |
(466.5 | ) |
||
| Cash flows from financing activities | 461.8 | 467.9 | ||||
Pro forma cost savings represent the estimated annual financial impact of the actions related to our OE Program initiatives, headcount reductions, plant consolidation savings, and other synergies related to the DPP Acquisition and the Gallus Acquisition, as if such activities were completed at the beginning of the TTM period.
73
As discussed previously, we are only required to perform the first lien leverage ratio calculation after borrowing 25% or $50.0 million on the Secured Revolving Facility. As of January 31, 2015 there were no outstanding borrowings on the Secured Revolving Facility and the calculation performed below is for information purposes.
The calculation of the first lien leverage ratio, if required, would include total debt secured by a first priority lien as of January 31, 2015 of $1,498.6 million. Net debt is then calculated to be $1,431.6 million (total debt secured by a first priority lien less total cash as of January 31, 2015 of $67.0 million). As a result our first lien leverage ratio as of January 31, 2015, would be 3.14.
2014 Senior Unsecured Notes
In February 2014 we issued $450.0 million in aggregate principal amount of 7.50% senior unsecured notes due February 1, 2022, or the OpCo Notes, in a private placement, pursuant to which we entered into an indenture, or the Indenture, with a commercial bank acting as trustee, or the Trustee.
Interest on the OpCo Notes accrues at a rate of 7.50% per annum and is payable semiannually in arrears on each February 1 and August 1, commencing on August 1, 2014. Interest is computed on the basis of a 360-day year comprised of twelve 30-day months. The OpCo Notes are generally required to be guaranteed by each of our restricted subsidiaries that guarantees the Credit Facility or that guarantees other material indebtedness of ours or other OpCo Note guarantors.
Except for offers to purchase OpCo Notes upon certain asset sales or a change in control, no mandatory redemption or sinking fund payment is required with respect to the OpCo Notes.
Prior to February 1, 2017, we may redeem all or a portion of the OpCo Notes at a redemption price equal to the principal amount redeemed, plus unpaid interest accruing on the principal amount redeemed to (but excluding) the redemption date, plus a make whole premium equal to the greater of (a) 1% of the principal amount redeemed and (b) (i) 105.625% of the principal amount redeemed plus all required interest payments on that principal amount through February 1, 2017, discounted back to the redemption date, minus (ii) the principal amount redeemed.
On and after February 1, 2017, we may redeem all or a portion of the OpCo Notes at the applicable redemption prices set forth below (expressed as percentages of principal amount redeemed), plus unpaid interest accruing on the principal amount redeemed to, but excluding, the redemption date:
| Year | % |
| 2017 | 105.625% |
| 2018 | 103.750% |
| 2019 | 101.875% |
| 2020 and thereafter | 100.000% |
In addition, we may redeem all of the OpCo Notes at a redemption price equal to the principal amount redeemed, plus unpaid interest accruing to (but excluding) the redemption, upon certain adverse changes in applicable tax laws.
The Indenture does not require us to maintain compliance with any financial covenants. The Indenture does contain customary affirmative and negative covenants, including with respect to mergers, asset sales, restricted payments, restricted investments, issuance of debt and equity, liens, and affiliate transactions, subject to baskets and other exceptions. However, we will be exempt from many of the negative covenants if the OpCo Notes receive investment grade ratings from both Moody’s and S&P. The Indenture also contains customary events of default, such as for non-payment, breach of other covenants, misrepresentation, cross default to other material debt, bankruptcy events, unsatisfied judgments, and actual or asserted invalidity of guarantees.
As of January 31, 2015, we were in compliance with the covenants in the Indenture.
74
Effects of inflation
We do not believe that inflation has had a significant impact on our revenues or results of operations since inception. We expect our operating expenses will change in the future in line with periodic inflationary changes in price levels. Because we intend to retain and continue to use our property and equipment, we believe that the incremental inflation related to the replacement costs of such items will not materially affect our operations. However, the rate of inflation affects our expenses, such as those for employee compensation, which could increase our level of expenses and the rate at which we use our resources. While our management generally believes that we will be able to offset the effect of price-level changes by adjusting our service prices and implementing operating efficiencies, any material unfavorable changes in price levels could have a material adverse effect on our financial condition, results of operations and cash flows.
Off-balance sheet arrangements
We do not use off-balance sheet arrangements to structure any of our financial arrangements. We do not have any interests in unconsolidated special-purpose or structured finance entities.
Tabular disclosure of contractual obligations
Contractual repayments of long-term debt, commitments under operating leases, commitments under capital leases and purchase obligations as of October 31, 2014 were as follows:
Obligation as of October 31, 2014 |
|||||||||||||||
| (in millions of dollars) | Total | Year 1 | 2-3 Years | 4-5 Years | After 5 Years |
||||||||||
| Long-term debt (including capital leases) | $ | 2,013.0 | $ | 22.8 | $ | 39.5 | $ | 34.8 | $ | 1,915.9 | |||||
| Interest on long-term debt(1) | 660.7 | 101.1 | 200.1 | 197.2 | 162.3 | ||||||||||
| Operating leases | 31.8 | 8.8 | 10.9 | 6.9 | 5.2 | ||||||||||
| Purchase obligations(2) | 54.6 | 51.0 | 3.6 | — | — | ||||||||||
| Total contractual obligations(3) | $ | 2,760.1 | $ | 183.7 | $ | 254.1 | $ | 238.9 | $ | 2,083.4 | |||||
(1) Represents interest payments under our Credit Facility, OpCo Notes, capital leases and other long-term debt based on the applicable interest rates in effect on October 31, 2014. See “Note 8 – Long Term Debt” to our consolidated financial statements for further information.
(2) Purchase obligations relate to capital commitments to complete authorized capital projects.
(3) Not included in the table are other long-term liabilities, which include unfunded termination indemnities in the amount of $6.8 million, employee future benefits in the amount of $83.2 million and other long-term liabilities in the amount of $17.3 million. These other long-term liabilities either have no fixed payment dates or are not settled in cash. See Note 9 and Note 10 to our consolidated financial statements. In addition, the Senior PIK Toggle Notes and the Second Additional Term Loan Facilities were not included in this table as they were not outstanding as of October 31, 2014.
Critical accounting estimates
The preparation of our consolidated financial statements requires management to make estimates and assumptions that affect the reported amounts of assets, liabilities, revenues and expenses. These estimates and assumptions are based upon management’s historical experience and are believed by management to be reasonable under the circumstances. Such estimates and assumptions are evaluated on an ongoing basis and form the basis for making judgments about the carrying values of assets and liabilities that are not readily apparent from other sources. Actual results could differ significantly from these estimates.
Our critical accounting estimates are those we believe are both most important to the portrayal of our financial condition and results and require our most difficult, subjective or complex judgments, often because we must make estimates about the effect of matters that are inherently uncertain. Judgments and uncertainties affecting the application of those policies may result in materially different amounts being reported under different conditions or using different assumptions. We believe the following estimates are the most critical in understanding the judgments that are involved in preparing our consolidated financial statements.
75
Goodwill
As a result of the Banner Acquisition, the DPP Acquisition and the Gallus Acquisition, we recorded goodwill representing the excess of the purchase price over the fair value of the assets acquired and liabilities assumed. We test goodwill for impairment at least annually in the fiscal fourth quarter, or when indications of potential impairment exist. We monitor for the existence of potential impairment indicators throughout the fiscal year. Testing is performed with respect to each of our reporting units that have been allocated goodwill, which we have determined are the sites within our DPS, API, DFC, and Other (Biosolutions and BLS) segments.
We may initiate goodwill impairment testing by considering qualitative factors to determine whether it is more likely than not that a reporting unit’s carrying value is greater than its fair value. Such factors may include the following, among others: a significant decline in the reporting unit’s expected future cash flows; a sustained, significant decline in our stock price and market capitalization; a significant adverse change in legal factors or in the business climate, unanticipated competition; and slower growth rates; and changes in management, key personnel, strategy or customers. If our qualitative assessment reveals that goodwill impairment is more likely than not, we perform the two-step impairment test. Alternatively, we may bypass the qualitative test and initiate goodwill impairment testing with the first step of the two-step goodwill impairment test.
During the first step of the goodwill impairment test, we compare the fair value of the reporting unit to its carrying value, including goodwill. Determining the fair value of the reporting unit entails significant estimates and assumptions including, but not limited to, developing appropriate discount rates and estimating future cash flows from the reporting units products or services. If the fair value of a reporting unit exceeds its carrying value, then we conclude that no goodwill impairment has occurred. If the carrying value of the reporting unit exceeds its fair value, we perform the second step of the goodwill impairment test to measure possible goodwill impairment loss. During the second step, we hypothetically value the reporting unit’s tangible and intangible assets and liabilities as if the reporting unit had been acquired in a business combination. We then compare the implied fair value of the reporting unit’s goodwill to the carrying value of its goodwill. If the carrying value of the reporting unit’s goodwill exceeds the implied fair value of the goodwill, we recognize an impairment loss in an amount equal to the excess, not to exceed the carrying value of the reporting unit’s goodwill. Once an impairment loss is recognized, the adjusted carrying value of the goodwill becomes the new accounting basis of the goodwill for the segment. Due to uncertain market conditions and potential changes in our strategy, product and service portfolio or reporting units, it is possible that the forecasts we use to support goodwill could change in the future, which could result in goodwill impairment charges that would adversely affect our results of operations.
Intangible assets
As a result of the Banner Acquisition, the DPP Acquisition, and the Gallus Acquisition, we recorded various intangible assets, including technology, in process research and development, customer relationships, favorable agreements, regulatory permits, non-compete, and trade name. We will test for definite lived intangible assets whenever events or changes in circumstances indicate that the carrying amount will not be recoverable. If such indicators are present, we assesses the recoverability of the intangible assets by determining whether the carrying value of such assets can be recovered through undiscounted future cash flows. If the sum of the undiscounted cash flows is less than the carrying amount, the excess of the carrying amount over the estimated fair value, based on the discounted cash flows, is recorded as a charge to earnings.
For indefinite-lived intangible assets other than goodwill, we compare the fair value of the intangible asset with the asset’s carrying amount. If the fair value is less than the carrying amount, we will recognize an impairment. This impairment test for indefinite-lived intangible assets other than goodwill is conducted annually, concurrently with the goodwill test.
Impairment of long-lived depreciable assets
We test for impairment annually and whenever events or circumstances make it more likely than not that the fair value of our long-lived depreciable assets has fallen below its carrying amount. If
76
such indicators are present, we assess the recoverability of the assets or group of assets by determining whether the carrying value of such assets can be recovered through undiscounted future cash flows. In addition, the useful life over which cash flows will occur, their amount and the asset’s residual value, if any, are considered in the impairment calculation. In turn, measurement of an impairment loss requires a determination of fair value, which is based on the best information available. We derive the required undiscounted cash flow estimates from our historical experience and internal business plans. To determine fair value, we use quoted market prices when available, or our internal cash flow estimates discounted at an appropriate interest rate and independent appraisals, as appropriate. If the sum of undiscounted future cash flows is less than the carrying amount, the excess of the carrying amount over the estimated fair value, based on discounted future cash flows, is recorded as a charge to earnings.
Since the time of the DPP Acquisition in the second quarter of fiscal 2014, our Biosolutions business has experienced a reduction in customer contracts and we expect a significant reduction in revenues going forward for this business unit and hence considering new strategic options including selling this business. As a result an impairment calculation was required to be performed. The conclusion from the analysis performed was an impairment charge of $12.4 million consisting of the complete write-off goodwill and intangibles of the business unit of $2.2 million and a $10.2 million reduction in the value of the business unit’s capital assets.
During fiscal 2013, we closed our Olds, Alberta, Canada facility. We incurred approximately $4.0 million in severance and retention expenses along with $0.4 million in closing costs. These costs are in addition to the non-cash impairment charge relating to the Olds, Alberta, Canada facility of $11.8 million recorded in fiscal 2013.
Inventories
Inventories consisting of raw materials, packaging components, spare parts, work-in-process, and finished goods are valued at the lower of cost and net realizable value. These adjustments are customer specific estimates of net realizable value that we may ultimately realize upon the disposition of the inventories. We perform an assessment of excess, obsolete and problem products on an on-going basis.
We procure inventory based on specific customer orders and forecasts. Customers have limited rights of modification (for example, cancellations) with respect to these orders. Customer modifications to orders affecting inventory previously procured by us and purchases of inventory beyond customer needs may result in excess and obsolete inventory for the related customers. Although we may be able to use some excess components and raw materials for other products manufactured, a portion of the cost of this excess inventory may not be returned to the vendors or recovered from customers. Write-offs or write-downs of inventory could relate to:
| • | declines in the market value of inventory; |
| • | changes in customer demand for inventory, such as cancellation of orders; and |
| • | our purchases of inventory beyond customer needs that result in excess quantities on hand that we may not be able to return to the vendor, use to fulfill orders from other customers or charge back to the customer. |
Adjustments above are recorded as an increase to cost of goods sold.
Payments received from customers for excess and obsolete inventories that have not been shipped to customers or otherwise disposed of are netted against inventory reserves.
Our practice is to dispose of excess and obsolete inventory as soon as practicable after such inventory has been identified as having no value to us.
Employee future benefits
As of October 31, 2014, we provided defined benefit pension plans to certain employees in our Canadian, U.K., The Netherlands, Mexico, Austria, Germany and France operations and post-employment health and dental coverage to certain of our Canadian employees.
77
The determination of the obligation and expense for defined benefit pensions and other post-employment benefits is dependent on certain assumptions used by actuaries in calculating such amounts. The assumptions used in determining the projected benefit obligation and the net periodic benefit cost as of and for the year ended October 31, 2014 were as follows:
Projected benefit obligation
Defined Benefit Plans |
Other Benefit Plans |
|||||||||||
| 2014 | 2013 | 2014 | 2013 | |||||||||
| Discount rate | 3.5 | % |
4.4 | % |
4.2 | % |
4.3 | % |
||||
| Rate of future compensation increases | 3.4 | % |
3.1 | % |
— | — | ||||||
Net periodic benefit cost
Defined Benefit Plans |
Other Benefit Plans |
|||||||||||||||||
| 2014 | 2013 | 2012 | 2014 | 2013 | 2012 | |||||||||||||
| Discount rate | 4.0 | % |
4.6 | % |
4.9 | % |
4.6 | % |
4.3 | % |
5.2 | % |
||||||
| Expected long-term return on plan assets | 5.4 | % |
5.3 | % |
5.9 | % |
— | — | — | |||||||||
| Rate of future compensation increases | 3.0 | % |
3.1 | % |
3.5 | % |
— | — | — | |||||||||
An approximate 7% annual rate of increase in the per capita cost of covered health care and dental benefits was assumed for fiscal 2014, with the assumption that the rate will decrease gradually to 6% and will remain at that level thereafter. The following table outlines the effects of a one-percentage-point increase and decrease in the assumed health care and dental benefit trend rates.
| (in millions of dollars) | Benefit Obligation |
Benefit Expense |
||||
| Impact of: |
$ | $ | ||||
| 1% increase | 1.2 | 0.1 | ||||
| 1% decrease | (1.0 | ) |
(0.1 | ) |
||
Stock-based compensation
Patheon Holdings management equity incentive plan
Our parent adopted the JLL/Delta Patheon Holdings, L.P. 2014 Equity Incentive Plan, or the MEIP, with an effective date of March 11, 2014. The purpose of the MEIP is to provide eligible participants with an opportunity to receive grants of profits interests of the Partnership designated as management units, or the Units. The award of Units pursuant to the MEIP is intended to compensate employees of the Partnership and its subsidiaries. The participants in the MEIP, as a group, are eligible to participate in a portion of the return on investment received by JLL Patheon Co-Investment Fund L.P., or JLL Holdco, and DSM on their Partnership investment once certain specified distribution thresholds have been achieved. Units are subject to forfeiture if a participant terminates employment prior to certain time periods, the occurrence of certain exit events and the satisfaction of specified distribution thresholds.
The Monte Carlo simulation model was used under the option pricing method to value the Units. This model incorporates various assumptions including equity value, volatility, time to liquidity, risk-free rates and expected dividends.
The fair value of the Units for purposes of determining compensation expense was estimated on the grant date using the following weighted average assumptions:
| 2014 | |||
| Expected time to liquidity (in years) | 6.0 | ||
| Estimated equity volatility | 50 | % |
|
78
| 2014 | |||
| Risk free rate | 1.93 | % |
|
| Dividend rate | — | ||
We estimated the expected time to a liquidity event, as defined, for the Units. We estimated the volatility based upon the volatility observed for certain guideline companies and considering the Partnership’s expected financial leverage. The interpolated yield on treasury notes with maturities closest to the expected time to the liquidity event, as defined, was used (adjusted for continuous compounding). We do not intend to pay dividends in the foreseeable future and, accordingly, we use a dividend rate of zero in the Monte Carlo simulation model.
Incentive stock option plan
We use the fair value method of accounting for stock-based compensation. We use the Black-Scholes option-pricing model to estimate the fair value of the options granted. The determination of the fair value of stock-based awards on the date of grant using an option-pricing model is affected by our stock price as well as assumptions regarding a number of complex and subjective variables. These variables include our expected dividends, the risk-free interest rate, the expected life of the award and the expected stock price volatility over the term of the award. The principal assumptions we used during fiscal 2013 in applying the Black-Scholes model are outlined below. We did not grant any new stock options in fiscal 2014.
| 2013 | |||
| Risk free interest rate | 1.4 | % |
|
| Expected volatility | 60 | % |
|
| Expected weighted-average life of options (in years) | 5.1 | ||
| Expected dividend yield | 0 | % |
|
We used a dividend rate of zero in the option-pricing model based on our intention not to pay dividends for the foreseeable future. We used the Government of Canada five-year bond rate for the risk-free interest rate. The estimated life of the options was five years based on weighted-average life of these options, vesting period and management’s estimate based on stock volatility. Expected volatility was the measure of the amount by which our restricted voting shares price fluctuated or was expected to fluctuate during a period. We considered the historic volatility of our share price in estimating our expected volatility of 60%.
For both of the above stock-based compensation plans, if factors change and we employ different assumptions for estimating stock-based compensation expense in future periods or if we decide to use a different valuation model, the stock-based compensation expense we recognize in future periods may differ significantly from what we have previously recorded and could materially affect our operating income, and net income. These differences may result in a lack of consistency in future periods and materially affect the fair value estimate of our stock-based awards. They may also result in a lack of comparability with other companies that use different models, methods and assumptions.
Income taxes
We follow the liability method of income tax allocation. Under this method, deferred tax assets and liabilities are determined based on differences between the financial reporting and tax bases of assets and liabilities and are measured using the enacted tax rates and laws that will be in effect when the differences are expected to reverse.
Preparation of our consolidated financial statements requires an estimate of income taxes in each of the jurisdictions in which we operate. The process involves an estimate of our current tax expense and an assessment of temporary differences resulting from differing treatment of items such as depreciation and amortization for tax and accounting purposes. These differences result in deferred tax assets and liabilities and are reflected in our consolidated balance sheet.
79
We evaluate our ability to realize deferred tax assets on a quarterly basis. A valuation allowance is provided if, based upon the weight of available evidence, it is more likely than not that a portion of the deferred tax assets will not be realized.
The factors used to assess the likelihood of realization of these assets include our calculation of cumulative pre-tax book income or loss, turn-around of temporary timing differences, available tax planning strategies that could be implemented to realize the deferred tax assets, and forecasted pre-tax book income and taxable income by specific tax jurisdiction. Actual results may vary from these forecasts and result in a change in our ability to realize benefits of these tax assets in the future. If we are unable to meet our projected forecasts or implement certain tax planning strategies in jurisdictions for which there is currently no valuation allowance, we may be required to record additional valuation allowances.
During fiscal 2013, we determined that full valuation allowances on our net Canadian, French, and U.K. deferred tax assets was required due to cumulative losses in these jurisdictions. During fiscal 2013 we also determined that a partial valuation allowance was required on certain deferred tax assets within the United States. As a result, we recorded valuation allowances against our deferred assets in the United Kingdom, France, the United States and Canada which now totals $93.0 million.
During fiscal 2014, we determined that it is more likely than not that a portion of our tax assets in The Netherlands, Mexico and United States will not be realized and therefore required a valuation allowance against them. We also determined that a portion of our Austrian and German tax assets will not be realized and adjusted goodwill accordingly. Additionally, as a result of the DPP Acquisition, we received deferred assets in certain jurisdictions that were already fully valued. The net effect was an increase to the valuation allowance on our tax assets.
Deferred tax assets of $25.0 million and $7.0 million have been recorded at October 31, 2014 and 2013, respectively. These assets consist primarily of deferred revenue, accounting provisions related to items not currently deductible for tax purposes, the tax benefit of net operating loss carry-forwards, research and development investment tax credits and unclaimed research and development expenditures.
The deferred tax assets recorded at October 31, 2014 and 2013 are net of a valuation allowance of $282.7 million and $93.0 million, respectively.
Deferred tax liabilities of $54.0 million and $45.0 million have been recorded at October 31, 2014 and 2013, respectively. These liabilities are primarily a difference between book and tax basis in capital assets.
Our tax filings are subject to audit by taxation authorities. Although our management believes that it has adequately provided for income taxes based on the information available, the outcome of audits cannot be known with certainty and the potential impact on our consolidated financial statements is not determinable.
Segment information
The Company has determined it has four reportable segments: DPS, PDS, DSS and DFC. BLS, Biosolutions and Corporate are not individually reportable segments since the quantitative thresholds have not been met and as such have been reported in Other.
Quantitative and qualitative disclosures about market risk
Foreign currency risk
Our business is conducted in several currencies—Canadian dollars and U.S. dollars for our Canadian operations, U.S. dollars for our U.S. operations, Euros, U. S. dollars and British Sterling for our European operations, Australian Dollars for our Australian operations, and the Mexican Peso for our Mexican operations. We are subject to foreign currency transaction risk because a significant portion of our revenues and operating expenses from our operations in certain countries are denominated in different currencies. Our material foreign currency transaction risk arises from our
80
Canadian operations. Our Canadian operations negotiate sales contracts for payment in both U.S. and Canadian dollars, and materials and equipment are purchased in both U.S. and Canadian dollars. The majority of the non-material costs (including payroll, facilities’ costs and costs of locally sourced supplies and inventory) of our Canadian operations are denominated in Canadian dollars. In the twelve months ended October 31, 2014, approximately 90% of the revenues and 10% of the operating expenses of our Canadian operations were transacted in U.S. dollars. As a result, if we do not effectively hedge such foreign currency exposure, our results of operations will be adversely affected by an increase in the value of the Canadian dollar relative to such foreign currency. In addition, we may experience hedging and transactional gains or losses because of volatility in the exchange rate between the Canadian dollar and the U.S. dollar. Based on our current U.S. denominated net inflows, for each 10% change in the Canadian-U.S. dollar exchange rate, the impact on pre-tax income for the quarter, excluding any hedging activities, would be approximately $19.1 million.
To mitigate exchange-rate risk, we utilize foreign exchange forward contracts and collars in certain circumstances to lock in exchange rates with the objective that the gain or loss on the forward contracts and collars will approximately offset the loss or gain that results from the transaction or transactions being hedged. As of October 31, 2014, we had entered into 69 foreign exchange forward contracts covering approximately 81% of our Canadian-U.S. dollar cash flow exposures for fiscal 2014. See Note 13 to our consolidated financial statements. Our foreign exchange forward contracts mature at various dates through July 6, 2016 and have an aggregate fair value of $123.3 million. As of October 31, 2014, an adverse exchange rate movement of 10% against our foreign exchange forward contracts and collars would result in a pre-tax loss of approximately $12.3 million. As of January 31, 2015, the Company has entered into foreign exchange contracts to cover approximately 84% of its Canadian-U.S. dollar cash flow exposures for fiscal 2015.
In addition, as of October 31, 2014, we have designated €320.0 million of euro-denominated debt as a hedge against our net investment in our subsidiaries in Austria, The Netherlands, Germany, France and Italy. This hedge was designated at the time of the DPP Acquisition and the related refinancing that occurred on March 11, 2014 and is re-designated on a quarterly basis. Exchange gains of $33.0 million as of October 31, 2014 arising from this debt, from the date so designated, are recorded in accumulated other comprehensive income (loss) in shareholders’ (deficit) equity.
As of January 31, 2015, the Company has designated €320.0 million of euro-denominated debt (further discussed in Note 12) as a hedge against its net investment in its subsidiaries in Austria, The Netherlands, Germany, France and Italy. This hedge was designated at the time of the DPP Acquisition and the related refinancing that occurred on March 11, 2014 and is re-designated on a quarterly basis. There were cumulative exchange gains of $72.4 million as of January 31, 2015 arising from this debt, from the date so designated, are recorded in accumulated other comprehensive income (loss) in shareholders’ deficit.
Interest rate risk
As of October 31, 2014, our sources of variable rate long-term debt were comprised of the following. The table below assumes a fully drawn Secured Revolving Facility and does not include any potential hedging impacts.
| Total Borrowed/ Available |
Impact of 100 Basis Point Increase in Applicable Interest Rates |
|||||
| $ | $ | |||||
| USD Term Loan with a base rate plus 2.25% or LIBOR with a floor of 1% plus 3.25% rate, (currently 4.25%), and maturity date of March 10, 2021 | 1,142.1 | 11.4 | ||||
| Euro Term Loan (€320.0 million) with a base rate plus 2.50% or LIBOR with a floor of 1% plus 3.50% rate, (currently 4.50%), and maturity date of March 10, 2021 | 399.7 | 4.0 | ||||
81
| Total Borrowed/ Available |
Impact of 100 Basis Point Increase in Applicable Interest Rates |
|||||
| $200.0 million secured revolving credit facility maturing March 10, 2019, bearing interest for eurodollar loans at LIBOR with a floor of 1% plus 3.25%, Canadian prime rate loans at the Canadian prime rate plus 2.25%, and base rate loans at the base rate plus 2.25% | 200.0 | 2.0 | ||||
| Italian subsidized loan with annual interest rate of 0.5%, and maturity date of June 30, 2020 | 5.9 | 0.1 | ||||
| Italian bank loan with Euribor 6-month + 7.1% rate, and maturity date of June 30, 2020 | 0.7 | — | ||||
| Bourgoin equipment capital leases with a LIBOR plus 3.5% rate and maturities ranging from May 2014 through September 2016 | 0.5 | — | ||||
Credit risk
Credit risk arises from cash and cash equivalents held with banks and financial institutions, derivative financial instruments (foreign exchange contracts with positive fair values), and credit exposure to customers, including outstanding accounts receivable. The maximum exposure to credit risk is equal to the carrying value of the financial assets.
The objective of managing customer credit risk is to prevent losses in financial assets. The Company regularly assesses the credit quality of its customers, taking into account their financial position, past experience and other factors. Management also regularly monitors the utilization of credit limits. In cases where the credit quality of a customer does not meet the Company’s requirements, a cash deposit is received before any services are provided. As of January 31, 2015 and October 31, 2014, the Company held deposits of $12.2 million and $12.6 million, respectively.
Liquidity risk
Liquidity risk arises when financial obligations exceed financial assets available at a particular point in time. The Company’s objective in managing liquidity risk is to maintain sufficient readily available reserves in order to meet its liquidity requirements at all times. The Company mitigates liquidity risk by maintaining cash and cash equivalents on-hand and through the availability of funding from credit facilities. As of January 31, 2015, the Company was holding cash and cash equivalents of $67.0 million and had undrawn lines of credit available to it of $206.6 million.
82
Overview
Our company
Patheon is a leading global provider of outsourced pharmaceutical development and manufacturing, or CDMO, services. We provide a comprehensive, integrated and highly customizable range of active pharmaceutical ingredients, or API, and finished drug product services to our customers, from formulation development to clinical and commercial-scale manufacturing, packaging, and lifecycle management. Our services address both small molecule and large molecule biological drugs. We are the only end-to-end integrated provider of such services, which, combined with our scientific and regulatory expertise and specialized capabilities, allows our customers to partner with a single outsourced provider to address their most complex development and manufacturing needs. We believe we have the broadest technological capabilities in our industry, across the full spectrum of development and manufacturing, to support our end-to-end integrated platform.
We believe we are a critical partner for our customers who increasingly rely on our customized formulation, development and manufacturing expertise to address growing drug complexity, cost pressures and regulatory scrutiny. We partner with many of our customers early in the drug development process, providing us the opportunity to continue to expand our relationship as molecules progress through the clinical phase and into commercial manufacturing. This results in long-term relationships with our customers and a recurring revenue stream. We believe our breadth of services, reliability and scale addresses our customers’ increasing need to outsource and desire to reduce the number of supply chain partners while maintaining a high quality of service.
Through our end-to-end integrated service offering, known as “Patheon OneSource”, we provide our customers with comprehensive solutions for both small molecule and large molecule biological pharmaceuticals across our three main segments, including development and manufacturing services for API (Drug Substance Services, or DSS), formulation development and pre-clinical and clinical drug product manufacturing (Pharmaceutical Development Services, or PDS), and commercial drug product manufacturing and packaging (Drug Product Services, or DPS).
Our end-to-end integrated service offering allows us to provide a comprehensive suite of capabilities across different drug formulations to address our customers’ needs. Our specialized capabilities address 75% of all pharmaceutical dosage forms, with expertise and specialized capacity in high potency, controlled substances, low-solubility, sterile, modified release and softgel technologies. We are the number one global provider of PDS with capabilities spanning the full breadth of advanced scientific services from discovery to regulatory approval, including formulation development across approximately 40 dosage forms, analytical services, and lifecycle management. In DPS, we believe we are among the largest providers of aseptic “fill-finish” services for finished dose biological drug products, and a leader in the highly-complex development and manufacturing of biological drug substance through our four biological API facilities.
83
We provide development and manufacturing services for more than 800 products and molecules, and produce 24 billion solid doses and 150 million sterile doses annually, many of which address central nervous system, oncological and other life-threatening conditions. We believe we are the clear partner of choice for the pharmaceutical industry. Over the last decade, we have developed and manufactured 86 newly approved drugs, including 11 in 2014, which is more than twice the number of any other CDMO service provider. This represents 41% of the total outsourced approvals during this period. We serve a highly diverse, blue chip customer base comprised of more than 400 significant customers in over 60 countries, including all of the top 20 largest pharmaceutical companies, seven of the 10 largest biotechnology companies and seven of the world’s 10 largest specialty pharmaceutical companies.
We employ approximately 8,700 people, including 634 scientists, at more than 25 locations in the U.S., Canada, Europe, Australia, Japan and China. For the year ended October 31, 2014, our reported revenues were $1.7 billion.
The evolution of Patheon
In early 2011, James C. Mullen, who was previously the Chief Executive Officer of Biogen Idec Inc., one of the world’s largest biotech companies, joined Patheon as Chief Executive Officer, and assembled a leadership team that brought extensive pharmaceutical and healthcare sector experience, as well as a customer perspective to our business. Over the last four years, we have transformed our business into a global, end-to-end integrated service provider, and significantly enhanced our operating performance and growth potential. We made substantial investments in a broad range of technologies that provide our customers advanced development services, and operations systems that enable us to execute customer projects on-time and on-budget, while maintaining excellence in quality. As a result, we have positioned our business to meet the rapidly evolving development and manufacturing needs of our customers while continuing to deliver strong financial performance.
These strategic investments and operational changes implemented since 2011 have significantly improved our financial performance and provide the foundation for our future growth. These changes include:
| • | Implementing operational excellence initiatives throughout the company. Since 2011, we have implemented a series of continuous improvement projects as part of our company-wide operational excellence program, or OE Program, to enhance our manufacturing and operational processes. The program relies on several key levers, including Lean and Six Sigma principles, visual management tools and performance boards to monitor key indicators, and employee engagement and empowerment. Examples of actions that we have taken as a part of our OE Program include enhancing our labor productivity, improving our manufacturing yield through streamlining floor operations, consolidating procurement activities, and rationalizing facilities. Our OE Program is deeply ingrained in our corporate culture and significantly reduces production costs, improves productivity of our operating assets and employees, and drives an industry-leading customer experience. We rely on our OE Program to drive key customer metrics, such as RFT and OTD, which improve efficiency, reduce costs, enhance execution of client projects, and support growth by increasing manufacturing capacity and throughput. Our organization-wide focus on RFT and OTD, coupled with our technical capabilities and regulatory and scientific expertise, provides substantial value to our customers, allowing them to bring better products to market faster while reducing their manufacturing costs. This, in turn, drives customer retention, new business wins and higher profitability. We apply our OE Program to our entire existing manufacturing network, as well as to businesses that we acquire. |
| • | Establishing a global end-to-end integrated platform by investing $1.4 billion in five M&A transactions to expand the range of development and manufacturing services offered to our customers. Since 2012, we have acquired and integrated five companies: Banner Pharmacaps, DSM Pharmaceutical Products, Gallus BioPharmaceuticals, Agere Pharmaceuticals and IRIX Pharmaceuticals. Through our acquisitions, we have added attractive and differentiated capabilities and technologies for developing and manufacturing a broad array of complex small |
84
molecules and large molecule biologics, including capabilities in softgel, development and commercial scale biological and small molecule API, North American sterile capacity, and low-solubility dispersion technology. We have developed a system for integrating acquisitions based on our operational excellence capabilities that ensures seamless transition into Patheon and rapid realization of operating efficiencies, which translate into revenue and cost synergies. We believe our expertise in integrating acquisitions positions Patheon to lead the consolidation of the fragmented CDMO industry and add capabilities to further strengthen our value proposition to our customers.
| • | Enhancing our sales and marketing strategy and management team to facilitate strategic, solutions-based relationships with customers across multiple molecules and spanning a drug’s entire life cycle. Our global sales force is deeply embedded with our current customers and brings to bear the full resources and expertise of the Patheon organization to expand existing customer relationships and generate sales with new customers. We engage our senior management in the sales and marketing process to build strategic relationships and to enhance our customers’ experience. As a result of these efforts and our expanded capabilities, the number and value of our new business proposals have grown, our win rates and retention rates have increased significantly, and we continuously generate new business. |
These changes have transformed Patheon into a global business with a diversified revenue and customer base, and strong revenue and margin growth. From fiscal 2011 to fiscal 2014, our revenues have grown from $698 million to $1,705 million, and from fiscal 2011 to the quarter ended January 31, 2015, our gross margin expanded by 9%. In addition, we have diversified our customer base, with our top 10 customers accounting for 36% of revenues in the quarter ended January 31, 2015 versus 54% in fiscal 2011.
The chart below highlights key information about our business.
85
Our industry and customer trends
The global pharmaceutical industry is a large, growing market. We serve all key sectors of the industry across both small molecules and large molecule biologics, through solid dose forms, sterile products and other complex products such as controlled substances. Revenue for the pharmaceutical industry was $742 billion in 2014 and is expected to grow to $1 trillion in 2020, representing a compounded annual growth rate of 5.1%. This growth is driven by global, secular trends, including increasing demand for pharmaceuticals because of expanded insurance coverage in key markets, an aging population and increased life expectancy rates, a growing middle class in emerging markets and growth in specialty pharmaceuticals. We believe these factors will continue to drive unit growth and complexity, benefiting CDMOs such as Patheon.
The outsourcing of API and drug product development and manufacturing by the pharmaceutical and biotechnology industries is an important driver of growth in our business. In 2014, the pharmaceutical industry spent approximately $140 billion on formulation, development and manufacturing, according to Evaluate Pharma, and approximately $40 billion is expected to be outsourced to CDMOs such as Patheon in 2015, according to Root Analysis. Currently, only 25% to 30% of pharmaceutical industry spending on formulation, development and manufacturing is outsourced, and in the future it is expected that our customer base will expand the use of outsourcing to CDMOs because of changing industry dynamics, driving growth in our market. Industry sources indicate that the CDMO industry’s annual growth rate is expected to be higher than the growth rate in the overall pharmaceutical industry, with overall CDMO growth in the mid- to high single digits, and higher for finished dosage formulation services, specialized technologies such as solubility solutions, and pharmaceuticals requiring sterile production such as biological drugs, capabilities in which Patheon has extensive experience.
The key industry dynamics underlying CDMO industry growth include:
| • | Growing pricing and competitive pressures are forcing pharmaceutical and biotechnology companies to reduce fixed costs, reduce time to market for their new drugs, simplify historically complex supply chains and streamline vendor management, while ensuring reliability and quality. |
| • | Complex formulation challenges presented by many new products require expertise that is costly or impractical for pharmaceutical and biotechnology companies to build and operate in-house. For example, 60% to 90% of all new compounds entering development will need specialized manufacturing and/or molecular profile modification according to industry research in the American Pharmaceutical Review. |
| • | Growth in the number of drugs developed by emerging and mid-sized companies, which currently represents an estimated 80% of the drug pipeline. In 2014, approximately $40 billion of capital was raised to fund the development of drug pipelines of emerging biotechnology companies. For many of these companies, outsourcing to CDMOs such as Patheon is a critical component of their business model because they lack in-house formulation capabilities as well as the experience and infrastructure to manufacture the products themselves. |
| • | Increasing regulatory complexity and focus on compliance. The industry is highly regulated with oversight by the U.S. Food and Drug Administration, or FDA, and its counterparts globally. We believe this represents an opportunity for qualified and global CDMOs to expand market share as companies are looking for a partner such as Patheon with a track record of quality excellence and deep regulatory capabilities, in order to avoid the consequences of manufacturing and quality issues and regulator-ordered shutdowns, such as drug shortages and lost revenue and earnings. |
We serve the entire spectrum of customers, including large, mid-size and specialty pharmaceutical and biotechnology companies, emerging biotechnology companies, and generic pharmaceutical companies, as well as customers in other related areas, such as consumer or over-the-counter, nutritional and animal health companies, each with a distinct outsourcing dynamic:
| • | Large pharmaceutical and biotechnology companies are actively shrinking their fixed asset base and focusing on their core activities of research and development, or R&D, and sales and |
86
marketing. These companies are increasingly recognizing that development and manufacturing are a non-core activity and deciding to outsource instead of investing substantial capital in building specialized capabilities in-house to address their increasingly complex pipeline.
| • | Mid-size or specialty pharmaceutical and biotechnology companies are increasingly focused on sales, marketing, and late stage clinical development, as opposed to manufacturing and R&D, and as a result have limited internal capacity and capabilities and are outsourcing significant portions of their value chain. |
| • | Emerging pharmaceutical and biotechnology companies are being driven by venture and other investors to adopt virtual models that rely heavily on outsourcing through clinical proof-of-concept, and licensing to or acquisition by larger companies for late stage clinical development and commercialization. Due to the significant cost and time involved in switching service providers, companies such as Patheon with end-to-end integrated offerings are well-positioned to retain a molecule whether or not it is licensed or sold. |
| • | Generic pharmaceutical companies increasingly seek to outsource development and manufacturing of complex products they cannot produce with their existing infrastructure to third parties with such specialized capabilities given the importance of speed-to-market for these companies (for example, 180-day marketing exclusivity period for generic companies that are “first-to-file” under a patent challenge). |
Relative to the outsourcing rate for the contract research organization, or CRO, industry, the CDMO industry is underpenetrated in most of its sub-segments, creating significant growth opportunities for a CDMO with an end-to-end integrated offering such as Patheon due to a growing propensity by biopharmaceutical companies to outsource. We believe our sector will follow a similar trajectory to the CRO industry.
Current outsourcing penetration
In addition, the CDMO industry is highly fragmented, with more than 600 companies worldwide, many of which specialize in a single capability or are too small to achieve economies of scale and benefit from customer or product diversification. As a result of growing customer demand for scale providers with a broader range of services throughout the drug lifecycle, we believe there will be opportunities for a company such as Patheon to consolidate the industry through strategic acquisitions and to take market share from sub-scale competitors.
Our competitive strengths
We believe the following competitive strengths provide the foundation for our position as the leading provider of CDMO services:
| • | Sector-leading performance driven by continuous operational excellence improvement. Over the last four years we have implemented a major initiative to drive operational efficiencies across our global network of facilities and rapidly and effectively integrate acquisitions. These improvements, which are deeply embedded in our operations and culture, are aimed at aligning |
87
our operations and incentives around the key customer metrics of RFT and OTD. As a result, our on-time performance for delivering customer projects increased from 86% in 2011 to 93% in 2014, to which our customers ascribe significant value. In addition, through efficiency gains we have increased capacity by 21% over this period without significant capital investments and generated substantial cost savings from improvements to both existing operations and acquired businesses. We believe these continuous efforts will continue to unlock capacity, reduce costs and help drive margin improvements annually.
| • | End-to-end integrated capabilities. We provide a comprehensive, integrated and highly customizable range of API and finished drug product services to customers, from formulation development to clinical and commercial-scale manufacturing, packaging, and lifecycle management. Our services address both small molecule and large molecule biological drugs. We believe we are further differentiated by the wide range of formulation and manufacturing services we provide to our customers, which encompass 75% of the all pharmaceutical dosage forms, and by providing specialized capabilities our customers are increasingly seeking such as high potency, controlled substances, low-solubility, aseptic manufacturing, modified release and softgel formulations. Our breadth of technologies spanning development and manufacturing further support our end-to-end integrated platform, increasing product development speed and reducing costs for our customers by avoiding the time, regulatory burden and cost required to transfer a molecule to other service providers. |
| • | Extensive and long-term relationships with our customers from development through commercial manufacturing drives a recurring, highly-visible revenue stream. Our end-to-end integrated platform allows us to capture customer molecules early in the development process and retain them through full-scale commercial manufacturing, while efficiently and reliably maintaining quality in a complex supply chain. Over the last three years, 33% of our commercial manufacturing new product launches originated from our formulation and development projects. Since 2013, of the 27 PDS projects that received regulatory approval, 74% remained with Patheon for commercial manufacturing. Our drug product commercial manufacturing contracts generally extend five or more years and at least 90% of the products we currently manufacture are under contract through 2017. |
| • | Industry-leading reputation for quality and reliability across our global network. We are an industry leader in product quality and regulatory compliance. We have a culture of continuous improvement in quality, with internal standards and targets that exceed regulatory rules and customers’ internal standards. As a result, we believe we have one of the best track records in the industry for both pharmaceutical companies and outsourced providers. The increased regulatory scrutiny has resulted in industry supply disruptions or facility shutdowns, contributing to the recent record levels of drug shortages, including for numerous life-saving drugs. As regulatory requirements have become more stringent, many pharmaceutical companies have migrated to CDMO providers with a demonstrated ability to consistently meet quality and compliance standards. Patheon complements its industry-leading quality systems with a global network, which allows us to validate our customers’ products across multiple lines within a facility and across multiple facilities within our network to ensure supply security. In addition, our focus on RFT and OTD metrics underpin our industry-leading position for customer service. |
| • | Proven management team. Our management team is highly experienced, possesses deep industry knowledge and is operationally focused. The senior team, including our Chief Executive Officer, James C. Mullen, has incorporated the customer perspective from extensive careers in the pharmaceutical industry. Under Mr. Mullen’s leadership, we have repositioned our business by executing on our operational excellence initiatives and undertaking five acquisitions to establish Patheon as the only end-to-end integrated provider of CDMO services. |
88
Our growth strategy
Our strategy is to grow top-line revenues organically, increase margins through operational efficiency initiatives and operating leverage from incremental revenue, and acquire and integrate companies that complement our existing platform. The key elements of our growth strategy are:
| • | Leverage our end-to-end platform and global scale to extend our position as the leading integrated CDMO. The highly customizable services we provide throughout the product life cycle afford us significant opportunities to respond to growing customer demand for supply chain simplicity, development and manufacturing speed, and quality. Our PDS capabilities allow us to partner with our customers early in the development process of their molecules providing a pipeline of molecules for our commercial manufacturing services as the molecules progress through the clinical phase and into commercial manufacture. In fiscal 2014, we had PDS projects for 618 drugs in clinical development, including 235 Phase 1 projects, 110 Phase 2 projects and 203 Phase 3 projects. During our evolution over the past four years, we have aligned our sales, marketing and management functions, on all organizational levels, to cross-sell the breadth of our capabilities and market the “Patheon OneSource” service offering. We believe this strategy will continue to drive business across all customer segments, and represents a high-dollar value, high-margin growth opportunity. |
| • | Continue operational excellence initiatives to optimize capacity and efficiency, reduce costs and drive outstanding financial performance. Our organization-wide operational excellence efforts focus on improving manufacturing efficiency and quality, driving cost savings, increasing capacity and creating value throughout the manufacturing chain. We intend to continue maximizing revenue growth and margin expansion through our resulting expanded capacity and facility utilization. For example, we have increased capacity by 21% since 2011, and our current utilization of 49% allows us to continue to launch new projects without significant investment in new facilities. We believe that this continuous focus on operational excellence will drive margin improvements and support robust revenue growth on an annual basis, which should result in significant operating leverage. |
| • | Target high-growth, high-value areas of the pharmaceutical and biotechnology industries. Our customers increasingly seek complex drug formulations and delivery technologies that exceed their own in-house capabilities. We intend to use our broad range of specialized dosage and formulation solutions, which include high potency, softgel, controlled substance, modified release and sterile dosage forms, to serve this market segment. For example, our acquisition of Gallus BioPharmaceuticals provided us with capabilities for complex clinical and commercial scale biologics manufacturing in the key U.S. market. We believe our expertise in these areas and the breadth of services we provide are differentiators for Patheon. |
| • | Selectively pursue strategic investments and acquisitions to support expanding customer needs and complement our existing platform. As a customer-driven company we have invested in new specialized technologies, expanded capacity in high-demand capabilities, and broadened our capabilities in high value-added product and service offerings in response to market demand. For example, in response to growing demand for pre-filled syringes to deliver biological molecules, we completed construction of a new production line in a European sterile facility in late 2013. In addition, we have acquired five companies since 2012, including three acquisitions between September 2014 and March 2015, each of which provided new or expanded capabilities and scale for our end-to-end integrated offering. We plan to continue adding complementary, high-value technological and operational capabilities and service offerings to meet customer needs through investment, acquisitions and collaborations. We expect Patheon will continue to be an active, disciplined consolidator of the fragmented CDMO industry to complement our organic growth strategy. |
89
Our operational excellence program
Since 2011, we have implemented a series of continuous improvement projects as part of our company-wide operational excellence program, or OE Program, to enhance our manufacturing and operational processes. Our OE Program is deeply ingrained in our corporate culture and is designed to significantly reduce production costs, improve productivity of our operating assets and employees, and drive an industry-leading customer experience. In addition, our OE Program serves as a critical tool to assist in rapidly and seamlessly integrating acquired businesses and achieving cost synergies. Our OE Program, Driving Performance eXponentially, is built upon the cumulative strengths and successes of legacy initiatives, and was developed in close collaboration with a preeminent global consultancy firm.
Our OE Program is centered on a commitment to delivering services and products to our customers “right the first time” and “on time”, which we believe in turn drives customer retention and new business wins. The program relies on several key levers, including Lean and Six Sigma principles, visual management tools and performance boards to monitor key indicators, as well as employee engagement and empowerment. These three components allow quality, timeliness and efficiency to be measured and monitored by all employees, from workers on the factory floor to our Chief Executive Officer, and we believe result in better performance and customer satisfaction. This has directly improved our operating performance, increased capacity within our existing facility network and enhanced operating efficiencies, resulting in enhanced operating margins. Examples of actions that we have taken as a part of our OE Program and the resulting operational and financial benefits include:
| • | Labor savings driven by streamlining floor operations, optimizing shift structures and improving organizational design, and improving site systems and processes; |
| • | Yield improvement as a result of reduction in manufacturing losses related to quality, equipment readiness, and continuously enhancing staff training; |
| • | Energy savings driven by enhanced performance management (tracking, target setting and root-cause problem solving); and |
| • | Improvements driven by reduction in direct labor, factory overhead, and SG&A staff. |
In addition, we have consolidated procurement activities, rationalized facilities, and moved non-core administrative functions to lower cost jurisdictions through a business process outsourcing initiative. Typically, the impact of any given operational improvement is modest; however, the aggregate impact of hundreds of process improvements in each facility across the entire manufacturing network has a significant financial impact.
We continue to drive our OE Program globally. Each site goes through a structured process, starting with a diagnostic phase that includes gathering data on the site, followed by an implementation stage, with active sponsorship from site leadership and driven by seasoned OE leadership from sites that have already put such OE programs in place. Thereafter we focus on stabilizing, improving, and tracking the implemented programs. Once initially implemented in a given facility, our OE Program then focuses on continuous improvement which continues to yield operating efficiencies, cost savings and ongoing margin expansion.
Our services
The development and manufacture of pharmaceuticals is a complex, multi-step process involving the following:
| • | Development of a manufacturing process for and production of the active pharmaceutical ingredient or biologic substance; |
| • | Development of a suitable formulation; production at pilot scale; |
| • | Technology transfer to scale up the manufacturing; and |
| • | Commercial scale manufacturing and packaging. |
90
Through our end-to-end integrated platform, we provide the entire spectrum of development and manufacturing services for both small molecule and large molecule biological pharmaceuticals. We operate three core lines of business that span the value chain for formulation, development and manufacturing services: DPS, PDS, and DSS.
Drug Product Services
We believe we are the world’s second largest DPS provider with an approximate 7% global market share based on calendar year 2014 market size provided by Roots Analytics. In fiscal 2014, DPS had revenues of $1,196.5 million, which was 60% of our total revenues.
Our DPS business segment provides manufacturing and packaging for approved prescription, OTC, and nutritional products. We manufacture both small molecule and large molecule biologic products for customers in conventional and specialized dosage forms. We differentiate ourselves by our breadth of dosage forms and specialized capabilities. Small molecule dosage forms include both coated and uncoated compressed tablets and hard shell gelatin capsules. Our specialized capabilities relate to high potency, controlled substance, modified release and softgel technology dosage forms including sterile injectables, solid oral conventional and specialized dosages, such as softgel, high potency, controlled substances and modified release. Our sterile dosage forms include aseptically (sterile) filled and terminally sterilized liquids and vials, bottles and pre-filled syringes/cartridges and sterile lyophilized (freeze-dried) products in vials. DPS operations are located at 11 facilities in North America and Europe.
Our DPS customer base is diverse. In fiscal 2014, we provided DPS services to more than 260 different groups, which included large and mid-size pharmaceutical, biotechnology and generic pharmaceutical companies, comprising 44%, 23%, 14%, and 12% of our fiscal DPS revenues, respectively. The remaining revenues were from early stage and other pharmaceutical customers. In fiscal 2014, the top 20 DPS different groups represented approximately 71% of our DPS total revenues.
Typically, we enter into contracts with our DPS customers that are 5 years or longer, providing a stable, recurring revenue base with substantial forward visibility. Of the DPS products we manufactured in 2010, we still manufacture 78% and the revenues we derived from these products in fiscal 2014 exceeded the revenues we derived from all DPS products in 2010.
Over the last decade, we have developed and manufactured 86 newly approved drugs, including 11 in 2014, which is more than twice the number of any other CDMO. This represents 41% of the total outsourced approvals during this period.
Pharmaceutical Development Services
We believe we are the world’s largest PDS provider, with approximately 9% global market share. In fiscal 2014, our PDS segment produced approximately $165.2 million, or 10% of our total revenues.
Our PDS business segment provides a wide spectrum of advanced formulation, production and technical services and scientific expertise and solutions from the early stages of a product’s development to regulatory approval and new formulations of approved products for lifecycle extension. The specific services we provide include: early development; pre-formulation, formulation and development of dosage forms; manufacturing of development stage products during the regulatory drug approval process, including manufacturing of pilot batches; scale-up and technology transfer services designed to validate commercial-scale drug manufacturing processes; and development of analytical methods and delivery of analytical services. We operate nine development facilities in North America and Europe.
91
We provide solutions for our clients across approximately 40 dosage forms, representing about 75% of all dosage forms.
The table below highlights certain of our dosage forms:
| Solid Oral | Softgels |
| Conventional | Liquid-filled capsules |
| Immediate release tablets | Softgel capsules |
| Powders/granules/coated beads | Twist off softgels |
| Powder filled capsules | EnterCare Enteric softgels |
| LiquiSoft Chewable Liquid Filled Softgels | |
| Specialized | Versatrol Controlled Release Softgels |
| Multi-layered tablets | Solvatrol Enhanced Solubility Softgels |
| Fast dispersible tablets | Soflet Gelcaps |
| Controlled release tablets | Chewels Chewable Gels |
| Ecocaps Non-animal Softgels | |
| Sterile | |
| Liquid Small Volume Parenteral (SVP) | Highly Regulated Products |
| Liquid Large Volume Parenteral (LVP) | Controlled Substances |
| Lyophilized Vial | High Potency |
| Prefilled Syringes | Unique Solutions |
| Cartridges |
Our PDS segment is a strategic feeder to our DPS segment because of our in-depth understanding of a molecule we have helped develop and the high cost and time to switch pharmaceutical service providers as that molecule progresses into commercial manufacturer. Contracts in our PDS segment typically range from three to 12 months. During fiscal 2014, we were awarded DPS contracts for 13 new products that had been developed by our PDS. Eighty-seven former PDS projects are expected to contribute to 2015 DPS revenues. Over the last three years, 33% of our commercial manufacturing new product launches originated from our formulation and development projects. Since 2013, of the 27 PDS projects that received regulatory approval, 74% remained with Patheon for commercial manufacturing.
In fiscal 2014, we worked on approximately 634 projects for our customers, including 618 drug candidates at the investigational new drug, or IND, application stage, which is when the drug is in clinical development but not yet approved for marketing.
Among the projects we worked on during fiscal 2014, 235 Phase 1 projects, 110 Phase 2 projects and 203 Phase 3 projects as well as other projects at the pre-clinical and post-approval stage. Since the beginning of 2004, our PDS business has developed on behalf of our customers 41 new molecular entities, or NME, that have been approved for marketing by regulatory authorities, as well as numerous new formulations of existing NMEs. Any patent and drug approvals that we obtain, or help to obtain, belong to our customers. We believe our customers value our service-oriented business model as we do not receive royalties or earn revenues from products or NMEs that we develop, or help to develop, other than for the development services we provide.
We have a diverse PDS customer base, with emerging companies representing 80% of our customers, which is consistent with the current composition of the global drug pipeline, with the balance represented by midsize, large pharmaceutical and biotechnology companies and other customers.
Our development group, comprises approximately 634 scientists and technicians, including approximately 53 holding doctoral degrees, and another 143 holding Master’s in Science degrees, with extensive development experience across a wide variety of pharmaceutical dosage forms.
92
Drug Substance Services
Our DSS segment provides development and manufacturing services for the biologically active component of pharmaceutical products under current good manufacturing practice, or cGMP, conditions from early development through commercial production. Our service offerings address small molecules, produced through chemical synthesis, and large molecule biologics such as antibodies and proteins produced through mammalian cell culture. In fiscal 2014, our DSS segment produced approximately $188.9 million or 11% of our total revenues.
We operate two small molecule active pharmaceutical production facilities, located in Linz, Austria and Regensburg, Germany, and four biologics active drug substance development and manufacturing facilities, located in St. Louis, MO, Princeton, NJ, Groningen, The Netherlands and Brisbane, Australia. In fiscal 2014, our DSS segment generated revenues of $188.9 million, which represented 11% of our revenues. We provided DSS services for 78 development stage molecules and 41 molecules for commercial use in approved products.
Our biologics capabilities include several proprietary technologies that enable us to produce and purify our clients’ biological substances. These technologies are provided as part of our service to clients. We do not receive milestones or royalties for their use (see “—Intellectual property”). These technologies include:
| • | XD technology, a broad-based proprietary platform technology to significantly boost the upstream output of mammalian cell culture processes |
| • | Rhobust, a unique, proprietary capture/clarification technology, acquired to complement the value created by XD technology |
| • | Kremer Method for purification in downstream processing and for supporting continuous manufacturing improvements |
We have a broad set of technologies and capabilities for complex chemistries to support API development and production of small molecules. These technologies include:
| • | Micro reactor – technology for integrating process development, production and downstream processing from laboratory to plant scale in multiproduct production environments under cGMP conditions |
| • | Ozonolysis – process for using ozone to create organic compounds such as alcohols, aldehydes or acids. Our capabilities extend from process development at laboratory scale to large-scale production |
| • | Polymers – production, purification and finalization of polymers (hydrogels) for pharmaceutical application, including specialized equipment for cutting and drying |
| • | Hazardous materials handling – experience in on-site-on-demand production and use of hazardous reagents for productions under cGMP conditions |
Non-core operations
DPx Fine Chemicals
Our DFC segment provides synthesis to customers in the agricultural chemical industry and maleic anhydride and many specialty esters used in a broad range of industries and specialty products. Our DFC segment generated revenue of $167.8 million, or 9.8% of our total revenue in fiscal 2014. DFC operates out of our Linz, Austria site, which it shares with our API business.
Other
Biosolutions
Our Biosolutions business produces a variety of microorganisms and anti-infective, enzyme, and pharmaceutical protein products.
93
Since the completion of the DPP Acquisition in the second quarter of fiscal 2014, our Biosolutions business has experienced a reduction in customer contracts that we expect to result in a reduction in revenues going forward, and we are considering new strategic options for the Biosolution business, including selling the business.
Banner Life Sciences
BLS is our proprietary products business. BLS is focused on research and development, in-licensing, out-licensing and commercialization of innovative formulations for the pharmaceutical industry, as well as the marketing of prescription, over-the-counter and nutritional products.
In March 2015, our board of directors authorized us to pursue a spin-off of our BLS business, which we plan to complete prior to closing of this offering.
On May 12, 2015, we completed the sale of Banner Mexico for a purchase price of $34.0 million.
Customers and customer relationships
We provided services to approximately 400 significant customers worldwide in fiscal 2014. Our customers include the world’s 20 largest pharmaceutical companies, seven of the world’s top ten global biotechnology companies and seven of the world’s ten largest specialty pharmaceutical companies. For fiscal 2014 our top 10 customers accounted for approximately 39% of our revenues. Our largest customer represented 7% of revenues in fiscal 2014, and no single product accounted for more than 4% of revenues. Our top customers work with us across multiple areas; on average our top 10 customers work with us in about three out of four segments.
We believe the increasing use of outsourcing by pharmaceutical companies is creating opportunities for us to move from transactional to more strategic relationships with our customers. In line with our strategy of providing end-to-end, integrated services, and broader, deeper client relationships, we have entered into several master service agreements with customers that envision long-term, multi-product and multi-site across multiple segments. For example, we have executed a five-year master supply agreement with a global pharmaceutical company to provide development and manufacturing services. In addition, we have entered into arrangements with customers that have shut down or downsized their facilities, under which the associated production has been transferred to us. We have also entered into a seven-year manufacturing agreement that led to construction of a new manufacturing facility within one of our existing sites with significant financing from the customer. To facilitate such deeper arrangements, we have developed master service agreement templates for both our PDS and DPS services to allow for the addition of new projects and products without having to renegotiate terms and conditions.
Sales and marketing
Our global sales and marketing group is responsible for generating new business. Each of our territory-based sales teams is responsible for identifying new customer opportunities, maintaining existing customer relationships and generating sales from these customers within its territory. Our Americas territory-based sales team is comprised of 21 members and covers the United States and Canada. We also have a territory-based sales team covering Europe and Japan, which is comprised of 18 members. Each sales team seeks to generate sales across our entire network. Determination of which site, or sites, will perform specific services is dictated by the nature of the customer’s product, our capabilities and customer preferences. We also engage senior management in the sales and marketing process to build more strategic relationships with our customers and to enhance customer experience.
The projects of our existing customers are managed by site-based project managers and business managers, who also play an integral role in the sales process by ensuring that the existing projects meet our customers’ expectations and understanding our customers’ projects and evolving needs. These activities can assist the site-based teams in obtaining additional work on existing projects and identifying new projects with existing customers.
94
Our sales team is supported by global marketing, sales operations, business development services and business intelligence groups located at our U.S. headquarters in Durham, North Carolina, and regional support resources in Europe and Japan.
Properties
We have more than 25 locations in the U.S., Canada, Europe, Australia, Japan and China. The following table provides additional information about our principal manufacturing and development centers:
| Location | Country | Segment | Square Footage per Property Footnote |
Owned / Leased |
||||
| Linz | Austria | DFC / DSS | 2,164,180 | Owned | ||||
| Greenville, NC | United States | DPS / PDS | 1,451,527 | Owned | ||||
| Manati | Puerto Rico | DPS | 546,872 | Owned | ||||
| Cincinnati, OH | United States | DPS / PDS | 495,700 | Owned | ||||
| Monza | Italy | DPS | 463,229 | Owned | ||||
| Swindon | United Kingdom | DPS | 355,511 | Owned | ||||
| Bourgoin - Jallieu | France | DPS / PDS | 355,228 | Owned | ||||
| Capua | Italy | Other | 293,000 | Owned | ||||
| Ferentino | Italy | DPS / PDS | 290,473 | Owned | ||||
| Mississauga | Canada | DPS / PDS | 285,570 | Owned | ||||
| High Point, NC | United States | DPS / PDS / Other | 243,000 | Owned | ||||
| Whitby | Canada | DPS / PDS | 233,664 | Owned | ||||
| St. Louis, MO | United States | DSS | 200,000 | Owned | ||||
| Tilburg | The Netherlands | DPS / PDS / Other | 97,000 | Owned | ||||
| Brisbane(3) | Australia | DSS | 86,400 | Leased | ||||
| Regensburg(5) | Germany | DSS | 72,000 | Leased | ||||
| Greenville, SC | United States | DSS | 64,970 | Owned | ||||
| Princeton, NJ(2) | United States | DSS | 57,000 | Leased | ||||
| Groningen, Zuiderweg | The Netherlands | DSS | 51,000 | Owned | ||||
| Florence, SC | United States | DSS | 43,704 | Owned | ||||
| Bend, OR(4) | United States | PDS | 22,939 | Leased | ||||
| Groningen, Rozenburglaan(6) | The Netherlands | DSS | 19,500 | Leased | ||||
| Milton Park(1) | United Kingdom | PDS | 13,500 | Leased | ||||
(1) Our Milton Park facility is subject to a lease from Lansdown Estates Group Limited until the year 2020, with an annual minimum rent of $0.2 million, based on an average foreign exchange rate of British pound sterling to USD for fiscal 2014 of 1.6565.
(2) Our Princeton, NJ facility is subject to a lease from College Road Associates LLC until November, 2016, with an annual minimum rent of $1.3 million.
(3) Our Brisbane facility is subject to a lease from the State of Queensland until the year 2023, with an annual minimum rent of $1 million, based on an average foreign exchange rate of Australian dollar to USD for fiscal 2014 of 0.9245.
(4) Our Bend, OR operations occupy four separate leased premises and are subject to leases from two separate landlords – Basalt Lot 12 LLC (10,072 square feet), and Deschutes Properties LLC (12,867 square feet). The Basalt lease is set to expire in October, 2015 with the Deschutes Properties lease will expire in the year 2018. Combined annual minimum rent for these facilities is $0.3 million.
(5) Our Regensburg, Germany facility is subject to a lease from Dr. Hubert Ampferl until the year 2020, with an annual minimum rent of $0.3 million, based on an average foreign exchange of the Euro to USD for fiscal 2014 of 1.3488.
(6) Our Groningen (Rozenburglaan), The Netherlands facility is subject to a lease from Visser Vastgoed Belegingen B.V. until the year 2018, with an annual minimum rent of $0.4 million, based on an average foreign exchange of the Euro to USD for fiscal 2014 of 1.3488.
We also lease facilities in Research Triangle Park, North Carolina, Framingham, Massachusetts, Tokyo, Japan (sales office), Shanghai, China (sales office), Utrecht, The Netherlands (sales office), High Point , North Carolina (warehouse space), Linz, Austria (warehouse space) and Princeton, New Jersey (warehouse space).
95
Certain of these facilities are pledged as collateral for our Secured Term Loan and Revolving Facility. See “Management’s discussion and analysis of financial condition and results of operations— Liquidity and capital resources—Financing arrangements.” We believe that our facilities are adequate for our operations and that suitable additional space will be available when needed.
Competition
We operate in a market that is highly competitive. We compete to provide services to pharmaceutical companies around the world.
Our competition in the DPS market includes full-service pharmaceutical outsourcing companies; contract manufacturers focusing on a limited number of dosage forms; contract manufacturers providing multiple dosage forms; and large pharmaceutical companies offering third-party manufacturing services to fill their excess capacity. In addition, in Europe, there are a large number of privately owned, dedicated outsourcing companies that serve only their local or national markets. Also, large pharmaceutical companies have been seeking to divest portions of their manufacturing capacity, and any such divested businesses may compete with us in the future. We compete primarily on the basis of the security of supply (quality, regulatory compliance and financial stability), service (on-time delivery and manufacturing flexibility), capabilities, cost-effective manufacturing and scale.
Our competition in the PDS market includes a large number of laboratories that offer only a limited range of developmental services, generally at a small scale; providers focused on specific technologies and/or dosage forms; and a few fully integrated companies that can provide the full complement of services necessary to develop, scale-up and manufacture a wide range of dosage forms. We also compete in the PDS market with major pharmaceutical and chemical companies, specialized contract research organizations, research and development firms, universities and other research institutions. We may also compete with the internal operations of pharmaceutical companies that choose to source PDS internally. We compete primarily on the basis of scientific expertise, knowledge and experience in dosage form development, availability of a broad range of equipment, RFT, OTD of clinical materials, compliance with cGMPs, regulatory compliance, cost effective services and scale.
Some of our competitors may have substantially greater financial, marketing, technical or other resources than we do. Additional competition may emerge and may, among other things, result in a decrease in the fees paid for our services.
One of the many factors affecting competition is the current excess capacity within the pharmaceutical industry of facilities capable of manufacturing drugs in solid dosage forms. Thus, customers currently have a wide range of supply alternatives for these dosage forms. Another factor causing increased competition is that a number of companies in Asia, particularly India, have been entering the sectors in which we compete over the past few years, have begun obtaining approval from the FDA for certain of their plants and have acquired additional plants in Europe and North America. One or more of these companies may become a significant competitor to us.
Intellectual property
We rely on a combination of trademark, patent, trade secret, copyright and other intellectual property laws in the United States, The Netherlands, Canada and other countries. We have applied in the United States The Netherlands, Canada and in certain foreign countries for registration of a limited number of trademarks and patents, some of which have been registered or issued. Also, many of the formulations used by us in manufacturing products to customer specifications are subject to patents or other intellectual property rights owned by or licensed to the relevant customer. Further, we rely on non-disclosure agreements and other contractual provisions to protect our intellectual property rights and typically enter into mutual confidentiality agreements with customers that own or are licensed users of patented formulations.
We have patents and trademarks and have acquired and developed and continue to acquire and develop knowledge and expertise, or know-how, and trade secrets in the provision of services in our
96
businesses, including know-how and trade secrets related to proprietary softgel technologies and patents, trademarks, know-how and trade secrets related to advanced intermediates, finished dose pharmaceutical contract manufacturing, microbial fermentation manufacturing, and mammalian technology development and manufacturing. Our know-how and trade secrets in our businesses may not be patentable, but they are valuable in that they enhance our ability to provide high-quality services to our customers.
To the extent that we determine that certain aspects of the services we provide are innovative and patentable, we have filed and pursued, and plan to continue to file and pursue, patent applications to protect such inventions, as well as applications for registration of other intellectual property rights, as appropriate. However, we do not consider any particular patent, trademark, license, franchise or concession to be material.
Regulatory matters
We are required to comply with the regulatory requirements of various local, state, provincial, national and international regulatory bodies having jurisdiction in the countries or localities where we manufacture products or where our customers’ products are distributed. In particular, we are subject to laws and regulations concerning research and development, testing, manufacturing processes, equipment and facilities, including compliance with cGMPs, labeling and distribution, import and export, and product registration and listing. As a result, most of our facilities are subject to regulation by the FDA, as well as regulatory bodies of other jurisdictions, such as the EMA, Health Canada, National Health Surveillance Agency in Brazil, or Anvisa, and/or the Federal Commission for the Protection against Sanitary Risk of the Mexican health authority, or COFEPRIS, depending on the countries in which our customers market and sell the products we manufacture and/or package on their behalf. We are also required to comply with environmental, health and safety laws and regulations, as discussed in “Environmental matters” below. These regulatory requirements impact many aspects of our operations, including manufacturing, developing, labeling, packaging, storage, distribution, import and export and record keeping related to customers’ products. Noncompliance with any applicable regulatory requirements can result in government refusal to approve (i) facilities for testing or manufacturing products or (ii) products for commercialization. The FDA and other regulatory agencies can delay, limit or deny approval for many reasons, including:
| • | Changes to the regulatory approval process, including new data requirements, for product candidates in those jurisdictions, including the United States, in which we or our customers may be seeking approval; |
| • | A product candidate may not be deemed to be safe or effective; |
| • | The ability of the regulatory agency to provide timely responses as a result of its resource constraints; and |
| • | The manufacturing processes or facilities may not meet the applicable requirements. |
We work closely with our customers to become fully aligned with them and provide them with a level of comfort regarding product availability. As we become more fully aligned, satisfy their needs and exhibit a level of sustainability and a successful compliance record, customers become comfortable with our service and have fewer incentives to establish secondary and additional suppliers. An excellent compliance record helps insure product availability and will encourage customers to place more business with us.
In addition, if new legislation or regulations are enacted or existing legislation or regulations are amended or are interpreted or enforced differently, we may be required to obtain additional approvals or operate according to different manufacturing or operating standards or pay additional product or establishment user fees. This may require a change in our research and development and manufacturing techniques or additional capital investments in our facilities.
Our pharmaceutical development and manufacturing projects generally involve products that must undergo pre-clinical and clinical evaluations relating to product safety and efficacy before they are
97
approved as commercial therapeutic products. The regulatory authorities having jurisdiction in the countries in which our customers intend to market their products may delay or put on hold clinical trials, delay approval of a product or determine that the product is not approvable. The FDA or other regulatory agencies can delay approval of a drug if our manufacturing facility is not able to demonstrate compliance with cGMPs, pass other aspects of pre-approval inspections (i.e., compliance with filed submissions) or properly scale up to produce commercial supplies. The FDA and comparable government authorities having jurisdiction in the countries in which our customers intend to market their products have the authority to withdraw product approval or suspend manufacture if there are significant problems with raw materials or supplies, quality control and assurance or the product is deemed adulterated or misbranded.
Some of our manufactured products are listed as controlled substances. Controlled substances are those products that present a risk of substance abuse. In the United States, these types of products are classified by the DEA as Schedule II, III and IV substances under the Controlled Substances Act of 1970. The DEA classifies substances as Schedule I, II, III, IV or V substances, with Schedule I substances considered to present the highest risk of substance abuse and Schedule V substances the lowest risk. Scheduled substances are subject to DEA regulations relating to manufacturing, storage, distribution, import and export and physician prescription procedures. For example, scheduled drugs are subject to distribution limits and a higher level of recordkeeping requirements.
Furthermore, the total amount of controlled substances for manufacture or commercial distribution is limited by the DEA and allocated through quotas. Our quotas or our customers’ quotas, if any, may not be sufficient to meet commercial demand or to economically produce the product. In addition, based on the regulation regarding controlled substances, the number of manufacturers for API are typically limited. Subsequently manufacturing or supply issues could disrupt our manufacture of the finished dosages for our products.
Entities must be registered annually with the DEA to manufacture, distribute, dispense, import, export and conduct research using controlled substances. State controlled substance laws also require registration for similar activities. In addition, the DEA requires entities handling controlled substances to maintain records, file reports, follow specific labeling and packaging requirements and provide appropriate security measures to control against diversion of controlled substances. If we fail to follow these requirements, we may be subject to significant civil and/or criminal penalties and possibly a revocation of one of our DEA registrations.
Products containing controlled substances may generate significant public health and safety issues, and in such instances, federal or state authorities can withdraw or limit the marketing rights or regulatory approvals for these products. Issues regarding controlled substances could also impact our reputation with regulatory bodies, customers and the public. For some scheduled substances, the FDA may require us or our customers to develop product attributes or a risk evaluation and mitigation strategy to reduce the inappropriate use of the products, including the manner in which they are marketed and sold, so as to reduce the risk of diversion or abuse of the product. Developing such a program may be time-consuming and could delay approval of product candidates containing controlled substances. Such a program or delays of any approval from the FDA could adversely affect our business, results of operations and financial condition.
Audits are an important means by which prospective and existing customers gain confidence that our operations are conducted in accordance with applicable regulatory requirements. Since 2006 our facilities and development centers were audited by 1,929 separate customer audit teams, representing both prospective and existing customers. These audits contribute to our ongoing improvement of our manufacturing and development practices. In addition to customer audits, we, like all commercial drug manufacturers, are subject to audits by various regulatory authorities. Since 2006, regulatory authorities conducted 231 such audits, which involved multiple products, at our sites in North America, Europe and Mexico. Responses to audit observations were submitted to address observations noted, but not all have been fully resolved. It is not unusual for regulatory agencies or customers to request further clarification and/or follow-up on the responses we provide.
98
Environmental matters
We are required to comply with a variety of environmental, health and safety laws and regulations in each of the jurisdictions in which we operate. We strive to manage the potential risks associated with such laws and regulations through our operational controls, environmental monitoring and routine risk assessment and mitigation processes. Additionally, we maintain an ongoing audit system, including both internal and external audits, designed to help identify and mitigate risks.
A number of our facilities have a history of, or the potential for, contamination and are currently undergoing assessment, remediation or monitoring. In addition, we have also sold or closed some facilities, and in some cases have retained an obligation to address past environmental contamination at such locations.
We have established an accrual, which we review and adjust periodically, to cover contingent liabilities associated with environmental matters. While future developments (for example, changes in our obligations at the sites we are currently addressing or discovery of conditions requiring investigation or remediation at other sites for which we may be responsible) could result in increases to our accrual, we believe that that any increases in our accrual to address any environmental liabilities of which we are aware would not materially and adversely affect us.
Seasonality
Revenues from some of our DPS and PDS operations have traditionally been lower in our first fiscal quarter, being the three months ending January 31. We attribute this trend to several factors, including (i) the reassessment by many customers of their need for additional product in the last quarter of the calendar year in order to use existing inventories of products; (ii) the lower production of seasonal cough and cold remedies in the first fiscal quarter; (iii) limited project activity towards the end of the calendar year by many small pharmaceutical and biotechnology customers involved in PDS projects in order to reassess progress on their projects and manage cash resources; and (iv) the Patheon-wide facility shutdown during a portion of the traditional holiday period in December and January.
Employees
As of June 1, 2015, we had approximately 8,700 employees and contractors. Works councils and/or collective bargaining agreements are in place at all of our facilities in the United Kingdom, France, Italy, The Netherlands, Austria, and Germany, consistent with local labor laws. DPP also holds a bi-annual European Dialog meeting with all the European Works Council representatives and representatives of DPP’s management. There is no union representation at any of our North American sites. Our management believes that we generally have a good relationship with our employees around the world and the works councils that represent a portion of our European employee base.
Legal proceedings
From time to time, we may be involved in legal proceedings arising in the ordinary course of business, including, without limitation, inquiries and claims concerning environmental contamination as well as litigation and allegations in connection with acquisitions, product liability manufacturing or packaging failures, and claims for reimbursement for the cost of lost or damaged APIs, the cost of which could be significant. We intend to vigorously defend ourselves against such other litigation and do not currently believe that the outcome of any existing such litigation will have a material adverse effect on our results of operations or financial condition.
On December 10, 2012, Procaps S.A., or Procaps, filed a complaint against Patheon in the United States District Court for the Southern District of Florida (Case No. 12-cv-24356-DLG). The complaint involves Patheon’s collaboration agreement with Procaps, pursuant to which both companies agreed to work together with respect to the marketing of a line of certain prescription pharmaceutical softgel development and manufacturing services. Procaps alleges that Patheon’s acquisition of Banner, a business that historically has generated less than 10% of its revenues from
99
softgel services for prescription pharmaceuticals, transformed the collaboration agreement into an anticompetitive restraint of trade and an agreement between direct competitors to set prices, divide markets and/or allocate geographic territories. Procaps seeks (i) a declaratory judgment that the collaboration agreement must cease and/or terminate; (ii) an injunction requiring that we divest all of Banner softgel manufacturing capabilities; and (iii) monetary damages under federal and state antitrust and unfair competition laws, including treble damages for violations of the Sherman Act. Patheon subsequently answered Procaps’s complaint and filed our affirmative defenses to the complaint. In July 2014, upon Motion for Summary Judgment by Patheon, the court dismissed Procaps’ unfair competition claims, leaving only the antitrust claims in dispute. The parties are currently conducting discovery. In March 2015, the court ordered trial to commence on November 16, 2015.
We deny all allegations contained in Procaps’s complaint and believe that Procaps’s claims are without merit. We intend to vigorously defend ourselves in this lawsuit. Based on our knowledge as of the date of this prospectus, we believe that the eventual resolution of the above matter is unlikely to have a material effect on our financial position, operating results or liquidity. However, the results of litigation are inherently unpredictable and the possibility exists that the ultimate resolution of the matters could result in a material adverse effect on our business, results of operations and financial condition.
One putative class action is pending in the United States against one of our customers in connection with the recall of certain lots of allegedly defective products manufactured by us for the customer. We have also been named in the putative class action and in one of the individual plaintiff actions. The customer has given us notice of its intent to seek indemnification from us for all damages, costs and expenses, pursuant to the manufacturing services agreement between the customer and us. As this case is at an early stage, we are unable to estimate the amount of potential damages for which we may be directly or indirectly liable in the above action.
In addition, the healthcare industry is highly regulated and government agencies continue to scrutinize certain practices affecting government programs and otherwise. From time to time, we receive subpoenas or requests for information from various government agencies, including from state attorneys general and the U.S. Department of Justice relating to the business practices of customers or suppliers. We generally respond to such subpoenas and requests in a timely and thorough manner, which responses sometimes require considerable time and effort, and can result in considerable costs being incurred, by us. We expect to incur additional costs in the future in connection with existing and future requests.
Our business may, from time to time, be subject to claims from its employees, customers and suppliers. We believe that neither we, nor any of our subsidiaries, are currently involved in any material pending legal proceeding, other than as described above. Additionally, no such proceedings are known to be contemplated by governmental authorities.
100
Executive officers and directors
The following table sets forth the names, ages and positions of the directors and executive officers of Patheon as of the date of this prospectus.
| Name | Age | Position |
| James C.Mullen | 56 | Chief Executive Officer and Director* |
| Rebecca Holland New | 40 | Chief Human Resources Officer and Executive Vice President, Communications and Project Management Office |
| Michael Lehmann | 52 | President, Global Pharmaceutical Development Services and Executive Vice President, Global Sales and Marketing |
| Lukas Utiger | 51 | President, Drug Substance |
| Stuart Grant | 60 | Executive Vice President and Chief Financial Officer and Director |
| Michael E. Lytton | 58 | Executive Vice President, Corporate Development and Strategy and President Banner Life Sciences |
| Eric Sherbet | 51 | General Counsel and Secretary and Director |
| Harry R. Gill, III | 55 | Senior Vice President, Quality and Continuous Improvement |
| Antonio Magnelli | 47 | Senior Vice President, Drug Product – Europe |
| Franco Negron | 48 | Senior Vice President, Drug Product – North America |
| Paul S. Levy | 67 | Chairman and Director* |
| Daniel Agroskin | 38 | Director |
| Michel Lagarde | 41 | Director* |
| Nicholas O’Leary | 31 | Director* |
| Stephan Tanda | 49 | Director* |
| Hugh Welsh | 48 | Director* |
| Philip Eykerman | 46 | Director* |
* We expect that these individuals will be appointed to our board of directors prior to this offering.
James C. Mullen, age 56, joined Patheon as Chief Executive Officer in February 2011, bringing over 30 years of experience in the pharmaceutical and biotechnology industries, over 20 of which have been spent at the executive level. Mr. Mullen will be appointed to our board of directors prior to this offering. Mr. Mullen served as the President and Chief Executive Officer of Biogen Idec, Inc., a biotechnology company, from June 2000 to June 2010. Prior to that, Mr. Mullen held various operating positions at Biogen Idec, Inc., including Chief Operating Officer, Vice President, International, Vice President, Operations, and several manufacturing and engineering positions at SmithKline Beckman (now GlaxoSmithKline). Mr. Mullen previously served on the board of Biogen until June 2010 and until April 2015, on the board of PerkinElmer, Inc., a technology and service provider for diagnostics, research, environmental and industrial and laboratory services markets.
Rebecca Holland New, age 40, has served as Chief Human Resources Officer and Executive Vice President, Corporate Communications and Project Management Office since December 2014. Ms. Holland New joined Patheon in August 2011 as Senior Vice President Human Resources bringing substantial experience leading and developing business leadership, strategies and operational processes within growing global healthcare organizations. Before joining Patheon, Mrs. Holland New was Global Vice President of Human Resources at Bausch & Lomb. Before becoming Global Vice President of Human Resources at Bausch & Lomb, she held global human resources leadership positions at that company’s business operations, talent, corporate and pharmaceutical business units as well as global research and development. Prior to joining Bausch & Lomb, Mrs. Holland New held human resources leadership positions at Novo Nordisk and Bristol-Myers Squibb Company. She currently serves on the Board of Trustees for the American Health Policy Institute and is an active
101
member with the Human Resources Public Policy Association. Mrs. Holland New earned a master’s degree in industrial and labor relations as well as a Bachelor of Science in economics, marketing and finance from Cornell University. In addition, she completed coursework toward a Ph.D./Master of Science in organizational psychology from Columbia University and Rutgers University. She was recently awarded the Triangle Business Journal Women in Business award in March 2015.
Michael Lehmann, age 52, joined Patheon in November 2012 as President, Global Pharmaceutical Development Services and in December 2012, was appointed Executive Vice President, Global Sales & Marketing. Mr. Lehman brings over 25 years of healthcare services leadership experience to Patheon. From September 2005 to September 2012, Mr. Lehmann was employed by Covance, Inc., or Covance, one of the world’s largest drug development services companies, and from January 2009, held the position of Corporate Senior Vice President and General Manager in the Global Early Development business of Covance. In that role, Mr. Lehmann was responsible for global early development and profit and loss management. Previously, he served at Covance as Corporate Senior Vice President and President of the Global Nonclinical Safety Assessment business from January 2009 to October 2011, as Corporate Vice President and President of the Labs North America business from January 2008 to January 2009 and as General Manager of the Madison Site from September 2005 to January 2008. Prior to joining Covance, Mr. Lehmann worked for 17 years at GE Healthcare in key operational and management roles.
Lukas Utiger, age 51, joined Patheon in March 2014 in connection with the DPP Acquisition. Dr. Utiger joined DSM in August, 2013 and led the DPP Business as President and CEO from October 2013 until the consummation of the DPP Acquisition. Prior to taking this position at DSM Dr. Utiger spent 21 years with Lonza where he lead the R&D organization and ran 3 different divisions (CMO, specialty chemical and bioscience) while serving 12 years on the executive committee. During this time, he gained in-depth operational and business experience in the field of chemical, biotech and viral/cell technologies. In addition, he was responsible for the development of all Lonza businesses in China and India. Before his time at Lonza, Dr. Utiger joined the ICI Chemical & Polymer Division (Runcorn, U.K.) in the process development group for four years.
Stuart Grant, age 60, joined Patheon in February 2012 as Executive Vice President and Chief Financial Officer, bringing over 30 years of financial management experience to the Company, over 15 of which have been in the pharmaceutical industry. From 2007 to 2011, Mr. Grant served as Senior Vice President and Chief Financial Officer of BioCryst Pharmaceuticals, Inc., a pharmaceutical development company. Prior to that, Mr. Grant progressed through a variety of financial management positions at Serono SA (now Merck Serono), a global pharmaceutical services company, including Chief Financial Officer, USA, from 2002 to 2004 and Group Chief Financial Officer from 2004 to 2007. Mr. Grant also spent 15 years in finance at Digital Equipment Company and several years working as a tax consultant and senior auditor for Price Waterhouse (now PricewaterhouseCoopers) in Glasgow, Scotland.
Michael E. Lytton, age 57, joined Patheon in May 2011 as Executive Vice President, Corporate Development and Strategy and General Counsel. In October 2014, Mr. Lytton was appointed President of Banner Life Sciences and transitioned from his role as General Counsel. From January 2009 through February 2011, Mr. Lytton was Executive Vice President of Corporate and Business Development of Biogen. Prior to joining Biogen, from January 2001 through December 2008, Mr. Lytton was a General Partner with Oxford Bioscience Partners, or Oxford, a venture capital firm investing in therapeutic, diagnostic and life science tool companies. Prior to Oxford, Mr. Lytton practiced law for 17 years and specialized in representing biomedical companies; he is a past Partner and member of the Executive Committee of the law firm Edwards Wildman Palmer and previously was a Partner of the law firm WilmerHale. From September 2004 to October 2011, Mr. Lytton was the Chairman of the Board of Santhera Pharmaceuticals AG, and he has also served on various boards of many other academic, non-profit and private and public for-profit companies throughout his career.
Eric Sherbet, age 51, joined Patheon in November 2014 as General Counsel and Secretary. Mr. Sherbet joined our board of directors in June 2015. From April 2011 through October 2014, Mr. Sherbet was General Counsel and Secretary of inVentiv Health, Inc., a global provider of clinical
102
development and commercialization services to the pharmaceutical industry. Mr. Sherbet served as Vice President, Deputy General Counsel and Corporate Secretary of Foster Wheeler AG, a global engineering services, construction and power company from December 2007 until April 2011.
Harry R. Gill, III, age 54, joined Patheon in July 2010 as Vice President, North America, Business Management. In 2011, he was promoted to Vice President, Global Operational Excellence. In September 2012, Mr. Gill was promoted to his current position as Senior Vice President, Quality and Continuous Improvement. Prior to joining Patheon, he had over 25 years of experience in quality, plant operations, technical services and operational excellence. Mr. Gill held the position of Site General Manager at Wyeth (now Pfizer Inc.), a pharmaceutical company, from September 2006 to July 2010. Prior to Wyeth, Mr. Gill served as Director of Engineering at Baxter Healthcare from August 1998 to May 2001. In addition, he has eight years of combined international experience in Asia and Puerto Rico.
Antonio Magnelli, age 47, joined Patheon in July 2000 and has held progressively senior roles leading to his appointment in October 2008 to Executive Director and General Manager of the company’s facility in Monza, Italy. Mr. Magnelli has extensive experience in the pharmaceutical industry and began his career in 1993. Prior to joining Patheon, he held key roles in engineering at Sanofi-Aventis and is specialized in lyophilization.
Franco Negron, age 48, joined Patheon in November 2009 as Vice President and General Manager of the company’s operations in Puerto Rico. Mr. Negron has over 20 years’ experience in the pharmaceutical industry. He has served in various senior positions, including Global Vice President for Novartis Consumer Health, Over-the-Counter and Pharmaceutical Products with specific focus on global process improvement initiatives. Prior to joining Novartis, he also served as Vice President Manufacturing and Supply at Valeant Pharmaceuticals and Site General Manager for McNeil Consumer Healthcare.
Paul S. Levy, age 67, will be appointed as chairman of our board of directors prior to this offering. Mr. Levy has served on the board of directors of Patheon Inc. from 2007 to 2014. Mr. Levy is a Managing Director of JLL Partners, Inc., which he founded in 1988. In the last five years, he served on the boards of the following public companies: Builders FirstSource, Inc. (current), Patheon, Inc. (former), PGT, Inc. (former), IASIS Healthcare, LLC (current; privately held company with public filings), and The J.G. Wentworth Company (current). We believe Mr. Levy’s extensive experience in buying and managing a variety of businesses is of great value to the board of directors and the Company.
Daniel Agroskin, age 38, joined our board of directors in January 2014 and served on the board of directors of Patheon, Inc. since 2009. Mr. Agroskin is a Managing Director of JLL Partners, Inc., which he joined in July 2005. Prior to that, he worked at JP Morgan Partners, a private equity investment firm, and in Merrill Lynch’s Mergers and Acquisitions Group. He holds a Bachelor of Arts degree from Stanford University and a Master of Business Administration degree from the Wharton School of the University of Pennsylvania. In the last five years, Mr. Agroskin served on the boards of the following public companies: Builders FirstSource, Inc. (current), PGT, Inc. (previous) and Patheon, Inc. (previous). Mr. Agroskin is also a director on the boards of American Dental Partners, Inc., Synarc-Biocore Topco Holdings, Inc., and Medical Card Systems, Inc. Mr. Agroskin was previously a director on the board of PharmaNet Development Group, Inc. until July 2011. We believe Mr. Agroskin’s financial and investment expertise and his experience on other boards of directors provides value to the Company and its shareholders.
Michel Lagarde, age 41, will be appointed to our board of directors prior to this offering. Mr. Lagarde has served on the board of directors of Patheon, Inc. since 2011. Mr. Lagarde is a Managing Director of JLL Partners, which he joined in January 2008. From February 1996 to December 2007 Mr. Lagarde was employed with the Philips Electronics group of companies. Mr. Lagarde served as Chief Executive Officer of Philips Electronics North America, Domestic Appliances and Personal Care division from April 2004 and as Chief Financial Officer from May 2006. In the last five years, he served on the boards of the following public companies: Patheon, Inc. (former). Mr. Lagarde is also a director on the boards of American Dental Partners, Inc.,
103
Synarc-Biocore Topco Holdings, Inc. and ACE Cash Express, Inc. Mr. Lagarde was previously a director on the board of PharmaNet Development Group, Inc. until July 2011. Mr. Lagarde holds a Bachelor of Business Administration degree from European University Antwerp, and an Executive Masters degree in Finance & Control from University of Amsterdam. Our Board believes that Mr. Lagarde’s executive and finance positions at a manufacturer of consumer products and business and finance degrees qualify him for service as a member of our Board and add value to the Company and its shareholders.
Nicholas O’Leary, age 31, will be appointed to our board of directors prior to this offering. Mr. O’Leary has served on the board of directors of Patheon, Inc. since 2012. Mr. O’Leary joined JLL Partners as an Associate in July 2009 and was promoted to Senior Associate in July 2011 and Vice President in July 2012. Mr. O’Leary was employed with Merrill Lynch & Co., a financial management and advisory firm, in its Mergers and Acquisitions Group as an Analyst from June 2006 to June 2008 and as a Senior Analyst from June 2008 to June 2009. Mr. O’Leary holds a Bachelor of Arts degree from Washington and Lee University, where he graduated Phi Beta Kappa and magna cum laude. In the last five years, he served on the boards of the following public companies: Patheon, Inc. (former). We believe Mr. O’Leary’s experience in the finance industry qualifies him for service as a member of our board of directors and adds value to the Company and its shareholders.
Stephan Tanda, age 49, will be appointed to our board of directors prior to this offering. Mr. Tanda has been a member of the Management Board of Koninklijke DSM N.V. since May 2007. He previously served as President and Chief Executive Office of Freudenberg Nonwovens Limited Partnership, Weinheim, Germany and Durham, North Carolina, from 2004 to 2007. Prior to this, Mr. Tanda served in various positions at E.I. DuPont de Nemours from 1991 to 2003. Mr. Tanda is a Austrian citizen.
Hugh Welsh, age 48, will be appointed to our board of directors prior to this offering and has served as President and General Counsel of DSM North America since 2010. He previously served as Vice President and General Counsel of DSM North America from 2006 to 2010. Mr. Welsh is a United States citizen.
Philip Eykerman, age 46, will be appointed to our board of directors prior to this offering and has served as DSM’s Executive Vice President Corporate Strategy and Acquisitions since 2011. He previously was a partner at McKinsey & Company (Brussels) from 1997 to 2011 leading their chemicals practice in the Benelux and France. Mr. Eykerman is a Belgian citizen.
In addition, the individuals below are currently members of our board of directors who are expected to resign from our board prior to this offering:
James Unsworth, age 56, is a director and principal at Unsworth & Associates B.V., Unsworth & Associates S.à.r.l., Luxembourg, since 2000. Since 1998, Mr. Unsworth has been managing director of several entities owning and financing Mexican and British real estate assets. From 1996 to present, Mr. Unsworth has been a managing director at Caisse Dépôt et Placement du Québec and managing director of the holding companies of Otera, Ivanhoe Cambridge Inc. and other companies with investments in Spain, Germany and Russia. Mr. Unsworth is currently a managing director of the holding and/or finance companies of Barrick Gold Corp., Bombardier International, Centerra Gold, Elizabeth Arden (Netherlands) Holdings BV, Manulife Financial.
Ralf Schmeitz, age 42, has served as Corporate Business Controller at DSM since 2013, as Corporate Cash Manager from 2010 to 2013, and as Corporate Finance Officer from 2006 to 2010. Prior to joining DSM, Mr. Schmeitz worked for several years for Hewlett Packard in management positions in finance and sales operations. Prior to that, Mr. Schmeitz worked as a senior auditor at PricewaterhouseCoopers, starting in 1996. Mr. Schmeitz holds a master’s degree in Accounting and Business Valuation. Mr. Schmeitz is a Dutch citizen.
Severijn M. J. van der Veen, age 47, is a director of finance & accounting at Unsworth & Associates B.V. since 2009. Mr. van der Veen was a financial controller at ABN Amro Bank N.V., Amsterdam
104
from 2006 to 2009. Prior to that, Mr. van der Veen was Chief Financial Officer at Net Ventures B.V. from 2000 to 2005. Mr. van der Veen was a corporate accountant at Zenith Media Worldwide from 1998 to 1999 and held various positions at KPMG Audit and KPMG Accountants from 1992 to 1998.
Board composition
Our business affairs will be managed under the direction of our board of directors.
Our articles of association provide that our board of directors shall consist of such number of directors as shall from time to time be fixed by our board of directors. Prior to the closing of this offering, we intend to appoint additional directors who are independent in accordance with the criteria established by for independent board members to our board of directors. After this offering, our board of directors will initially be composed of executive board members and non-executive board members.
At each annual meeting of shareholders, the directors will be elected for a three-year term to serve until the next annual meeting of our shareholders, or until their successors are duly appointed.
Each of our executive officers serves at the discretion of our board of directors and holds office until his successor is duly appointed and qualified or until his earlier resignation or removal. There are no family relationships among any of our directors or executive officers.
Upon completion of this offering, JLL and DSM will enter into a shareholders agreement with us, pursuant to which each of JLL and DSM will be entitled to nominate a certain number of designees for election to our board of directors and will agree to vote in favor of each other’s nominees. As a result, we will be a “controlled company” under the rules of the . Under these rules, a company of which more than 50% of the voting power is held by an individual, group or another company is a “controlled company” and may elect not to comply with certain corporate governance standards, including the requirements that (i) a majority of our board of directors consist of independent directors and (ii) that our board of directors have compensation and nominating and corporate governance committees composed entirely of independent directors, as independence is defined in Rule 10A-3 of the Exchange Act and under the listing standards. For at least some period following this offering, we intend to utilize these exemptions. As a result, although we will have a fully independent audit committee, immediately following this offering we do not expect that the majority of our directors will be independent. Accordingly, although we may transition to a board with a majority of independent directors prior to the time we cease to be a “controlled company,” for such period of time you will not have the same protections afforded to shareholders of companies that are subject to all of these corporate governance requirements. See “Risk factors—Risks related to this offering and our common stock—Upon the listing of our shares on the , we will be a ‘controlled company’ within the meaning of the rules of the and, as a result, will qualify for, and intend to rely on, exemptions from certain corporate governance requirements. You will not have the same protections afforded to shareholders of companies that are subject to such requirements.” In the event that we cease to be a “controlled company” and our shares continue to be listed on the , we will be required to comply with these provisions within the applicable transition periods.
Director independence
Our business affairs will be managed under the direction of our board of directors.
We intend to apply to list our common stock on the . Under the rules of the , independent directors must comprise a majority of a listed company’s board of directors. In addition, the rules of the require that, subject to specified exceptions, each member of a listed company’s audit, compensation and nominating and corporate governance committees must be independent. As discussed above, we intend to avail ourselves of the “controlled company” exception and, as a result, although we will have an independent audit committee, we will not have a majority of independent directors on our board. Under the rules of the , a director is independent only if our board of directors makes an affirmative determination that the director has no material relationship with us.
105
Board committees
Our board of directors has the authority to appoint committees to perform certain management and administrative functions. Our board of directors will have an audit committee composed of independent directors and a compensation committee, each of which has the composition and the responsibilities described below. Our board of directors may from time to time establish other committees.
Audit committee
Upon or prior to completion of this offering, we will establish an audit committee and will adopt a charter for the audit committee that complies with applicable federal, state and rules relating to corporate governance matters. Our audit committee will oversee our accounting and financial reporting process and the audit of our financial statements and will assist our board of directors in monitoring our financial systems and our legal and regulatory compliance. Our audit committee will be responsible for, among other things:
Appointing, compensating and overseeing the work of our independent auditors, including resolving disagreements between management and the independent registered public accounting firm regarding financial reporting;
| • | Approving engagements of the independent registered public accounting firm to render any audit or permissible non-audit services; |
| • | Reviewing the qualifications and independence of the independent registered public accounting firm; |
| • | Reviewing our financial statements and related disclosures and reviewing our critical accounting policies and practices; |
| • | Reviewing the adequacies and effectiveness of our internal control over financial reporting; |
| • | Establishing procedures for the receipt, retention and treatment of accounting and auditing related complaints and concerns; |
| • | Preparing the audit committee report required by SEC rules to be included in our annual proxy statement; |
| • | Reviewing and discussing with management and the independent registered public accounting firm the results of our annual audit, our quarterly financial statements and our publicly filed reports; and |
| • | Reviewing and approving in advance any proposed related person transactions. |
We believe that the functioning of our audit committee will comply with the applicable requirements of the and SEC rules and regulations.
Our board of directors will consider the independence and other characteristics of each member of our audit committee. Audit committee members must satisfy the independence requirements and additional independence criteria set forth under Rule 10A-3 of the Exchange Act. In addition, the requires that, subject to specified exceptions, including certain phase-in rules, each member of a listed company’s audit committee be independent and that audit committee members also satisfy independence criteria set forth in Rule 10A-3. In order to be considered independent for purposes of Rule 10A-3, an audit committee member may not, other than in his capacity as a member of the board, accept consulting, advisory or other fees from us or be an affiliated person of us. After the applicable phase-in period, each of the members of our audit committee will qualify as an independent director pursuant to the rules and Rule 10A-3.
106
Compensation committee
Upon or prior to completion of this offering, we will establish a compensation committee and will adopt a charter for the compensation committee that complies with applicable federal, state and rules relating to corporate governance matters. Our compensation committee will oversee our compensation policies, plans and programs. The compensation committee will be responsible for, among other things:
| • | Reviewing and recommending policies, plans and programs relating to compensation and benefits of our directors, officers and employees; |
| • | Reviewing and recommending compensation and the corporate goals and objectives relevant to compensation of our Chief Executive Officer; |
| • | Reviewing and approving compensation and the corporate goals and objectives relevant to compensation for executive officers other than our Chief Executive Officer; |
| • | Evaluating the performance of our Chief Executive Officer and other executive officers in light of established goals and objectives; and |
| • | Administering our equity compensation plans for our employees and directors. |
Code of business conduct and ethics
We have adopted a code of business conduct and ethics that is applicable to all of our employees, officers and directors, including our chief executive and senior financial officers. The code of business conduct and ethics will be available on our website at www.patheon.com. We expect that any amendment to the code, or any waivers of its requirements, will be disclosed on our website. The inclusion of our website in this prospectus does not include or incorporate by reference the information on our website into this prospectus.
Compensation committee interlocks and insider participation
None of our executive officers currently serves, or has served during the last completed fiscal year, on the compensation committee or board of directors of any other entity that has one or more executive officers serving as a member of our board of directors or compensation committee.
Non-employee director compensation
We are currently in the process of determining the compensation of the individuals who will comprise our board of directors. Information is not currently available regarding director compensation. We will include the relevant disclosures in subsequent amendments to this registration statement as such information becomes available.
107
The following executives were our named executive officers for fiscal 2014:
| Name | Position |
| James C. Mullen | Chief Executive Officer |
| Stuart Grant | Executive Vice President, Chief Financial Officer |
| Michael Lehmann | President, Global Pharmaceutical Development Services and Executive Vice President, Global Sales and Marketing |
| Michael Lytton | Executive Vice President of Corporate Development and Strategy |
| Harry R. Gill, III | Senior Vice President, Quality and Continuous Improvement |
Compensation discussion and analysis
The Compensation Discussion and Analysis describes our executive compensation philosophy, components and policies, including analysis of the compensation earned by our named executive officers for fiscal 2014 as detailed in the accompanying tables.
Compensation decisions prior to the DPP Acquisition on March 11, 2014 for our named executive officers were made by the Board of Directors and/or Compensation and Human Resources Committee of Patheon Inc., our wholly owned subsidiary. Compensation decisions after the DPP Acquisition on March 11, 2014 for our named executive officers were made by the Board of Directors and/or Compensation Committee of JLL/Delta Patheon GP, Ltd., the general partner of Patheon Holdings. Unless indicated otherwise, we refer to both compensation committees in this “Executive Compensation” section as the “CHR Committee” and both boards of directors as our “Board.”
Executive summary
| • | Setting fiscal 2014 Compensation. In making compensation decisions for fiscal 2014, our CHR Committee took into account a number of factors, including (i) the need to attract, retain and motivate talented executives; (ii) our financial performance and achievement of corporate objectives; and (iii) the achievement of individual objectives by each executive officer. |
| • | Elements of Compensation. Consistent with our philosophy that executive compensation should incentivize our executive officers to enhance shareholder value, each of our executive officers is compensated with base salary, short-term cash incentives and long-term incentives, as well as (to a lesser extent) perquisites and personal benefits, retirement benefits and termination and change in control benefits that are commensurate with the executive’s experience and performance and the market rate for the position. |
| • | Key Compensation Decisions for fiscal 2014. Our CHR Committee and/or our Board made the following key executive compensation decisions for fiscal 2014: |
| • | approval of the DPx Short Term Incentive Plan for fiscal 2014, or the 2014 Bonus Plan, and payments to our named executive officers thereunder; |
| • | approval of salary increases for certain of our named executive officers; and |
| • | approval of the MEIP and grants of profits interests of the Partnership, or the MEIP Awards to our named executive officers thereunder. |
Compensation philosophy and objectives
Our compensation philosophy is based on pay for performance and the market rate of compensation for our executive officers. We reward our executive officers for delivering superior performance that contributes to our long-term success and the creation of shareholder value.
108
The objectives of our compensation program are to:
| • | attract and retain qualified and experienced individuals to serve as executive officers; |
| • | align the compensation level of each executive officer with his level of responsibility; |
| • | motivate each executive officer to achieve short and long-term corporate goals; |
| • | align the interests of executive officers with those of shareholders; and |
| • | reward executive officers for excellent corporate and individual performance. |
Our policy is to pay competitively at all levels of the organization. We believe that a highly skilled, engaged and results-oriented workforce is key to our success and helps ensure quality and reliability to our customers. We believe that our executive compensation is competitive and allows us to attract and retain top managerial talent.
Omnibus equity incentive plan
In connection with this offering, we anticipate adopting an omnibus equity incentive plan, the material terms of which will be summarized in subsequent amendments to the registration statement of which this prospectus is a part. We expect the plan to permit the grant of awards, in the discretion of the plan’s administrator, to officers, employees, directors, consultants and other service providers of the Company in the form of stock options, stock appreciation rights, shares of restricted stock, restricted stock units, performance awards or other stock-based or cash-based awards. The purposes of the plan will be to foster behavior that will produce the greatest increase in value for shareholders, reinforce key company goals and objectives that help drive shareholder value, and reward the performance of individuals in fulfilling long-term corporate objectives.
Process for determining executive compensation
Role of our CHR Committee and Board
Our CHR Committee and Board share responsibility for determining executive compensation. Our Board’s involvement in the executive compensation process reflects its desire to oversee compensation decisions regarding our executive officers, particularly our Chief Executive Officer. Accordingly, our CHR Committee makes recommendations regarding, and our Board approves, the compensation of our Chief Executive Officer, including grants of equity awards. Our CHR Committee is solely responsible for approving our executive compensation policies and programs, the compensation of our executive officers, other than our Chief Executive Officer, for establishing and approving payments under our annual cash incentive plan, the grant of equity awards, other than for our Chief Executive Officer, and for reporting such decisions to our Board. In addition, the CHR Committee:
| • | reviews management’s recommendations regarding the hiring, termination, transfer or promotion of senior executives and the terms of any separation agreements with such senior executives; and |
| • | recommends to the Board, from time to time, the amount, determination and payment of remuneration to be paid to the members of our Board. |
Role of executive officers
Other than providing input into their individual performance objectives, neither our Chief Executive Officer nor our other executive officers have any role in recommending or setting their own compensation. Our Chief Executive Officer makes recommendations to our CHR Committee regarding the compensation of our other executive officers and provides input regarding executive compensation programs and policies generally.
Role of compensation consultants
Our CHR Committee did not utilize the services of an independent compensation consultant in fiscal 2014.
109
Role of benchmarking and comparative analysis
The Company engaged Mercer to provide compensation data for executives from its global database for both $2.5 billion and $4 billion companies. The CHR Committee did not target a specific percentile for the components of executive compensation from this database, but considered the Mercer data as one of several factors in making executive compensation decisions.
Elements of compensation
Our overall executive compensation program includes the following major elements:
| Element | Form | Performance Period | Determination |
| Base Salary | Cash | One year | Periodically reviewed against market and further adjusted based on individual experience and performance |
| Short-Term Incentives | Annual Cash Incentive Bonus | One year | Subject to our performance against pre-determined corporate objectives, individual achievement of personal performance objectives and the discretion of our CHR Committee |
| Long-Term Incentives | Profits Interests in Partnership | Partnership profits interests generally vest in part over four years, in part on an exit event and in part based on returns to JLL Holdco and DSM. | Generally, profits interests represent a share in future profits of the Partnership. |
| Perquisites | Relocation expenses and incentives; automobile, education and executive allowances; enhanced medical, dental, life insurance and disability benefits | Provided in connection with executive benefit plans, recruitment and retention programs | Based on individually negotiated terms of employment or as introduced from time to time to enhance executive retention |
| Broad-Based Benefits | Health, dental, retirement, life insurance and disability | Ongoing | Consistent with the broad-based benefits offered by other multinational organizations |
| Termination/ Change in Control Benefits | Compensation in connection with certain terminations of employment and change in control | Provided in connection with specified events | Based on individually negotiated terms of employment or as introduced from time to time by our CHR Committee to enhance executive retention |
110
Factors considered in making individual pay decisions
Compensation elements
At this time, we do not target a specific mix of executive compensation by allocating total compensation between cash and noncash pay, between current and long-term pay or among different types of long-term incentive awards, other than setting annual cash bonus targets as a percentage of annual salary. The profile of our executive compensation is driven by decisions made for each component of pay separately, which we intend to be appropriately competitive, as well as the impact of our decisions on total compensation. However, consistent with our compensation philosophy, our CHR Committee believes that a significant portion of each named executive officer’s compensation should be at risk.
Role of company and individual performance
Our compensation philosophy is based on pay for performance. We reward our executive officers for delivering superior performance that contributes to our long-term success and the creation of shareholder value. In measuring such performance, we consider the achievement of both corporate and individual goals.
We reward significant contributions by our executive officers through salary increases, payments under our annual cash incentive plans and through long-term equity awards. In particular, our 2014 Bonus Plan was designed to focus our executive officers on the achievement of both corporate and individual performance objectives. The corporate performance objectives under our 2014 Bonus Plan were recommended to our CHR Committee by our Chief Executive Officer and approved by our CHR Committee.
The individual performance objectives under our 2014 Bonus Plan were determined by our CHR Committee in consultation with our Chief Executive Officer (other than with respect to himself). Our Chief Executive Officer submitted individual performance objectives for our executive officers (who themselves had input into the determination of their individual objectives) to our CHR Committee. Our CHR Committee reviewed the submitted individual performance objectives and approved them with any such changes as it believed appropriate. Our CHR Committee recommended, and our Board approved, the individual performance objectives for our Chief Executive Officer.
Internal pay equity
We consider internal pay equity when setting compensation for our executive officers. We review compensation levels to ensure that appropriate equity exists between our Chief Executive Officer and our other executive officers, as well as among our executive officers (other than the Chief Executive Officer). Differences in compensation among our named executive officers are attributable to differences in levels of experience, performance, scope of position and market demand for executive talent.
Fixed compensation – base salary
Overview
Base salary is intended to reflect the skills, competencies, experience, scope of position and performance of each named executive officer. Base salary levels also are targeted to be comparable to salaries offered for positions involving similar responsibilities and complexity at other companies. Competitive base salaries enable us to attract and retain qualified individuals to serve as named executive officers. Base salary also aligns the compensation level of each named executive officer to his level of responsibility. Base salaries are adjusted annually where appropriate based on levels of responsibility and sustained performance. Base salary is linked to other elements of compensation such as the annual cash incentive bonus, certain retirement plan benefits and termination and change in control benefits.
111
Fiscal 2014 base salaries
The key salary decisions made during fiscal 2014 for our named executive officers were as follows:
| • | Stuart Grant. Our CHR Committee approved an increase in Mr. Grant’s salary from $430,000 to $475,000, effective June 8, 2014, in light of Mr. Grant’s increased responsibilities for the combined Finance organization as a result of the DPP Acquisition. |
| • | Michael Lehmann. Our CHR Committee approved an increase in Mr. Lehmann’s salary from $390,000 to $415,000, effective June 8, 2014, in light of Mr. Lehmann’s increased responsibilities for the combined Sales and Marketing organizations as a result of the DPP Acquisition. |
| • | Harry R. Gill, III. Our CHR Committee approved an increase in Mr. Gill’s salary from $350,000 to $375,000, effective June 8, 2014, in light of Mr. Gill’s increased responsibilities for the combined Quality and Operational Excellence organizations as a result of the DPP Acquisition. |
Variable compensation – short-term and long-term incentives
The variable elements of our compensation include short-term incentives in the form of the opportunity for an annual cash incentive bonus and long-term incentives in the form of profits interests. The level of variable compensation offered to our named executive officers is determined, in part, based on an overall assessment of our business performance, including achievement against stated corporate objectives.
Short-term incentive – cash incentive bonuses
Overview
Under our 2014 Bonus Plan, our named executive officers and other members of our senior management may receive cash incentive bonuses based on certain performance criteria, subject to certain prescribed limits. The annual cash incentive bonus is intended to motivate our named executive officers to achieve short-term corporate and individual goals and to ultimately reward them for excellent corporate and individual performance. The 2014 Bonus Plan similarly incentivizes all our employees through a combination of corporate and business unit objectives and individual performance. For fiscal 2014, payments to our named executive officers and other members of senior management were made under the 2014 Bonus Plan, based on the achievement of certain corporate and individual objectives established by our CHR Committee and Chief Executive Officer. Additional bonus payments were made to named executive officers and other members of senior management in the discretion of our CHR Committee.
2014 bonus plan opportunity
Target awards under our 2014 Bonus Plan are set forth in each named executive officer’s employment agreement. For fiscal 2014, all of our named executive officers, other than Mr. Mullen, had a target bonus of 45% of base salary. Mr. Mullen has a target bonus of 100% of base salary.
Our CHR Committee approved the various weights allocated to the different financial performance objectives under our 2014 Bonus Plan to incentivize contributions by our named executive officers to our overall corporate performance. In addition, our CHR Committee determined that part of the bonus opportunity should be based on the achievement of individual objectives to focus our named executive officers to execute on projects without an immediately quantifiable financial impact but that would contribute to both our short-term and long-term success.
Financial objectives
Corporate Adjusted EBITDA comprised 50% of the corporate objectives for our named executive officers and is defined as net income (loss) from continuing operations before repositioning expenses, interest expense, foreign exchange losses reclassified from other comprehensive income (loss), refinancing expenses, acquisition and integration costs (including certain product returns and inventory write-offs recorded in gross profit), gains and losses on sale of capital assets, income
112
taxes, asset impairment charges, depreciation and amortization, stock-based compensation expense, certain consulting costs, purchase accounting adjustments, acquisition-related litigation expenses and other income and expenses, with additional adjustments for foreign currency exchange differences versus budgeted exchange rates and other one-time, non-operating gains or losses at the discretion of management.
Corporate Net Free Cash Flow comprised 25% of the corporate objectives for our named executive officers and is defined as cash flow from operations minus capital spending.
Corporate Revenue, as determined under U.S. GAAP, comprised 25% of the corporate objectives for our named executive officers.
Under the 2014 Bonus Plan, the payout with respect to achievement of any one corporate objective was not conditioned on the achievement of any other corporate objective. Under our 2014 Bonus Plan, if we did not meet the threshold performance of 90% of target for Corporate Adjusted EBITDA or Corporate Net Free Cash Flow, or 96% of Corporate Revenue, there would be no payout to our named executive officers under the plan for the applicable objective. If performance were to fall between threshold and target or between target and maximum for a particular objective, payout factors would be interpolated on a straight-line basis for such objective.
In setting the financial targets under our 2014 Bonus Plan, our CHR Committee focused on establishing targets for which attainment was not assured and which would require significant effort on the part of our named executive officers. For fiscal 2014, target Corporate Adjusted EBITDA, Corporate Net Free Cash Flow and Corporate Revenue were based on our 2014 budget.
The following table shows the payout percentages related to the achievement of each of our corporate goals under our 2014 Bonus Plan:
| Corporate Adjusted EBITDA Goal (millions of $) |
Performance (% of Target) |
Payout Factor | Payout (% of Target Bonus) |
|||||||||
| Threshold | 257.9 | 90 | % |
0.5x | 50 | % |
||||||
| Target | 286.8 | 100 | % |
1.0x | 100 | % |
||||||
| Maximum | 344.2 | 120 | % |
1.5x | 150 | % |
||||||
| Corporate Net Free Cash Flow Goal (millions of $) |
Performance (% of Target) |
Payout Factor | Payout (% of Target Bonus) |
|||||||||
| Threshold | 63.0 | 90 | % |
0.5x | 50 | % |
||||||
| Target | 70.0 | 100 | % |
1.0x | 100 | % |
||||||
| Maximum | 87.5 | 125 | % |
1.5x | 150 | % |
||||||
| Corporate Revenue Goal (millions of $) |
Performance (% of Target) |
Payout Factor | Payout (% of Target Bonus) |
|||||||||
| Threshold | 1,863.3 | 96 | % |
0.5x | 50 | % |
||||||
| Target | 1,940.0 | 100 | % |
1.0x | 100 | % |
||||||
| Maximum | 2,037.9 | 105 | % |
2.0x | 200 | % |
||||||
Individual objectives
In addition to corporate and/or financial objectives, a component of each named executive officer’s bonus eligibility was based on the achievement of individual objectives. At the end of fiscal 2014, the Chief Executive Officer discussed with each then-employed named executive officer his achievement of individual objectives and assigned a performance rating. The CHR Committee discussed with the Chief Executive Officer his achievement of his individual objectives and assigned a performance rating. Under the 2014 Bonus Plan, the named executive officer’s bonus eligibility is based on the achievement of the financial objectives and a multiplier for his performance rating as follows, with a maximum possible payout under the 2014 Bonus Plan of 200% of the executive’s target amount:
113
| Rating | Description |
Pay for Performance Multiplier |
| 1 | Not Acceptable | 0 |
| 2 | Sometimes Meets Expectations | 0-0.5 |
| 3 | Meets Expectations | 0.75-1.0 |
| 4 | Exceeds Expectations | 1.0-1.25 |
| 5 | Outstanding | 1.25-1.75 |
Individual objectives for our named executive officers included individual performance goals specific to such individual or his area of responsibility. Individual goals included timely achievement of certain strategic and financial goals, functional financial and budget goals, design and implementation of productivity measures, quality and compliance results, and development of new business opportunities.
2014 bonus plan results
The following table shows the percentage of achievement of the financial objectives applicable to our named executive officers eligible for a bonus for fiscal 2014:
| (in millions of $ unless otherwise noted) Financial Objective |
Target | Actual | Achievement (%) | ||||||
| Corporate Adjusted EBITDA | 286.6 | 298.4 | 104.0 | ||||||
| Corporate Net Free Cash Flow | 70.0 | 80.3 | 114.7 | ||||||
| Corporate Revenue | 1,940.9 | 1,947.2 | 100.3 | ||||||
Based on the relative weights allocated to our corporate objectives and the level of achievement of those objectives for fiscal 2014, our named executive officers were eligible to receive payouts under the 2014 Bonus Plan of 112.5% before consideration of achievement of individual objectives.
The bonuses awarded to our named executive officers were as follows:
| Name | Target Bonus | Target Fiscal 2014 Bonus ($) |
2014 Bonus Plan Paid ($) |
Total Bonus Paid (% of Target) |
||||||||
| James C. Mullen | 100 | % |
900,000 | 1,012,500 | 112.5 | |||||||
| Stuart Grant | 45 | % |
201,288 | 225,000 | 111.8 | |||||||
| Michael Lehmann | 45 | % |
179,827 | 215,000 | 120.0 | |||||||
| Michael Lytton | 45 | % |
180,000 | 220,000 | 122.2 | |||||||
| Harry R. Gill, III | 45 | % |
161,827 | 185,000 | 114.3 | |||||||
In light of their roles as CEO and CFO, respectively, the Board and CHR Committee concluded that it was appropriate to approve bonus awards to Messrs. Mullen and Grant largely based on corporate performance.
Messrs Lehmann, Lytton and Gill received bonus awards in excess of the 112.5% of target payable based on achievement of our corporate objectives due to the following achievements with respect to their individual objectives:
| • | Michael Lehmann: Achievement or overachievement of sales and marketing goals and all key financial goals and sales targets for the Global Pharmaceutical Development Business and enhancements of key leadership positions for the Global Pharmaceutical Development Business. |
| • | Michael E. Lytton: Leadership of Corporate Development and Legal functions in connection with the negotiation and execution of the DPP Acquisition, support for our Board and CEO in the development of new corporate governance processes for the combined businesses of Patheon and DPP and development of key strategies for the combined Patheon, DPP and Gallus businesses. |
114
| • | Harry R. Gill, III: Overachievement of key operational excellence objectives, successful integration of quality functions for the combined Patheon and DPP businesses and contributions toward our OE performance. |
Long-term incentives
Overview
Long-term incentives are intended to motivate our named executive officers to achieve long-term corporate goals and to ultimately reward them for excellent corporate performance. Long-term incentives do not influence any other element of compensation.
JLL/Delta Patheon Holdings, L.P., 2014 Management Equity Incentive Plan
The purpose of the MEIP is to provide eligible participants with an opportunity to receive grants of profits interests of the Partnership designated as management units, or Units. The award of Units pursuant to the MEIP is intended to compensate employees of the Partnership and its subsidiaries. The participants in the MEIP, as a group, are eligible to participate in the gain earned by JLL Holdco and DSM on their investment in the company once certain specified distribution thresholds have been achieved.
The aggregate number, class and tranche of Units that may be issued or transferred under the MEIP is determined from time to time by the Board or the CHR Committee, subject to the conditions and limitations set forth in the Partnership’s partnership agreement. The Partnership may grant awards to eligible participants, upon such terms and conditions as the Board or the CHR Committee shall determine, and as set forth in the partnership agreement and any applicable award agreement.
Awards under the MEIP represent the right of a participant to participate in a pool of up to 10% of the appreciation in value of the Partnership. The percentage of the appreciation in value that is included in the pool is determined based on returns to JLL Holdco and DSM on invested capital in the form of distributions as follows:
| Units | Return on Invested Capital Threshold |
Percentage of Appreciation in Value of Partnership |
| Class B | Benchmark Amount (discussed below) | 7% |
| Class C | 2.0x Invested Capital | 1% |
| Class D | 2.5x Invested Capital | 1% |
| Class E | 3.0x Invested Capital | 1% |
The Benchmark Amount equals the fair market value of the Partnership as of the date of grant of the Units. Each of our named executive officers received a grant of Units as of June 24, 2014, at which time the Benchmark Amount was $1.67 billion. Under the terms of the June 24, 2014 grants, once distributions to JLL Holdco and DSM exceed $1.67 billion, holders of Class B Units will be entitled to distributions until such holders have received (in the aggregate, assuming all such units have been issued) 7% of the appreciation in value of the Partnership in excess of $980 million, which is the total amount of capital invested by JLL Holdco and DSM, the Invested Capital, and will continue to be entitled to 7% of the appreciation in value of the Partnership thereafter.
Class C Units, Class D Units and Class E Units are entitled to distributions upon achievement of the relevant Return on Invested Capital Thresholds (listed in the above chart). For example, upon achievement of a Return on Invested Capital Threshold that is three times Invested Capital, all of Class C Units, Class D Units and Class E Units would be entitled to share in the appreciation of the Partnership and each named executive officer would receive his pro rata portion of a total of 10% of the appreciation in value of the Partnership.
Forfeiture restrictions with respect to 71% of the Class B Units lapse in equal installments on the first, second, third and fourth anniversaries of the date of grant. Forfeiture restrictions with respect to the remaining Class B Units lapse upon a qualifying exit event. Forfeiture restrictions on the Class C Units, Class D Units and Class E Units lapse when the return of capital thresholds applicable
115
to such Units is satisfied or, if a qualifying exit event has not occurred prior to the fifth anniversary of an IPO, when the market value of the publicly traded securities would result in the satisfaction of the return of capital applicable to such Units. In all events, the lapse of forfeiture restrictions are contingent upon the participant’s continuing employment as of the date such restrictions would otherwise lapse.
A qualifying exit event under the MEIP is the earlier of (i) a change of control, as defined under the MEIP, and (ii) in connection with or following an initial public offering, the sale or disposition by JLL Holdco and its affiliates of equity securities such that, immediately following such sale or disposition, either (A) JLL Holdco and its affiliates own less than 20% of the outstanding equity securities of the Partnership or the affiliate that issues the publicly traded equity securities on a fully-diluted basis or (B) JLL Holdco and its affiliates have received aggregate distributions equal to or in excess of 250% of its invested capital.
A change of control under the MEIP is generally (i) the sale of all or substantially all of the assets of the Partnership other than to JLL Holdco or DSM or their respective affiliates, (ii) a merger, consolidation, recapitalization or other reorganization by the Partnership or a sale or distribution of equity securities or voting power, in each case, that results in any person other than JLL Holdco or DSM owning more than 50% of the outstanding Equity Securities or voting power of the Partnership or (iii) a liquidation or dissolution of the Partnership.
Our named executive officers received the following MEIP awards in fiscal 2014:
| Date of Grant | Class B Units |
Class C Units |
Class D Units |
Class E Units |
Total Units | |||||||||||
| James C. Mullen | June 24, 2014 | 21,000 | 3,000 | 3,000 | 3,000 | 30,000 | ||||||||||
| Stuart Grant | June 24, 2014 | 4,550 | 650 | 650 | 650 | 6,500 | ||||||||||
| Michael Lehmann | June 24, 2014 | 2,800 | 400 | 400 | 400 | 4,000 | ||||||||||
| Michael E. Lytton | June 24, 2014 | 2,800 | 400 | 400 | 400 | 4,000 | ||||||||||
| Harry R. Gill, III | June 24, 2014 | 2,450 | 350 | 350 | 350 | 3,500 | ||||||||||
Perquisites and personal benefits
We provide certain perquisites and personal benefits to recruit and retain our named executive officers. The level of perquisites and personal benefits provided to our named executive officers does not influence any other element of compensation.
Our group benefits are intended to provide competitive and adequate protection in case of sickness, disability or death. We offer health, dental, pension or retirement, life insurance and disability programs to all of our employees on the same basis. In addition, our named executive officers receive certain enhanced benefits for medical, dental, vision, life insurance and disability, including premium waivers and enhanced coverage.
In addition to enhanced health, life insurance and related benefits, during fiscal 2014, certain of our named executive officers received automobile allowances or the use of a company car, and certain of our named executive officers received relocation benefits and incentives (and related tax gross-ups) to offset the cost of their relocation to our U.S. headquarters.
Benefits relating to termination and change in control
Our named executive officers are covered by termination and change in control provisions in their employment agreements. The events that trigger payment under these arrangements were determined through the negotiation of the applicable employment agreement.
In addition, in the event of a change of control under the MEIP, 29% of the Class B Units will vest, any remaining unvested Class B Units subject to time-based vesting will automatically vest, and the Class C Units, Class D Units and Class E Units will automatically vest if the applicable return of capital threshold for such units is achieved in connection with the transaction.
116
Risk management
Our CHR Committee and our Board endeavor to design our compensation programs to help ensure that these programs do not encourage our executive officers to take unnecessary and excessive risks that could harm our long-term value. We believe that the following components of our executive compensation program, which are discussed more fully above, discourage our executive officers from taking unnecessary or excessive risks:
| • | Base salaries and personal benefits are sufficiently competitive and not subject to performance risk. |
| • | The vesting terms of our long-term incentive awards are designed to better align our executives’ interests with the long-term interests of our shareholders. |
| • | Corporate and individual performance objectives for our executive officers are generally designed to be achievable with sustained and focused effort. |
| • | Minimum thresholds apply to all components of our annual incentive plans for both (i) the funding of the plans and (ii) payout levels of performance objectives, including individual performance objectives. |
| • | Our annual incentive plans are, subject to applicable regulations, discretionary, and we have documented our reserved right to amend or discontinue our incentive plans at any time with or without notice. |
| • | In order for an employee to receive a payout under one of our annual incentive plans, he or she must be employed at the time of payout, unless our CHR Committee determines otherwise. |
| • | In order for an employee to be an eligible participant in one of our annual incentive plans, he or she must have completed at least three months of active employment with us prior to the applicable fiscal year’s end. |
Compensation program risk assessment
We have conducted a risk assessment of our compensation policies and practices for all of our employees (not just our executive officers). Based on this review, we concluded that risks arising from our compensation policies and practices for our employees are not reasonably likely to have a material adverse effect on us. Our risk assessment included a review of program policies and practices; program analysis to identify risk and risk control related to the programs; and determinations as to the sufficiency of risk identification, the balance of potential risk to potential reward, risk control and the support of the programs and their risks to our strategy. Although we reviewed all compensation programs, we focused on the programs with variability of payout (e.g., short-term and long-term incentive programs), with the ability of a participant to directly affect payout and the controls on participant action and payout. As part of our review, we specifically noted the following factors that reduce the likelihood that excessive risk taking would have a material adverse effect on us: (i) a strong internal control structure, including business, legal and finance review of our customer contracts prior to entry into such contracts; (ii) payment to our employees of competitive base salaries and benefits that are not subject to performance risk; and (iii) a mix between cash and noncash and short-term and long-term compensation.
Tax and accounting considerations
Tax and accounting considerations generally do not have a material impact on our compensation decisions. However, our CHR Committee does consider the accounting and cash flow implications of various forms of executive compensation.
Section 162(m) of the Internal Revenue Code places a limit of $1 million on the amount of compensation that a public company may deduct for corporate income tax purposes in any one year with respect to its named executive officers (other than the chief financial officer). In fiscal 2014, as a privately-held company, Section 162(m) did not apply to us. Going forward, following expiration of the Section 162(m) transition period, the CHR Committee will use its judgment to authorize
117
compensation payments that may be subject to the limit when the CHR Committee believes that such payments are appropriate, in order to maintain flexibility in compensating our executives.
In our consolidated financial statements, we record salaries and bonuses as expenses in the amount paid or to be paid to the named executive officers. Accounting rules also require us to record an expense in our consolidated financial statements for the portion of the Class B Units of the MEIP Awards for which forfeiture restrictions lapsed based on the participant’s service over a four-year period. Our CHR Committee believes that the many advantages of equity compensation more than compensate for the non-cash accounting expense associated with it.
Summary compensation table
| Name and Principal Position | Fiscal Year |
Salary ($)(1) |
Stock Awards ($)(2) |
Non-Equity Incentive Plan Compensation ($)(3) |
All Other Compensation ($)(4) |
Total ($) | ||||||||||
| James C. Mullen | 2014 | 934,615 | 20,182,920 | 1,012,500 | 22,970 | 22,153,005 | ||||||||||
| Chief Executive Officer |
||||||||||||||||
| Stuart Grant | 2014 | 463,846 | 4,372,966 | 225,000 | 21,094 | 5,082,906 | ||||||||||
| Executive Vice President, Chief Financial Officer |
||||||||||||||||
| Michael Lehmann | 2014 | 414,615 | 2,691,056 | 215,000 | 86,614 | 3,407,285 | ||||||||||
| President, Global Pharmaceutical Development Services and Executive Vice President, Global Sales and Marketing |
||||||||||||||||
| Michael E. Lytton | 2014 | 415,385 | 2,691,056 | 220,000 | 32,717 | 3,359,158 | ||||||||||
| Executive Vice President, Corporate Development and Strategy |
||||||||||||||||
| Harry R. Gill, III | 2014 | 376,077 | 2,354,674 | 185,000 | 33,857 | 2,946,608 | ||||||||||
| Senior Vice President, Quality and Continuous Improvement |
||||||||||||||||
(1) We have entered into employment agreements with each of our named executive officers that set an initial base salary at the time of hire. Thereafter, base salary for our Chief Executive Officer is determined by our Board, and base salary for our other executive officers is approved by our CHR Committee. See “—Compensation discussion and analysis—Fixed compensation—base salary.” Amounts are based on base salaries as described above, but reflect the fact that fiscal 2014 included 27 pay periods based on our bi-weekly pay cycle.
(2) The amounts shown in this column do not reflect compensation actually received by the named executive officers, but instead represent the aggregate grant date fair value of MEIP Awards granted during fiscal 2014, computed in accordance with Financial Accounting Standards Board Accounting Standard Codification Topic 718. These award values have been determined based on certain assumptions. The assumptions related to the MEIP Awards are described in the Note 11 to our consolidated audited financial statements included in this registration statement.
(3) The amounts shown in this column for each of our named executive officers represent bonuses paid under our 2014 Bonus Plan. See “—Variable compensation—short-term and long-term incentives—Short-term incentive—Cash incentive bonus.”
(4) The amounts shown in this column represent company matching contributions to the 401(k) retirement plan, the cost of supplemental health and insurance benefits, life insurance premiums, the cost of automobile allowances, relocation expenses, tax gross-ups, and other perquisites or personal benefits. Details are provided below in “—All other compensation table.”
118
All other compensation table
The following table sets forth each component of the “All Other Compensation” column of the Summary Compensation Table for fiscal 2014.
| Name | Defined Contribution Plan Contributions ($)(1) |
Cost of Supplemental Health and Insurance Benefits and Life Insurance ($)(2) |
Cost of Automobile Allowance ($)(3) |
Relocation Expenses ($)(4) |
Tax Gross-Ups ($)(5) |
Total ($) |
||||||||||||
| James C. Mullen | — | 21,479 | — | — | 1,492 | 22,971 | ||||||||||||
| Stuart Grant | — | 19,603 | — | — | 1,492 | 21,095 | ||||||||||||
| Michael Lehmann | 10,185 | 21,511 | — | 29,362 | 25,557 | 86,615 | ||||||||||||
| Michael Lytton | 7,346 | 23,879 | — | — | 1,492 | 32,717 | ||||||||||||
| Harry R. Gill, III | — | 20,365 | 12,000 | — | 1,492 | 33,857 | ||||||||||||
(1) The amounts in this column reflect matching contributions to Messrs. Lehmann and Lytton’s 401(k) retirement plans.
(2) The amounts in this column represent the incremental dollar value of life insurance, medical, vision, dental, and long-term disability insurance premiums paid by us on behalf of our named executive officers in fiscal 2014 above the amounts generally available to all employees, as well as supplemental health benefits, including enhanced medical benefits paid for the benefit of our named executive officers. Some of these amounts are taxable benefits, which are “grossed-up” based on the individual’s applicable tax rate.
(3) Mr. Gill receives a car allowance to pay for automobile-related expenses. The amounts in this column reflect the cost of such allowances.
(4) In fiscal 2014, Mr. Lehmann received assistance with the purchase of a new home and the amount in this column represents the aggregate incremental cost of such assistance, which includes the costs related to temporary living arrangements, storage of personal belongings and home inspection fees. These amounts are taxable benefits, which are “grossed-up” based on the individual’s applicable tax rate.
(5) The amounts in this column represent tax gross-ups paid to our named executive officers in connection with relocation expenses and health benefits provided to them.
Grants of plan-based awards in fiscal 2014
The following table provides information about equity awards and non-equity incentive plan awards granted to our named executive officers in fiscal 2014. All MEIP Awards were granted under our MEIP. Estimated possible payouts under non-equity incentive plan awards were based on our 2014 Bonus Plan. Our performance measures and financial results are discussed more fully in “—Compensation discussion and analysis.”
Estimated Possible Payouts Under Non-Equity Incentive Plan Awards |
All Other Stock Awards: Number of Shares of Stock or Units (#)(2) |
Grant Date Fair Value of Stock Awards ($)(3) |
||||||||||||||
| Name | Grant Date | Threshold ($)(1) |
Target ($) | Maximum ($) | ||||||||||||
| James C. Mullen | June 24, 2014 | 450,000 | 900,000 | 1,800,000 | 30,000 | 20,182,920 | ||||||||||
| Stuart Grant | June 24, 2014 | 100,644 | 201,288 | 402,576 | 6,500 | 4,372,966 | ||||||||||
| Michael Lehmann | June 24, 2014 | 89,914 | 179,827 | 359,654 | 4,000 | 2,691,056 | ||||||||||
— | — | |||||||||||||||
| Michael E. Lytton | June 24, 2014 | 90,000 | 180,000 | 360,000 | 4,000 | 2,691,056 | ||||||||||
| Harry R. Gill, III | June 24, 2014 | 80,913 | 161,827 | 323,654 | 3,500 | 2,354,674 | ||||||||||
(1) There is no minimum amount payable under the 2014 Bonus Plan. No payout is earned with respect to a particular performance objective if we fail to achieve the threshold level of performance with respect to such objective. In addition, even if we meet minimum corporate financial metrics, the incentive payments under the 2014 Bonus Plan are subject to the individual executive’s
119
personal performance multiplier, which could be 0% for a rating of less than “Meets Expectations.” The threshold amount is 50% of the target amount shown, and the amount shown in the threshold column represents the amount payable under the 2014 Bonus Plan if the threshold levels are met for each corporate performance measure and a 1.0 personal performance multiplier is applied. The amounts in the target column represent the amounts payable under the 2014 Bonus Plan if we meet 100% of each of the three target corporate financial performance measures and a 1.0 personal performance multiplier is applied. The maximum amount payable under the 2014 Bonus Plan is 200% of the executive’s target amount.
(2) Under the MEIP, the named executive officers received Class B Units, Class C Units, Class D Units and Class E Units on June 24, 2014. For additional information on these Partnership profits interests, see the discussion above under “JLL/Delta Patheon Holdings, L.P., 2014 Management Equity Incentive Plan.”
(3) These dollar amounts do not represent compensation actually received in 2014. Instead, the amounts reflect the aggregate grant-date fair value of awards received in 2014, computed in accordance with ASC Topic 718.
Outstanding equity awards as of October 31, 2014
Stock Awards |
|||||||||
| Name | Grant Date(1) | Number of Shares or Units of Stock That Have Not Vested (#) |
Market Value of Shares or Units That Have Not Vested ($) |
||||||
| James C. Mullen | 06/24/2014 | 30,000 | |||||||
| Stuart Grant | 06/24/2014 | 6,500 | |||||||
| Michael Lehmann | 06/24/2014 | 4,000 | |||||||
| Michael Lytton | 06/24/2014 | 4,000 | |||||||
| Harry R. Gill, III | 06/24/2014 | 3,500 | |||||||
(1) Represents MEIP awards (Class B Units, Class C Units, Class D Units and Class E Units) granted under the MEIP. Forfeiture restrictions with respect to 71% of the Class B Units lapse in equal installments on the first, second, third and fourth anniversaries of the date of grant. Forfeiture restrictions with respect to the remaining Class B Units lapse upon a qualifying exit event. Forfeiture restrictions on the Class C Units, Class D Units and Class E Units lapse when the return of capital thresholds applicable to such Units is satisfied or, if a qualifying exit event has not occurred prior to the fifth anniversary of an IPO, when the market value of the publicly traded securities would result in the satisfaction of the return of capital applicable to such Units. For additional information, see “—Variable compensation—short-term and long-term incentives—Long-term incentives.”
(2) The market value is determined by multiplying the value of the applicable class of units as of October 31, 2014 (as determined in accordance with our annual valuation process) by the number of units of the applicable class.
Termination and change in control benefits
The following contracts, agreements, plans and arrangements provide for payments to the applicable named executive officers at, following or in connection with either (i) certain terminations of employment or (ii) a change in control of our Company.
In the event of a change of control under the MEIP, 28% of the Class B Units will vest, the remaining Class B Units that are subject to time-based vesting will automatically vest, and the Class C Units, Class D Units and Class E Units will automatically vest if the applicable return of capital threshold for such units is achieved in connection with the transaction.
A change of control under the MEIP is generally (i) the sale of all or substantially all of the assets of the Partnership other than to JLL Holdco or DSM or their respective affiliates, (ii) a merger, consolidation, recapitalization or other reorganization by the Partnership or a sale or distribution of equity securities or voting power, in each case, that results in any person other than JLL Holdco or DSM owning more than 50% of the outstanding Equity Securities or voting power of the Partnership, or (iii) a liquidation or dissolution of the Partnership.
Employment agreements
Our employment agreements with our named executive officers contain certain provisions relating to benefits our named executive officers may receive upon a qualifying termination of employment. In general, our named executive officers are only entitled to receive severance benefits under their employment agreements if they execute and do not revoke a waiver and release drafted by us within a prescribed time following termination of employment. In addition, the employment agreements with each of our named executive officers include requirements related to confidentiality, non-solicitation and noncompetition. The non-solicitation and noncompetition requirements extend for 12 months following each named executive officer’s termination of employment (24 months for Mr. Mullen). Set forth below is a summary of the material termination provisions of each named executive officer’s employment agreement.
120
James C. Mullen
Mr. Mullen’s employment agreement provides that if we terminate his employment without Cause, or if he terminates his employment for Good Reason, we are required to pay him severance equal to two years of his then current base salary, payable in 24 equal monthly installments. Mr. Mullen’s right to severance benefits is contingent upon his continued compliance with the confidentiality, non-disparagement, non-solicitation and non-competition provisions of his employment agreement and his execution and non-revocation of a release of claims.
Stuart Grant
Mr. Grant’s employment agreement provides that if we terminate his employment without Cause, or if he terminates his employment for Good Reason, we are required to pay him severance equal to 12 months of his annual base salary plus an amount determined by our CHR Committee in its sole discretion to reflect the annual incentive Mr. Grant would have otherwise earned during the year in which the termination occurs, payable in 12 equal monthly payments. Mr. Grant’s right to severance benefits is contingent upon his execution and non-revocation of a release of claims.
Michael Lehmann
Mr. Lehmann’s employment agreement provides that if we terminate his employment without Cause, or if he terminates his employment for Good Reason, we are required to pay him severance equal to 12 months of his annual base salary, in 12 equal monthly payments. Mr. Lehmann’s right to severance benefits is contingent upon his continued compliance with the restrictive covenants contained in his employment agreement and his execution and non-revocation of a release of claims.
Michael E. Lytton
Mr. Lytton’s employment agreement, as amended, provides that if we terminate his employment other than for Cause or if he terminates his employment for Good Reason, we are required to pay him severance equal to 12 months of his annual base salary plus any performance bonus for periods of service completed prior to the date of termination, payable in 12 equal monthly payments. Mr. Lytton’s right to severance benefits is contingent upon his continued compliance with the restrictive covenants contained in his employment agreement and his execution and non-revocation of a release of claims.
Harry R. Gill, III
Mr. Gill’s employment agreement, as amended, provides that if we terminate his employment without Cause, we are required to pay him severance equal to 12 months of his annual base salary plus an amount determined by the President, North America Operations in his sole discretion to reflect the annual incentive Mr. Gill would have earned during the year in which termination occurs. Severance is payable in 12 equal monthly installments. Subject to Mr. Gill’s election of COBRA coverage, the employment agreement also provides that we will pay the company portion of his health coverage for twelve months following such termination of employment. Mr. Gill’s right to severance benefits is contingent upon his continued compliance with the restrictive covenants contained in his employment agreement and his execution and non-revocation of a release of claims.
For purposes of the employment agreements with our named executive officers, the terms below have the following meanings, as applicable:
| • | “Cause” generally means the determination, in good faith, by our Board (or, in the case of Mr. Gill, by the President, North America Operations), after notice to the executive officer that one or more of the following events have occurred: (i) the executive officer has failed to perform his material duties, and such failure has not been cured after a period of 30 days’ notice from us; (ii) any reckless or grossly negligent act by the executive officer having the effect of injuring the interests, business or reputation of any member of our affiliated group; (iii) the executive officer’s |
121
commission of any felony (including entry of a nolo contendere plea); (iv) any misappropriation or embezzlement of the property of any member of our affiliated group; or (v) breach by the executive officer of any material provision of his employment agreement, which breach, if curable, remains uncured for a period of 30 days after receipt by him of written notice from us.
| • | “Good Reason” generally means the occurrence of any of the following events without the executive officer’s consent: (i) a material reduction in the executive officer’s duties or responsibilities or the assignment to the executive officer of duties materially inconsistent with his position; or (ii) a material breach by us of the executive officer’s employment agreement. A termination of the executive officer’s employment by him is not deemed to be for Good Reason unless (x) he gives notice to us of the existence of the event or condition constituting Good Reason within 30 days after such event or condition initially occurs or exists; (y) we fail to cure such event or condition within 30 days after receiving such notice; and (z) his “separation from service” within the meaning of the U.S. Internal Revenue Code of 1986, as amended, or the Code, occurs not later than 90 days after such event or condition initially occurs of exists. |
| • | Under Mr. Lytton’s employment agreement, “Good Reason” also includes a requirement by us that he work more than 50 miles from his principal office. |
| • | Under Mr. Mullen’s employment agreement, “Good Reason” also includes removal of him from his position. Mr. Mullen’s agreement also provides that no termination for Good Reason is effective unless (i) he gives us written notice within 60 days of becoming aware of the initial occurrence of the event or condition constituting Good Reason and the specific reasonable cure requested by him; (ii) we have failed to cure such event or condition within 30 days of receiving such notice; and (iii) he resigns within three months of the initial occurrence. Furthermore, Mr. Mullen may not resign for Good Reason if, on the date of notice to us, (x) grounds exist for his termination by us for Cause or (y) he has already given us notice of (a) the non-renewal of his agreement at the end of its term or (b) his intention to resign without Good Reason. |
Potential payments upon termination or change in control
The following table summarizes the estimated amounts payable to each named executive officer in the event of a termination of employment or change in control.
We have noted below the other material assumptions used in calculating the estimated payments under each triggering event. The actual amounts that would be paid to a named executive officer upon termination of employment can only be determined at the time an actual triggering event occurs.
| Name | Triggering Event(1) | Severance ($)(2) | Bonus ($)(2) | Total ($) | ||||||
| James C. Mullen | Other than for Cause/ For Good Reason |
1,800,000 | — | 1,800,000(3 | ) |
|||||
| Change in Control | — | — | —(4 | ) |
||||||
| Stuart Grant | Other than for Cause/ For Good Reason |
475,000 | 213,750 | 688,750(3 | ) |
|||||
| Change in Control | — | — | —(4 | ) |
||||||
| Michael Lehmann | Other than for Cause/ For Good Reason |
415,000 | — | 415,000(3 | ) |
|||||
| Change in Control | — | — | —(4 | ) |
||||||
| Michael E. Lytton | Other than for Cause/ For Good Reason |
400,000 | 180,000 | 580,000(3 | ) |
|||||
| Change in Control | — | — | —(4 | ) |
||||||
| Harry R. Gill, III | Other than for Cause/ For Good Reason |
375,000 | 168,750 | 543,750(3 | ) |
|||||
| Change in Control | — | — | —(4 | ) |
||||||
(1) The employment agreements provide for payment of severance in connection with a named executive officer’s termination of employment other than for Cause or for Good Reason (as such terms are defined in the employment agreements, further discussed above).
122
(2) The values shown represent the payments that would have been made to our named executive officers pursuant to their respective employment agreements. These amounts are based on the named executive officers’ base salaries and bonus targets in effect as of October 31, 2014. For purposes of this table, the bonus column reflects the target performance bonus amount for a full fiscal year.
(3) Assuming a qualifying termination of employment occurred on October 31, 2014, none of the time-based vesting Class B Units granted under the MEIP would have been vested as of such date, and all units granted under the MEIP would have been forfeited.
(4) All of the Class B Units granted under the MEIP would vest on a change in control of the Partnership, and the value to be received by the named executive officers in respect of such units would depend upon the proceeds received in connection with such a transaction. The Class C Units, Class D Units and Class E Units granted under the MEIP would only vest if the applicable return of capital threshold for such units was achieved in connection with the transaction.
123
Certain relationships and related person transactions
In addition to the director and executive officer compensation arrangements discussed above in the section entitled “Executive compensation,” this section describes transactions, or series of related transactions, since January 1, 2012 to which we were a party or will be a party, in which:
| • | the amount involved exceeded or will exceed $120,000; and |
| • | any of our directors, executive officers or beneficial owners of more than 5% of any class of our capital stock, or 5% Holder, or any members of the immediate family of and any entity affiliated with any such person, had or will have a direct or indirect material interest. |
Description of transactions
In connection with the proposed spin-off of BLS, we expect to enter into agreements with BLS to continue to provide commercial manufacturing services and management services, including strategic management, finance, information technology and legal support services, after the spin-off. We expect that certain of our executive officers will provide the management services. In addition, Patheon US Holdings Inc. will enter into a tax sharing agreement with BLS that generally governs the parties’ respective rights, responsibilities and obligations after the separation of BLS from Patheon US Holdings Inc. with respect to certain taxes. The agreement will also assign rights and responsibilities for administrative matters, such as the filing of returns, payment of taxes due, retention of records, tax reporting practices and conduct of audits, examinations or similar proceedings. The agreement will provide for cooperation and information sharing with respect to tax matters.
Registration rights agreement
We intend to enter into a registration rights agreement with certain direct and indirect holders of our common stock pursuant to which we will grant them, their affiliates and certain of their transferees the right, under certain circumstances and subject to certain restrictions, to require us to register under the Securities Act shares of our common stock (and other securities convertible into or exchangeable or exercisable for shares of our common stock) held or acquired by them. Such securities registered under any registration statement will be available for sale in the open market unless restrictions apply.
Policies and procedures for related person transactions
Prior to the completion of this offering, our board of directors will adopt a written statement of policy regarding transactions with related persons, which we refer to as our “related person policy.” Our related person policy requires that a “related person” (as defined as in paragraph (a) of Item 404 of Regulation S-K) must promptly disclose to our General Counsel any “related person transaction” (defined as any transaction that is anticipated would be reportable by us under Item 404(a) of Regulation S-K in which we were or are to be a participant and the amount involved exceeds $120,000 and in which any related person had or will have a direct or indirect material interest) and all material facts with respect thereto. The General Counsel will then promptly communicate that information to our board of directors. No related person transaction will be executed without the approval or ratification of our board of directors or a duly authorized committee of our board of directors. It is our policy that directors interested in a related person transaction will recuse themselves from any vote on a related person transaction in which they have an interest.
124
Principal and selling shareholders
The following table sets forth information regarding the beneficial ownership of shares of our common stock as of , 2015 by:
| • | the selling shareholders; |
| • | each person known to us to beneficially own more than 5% of our outstanding common stock; |
| • | each of our directors and named executive officers; and |
| • | all of our directors and executive officers as a group. |
The amounts and percentages of shares beneficially owned are reported on the basis of SEC regulations governing the determination of beneficial ownership of securities. Under SEC rules, a person is deemed to be a “beneficial owner” of a security if that person has or shares voting power or investment power, which includes the power to dispose of or to direct the disposition of such security. A person is also deemed to be a beneficial owner of any securities of which that person has a right to acquire beneficial ownership within 60 days. Securities that can be so acquired are deemed to be outstanding for purposes of computing such person’s ownership percentage, but not for purposes of computing any other person’s percentage. Under these rules, more than one person may be deemed to be a beneficial owner of the same securities and a person may be deemed to be a beneficial owner of securities as to which such person has no economic interest.
Except as otherwise indicated in the footnotes below, each of the beneficial owners has, to our knowledge, sole voting and investment power with respect to the indicated shares. Unless otherwise noted, the address of each beneficial owner is .
Shares beneficially owned prior to this offering |
Shares beneficially owned after this offering (without option) |
Shares beneficially owned after this offering (with option) |
||||||||||||||||||||||
| Name and address of beneficial owners |
Number | % | Number of shares being offered |
Number of shares subject to option |
Number | % | Number | % | ||||||||||||||||
| 5% shareholders: |
||||||||||||||||||||||||
| JLL | ||||||||||||||||||||||||
| DSM | ||||||||||||||||||||||||
| Directors and named executive officers: |
||||||||||||||||||||||||
| James C. Mullen | ||||||||||||||||||||||||
| Michael Lehmann | ||||||||||||||||||||||||
| Stuart Grant | ||||||||||||||||||||||||
| Michael E. Lytton | ||||||||||||||||||||||||
| Eric Sherbet | ||||||||||||||||||||||||
| Harry R. Gill, III | ||||||||||||||||||||||||
| Paul S. Levy | ||||||||||||||||||||||||
| Daniel Agroskin | ||||||||||||||||||||||||
| Michel Lagarde | ||||||||||||||||||||||||
| Nicholas O’Leary | ||||||||||||||||||||||||
| Stephan Tanda | ||||||||||||||||||||||||
| Hugh Welsh | ||||||||||||||||||||||||
| Philip Eykerman | ||||||||||||||||||||||||
| Directors and executive officers as a group | ||||||||||||||||||||||||
125
The following is a description of the material terms of our articles of association, which will be filed as an exhibit to the registration statement of which this prospectus is a part.
General
The material provisions of our articles of association and particular provisions of Dutch law relevant to our statutory existence and the Dutch Corporate Governance Code are summarized below. This is a summary of our amended articles of association as they will be in effect upon the closing of this offering. This summary does not restate our articles of association or relevant Dutch law in their entirety. While we believe that this summary contains all of the information about the articles of association important to your decision to subscribe for the common shares, it does not include all of the provisions that you may feel are important. The articles of association, and not this summary, will define your rights as a holder of shares of our common stock.
Authorized capital
Following the completion of this offering (assuming that the underwriters’ option to purchase additional shares of our common stock is not exercised), our authorized capital stock will consist of shares, divided into:
| Series | Nominal Value per Share |
Number of Shares Authorized |
Number of Shares Outstanding |
||||||
| Common stock | $ | ||||||||
Under Dutch law, our authorized capital stock is the maximum capital that we may issue without amending our articles of association. An amendment of our articles of association would require a resolution from the general meeting.
Our articles of association are registered at the Dutch Trade Register, and an unofficial English translation has been filed with the SEC as an exhibit to the registration statement of which this prospectus forms a part. Our file number with the Dutch Trade Register is 59564903.
Issuance of capital stock
Under Dutch law, we may only issue capital stock pursuant to a resolution of the general meeting, unless another corporate body has been designated to do so by a resolution of the general meeting or by our articles of association.
Our board will be designated by the articles of association for a period of five years from the closing of this offering to issue shares and grant rights to subscribe for shares up to the amount of unissued shares in our authorized capital stock, subject to the approval of our board. The designation may be extended from time to time, with periods not exceeding five years, by a resolution of the general meeting adopted with a simple majority. If authority is not delegated to another corporate body, the general meeting may only decide to issue shares and grant rights to subscribe for shares at the proposal of the board.
Preemptive rights
Under Dutch law, in the event of an issuance of shares of common stock, each holder of common stock will have a pro rata preemptive right based on the number of shares of common stock held by such shareholder. Preemptive rights do not apply with respect to the issuance of preferred stock, or to shares of common stock issued against contributions other than in cash or shares of common stock issued to our employees or the employees of one of our group companies. Our board will be authorized by the articles of association for a period of five years from the date of the offering to limit or exclude any preemptive rights to which shareholders may be entitled in connection with the issuance of shares. The above authority to limit or exclude preemptive rights can only be exercised if at that time the authority to issue shares is in full force and effect. The authority to limit or exclude
126
preemptive rights may be extended from time to time, with periods not exceeding five years, by a resolution of the general meeting adopted with a simple majority. If authority is not delegated to another corporate body, the general meeting may only decide to limit or exclude preemptive rights at the proposal of the board.
Repurchase of shares of capital stock
Under Dutch law, a public company with limited liability (naamloze vennootschap) may acquire its own shares, subject to certain provisions of Dutch law and the company’s articles of association. We may acquire our own shares either without paying any consideration, or in the event any consideration must be paid only if (i) our shareholders’ equity less the acquisition price is not less than the sum of paid-up and called-up capital and any reserve required to be maintained by law or our articles of association, (ii) we and our subsidiaries would not thereafter hold or hold shares as a pledgee with an aggregate par value exceeding 50% of our issued capital stock and (iii) the general meeting has authorized the board to effect such acquisitions, upon the proposal of our board.
Capital reduction
Subject to Dutch law and our articles of association, pursuant to a proposal of the board, the general meeting may resolve to reduce the outstanding capital stock by cancellation of shares or by reducing the par value of the shares by means of an amendment to our articles of association. Dutch law requires that this resolution be adopted by an absolute majority of votes cast, or by a two-thirds majority of the votes cast, if less than half of the issued capital stock is present or represented at the meeting.
Dividends
Subject to certain exceptions, Dutch law provides that dividends may only be paid out of profits as shown in our annual financial statements as adopted by the general meeting.
Moreover, under Dutch law, we may only pay distributions if our shareholders’ equity (eigen vermogen) exceeds the sum of the paid-up and called-up share capital plus the reserves required to be maintained by Dutch law or by our articles of association. Pursuant to our articles of association our board of directors may decide that part of the profits realized during a financial year can be set aside to increase and/or constitute reserves. The part of the profits not so allocated to reserves is at the free disposal of the general meeting which can decide that a distribution of such profit be made.
Interim distribution can be made pursuant to a resolution of our board of directors, subject to the limitations relating to payments of preferential dividends described above and legal restrictions.
Should it be determined that any distribution made was not permitted, the shareholders or any other person entitled to profits must repay the dividends declared to the extent such shareholder or person was or ought to have been aware that the distribution was not permitted.
Subject to such restrictions, any future determination to pay distributions will depend upon a number of factors, including our results of operations, financial condition, future prospects, contractual restrictions, restrictions imposed by applicable law and other factors our board of directors deems relevant. See “Dividend policy.”
General meeting
Procedures and admissions
Pursuant to our articles of association, general meetings will be held in Amsterdam, The Netherlands in the municipality in which the company has its statutory seat, or at Schiphol (Municipality of Haarlemmermeer). A general meeting shall be held at least once a year within the period required by Dutch law, which is currently no later than six months after the end of our fiscal year, unless our articles of association provide for a shorter period.
127
Extraordinary general meetings shall be held as frequently as needed; however they must be convened by the board. Our board must give public notice of a general meeting or an extraordinary meeting of shareholders, by at least such number of days prior to the day of the meeting as required by Dutch law, which is currently fifteen days.
Pursuant to Dutch law, one or more shareholders representing at least 10% of the issued capital stock may request the Dutch courts to order that a general meeting be held if our board has not met the request of such shareholders to convene a general meeting.
The agenda for a meeting of shareholders must contain such items as the board or the person or persons convening the meeting determine. The agenda shall also include any matter, the consideration of which has been requested by one or more shareholders, representing alone or jointly with others at least such percentage of the issued capital stock as determined by Dutch law, which is currently set at 3%. The request to consider such matter should have been received by us no later than on the 60th day prior to the date of the meeting accompanied by a statement containing the reasons for the request.
The agenda for the annual general meeting shall contain, among other items, items placed on the agenda in accordance with Dutch law and our articles of association, the consideration of the annual report, the discussion and adoption of our annual accounts, our policy regarding dividends and reserves and the proposal to pay a dividend (if applicable), proposals relating to the composition of the board, including the filling of any vacancies on the board, the proposals placed on the agenda by the board, including but not limited to a proposal to grant discharge to the members of the board for their management and their supervision during the fiscal year, together with the items proposed by shareholders in accordance with provisions of Dutch law and our articles of association.
Shareholders are entitled to attend our general meeting, to address the general meeting and to vote, either in person or represented by a person holding a written proxy. The requirement that a proxy must be in written form is also fulfilled when it is recorded electronically.
The holder of a right of usufruct or a pledgee with voting rights is entitled to request an item to be placed on the agenda of the general meeting, to attend the general meeting, to address the general meeting and to vote.
Under Dutch law, shareholders’ resolutions may be adopted in writing without holding a meeting, provided that (i) the articles of association explicitly allow such practice, and (ii) all shareholders are in favor of the resolution to be adopted. The requirement of unanimity renders the adoption of shareholder resolutions without a meeting not feasible for publicly traded companies.
Members of the board are authorized to attend general meetings. They have an advisory vote. The general meeting is presided over by the chairman. In the absence of the chairman, one of the other directors presides over the meeting.
Voting rights
Under Dutch law, each share of common stock confers the right to cast one vote at the general meeting. Each shareholder may cast as many votes as it holds shares. Pursuant to our articles of association, each share of common stock will confer the right to cast one vote. Resolutions by the general meeting must be adopted by an absolute majority of votes cast, unless another standard of votes and/or a quorum is required by virtue of Dutch law or our articles of association. There is no required quorum under Dutch law for shareholder action at a properly convened shareholder meeting, except in specific instances prescribed by Dutch law or our articles of association.
Each shareholder has the right to participate in, address and exercise its right to vote at the general meeting in person or by written proxy or by electronic means of communication, subject to certain conditions for the use of electronic means of voting set by or pursuant to our articles of association.
No votes may be cast at a general meeting on the shares held by us or our subsidiaries. Nonetheless, the holders of a right of usufruct and the holders of a right of pledge in respect of the shares held by us or our subsidiaries in our capital stock are not excluded from the right to vote on such shares,
128
if the right of usufruct or the right of pledge was granted prior to the time such shares were acquired by us or any of our subsidiaries. Neither we nor our subsidiaries may cast votes in respect of a share on which we or such subsidiary holds a right of usufruct or a right of pledge.
Under Dutch law, our board is not required to set a record date for a general meeting to determine those shareholders that are entitled to vote at the general meeting. If our board determines in the future to include a record date in a notice for convening a general meeting, Dutch law requires that the record date be on the 28th day prior to the date of the general meeting. Shareholders as of the record date shall be deemed entitled to attend and to vote at the general meeting. There is no specific provision in Dutch law relating to adjournment of the general meeting.
Shareholder vote on certain reorganizations
Under Dutch law, the approval of our general meeting is required for any significant change in the identity of us or our business.
Appraisal rights
Subject to certain exceptions, Dutch law does not recognize the concept of appraisal or dissenters’ rights.
Anti-takeover provisions
Under Dutch law, protective measures against takeovers are possible and permissible, within the boundaries set by Dutch law and Dutch case law.
The following resolutions and provisions of our articles of association may have the effect of making a takeover of our company more difficult or less attractive, including:
| • | our board will be designated to issue shares and grant rights to subscribe for shares in the form of common or preferred stock, up to the amount of our authorized capital stock and to limit or exclude preemptive rights on shares, both for a period of five years from the date of the offering; and |
| • | shareholder action by written consent will not be permitted, thereby requiring all shareholder actions to be taken at a general meeting. |
Inspection of books and records
The board provides all information required by Dutch law at the general meeting and makes the information available to individual shareholders at the office of the company with copies available upon request. The part of our shareholders’ register kept in The Netherlands is available for inspection by the shareholders.
Amendment of the articles of association
The general meeting will be able to effect an amendment of the articles of association only upon a proposal of our board.
Dissolution, merger or demerger
The general meeting will only be able to effect a dissolution of the company. The liquidation of the company shall be carried out by the directors, if and to the extent the general meeting has not appointed one or more other liquidators.
Under Dutch law, a resolution for a legal merger (juridische fusie) or legal demerger (juridische splitsing) is adopted in the same manner as a resolution to amend the articles of association. The general meeting may, in accordance with the relevant merger proposal by the board, adopt a resolution for a legal merger or legal demerger by an absolute majority of the votes cast, unless less than half of the issued capital stock is present or represented at the meeting, in which case a two-thirds majority is required.
129
Shareholder suits
If a third party is liable to a Dutch company, under Dutch law generally shareholders do not have the right to bring an action on behalf of the company or bring an action on their own behalf to recover damages sustained as a result of a decrease in value, or loss of an increase in value, of their stock. Only in the event that the cause for the liability of such third party to the company also constitutes a tortious act directly against such shareholder and the damages sustained are permanent may that shareholder have an individual right of action against such third party on its own behalf to recover such damages. The Dutch Civil Code provides for the possibility to initiate such actions collectively. A foundation or an association whose objective, as stated in its articles of association, is to protect the rights of a group of persons having similar interests may institute a collective action. The collective action cannot result in an order for payment of monetary damages but may result in a declaratory judgment (verklaring voor recht), for example, declaring that a party has acted wrongfully or has breached its fiduciary duty. The foundation or association and the defendant are permitted to reach (often on the basis of such declaratory judgment) a settlement, which provides for monetary compensation of damages. A designated Dutch court may declare the settlement agreement binding upon all the injured parties whereby an individual injured party will have the choice to opt-out within the term set by the court (at least three months). Such individual injured party may also individually institute a civil claim for damages within the aforementioned term.
Squeeze-out
Under Dutch law, a shareholder who holds at least 95% of our issued capital for its own account may institute proceedings against the other shareholders jointly for the transfer of their shares to the shareholder. The proceedings are held before the Enterprise Division (Ondernemingskamer) of the Court of Appeal in Amsterdam, which may award the claim for squeeze-out in relation to all minority shareholders and will determine the price to be paid for the shares, if necessary, after appointment of one or three experts who will render an opinion to the Enterprise Chamber on the value of the shares. The court shall disallow the proceedings against all other defendants if (i) notwithstanding compensation, a defendant would sustain serious tangible loss by the transfer; (ii) the defendant is the holder of a share in which a special right of control of the company is vested under the articles of association; or (iii) a claimant has, as against a defendant, renounced his power to institute such proceedings. Once the order for transfer has become final, the acquirer must give written notice of the price, the date on which and the place where the price is payable to the minority shareholders whose addresses are known to the acquirer. Unless all addresses are known to the acquirer, it must also publish the same in a daily newspaper with nationwide distribution.
Transfer agent and registrar
We anticipate that the transfer agent and registrar for our common stock will be .
Listing
Our common stock has been approved for listing on the under the symbol “PTHN.”
130
Shares eligible for future sale
Prior to this offering, there has been no public market for our common stock. No prediction can be made as to the effect, if any, future sales of shares, or the availability for future sales of shares, will have on the market price of our common stock prevailing from time to time. The sale of substantial amounts of our common stock in the public market, or the perception that such sales could occur, could harm the prevailing market price of our common stock. Upon completion of this offering we will have a total of shares of our common stock outstanding, or shares assuming the underwriters exercise in full their option to purchase additional shares.
We intend to file one or more registration statements on Form S-8 under the Securities Act to register common stock issued or reserved for issuance under our omnibus equity incentive plan. Any such Form S-8 registration statement will automatically become effective upon filing. Accordingly, shares registered under such registration statement will be available for sale in the open market, unless such shares are subject to vesting restrictions with us or the lock-up restrictions described below. We expect that the registration statement on Form S-8 will cover shares.
Registration rights
We intend to enter into a registration rights agreement with certain direct and indirect holders of our common stock pursuant to which we will grant them, their affiliates and certain of their transferees the right, under certain circumstances and subject to certain restrictions, to require us to register under the Securities Act shares of our common stock (and other securities convertible into or exchangeable or exercisable for shares of our common stock) held or acquired by them. Such securities registered under any registration statement will be available for sale in the open market unless restrictions apply.
Lock-up arrangements
We, all of our directors, officers and certain existing shareholders have agreed that, without the prior written consent of , we and they will not, subject to certain customary exceptions, directly or indirectly, (1) offer for sale, sell, pledge, or otherwise dispose of (or enter into any transaction or device that is designed to, or could be expected to, result in the disposition by any person at any time in the future of) any shares of our common stock or any securities convertible into or exercisable or exchangeable for shares of our common stock (including, without limitation, shares of our common stock that may be deemed to be beneficially owned in accordance with the rules and regulations of the SEC and shares of our common stock that may be issued upon exercise of any options or warrants), (2) enter into any swap or other derivatives transaction that transfers to another, in whole or in part, any of the economic consequences of ownership of shares of our common stock or securities convertible, exercisable or exchangeable into shares of our common stock, (3) make any demand for or exercise any right or file or cause to be filed a registration statement, including any amendments thereto, with respect to the registration of any shares of our common stock or securities convertible, exercisable or exchangeable into shares of our common stock or any of our other securities or (4) publicly disclose the intention to do any of the foregoing for a period of 180 days after the date of this prospectus. See “Underwriting.”
Rule 144
In general, under Rule 144, a person who is not our affiliate and has not been our affiliate at any time during the preceding three months will be entitled to sell any shares of our common stock that such person has beneficially owned for at least six months, including the holding period of any prior owner other than one of our affiliates, without regard to volume limitations. Sales of our common stock by any such person would be subject to the availability of current public information about us if the shares to be sold were beneficially owned by such person for less than one year. Such person may sell shares of our common stock acquired from us immediately upon the closing of this offering, without regard to volume limitations or the availability of public information about us, if the person has beneficially owned the shares to be sold for at least one year, including the holding period of any prior owner other than one of our affiliates.
131
Each of our affiliates who has beneficially owned shares of our common stock for at least six months, including the holding period of any prior owner other than one of our affiliates, will be entitled to sell within any three-month period a number of shares that does not exceed the greater of 1% of the number of shares of our common stock then outstanding and the average weekly trading volume in our common stock on the during the four calendar weeks preceding the date of filing of a Notice of Proposed Sale of Securities Pursuant to Rule 144 with respect to the sale. Sales under Rule 144 by our affiliates are also subject to manner of sale provisions and notice requirements and to the availability of current public information about us.
132
Tax considerations
United States federal income tax considerations
Introduction
The following discussion is a summary of U.S. federal income tax considerations relating to the ownership and disposition of shares by U.S. Holders (as defined below). This discussion is based on the U.S. Internal Revenue Code of 1986, as amended, or the Code, its legislative history, existing and proposed U.S. Treasury Regulations promulgated thereunder, judicial decisions, administrative pronouncements, and the Convention between the Kingdom of The Netherlands and the United States of America for the Avoidance of Double Taxation and the Prevention of Fiscal Evasion with Respect to Taxes on Income, or the Netherlands-U.S. Convention, each as in effect on the date hereof, and all of which are subject to change or differing interpretations, possibly with retroactive effect. This summary is limited to U.S. Holders of shares that (i) are initial purchasers of shares pursuant to the initial public offering (ii) will hold such shares as capital assets (generally property held for investment) under the Code and (iii) use the U.S. dollar as their functional currency. This summary is not a complete analysis or description of all potential tax consequences to U.S. Holders and does not address all tax considerations that may be relevant to all categories of potential purchasers (such as dealers or traders in securities, commodities, or currencies, tax exempt investors, investors who own directly, indirectly or by attribution 10% or more of the voting stock of the Company, banks, financial institutions, thrifts, regulated investment companies, insurance companies, grantor trusts, individual retirement accounts or other tax deferred accounts, investors that hold shares as part of a “hedging,” “integrated,” “conversion” or constructive sale transaction or a “straddle,” persons who have ceased to be U.S. citizens or to be taxed as resident aliens, investors liable for the alternative minimum tax, or investors holding shares in connection with a permanent establishment or a fixed base through which an investor carries on business or performs services outside the United States). Further, this summary does not address the 3.8% tax on net investment income, or any state, local, non-U.S., federal estate, gift or other tax consequences relating to the ownership and disposition of shares.
The term “U.S. Holder” means a beneficial owner of shares that is for U.S. federal income tax purposes:
| • | an individual who is a citizen or resident of the United States; |
| • | a corporation or other entity treated as a corporation for U.S. federal income tax purposes created or organized in or under the laws of the United States or any state thereof (including the District of Columbia); |
| • | an estate the income of which is subject to U.S. federal income taxation regardless of its source; or |
| • | a trust: (a) the administration of which is subject to the primary supervision of a court within the United States and for which one or more U.S. persons have the authority to control all substantial decisions; or (b) that has a valid election in effect under applicable U.S. Treasury Regulations to be treated as a U.S. person. |
If a partnership (or other entity classified as a partnership for U.S. federal income tax purposes) holds shares, the U.S. federal income tax treatment of a partner generally will depend upon the status of the partner and the activities of the partnership. Partners in partnerships holding shares should consult their tax advisors concerning the associated tax consequences.
THE UNITED STATES FEDERAL INCOME TAX CONSEQUENCES SET FORTH BELOW ARE FOR GENERAL INFORMATION PURPOSES ONLY AND ARE NOT INTENDED TO CONSTITUTE A COMPLETE DESCRIPTION OF ALL TAX CONSEQUENCES RELATING TO THE OWNERSHIP AND DISPOSITION OF SHARES. BECAUSE INDIVIDUAL CIRCUMSTANCES MAY DIFFER, A PROSPECTIVE HOLDER SHOULD CONSULT WITH ITS TAX ADVISOR REGARDING THE APPLICABILITY OF THESE RULES TO IT AND THE PARTICULAR TAX EFFECTS TO IT OF THE OWNERSHIP AND DISPOSITION OF SHARES, INCLUDING THE APPLICATION OF STATE, LOCAL AND NON-U.S. TAX LAWS.
133
Distributions with respect to the shares
Subject to the passive foreign investment company, or PFIC, rules discussed below, a distribution of cash or property with respect to the shares (other than certain pro rata distributions of shares to all shareholders), including the amount of Dutch tax withheld, if any, will generally be treated as a dividend to the extent paid out of the Company’s current or accumulated earnings and profits (as determined for U.S. federal income tax purposes) and will be includible in the U.S. Holder’s gross income on the day actually or constructively received. The Company does not intend to maintain calculations of its earnings and profits under U.S. federal income tax principles, and therefore U.S. Holders should expect that such distributions will generally be reported as dividend income. Dividends paid to corporate U.S. Holders will not be eligible for the dividends received deduction allowed to U.S. corporations. Provided that certain holding period and other requirements are met, certain non-corporate U.S. Holders are eligible for the preferential rates generally available for non-corporate recipients of “qualified dividend income. “ Dividends paid with respect to shares will generally be qualified dividend income if we were not, in the year prior to the year in which the dividend was paid, and are not, in the year in which the dividend is paid, a PFIC. We currently believe that dividends paid with respect to shares would constitute qualified dividend income for U.S. federal income tax purposes with respect to eligible holders; however, this is a factual matter and is subject to change. U.S. Holders are urged to consult their tax advisors regarding the availability of the preferential dividend tax rates.
Dividends paid to U.S. Holders with respect to shares will generally be treated as foreign source “passive category income” for foreign tax credit purposes. Subject to certain limitations and subject to the discussion in the next paragraph, Dutch income taxes withheld from dividends on shares at a rate not exceeding the rate provided by the Netherlands-U.S. Convention will be treated as foreign taxes eligible for credit against a U.S. Holder’s U.S. federal income tax liability. In lieu of a credit, a U.S. Holder may elect to deduct any such Dutch income taxes, provided a deduction is claimed for all of the foreign income taxes the U.S. Holder pays in the particular taxable year.
Subject to certain exceptions under Dutch domestic law, the Company may not be required to transfer to the Dutch tax authorities the full amount of Dutch dividend withholding tax withheld in respect of dividends that the Company distributes, if the Company has received a profit distribution from a qualifying foreign subsidiary, which distribution is exempt from Dutch corporate income tax and has been subject to a foreign withholding tax at a rate of at least 5%. In such event, the Dutch withholding tax imposed on dividends paid to a U.S. Holder may not be fully creditable against the U.S. Holder’s U.S. federal income tax liability.
The rules governing the calculation and timing of foreign tax credits and the deduction of foreign taxes are complex and depend on a U.S. Holder’s particular circumstances. U.S. Holders should consult their tax advisors concerning the availability of foreign tax credits or deductions in their particular circumstances.
Sale or exchange of shares
Subject to the PFIC rules discussed below, a U.S. Holder generally will recognize capital gain or loss on the sale, exchange, redemption, or other taxable disposition of shares in an amount equal to the difference between the U.S. dollar value of the amount of cash and the fair market value of other property received upon disposition and the holder’s adjusted tax basis in such shares. Such gain or loss will be long-term gain or loss if the holder has held such shares for more than one year as at the date of such sale, exchange, redemption or other taxable disposition. Such gain or loss will generally be treated as U.S. source for foreign tax credit limitation purposes. The deductibility of capital losses is subject to significant limitations. Any long-term capital gain recognized by non-corporate U.S. Holders generally will be subject to U.S. federal income tax at reduced rates.
Passive foreign investment company considerations
A non-U.S. corporation will be classified as a PFIC for U.S. federal income tax purposes in any taxable year in which, after applying certain look-through rules, either (i) at least 75% of its gross income is “passive income” or (ii) at least 50% of the average quarterly value of its gross assets is
134
attributable to assets that produce or are held for the production of passive income. Passive income for this purpose generally includes dividends, interest, royalties, rents and gains from commodities and securities transactions. In making this determination, the non-U.S. corporation would be treated as earning its proportionate share of any income and owning its proportionate share of any assets of any corporation in which it holds a 25% or greater interest.
Based upon the Company’s calculations, the Company does not believe that it was a PFIC for its taxable year ending October 31, 2014. The Company does not anticipate being a PFIC for the 2015 taxable year or in the foreseeable future. However, because PFIC status is based on the Company’s income, assets and activities for the entire taxable year, it is not possible to determine whether the Company will be characterized as a PFIC for the 2015 taxable year or any future year, until after the close of the year. Moreover, the Company must determine its PFIC status annually based on tests that are factual in nature, and its status in future years will depend on its income, assets and activities in those years. U.S. Holders who hold shares during a period when the Company is a PFIC will be subject the PFIC rules, even if the Company ceases to be a PFIC in later years.
If the Company were a PFIC for any taxable year (or portion thereof) that is included in the holding period of a U.S. Holder, such U.S. Holder would generally be subject to increased tax charges and other material disadvantageous tax treatment with respect to any gain from the sale, exchange or other disposition of, and certain distributions with respect to, the shares. U.S. Holders are urged to consult their tax advisers about the PFIC rules, including the applicability of certain elections that may alleviate certain of the tax consequences referred to above if the Company were treated as a PFIC.
Foreign financial asset reporting
Pursuant to the Hiring Incentives to Restore Employment Act of 2010, an individual U.S. Holder may be required to submit to the IRS certain information with respect to his or her beneficial ownership of the shares. This law also imposes penalties if an individual U.S. Holder is required to submit such information to the IRS and fails to do so. U.S. Holders should consult with their tax advisors regarding the possible implications of this legislation on their investment in shares.
THE DISCUSSION ABOVE IS A GENERAL SUMMARY. IT DOES NOT COVER ALL TAX MATTERS THAT MAY BE IMPORTANT TO A PARTICULAR INVESTOR. EACH PROSPECTIVE INVESTOR SHOULD CONSULT ITS OWN TAX ADVISOR ABOUT THE TAX CONSEQUENCES OF AN INVESTMENT IN THE SHARES UNDER THE INVESTOR’S OWN CIRCUMSTANCES.
Introduction
The information set out below is a summary of the Dutch tax considerations of the acquisition, holding, redemption and disposal of the shares. This summary is limited to the Dutch tax implications for a holder who is not, or is not deemed to be and/or has not elected to be taxed as, a resident of the Netherlands for Dutch tax purposes (a “Non-resident Holder”).
This summary does not purport to be a comprehensive description of all Dutch tax considerations that may be relevant to a particular holder of the shares. Such holders may be subject to special tax treatment under any applicable law and this summary is not intended to be applicable in respect of all categories of holders of shares.
This summary is based on the tax laws of the Netherlands as in effect on the date of this prospectus, as well as regulations, rulings and decisions of the Netherlands or of its taxing and other authorities available on or before such date and now in effect, and as applied and interpreted by Netherlands courts, without prejudice to any amendments introduced at a later date and implemented with or without retroactive effect. All of the foregoing is subject to change, which change could apply retroactively and could affect the continued validity of this summary.
Because it is a general summary, prospective holders of the shares should consult their own tax advisors as to the Dutch or other tax considerations of the acquisition, holding and transfer of the
135
shares including, in particular, the application to their particular situations of the tax considerations discussed below, as well as the application of foreign or other tax laws.
Dividend withholding tax
Under the Dutch Dividend Tax Act of 1965 (Wet op de dividendbelasting 1965), we are required to withhold 15% Dutch dividend withholding tax in respect of dividends paid on the shares to a Non-resident Holder. Generally, the dividend withholding tax will not be borne by us, but will be withhold from the gross dividends paid on our shares. For this purpose, dividends are defined as the proceeds from shares, which generally include:
| • | distributions in cash or in kind, deemed and constructive distributions and repayments of paid-in capital not recognized for Dutch dividend withholding tax purposes; |
| • | liquidation proceeds, proceeds on redemption of the shares and the consideration for the repurchase of the shares by us in excess of our average paid-in capital recognized for Dutch dividend withholding tax purposes, unless a particular statutory exemption applies; |
| • | the nominal value of shares issued to a holder of shares or an increase in the nominal value of the shares, unless distributed out of our paid-in capital as recognized for Dutch dividend withholding tax purposes; and |
| • | subject to certain exceptions, partial repayments of paid-in capital for tax purposes, if and to the extent there are qualifying profits (zuivere winst), within the meaning of the Dutch Dividend Tax Act of 1965. |
Exemption from Dutch dividend withholding tax for certain corporate Non-resident Holders
A corporate Non-resident Holder may obtain an exemption from Dutch dividend withholding tax if:
| a. | the shares are attributable to a permanent establishment in The Netherlands and the participation exemption or credit of article 13 or 13aa of the Dutch Corporate Income Tax Act 1969 (Wet op de vennootschapsbelasting 1969) is applicable; or |
| b. | it is a resident in another member state of the European Union (“EU”) or of the European Economic Area (currently Iceland, Norway and Liechtenstein), and the conditions of the EU Parent-Subsidiary Directive as implemented in article 4(2) and 4(3) of the Dutch Dividend Tax Act of 1965 are satisfied, unless a general anti-abuse rule applies. |
Refund of Dutch dividend withholding tax for certain corporate Non-resident Holders
Under the Dutch Dividend Tax Act of 1965 a refund of the Dutch dividend withholding tax is available to a corporate Non-resident Holder resident in another European Union member state or of the European Economic Area and that is not subject to taxation imposed on income or profits in its state of residence, may be entitled to a refund of Dutch dividend withholding tax, if:
| a. | the corporate Non-resident Holder would not be subject to corporate income tax if resident in the Netherlands; |
| b. | it can be considered to be the beneficial owner of the dividends; |
| c. | it is not considered to be similar to a fiscal investment institution (fiscale beleggingsinstelling) or an exempt investment institution (vrijgestelde beleggingsinstelling) as defined in the Dutch Corporate Income Tax Act 1969; and |
| d. | certain administrative conditions are met. |
Treaty for the avoidance of double taxation
If a treaty for the avoidance of double taxation and the prevention of fiscal abuse with respect to taxes on income is in effect between the Netherlands and resident country of the Non-resident Holder, and the Non-resident Holder is the beneficial owner of the dividend and a resident for the
136
purposes of such treaty, the Non-resident Holder may, depending on the terms of that particular treaty, and subject to compliance with the procedures for claiming benefits under such treaty, qualify for full or partial relief at source or for a refund in whole or in part of the Dutch dividend withholding tax. The Netherlands-U.S. Convention generally provides for a 15% tax rate on dividends, subject to certain exceptions. As such, there is no need to claim a refund of the excess of the amount withheld over the tax treaty rate.
Beneficial owner—anti-dividend stripping legislation
Under the Dutch Dividend Tax Act of 1965, no exemption from, reduction in or refund of, Dutch dividend withholding tax is granted if the recipient of the dividends paid by us is not considered the beneficial owner of such dividends.
Tax on income and capital gains
Individual Non-resident Holders
An individual Non-resident Holder will not be subject to Dutch tax on income received in respect of the shares or capital gains derived from their sale, exchange or other disposition, provided that such Non-resident holder:
| • | does not derive and has not derived profits from an enterprise, which is, in whole or in part, carried on through a permanent establishment or a permanent representative in the Netherlands to which the shares are attributable; |
| • | does not share and has not shared directly in the profits of an enterprise, other than by way of securities, which is managed and controlled in the Netherlands and which enterprise (is deemed to) own(s), or has (or is deemed to have) owned, shares; |
| • | does not carry out and has not carried out employment activities, the income from which is taxable in the Netherlands, with which the holding of shares is or was connected; |
| • | does not derive benefits from miscellaneous activities (resultaat uit overige werkzaamheden) carried on in the Netherlands in respect to the shares, including, without limitation, activities which are beyond the scope of active portfolio investment activities; |
| • | does not hold and has not held a (deemed) substantial interest in the our share capital or, in the event the Non-resident Holder holds or has held a (deemed) substantial interest in our share capital, such interest is, or was, a business asset in the hands of the Non-resident Holder. Generally a holder of the shares will have a substantial interest in us if he holds, alone or together with his partner (statutorily defined term), whether directly or indirectly, the ownership of, or certain other rights, over shares representing 5% or more of our total issued and outstanding capital (or the issued and outstanding capital of any class of our shares), or rights to acquire shares, whether or not already issued, which represent at any time 5% or more of our total issued and outstanding capital (or the issued and outstanding capital of any class of our shares) or the ownership of certain profit participating certificates that relate to 5% or more of the annual profit and/or to 5% or more of the liquidation proceeds of us. A holder of the shares will also have a substantial interest in us if one of certain relatives of that holder or of his partner (a statutory defined term) has a substantial interest in us. If a holder of the shares does not have a substantial interest, a deemed substantial interest will be present if (part of) a substantial interest has been disposed of, or is deemed to have been disposed of, without recognizing taxable gain. |
Corporate Non-resident Holders
A corporate Non-resident Holder will not be subject to Dutch tax on income derived from shares or capital gains derived from their sale, exchange or disposition of shares unless such holder:
| • | derives profits from an enterprise, which enterprise is, in whole or in part, carried on through a permanent establishment or a permanent representative in the Netherlands (Dutch enterprise) and the shares are attributable to this permanent establishment or permanent representative, unless the participation exemption of article 13 of the Dutch Corporate Income Tax Act 1969 applies; |
137
| • | has a (deemed) substantial interest in the our share capital, which is not attributable to its enterprise and (one of) the main purposes of the chosen ownership structure is the avoidance of income tax or dividend withholding tax; |
| • | is a resident of certain formerly Dutch territories and certain other conditions are met; or |
| • | has certain assets deemed to be treated as a Dutch enterprise under Dutch tax law and the shares are attributable to this Dutch enterprise. |
Gift or inheritance tax
No gift or inheritance taxes will arise in the Netherlands in respect of the acquisition of the shares by way of a gift by, or as a result of the death of, a holder that is neither a resident nor deemed to be a resident of the Netherlands for the purposes of Dutch gift and inheritance tax, unless in the case of a gift of the shares by a holder who at the date of the gift was neither a resident nor deemed to be a resident of the Netherlands, such holder dies within 180 days after the date of the gift and at the time of his or her death is a resident or deemed to be a resident of the Netherlands. A gift made by a Non-resident Holder under a condition precedent is deemed to be made at the time the condition precedent is fulfilled and could be subject to Dutch gift and inheritance tax if the donor is a (deemed) resident of the Netherlands at that time.
Value added tax
No Netherlands value added tax will be payable by a Non-resident Holder of the shares in consideration for the offer of the shares (other than value added taxes on fees payable in respect of services not exempt from Netherlands value added tax).
Other taxes or duties
No registration tax, customs duty, transfer tax, stamp duty, capital tax or any other similar documentary tax or duty will be payable in the Netherlands by a Non-resident Holder in respect of or in connection with the subscription, issue, placement, allotment, delivery or transfer of the shares.
138
We and the selling shareholders are offering the shares of common stock described in this prospectus through a number of underwriters. J.P. Morgan Securities LLC, Morgan Stanley & Co. LLC, Jefferies LLC and UBS Securities LLC are acting as joint book-running managers of the offering and as representatives of the underwriters. We and the selling shareholders have entered into an underwriting agreement with the underwriters. Subject to the terms and conditions of the underwriting agreement, we and the selling shareholders have agreed to sell to the underwriters, and each underwriter has severally agreed to purchase, at the public offering price less the underwriting discounts and commissions set forth on the cover page of this prospectus, the number of shares of common stock listed next to its name in the following table:
| Name | Number of Shares |
||
| J.P. Morgan Securities LLC | |||
| Morgan Stanley & Co. LLC | |||
| Jefferies LLC | |||
| UBS Securities LLC | |||
| Total | |||
The underwriters are committed to purchase all the common shares offered by us and the selling shareholders if they purchase any shares. The underwriting agreement also provides that if an underwriter defaults, the purchase commitments of non-defaulting underwriters may also be increased or the offering may be terminated.
The underwriters propose to offer the common shares directly to the public at the initial public offering price set forth on the cover page of this prospectus and to certain dealers at that price less a concession not in excess of $ per share. Any such dealers may resell shares to certain other brokers or dealers at a discount of up to $ per share from the initial public offering price. After the initial public offering of the shares, the offering price and other selling terms may be changed by the underwriters. Sales of shares made outside of the United States may be made by affiliates of the underwriters.
The underwriters have an option to buy up to additional shares of common stock from us and certain of the selling shareholders to cover sales of shares by the underwriters which exceed the number of shares specified in the table above. The underwriters have 30 days from the date of this prospectus to exercise this over-allotment option. If any shares are purchased with this over-allotment option, the underwriters will purchase shares in approximately the same proportion as shown in the table above. If any additional shares of common stock are purchased, the underwriters will offer the additional shares on the same terms as those on which the shares are being offered.
The underwriting fee is equal to the public offering price per share of common stock less the amount paid by the underwriters to us per share of common stock. The underwriting fee is $ per share. The following table shows the per share and total underwriting discounts and commissions to be paid to the underwriters assuming both no exercise and full exercise of the underwriters’ option to purchase additional shares.
Without over-allotment exercise |
With full over-allotment exercise |
|||||
| Per Share | $ | $ | ||||
| Total: |
||||||
| Paid by us | $ | $ | ||||
| Paid by the selling shareholders | $ | $ | ||||
139
We estimate that the total expenses of this offering, including registration, filing and listing fees, printing fees and legal and accounting expenses, but excluding the underwriting discounts and commissions, will be approximately $ .
A prospectus in electronic format may be made available on the web sites maintained by one or more underwriters, or selling group members, if any, participating in the offering. The underwriters may agree to allocate a number of shares to underwriters and selling group members for sale to their online brokerage account holders. Internet distributions will be allocated by the representatives to underwriters and selling group members that may make Internet distributions on the same basis as other allocations.
We have agreed that we will not, subject to certain customary exceptions, (i) offer, pledge, sell, contract to sell, sell any option or contract to purchase, purchase any option or contract to sell, grant any option, right or warrant to purchase or otherwise transfer or dispose of, directly or indirectly, or file with the Securities and Exchange Commission a registration statement under the Securities Act relating to, any shares of our common stock or securities convertible into or exchangeable or exercisable for any shares of our common stock, or publicly disclose the intention to make any offer, sale, pledge, disposition or filing, or (ii) enter into any swap or other arrangement that transfers, in whole or in part, any of the economic consequences of ownership of any shares of common stock or any such other securities (regardless of whether any of these transactions are to be settled by the delivery of shares of common stock or such other securities, in cash or otherwise), in each case without the prior written consent of J.P. Morgan Securities LLC for a period of 180 days after the date of this prospectus, other than the shares of our common stock to be sold hereunder and any shares of our common stock issued upon the exercise of options granted under our existing management incentive plans. Notwithstanding the foregoing, if (1) during the last 17 days of the 180-day restricted period, we issue an earnings release or material news or a material event relating to our company occurs; or (2) prior to the expiration of the 180-day restricted period, we announce that we will release earnings results during the 16-day period beginning on the last day of the 180-day period, the restrictions described above shall continue to apply until the expiration of the 18-day period beginning on the issuance of the earnings release or the occurrence of the material news or material event
The selling shareholders, our directors and executive officers, and our significant shareholders have entered into lock-up agreements with the underwriters prior to the commencement of this offering pursuant to which each of these persons or entities, with limited exceptions, for a period of 180 days after the date of this prospectus, may not, without the prior written consent of J.P. Morgan Securities LLC, subject to certain customary exceptions, (1) offer to sell, pledge, sell, contract to sell, sell any option or contract to purchase, purchase any option or contract to sell, grant any option, right or warrant to purchase, or otherwise transfer or dispose of, directly or indirectly, any shares of our common stock or any securities convertible into or exercisable or exchangeable for our common stock (including, without limitation, common stock or such other securities which may be deemed to be beneficially owned by such directors, executive officers, managers and members in accordance with the rules and regulations of the SEC and securities which may be issued upon exercise of a stock option or warrant) or publicly disclose the intention to make any offer, sale, pledge or disposition or (2) enter into any swap or other agreement that transfers, in whole or in part, any of the economic consequences of ownership of the common stock or such other securities, whether any such transaction described in clause (1) or (2) above is to be settled by delivery of common stock or such other securities, in cash or otherwise, or (3) make any demand for or exercise any right with respect to the registration of any shares of our common stock or any security convertible into or exercisable or exchangeable for our common stock. Notwithstanding the foregoing, if (1) during the last 17 days of the 180-day restricted period, we issue an earnings release or material news or a material event relating to our company occurs; or (2) prior to the expiration of the 180-day restricted period, we announce that we will release earnings results during the 16-day period beginning on the last day of the 180-day period, the restrictions described above shall continue to apply until the expiration of the 18-day period beginning on the issuance of the earnings release or the occurrence of the material news or material event.
140
The restrictions described in the paragraph above do not apply, subject in certain cases to various conditions (including no filing requirements (other than certain filings on Form 5) and the transfer of the lock-up restrictions), to:
| • | any shares of our common stock acquired by a shareholder (i) in the open market after the completion of this offering or (ii) from the underwriters in this offering; |
| • | transfers as a bona fide gift or gifts; |
| • | transfers to partners, beneficiaries, members or stockholders; |
| • | transfers to affiliates or to any investment fund, customer account or other entity controlled by or under common control or management; |
| • | transfers to any trust for the direct or indirect benefit of the grantor or any immediate family member; |
| • | exercises of warrants or exercises of stock options granted pursuant to our stock option/incentive plans or otherwise outstanding on the date of this prospectus; |
| • | the establishment of any contract, instruction or plan that satisfies all of the requirements of Rule 10b5-1 under the Exchange Act; and |
| • | any demands or requests for, exercise any right with respect to, or take any action in preparation of, the registration by us under the Securities Act. |
See “Shares eligible for future sale” for a discussion of certain transfer restrictions.
We have agreed to reimburse the underwriters for up to $ for their expenses in connection with the qualification of the offering of the shares with the Financial Industry Regulatory Authority, Inc.
We and the selling shareholders have agreed to indemnify the underwriters against certain liabilities, including liabilities under the Securities Act of 1933.
We will apply to have our common stock approved for listing on the under the symbol “PTHN.”
In connection with this offering, the underwriters may engage in stabilizing transactions, which involves making bids for, purchasing and selling shares of common stock in the open market for the purpose of preventing or retarding a decline in the market price of the common stock while this offering is in progress. These stabilizing transactions may include making short sales of the common stock, which involves the sale by the underwriters of a greater number of shares of common stock than they are required to purchase in this offering, and purchasing shares of common stock on the open market to cover positions created by short sales. Short sales may be “covered” shorts, which are short positions in an amount not greater than the underwriters’ over-allotment option referred to above, or may be “naked” shorts, which are short positions in excess of that amount. The underwriters may close out any covered short position either by exercising their over-allotment option, in whole or in part, or by purchasing shares in the open market. In making this determination, the underwriters will consider, among other things, the price of shares available for purchase in the open market compared to the price at which the underwriters may purchase shares through the over-allotment option. A naked short position is more likely to be created if the underwriters are concerned that there may be downward pressure on the price of the common stock in the open market that could adversely affect investors who purchase in this offering. To the extent that the underwriters create a naked short position, they will purchase shares in the open market to cover the position.
The underwriters have advised us that, pursuant to Regulation M of the Securities Act of 1933, they may also engage in other activities that stabilize, maintain or otherwise affect the price of the common stock, including the imposition of penalty bids. This means that if the representatives of the underwriters purchase common stock in the open market in stabilizing transactions or to cover short sales, the representatives can require the underwriters that sold those shares as part of this offering to repay the underwriting discount received by them.
141
These activities may have the effect of raising or maintaining the market price of the common stock or preventing or retarding a decline in the market price of the common stock, and, as a result, the price of the common stock may be higher than the price that otherwise might exist in the open market. If the underwriters commence these activities, they may discontinue them at any time. The underwriters may carry out these transactions on The New York Stock Exchange, in the over-the-counter market or otherwise.
Prior to this offering, there has been no public market for our common stock. The initial public offering price will be determined by negotiations between us and the representatives of the underwriters. In determining the initial public offering price, we and the representatives of the underwriters expect to consider a number of factors including:
| • | the information set forth in this prospectus and otherwise available to the representatives; |
| • | our prospects and the history and prospects for the industry in which we compete; |
| • | an assessment of our management; |
| • | our prospects for future earnings; |
| • | the general condition of the securities markets at the time of this offering; |
| • | the recent market prices of, and demand for, publicly traded common stock of generally comparable companies; and |
| • | other factors deemed relevant by the underwriters and us. |
Neither we nor the underwriters can assure investors that an active trading market will develop for our common shares, or that the shares will trade in the public market at or above the initial public offering price.
Other than in the United States, no action has been taken by us or the underwriters that would permit a public offering of the securities offered by this prospectus in any jurisdiction where action for that purpose is required. The securities offered by this prospectus may not be offered or sold, directly or indirectly, nor may this prospectus or any other offering material or advertisements in connection with the offer and sale of any such securities be distributed or published in any jurisdiction, except under circumstances that will result in compliance with the applicable rules and regulations of that jurisdiction. Persons into whose possession this prospectus comes are advised to inform themselves about and to observe any restrictions relating to the offering and the distribution of this prospectus. This prospectus does not constitute an offer to sell or a solicitation of an offer to buy any securities offered by this prospectus in any jurisdiction in which such an offer or a solicitation is unlawful.
Notice to Prospective Investors in the European Economic Area
In relation to each Member State of the European Economic Area (each, a “Relevant Member State”), no offer of shares may be made to the public in that Relevant Member State other than:
| • | to any legal entity which is a qualified investor as defined in the Prospectus Directive; |
| • | to fewer than 100 or, if the Relevant Member State has implemented the relevant provision of the 2010 PD Amending Directive, 150, natural or legal persons (other than qualified investors as defined in the Prospectus Directive), as permitted under the Prospectus Directive, subject to obtaining the prior consent of the representatives; or |
| • | in any other circumstances falling within Article 3(2) of the Prospectus Directive, |
provided that no such offer of shares shall require the Company or the representatives to publish a prospectus pursuant to Article 3 of the Prospectus Directive or supplement a prospectus pursuant to Article 16 of the Prospectus Directive.
Each person in a Relevant Member State who initially acquires any shares or to whom any offer is made will be deemed to have represented, acknowledged and agreed that it is a “qualified investor” within the meaning of the law in that Relevant Member State implementing Article 2(1)(e)
142
of the Prospectus Directive. In the case of any shares being offered to a financial intermediary as that term is used in Article 3(2) of the Prospectus Directive, each such financial intermediary will be deemed to have represented, acknowledged and agreed that the shares acquired by it in the offer have not been acquired on a non-discretionary basis on behalf of, nor have they been acquired with a view to their offer or resale to, persons in circumstances which may give rise to an offer of any shares to the public other than their offer or resale in a Relevant Member State to qualified investors as so defined or in circumstances in which the prior consent of the representatives has been obtained to each such proposed offer or resale.
The Company, the representatives and their affiliates will rely upon the truth and accuracy of the foregoing representations, acknowledgements and agreements.
This prospectus has been prepared on the basis that any offer of shares in any Relevant Member State will be made pursuant to an exemption under the Prospectus Directive from the requirement to publish a prospectus for offers of shares. Accordingly any person making or intending to make an offer in that Relevant Member State of shares which are the subject of the offering contemplated in this prospectus may only do so in circumstances in which no obligation arises for the Company or any of the underwriters to publish a prospectus pursuant to Article 3 of the Prospectus Directive in relation to such offer. Neither the Company nor the underwriters have authorized, nor do they authorize, the making of any offer of shares in circumstances in which an obligation arises for the Company or the underwriters to publish a prospectus for such offer.
For the purpose of the above provisions, the expression “an offer to the public” in relation to any shares in any Relevant Member State means the communication in any form and by any means of sufficient information on the terms of the offer and the shares to be offered so as to enable an investor to decide to purchase or subscribe the shares, as the same may be varied in the Relevant Member State by any measure implementing the Prospectus Directive in the Relevant Member State and the expression “Prospectus Directive” means Directive 2003/71/EC (including the 2010 PD Amending Directive, to the extent implemented in the Relevant Member States) and includes any relevant implementing measure in the Relevant Member State and the expression “2010 PD Amending Directive” means Directive 2010/73/EU.
Notice to Prospective Investors in the United Kingdom
In addition, in the United Kingdom, this document is being distributed only to, and is directed only at, and any offer subsequently made may only be directed at persons who are “qualified investors” (as defined in the Prospectus Directive) (i) who have professional experience in matters relating to investments falling within Article 19 (5) of the Financial Services and Markets Act 2000 (Financial Promotion) Order 2005, as amended, or the Order, and/or (ii) who are high net worth companies (or persons to whom it may otherwise be lawfully communicated) falling within Article 49(2)(a) to (d) of the Order (all such persons together being referred to as “relevant persons”).
Any person in the United Kingdom that is not a relevant person should not act or rely on the information included in this document or use it as basis for taking any action. In the United Kingdom, any investment or investment activity that this document relates to may be made or taken exclusively by relevant persons. Any person in the United Kingdom that is not a relevant person should not act or rely on this document or any of its contents.
Notice to Prospective Investors in Switzerland
The shares may not be publicly offered in Switzerland and will not be listed on the SIX Swiss Exchange, or SIX, or on any other stock exchange or regulated trading facility in Switzerland. This document does not constitute a prospectus within the meaning of, and has been prepared without regard to the disclosure standards for issuance prospectuses under art. 652a or art. 1156 of the Swiss Code of Obligations or the disclosure standards for listing prospectuses under art. 27 ff. of the SIX Listing Rules or the listing rules of any other stock exchange or regulated trading facility in Switzerland. Neither this document nor any other offering or marketing material relating to the shares or the offering may be publicly distributed or otherwise made publicly available in Switzerland.
143
Neither this document nor any other offering or marketing material relating to the offering, the Company, the shares have been or will be filed with or approved by any Swiss regulatory authority. In particular, this document will not be filed with, and the offer of shares will not be supervised by, the Swiss Financial Market Supervisory Authority FINMA, and the offer of shares has not been and will not be authorized under the Swiss Federal Act on Collective Investment Schemes, or CISA. The investor protection afforded to acquirers of interests in collective investment schemes under the CISA does not extend to acquirers of shares.
Notice to Prospective Investors in the Dubai International Financial Centre
This document relates to an Exempt Offer in accordance with the Markets Rules 2012 of the Dubai Financial Services Authority, or DFSA. This document is intended for distribution only to persons of a type specified in the Markets Rules 2012 of the DFSA. It must not be delivered to, or relied on by, any other person. The DFSA has no responsibility for reviewing or verifying any documents in connection with Exempt Offers. The DFSA has not approved this prospectus supplement nor taken steps to verify the information set forth herein and has no responsibility for this document. The securities to which this document relates may be illiquid and/or subject to restrictions on their resale. Prospective purchasers of the securities offered should conduct their own due diligence on the securities. If you do not understand the contents of this document you should consult an authorized financial advisor.
In relation to its use in the Dubai International Financial Centre, or DIFC, this document is strictly private and confidential and is being distributed to a limited number of investors and must not be provided to any person other than the original recipient, and may not be reproduced or used for any other purpose. The interests in the securities may not be offered or sold directly or indirectly to the public in the DIFC.
Notice to Prospective Investors in the United Arab Emirates
The shares have not been, and are not being, publicly offered, sold, promoted or advertised in the United Arab Emirates (including the Dubai International Financial Centre) other than in compliance with the laws of the United Arab Emirates (and the Dubai International Financial Centre) governing the issue, offering and sale of securities. Further, this prospectus does not constitute a public offer of securities in the United Arab Emirates (including the Dubai International Financial Centre) and is not intended to be a public offer. This prospectus has not been approved by or filed with the Central Bank of the United Arab Emirates, the Securities and Commodities Authority or the Dubai Financial Services Authority.
Notice to Prospective Investors in Australia
This prospectus:
| • | does not constitute a disclosure document under Chapter 6D.2 of the Corporations Act 2001 (Cth), or the Corporations Act; |
| • | has not been, and will not be, lodged with the Australian Securities and Investments Commission, or ASIC, as a disclosure document for the purposes of the Corporations Act and does not purport to include the information required of a disclosure document under Chapter 6D.2 of the Corporations Act; and |
| • | may only be provided in Australia to select investors who are able to demonstrate that they fall within one or more of the categories of investors, or Exempt Investors, available under section 708 of the Corporations Act. |
The shares may not be directly or indirectly offered for subscription or purchased or sold, and no invitations to subscribe for or buy the shares may be issued, and no draft or definitive offering memorandum, advertisement or other offering material relating to any shares may be distributed in Australia, except where disclosure to investors is not required under Chapter 6D of the Corporations Act or is otherwise in compliance with all applicable Australian laws and regulations. By submitting an application for the shares, you represent and warrant to us that you are an Exempt Investor.
144
As any offer of shares under this document will be made without disclosure in Australia under Chapter 6D.2 of the Corporations Act, the offer of those securities for resale in Australia within 12 months may, under section 707 of the Corporations Act, require disclosure to investors under Chapter 6D.2 if none of the exemptions in section 708 applies to that resale. By applying for the shares you undertake to us that you will not, for a period of 12 months from the date of issue of the shares, offer, transfer, assign or otherwise alienate those securities to investors in Australia except in circumstances where disclosure to investors is not required under Chapter 6D.2 of the Corporations Act or where a compliant disclosure document is prepared and lodged with ASIC.
Notice to Prospective Investors in Japan
The shares have not been and will not be registered under the Financial Instruments and Exchange Act. Accordingly, the shares may not be offered or sold, directly or indirectly, in Japan or to, or for the benefit of, any resident of Japan (which term as used herein means any person resident in Japan, including any corporation or other entity organized under the laws of Japan), or to others for re-offering or resale, directly or indirectly, in Japan or to or for the benefit of a resident of Japan, except pursuant to an exemption from the registration requirements of, and otherwise in compliance with, the Financial Instruments and Exchange Act and any other applicable laws, regulations and ministerial guidelines of Japan.
Notice to Prospective Investors in Hong Kong
The shares have not been offered or sold and will not be offered or sold in Hong Kong, by means of any document, other than (a) to “professional investors” as defined in the Securities and Futures Ordinance (Cap. 571) of Hong Kong and any rules made under that Ordinance; or (b) in other circumstances which do not result in the document being a “prospectus” as defined in the Companies Ordinance (Cap. 32) of Hong Kong or which do not constitute an offer to the public within the meaning of that Ordinance. No advertisement, invitation or document relating to the shares has been or may be issued or has been or may be in the possession of any person for the purposes of issue, whether in Hong Kong or elsewhere, which is directed at, or the contents of which are likely to be accessed or read by, the public of Hong Kong (except if permitted to do so under the securities laws of Hong Kong) other than with respect to shares which are or are intended to be disposed of only to persons outside Hong Kong or only to “professional investors” as defined in the Securities and Futures Ordinance and any rules made under that Ordinance.
Notice to Prospective Investors in Singapore
This prospectus has not been registered as a prospectus with the Monetary Authority of Singapore. Accordingly, this prospectus and any other document or material in connection with the offer or sale, or invitation for subscription or purchase, of shares may not be circulated or distributed, nor may the shares be offered or sold, or be made the subject of an invitation for subscription or purchase, whether directly or indirectly, to persons in Singapore other than (i) to an institutional investor under Section 274 of the Securities and Futures Act, Chapter 289 of Singapore, or the SFA, (ii) to a relevant person pursuant to Section 275(1), or any person pursuant to Section 275(1A), and in accordance with the conditions specified in Section 275, of the SFA, or (iii) otherwise pursuant to, and in accordance with the conditions of, any other applicable provision of the SFA.
Where the shares are subscribed or purchased under Section 275 of the SFA by a relevant person which is:
| • | a corporation (which is not an accredited investor (as defined in Section 4A of the SFA)) the sole business of which is to hold investments and the entire share capital of which is owned by one or more individuals, each of whom is an accredited investor; or |
| • | a trust (where the trustee is not an accredited investor) whose sole purpose is to hold investments and each beneficiary of the trust is an individual who is an accredited investor, |
securities (as defined in Section 239(1) of the SFA) of that corporation or the beneficiaries’ rights and interest (howsoever described) in that trust shall not be transferred within six months after that
145
corporation or that trust has acquired the shares pursuant to an offer made under Section 275 of the SFA except:
| • | to an institutional investor or to a relevant person defined in Section 275(2) of the SFA, or to any person arising from an offer referred to in Section 275(1A) or Section 276(4)(i)(B) of the SFA; |
| • | where no consideration is or will be given for the transfer; |
| • | where the transfer is by operation of law; |
| • | as specified in Section 276(7) of the SFA; or |
| • | as specified in Regulation 32 of the Securities and Futures (Offers of Investments) (Shares and Debentures) Regulations 2005 of Singapore |
Notice to Prospective Investors in Bermuda
Shares may be offered or sold in Bermuda only in compliance with the provisions of the Investment Business Act of 2003 of Bermuda which regulates the sale of securities in Bermuda. Additionally, non-Bermudian persons (including companies) may not carry on or engage in any trade or business in Bermuda unless such persons are permitted to do so under applicable Bermuda legislation.
Notice to Prospective Investors in Saudi Arabia
This document may not be distributed in the Kingdom of Saudi Arabia except to such persons as are permitted under the Offers of Securities Regulations as issued by the board of the Saudi Arabian Capital Market Authority, or CMA, pursuant to resolution number 2-11-2004 dated 4 October 2004 as amended by resolution number 1-28-2008, as amended, or the CMA Regulations. The CMA does not make any representation as to the accuracy or completeness of this document and expressly disclaims any liability whatsoever for any loss arising from, or incurred in reliance upon, any part of this document. Prospective purchasers of the securities offered hereby should conduct their own due diligence on the accuracy of the information relating to the securities. If you do not understand the contents of this document, you should consult an authorized financial adviser.
Notice to Prospective Investors in the British Virgin Islands
The shares are not being, and may not be offered to the public or to any person in the British Virgin Islands for purchase or subscription by or on behalf of the Patheon. The shares may be offered to companies incorporated under the BVI Business Companies Act, 2004 (British Virgin Islands), or BVI Companies, but only where the offer will be made to, and received by, the relevant BVI Company entirely outside of the British Virgin Islands.
Notice to Prospective Investors in China
This prospectus does not constitute a public offer of the shares, whether by sale or subscription, in the People’s Republic of China, or the PRC. The shares is not being offered or sold directly or indirectly in the PRC to or for the benefit of, legal or natural persons of the PRC.
Further, no legal or natural persons of the PRC may directly or indirectly purchase any of the shares or any beneficial interest therein without obtaining all prior PRC’s governmental approvals that are required, whether statutorily or otherwise. Persons who come into possession of this document are required by the issuer and its representatives to observe these restrictions.
Notice to Prospective Investors in Korea
The shares have not been and will not be registered under the Financial Investments Services and Capital Markets Act of Korea and the decrees and regulations thereunder, or the FSCMA, and the shares have been and will be offered in Korea as a private placement under the FSCMA. None of the shares may be offered, sold or delivered directly or indirectly, or offered or sold to any person for re-offering or resale, directly or indirectly, in Korea or to any resident of Korea except pursuant to the applicable laws and regulations of Korea, including the FSCMA and the Foreign Exchange
146
Transaction Law of Korea and the decrees and regulations thereunder, or the FETL. The shares have not been listed on any of securities exchanges in the world including, without limitation, the Korea Exchange in Korea. Furthermore, the purchaser of the shares shall comply with all applicable regulatory requirements (including but not limited to requirements under the FETL) in connection with the purchase of the shares. By the purchase of the shares, the relevant holder thereof will be deemed to represent and warrant that if it is in Korea or is a resident of Korea, it purchased the shares pursuant to the applicable laws and regulations of Korea.
Notice to Prospective Investors in Malaysia
No prospectus or other offering material or document in connection with the offer and sale of the shares has been or will be registered with the Securities Commission of Malaysia, or Commission for the Commission’s approval pursuant to the Capital Markets and Services Act 2007. Accordingly, this prospectus and any other document or material in connection with the offer or sale, or invitation for subscription or purchase, of the shares may not be circulated or distributed, nor may the shares be offered or sold, or be made the subject of an invitation for subscription or purchase, whether directly or indirectly, to persons in Malaysia other than (i) a closed end fund approved by the Commission; (ii) a holder of a Capital Markets Services Licence; (iii) a person who acquires the shares, as principal, if the offer is on terms that the shares may only be acquired at a consideration of not less than RM250,000 (or its equivalent in foreign currencies) for each transaction; (iv) an individual whose total net personal assets or total net joint assets with his or her spouse exceeds RM3 million (or its equivalent in foreign currencies), excluding the value of the primary residence of the individual; (v) an individual who has a gross annual income exceeding RM300,000 (or its equivalent in foreign currencies) per annum in the preceding twelve months; (vi) an individual who, jointly with his or her spouse, has a gross annual income of RM400,000 (or its equivalent in foreign currencies), per annum in the preceding twelve months; (vii) a corporation with total net assets exceeding RM10 million (or its equivalent in a foreign currencies) based on the last audited accounts; (viii) a partnership with total net assets exceeding RM10 million (or its equivalent in foreign currencies); (ix) a bank licensee or insurance licensee as defined in the Labuan Financial Services and Securities Act 2010; (x) an Islamic bank licensee or takaful licensee as defined in the Labuan Financial Services and Securities Act 2010; and (xi) any other person as may be specified by the Commission; provided that, in the each of the preceding categories (i) to (xi), the distribution of the shares is made by a holder of a Capital Markets Services Licence who carries on the business of dealing in securities. The distribution in Malaysia of this prospectus is subject to Malaysian laws. This prospectus does not constitute and may not be used for the purpose of public offering or an issue, offer for subscription or purchase, invitation to subscribe for or purchase any securities requiring the registration of a prospectus with the Commission under the Capital Markets and Services Act 2007.
Notice to Prospective Investors in Taiwan
The shares have not been and will not be registered with the Financial Supervisory Commission of Taiwan pursuant to relevant securities laws and regulations and may not be sold, issued or offered within Taiwan through a public offering or in circumstances which constitutes an offer within the meaning of the Securities and Exchange Act of Taiwan that requires a registration or approval of the Financial Supervisory Commission of Taiwan. No person or entity in Taiwan has been authorized to offer, sell, give advice regarding or otherwise intermediate the offering and sale of the shares in Taiwan.
147
Notice to Prospective Investors in South Africa
Due to restrictions under the securities laws of South Africa, the shares are not offered, and the Offer shall not be transferred, sold, renounced or delivered, in South Africa or to a person with an address in South Africa, unless one or other of the following exemptions applies:
| • | the offer, transfer, sale, renunciation or delivery is to duly registered banks, mutual banks, financial services provider, financial institution, the Public Investment Corporation (in each case registered as such in South Africa), a person who deals with securities in their ordinary course of business, or a wholly owned subsidiary of a bank, mutual bank, authorized services provider or financial institution, acting as agent in the capacity of an authorized portfolio manager for a pension fund (duly registered in South Africa), or as manager for a collective investment scheme(registered in South Africa); or |
| • | the contemplated acquisition cost of the securities, for any single addressee acting as principal is equal to or greater than R1,000,000. |
This document does not, nor is it intended to, constitute an “offer to the public” (as that term is defined in the South African Companies Act, 2008, or the SA Companies Act) and does not, nor is it intended to, constitute a prospectus prepared and registered under the SA Companies Act. This document is not an “offer to the public” and must not be acted on or relied on by persons who do not fall within Section 96(1)(a) of the SA Companies Act (such persons being referred to as “relevant persons”). Any investment or investment activity to which this document relates is available only to relevant persons and will be engaged in only with relevant persons.
148
Certain legal matters in connection with this offering relating to United States law will be passed upon for us by Skadden, Arps, Slate, Meagher & Flom LLP, New York, New York. The validity of the common stock being offered by this prospectus and other legal matters concerning this offering relating to Dutch law will be passed upon for us by De Brauw Blackstone Westbroek N.V., The Netherlands. Certain legal matters in connection with this offering will be passed upon for the underwriters by Davis Polk & Wardwell LLP, New York, New York.
The consolidated financial statements of Patheon Holdings Coöperatief U.A. at October 31, 2014 and 2013, and for each of the three years in the period ended October 31, 2014, appearing in this Prospectus and Registration Statement have been audited by Ernst & Young LLP, independent registered public accounting firm, as set forth in their report thereon appearing elsewhere herein, and are included in reliance upon such report given on the authority of such firm as experts in accounting and auditing.
The consolidated financial statements of Gallus BioPharmaceuticals, LLC at December 31, 2013 and for the year then ended, included herein have been audited by Ernst & Young LLP, independent auditors, as set forth in their report thereon, included therein. Such consolidated financial statements are included herein in reliance upon such report given on the authority of such firm as experts in accounting and auditing.
The combined financial statements of DSM Pharmaceutical Products Group at 31 December 2013 and 2012 and for each of the three years in the period ended 31 December 2013, appearing in this Prospectus and Registration Statement have been audited by Ernst & Young Accountants LLP, independent auditors, as set forth in their report thereon, appearing elsewhere herein, and are included in reliance upon such report given on the authority of such firm as experts in accounting and auditing.
Where you can find more information
We filed a registration statement on Form S-1 with the Securities and Exchange Commission with respect to the registration of the common stock offered for sale by means of this prospectus. This prospectus does not contain all of the information set forth in the registration statement and the exhibits to the registration statement. For further information about us, the common stock we are offering by means of this prospectus and related matters, you should review the registration statement, including the documents filed as exhibits to the registration statement. Statements contained in this prospectus about the contents of any contract or any other document that is filed as an exhibit to the registration statement are not necessarily complete, and we refer you to the full text of the contract or other document filed as an exhibit to the registration statement. A copy of the registration statement and the exhibits to the registration statement may be inspected without charge at the public reference facilities maintained by the Securities and Exchange Commission at 100 F. Street, N.E., Washington, D.C. 20549, and copies of all or any part of the registration statement may be obtained from the Securities and Exchange Commission upon payment of the prescribed fee. Information on the operation of the public reference facilities may be obtained by calling the Securities and Exchange Commission at 1-800-SEC-0330. The Securities and Exchange Commission maintains a website that contains reports, proxy and information statements, and other information regarding registrants that file electronically with the Securities and Exchange Commission. The address of the site is http://www.sec.gov.
As a result of this offering, we will become subject to the information and periodic reporting requirements of the Securities Exchange Act of 1934, as amended, and, in accordance with such requirements, will file periodic reports, proxy statements, and other information with the Securities and Exchange Commission. These periodic reports, proxy statements, and other information will be available for inspection and copying at the regional offices, public reference facilities, and web site
149
of the Securities and Exchange Commission referred to above. We intend to furnish our shareholders with annual reports containing consolidated financial statements audited by our independent registered accounting firm.
150
Patheon Holdings Coöperatief U.A.
F-1
Gallus BioPharmaceuticals, LLC
DSM Pharmaceutical Products Group
F-2
Patheon Holdings Coöperatief U.A.
CONSOLIDATED BALANCE SHEETS
(unaudited)
As of January 31, 2015 |
As of October 31, 2014 |
|||||
| (in millions of U.S. dollars) | $ | $ | ||||
| Assets |
||||||
| Current |
||||||
| Cash and cash equivalents | 67.0 | 84.6 | ||||
| Accounts receivable, net | 339.1 | 334.9 | ||||
| Inventories | 413.9 | 442.9 | ||||
| Income taxes receivable | 1.3 | 4.4 | ||||
| Prepaid expenses and other | 19.6 | 20.2 | ||||
| Deferred tax assets - short-term | 21.1 | 21.6 | ||||
| Total current assets | 862.0 | 908.6 | ||||
| Capital assets | 867.3 | 923.0 | ||||
| Intangible assets | 248.6 | 257.0 | ||||
| Deferred financing costs | 64.4 | 67.2 | ||||
| Deferred tax assets | 3.1 | 3.4 | ||||
| Goodwill | 166.8 | 170.8 | ||||
| Investments | 14.3 | 15.4 | ||||
| Other long-term assets | 19.8 | 23.9 | ||||
| Total assets | 2,246.3 | 2,369.3 | ||||
| Liabilities and members’ deficit |
||||||
| Current |
||||||
| Short-term borrowings | 2.4 | 2.6 | ||||
| Accounts payable and accrued liabilities | 408.4 | 454.4 | ||||
| Income taxes payable | 4.5 | 2.7 | ||||
| Deferred revenues - short-term | 103.8 | 96.5 | ||||
| Deferred tax liabilities - short-term | 1.1 | 1.2 | ||||
| Current portion of long-term debt | 23.3 | 22.8 | ||||
| Total current liabilities | 543.5 | 580.2 | ||||
| Long-term debt | 1,928.9 | 1,975.3 | ||||
| Deferred revenues | 53.2 | 46.1 | ||||
| Deferred tax liabilities | 50.9 | 52.8 | ||||
| Other long-term liabilities | 98.1 | 107.3 | ||||
| Total liabilities | 2,674.6 | 2,761.7 | ||||
| Commitments and contingencies |
||||||
| Members’ deficit: |
||||||
| Membership interests | 542.6 | 538.5 | ||||
| Accumulated deficit | (898.2 | ) |
(892.1 | ) |
||
| Accumulated other comprehensive loss | (72.7 | ) |
(38.8 | ) |
||
| Total members’ deficit | (428.3 | ) |
(392.4 | ) |
||
| Total liabilities and members’ deficit | 2,246.3 | 2,369.3 | ||||
See accompanying notes
F-3
Patheon Holdings Coöperatief U.A.
CONSOLIDATED STATEMENTS OF OPERATIONS
(unaudited)
Three months ended January 31, |
||||||
2015 |
2014 |
|||||
| (in millions of U.S. dollars) | $ | $ | ||||
| Revenues | 488.8 | 262.2 | ||||
| Cost of goods sold | 352.4 | 197.5 | ||||
| Gross profit | 136.4 | 64.7 | ||||
| Selling, general and administrative expenses | 77.2 | 46.3 | ||||
| Research and development | 3.9 | 2.8 | ||||
| Repositioning expenses | 17.8 | 0.7 | ||||
| Acquisition and integration costs | 6.1 | 4.9 | ||||
| Gain on sale of capital assets | (0.1 | ) |
(0.4 | ) |
||
| Operating income | 31.5 | 10.4 | ||||
| Interest expense, net | 28.0 | 12.9 | ||||
| Foreign exchange loss, net | 3.9 | 1.2 | ||||
| Other income, net | (0.1 | ) |
(1.4 | ) |
||
| Loss before income taxes | (0.3 | ) |
(2.3 | ) |
||
| Provision for income taxes | 5.8 | 1.3 | ||||
| Net loss | (6.1 | ) |
(3.6 | ) |
||
See accompanying notes
F-4
Patheon Holdings Coöperatief U.A.
CONSOLIDATED STATEMENTS OF COMPREHENSIVE LOSS
(unaudited)
Three months ended January 31, |
||||||
2015 |
2014 |
|||||
| (in millions of U.S. dollars) | $ | $ | ||||
| Net loss | (6.1 | ) |
(3.6 | ) |
||
| Other comprehensive (loss) income, net of income taxes: |
||||||
| Change in foreign currency losses on investments in subsidiaries, net of hedging activities | (25.4 | ) |
(11.0 | ) |
||
| Change in value of derivatives designated as foreign currency cash flow hedges | (11.5 | ) |
(8.6 | ) |
||
| Gains from foreign currency cash flow hedges reclassified to consolidated statements of operations1 | 2.6 | 1.0 | ||||
| Net change in minimum pension liability2 | 0.4 | 0.8 | ||||
| Comprehensive loss | (40.0 | ) |
(21.4 | ) |
||
1 No income tax expense (benefit) is included as these amounts are from the Company’s Canadian operations which are under full valuation allowance. Amounts, gross of tax, have been reclassified to foreign exchange loss, net on the consolidated statements of operations.
2 Net of an income tax expense of $0.0 million and $0.2 million for the three months ended January 31, 2015 and 2014, respectively, which is included as a component of provision for income taxes on the consolidated statement of operations. Amounts, gross of tax, have been reclassified to cost of goods sold and selling, general and administrative expenses on the consolidated statements of operations. See Note 8 for further information.
See accompanying notes
F-5
Patheon Holdings Coöperatief U.A.
CONSOLIDATED STATEMENT OF CHANGES IN MEMBERS’
DEFICIT
(unaudited)
| (in millions of U.S. dollars) | Membership Interest |
Accumulated deficit |
Accumulated Other Comprehensive Income |
Total Members’ deficit |
||||||||
| Balance at October 31, 2014 | $ | 538.5 | $ | (892.1 | ) |
$ | (38.8 | ) |
$ | (392.4 | ) |
|
| Management equity incentive plan stock-based compensation | 4.1 | — | — | 4.1 | ||||||||
| Comprehensive income (loss): |
||||||||||||
| Net loss | — | (6.1 | ) |
— | (6.1 | ) |
||||||
| Change in foreign currency losses on investments in subsidiaries, net of hedging activities | — | — | (25.4 | ) |
(25.4 | ) |
||||||
| Change in value of derivatives designated as foreign currency cash flow hedges | — | — | (11.5 | ) |
(11.5 | ) |
||||||
| Gains from foreign currency hedges reclassified to consolidated statement of operations | — | — | 2.6 | 2.6 | ||||||||
| Net change in minimum pension liability | — | — | 0.4 | 0.4 | ||||||||
| Subtotal | 4.1 | (6.1 | ) |
(33.9 | ) |
(35.9 | ) |
|||||
| Balance at January 31, 2015 | $ | 542.6 | $ | (898.2 | ) |
$ | (72.7 | ) |
$ | (428.3 | ) |
|
See accompanying notes
F-6
Patheon Holdings Coöperatief U.A.
CONSOLIDATED STATEMENTS OF CASH FLOWS
(unaudited)
Three months ended January 31, |
||||||
2015 |
2014 |
|||||
| (in millions of U.S. dollars) | $ | $ | ||||
| Operating activities |
||||||
| Net loss | (6.1 | ) |
(3.6 | ) |
||
| Add (deduct) charges to operations not requiring a current cash payment: |
||||||
| Depreciation and amortization | 29.7 | 12.5 | ||||
| Non-cash interest | 3.0 | 1.6 | ||||
| Change in other long-term assets and liabilities | 1.1 | (5.5 | ) |
|||
| Deferred income taxes | 0.6 | — | ||||
| Amortization of deferred revenues | (41.6 | ) |
(5.1 | ) |
||
| Gain on sale of capital assets | (0.1 | ) |
(0.4 | ) |
||
| Share-based compensation expense | 4.1 | 0.8 | ||||
| Other | (0.4 | ) |
(1.5 | ) |
||
(9.7 | ) |
(1.2 | ) |
|||
| Net change in non-cash working capital balances | (32.5 | ) |
(4.1 | ) |
||
| Increase in deferred revenues | 62.8 | 6.5 | ||||
| Cash provided by operating activities | 20.6 | 1.2 | ||||
| Investing activities |
||||||
| Additions to capital assets | (33.1 | ) |
(21.2 | ) |
||
| Proceeds from sale of capital assets | 0.2 | 4.4 | ||||
| Cash used in investing activities | (32.9 | ) |
(16.8 | ) |
||
| Financing activities |
||||||
| Increase in short-term borrowings | — | 13.0 | ||||
| Proceeds from long-term borrowings | 5.3 | — | ||||
| Repayment of long-term debt | (10.6 | ) |
(12.2 | ) |
||
| Cash (used in) provided by financing activities | (5.3 | ) |
0.8 | |||
| Effect of exchange rate changes on cash and cash equivalents | — | (1.0 | ) |
|||
| Net decrease in cash and cash equivalents during the period | (17.6 | ) |
(15.8 | ) |
||
| Cash and cash equivalents, beginning of period | 84.6 | 61.6 | ||||
| Cash and cash equivalents, end of period | 67.0 | 45.8 | ||||
See accompanying notes
F-7
Notes to Unaudited Consolidated Financial Statements
for the Three Months Ended January 31, 2015
(Dollar information in tabular form is expressed in millions of U.S. dollars)
1. BASIS OF PRESENTATION AND SUMMARY OF SIGNIFICANT ACCOUNTING POLICIES
Basis of presentation
Patheon Holdings Coöperatief U.A. (the “Company” or “Patheon Holdings”) is a wholly owned company of JLL/Delta Patheon Holdings, L.P. (the “Partnership”) which is owned 51% by JLL Patheon Co-Investment Fund L.P. (“JLL”) and 49% by Koninklijke DSM N.V. (“DSM”). The Company was formed on March 11, 2014 as a result of Patheon Inc. entering into an arrangement agreement (the “Arrangement Agreement”) with DSM and JLL. Pursuant to the Arrangement Agreement, Patheon Holdings acquired all of the outstanding equity securities of Patheon Inc. In addition, DSM contributed its existing pharmaceutical products business (“DPP”) to the Company (the “DPP Acquisition”). From an accounting standpoint, Patheon Inc. was the acquirer and as such all financial information prior to March 11, 2014 is related to Patheon Inc.
The accompanying unaudited consolidated financial statements have been prepared by the Company in accordance with accounting principles generally accepted in the United States (“U.S. GAAP”). Operating results for the three months ended January 31, 2015 are not necessarily indicative of the results that may be expected for the fiscal year ending October 31, 2015 (“fiscal 2015”). These consolidated financial statements do not include all the information and footnotes required by U.S. GAAP for annual financial statements and therefore should be read in conjunction with the audited consolidated financial statements and notes for the fiscal year ended October 31, 2014 (“fiscal 2014”).
The consolidated financial statements include the accounts of the Company and its wholly-owned subsidiaries. All intercompany transactions have been eliminated.
The preparation of the consolidated financial statements in conformity with U.S. GAAP requires management to make estimates and assumptions that affect: the reported amounts of assets and liabilities; the disclosure of contingent assets and liabilities at the date of the consolidated financial statements; and the reported amounts of revenue and expenses in the reporting period. Management believes that the estimates and assumptions used in preparing its consolidated financial statements are reasonable and prudent; however, actual results could differ from those estimates.
Changes in significant accounting policies
There have been no significant changes in accounting policies compared to the disclosure in the Patheon Holdings 2014 consolidated financial statements.
Segment Information
U.S. GAAP requires segmentation based on an entity’s internal organization and reporting of revenue and operating income (loss) based upon internal accounting methods commonly referred to as the “management approach”. Operating segments are defined as components of an enterprise about which separate financial information is available that is evaluated regularly by the chief operating decision maker (“CODM”), or decision making group, in deciding how to allocate resources and in assessing performance. The Company’s CODM is its Chief Executive Officer.
The Company’s seven operating segments are: North America Drug Product Services, or North America DPS, Europe Drug Product Services, or Europe DPS, Pharmaceutical Development Services, or PDS, Drug Substance Services, or DSS, DPx Fine Chemical, or DFC, Banner Life Sciences, or BLS, and Biosolutions. The North America DPS, and Europe DPS operating segments met the aggregation criteria to present as one reportable segment referred to as DPS. As a result, the Company has determined it has four reportable segments: DPS, PDS, DSS and DFC. BLS, Biosolutions, and Corporate are not individually reportable segments since the quantitative thresholds have not been met and as such have been reported in Other.
F-8
Recently adopted accounting pronouncements
In December 2011, the FASB issued ASU 2011-11, “Disclosures about Offsetting Assets and Liabilities,” which requires enhanced disclosures about financial instruments and derivative instruments that are either (i) offset in accordance with either Section 210-20-45 or 815-10-45 or (ii) subject to an enforceable master netting arrangement or similar agreement, irrespective of whether they are offset in accordance with either Section 210-20-45 or Section 815-10-45. The amendments are effective for annual reporting periods beginning on or after January 1, 2013 and interim periods within those annual periods. The amendments are required to be applied retrospectively for all prior periods presented. The adoption of this guidance did not have a material impact on the Company’s consolidated financial statements.
In November 2014, FASB issued ASU 2014-17, Business Combinations (Topic 805): Pushdown Accounting (a consensus of the FASB Emerging Issues Task Force). ASU 2014-17 provides an acquired entity with an option to apply pushdown accounting in its separate financial statements upon occurrence of an event in which an acquirer obtains control of the acquired entity. ASU No. 2014-17 is effective on November 18, 2014. After the effective date an acquired entity can make an election to apply the guidance to future change-in-control events or to its most recent change-in-control event. The adoption of this guidance did not have a material impact on the Company’s consolidated financial statements.
In July 2013, the FASB issued ASU 2013-11, “Income Taxes, Presentation of an Unrecognized Tax Benefit When a Net Operating Loss Carryforward, a Similar Tax Loss, or a Tax Credit Carryforward Exists” (“ASU 2013-11”). ASU 2013-11 states that an unrecognized tax benefit, or a portion of an unrecognized tax benefit, should be presented in the financial statements as a reduction to a deferred tax asset for a net operating loss carryforward, a similar tax loss, or a tax credit carryforward, except as follows. To the extent a net operating loss carryforward, a similar tax loss, or a tax credit carryforward is not available at the reporting date under the tax law of the applicable jurisdiction to settle any additional income taxes that would result from the disallowance of a tax position or the tax law of the applicable jurisdiction does not require the entity to use, and the entity does not intend to use, the deferred tax asset for such purpose, the unrecognized tax benefit should be presented in the financial statements as a liability and should not be combined with deferred tax assets. The amendments in ASU 2013-11 are effective for fiscal years, and interim periods within those years, beginning after December 15, 2013, with early adoption permitted. The amendments should be applied prospectively to all unrecognized tax benefits that exist at the effective date. Retrospective application is permitted. The adoption of this guidance did not have a material impact on the Company’s consolidated financial statements.
In March 2013, the FASB issued ASU 2013-05, “Parent’s Accounting for the Cumulative Translation Adjustment upon Derecognition of Certain Subsidiaries or Groups of Assets within a Foreign Entity or of an Investment in a Foreign Entity” (“ASU 2013-05”). ASU 2013-05 resolves the diversity in practice concerning the release of the cumulative translation adjustment into net income when a parent either sells a part or all of its investment in a foreign entity or no longer holds a controlling financial interest in a subsidiary or group of assets within a foreign entity. The guidance is effective for fiscal years and interim reporting periods within those fiscal years beginning after December 15, 2013. The amendments described in the ASU are to be applied prospectively to derecognition events occurring after the effective date; prior periods are not to be adjusted. The adoption of this guidance is dependent upon future transactions.
In February 2013, the FASB issued ASU 2013-04, “Obligations Resulting from Joint and Several Liability Arrangements for Which the Total Amount of the Obligation Is Fixed at the Reporting Date” (“ASU 2013-04”). ASU 2013-04 provides guidance for the recognition, measurement and disclosure resulting from joint and several liability arrangements. Examples of obligations that fall within the scope of the ASU include certain debt arrangements, other contractual obligations and settled litigation. The new guidance is effective on a retrospective basis for fiscal years and interim periods within those fiscal years beginning after December 15, 2013. The adoption of this guidance is not expected to have a material impact on the Company’s financial statements.
F-9
Recently issued accounting pronouncements
In August 2014, FASB issued ASU No. 2014-15, Presentation of Financial Statements—Going Concern (Subtopic 205-40): Disclosure of Uncertainties about an Entity’s Ability to Continue as a Going Concern. ASU 2014-15 is intended to define management’s responsibility to evaluate whether there is substantial doubt about an organization’s ability to continue as a going concern and to provide related footnote disclosures. The guidance centers on disclosure requirements when management deems it probable that conditions or events, considered in aggregate, raise substantial doubt about the entity’s ability to continue as a going concern within one year after the date that the financial statements are issued. ASU No. 2014-15 is effective for annual periods after December 15, 2016, but early adoption is permitted. The adoption of this guidance is not expected to have a material impact on the Company’s financial statements.
In June 2014, the FASB issued ASU 2014-12 “Compensation—Stock Compensation”. The amendments in this update create Topic 718, “Compensation—Stock Compensation”. The amendments in this ASU apply to all reporting entities that grant their employees share-based payments in which the terms of the award provide that a performance target that affects vesting could be achieved after the requisite service period. The amendments require that a performance target that affects vesting and that could be achieved after the requisite service period be treated as a performance condition. This ASU is effective for annual periods and interim periods within those annual periods, beginning after December 15, 2015. Early adoption is permitted. The amendments should be applied prospectively to all share-based payment awards that are granted or modified on or after the effective date, or retrospectively to all awards with performance targets that are outstanding as of the beginning of the earliest annual period presented in the financial statements, and to all new or modified awards thereafter. The adoption of this guidance is not expected to have a material impact on the Company’s financial statements.
On May 28, 2014, FASB and IASB issued a converged standard on revenue recognition from contracts with customers, ASU 2014-09 (Topic 606) and IFRS 15. The core principle of the new standard is for companies to recognize revenue to depict the transfer of goods or services to customers in amounts that reflect the consideration (that is, payment) to which the company expects to be entitled in exchange for those goods or services. The new standard also will result in enhanced disclosures about revenue, provide guidance for transactions that were not previously addressed comprehensively (for example, service revenue and contract modifications) and improve guidance for multiple-element arrangements. The new authoritative guidance will become effective in the first quarter of fiscal 2019. There are two methods for adopting the standard amendment. The first method is to retrospectively adjust each reporting period presented. The second method is to retrospectively adjust with the cumulative effect recognized at the date of initial application along with additional disclosures in reporting periods that include the date of initial application. The Company is evaluating the impact of this new pronouncement along with the method of adoption.
In April, 2014, the FASB issued Accounting Standards Update No. 2014-08, Presentation of Financial Statements (Topic 205) and Property, Plant, and Equipment (Topic 360). The ASU states that disposal of a component of an entity or a group of components of an entity is required to be reported in discontinued operations if the disposal represents a strategic shift that has (or will have) a major effect on an entity’s operations and financial results when the component of an entity or group of components of an entity meets the criteria to be classified as held for sale, is disposed of by sale, or disposed of other than by sale. The Company should apply the amendments in this Update prospectively to both of the following: (1) All disposals (or classifications as held for sale) of components of an entity that occur within annual periods beginning on or after December 15, 2014, and interim periods within annual periods beginning on or after December 15, 2015; (2) All businesses or nonprofit activities that, on acquisition, are classified as held for sale that occur within annual periods beginning on or after December 15, 2014, and interim periods within annual periods beginning on or after December 15, 2015. The impact of adopting this guidance is dependent upon future transactions.
F-10
2. BUSINESS COMBINATIONS
Gallus BioPharmaceuticals Acquisition
Background
On September 29, 2014, the Company acquired Gallus (the “Gallus Acquisition”), a leading contract manufacturing company specializing in biologics (included in the DSS segment) for a cash purchase price of $257.2 million. The business will aim to support the needs of customers with biologics projects by providing flexibility, leading technology solutions, commercial operations and an expanded footprint.
Purchase price allocation
The Gallus Acquisition has been accounted for using the acquisition method of accounting in accordance with ASC Subtopic 805-10, “Business Combinations,” and the fair value concepts set forth in ASC Subtopic 820-10. Under ASC 805-10, the total purchase price for Gallus was allocated to the assets acquired and liabilities assumed based on their respective fair values as of the acquisition date. The allocation of the purchase price is based on estimates and assumptions that are subject to change within the measurement period. The excess of the purchase price over the fair values of the assets acquired and liabilities assumed was recorded as goodwill. Goodwill largely consists of geographic expansion of product sales, manufacturing and other synergies of the combined companies, and the value of the assembled workforce.
The preliminary purchase price allocation for the Gallus Acquisition is as follows:
| $ | |||
| Cash and cash equivalents | 0.9 | ||
| Accounts receivable | 17.5 | ||
| Inventories | 8.1 | ||
| Prepaid expenses and other | 2.0 | ||
| Capital assets | 72.5 | ||
| Intangible assets | 111.7 | ||
| Goodwill | 85.6 | ||
| Other long-term assets | 0.1 | ||
| Accounts payable and accrued liabilities | (13.2 | ) |
|
| Deferred tax liabilities - short-term | (0.1 | ) |
|
| Deferred revenues - short-term | (21.4 | ) |
|
| Current portion of long-term debt | (2.0 | ) |
|
| Long-term debt | (1.9 | ) |
|
| Deferred revenues - long-term | (1.8 | ) |
|
| Other long-term liabilities | (0.8 | ) |
|
| Total purchase price | 257.2 | ||
The Company expects a portion of the goodwill to be tax deductible.
Note that the fair values of the net assets acquired are based upon management’s preliminary estimate of the respective fair values. The estimated fair values of net assets and resulting goodwill are subject to the Company finalizing its analysis on certain tax attributes, and contingent liabilities.
F-11
Valuations of intangible assets acquired
The weighted-average life of the acquired intangible assets is approximately 14.8 years. The following table sets forth the components of the acquired intangible assets by type:
| Estimated Fair Value |
Estimated Useful Life (in years) |
|||||
| $ | ||||||
| Developed technology and know-how | 2.3 | 15 | ||||
| Customer relationships | 107.2 | 15 | ||||
| Non-compete agreements | 2.2 | 3 | ||||
| Total | 111.7 | |||||
DPP Acquisition
Background
On March 11, 2014, JLL contributed $500.0 million in cash for a 51.0 percent interest in Patheon Holdings and DSM contributed DPP in exchange for a 49.0 percent interest in Patheon Holdings, a cash payment of $114.4 million, a preferred interest in JLL/Delta Patheon Holdings L.P. of $49.9 million (net of pension obligation purchase price adjustment of $25.1 million), and a potential earn-out on the Biologics business (included in the DSS segment). DSM also received reimbursement for its transaction related expenses. Transaction related expenses incurred by Patheon Holdings were expensed as incurred and have been included within acquisition and integration costs in the consolidated statement of operations. Refer to the following table for a breakout of the consideration:
| $ | |||
| DSM contribution of DPP for a 49% interest in Patheon Holdings | 480.4 | ||
| Preferred interest in JLL/Delta Patheon Holdings L.P. | 49.9 | ||
| DSM cash payment | 114.4 | ||
| Patheon Holdings reimbursement to DSM | 17.4 | ||
| Earnout to DSM related to Biologics business | 3.5 | ||
| Total purchase price | 665.6 | ||
Purchase price allocation
The DPP Acquisition has been accounted for using the acquisition method of accounting in accordance with ASC Subtopic 805-10, “Business Combinations,” and the fair value concepts set forth in ASC Subtopic 820-10, “Fair Value Measurements and Disclosures”. Under ASC 805-10, pursuant to which the total purchase price for DPP was allocated to the assets acquired and liabilities assumed based on their respective fair values as of the acquisition date. The allocation of the purchase price is based on estimates and assumptions that are subject to change within the measurement period. The excess of the purchase price over the fair values of the assets acquired and liabilities assumed was recorded as goodwill. Goodwill largely consists of geographic expansion of product sales, manufacturing and other synergies of the combined companies, and the value of the assembled workforce.
F-12
The preliminary purchase price allocation for the DPP Acquisition is as follows:
| $ | |||
| Cash and cash equivalents | 10.2 | ||
| Accounts receivable | 137.5 | ||
| Inventories | 311.3 | ||
| Income taxes receivable | 1.5 | ||
| Prepaid expenses and other | 1.7 | ||
| Deferred tax assets - short term | 2.7 | ||
| Capital assets | 397.7 | ||
| Intangible assets | 101.6 | ||
| Goodwill | 36.5 | ||
| Deferred tax assets - long-term | 1.1 | ||
| Investments | 9.1 | ||
| Other long-term assets | 10.3 | ||
| Accounts payable and accrued liabilities | (199.0 | ) |
|
| Income tax payable | (0.9 | ) |
|
| Deferred revenues - short-term | (34.2 | ) |
|
| Current portion of long-term debt | (2.8 | ) |
|
| Long-term debt | (9.2 | ) |
|
| Deferred revenues - long-term | (28.4 | ) |
|
| Other long-term liabilities | (67.3 | ) |
|
| Deferred tax liabilities - long-term | (13.8 | ) |
|
| Total purchase price | 665.6 | ||
The Company does not expect any of the goodwill to be tax deductible.
The fair values of the net assets acquired are based upon management’s preliminary estimate of the respective fair values. The estimated fair values of net assets and resulting goodwill are subject to the Company finalizing its analysis on certain tax attributes, and contingent liabilities.
Valuations of intangible assets acquired
The weighted-average life of the acquired intangible assets is approximately 12.3 years. The following table sets forth the components of the acquired intangible assets by type:
| Estimated Fair Value |
Estimated Useful Life (in years) |
|||
| $ | ||||
| Favorable Agreements | 1.5 | 0.5 - 9 | ||
| Trade names | 0.7 | 8 - 9 | ||
| Developed technology and know-how | 23.5 | 7 - 14 | ||
| Customer relationships | 66.8 | 13 - 14 | ||
| In-process research and development(1) | 8.8 | Indefinite | ||
| Regulatory permits | 0.3 | Indefinite | ||
| Total | 101.6 | |||
(1) In process research and development is currently classified as indefinite-lived intangible assets and will either begin to be amortized upon product approval and commercialization or written-off if not approved.
Pro forma financial information - DPP
The following table presents pro forma results of operations and gives effect to the DPP Acquisition as if the transaction had been consummated on November 1, 2013. The pro forma financial information for the Gallus Acquisition, including the additional interest on debt, has been excluded from these results as the results of operations of Gallus were not material to the results of operations for the periods presented. This unaudited pro forma financial information is provided
F-13
for informational purposes only and is not necessarily indicative of what the actual results of operations would have been had the transactions taken place on November 1, 2013, nor is it indicative of the future consolidated results of operations of the combined companies.
| Unaudited | Three months ended January 31, |
||
| 2014 | |||
| $ | |||
| Revenues | 458.0 | ||
| Net loss | (189.4 | ) |
|
The unaudited pro forma financial information was prepared using the acquisition method of accounting and is based on the historical financial information of the Company and DPP, reflecting the Company’s and DPP’s combined results of operations for the three month period ended January 31, 2014. The historical financial information has been adjusted to give effect to the pro forma events that are (i) directly attributable to the DPP Acquisition, (ii) factually supportable and (iii) expected to have a continuing impact on the combined results of the Company and DPP. The unaudited pro forma consolidated results reflect primarily the following pro forma adjustments:
| • | additional interest expense and amortization of deferred financing costs related to the long-term debt used to fund the acquisition; refinancing expense not capitalized as a part of deferred financing costs and/or original issue discount have been removed. |
| • | additional amortization expense related to the fair-value of identifiable intangible assets acquired; |
| • | additional cost of goods sold resulting from increases/decreases in depreciation expense relating to the fair values of acquired property and equipment; and |
| • | removal of acquisition-related costs. |
3. PLANT CONSOLIDATIONS, SALES AND ASSET IMPAIRMENTS
Since the completion of the DPP Acquisition in the second quarter of fiscal 2014, the Biosolutions business has experienced a reduction in customer contracts and the Company expects reduction in revenues going forward for this business and is considering new strategic options including selling the business. As a result the Company recorded an impairment charge of $12.4 million in fiscal 2014, consisting of the write-off of goodwill and intangible assets of the Biosolutions business of $2.2 million with the remainder of the impairment related to capital assets.
On July 2, 2014, the Company announced plans to close its facility in Venlo, The Netherlands. The Company ceased operations at the facility in February 2015 and transferred remaining production to other Patheon Holdings facilities. Because the business in the Venlo facility is being transferred within the existing site network, its results of operations will be included in continuing operations in the consolidated financial statements. The Company expects to incur approximately $26.2 million in severance for approximately 105 employees and approximately $12.1 million in other shut down related costs, most of which were recorded in fiscal 2014 and will be paid over the course of fiscal 2015.
The Company completed the consolidation of its Caguas, Puerto Rico operations into its Manati, Puerto Rico operations during the first quarter of fiscal 2014 and vacated the Caguas facility as of January 31, 2014. Total project repositioning expenses were $14.9 million, of which $0.5 million was recorded within repositioning expenses in the accompanying consolidated statement of operations for the three months ended January 31, 2014. Because the business in the Caguas facility transferred within the existing site network, its results of operations are included in continuing operations in the consolidated financial statements.
F-14
Subsequent to the closing of the Banner acquisition in December 2012, the Company performed a review of Banner’s facilities and decided to close the Olds, Alberta, Canada facility. The Company sold the Olds, Alberta, Canada facility on November 1, 2013 for approximately $3.8 million.
4. SUPPLEMENTAL BALANCE SHEET INFORMATION
Inventories
Inventories consisted of the following:
| January 31, 2015 | October 31, 2014 | |||||
| $ | $ | |||||
| Raw materials, packaging components and spare parts | 153.6 | 155.9 | ||||
| Work-in-process | 66.5 | 71.2 | ||||
| Finished goods | 193.8 | 215.8 | ||||
| Balance, end of period | 413.9 | 442.9 | ||||
Accounts payable and accrued liabilities
The following is the breakdown of accounts payable and accrued liabilities:
| January 31, 2015 | October 31, 2014 | |||||
| $ | $ | |||||
| Trade payables | 216.8 | 252.7 | ||||
| Interest payable | 25.3 | 17.6 | ||||
| Accrued salaries and related expenses | 76.8 | 95.1 | ||||
| Customer deposits | 12.2 | 12.6 | ||||
| Repositioning | 50.5 | 48.4 | ||||
| Other accruals | 26.8 | 28.0 | ||||
| Balance, end of period | 408.4 | 454.4 | ||||
Intangible assets
As part of the Banner, DPP, and Gallus acquisitions, the Company acquired certain intangible assets. The following table summarizes gross carrying amounts, accumulated amortization, and accumulated impairments related to the Company’s identifiable intangible assets as of January 31, 2015:
| Definite-lived intangible assets | Gross carrying value |
Accumulated amortization |
Accumulated impairment |
Net carrying value |
Weighted Average Useful Life (in Years) |
||||||||||
| $ | $ | $ | $ | ||||||||||||
| Favorable agreements | 1.5 | (1.0 | ) |
(0.5 | ) |
— | 0.0 | ||||||||
| Trade names | 1.5 | (0.4 | ) |
— | 1.1 | 6.9 | |||||||||
| Developed technology | 72.2 | (11.2 | ) |
(0.3 | ) |
60.7 | 10.9 | ||||||||
| Customer relationships | 185.1 | (9.3 | ) |
— | 175.8 | 14.2 | |||||||||
| In-process research and development | 5.0 | (0.5 | ) |
— | 4.5 | 9.5 | |||||||||
| Non-compete agreements | 2.2 | (0.2 | ) |
— | 2.0 | 3.0 | |||||||||
| Foreign exchange | (5.0 | ) |
|||||||||||||
| Balance, end of period | 267.5 | (22.6 | ) |
(0.8 | ) |
239.1 | |||||||||
F-15
| Indefinite-lived intangible assets | Gross carrying value |
Accumulated impairment |
Net carrying value |
||||||
| $ | $ | $ | |||||||
| In-process research and development | 20.6 | (11.0 | ) |
9.6 | |||||
| Regulatory permits | 0.3 | (0.1 | ) |
0.2 | |||||
| Foreign exchange | (0.3 | ) |
|||||||
| Balance, end of period | 20.9 | (11.1 | ) |
9.5 | |||||
In-process research and development (“IPR&D”) is classified as definite-lived or indefinite-lived depending on whether the product has been approved and if commercialization has begun. IPR&D for products that have been approved is classified as a definite-lived intangible asset and is amortized over the life of the asset. IPR&D for products that have not been approved is classified as an indefinite-lived intangible asset and either begins to be amortized upon approval and product commercialization or is written-off if the product is not approved.
During the fourth quarter of fiscal 2014, as a result of the annual impairment testing of indefinite-lived intangible assets, the Company incurred impairment losses of $9.7 million, stemming from changes in market factors and expected product commercialization timing. In addition, in the fourth quarter of fiscal 2014 certain assets within the Company’s Biosolutions business was impaired (See Note 3) and as a result $0.9 million of intangible assets related to favorable agreements, developed technology and regulatory permits were written off. During fiscal 2013, the Company incurred an impairment charge of $1.3 million for certain Banner IPR&D projects.
Goodwill
The following table summarizes the changes in goodwill during fiscal 2013, fiscal 2014 and for the three month period ending January 31, 2015:
| Total | |||
| $ | |||
| Goodwill(1) | 3.5 | ||
| Accumulated impairment loss-prior periods(1) | — | ||
| Impairment loss–current period | (0.1 | ) |
|
| Additions through acquisitions(2) | 45.1 | ||
| Balance October 31, 2013 | 48.5 | ||
| Impairment loss –current period | (1.3 | ) |
|
| Additions through acquisitions(3) | 124.8 | ||
| Foreign Currency Translation Adjustments | (1.2 | ) |
|
| Balance October 31, 2014 | 170.8 | ||
| Measurement period adjustments | (2.7 | ) |
|
| Foreign Currency Translation Adjustments | (1.3 | ) |
|
| Balance January 31, 2015 | 166.8 | ||
(1) the opening goodwill balance as of November 1, 2012 is reflective of historical impairment charges of the full value of goodwill related to the Puerto Rico operations of $172.5 million which was recorded in fiscal 2006.
(2) represents goodwill recorded in connection with the Banner Acquisition.
(3) represents goodwill recorded in connection with the DPP and Gallus Acquisitions.
F-16
5. MEMBERS’ (DEFICIT)/SHAREHOLDERS’ EQUITY
Membership interests
On the closing of the DPP Acquisition on March 11, 2014, the Patheon business and the DPP Business were combined into DPx, a wholly owned subsidiary of Patheon Holdings. Following completion of the transaction, Patheon Inc.’s restricted voting shares were delisted from the Toronto Stock Exchange, ceased to be registered with the United States Securities and Exchange Commission and were cancelled. Under the DPP Acquisition, each restricted voting share outstanding immediately prior to the DPP Acquisition, including any restricted voting shares issued upon the exercise of any options, held by shareholders other than JLL were transferred to the Company in exchange for $9.32 per share. A summary of the share repurchase is as follows:
| $ | |||
| Purchase of Patheon equity - JLL portion | 731.9 | ||
| Purchase of Patheon equity - non-JLL portion | 581.6 | ||
| Purchase or settlement of Patheon employee options | 75.7 | ||
| Total paid to shareholders | 1,389.2 | ||
| JLL portion of purchase of Patheon equity invested in Patheon Holdings | (500.0 | ) |
|
| Total paid to Patheon shareholders, net of amounts reinvested by JLL | 889.2 | ||
The Company is a Cooperatief and has issued 1,000 membership interests . Each membership interest carries one vote. The membership interests are held indirectly by the Partnership. The Partnership is owned 51.0% by JLL and 49.0% by DSM. The Partnership holds 954 voting membership interests in the Company while DSM NewCo B.V. holds 45 voting interests and JLL/Delta Patheon G.P. holds one voting membership interest. A summary of the Patheon Holdings equity sources is as follows:
| $ | |||
| JLL contribution for a 51% interest in Patheon Holdings | 500.0 | ||
| DSM contribution of DPP business for a 49% interest in Patheon Holdings | 480.4 | ||
| Preferred interest in the Partnership to DSM | 49.9 | ||
| Earnout to DSM related to Biologics business | 3.5 | ||
| Total membership interest in Patheon Holdings | 1,033.8 | ||
| JLL portion of purchase of Patheon equity invested in Patheon Holdings | (500.0 | ) |
|
| Net membership interests in Patheon Holdings | 533.8 | ||
6. SEGMENT INFORMATION
An operating segment is a component of the Company (a) that engages in business activities from which it may earn revenues and incur expenses, (b) whose operating results are regularly reviewed by the Company’s chief operating decision maker (our Chief Executive Officer) to make decisions about resources to be allocated to the segment and to assess its performance, and (c) for which discrete financial information is available.
The Company’s seven operating segments are: North America DPS, Europe DPS, PDS, DSS, DFC, BLS and Biosolutions. The North America DPS, and Europe DPS operating segments met the aggregation criteria to be presented as one DPS reportable segment. As a result, the Company has determined it has four reportable segments: DPS, PDS, DSS and DFC. The DPS, PDS and DSS operating segments comprise the Patheon business unit, the DFC operating segment comprises the DPx Fine Chemicals business unit. BLS, Biosolutions, and Corporate are not individually reportable segments since the quantitative thresholds have not been met and, as such, have been reported in Other.
The DPS segment includes commercial manufacturing outsourcing services, and the PDS segment includes pharmaceutical development services. The DSS segment includes active pharmaceutical ingredients and pharmaceutical intermediates. DFC includes agricultural and crop protection
F-17
chemicals, other fine chemicals, and the production of maleic anhydride and derivatives. The BLS business includes activities in connection with the research and development, in-licensing, out-licensing and commercialization of innovative formulation technologies, as well as the marketing of prescription, over the counter and nutritional proprietary products. Biosolutions produces products manufactured using microbial fermentation, including many types of anti-infectives, enzymes and pharmaceutical and non-pharmaceutical proteins. Corporate expenses primarily relate to general, administrative and sales and marketing expenses related to the corporate organization. These expenses are recorded in unallocated corporate expenses as these items are centrally directed and controlled and are not included in internal measures of segment operating performance. The CODM does not evaluate its operating segments using discrete asset information.
As of and for the three months ended January 31, 2015 |
|||||||||||||||||||||
DPS |
PDS |
DSS |
DFC |
Other |
Intersegment Eliminations |
Total |
|||||||||||||||
| $ | $ | $ | $ | $ | $ | $ | |||||||||||||||
| Revenues | 304.3 | 44.5 | 76.9 | 50.5 | 42.8 | (30.2 | ) |
488.8 | |||||||||||||
| Adjusted EBITDA | 71.7 | 14.0 | 10.7 | 9.8 | (18.7 | ) |
— | 87.5 | |||||||||||||
| Depreciation and amortization | 15.8 | 1.0 | 6.5 | 2.3 | 4.1 | — | 29.7 | ||||||||||||||
| Capital expenditures | 24.9 | 1.7 | 3.0 | 2.5 | 1.0 | — | 33.1 | ||||||||||||||
As of and for the three months ended January 31, 2014 |
|||||||||||||||||||||
DPS |
PDS |
DSS |
DFC |
Other |
Intersegment Eliminations |
Total |
|||||||||||||||
| $ | $ | $ | $ | $ | $ | $ | |||||||||||||||
| Revenues | 213.8 | 39.1 | — | — | 32.5 | (23.2 | ) |
262.2 | |||||||||||||
| Adjusted EBITDA | 29.9 | 11.4 | — | — | (9.0 | ) |
— | 32.3 | |||||||||||||
| Depreciation and amortization | 11.2 | 1.0 | — | — | 0.3 | — | 12.5 | ||||||||||||||
| Capital expenditures | 20.2 | 0.9 | — | — | 0.1 | — | 21.2 | ||||||||||||||
The Company accounts for inter-segment sales between DPS and BLS at cost plus a specified mark-up.
The Company evaluates the performance of its segments based on segment Adjusted EBITDA. The Company’s Adjusted EBITDA is income (loss) from continuing operations before repositioning expenses, interest expense, foreign exchange losses reclassified from other comprehensive income (loss), refinancing expenses, acquisition and integration costs (including certain product returns and inventory write-offs recorded in gross profit), gains and losses on sale of capital assets, income taxes, impairment charges, depreciation and amortization, stock-based compensation expense, consulting costs related to our operational initiatives, purchase accounting adjustments, acquisition-related litigation expenses and other income and expenses. “Adjusted EBITDA margin” is Adjusted EBITDA as a percentage of revenues. The Company’s presentation of Adjusted EBITDA may not be comparable to similarly-titled measures used by other companies and is not equivalent to “Consolidated EBITDA” as defined in the Credit Agreement (as discussed in Note 12).
F-18
Below is a reconciliation of Adjusted EBITDA to its closest U.S. GAAP measure.
Three months ended January 31, |
||||||
| 2015 | 2014 | |||||
| $ | $ | |||||
| Total Adjusted EBITDA | 87.5 | 32.3 | ||||
| Depreciation and amortization | (29.7 | ) |
(12.5 | ) |
||
| Repositioning expenses | (17.8 | ) |
(0.7 | ) |
||
| Acquisition and integration costs | (6.1 | ) |
(4.9 | ) |
||
| Interest expense, net | (28.0 | ) |
(12.9 | ) |
||
| Gain on sale of capital assets | 0.1 | 0.4 | ||||
| Provision for income taxes | (5.8 | ) |
(1.3 | ) |
||
| Operational initiatives related consulting costs | (1.5 | ) |
(1.4 | ) |
||
| Acquisition-related litigation expenses | (1.0 | ) |
(3.1 | ) |
||
| Stock-based compensation expense | (4.1 | ) |
(0.8 | ) |
||
| Other | 0.3 | 1.3 | ||||
| Net loss | (6.1 | ) |
(3.6 | ) |
||
As illustrated in the table below, revenues are attributed to countries based on the location of the customer’s billing address, capital assets are attributed to the country in which they are located and goodwill is attributed to the country in which the entity to which the goodwill pertains is located:
As of and for the three months ended January 31, 2015 |
|||||||||||||||
| Canada | US* | Europe | Other** | Total | |||||||||||
| $ | $ | $ | $ | $ | |||||||||||
| Revenues | 7.6 | 271.1 | 182.2 | 27.9 | 488.8 | ||||||||||
| Capital Assets | 96.6 | 391.2 | 354.2 | 25.3 | 867.3 | ||||||||||
| Goodwill | 2.7 | 153.2 | 6.0 | 4.9 | 166.8 | ||||||||||
* Includes Puerto Rico
** Includes Mexico, Other Latin America, Asia, and Australia
As of and for the three months ended January 31, 2014 |
|||||||||||||||
| Canada | US* | Europe | Other** | Total | |||||||||||
| $ | $ | $ | $ | $ | |||||||||||
| Revenues | 3.8 | 153.7 | 84.2 | 20.5 | 262.2 | ||||||||||
| Capital Assets | 105.1 | 179.7 | 193.4 | 7.6 | 485.8 | ||||||||||
| Goodwill | 3.1 | 35.1 | 7.0 | 3.0 | 48.2 | ||||||||||
* Includes Puerto Rico
** Includes Mexico
7. LONG-TERM INCENTIVE PLANS AND STOCK-BASED COMPENSATION
Management long-term incentive plan
On March 11, 2014, the Company adopted the Management Long-Term Incentive Plan (the “LTIP”) to provide long-term incentives to select key management employees of Patheon Holdings and its subsidiaries who have contributed and are expected to contribute materially to the success of the Company, and to reward outstanding performance by such employees. Leadership, key positions or identified key talent may be invited to participate in the LTIP during an identified plan year. Compensation is payable under this plan upon an Exit Event by the controlling investors of the Company (JLL and DSM) as defined below, if the participant is still employed by the Company, or a qualifying termination, as defined.
F-19
An Exit Event is defined as the earlier of: (a) a change of control, and (b) in connection with or following an Initial Public Offering (“IPO”), the sale or disposition by JLL or any of its affiliates of equity securities such that, immediately following such sale or disposition, either (i) JLL and its affiliates own less than 20.0% of the outstanding equity securities of the Partnership or the Partnership offeror, calculated on a fully-diluted basis, or (ii) JLL and its affiliates have received, in the aggregate, distributions in respect of such sale or disposition (together with any sale or disposition occuring prior thereto) equal to or in excess of 250.0% of the initial capital contributions and any additional capital contributions made by JLL and its affiliates for all equity securities of the Partnership or the Partnership offeror held by JLL and its affiliates prior to such sale or disposition.
Not later than 90 days following commencement of each applicable Company fiscal year that would end during the term of the LTIP, the Compensation Committee will determine, in its sole and absolute discretion, with respect to such fiscal year, (i) the Participants (as defined in the LTIP) with respect to that fiscal year, (ii) the EBITDA Target (as defined in the LTIP), and (iii) the targeted amount of each Award. Each award shall be evidenced by a written notice and shall be deemed granted on the first day of the fiscal year with respect to which the Compensation Committee resolves to grant such award (the “Grant Date”). Awards are denominated as a percentage of the Participant’s base salary, with the target percentage based on the Participant’s level within the organization, as determined by the Compensation Committee in its sole and absolute discretion. All awards will be paid in the form of cash, or other property having a value equal to such cash payment, as determined by the Compensation Committee in its sole and absolute discretion.
Under the LTIP the Company has granted $6.3 million in awards as of January 31, 2015, all of which vest over a five-year period. The Company did not report any compensation expense for the LTIP during the three months ended January 31, 2015 as this plan becomes payable only as a result of an event which is deemed to not be probable until the occurrence of the event.
Stock-based compensation
Management Equity Incentive Plan
The Partnership adopted the Plan with an effective date of March 11, 2014. The purpose of the Plan is to provide eligible participants with an opportunity to receive grants of profits interests of the Partnership designated as management units. The award of management units pursuant to this Plan is intended to compensate employees of the Partnership and its subsidiaries. The participants in the Plan, as a group, are eligible to participate in the gain on the investment earned by JLL and DSM on their Patheon Holdings investment once certain specified distribution thresholds have been achieved.
The aggregate number, class and tranche of management units (the “Units”) that may be issued or transferred under this Plan is determined from time to time by the Board of Directors (the “Partnership Board”) of JLL/Delta Patheon G.P. Ltd., the general partner of the Partnership, subject to the conditions and limitations set forth in the Partnership’s partnership agreement. The Partnership may grant awards to eligible participants, upon such terms and conditions as the Partnership Board shall determine, and as set forth by the Board in an award agreement.
A summary of the Plan activity for the three months ended January 31, 2015 is as follows:
| Class B | Class C | Class D | Class E | Totals | Weighted average fair value |
|||||||||||||
| Outstanding as of October 31, 2014 | 51,800 | 7,400 | 7,400 | 7,400 | 74,000 | $ | 676.87 | |||||||||||
| Granted | 11,200 | 1,600 | 1,600 | 1,600 | 16,000 | $ | 966.51 | |||||||||||
| Outstanding as of January 31, 2015 | 63,000 | 9,000 | 9,000 | 9,000 | 90,000 | $ | 728.36 | |||||||||||
71.4286% of the Class B units only have a service-based component for vesting. Accordingly, the Company recorded $4.1 million of compensation expense for the three months end January 31, 2015 related to the service-based portion of the Class B units, which is being amortized over the four year vesting period using the accelerated attribution method. The remaining Units vest upon
F-20
the achievement of a specified return on investment received by JLL and DSM or an Exit Event. As such, no expense has been recognized for the other Units as of January 31, 2015 as the achievement of the distribution thresholds and exit event is deemed to not be probable until the occurrence of the event since the Company currently does not intend to pay dividends or make any distributions to its members.
As of January 31, 2015, the total unrecognized compensation cost related to the non-vested Class B units with a service condition of $24.9 million, which is expected to be recognized through fiscal 2019, (weighted-average remaining vesting period of 2.26 years). The total unrecognized fair value of the Class B (service/performance/market-based conditions), C, D, and E units is $31.9 million.
Incentive stock option plan
Prior to the DPP Acquisition, the Patheon Inc. had an incentive stock option plan in which directors, officers and key employees of the Company and its subsidiaries, as well as other persons engaged to provide ongoing management or consulting services to Patheon, were eligible to participate. As of March 10, 2014 and October 31, 2013, the total number of restricted voting shares issuable under the plan was 15,500,151 shares, of which there were stock options outstanding to purchase 10,996,225 shares and 11,017,225 shares, respectively, under the plan.
For the purposes of calculating the stock-based compensation expense in connection with the Company’s incentive stock option plan, the fair value of stock options was estimated at the date of the grant using the Black-Scholes option pricing model and the cost was amortized over the vesting period.
Stock-based compensation expense recorded in the three months ended January 31, 2014 was $0.8 million.
The DPP Acquisition constituted a change in control as defined in the stock option plan since DSM indirectly owns more than 30% of the voting shares of Patheon. The stock option plan included a provision to make outstanding stock options immediately exercisable upon a change in control and as such the employees met the requisite service period since they were not required to provide additional service towards vesting of their awards. As a result all outstanding stock options were fully vested upon the DPP Acquisition. Cash was paid to employees by the Company to repurchase the options in the second quarter of fiscal 2014 which is included in the total cash consideration paid to Patheon shareholders.
In addition, on March 11, 2014, certain executives of Patheon entered into option waiver and termination agreements (the “Termination Agreements”). Under the Termination Agreements, certain option awards to these executives would terminate prior to but dependent on the closing of the DPP Acquisition (the Terminated Options). As consideration for agreeing to terminate their option awards and not be paid cash for these options upon the change in control, the executives each were given management units in JLL Patheon Co-Investment Fund L.P. which had a fair value equal to the terminated options.
As of January 31, 2015, there was no unrecognized compensation cost remaining as there were no awards outstanding at that date. As a result of the Company’s going private transaction on March 11, 2014, the stock option program was cancelled and there have been no new additional optioned shares granted.
F-21
8. PENSION AND POST-RETIREMENT BENEFITS
Employee future benefits
The components of net periodic benefit cost for the defined benefit plans and other benefit plans for the three months ended January 31, 2015 and 2014 were as follows:
Three months ended January 31, |
||||||||||||
2015 |
2014 |
|||||||||||
| Defined benefit pension plans |
Other benefit plans |
Defined benefit pension plans |
Other benefit plans |
|||||||||
| $ | $ | $ | $ | |||||||||
| Service cost | 0.8 | — | 0.5 | — | ||||||||
| Interest cost | 1.6 | 0.1 | 1.4 | 0.1 | ||||||||
| Expected return on plan assets | (1.5 | ) |
— | (1.6 | ) |
— | ||||||
| Curtailment gain | — | — | (0.9 | ) |
— | |||||||
| Settlement loss | — | — | 1.2 | — | ||||||||
| Amortization of actuarial loss | 0.4 | — | 0.2 | — | ||||||||
| Net periodic benefit costs | 1.3 | 0.1 | 0.8 | 0.1 | ||||||||
Based on current information available from actuarial estimates, the Company anticipates that contributions required under its defined benefit pension plans and other benefit plans for fiscal 2015 will be approximately $5.4 million compared to contributions of $7.0 million that were made in fiscal 2014. The decrease in the expected fiscal 2015 contributions compared to fiscal 2014 are as a result of the settlement of the Netherlands defined benefit plan in fiscal 2014 and a reduction in expected fiscal 2015 contributions to the UK defined benefit plan partially offset by the impact of holding defined benefit pension plans in Austria, Germany and Italy as a result of the DPP Acquisition for a full year in fiscal 2015. Required contributions to defined benefit pension plans in future years may vary and will be dependent upon a number of variables, including the long-term rate of return on plan assets.
The defined benefit and other benefit plans estimates above do not include the unfunded termination indemnities related to the employees of the Company’s Italian and Mexican subsidiaries.
In accordance with Italian severance pay statutes, an employee benefit is accrued for service to date and is payable when the employee’s employment with the Company ceases. The termination indemnity liability is calculated in accordance with local civil and labor laws based on each employee’s length of service, employment category and remuneration. The Italian termination liability is adjusted annually by a cost-of-living index provided by the Italian government. Although there is no vesting period, the Italian government has established private accounts for these benefits and has required the Company to contribute $3.9 million and $3.9 million in fiscal 2015 and 2014 respectively to these accounts, with additional contributions in the future. The liability recorded in the consolidated balance sheets is the amount to which the employees would be entitled if their employment with the Company ceased. The related expenses for the three months ended January 31, 2015 and 2014 was $1.1 million and $0.8 million, respectively.
The defined benefit and other benefit plans estimates above also do not include the unfunded termination indemnities related to the employees of the Company’s Mexican subsidiary, which the Company acquired as part of the Banner Acquisition. According to the Mexican labor law, a termination indemnity is payable when a company terminates an employment relationship without justified cause (as defined in the labor law) and is equal to three months of salary and benefits, plus 20 days of salary and benefits per each credited service year. The termination indemnity liability is unfunded; therefore the liability is recognized through a reserve calculated by the actuaries. The related expenses for the three months ended January 31, 2015 and 2014 were less than $0.1 million.
The employee future benefit expense in connection with defined benefit pension plans, other post-retirement benefit plans and the unfunded termination indemnities for the three months ended January 31, 2015 and 2014 was $2.5 million and $1.7 million, respectively.
F-22
The Company terminated its Netherlands Pension Plan as of December 31, 2013 and replaced it with a defined contribution plan. All current and future employees in the Netherlands are eligible to participate in the defined contribution plan. The accrued benefits under the terminated pension plan were settled with non-participating annuity contracts. These events were accounted for as a curtailment and a settlement. The curtailment impact reduced the projected benefit obligation by $1.7 million in the first quarter of 2014. This resulting curtailment gain was applied first against the accumulated unrecognized net actuarial losses in other comprehensive (loss) income of $0.8 million and the remaining $0.9 million was taken to the consolidated statement of operations. The settlement resulted in a loss of $1.2 million that was recorded in the consolidated statement of operations in the first quarter of 2014.
9. REPOSITIONING EXPENSE
During the three months ended January 31, 2015, the Company incurred $17.8 million in repositioning expenses, which related to DPP synergies, the termination of certain transition service agreements (“TSA’s”) with DSM and other operational initiatives. During the three months ended January 31, 2014, the Company incurred $0.7 million in repositioning expenses, which related to Banner synergy initiatives and the shutdown of the Caguas facility.
As part of the DPP acquisition, the Company had TSA’s with DSM, whereby DSM performed certain shared services functions on behalf of the company. During the three months ended January 31, 2015, the Company notified DSM that it would not extend a majority of the service agreements covered by the TSA beyond December 31, 2014. This triggered a €11.4 million liability for termination costs and an additional €2.1 million liability associated with certain R&D contracts and other costs associated with the service agreement transition. A total of €13.5 million ($16.3 million), was recognized during the three months ended January 31, 2015. This liability is expected to be settled in cash during fiscal 2015.
On July 2, 2014, the Company announced plans to close its facility in Venlo, The Netherlands. The Company ceased operations in February 2015 and transferred remaining production to other Patheon Holdings facilities. Because the business in the Venlo facility is being transferred within the existing site network, its results of operations will be included in continuing operations in the consolidated financial statements. The Company expects to incur approximately $26.2 million in severance for approximately 105 employees and approximately $12.1 million in other shut down related costs, much of which will be paid out over the course of the next year.
On May 9, 2012, the Company announced the Plan of Termination to reduce the Company’s workforce across the Company’s global operations. The Company anticipates that it may further adjust the size of the workforce at the Swindon or other facilities as it continues its transformation process.
F-23
The following is a summary of these expenses and other charges associated with operational improvements (collectively “repositioning expenses”) as of and for the three months ended January 31, 2015 and 2014:
As of and for the three months ended January 31, 2015 |
||||||||||||||||||
| DPS | PDS | DSS | DFC | Other | Total | |||||||||||||
| $ | $ | $ | $ | $ | $ | |||||||||||||
| Total repositioning liabilities at October 31, 2014 | 48.5 | |||||||||||||||||
| Employee-related expenses | 1.2 | — | 0.3 | — | (0.4 | ) |
1.1 | |||||||||||
| Consulting, professional and project management costs | 5.4 | — | 4.7 | 3.7 | 2.9 | 16.7 | ||||||||||||
| Total expenses | 6.6 | — | 5.0 | 3.7 | 2.5 | 17.8 | ||||||||||||
| Repositioning expenses paid | (10.5 | ) |
||||||||||||||||
| Foreign exchange | (5.2 | ) |
||||||||||||||||
| Total repositioning liabilities at January 31, 2015 | 50.6 | |||||||||||||||||
$50.5 million of the total repositioning liabilities as of January 31, 2015 was recorded in accounts payable and accrued liabilities while $0.1 million was recorded in other long-term liabilities on the consolidated balance sheet.
As of and for the three months ended January 31, 2014 |
||||||||||||||||||
| DPS | PDS | DSS | DFC | Other | Total | |||||||||||||
| $ | $ | $ | $ | $ | $ | |||||||||||||
| Total repositioning liabilities at October 31, 2013 | 7.7 | |||||||||||||||||
| Consulting, professional and project management costs | 0.6 | — | — | — | 0.1 | 0.7 | ||||||||||||
| Total expenses | 0.6 | — | — | — | 0.1 | 0.7 | ||||||||||||
| Repositioning expenses paid, net of reimbursements | (4.8 | ) |
||||||||||||||||
| Total repositioning liabilities at January 31, 2014 | 3.6 | |||||||||||||||||
Total repositioning liabilities as of January 31, 2014 was recorded in accounts payable and accrued liabilities.
10. OTHER INFORMATION
Foreign exchange
During the three months ended January 31, 2015, the Company recorded foreign exchange losses of $3.9 million. These losses were from both hedge and operating exposures. During the three months ended January 31, 2014, the Company recorded foreign exchange losses of $1.2 million. These losses were primarily from hedging activities, partially offset by operating exposures.
Contingencies
On December 10, 2012, Procaps S.A. (“Procaps”) filed a complaint against the Company in the United States District Court for the Southern District of Florida (Case No. 12-cv-24356-DLG). The complaint involves the Company’s collaboration agreement with Procaps, pursuant to which both companies agreed to work together with respect to the marketing of a line of certain prescription pharmaceutical soft-gel development and manufacturing services. Procaps alleges that the Company’s acquisition of Banner, a business that historically has generated less than 10% of its revenues from softgel services for prescription pharmaceuticals, transformed the collaboration agreement into an anticompetitive restraint of trade and an agreement between direct competitors
F-24
to set prices, divide markets and/or allocate geographic territories. Procaps seeks (i) a declaratory judgment that the collaboration agreement must cease and/or terminate; (ii) an injunction requiring that Patheon divest all of Banner’s soft-gel manufacturing capabilities; and (iii) monetary damages under federal and state antitrust and unfair competition laws, including treble damages for violations of the Sherman Act. Patheon subsequently answered Procaps’ complaint and filed its affirmative defenses to the complaint. In July 2014, upon Motion for Summary Judgment by Patheon, the court dismissed Procaps’ unfair competition claims, leaving only the antitrust claims in dispute. The parties are currently conducting this discovery. In March 2015, the court ordered trial to commence on November 16, 2015.
The Company has not included any accrual in the consolidated financial statements as of January 31, 2015 related to this matter as a result of its assessment that the likelihood of a material loss in connection with the matter is not probable. Due to the early stage of the lawsuit, an estimate of the potential damages or range of damages cannot be made at this time. However, an adverse outcome in this matter could have a material adverse effect on the Company’s business, results of operations and financial condition.
One putative class action is pending in the United States against the Company and one of its customers in connection with the recall of certain lots of allegedly defective products manufactured by the Company for the customer. The customer has given the Company notice of its intent to seek indemnification from the Company for all damages, costs and expenses, pursuant to the manufacturing services agreement between the customer and the Company. As this case is at an early stage, the Company is unable to estimate the number of potential damages for which the Company may be directly or indirectly liable.
11. FINANCIAL INSTRUMENTS, FAIR VALUE AND RISK MANAGEMENT
The Company has determined the estimated fair values of its financial instruments based on appropriate valuation methodologies; however, considerable judgment is required to develop these estimates. The fair values of the Company’s financial instruments are not materially different from their carrying values.
Fair value measurements
The Company classifies and discloses its fair value measurements using a fair value hierarchy that reflects the significance of the inputs used in making the measurements. The fair value hierarchy has the following levels: (a) quoted prices (unadjusted) in active markets for identical assets or liabilities (Level 1); (b) inputs other than quoted prices included in Level 1 that are observable for the asset or liability, either directly (i.e., as prices) or indirectly (i.e., derived from prices) (Level 2); and (c) inputs for the asset or liability that are not based on observable market data (unobservable inputs) (Level 3).
The fair value is principally applied to financial assets and liabilities such as derivative instruments consisting of foreign exchange forward contracts, available-for-sale securities related to Republic of Austria bonds, and held-for-trading securities related to the Company’s US deferred compensation plan which is invested in mutual funds and common/collectives trusts measured at net asset value. The following table provides a summary of the financial assets and liabilities that are measured at fair value as of January 31, 2015 and October 31, 2014:
Fair value measurement at January 31, 2015 using: |
Fair value measurement at October 31, 2014 using: |
|||||||||||||||||||||||
| Assets measured at fair value | Level 1 | Level 2 | Level 3 | Total | Level 1 | Level 2 | Level 3 | Total | ||||||||||||||||
| $ | $ | $ | $ | $ | $ | $ | $ | |||||||||||||||||
| Contingent consideration receivable | — | — | — | — | — | — | 0.5 | 0.5 | ||||||||||||||||
| Available-for-sale securities | 1.4 | — | — | 1.4 | 1.5 | — | — | 1.5 | ||||||||||||||||
| Held-for-trading securities | — | 1.6 | — | 1.6 | — | 1.9 | — | 1.9 | ||||||||||||||||
| Total assets | 1.4 | 1.6 | — | 3.0 | 1.5 | 1.9 | 0.5 | 3.9 | ||||||||||||||||
F-25
Fair value measurement at January 31, 2015 using: |
Fair value measurement at October 31, 2014 using: |
|||||||||||||||||||||||
| Liabilities measured at fair value | Level 1 | Level 2 | Level 3 | Total | Level 1 | Level 2 | Level 3 | Total | ||||||||||||||||
| $ | $ | $ | $ | $ | $ | $ | $ | |||||||||||||||||
| Derivatives designated as hedging instruments: |
||||||||||||||||||||||||
| Foreign exchange forward contracts | — | 15.8 | — | 15.8 | — | 6.9 | — | 6.9 | ||||||||||||||||
| Total liabilities | — | 15.8 | — | 15.8 | — | 6.9 | — | 6.9 | ||||||||||||||||
Level 1 - Based on quoted market prices in active markets.
Level 2 - Inputs, other than quoted prices in active markets, that are observable, either directly or indirectly.
Level 3 - Unobservable inputs that are not corroborated by market data.
The following table presents the fair value of the Company’s derivative financial instruments and their classifications on the consolidated balance sheets as of January 31, 2015 and October 31, 2014:
Assets as of January 31, 2015 |
Assets as of October 31, 2014 |
|||||||||||
| Fair values of derivatives and investments |
Balance sheet location | Fair value |
Balance sheet location | Fair value |
||||||||
| $ | $ | |||||||||||
| Derivatives and investments: |
||||||||||||
| Contingent consideration receivable | Accounts Receivable, net | — | Accounts Receivable, net | 0.5 | ||||||||
| Available-for-sale securities | Investments | 1.4 | Investments | 1.5 | ||||||||
| Held-for-trading securities | Investments | 1.6 | Investments | 1.9 | ||||||||
| Investments Total | 3.0 | 3.9 | ||||||||||
Liabilities as of January 31, 2015 |
Liabilities as of October 31, 2014 |
|||||||||||
| Balance sheet location | Fair value |
Balance sheet location | Fair value |
|||||||||
| $ | $ | |||||||||||
| Derivatives designated as hedging instruments: |
||||||||||||
| Foreign exchange forward contracts | Accounts payable and accrued liabilities |
13.0 | Accounts payable and accrued liabilities |
5.9 | ||||||||
| Foreign exchange forward contracts | Other long-term liabilities |
2.8 | Other long-term liabilities | 1.0 | ||||||||
| Total designated derivatives | 15.8 | 6.9 | ||||||||||
As of January 31, 2015 and October 31, 2014 derivatives designated as hedging instruments were in a gross loss position.
On August 31, 2012, the Company completed the sale of its global secondary clinical packaging and clinical distribution services business to Bellwyck Packaging Solutions. The total consideration for the sale of this business was approximately $2.7 million, of which $1.35 million was paid in cash at closing and $1.35 million was to be paid in 24 months from the closing date if certain revenue targets were met by the new owner. The Company received the final amount on the earnout target of $0.5 million in November, 2014. The value of the earn-out as of October 31, 2014 was adjusted to be equal to the amount of the final payout.
F-26
As of January 31, 2015, the fair values and carrying values of the Company’s long-term debt, including the current portion of long-term debt, are categorized in the table below:
Fair Value |
Carrying Value |
|||||||||||||||
| Liabilities: | Level 1 | Level 2 | Level 3 | Level 4 | ||||||||||||
| $ | $ | $ | $ | $ | ||||||||||||
| Long-term debt, including current portion | — | 1,943.0 | — | 1,943.0 | 1,952.2 | |||||||||||
As of October 31, 2014, the fair values and carrying values of the Company’s long-term debt, including the current portion of long-term debt, are categorized in the table below:
Fair Value |
Carrying Value |
|||||||||||||||
| Liabilities: | Level 1 | Level 2 | Level 3 | Level 4 | ||||||||||||
| $ | $ | $ | $ | $ | ||||||||||||
| Long-term debt, including current portion | — | 1,994.0 | — | 1,994.0 | 1,998.1 | |||||||||||
The fair value of the Company’s long-term debt, including the current portion of long-term debt, is based on the quoted market prices for the same issues or on the current rates offered for debt of similar remaining maturities.
Foreign exchange forward contracts and other hedging arrangements
The Company utilizes financial instruments to manage the risk associated with fluctuations in foreign exchange and interest rates. The Company formally documents all relationships between hedging instruments and hedged items, as well as its risk management objective and strategy for undertaking various hedge transactions.
As of January 31, 2015, the Company’s Canadian operations had entered into foreign exchange forward contracts to sell an aggregate amount of $122.0 million (USD). These contracts hedge the Canadian operations expected exposure to U.S. dollar denominated receivables and mature at the latest on October 5, 2016, at an average exchange rate of $1.1068 Canadian. The mark-to-market value of these financial instruments as of January 31, 2015 was an unrealized loss of $15.8 million, which has been recorded in accumulated other comprehensive income in members’ deficit, net of associated income tax.
Risks arising from financial instruments and risk management
The Company’s activities expose it to a variety of financial risks: market risk (including foreign exchange and interest rate), credit risk and liquidity risk. The Company’s overall risk management program focuses on the unpredictability of financial markets and seeks to minimize potential adverse effects on the Company’s financial performance. The Company uses derivative financial instruments to hedge certain risk exposures. The Company does not purchase any derivative financial instruments for speculative purposes.
Financial risk management is the responsibility of the Company’s corporate treasury. The corporate treasury works with the Company’s operational personnel to identify, evaluate and, where appropriate, hedge financial risks. The Company’s corporate treasury also monitors material risks and discusses them with the Audit Committee of the Board of Directors.
Foreign exchange risk
As of January 31, 2015, the Company operated in Canada, the United States, Italy, France, the United Kingdom, The Netherlands, Australia, Germany, Austria, Mexico and Japan. Foreign exchange risk arises because the value of the local currency receivable or payable for transactions denominated in foreign currencies may vary due to changes in exchange rates (“transaction exposures”) and because the non-U.S. dollar denominated financial statements of the Company may vary on consolidation into the reporting currency of U.S. dollars (“translation exposures”).
The Company’s most significant transaction exposure is from its Canadian operations. Approximately 90% of the revenues of the Canadian operations and approximately 10% of its
F-27
operating expenses are transacted in U.S. dollars. As a result, the Company may experience transaction exposures because of volatility in the exchange rate between the Canadian and U.S. dollar. Based on the Company’s current U.S. denominated net inflows, as of January 31, 2015, fluctuations of +/-10% would, everything else being equal, have an effect on quarterly (loss) income before income taxes of approximately +/- $3.6 million, prior to hedging activities.
The objective of the Company’s foreign exchange risk management activities is to minimize transaction exposures and the resulting volatility of the Company’s earnings. The Company manages this risk by entering into foreign exchange contracts. As of January 31, 2015, the Company has entered into foreign exchange contracts to cover approximately 84% of its Canadian-U.S. dollar cash flow exposures for fiscal 2015.
As of January 31, 2015, the Company has designated €320.0 million of Euro denominated debt (further discussed in Note 12) as a hedge against its net investment in its subsidiaries in Austria, The Netherlands, Germany, France and Italy. This hedge was designated at the time of the DPP Acquisition and the related refinancing that occurred on March 11, 2014 and is re-designated on a quarterly basis. There were cumulative exchange gains of $72.4 million as of January 31, 2015 arising from this debt, from the date so designated, are recorded in accumulated other comprehensive income (loss) in members’ deficit.
Translation gains and losses related to certain foreign currency denominated intercompany loans are included as part of the net investment in certain foreign subsidiaries, and are included in accumulated other comprehensive income (loss) in members’ deficit.
Credit risk
Credit risk arises from cash and cash equivalents held with banks and financial institutions, derivative financial instruments (foreign exchange contracts with positive fair values), and credit exposure to customers, including outstanding accounts receivable. The maximum exposure to credit risk is equal to the carrying value of the financial assets.
The objective of managing customer credit risk is to prevent losses in financial assets. The Company regularly assesses the credit quality of its customers, taking into account their financial position, past experience and other factors. Management also regularly monitors the utilization of credit limits. In cases where the credit quality of a customer does not meet the Company’s requirements, a cash deposit is received before any services are provided. As of January 31, 2015 and October 31, 2014, the Company held deposits of $12.2 million and $12.6 million, respectively.
Liquidity risk
Liquidity risk arises when financial obligations exceed financial assets available at a particular point in time. The Company’s objective in managing liquidity risk is to maintain sufficient readily available reserves in order to meet its liquidity requirements at all times. The Company mitigates liquidity risk by maintaining cash and cash equivalents on-hand and through the availability of funding from credit facilities. As of January 31, 2015, the Company was holding cash and cash equivalents of $67.0 million and had undrawn lines of credit available to it of $206.6 million.
F-28
12. LONG-TERM OBLIGATIONS AND OTHER SHORT-TERM BORROWINGS
Long-term debt in the accompanying consolidated balance sheets at January 31, 2015 and October 31, 2014 consists of the following:
| As of January 31, 2015 |
As of October 31, 2014 |
|||||
| $ | $ | |||||
| USD Term Loan with a base rate plus 2.25% or LIBOR with a floor of 1% plus 3.25% rate, (currently 4.25%), and maturity date of March 10, 2021 (the “Credit Agreement”) | 1,139.3 | 1,142.1 | ||||
| Euro Term Loan (€320.0 million) with a base rate plus 2.50% or LIBOR with a floor of 1% plus 3.50% rate, (currently 4.50%), and maturity date of March 10, 2021 (the “Credit Agreement”) | 359.3 | 399.7 | ||||
| 7.50% Senior Notes due February 1, 2022 (the “Notes”) | 450.0 | 450.0 | ||||
| Seller financing incurred by Gallus, non-interest bearing with a maturity date of May 13, 2016 | 4.0 | 4.0 | ||||
| Capua Italian government subsidized loans with annual interest rates ranging from 0.50% to 3.10%, and maturities ranging from May 2016 to December 2016. | 2.1 | 2.8 | ||||
| Government of Austria research and development loans with annual interest rates ranging from 1.50% to 3.74% and maturities through March 2019 | 4.9 | 5.9 | ||||
| Austrian capital lease on building with an interest rate of 3.54% and a maturity of September 2015 | 1.1 | 1.4 | ||||
| Italian subsidized loan with annual interest rate of 0.5%, and maturity date of June 30, 2020 | 4.9 | 5.9 | ||||
| Italian bank loan with Euribor 6-month + 7.1% rate, and maturity date of June 30, 2020 | 0.6 | 0.7 | ||||
| Bourgoin equipment capital leases with a LIBOR plus 3.5% rate and maturities through September 2016 | 0.3 | 0.5 | ||||
| Total long-term debt outstanding | 1,966.5 | 2,013.0 | ||||
| Less original issue discount, net of accumulated amortization of $1.7 million, and $1.1 million, respectively | (14.3 | ) |
(14.9 | ) |
||
| Less current portion | (23.3 | ) |
(22.8 | ) |
||
| Balance, end of the period | 1,928.9 | 1,975.3 | ||||
2014 Term Loans and Revolving Line
On March 11, 2014, the Company completed the refinancing of its existing credit facility (the “Refinancing”), pursuant to which it entered into a credit agreement (the “Credit Agreement”) documenting a new credit facility (the “Credit Facility”) for a USD denominated secured term loan in the amount of $985.0 million and a Euro denominated secured term loan in the amount of €250 million, or $345.0 million, (together, with the incremental term loans described below, the “Secured Term Loans”) and a secured multi-currency revolving line in the amount of $200.0 million (the “Secured Revolving Facility”). Up to $75.0 million of the Secured Revolving Facility is available for letters of credit. The Secured Term Loans mature on March 10, 2021, and the Secured Revolving Facility matures on March 10, 2019. The USD denominated Secured Term Loan bears interest at a rate per annum equal to, at the option of the Company, a base rate plus 2.25% or LIBOR with a floor of 1% plus 3.25%. The Euro denominated Secured Term Loan bears interest at a rate per annum equal to, at the option of the Company, a base rate plus 2.50% or LIBOR with a floor of 1% plus 3.50%. Borrowings under the Secured Revolving Facility bear interest for eurodollar loans at LIBOR with a floor of 1% plus 3.25%, Canadian prime rate loans at the Canadian prime rate plus
F-29
2.25%, and base rate loans at the base rate plus 2.25%. The Company will also pay a commitment fee of 0.50% per annum on the unused portion of the Secured Revolving Facility with a step down to 0.375% when the First Lien Leverage Ratio (as defined below) is less than or equal to 3.00 to 1.00.
On September 29, 2014, the Company entered into Amendment No. 1 to the Credit Agreement which added two incremental term loans to the Credit Facility; a USD denominated term loan in the amount of $160.0 million, and a Euro denominated term loan in the amount of €70.0 million, or $88.7 million. The Company used the proceeds for these two incremental term loans to fund a portion of the purchase price for the Gallus Acquisition. The other material terms of the incremental term loans are identical to those of the initial term loans. As of January 31, 2015, there were no outstanding borrowings under the Revolving Line.
Under the Secured Revolving Facility, the Company is required to maintain a First Lien Leverage Ratio below a certain amount for each of the Testing Periods as set forth in the Credit Agreement after such time as the Company has borrowed 25% or $50.0 million under the Secured Revolving Facility. For purposes of the Credit Agreement, a Testing Period means a single period consisting of the most recent four consecutive fiscal quarters ending on the covenant determination date. As of January 31, 2015, the Company was not required to calculate the First Lien Leverage Ratio as there were no borrowings outstanding under the Secured Revolving Facility. The following table discloses the maximum permitted First Lien Leverage Ratios permitted under the Credit Agreement:
| Testing Period Ending | Maximum Ratio |
| April 30, 2014 through October 31, 2014 | 6.75 to 1.00 |
| November 1, 2014 through October 31, 2015 | 6.50 to 1.00 |
| November 1, 2015 through October 31, 2016 | 6.25 to 1.00 |
| November 1, 2016 through October 31, 2017 | 6.00 to 1.00 |
| November 1, 2017 and thereafter | 5.75 to 1.00 |
Because the Company has not to date borrowed 25% or $50 million under the Secured Revolving Facility, the Company was not required to comply with the First Lien Leverage Ratio covenant described above at any time during the three months ended January 31, 2015.
“First Lien Leverage Ratio” is generally defined in the Credit Agreement as the ratio of (i) the sum of the aggregate principal amount of the Company’s and its restricted subsidiaries’ indebtedness for borrowed money, principal amount of capital lease obligations and debt obligations evidenced by bonds, promissory notes, debentures or debt securities that is secured by a first priority lien on the collateral minus unrestricted cash and cash equivalents held by the Company and its restricted subsidiaries in each case set forth in the Credit Agreement to (ii) Consolidated EBITDA. Consolidated EBITDA is generally defined in the Credit Agreement as income (loss) from continuing operations before repositioning expenses, interest expense, foreign exchange losses reclassified from other comprehensive income (loss), refinancing expenses, acquisition-related costs, gains and losses on sale of capital assets, income taxes, asset impairment charges, depreciation and amortization, unit-based compensation expense, consulting costs related to the Company’s operational initiatives, purchase accounting adjustments, other income and expenses, non-cash charges, expenses related to the DPP Acquisition, pro forma cost savings from operational excellence initiatives and plant consolidations, pro forma synergies from the DPP Acquisition, and proceeds from business interruption insurance, among other adjustments. Consolidated EBITDA is not equivalent to Adjusted EBITDA, which, as discussed in Note 15, is the Company’s measure of segment performance.
The Company is required to make the following mandatory prepayments in respect of the Secured Term Loans: (i) 50% of Excess Cash Flow (as defined in the Credit Agreement) when the Company maintains a First Lien Leverage Ratio of greater than 4.00 to 1.00, with step downs to (a) 25% when the Company maintains a First Lien Leverage Ratio of less than or equal to 4.00 to 1.00 but greater than 3.50 to 1.00 and (b) 0% when the Company maintains a First Lien Leverage Ratio of less than or equal to 3.50 to 1.00; (ii) 100% of the net cash proceeds of certain asset sales (including insurance
F-30
and condemnation proceeds), subject to thresholds, reinvestment rights and certain other exceptions; and (iii) 100% of the net cash proceeds of issuances of debt obligations, subject to certain exceptions and thresholds. “Excess Cash Flow” is generally defined as Consolidated EBITDA (as defined in the Credit Agreement) plus, (i) decreases in working capital, (ii) extraordinary or nonrecurring income or gains and (iii) certain other adjustments, minus, (a) increases in working capital, (b) cash interest, (c) cash taxes, (d) cash capital expenditures (e) scheduled debt amortization and (f) certain other adjustments. No Excess Cash Flow payment was required for fiscal 2014. As the Excess Cash Flow calculation is performed annually, no payment is due for the three months ended January 31, 2015. The Company may voluntarily repay borrowings under the Credit Facility at any time. Any prepayment or repricing of Term Loans prior to March 29, 2015, is subject to a prepayment fee equal to 1.00% of the principal prepaid or repriced.
If the Company has failed to maintain the applicable First Lien Leverage Ratio, it may nevertheless avoid a default by (i) repaying outstanding borrowings under the Revolving Line in an amount sufficient to avoid triggering the First Lien Leverage Ratio for that fiscal quarter or (ii) accepting a cash contribution of qualified equity in an amount which, if treated as Consolidated EBITDA, would bring the Company into compliance with the applicable First Lien Leverage Ratio for that fiscal quarter, in each case during the 11 business days following the deadline for delivery of the Company’s compliance certificate for that fiscal quarter. In addition, maintenance of the First Lien Leverage Ratio is required only with respect to the Revolving Line; the Term Loans do not directly benefit from the financial covenant and, until the Revolving Line is terminated and all outstanding borrowings thereunder are accelerated, will remain unaffected by a default under the Revolving Line that arises from the Company’s failure to maintain the applicable First Lien Coverage Ratio.
The Credit Agreement contains other customary terms, including (i) representations, warranties and affirmative covenants, (ii) negative covenants (in addition to the limitation on distributions and the requirement to maintain the First Lien Leverage Ratio levels as described above), such as limitations on indebtedness, liens, mergers, acquisitions, asset sales, investments, prepayments of subordinated debt, and transactions with affiliates, in each case subject to baskets, thresholds and other exceptions, and (iii) events of default, such as for non-payment, breach of other covenants, misrepresentations, cross default to other debt, change in control, bankruptcy events, ERISA events, unsatisfied judgments and actual or asserted invalidity of guarantees or security documents.
As of January 31, 2015, the Company was in compliance with the covenants in the Credit Facility.
Provided that the Company is in compliance with the First Lien Leverage Ratio test and no default under the Credit Agreement is continuing or would result therefrom, the covenant in the Credit Agreement that limits the Company’s ability to pay dividends or make other distributions to its members generally permits (with certain exceptions and qualifications) the Company to pay dividends or make such distributions in an aggregate amount, when taken together with the aggregate amount of any prepayment, repurchase, redemption or defeasance of subordinated indebtedness, not to exceed the greater of (x) 3.00% of Consolidated Total Assets and (y) $65.0 million and (ii) in aggregate amount not to exceed the available amount (as defined in the Credit Agreement) at such time. Other than the return of capital discussed in Note 5, the Company historically has not paid dividends on its restricted voting shares.
The Credit Facility is guaranteed by certain wholly owned subsidiaries of the Company and secured by a first priority pledge on substantially all of the assets of the Company and the subsidiary guarantors, in each case subject to certain exceptions.
2014 Senior Unsecured Notes
In February 2014 the Company issued $450.0 million in aggregate principal amount of 7.50% senior unsecured notes due February 1, 2022 (the “Notes”) in a private placement, pursuant to which it entered into an indenture (the “Indenture”) with a commercial bank acting as trustee (the “Trustee”).
Interest on the Notes accrues at a rate of 7.50% per annum and is payable semiannually in arrears on each February 1 and August 1, commencing on August 1, 2014. Interest is computed on the basis
F-31
of a 360-day year comprised of twelve 30-day months. The Notes are generally required to be guaranteed by each of the Company’s restricted subsidiaries that guarantees the Credit Facility or that guarantees other material indebtedness of the Company or other Note guarantors.
Except for offers to purchase Notes upon certain asset sales or a change in control of the Company, no mandatory redemption or sinking fund payment is required with respect to the Notes.
Prior to February 1, 2017, the Company may redeem all or a portion of the Notes at a redemption price equal to the principal amount redeemed, plus unpaid interest accruing on the principal amount redeemed to (but excluding) the redemption date, plus a make whole premium equal to the greater of (a) 1% of the principal amount redeemed and (b) (i) 105.625% of the principal amount redeemed) plus all required interest payments on that principal amount through February 1, 2017, discounted back to the Redemption Date, minus (ii) the principal amount redeemed.
On and after February 1, 2017, the Company may redeem all or a portion of the Notes at the applicable redemption prices set forth below (expressed as percentages of principal amount redeemed), plus unpaid interest accruing on the principal amount redeemed to, but excluding, the Redemption Date:
| Year | % |
| 2017 | 105.625% |
| 2018 | 103.750% |
| 2019 | 101.875% |
| 2020 and thereafter | 100.000% |
In addition, the Company may redeem all of the Notes at a redemption price equal to the principal amount redeemed, plus unpaid interest accruing to (but excluding) the redemption, upon certain adverse changes in applicable tax laws.
The Indenture does not require the Company to maintain compliance with any financial covenants. The Indenture does contain customary affirmative and negative covenants, including with respect to mergers, asset sales, restricted payments, restricted investments, issuance of debt and equity, liens, and affiliate transactions, subject to baskets and other exceptions. However, the Company will be exempt from many of the negative covenants if the Notes receive investment grade ratings from both Moody’s and S&P. The Indenture also contains customary events of default, such as for non-payment, breach of other covenants, misrepresentation, cross default to other material debt, bankruptcy events, unsatisfied judgments, and actual or asserted invalidity of guarantees.
As of January 31, 2015, the Company was in compliance with the covenants in the Indenture.
Prior Credit Arrangements-$660 Million Credit Facility
On December 14, 2012, in connection with the Banner Acquisition, the Company entered into a credit agreement providing for a credit facility comprised of a secured term loan in the amount of $575.0 million and a secured revolving line of credit in the amount of $85.0 million. On March 11, 2014, this credit facility was repaid with the proceeds of the Credit Facility and was terminated.
Other Financing Arrangements
During the third quarter of fiscal 2013, the Company received assistance from the Italian government in the form of two loans. One loan is a subsidized loan for approximately €6.0 million, of which the Company received €5.4 million during the three months ended July 31, 2013 with the remaining €0.6 million to be received in fiscal 2015. The subsidized loan has an annual interest rate of 0.5%, a maturity date of June 30, 2020 and amortizes in fixed semi-annual installments. The second loan is a bank loan of approximately €0.7 million, of which the Company received €0.6 million during the three months ended July 31, 2013 with the remaining €0.1 million to be received in fiscal 2015. The bank loan bears interest at a 6-month Euribor rate plus 7.1%, has a maturity date of June 30, 2020 and amortizes in six variable semi-annual installments beginning in December 2017.
F-32
In addition to the two Italian loans issued in fiscal 2013 above, the Company was also approved to receive a grant for approximately €0.7 million to reimburse the Company for research and development costs incurred and was reflected in cost of goods sold in fiscal year 2013.
In connection with the DPP Acquisition on March 11, 2014, the Company assumed $12.0 million in third party debt which includes a loan for its Capua, Italy site (subsidized by the Italian government), Austrian government research and development loans and a capital lease for its Linz, Austria site.
In connection with the Gallus Acquisition on September 29, 2014, the Company assumed $4.0 million in seller financing previously incurred by Gallus. The debt is non-interest bearing with $0.2 million of imputed interest remaining until maturity.
As of January 31, 2015 the Company had short-term insurance premium financing of $2.4 million as compared to $2.6 million as of October 31, 2014.
13. RELATED PARTY TRANSACTIONS
The Company has a service agreement with JLL Partners Inc., and certain of its affiliates, and DSM whereby the Company will reimburse JLL Partners Inc., and certain of its affiliates, and DSM for any management, consulting, financial, and other business services as provided under the agreement. The amount spent on these services for the three months ended January 31, 2015 and 2014 is $0.1 million and $0.1 million, respectively. Amounts payable for these services as of January 31, 2015 and October 31, 2014 are $0.1 million and $0.1 million, respectively.
The Company has TSA’s with DSM resulting from the DPP Acquisition whereby DSM performs certain shared service functions on behalf of the Company. The amount incurred for these services during the three months ended January 31, 2015 was $11.8 million. Amounts payable for these services as of January 31, 2015 and October 31, 2014 are $6.8 million and $11.4 million respectively. Additionally, the Company performs certain services on behalf of DSM. Revenues for these services for the three months ended January 31, 2015 are $5.9 million. Amounts receivable as of January 31, 2015 and October 31, 2014 are $9.5 million and $13.5 million respectively. The Company decided not to extend a majority of the service agreements covered by the TSA’s beyond December 31, 2014. This triggered an €11.4 million liability for termination costs and an additional €2.1 million liability associated with certain R&D contracts and other costs associated with the service agreement transition. A total of €13.5 million ($16.3 million), was recognized during the three months ended January 31, 2015. This liability is expected to be settled during fiscal 2015.
As a result of the DPP Acquisition, the Company holds a 50.0% interest in Percivia, a limited liability company for the purpose of performing research and development activities and licensing certain technology, and a 47.5% interest in ChemiePark, tasked with providing modern and powerful fire protection for the chemicals site in Linz, Austria. Both of these investments are accounted for using the equity method. As of January 31, 2015 and October 31, 2014, the Company had an investment value in Percivia and ChemiePark of $6.3 million and $0.1 million. For the three months ended January 31, 2015 and 2014, the Company recorded investment gains for Percivia and ChemiePark of $0.0 million and $0.0 million, respectively.
As of January 31, 2015 and October 31, 2014, the Company had an investment of $4.9 million and $5.6 million respectively, representing an 18% interest in two Italian companies (collectively referred to as “BSP Pharmaceuticals”) whose largest investor was previously an officer of the Company until December 31, 2009. These companies specialize in the manufacture of cytotoxic pharmaceutical products. As a result of the shareholders’ agreement with the other investors in BSP Pharmaceuticals that provides the Company with significant influence over BSP Pharmaceuticals’ operations, the Company accounts for its investment in BSP Pharmaceuticals using the equity method. Accordingly, for the three months ended January 31, 2015 the Company recorded an investment loss of approximately $0.1 million and recorded investment income of approximately $1.3 million for the three months ended January 31, 2014.
In connection with its investment in BSP Pharmaceuticals, the Company has a management services agreement with BSP Pharmaceuticals that provides on-going sales and marketing services, and
F-33
provided engineering and operational services during the construction of the BSP facility which was completed in 2008. There were no management fees recorded under this agreement for the three months ended January 31, 2015 and 2014, respectively. There was no accounts receivable balance at January 31, 2015 and October 31, 2014 in connection with the management services agreement.
In connection with certain of BSP Pharmaceuticals’ bank financing, the Company had made commitments that, if needed, it would irrevocably inject equity (pro-rata) in order to ensure BSP complies with certain specific bank covenants. The Company has not made any injections since fiscal 2010.
14. INCOME TAXES
The Company accounts for income taxes under FASB ASC 740, Income Taxes (“ASC 740”). The Company calculates its quarterly tax provision consistent with the guidance provided by ASC 740-270, whereby the Company forecasts its estimated annual effective tax rate then applies that rate to its year-to-date pre-tax book (loss) income. The effective tax rate may be subject to fluctuations during the year as new information is obtained, which may affect the assumptions used to estimate the annual effective rate, including factors such as the valuation allowances against deferred tax assets, the recognition or de-recognition of tax benefits related to uncertain tax positions, or changes in or the interpretation of tax laws in jurisdictions where the Company conducts business. The Company has recorded valuation allowances against certain Netherlands and foreign jurisdictions due to insufficient evidence supporting the Company’s ability to use these assets in the future.
For the three months ended January 31, 2015 and 2014, the Company recorded a provision for income taxes of $5.8 million and $1.3 million, respectively.
The Company does not reasonably expect material changes to the amount of uncertain tax positions within the next 12 months.
15. SUBSEQUENT EVENT
On March 4, 2015, the Company announced it reached a definitive agreement to acquire IRIX Pharmaceuticals, a company headquartered in Florence, S.C., that specializes in difficult to manufacture active pharmaceutical ingredient needs for drugs from early and late development, through commercial launch. The Company purchased IRIX for approximately $160.6 million and closed the transaction during the second quarter of fiscal 2015. The Company funded the purchase price through cash, equity, and the raising of additional debt. In connection with this transaction, the Company entered into Amendment no. 2 to the Credit Agreement which added two incremental term loans to the Credit Agreement, a euro denominated term loan in the amount of €155 million, or $168 million, and a USD denominated term loan in the amount of $20 million.
On March 9, 2015, the Company announced it reached a definitive agreement to acquire Agere Pharmaceuticals, a recognized leader in complex solubility technology, to expand its early stage pharmaceutical development capabilities. The Company purchased Agere for approximately $26.0 million and closed the transaction during the second quarter of fiscal 2015. The Company funded the purchase price through the use of available cash and equity.
On May 6, 2015, the Company’s subsidiary JLL/Delta Dutch Pledgeco B.V. (“Pledgeco”), closed on a $550.0 million aggregate principal amount of its 8.75%/9.50% senior PIK toggle note due 2020. Pledgeco intends to use the proceeds to pay a dividend or other distribution to the Partnership along with certain related transaction fees and expenses as a result of the $550.0 million debt offering.
On May 12, 2015, the Company announced the closing of the deal to sell its Banner Pharmacaps entity in Mexico to the Perrigo Company plc for approximately $34.0 million.
F-34
Report of Independent Registered Public Accounting Firm
The Board of Directors and Shareholders
Patheon Holdings Coöperatief U.A.
We have audited the accompanying consolidated balance sheets of Patheon Holdings Coöperatief U.A. as of October 31, 2014 and 2013, and the related consolidated statements of operations, comprehensive loss, members’ (deficit)/shareholders’ equity, and cash flows for each of the three years in the period ended October 31, 2014. These financial statements are the responsibility of the Company’s management. Our responsibility is to express an opinion on these financial statements based on our audits.
We conducted our audits in accordance with the standards of the Public Company Accounting Oversight Board (United States). Those standards require that we plan and perform the audit to obtain reasonable assurance about whether the financial statements are free of material misstatement. We were not engaged to perform an audit of the Company’s internal control over financial reporting. Our audits included consideration of internal control over financial reporting as a basis for designing audit procedures that are appropriate in the circumstances, but not for the purpose of expressing an opinion on the effectiveness of the Company’s internal control over financial reporting. Accordingly, we express no such opinion. An audit also includes examining, on a test basis, evidence supporting the amounts and disclosures in the financial statements, assessing the accounting principles used and significant estimates made by management, and evaluating the overall financial statement presentation. We believe that our audits provide a reasonable basis for our opinion.
In our opinion, the financial statements referred to above present fairly, in all material respects, the consolidated financial position of Patheon Holdings Coöperatief U.A. at October 31, 2014 and 2013, and the consolidated results of its operations and its cash flows for each of the three years in the period ended October 31, 2014, in conformity with U.S. generally accepted accounting principles.
/s/ Ernst & Young LLP
Raleigh, North Carolina
June 8, 2015
F-35
Patheon Holdings Coöperatief U.A.
CONSOLIDATED BALANCE SHEETS
As of October 31, 2014 |
As of October 31, 2013 |
|||||
| (in millions of U.S. dollars) | $ | $ | ||||
| Assets |
||||||
| Current |
||||||
| Cash and cash equivalents | 84.6 | 61.6 | ||||
| Accounts receivable, net | 334.9 | 167.2 | ||||
| Inventories | 442.9 | 157.7 | ||||
| Income taxes receivable | 4.4 | 3.6 | ||||
| Prepaid expenses and other | 20.2 | 15.3 | ||||
| Deferred tax assets - short-term | 21.6 | 6.9 | ||||
| Total current assets | 908.6 | 412.3 | ||||
| Capital assets | 923.0 | 498.1 | ||||
| Intangible assets | 257.0 | 69.2 | ||||
| Deferred financing costs | 67.2 | 22.1 | ||||
| Deferred tax assets | 3.4 | 0.1 | ||||
| Goodwill | 170.8 | 48.5 | ||||
| Investments | 15.4 | 7.8 | ||||
| Other long-term assets | 23.9 | 19.0 | ||||
| Total assets | 2,369.3 | 1,077.1 | ||||
| Liabilities and members’ (deficit)/shareholders’ equity |
||||||
| Current | ||||||
| Short-term borrowings | 2.6 | 3.0 | ||||
| Accounts payable and accrued liabilities | 454.4 | 221.5 | ||||
| Income taxes payable | 2.7 | 0.1 | ||||
| Deferred revenues - short-term | 96.5 | 15.0 | ||||
| Deferred tax liabilities - short-term | 1.2 | 0.1 | ||||
| Current portion of long-term debt | 22.8 | 6.8 | ||||
| Total current liabilities | 580.2 | 246.5 | ||||
| Long-term debt | 1,975.3 | 599.2 | ||||
| Deferred revenues | 46.1 | 20.1 | ||||
| Deferred tax liabilities | 52.8 | 44.9 | ||||
| Other long-term liabilities | 107.3 | 41.8 | ||||
| Total liabilities | 2,761.7 | 952.5 | ||||
| Commitments and contingencies |
||||||
| Members’ (deficit)/Shareholders’ equity |
||||||
| Membership interests | 538.5 | — | ||||
| Restricted voting shares | — | 610.6 | ||||
| Contributed surplus | — | 16.7 | ||||
| Accumulated deficit | (892.1 | ) |
(516.3 | ) |
||
| Accumulated other comprehensive (loss) income | (38.8 | ) |
13.6 | |||
| Total members’ (deficit) / shareholders’ equity | (392.4 | ) |
124.6 | |||
| Total liabilities and members’ (deficit) / shareholders’ equity | 2,369.3 | 1,077.1 | ||||
See accompanying notes
F-36
Patheon Holdings Coöperatief U.A.
CONSOLIDATED STATEMENTS OF OPERATIONS
Fiscal years ended October 31, |
|||||||||
2014 |
2013 |
2012 |
|||||||
| (in millions of U.S. dollars) | $ | $ | $ | ||||||
| Revenues | 1,704.8 | 1,019.7 | 748.0 | ||||||
| Cost of goods sold | 1,281.2 | 772.0 | 589.1 | ||||||
| Gross profit | 423.6 | 247.7 | 158.9 | ||||||
| Selling, general and administrative expenses | 261.5 | 163.6 | 128.6 | ||||||
| Research and development | 15.1 | 10.9 | — | ||||||
| Repositioning expenses | 53.5 | 15.8 | 6.1 | ||||||
| Acquisition and integration costs | 60.4 | 13.1 | 3.2 | ||||||
| Impairment charges | 22.1 | 13.1 | 57.9 | ||||||
| (Gain) loss on sale of capital assets | (0.1 | ) |
(1.3 | ) |
0.4 | ||||
| Operating income (loss) | 11.1 | 32.5 | (37.3 | ) |
|||||
| Interest expense, net | 90.4 | 47.8 | 26.5 | ||||||
| Foreign exchange loss, net | 8.7 | 0.8 | 0.5 | ||||||
| Refinancing expenses | 28.2 | 27.3 | — | ||||||
| Other income, net | (1.1 | ) |
(2.0 | ) |
(1.3 | ) |
|||
| Loss from continuing operations before income taxes | (115.1 | ) |
(41.4 | ) |
(63.0 | ) |
|||
| Current | 20.8 | 8.7 | 9.2 | ||||||
| Deferred | (16.7 | ) |
(14.2 | ) |
34.5 | ||||
| Provision for (benefit from) income taxes | 4.1 | (5.5 | ) |
43.7 | |||||
| Loss from continuing operations | (119.2 | ) |
(35.9 | ) |
(106.7 | ) |
|||
| Loss from discontinued operations | — | (0.2 | ) |
(0.3 | ) |
||||
| Net loss | (119.2 | ) |
(36.1 | ) |
(107.0 | ) |
|||
See accompanying notes
F-37
Patheon Holdings Coöperatief U.A.
CONSOLIDATED STATEMENTS OF COMPREHENSIVE LOSS
Fiscal years ended October 31, |
|||||||||
2014 |
2013 |
2012 |
|||||||
| (in millions of U.S. dollars) | $ | $ | $ | ||||||
| Net loss | (119.2 | ) |
(36.1 | ) |
(107.0 | ) |
|||
| Other comprehensive (losses) income, net of income taxes: |
|||||||||
| Change in foreign currency (losses) gains on investments in subsidiaries, net of hedging activities1 | (28.3 | ) |
3.4 | (11.9 | ) |
||||
| Change in value of derivatives designated as foreign currency cash flow hedges2 | (9.2 | ) |
(5.0 | ) |
1.3 | ||||
| Change in value of investments designated as available for sale3 | 0.1 | — | — | ||||||
| Gains (losses) on foreign currency cash flow hedges reclassified to consolidated statements of operations4 | 6.5 | (0.6 | ) |
0.5 | |||||
| Net change in minimum pension liability5 | (21.5 | ) |
1.9 | (0.2 | ) |
||||
| Comprehensive loss | (171.6 | ) |
(36.4 | ) |
(117.3 | ) |
|||
1 Net of an income tax benefit of $0.5 million in fiscal 2012.
2 Net of an income tax benefit of $0.1 million in fiscal 2012.
3 No income tax expense (benefit) is included as these amounts are from our Austrian operations which are under full valuation allowance. There were no sales of these investments in fiscal 2014 and as such there were no reclassifications related to this amount to the consolidated statements of operations during the period. See Note 13 for further information.
4 No income tax expense (benefit) is included as these amounts are from our Canadian operations which are under full valuation allowance. Amounts, gross of tax, have been reclassified to foreign exchange loss, net on the consolidated statements of operations.
5 Net of an income tax expense of $0.1 million (fiscal 2014), an income tax benefit of $0.2 million (fiscal 2013), and an income tax expense of $5.2 million (fiscal 2012) respectively, which is included as a component of provision for (benefit from) income taxes on the consolidated statement of operations. Amounts gross of tax have been reclassified to cost of goods sold and selling, general and administrative expenses on the consolidated statements of operations. See Note 10 for further information.
See accompanying notes
F-38
Patheon Holdings Coöperatief U.A.
CONSOLIDATED STATEMENT OF CHANGES IN MEMBERS’
(DEFICIT)/ SHAREHOLDERS’ EQUITY
Restricted Voting Shares |
Membership Interests |
Contributed Surplus |
Accumulated Deficit |
Accumulated Other Comprehensive Income |
Total Members’ (Deficit)/ Shareholders’ Equity |
|||||||||||||
| (in millions of U.S. dollars) | $ | $ | $ | $ | $ | $ | ||||||||||||
| Balance at October 31, 2011 | 571.9 | — | 13.5 | (373.2 | ) |
24.2 | 236.4 | |||||||||||
| Stock options exercised | 0.5 | — | (0.1 | ) |
— | — | 0.4 | |||||||||||
| Stock-based compensation | — | — | 3.1 | — | — | 3.1 | ||||||||||||
| Foreign Currency Translation Adjustment | 0.1 | 0.1 | ||||||||||||||||
| Comprehensive income (loss): |
||||||||||||||||||
| Net loss | — | — | — | (107.0 | ) |
— | (107.0 | ) |
||||||||||
| Change in foreign currency losses on investments in subsidiaries, net of hedging activities | — | — | — | — | (11.9 | ) |
(11.9 | ) |
||||||||||
| Change in value of derivatives designated as foreign currency cash flow hedges | — | — | — | — | 1.3 | 1.3 | ||||||||||||
| Gains on foreign currency hedges reclassified to consolidated statement of operations | — | — | — | — | 0.5 | 0.5 | ||||||||||||
| Net change in minimum pension liability | — | — | — | — | (0.2 | ) |
(0.2 | ) |
||||||||||
| Subtotal | 0.6 | — | — | (107.0 | ) |
(10.3 | ) |
(117.3 | ) |
|||||||||
| Balance at October 31, 2012 | 572.5 | — | 16.5 | (480.2 | ) |
13.9 | 122.7 | |||||||||||
| Proceeds from equity offering, net | 29.2 | — | — | — | — | 29.2 | ||||||||||||
| Stock options exercised | 8.9 | — | (3.0 | ) |
— | — | 5.9 | |||||||||||
| Stock-based compensation | — | — | 3.2 | — | — | 3.2 | ||||||||||||
| Comprehensive income (loss): |
||||||||||||||||||
| Net loss | — | — | — | (36.1 | ) |
— | (36.1 | ) |
||||||||||
| Change in foreign currency gains on investments in subsidiaries, net of hedging activities | — | — | — | — | 3.4 | 3.4 | ||||||||||||
| Change in value of derivatives designated as foreign currency cash flow hedges | — | — | — | — | (5.0 | ) |
(5.0 | ) |
||||||||||
| Losses on foreign currency hedges reclassified to consolidated statement of operations | — | — | — | — | (0.6 | ) |
(0.6 | ) |
||||||||||
| Net change in minimum pension liability | — | — | — | — | 1.9 | 1.9 | ||||||||||||
| Subtotal | 38.1 | — | 0.2 | (36.1 | ) |
(0.3 | ) |
1.9 | ||||||||||
| Balance at October 31, 2013 | 610.6 | — | 16.7 | (516.3 | ) |
13.6 | 124.6 | |||||||||||
| Patheon, Inc. stock-based compensation | — | — | 5.3 | — | — | 5.3 | ||||||||||||
| Patheon, Inc. share repurchase, net of amounts reinvested in Patheon Holdings | (610.6 | ) |
— | (22.0 | ) |
(256.6 | ) |
— | (889.2 | ) |
||||||||
| Patheon Holdings membership interests issued | — | 533.8 | — | — | — | 533.8 | ||||||||||||
| Management equity incentive plan stock-based compensation | — | 4.7 | — | — | — | 4.7 | ||||||||||||
| Comprehensive income (loss): |
||||||||||||||||||
| Net loss | — | — | — | (119.2 | ) |
— | (119.2 | ) |
||||||||||
| Change in foreign currency losses on investments in subsidiaries, net of hedging activities | — | — | — | — | (28.3 | ) |
(28.3 | ) |
||||||||||
| Change in value of derivatives designated as foreign currency cash flow hedges | — | — | — | — | (9.2 | ) |
(9.2 | ) |
||||||||||
| Change in value of derivatives designated as available for sale | — | — | — | — | 0.1 | 0.1 | ||||||||||||
| Gains on foreign currency hedges reclassified to consolidated statement of operations | — | — | — | — | 6.5 | 6.5 | ||||||||||||
| Net change in minimum pension liability | — | — | — | — | (21.5 | ) |
(21.5 | ) |
||||||||||
| Subtotal | (610.6 | ) |
538.5 | (16.7 | ) |
(375.8 | ) |
(52.4 | ) |
(517 | ) |
|||||||
| Balance at October 31, 2014 | — | 538.5 | — | (892.1 | ) |
(38.8 | ) |
(392.4 | ) |
|||||||||
See accompanying notes
F-39
Patheon Holdings Coöperatief U.A.
CONSOLIDATED STATEMENTS OF CASH FLOWS
Fiscal years ended October 31, |
|||||||||
2014 |
2013 |
2012 |
|||||||
| (in millions of U.S. dollars) | $ | $ | $ | ||||||
| Operating activities |
|||||||||
| Loss from continuing operations | (119.2 | ) |
(35.9 | ) |
(106.7 | ) |
|||
| Add (deduct) charges to operations not requiring a current cash payment: |
|||||||||
| Depreciation and amortization | 92.9 | 48.6 | 41.0 | ||||||
| Impairment charges | 22.1 | 13.1 | 57.9 | ||||||
| Non-cash interest | 24.8 | 7.8 | 1.2 | ||||||
| Change in other long-term assets and liabilities | (10.8 | ) |
(14.4 | ) |
(2.2 | ) |
|||
| Deferred income taxes | (16.7 | ) |
(14.2 | ) |
34.5 | ||||
| Amortization of deferred revenues | (52.8 | ) |
(18.3 | ) |
(13.1 | ) |
|||
| (Gain) loss on sale of capital assets | (0.1 | ) |
(1.3 | ) |
0.4 | ||||
| Stock-based compensation expense | 10.0 | 3.2 | 3.1 | ||||||
| Excess tax benefit from share-based payment arrangements | — | (1.0 | ) |
— | |||||
| Payment of original issue discount | (17.3 | ) |
— | — | |||||
| Other | (1.5 | ) |
(1.7 | ) |
(1.3 | ) |
|||
(68.6 | ) |
(14.1 | ) |
14.8 | |||||
| Net change in non-cash working capital balances | 9.7 | 10.0 | (6.6 | ) |
|||||
| Increase in deferred revenues | 83.9 | 17.3 | 25.2 | ||||||
| Cash provided by operating activities of continuing operations | 25.0 | 13.2 | 33.4 | ||||||
| Cash used in operating activities of discontinued operations | — | (0.2 | ) |
(0.4 | ) |
||||
| Cash provided by operating activities | 25.0 | 13.0 | 33.0 | ||||||
| Investing activities |
|||||||||
| Additions to capital assets | (92.6 | ) |
(49.8 | ) |
(53.4 | ) |
|||
| Proceeds from sale of capital assets | 4.6 | 6.6 | 0.4 | ||||||
| Proceeds from sale of business, net | — | — | 1.0 | ||||||
| Return of capital from equity investment | 1.3 | — | — | ||||||
| Acquisitions, net of cash acquired | (379.8 | ) |
(256.1 | ) |
— | ||||
| Cash used in investing activities of continuing operations | (466.5 | ) |
(299.3 | ) |
(52.0 | ) |
|||
| Cash provided by investing activities of discontinued operations | — | — | 0.1 | ||||||
| Cash used in investing activities | (466.5 | ) |
(299.3 | ) |
(51.9 | ) |
|||
| Financing activities |
|||||||||
| Decrease in short-term borrowings | — | — | (3.8 | ) |
|||||
| Proceeds from long-term borrowings, net of original issue discount | 2,092.0 | 647.0 | 40.9 | ||||||
| Increase in deferred financing costs | (60.9 | ) |
(22.7 | ) |
— | ||||
| Repayment of debt, net of original issue discount in 2014 and penalty payment in 2013 | (674.0 | ) |
(353.5 | ) |
(11.1 | ) |
|||
| Share issuance costs | — | (0.8 | ) |
— | |||||
| Proceeds on issuance of restricted voting shares | — | 35.9 | 0.3 | ||||||
| Excess tax benefit from share-based payment arrangements | — | 1.0 | — | ||||||
| Cash paid to acquire Patheon shares, net of amounts reinvested in Patheon Holdings | (889.2 | ) |
— | — | |||||
| Cash provided by financing activities | 467.9 | 306.9 | 26.3 | ||||||
| Effect of exchange rate changes on cash and cash equivalents | (3.4 | ) |
1.6 | (1.4 | ) |
||||
| Net increase in cash and cash equivalents during the period | 23.0 | 22.2 | 6.0 | ||||||
| Cash and cash equivalents, beginning of period | 61.6 | 39.4 | 33.4 | ||||||
| Cash and cash equivalents, end of period | 84.6 | 61.6 | 39.4 | ||||||
| Supplemental cash flow information |
|||||||||
| Interest paid (including payment of original issue discount in fiscal 2014) | 81.5 | 42.1 | 25.4 | ||||||
| Income taxes paid, net of income taxes received | 19.1 | 13.3 | 2.2 | ||||||
See accompanying notes
F-40
NOTES TO CONSOLIDATED FINANCIAL STATEMENTS
October 31, 2014, 2013 and 2012
(Dollar information in tabular form is expressed in millions of U.S. dollars, unless otherwise indicated)
1. NATURE OF BUSINESS
Patheon Holdings Coöperatief U.A. (the “Company” or “Patheon Holdings”) is a wholly owned company of JLL/Delta Patheon Holdings, L.P. (the “Partnership”) which is owned 51% by JLL Patheon Co-Investment Fund L.P. (“JLL”) and 49% by Koninklijke DSM N.V. (“DSM”). The Company was formed on March 11, 2014 as a result of Patheon Inc. entering into an arrangement agreement (the “Arrangement Agreement”) with DSM and JLL. Pursuant to the Arrangement Agreement, DPx Holdings B.V., a wholly owned subsidiary of Patheon Holdings, acquired all of the outstanding equity securities of Patheon Inc. In addition, DSM contributed its existing pharmaceutical products business (“DPP”) to the Company (the “DPP Acquisition”). From an accounting standpoint, Patheon Inc. was the acquirer and as such all financial information prior to March 11, 2014 is related to Patheon Inc.
The Company operates in three principal lines of business: Patheon, DPx Fine Chemicals and Banner Life Sciences. The Patheon business line conducts the Company’s pharmaceutical services. It includes the Drug Product Services (“DPS”) segment, which prior to the DPP Acquisition was referred to as Commercial Manufacturing Outsourcing services or “CMO”, the Pharmaceutical Development Services (“PDS”) segment, the Drug Substance Services (“DSS”) segment and the Biosolutions segment. The DPx Fine Chemicals (“DFC”) segment conducts the Company’s fine chemicals business. The Banner Life Sciences (“BLS”) segment conducts the Company’s proprietary products and technology operations.
More specifically, DPS includes commercial manufacturing support for a wide variety of solid and sterile dose forms; PDS includes support for the full breadth of advanced scientific services for the development and advancement of pharmaceutical products from discovery to regulatory approval; DSS includes the provision of active pharmaceutical ingredients, other fine chemical intermediates and biopharmaceutical drugs developed from optimized production of mammalian cell lines used to treat many chronic illnesses. DFC includes custom manufacturing services for intermediates used in the crop protection industry. The Biosolutions segment includes a large variety of products created from microbial fermentation, such as anti-infectives, enzymes and pharmaceutical proteins. BLS’s offerings are focused on proprietary products and technologies that are dedicated to the research and development, in-licensing, out-licensing and commercialization of innovative formulation technologies for the pharmaceutical industry, as well as the marketing of prescription, over-the-counter and nutritional proprietary products.
2. SUMMARY OF SIGNIFICANT ACCOUNTING POLICIES
Principles of consolidation and basis of presentation
The consolidated financial statements include the accounts of the Company and its wholly-owned subsidiaries. All intercompany transactions have been eliminated.
The preparation of the consolidated financial statements in conformity with accounting principles generally accepted in the United States (“U.S. GAAP”) requires management to make estimates and assumptions that affect: the reported amounts of assets and liabilities; the disclosure of contingent assets and liabilities at the date of the consolidated financial statements; and the reported amounts of revenue and expenses in the reporting period. Management believes that the estimates and assumptions used in preparing its consolidated financial statements are reasonable and prudent; however, actual results could differ from those estimates.
Segment Information
U.S. GAAP requires segmentation based on an entity’s internal organization and reporting of revenue and operating income (loss) based upon internal accounting methods commonly referred to as the “management approach”. Operating segments are defined as components of an enterprise
F-41
about which separate financial information is available that is evaluated regularly by the chief operating decision maker (“CODM”), or decision making group, in deciding how to allocate resources and in assessing performance. The Company’s CODM is its Chief Executive Officer.
The Company’s seven operating segments are: North America Drug Product Services, or North America DPS, Europe Drug Product Services, or Europe DPS, Pharmaceutical Development Services, or PDS, Drug Substance Services, or DSS, DPx Fine Chemical, or DFC, Banner Life Sciences, or BLS, and Biosolutions. The North America DPS, and Europe DPS operating segments met the aggregation criteria to present as one reportable segment referred to as DPS. As a result, the Company has determined it has four reportable segments: DPS, PDS, DSS and DFC. BLS, Biosolutions, and Corporate are not individually reportable segments since the quantitative thresholds have not been met and as such have been reported in Other.
Foreign exchange translation
Assets and liabilities of foreign operations are translated into U.S. dollars at the rates of exchange in effect at the balance sheet date. Income and expense items are translated at the weighted average exchange rates prevailing during each period presented. Gains and losses resulting from foreign currency transactions are included in the results of operations. Translation gains and losses related to certain foreign currency denominated intercompany loans that are not expected to be settled in the foreseeable future are included as part of the net investment in certain foreign subsidiaries, and are included in accumulated other comprehensive income (loss) in members’ (deficit)/shareholders’ equity. Gains and losses resulting from translation of financial statements of foreign subsidiaries are recorded as a component of accumulated other comprehensive (income) loss until either the sale or upon the complete or substantially complete liquidation by the Company of its investment in a foreign entity.
Revenue recognition
The Company recognizes revenue when services are completed in accordance with specific agreements with its customers and when all costs connected with providing these services have been incurred, the price is fixed or determinable and collectability is reasonably assured. Customer deposits on services in progress are included in accounts payable and accrued liabilities.
In the case of manufacturing services, revenue is recognized upon shipment, upon receipt of goods by the customer in line with the delivery terms outlined in the contract, or when products pass quality assurance testing, in all cases where the risk has been transferred, service obligations have been performed, and the Company is entitled to payment under the terms of the contract. The Company also has agreements with various distributors that allow the Company to share in product profits. The Company recognizes these profits once the distributor ships the product and title passes to the distributor’s customer.
In the case of development related services, revenue is recognized on the achievement of specific substantive milestones in accordance with the respective development service contracts when performance has been completed.
The Company accepts returns from its customers only for defective products. The impact of returns from customers is not significant to the business or the consolidated financial statements as a whole.
Deferred revenues
Customer agreements may provide that the costs of certain capital assets are reimbursed to the Company by the pharmaceutical companies that are to benefit from the improvements. These reimbursements are recorded as deferred revenues and are recognized as income over the remaining minimum term of the agreements including potential extensions. In certain instances the Company receives prepayment for future services and these amounts are amortized over the future required service periods.
F-42
Goodwill
Goodwill represents the excess of the purchase price of the Company’s interest in acquired subsidiary companies over the fair value of the underlying net identifiable assets as of the date of acquisition, with significant amounts recorded as a result of the acquisitions described in Note 3 (the “Acquisitions”) of DPP, Gallus Pharmaceuticals LLC (“Gallus”) and Sobel USA Inc. and Banner Pharmacaps Europe B.V. (together “Banner”). The Company tests goodwill for impairment at least annually in the fiscal fourth quarter, or when indications of potential impairment exist. The Company monitors for the existence of potential impairment indicators throughout the fiscal year. Testing is performed with respect to each of the Company’s reporting units that have been allocated goodwill.
If the Company’s qualitative assessment reveals that goodwill impairment is more likely than not, the Company performs the two-step impairment test. Alternatively, the Company may bypass the qualitative test and initiate goodwill impairment testing with the first step of the two-step goodwill impairment test.
During the first step of the goodwill impairment test, the Company compares the fair value of the reporting unit to its carrying value, including goodwill. If the fair value of a reporting unit exceeds its carrying value, then the Company concludes that no goodwill impairment has occurred. If the carrying value of the reporting unit exceeds its fair value, the Company performs the second step of the goodwill impairment test to measure possible goodwill impairment loss. During the second step, the Company hypothetically values the reporting unit’s tangible and intangible assets and liabilities as if the reporting unit had been acquired in a business combination. The Company then compares the implied fair value of the reporting unit’s goodwill to the carrying value of its goodwill. If the carrying value of the reporting unit’s goodwill exceeds the implied fair value of the goodwill, the Company recognizes an impairment loss in an amount equal to the excess, not to exceed the carrying value of the reporting unit’s goodwill. Once an impairment loss is recognized, the adjusted carrying value of the goodwill becomes the new accounting basis of the goodwill for the reporting unit.
Intangible Assets
As a result of the acquisitions, the Company has recorded various intangible assets, including developed technology, favorable agreements, non-compete agreements, customer relationships and trade names which are amortized on a straight-line basis over the respective estimated useful lives. The Company tests for impairment of definite lived intangible assets whenever events or changes in circumstances indicate that the carrying amount will not be recoverable.
If such indicators are present, the Company assesses the recoverability of the intangible assets by determining whether the carrying value of such assets can be recovered through undiscounted future cash flows. If the sum of the undiscounted cash flows is less than the carrying amount, the excess of the carrying amount over the estimated fair value, based on the discounted cash flows, is recorded as a charge to earnings.
For indefinite-lived intangible assets other than goodwill, the Company compares the fair value of the intangible asset with the asset’s carrying amount. If the fair value is less than the carrying amount, the Company recognizes an impairment charge. This impairment test for indefinite-lived intangible assets other than goodwill is conducted annually, concurrently with the goodwill impairment test.
Research and development expenses
The Company expenses research and development costs as incurred. These expenses relate to proprietary research and development efforts and consist of salaries and benefits, supplies and other costs.
Distribution costs
Costs, such as freight and handling, associated with the distribution of BLS, DFC and DSS products are recorded as SG&A expenses when incurred. Distribution costs were $7.6 million in fiscal 2014 and $2.6 million fiscal 2013.
F-43
Financial assets and liabilities
All financial instruments, including derivatives, are included in the consolidated balance sheets and are measured at fair value except for loans and receivables and other financial liabilities, which are measured at amortized cost. Held-for-trading financial instruments are recorded at cost as they are initiated and are subsequently measured at fair value and all revaluation gains and losses are included in net income (loss) in the period in which they arise. Available-for-sale financial instruments are recorded at cost as they are initiated and are subsequently measured at fair value and all unrealized revaluation gains and losses are included in other comprehensive income (loss) in the period in which they arise unless any such losses are determined to be other-than-temporary. Realized gains and losses are included in net income (loss) in the period in which they arise. All financial instrument transactions are recorded on the settlement date. Please refer to Note 13.
The Company expenses as incurred all transaction costs, including fees paid to advisors and other related costs. Financing costs, including underwriting and arrangement fees paid to lenders, are deferred and carried as an asset on the balance sheet and amortized into interest expense over the terms of the related agreements.
Derivatives and hedge accounting
The Company enters into foreign exchange forward contracts and collars to reduce its exposure to foreign currency denominated cash flows and changes in the fair value of foreign denominated assets and liabilities. The Company has designated certain Euro denominated debt as a hedge against its net investment in its subsidiaries in Austria, The Netherlands, Germany, France and Italy. Refer to Note 13.
All derivative instruments are recorded in the consolidated balance sheets at fair value unless exempted from derivative treatment as a normal purchase and sale. All changes in their fair value are recorded in income (loss) unless the cash flow hedge accounting criteria are met, in which case the changes in the fair value associated with the effective portions of the hedge are recorded in other comprehensive income (loss).
Cash and cash equivalents
Cash and cash equivalents include cash in interest-bearing accounts and term deposits with remaining maturities of less than three months at the date the term deposit was acquired.
Inventories
Inventories consisting of raw materials, packaging components, spare parts, work-in-process, and finished goods are valued at the lower of cost and net realizable value. Cost approximates average cost, and includes cost of purchased materials, costs of conversion, namely labor and overhead, and other costs, such as freight in, necessary to bringing the inventories to their present location and condition.
Capital assets
Capital assets are carried at cost less accumulated depreciation. The cost of assets disposed of and the related accumulated depreciation are removed from the accounts and any resulting gain or loss is reflected in earnings.
Depreciation is provided on the straight-line basis based on estimated useful lives as follows:
| Buildings | 10 – 50 years |
| Building equipment | 10 – 15 years |
| Machinery and equipment | 5 – 15 years |
| Office equipment | 3 – 10 years |
| Computer software | 4 – 10 years |
| Furniture and fixtures | 7 – 10 years |
F-44
Repairs and maintenance costs are charged to operations as incurred.
Impairment of long-lived depreciable assets
The Company reviews whether there are any indicators of impairment of its capital assets and identifiable intangible assets (“long-lived depreciable assets”). If such indicators are present, the Company assesses the recoverability of the assets or group of assets by determining whether the carrying value of such assets can be recovered through undiscounted future cash flows. If the sum of undiscounted future cash flows is less than the carrying amount, the excess of the carrying amount over the estimated fair value, based on discounted future cash flows, is recorded as a charge to earnings.
Employee benefit plans
The Company provides a number of benefit plans to its employees including: (a) defined benefit pension plans; (b) post-employment benefit plans; (c) defined contribution plans; and (d) unfunded termination indemnities.
The cost of defined benefit pension plans and other post-employment benefits, which include health care and dental benefits, related to employees’ current service is charged to earnings annually. The cost is computed on an actuarial basis using the projected benefit method pro-rated based on service and management’s best estimates of various actuarial factors, including salary escalation, other cost escalation and retirement ages of employees.
The valuation of defined benefit pension plan assets is at current market value, based on an actuarial valuation, for purposes of calculating the expected return on plan assets. Past service costs resulting from plan amendments are deferred and amortized on a straight-line basis over the remaining service life of employees active at the time of amendment.
Actuarial gains and losses arise from the difference between the actual long-term rate of return on plan assets for a period and the expected long-term rate of return on plan assets for that period, or from changes in actuarial assumptions used to determine the accrued benefit obligation. The excess of the net accumulated actuarial gain or loss over 10% of the greater of the benefit obligations and the fair value of plan assets is amortized over the average remaining service period of active employees. The average remaining service period of the active employees covered by the pension plans and the other retirement benefit plans at the measurement date of October 31, 2014 is 18 years (2013—19 years). When the restructuring of a benefit plan gives rise to both a curtailment and a settlement of obligations, the curtailment is accounted for prior to the settlement.
The cost of defined contribution plans is charged to earnings as funds are contributed by the Company.
Unfunded termination indemnities for the employees of the Company’s subsidiaries in Italy and Mexico are accrued based on Italian and Mexican severance pay statutes, respectively. The liability recorded in the consolidated balance sheets is the amount to which the employees would be entitled if the employees’ employment with the Company ceased as of the balance sheet date.
Income taxes
The Company follows the liability method of income tax allocation. Under this method, deferred tax assets and liabilities are determined based on differences between the financial reporting and tax bases of assets and liabilities and are measured using the enacted tax rates and laws that will be in effect when the differences are expected to reverse.
The Company evaluates its ability to realize deferred tax assets on a quarterly basis. The factors used to assess the likelihood of realization of these assets include the Company’s calculation of cumulative pre-tax book income or loss, turn-around of temporary timing differences, available tax planning strategies that could be implemented to realize the deferred tax assets, and forecasted pre-tax book income and taxable income by specific tax jurisdiction. Actual results may vary from these forecasts and result in a change in the ability of the Company to realize benefits of these tax assets in the future. If the Company is unable to meet its projected forecasts or implement certain
F-45
tax planning strategies in jurisdictions for which there is currently no valuation allowance, the recording of a valuation allowance may be required.
Stock-based compensation
Incentive Stock Option Plan
The fair value of stock options granted, modified or settled is recognized on a straight-line basis over the applicable stock option vesting period as stock-based compensation expense in the consolidated statements of operations and additional paid-in capital in the consolidated balance sheets. On the exercise of stock options, consideration received and the additional paid-in capital amount is credited to restricted voting shares. The Company estimates forfeitures based on a weighted-average of historical forfeitures. As a result of the DPP Acquisition all outstanding stock options fully vested and settled during the quarter ended April 30, 2014. Accordingly, there are no outstanding incentive stock options as of October 31, 2014.
For the purposes of calculating the stock-based compensation expense, the fair value of stock options is estimated at the date of the grant using the Black-Scholes option pricing model and the cost is amortized over the vesting period. This model requires the input of a number of assumptions including dividend yields, expected stock price volatility, expected time until exercise and risk-free interest rates. Although the assumptions used reflect management’s best estimates, they involve assumptions based on market conditions generally outside of the control of the Company.
Management Equity Incentive Plan
The Partnership adopted the Management Equity Incentive Plan (the “Plan”) with an effective date of March 11, 2014. The purpose of the Plan is to provide eligible participants with an opportunity to receive grants of profits interest of the Partnership designated as management units. The award of management units pursuant to this Plan is intended to compensate employees of the Partnership and its subsidiaries. The participants in the Plan, as a group, are eligible to participate in a portion of the return on investment received by JLL and DSM on their investment once certain specified distribution thresholds have been achieved. Grants of profits interests under the Plan contain services, performance, and/or market conditions.
The fair value of awards with only a service condition granted, modified or settled is recognized on a straight-line basis over the applicable vesting period as stock-based compensation expense in the consolidated statements of operations and additional paid-in capital in the consolidated balance sheets. The Company has not recognized any compensation expense for grants of profits interests that contain a performance condition as it is currently not probable that the specified conditions will be met. See Note 11 for further information.
For the purposes of calculating the stock-based compensation expense, the fair value of the awards is estimated at the date of the grant using a Monte Carlo simulation model under the option pricing method and the cost is amortized over the vesting period. This model incorporates various assumptions including equity value, volatility, time to liquidity, risk-free rates and expected dividends. Although the assumptions used reflect management’s best estimates, they involve assumptions based on market conditions generally outside of the control of the Company.
Loss per share
Patheon Holdings was formed on March 11, 2014 as a result of the Arrangement Agreement that was executed with DSM and JLL. Patheon Holdings does not have any outstanding shares and, as such,, loss per share information has not been presented.
Government financing
The Company makes periodic applications for financial assistance under available government assistance programs in the various jurisdictions in which it operates. Grants relating to capital expenditures are recorded as deferred revenue when received. The deferred revenue is then recognized in proportion to the depreciation expense on the related capital assets acquired within
F-46
the same line on the consolidated statement of operations. Grants and tax credits relating to current operating expenditures are generally recorded as a reduction of expenses at the time the eligible expenses are incurred. In the case of certain foreign subsidiaries, the Company receives investment incentive allowances, which are accounted for as a reduction of income tax expense.
Recently adopted accounting pronouncements
In February 2013, the FASB issued ASU 2013-02, “Reporting of Amounts Reclassified Out of Accumulated Other Comprehensive Income” (“ASU 2013-02”). ASU 2013-02 requires enhanced disclosures about items reclassified out of accumulated other comprehensive income (“AOCI”). For items reclassified to net income in their entirety, the ASU requires information about the effect of significant reclassification items to appear on separate line items of net income. For those items where direct reclassification to net income is not required, companies must provide cross-references to other disclosures that provide details about the effects of the reclassification out of AOCI. Expanded disclosures concerning current period changes in AOCI balances are also required for each component of other comprehensive income on the face of the financial statements or in the notes. ASU 2013-02 is effective prospectively for fiscal years beginning after December 15, 2012, and interim periods within those fiscal years. The adoption of this guidance did not have a material impact on the Company’s consolidated financial statements.
In December 2011, the FASB issued ASU 2011-11, “Disclosures about Offsetting Assets and Liabilities,” which requires enhanced disclosures about financial instruments and derivative instruments that are either (i) offset in accordance with either Section 210-20-45 or 815-10-45 or (ii) subject to an enforceable master netting arrangement or similar agreement, irrespective of whether they are offset in accordance with either Section 210-20-45 or Section 815-10-45. The amendments are effective for annual reporting periods beginning on or after January 1, 2013 and interim periods within those annual periods. The amendments are required to be applied retrospectively for all prior periods presented. The adoption of this guidance did not have a material impact on the Company’s consolidated financial statements.
Recently issued accounting pronouncements
In November 2014, FASB issued ASU 2014-17, Business Combinations (Topic 805): Pushdown Accounting (a consensus of the FASB Emerging Issues Task Force). ASU 2014-17 provides an acquired entity with an option to apply pushdown accounting in its separate financial statements upon occurrence of an event in which an acquirer obtains control of the acquired entity. ASU No. 2014-17 is effective on November 18, 2014. After the effective date an acquired entity can make an election to apply the guidance to future change-in-control events or to its most recent change-in-control event. The adoption of this guidance is not expected to have a material impact on the Company’s financial statements.
In August 2014, FASB issued ASU No. 2014-15, Presentation of Financial Statements—Going Concern (Subtopic 205-40): Disclosure of Uncertainties about an Entity’s Ability to Continue as a Going Concern. ASU 2014-15 is intended to define management’s responsibility to evaluate whether there is substantial doubt about an organization’s ability to continue as a going concern and to provide related footnote disclosures. The guidance centers on disclosure requirements when management deems it probable that conditions or events, considered in aggregate, raise substantial doubt about the entity’s ability to continue as a going concern within one year after the date that the financial statements are issued. ASU No. 2014-15 is effective for annual periods after December 15, 2016, but early adoption is permitted. The adoption of this guidance is not expected to have a material impact on the Company’s financial statements.
In June 2014, the FASB issued ASU 2014-12 “Compensation—Stock Compensation”. The amendments in this update create Topic 718, “Compensation—Stock Compensation”. The amendments in this ASU apply to all reporting entities that grant their employees share-based payments in which the terms of the award provide that a performance target that affects vesting could be achieved after the requisite service period. The amendments require that a performance target that affects vesting and that could be achieved after the requisite service period be treated
F-47
as a performance condition. This ASU is effective for annual periods and interim periods within those annual periods, beginning after December 15, 2015. Early adoption is permitted. The amendments should be applied prospectively to all share-based payment awards that are granted or modified on or after the effective date, or retrospectively to all awards with performance targets that are outstanding as of the beginning of the earliest annual period presented in the financial statements, and to all new or modified awards thereafter. The adoption of this guidance is not expected to have a material impact on the Company’s financial statements.
On May 28, 2014, FASB and IASB issued a converged standard on revenue recognition from contracts with customers, ASU 2014-09 (Topic 606) and IFRS 15. The core principle of the new standard is for companies to recognize revenue to depict the transfer of goods or services to customers in amounts that reflect the consideration (that is, payment) to which the company expects to be entitled in exchange for those goods or services. The new standard also will result in enhanced disclosures about revenue, provide guidance for transactions that were not previously addressed comprehensively (for example, service revenue and contract modifications) and improve guidance for multiple-element arrangements. The new authoritative guidance will become effective in the first quarter of fiscal 2019. There are two methods for adopting the standard amendment. The first method is to retrospectively adjust each reporting period presented. The second method is to retrospectively adjust with the cumulative effect recognized at the date of initial application along with additional disclosures in reporting periods that include the date of initial application. The Company is evaluating the impact of this new pronouncement along with the method of adoption.
In April, 2014, the FASB issued Accounting Standards Update No. 2014-08, Presentation of Financial Statements (Topic 205) and Property, Plant, and Equipment (Topic 360). The ASU states that disposal of a component of an entity or a group of components of an entity is required to be reported in discontinued operations if the disposal represents a strategic shift that has (or will have) a major effect on an entity’s operations and financial results when the component of an entity or group of components of an entity meets the criteria to be classified as held for sale, is disposed of by sale, or disposed of other than by sale. The Company should apply the amendments in this Update prospectively to both of the following: (1) All disposals (or classifications as held for sale) of components of an entity that occur within annual periods beginning on or after December 15, 2014, and interim periods within annual periods beginning on or after December 15, 2015; (2) All businesses or nonprofit activities that, on acquisition, are classified as held for sale that occur within annual periods beginning on or after December 15, 2014, and interim periods within annual periods beginning on or after December 15, 2015. The adoption of this guidance is dependent upon future transactions.
In July 2013, the FASB issued ASU 2013-11, “Income Taxes, Presentation of an Unrecognized Tax Benefit When a Net Operating Loss Carryforward, a Similar Tax Loss, or a Tax Credit Carryforward Exists” (“ASU 2013-11”). ASU 2013-11 states that an unrecognized tax benefit, or a portion of an unrecognized tax benefit, should be presented in the financial statements as a reduction to a deferred tax asset for a net operating loss carryforward, a similar tax loss, or a tax credit carryforward, except as follows. To the extent a net operating loss carryforward, a similar tax loss, or a tax credit carryforward is not available at the reporting date under the tax law of the applicable jurisdiction to settle any additional income taxes that would result from the disallowance of a tax position or the tax law of the applicable jurisdiction does not require the entity to use, and the entity does not intend to use, the deferred tax asset for such purpose, the unrecognized tax benefit should be presented in the financial statements as a liability and should not be combined with deferred tax assets. The amendments in ASU 2013-11 are effective for fiscal years, and interim periods within those years, beginning after December 15, 2013, with early adoption permitted. The amendments should be applied prospectively to all unrecognized tax benefits that exist at the effective date. Retrospective application is permitted. The adoption of this guidance is not expected to have a material impact on the Company’s financial statements.
In March 2013, the FASB issued ASU 2013-05, “Parent’s Accounting for the Cumulative Translation Adjustment upon Derecognition of Certain Subsidiaries or Groups of Assets within a Foreign Entity
F-48
or of an Investment in a Foreign Entity” (“ASU 2013-05”). ASU 2013-05 resolves the diversity in practice concerning the release of the cumulative translation adjustment into net income when a parent either sells a part or all of its investment in a foreign entity or no longer holds a controlling financial interest in a subsidiary or group of assets within a foreign entity. The guidance is effective for fiscal years and interim reporting periods within those fiscal years beginning after December 15, 2013. The amendments described in the ASU are to be applied prospectively to derecognition events occurring after the effective date; prior periods are not to be adjusted. The adoption of this guidance is dependent upon future transactions.
In February 2013, the FASB issued ASU 2013-04, “Obligations Resulting from Joint and Several Liability Arrangements for Which the Total Amount of the Obligation Is Fixed at the Reporting Date” (“ASU 2013-04”). ASU 2013-04 provides guidance for the recognition, measurement and disclosure resulting from joint and several liability arrangements. Examples of obligations that fall within the scope of the ASU include certain debt arrangements, other contractual obligations and settled litigation. The new guidance is effective on a retrospective basis for fiscal years and interim periods within those fiscal years beginning after December 15, 2013. The adoption of this guidance is not expected to have a material impact on the Company’s financial statements.
3. BUSINESS COMBINATIONS
Gallus BioPharmaceuticals Acquisition
Background
On September 29, 2014, the Company acquired Gallus (the “Gallus Acquisition”), a leading contract manufacturing company specializing in biologics (included in the DSS segment) for a cash purchase price of $259.1 million. The business will aim to support the needs of customers with biologics projects by providing flexibility, leading technology solutions, commercial operations and an expanded footprint.
Purchase price allocation
The Gallus Acquisition has been accounted for using the acquisition method of accounting in accordance with ASC Subtopic 805-10, “Business Combinations,” and the fair value concepts set forth in ASC Subtopic 820-10, “Fair Value Measurements and Disclosures”. Under ASC 805-10, the total purchase price for Gallus was allocated to the assets acquired and liabilities assumed based on their respective fair values as of the acquisition date. The allocation of the purchase price is based on estimates and assumptions that are subject to change within the measurement period. The excess of the purchase price over the fair values of the assets acquired and liabilities assumed was recorded as goodwill. Goodwill largely consists of geographic expansion of product sales, manufacturing and other synergies of the combined companies, and the value of the assembled workforce.
F-49
The estimated purchase price allocation for the Gallus Acquisition is as follows:
| $ | |||
| Cash and cash equivalents | 0.9 | ||
| Accounts receivable | 17.1 | ||
| Inventories | 8.1 | ||
| Prepaid expenses and other | 2.0 | ||
| Capital assets | 72.5 | ||
| Intangible assets | 111.7 | ||
| Goodwill | 87.9 | ||
| Other long-term assets | 0.1 | ||
| Accounts payable and accrued liabilities | (13.2 | ) |
|
| Deferred tax liabilities - short-term | (0.1 | ) |
|
| Deferred revenues - short-term | (21.4 | ) |
|
| Current portion of long-term debt | (2.0 | ) |
|
| Long-term debt | (1.9 | ) |
|
| Deferred revenues - long-term | (1.8 | ) |
|
| Other long-term liabilities | (0.8 | ) |
|
| Total purchase price | 259.1 | ||
The Company expects a portion of the goodwill to be tax deductible.
Note that the fair values of the net assets acquired are based upon management’s preliminary estimate of the respective fair values. The estimated fair values of net assets and resulting goodwill are subject to the Company finalizing its analysis on certain tax attributes, contingent liabilities and potential working capital adjustments.
Valuations of intangible assets acquired
The weighted-average life of the acquired intangible assets is approximately 14.8 years. The following table sets forth the components of the acquired intangible assets by type:
| Estimated Fair Value |
Estimated Useful Life (in years) |
|||||
| $ | ||||||
| Developed technology and know-how | 2.3 | 15 | ||||
| Customer relationships | 107.2 | 15 | ||||
| Non-compete agreements | 2.2 | 3 | ||||
| Total | 111.7 | |||||
Financial results of the acquired business - Gallus
The revenues and loss from continuing operations of Gallus from September 29, 2014 to October 31, 2014 included in the consolidated statement of operations are as follows:
| September 29, 2014 to October 31, 2014 |
|||
| $ | |||
| Revenues | 5.5 | ||
| Loss from continuing operations | (2.8 | ) |
|
Note that the above amounts exclude the impact of the pushdown of the purchase accounting adjustments to the Gallus operations. The net impact of the amortization of the capital and intangible assets resulting from the purchase price allocation is an expense of $0.6 million for the period from September 29, 2014 to October 31, 2014.
F-50
DPP Acquisition
Background
On March 11, 2014, JLL contributed $500.0 million in cash for a 51.0 percent interest in Patheon Holdings and DSM contributed DPP in exchange for a 49.0 percent interest in Patheon Holdings, a cash payment of $114.4 million, a preferred interest in JLL/Delta Patheon Holdings L.P. of $49.9 million (net of pension obligation purchase price adjustment of $25.1 million), and a potential earn-out on the Biologics business (included in the DSS segment). DSM also received reimbursement for its transaction related expenses. Transaction related expenses incurred by Patheon Holdings were expensed as incurred and have been included within acquisition and integration costs in the consolidated statement of operations. Refer to the following table for a breakout of the consideration:
| $ | |||
| DSM contribution of DPP for a 49% interest in Patheon Holdings | 480.4 | ||
| Preferred interest in JLL/Delta Patheon Holdings L.P. | 49.9 | ||
| DSM cash payment | 114.4 | ||
| Patheon Holdings reimbursement to DSM | 17.4 | ||
| Earnout to DSM related to Biologics business | 3.5 | ||
| Total purchase price | 665.6 | ||
Purchase price allocation
The DPP Acquisition has been accounted for using the acquisition method of accounting in accordance with ASC Subtopic 805-10, and the fair value concepts set forth in ASC Subtopic 820-10. Under ASC 805-10, pursuant to which the total purchase price for DPP was allocated to the assets acquired and liabilities assumed based on their respective fair values as of the acquisition date. The allocation of the purchase price is based on estimates and assumptions that are subject to change within the measurement period. The excess of the purchase price over the fair values of the assets acquired and liabilities assumed was recorded as goodwill. Goodwill largely consists of geographic expansion of product sales, manufacturing and other synergies of the combined companies, and the value of the assembled workforce.
The estimated purchase price allocation for the DPP Acquisition is as follows:
| $ | |||
| Cash and cash equivalents | 10.2 | ||
| Accounts receivable | 137.5 | ||
| Inventories | 310.9 | ||
| Income taxes receivable | 1.5 | ||
| Prepaid expenses and other | 1.7 | ||
| Deferred tax assets - short-term | 2.7 | ||
| Capital assets | 397.7 | ||
| Intangible assets | 101.6 | ||
| Goodwill | 36.9 | ||
| Deferred tax assets - long-term | 1.1 | ||
| Investments | 9.1 | ||
| Other long-term assets | 10.3 | ||
| Accounts payable and accrued liabilities | (199.0 | ) |
|
| Income tax payable | (0.9 | ) |
|
| Deferred revenues - short-term | (34.2 | ) |
|
| Current portion of long-term debt | (2.8 | ) |
|
| Long-term debt | (9.2 | ) |
|
| Deferred revenues - long term | (28.4 | ) |
|
| Other long-term liabilities | (67.3 | ) |
|
| Deferred tax liabilities - long-term | (13.8 | ) |
|
| Total purchase price | 665.6 | ||
F-51
The Company does not expect any of the goodwill to be tax deductible.
Note that the fair values of the net assets acquired are based upon management’s preliminary estimate of the respective fair values. The estimated fair values of net assets and resulting goodwill are subject to the Company finalizing its analysis on certain tax attributes, capital assets, and contingent liabilities.
Valuations of intangible assets acquired
The weighted-average life of the acquired intangible assets is approximately 12.3 years. The following table sets forth the components of the acquired intangible assets by type:
| Estimated Fair Value |
Estimated Useful Life (in years) |
|||||
| $ | ||||||
| Favorable agreements | 1.5 | 0.5-9 | ||||
| Trade names | 0.7 | 8-9 | ||||
| Developed technology and know-how | 23.5 | 7-14 | ||||
| Customer relationships | 66.8 | 13-14 | ||||
| In-process research and development(1) | 8.8 | Indefinite | ||||
| Regulatory permits | 0.3 | Indefinite | ||||
| Total | 101.6 | |||||
(1) In process research and development is currently classified as indefinite-lived intangible assets and will either begin to be amortized upon product approval and commercialization or written-off if not approved.
Financial results of the acquired business - DPP
The revenues and loss from continuing operations of DPP from March 11, 2014 to October 31, 2014 included in the consolidated statement of operations are as follows:
| March 11, 2014 to October 31, 2014 |
|||
| $ | |||
| Revenues | 549.5 |
||
| Loss from continuing operations | (62.9 | ) |
|
Banner Acquisition
Background
On December 14, 2012, the Company completed the acquisition of all of the issued and outstanding shares of capital stock of Sobel USA Inc., a Delaware corporation, and Banner Pharmacaps Europe B.V., a private limited company organized under the laws of The Netherlands (collectively “Banner”) from Sobel Best N.V. and VION Holding, N.V., each of which was organized under the laws of The Netherlands, for a net aggregate cash purchase price of approximately $269.0 million (the “Banner Acquisition”) in cash. Banner was a pharmaceutical business focused on delivering proprietary softgel formulations, which had four manufacturing facilities and a number of proprietary technologies and products.
Purchase price allocation
The Banner Acquisition was accounted for using the acquisition method of accounting in accordance with ASC Subtopic 805-10, “Business Combinations,” and the fair value concepts set forth in ASC Subtopic 820-10, “Fair Value Measurements and Disclosures”. Under ASC 805-10, pursuant to which the total purchase price for Banner was allocated to the assets acquired and liabilities assumed based on their respective fair values as of the acquisition date. The allocation of the purchase price was based on estimates and assumptions that were subject to change within the
F-52
measurement period. The excess of the purchase price over the fair values of the assets acquired and liabilities assumed was recorded as goodwill. Goodwill largely consisted of geographic expansion of product sales, manufacturing and other synergies of the combined companies, and the value of the assembled workforce.
The purchase price allocation for the Banner Acquisition was as follows:
| $ | |||
| Cash and cash equivalents | 12.7 | ||
| Accounts receivable | 53.4 | ||
| Inventories | 53.7 | ||
| Income taxes receivable | 4.3 | ||
| Prepaid expenses and other | 3.6 | ||
| Deferred tax assets - short-term | 1.8 | ||
| Capital assets | 91.0 | ||
| Intangible assets | 75.1 | ||
| Goodwill | 45.1 | ||
| Deferred tax assets - long-term | 0.1 | ||
| Other long-term assets | 0.3 | ||
| Accounts payable and accrued liabilities | (35.7 | ) |
|
| Deferred tax liabilities - short-term | (0.4 | ) |
|
| Other long-term liabilities | (1.4 | ) |
|
| Deferred tax liabilities - long-term | (34.6 | ) |
|
| Total purchase price | 269.0 | ||
The Company does not expect any of the goodwill to be tax deductible.
Valuations of intangible assets acquired
The weighted-average life of the acquired intangible assets was approximately 11.0 years. The following table sets forth the components of the acquired intangible assets by type:
| Estimated Fair Value |
Estimated Useful Life (in years) |
|||||
| $ | ||||||
| Trade names | 0.8 | 5-6 | ||||
| Developed technology | 46.4 | 10-12 | ||||
| Customer relationships | 11.1 | 7-12 | ||||
| In-process research and development(1) | 16.8 | Indefinite | ||||
| Total | 75.1 | |||||
(1) In process research and development is currently classified as indefinite-lived intangible assets and will either begin to be amortized upon product approval and commercialization or written-off if not approved.
Financial results of the acquired business - Banner
The revenues and loss from continuing operations of Banner for the period from December 15, 2012 through October 31, 2013 included in the consolidated statement of operations are as follows:
| Period from acquisition through October 31, 2013 |
|||
| $ | |||
| Revenues | 217.3 | ||
| Loss from continuing operations | (55.9 | ) |
|
F-53
Pro forma financial information - DPP and Banner
The following table presents pro forma results of operations and gives effect to the DPP and Banner Acquisitions as if the transaction had been consummated on November 1, 2012. The pro forma financial information for the Gallus Acquisition, including the additional interest on debt, has been excluded from these results as the results of operations of Gallus were not material to the results of operations for the periods presented. This unaudited pro forma financial information is provided for informational purposes only and is not necessarily indicative of what the actual results of operations would have been had the transactions taken place on November 1, 2012, nor is it indicative of the future consolidated results of operations of the combined companies.
| Unaudited | Fiscal years ended October 31, |
|||||
| 2014 | 2013 | |||||
| $ | $ | |||||
| Revenues | 1,984.8 | 1,826.6 | ||||
| Loss from continuing operations | (241.9 | ) |
(72.3 | ) |
||
The unaudited pro forma financial information was prepared using the acquisition method of accounting and is based on the historical financial information of the Company, DPP and Banner, reflecting the Company’s, DPP’s, and Banner’s combined results of operations for the twelve month periods ended October 31, 2014 and 2013. The historical financial information has been adjusted to give effect to the pro forma events that are (i) directly attributable to the DPP and Banner Acquisitions, (ii) factually supportable and (iii) expected to have a continuing impact on the combined results of the Company, DPP, and Banner. The unaudited pro forma consolidated results reflect primarily the following pro forma adjustments:
| • | additional interest expense and amortization of deferred financing costs related to the long-term debt used to fund the acquisitions; refinancing expense not capitalized as a part of deferred financing costs and/or original issue discount have been removed. |
| • | additional amortization expense related to the fair-value of identifiable intangible assets acquired; |
| • | additional cost of goods sold resulting from increases/decreases in depreciation expense relating to the fair values of acquired property and equipment; and |
| • | removal of acquisition-related costs. |
4. PLANT CONSOLIDATIONS, SALES AND ASSET IMPAIRMENTS
Since the completion of the DPP Acquisition in the second quarter of fiscal 2014, the Biosolutions business has experienced a reduction in customer contracts and the Company expects a significant reduction in revenues going forward for this business and is considering new strategic options including selling the business. As a result the Company recorded an impairment charge of $12.4 million consisting of the write-off of goodwill and intangibles of the Biosolutions business of $2.2 million with the remainder of the impairment related to capital assets.
On July 2, 2014, the Company announced that it intends to close its facility in Venlo, The Netherlands dependent on works council and trade union approvals. The Company plans to wind down the facility’s operations by early calendar 2015 and transfer any remaining production to other Patheon Holdings facilities. Because the business in the Venlo facility is being transferred within the existing site network, its results of operations will be included in continuing operations in the consolidated financial statements. The Company expects to incur approximately $26.2 million in severance for approximately 105 employees and approximately $12.1 million in other shut down related costs, most of which were recorded in fiscal 2014 and will be paid out over the course of the next year. The severance expense of $26.2 million and contract termination costs of $6.8 million, a total of $33.0 million, were accrued in fiscal 2014.
The Company completed the consolidation of its Caguas, Puerto Rico operations into its Manati, Puerto Rico operations during the first quarter of fiscal 2014 and vacated the Caguas facility as of
F-54
January 31, 2014. Total project repositioning expenses were $14.9 million, of which an additional $1.1 million was recorded within repositioning expenses in the accompanying consolidated statement of operations for the twelve months ended October 31, 2014. Because the business in the Caguas facility transferred within the existing site network, its results of operations are included in continuing operations in the consolidated financial statements.
Subsequent to the closing of the Banner Acquisition, the Company performed a review of Banner’s facilities and decided to close the Olds, Alberta, Canada facility. As a result of this decision during fiscal 2013, the Company recorded a non-cash impairment charge of $11.9 million during the fiscal year ended October 31, 2013 to reduce the carrying value of the long-term assets and goodwill to their fair value related to the Olds, Alberta, Canada reporting unit. The Company sold the Olds, Alberta, Canada facility on November 1, 2013 for approximately $3.8 million.
5. SUPPLEMENTAL BALANCE SHEET INFORMATION
Inventories
Inventories consisted of the following:
| October 31, 2014 | October 31, 2013 | |||||
| $ | $ | |||||
| Raw materials, packaging components and spare parts | 155.9 | 77.9 | ||||
| Work-in-process | 71.2 | 42.3 | ||||
| Finished goods | 215.8 | 37.5 | ||||
| Balance, end of period | 442.9 | 157.7 | ||||
The increase in overall inventory in fiscal 2014 compared to fiscal 2013 is primarily related to the DPP and Gallus acquisitions.
Below is a roll-forward of the Company’s inventory provisions for fiscal 2014 and 2013:
| October 31, 2014 | October 31, 2013 | |||||
| $ | $ | |||||
| Balance, beginning of the year | (20.6 | ) |
(14.0 | ) |
||
| Additions | (20.3 | ) |
(14.2 | ) |
||
| Write-offs | 9.5 | 7.6 | ||||
| Balance, end of period | (31.4 | ) |
(20.6 | ) |
||
Accounts payable and accrued liabilities
The following is the breakdown of accounts payable and accrued liabilities:
| October 31, 2014 | October 31, 2013 | |||||
| $ | $ | |||||
| Trade payables | 252.7 | 133.0 | ||||
| Interest payable | 17.6 | 1.7 | ||||
| Accrued salaries and related expenses | 95.1 | 52.9 | ||||
| Customer deposits | 12.6 | 16.7 | ||||
| Repositioning | 48.4 | 7.7 | ||||
| Other accruals | 28.0 | 9.5 | ||||
| Balance, end of period | 454.4 | 221.5 | ||||
The increase in overall accounts payable and accrued liabilities in fiscal 2014 compared to fiscal 2013 is primarily related to the DPP and Gallus acquisitions.
F-55
Intangible assets
As part of the DPP, Gallus and Banner acquisitions, the Company acquired certain intangible assets. The following table summarizes gross carrying amounts, accumulated amortization, and accumulated impairments related to the Company’s identifiable intangible assets as of October 31, 2014:
| Definite-lived intangible assets | Gross carrying value |
Accumulated amortization |
Accumulated impairment |
Net carrying value |
Weighted Average Useful Life (in Years) |
||||||||||
| $ | $ | $ | $ | ||||||||||||
| Favorable agreements | 1.5 | (1.0 | ) |
(0.5 | ) |
— | 0.0 | ||||||||
| Trade names | 1.5 | (0.4 | ) |
— | 1.1 | 6.9 | |||||||||
| Developed technology | 72.2 | (9.5 | ) |
(0.3 | ) |
62.4 | 10.9 | ||||||||
| Customer relationships | 185.1 | (5.9 | ) |
— | 179.2 | 14.2 | |||||||||
| In-process research and development | 5.0 | (0.5 | ) |
— | 4.5 | 9.5 | |||||||||
| Non-compete agreements | 2.2 | (0.1 | ) |
— | 2.1 | 3.0 | |||||||||
| Foreign exchange | (1.9 | ) |
|||||||||||||
| Balance, end of period | 267.5 | (17.4 | ) |
(0.8 | ) |
247.4 | |||||||||
| Indefinite-lived intangible assets | Gross carrying value |
Accumulated amortization |
Accumulated impairment |
Net carrying value |
||||||||
| $ | $ | $ | $ | |||||||||
| In-process research and development | 20.6 | — | (11.0 | ) |
9.6 | |||||||
| Regulatory permits | 0.3 | — | (0.1 | ) |
0.2 | |||||||
| Foreign exchange | (0.2 | ) |
||||||||||
| Balance, end of period | 20.9 | — | (11.1 | ) |
9.6 | |||||||
In-process research and development (“IPR&D”) is classified as definite-lived or indefinite-lived depending on whether the product has been approved and if commercialization has begun. IPR&D for products that have been approved is classified as a definite-lived intangible asset and is amortized over the life of the asset. IPR&D for products that have not been approved is classified as an indefinite-lived intangible asset and either begins to be amortized upon approval and product commercialization or is written-off if the product is not approved.
During fiscal 2014, as a result of the annual impairment testing of indefinite-lived intangible assets, the Company incurred impairment losses of $9.7 million, stemming from changes in market factors and expected product commercialization timing. In addition, in fiscal 2014 certain assets within the Company’s Biosolutions business was impaired (See Note 4) and as a result $0.9 million of intangible assets related to favorable agreements, developed technology and regulatory permits were written off.
During fiscal 2013, the Company incurred an impairment charge of $1.3 million for certain Banner IPR&D projects.
Amortization expense for the twelve months ended October 31, 2014, 2013 and 2012 was $12.4 million, $4.8 million and nil respectively.
The definite-lived intangible asset amortization horizon is as follows.
| $ | |||
| 2015 | 21.3 | ||
| 2016 | 21.3 | ||
| 2017 | 21.2 | ||
| 2018 | 20.4 | ||
| 2019 | 20.3 | ||
| Thereafter | 142.9 | ||
| Total | 247.4 | ||
F-56
Goodwill
The following table summarizes the changes in goodwill during each of fiscal 2014 and fiscal 2013:
| Total | |||
| $ | |||
| Goodwill(1) | 3.5 | ||
| Accumulated impairment loss- prior periods(1) | — | ||
| Impairment loss –current period | (0.1 | ) |
|
| Additions through acquisitions(2) | 45.1 | ||
| Balance October 31, 2013 | 48.5 | ||
| Impairment loss –current period | (1.3 | ) |
|
| Additions through acquisitions(3) | 124.8 | ||
| Foreign Currency Translation Adjustments | (1.2 | ) |
|
| Balance October 31, 2014 | 170.8 | ||
(1) the opening goodwill balance as of November 1, 2012 is reflective of historical impairment charges of the full value of goodwill related to the Puerto Rico operations of $172.5 million which was recorded in fiscal 2006.
(2) represents goodwill recorded in connection with the Banner Acquisition.
(3) represents goodwill recorded in connection with the DPP and Gallus Acquisitions.
Deferred revenues
The following table summarizes the deferred revenue activity for each of fiscal 2014, 2013 and 2012:
| Balance at October 31, 2011 | $ | 36.5 | |
| Cash received from customers | 25.2 | ||
| Cash repaid to customers | (5.7 | ) |
|
| Amortization of deferred revenues | (13.1 | ) |
|
| Foreign exchange | (0.1 | ) |
|
| Balance at October 31, 2012 | $ | 42.8 | |
| Cash received from customers | 17.3 | ||
| Amortization of deferred revenues | (18.3 | ) |
|
| Foreign exchange | 1.0 | ||
| Other (1) | (7.7 | ) |
|
| Balance at October 31, 2013 | $ | 35.1 | |
| Cash received from customers | 83.9 | ||
| Amortization of deferred revenues | (52.8 | ) |
|
| Additions from Acquisitions | 85.8 | ||
| Foreign exchange | (4.3 | ) |
|
| Other (1) | (5.1 | ) |
|
| Balance at October 31, 2014 | $ | 142.6 |
(1) Other changes to deferred revenues primarily consist of movement between deferred revenue and accrued liabilities for repayment to customers.
F-57
6. CAPITAL ASSETS
As of October 31, |
||||||||||||||||||
2014 |
2013 |
|||||||||||||||||
| Cost | Accumulated Depreciation |
Net Book Value |
Cost | Accumulated Depreciation |
Net Book Value |
|||||||||||||
| $ | $ | $ | $ | $ | $ | |||||||||||||
| Land | 79.5 | — | 79.5 | 37.9 | — | 37.9 | ||||||||||||
| Buildings | 415.9 | 51.8 | 364.1 | 309.6 | 78.8 | 230.8 | ||||||||||||
| Machinery and equipment | 449.8 | 107.1 | 342.7 | 419.3 | 256.4 | 162.9 | ||||||||||||
| Office equipment (including software) | 78.6 | 34.6 | 44.0 | 53.8 | 37.1 | 16.7 | ||||||||||||
| Furniture and fixtures | 14.7 | 10.2 | 4.5 | 13.5 | 9.8 | 3.7 | ||||||||||||
| Construction in progress | 88.2 | — | 88.2 | 46.1 | — | 46.1 | ||||||||||||
| Balance, end of the year | 1,126.7 | 203.7 | 923.0 | 880.2 | 382.1 | 498.1 | ||||||||||||
The year over year increase in capital assets was primarily a result of the DPP and Gallus acquisitions. The amount of open purchase commitments related to authorized capital projects at October 31, 2014 and 2013 was approximately $54.6 million and $9.9 million, respectively. The expenditures related to the fiscal 2014 open purchase commitments are expected to be incurred through fiscal 2017. There were no capital leases for fiscal 2013. Assets under capital leases and included within capital assets for fiscal 2014 are as follows:
As of October 31, |
|||
| 2014 | |||
| $ | |||
| Cost of assets under capital leases included in capital assets | 3.9 | ||
| Accumulated depreciation relating to assets under capital leases | (0.9 | ) |
|
| Net book value | 3.0 | ||
| Fiscal 2014 depreciation of assets under capital leases | 0.9 | ||
Depreciation expense for the twelve months ended October 31, 2014 , 2013 and 2012 was $80.5 million, $43.8 million and $41.0 million respectively.
7. SHORT-TERM BORROWINGS
As of October 31, |
||||||
| 2014 | 2013 | |||||
| $ | $ | |||||
| Short-term insurance premium financing | 2.6 | 3.0 | ||||
F-58
8. LONG-TERM DEBT
Long-term debt in the accompanying consolidated balance sheets at October 31, 2014 and October 31, 2013 consists of the following:
| As of October 31, 2014 |
As of October 31, 2013 |
|||||
| $ | $ | |||||
| USD Term Loan with a base rate plus 2.25% or LIBOR with a floor of 1% plus 3.25% rate, (currently 4.25%), and maturity date of March 10, 2021 (the “Credit Agreement”) | 1,142.1 | — | ||||
| Euro Term Loan (€320.0 million) with a base rate plus 2.50% or LIBOR with a floor of 1% plus 3.50% rate, (currently 4.50%), and maturity date of March 10, 2021 (the “Credit Agreement”) | 399.7 | — | ||||
| 7.50% Senior Notes due February 1, 2022 (the “Notes”) | 450.0 | — | ||||
| Seller financing incurred by Gallus, non-interest bearing with a maturity date of May 13, 2016 | 4.0 | — | ||||
| Capua Italian government subsidized loans with annual interest rates ranging from 0.50% to 3.10%, and maturities ranging from May 2016 to December 2016 | 2.8 | — | ||||
| Government of Austria research and development loans with annual interest rates ranging from 1.50% to 3.74% and maturities through March 2019 | 5.9 | — | ||||
| Austrian capital lease on building with an interest rate of 3.54% and a maturity of September 2015 | 1.4 | — | ||||
| Floating LIBOR plus 6.00% with LIBOR floor of 1.25% due December 14, 2018 | — | 569.3 | ||||
| Italian subsidized loan with annual interest rate of 0.5%, and maturity date of June 30, 2020 | 5.9 | 7.4 | ||||
| Italian bank loan with Euribor 6-month + 7.1% rate, and maturity date of June 30, 2020 | 0.7 | 0.8 | ||||
| Bourgoin equipment capital leases with a LIBOR plus 3.5% rate and maturities ranging from May 2014 through September 2016 | 0.5 | — | ||||
| $85 million secured revolving credit facility maturing December 14, 2017, bearing interest ranging from 5.0% to 7.75% | — | 43.7 | ||||
| Total long-term debt outstanding | 2,013.0 | 621.2 | ||||
| Less original issue discount, net of accumulated amortization of $1.1 million, and $2.1 million, respectively | (14.9 | ) |
(15.2 | ) |
||
| Less current portion | (22.8 | ) |
(6.8 | ) |
||
| Balance, end of the period | 1,975.3 | 599.2 | ||||
2014 Term Loans and Revolving Line
On March 11, 2014, the Company completed the refinancing of its existing credit facility (the “Refinancing”), pursuant to which it entered into a credit agreement (the “Credit Agreement”) documenting a new credit facility (the “Credit Facility”) for a USD denominated secured term loan in the amount of $985.0 million and a Euro denominated secured term loan in the amount of €250 million, or $345.0 million, (together, with the incremental term loans described below, the “Secured Term Loans”) and a secured multi-currency revolving line in the amount of $200.0 million (the “Secured Revolving Facility”). Up to $75.0 million of the Secured Revolving Facility is available for letters of credit. The Secured Term Loans mature on March 10, 2021, and the Secured Revolving Facility matures on March 10, 2019. The USD denominated Secured Term Loan bears interest at a rate per annum equal to, at the option of the Company, a base rate plus 2.25% or LIBOR with a floor of 1% plus 3.25%. The Euro denominated Secured Term Loan bears interest at a rate per annum equal to, at the option of the Company, a base rate plus 2.50% or LIBOR with a floor of 1%
F-59
plus 3.50%. Borrowings under the Secured Revolving Facility bear interest for eurodollar loans at LIBOR with a floor of 1% plus 3.25%, Canadian prime rate loans at the Canadian prime rate plus 2.25%, and base rate loans at the base rate plus 2.25%. The Company will also pay a commitment fee of 0.50% per annum on the unused portion of the Secured Revolving Facility with a step down to 0.375% when the First Lien Leverage Ratio (as defined below) is less than or equal to 3.00 to 1.00.
On September 29, 2014, the Company entered into Amendment No. 1 to the Credit Agreement which added two incremental term loans to the Credit Facility; a USD denominated term loan in the amount of $160.0 million, and a Euro denominated term loan in the amount of €70.0 million, or $88.7 million. The Company used the proceeds for these two incremental term loans to fund a portion of the purchase price for the Gallus Acquisition. The other material terms of the incremental term loans are identical to those of the initial term loans. As of October 31, 2014, there were no borrowings under the Revolving Line.
Under the Secured Revolving Facility, the Company is required to maintain a First Lien Leverage Ratio below a certain amount for each of the Testing Periods as set forth in the Credit Agreement after such time as the Company has borrowed 25% or $50.0 million under the Secured Revolving Facility. For purposes of the Credit Agreement, a Testing Period means a single period consisting of the most recent four consecutive fiscal quarters ending on the covenant determination date. As of October 31, 2014, the Company was not required to calculate the First Lien Leverage Ratio as there were no borrowings outstanding under the Secured Revolving Facility. The following table discloses the maximum permitted First Lien Leverage Ratios permitted under the Credit Agreement:
| Testing Period Ending | Maximum Ratio |
| April 30, 2014 through October 31, 2014 | 6.75 to 1.00 |
| November 1, 2014 through October 31, 2015 | 6.50 to 1.00 |
| November 1, 2015 through October 31, 2016 | 6.25 to 1.00 |
| November 1, 2016 through October 31, 2017 | 6.00 to 1.00 |
| November 1, 2017 and thereafter | 5.75 to 1.00 |
Because the Company has not to date borrowed 25% or $50 million under the Secured Revolving Facility, the Company was not required to comply with the First Lien Leverage Ratio covenant described above at any time during fiscal 2014.
“First Lien Leverage Ratio” is generally defined in the Credit Agreement as the ratio of (i) the sum of the aggregate principal amount of the Company’s and its restricted subsidiaries’ indebtedness for borrowed money, principal amount of capital lease obligations and debt obligations evidenced by bonds, promissory notes, debentures or debt securities that is secured by a first priority lien on the collateral minus unrestricted cash and cash equivalents held by the Company and its restricted subsidiaries in each case set forth in the Credit Agreement to (ii) Consolidated EBITDA. Consolidated EBITDA is generally defined in the Credit Agreement as income (loss) from continuing operations before repositioning expenses, interest expense, foreign exchange losses reclassified from other comprehensive income (loss), refinancing expenses, acquisition-related costs, gains and losses on sale of capital assets, income taxes, asset impairment charges, depreciation and amortization, stock-based compensation expense, consulting costs related to the Company’s operational initiatives, purchase accounting adjustments, other income and expenses, non-cash charges, expenses related to the DPP Acquisition, pro forma cost savings from operational excellence initiatives and plant consolidations, pro forma synergies from the DPP Acquisition, and proceeds from business interruption insurance, among other adjustments. Consolidated EBITDA is not equivalent to Adjusted EBITDA, which, as discussed in Note 15, is the Company’s measure of segment performance.
The Company is required to make the following mandatory prepayments in respect of the Secured Term Loans: (i) 50% of Excess Cash Flow (as defined in the Credit Agreement) when the Company maintains a First Lien Leverage Ratio of greater than 4.00 to 1.00, with step downs to (a) 25% when the Company maintains a First Lien Leverage Ratio of less than or equal to 4.00 to 1.00 but greater
F-60
than 3.50 to 1.00 and (b) 0% when the Company maintains a First Lien Leverage Ratio of less than or equal to 3.50 to 1.00; (ii) 100% of the net cash proceeds of certain asset sales (including insurance and condemnation proceeds), subject to thresholds, reinvestment rights and certain other exceptions; and (iii) 100% of the net cash proceeds of issuances of debt obligations, subject to certain exceptions and thresholds. “Excess Cash Flow” is generally defined as Consolidated EBITDA (as defined in the Credit Agreement) plus, (i) decreases in working capital, (ii) extraordinary or nonrecurring income or gains and (iii) certain other adjustments, minus, (a) increases in working capital, (b) cash interest, (c) cash taxes, (d) cash capital expenditures (e) scheduled debt amortization and (f) certain other adjustments. No Excess Cash Flow payment is required for fiscal 2014. The Company may voluntarily repay borrowings under the Credit Facility at any time. Any prepayment or repricing of Term Loans prior to March 29, 2015, is subject to a prepayment fee equal to 1.00% of the principal prepaid or repriced.
If the Company has failed to maintain the applicable First Lien Leverage Ratio, it may nevertheless avoid a default by (i) repaying outstanding borrowings under the Revolving Line in an amount sufficient to avoid triggering the First Lien Leverage Ratio for that fiscal quarter or (ii) accepting a cash contribution of qualified equity in an amount which, if treated as Consolidated EBITDA, would bring the Company into compliance with the applicable First Lien Leverage Ratio for that fiscal quarter, in each case during the 11 business days following the deadline for delivery of the Company’s compliance certificate for that fiscal quarter. In addition, maintenance of the First Lien Leverage Ratio is required only with respect to the Revolving Line; the Term Loans do not directly benefit from the financial covenant and, until the Revolving Line is terminated and all outstanding borrowings thereunder are accelerated, will remain unaffected by a default under the Revolving Line that arises from the Company’s failure to maintain the applicable First Lien Coverage Ratio.
The Credit Agreement contains other customary terms, including (i) representations, warranties and affirmative covenants, (ii) negative covenants (in addition to the limitation on distributions and the requirement to maintain the First Lien Leverage Ratio levels as described above), such as limitations on indebtedness, liens, mergers, acquisitions, asset sales, investments, prepayments of subordinated debt, and transactions with affiliates, in each case subject to baskets, thresholds and other exceptions, and (iii) events of default, such as for non-payment, breach of other covenants, misrepresentations, cross default to other debt, change in control, bankruptcy events, ERISA events, unsatisfied judgments and actual or asserted invalidity of guarantees or security documents.
As of October 31, 2014, the Company was in compliance with the covenants the Credit Facility.
Provided that the Company is in compliance with the First Lien Leverage Ratio test and no default under the Credit Agreement is continuing or would result therefrom, the covenant in the Credit Agreement that limits the Company’s ability to pay dividends or make other distributions to its /members generally permits (with certain exceptions and qualifications) the Company to pay dividends or make such distributions in an aggregate amount, when taken together with the aggregate amount of any prepayment, repurchase, redemption or defeasance of subordinated indebtedness, not to exceed the greater of (x) 3.00% of Consolidated Total Assets and (y) $65.0 million and (ii) in aggregate amount not to exceed the available amount (as defined in the Credit Agreement) at such time. Other than the return of capital discussed in Note 11, the Company historically has not paid dividends on its restricted voting shares.
The Credit Facility is guaranteed by certain wholly owned subsidiaries of the Company and secured by a first priority pledge on substantially all of the assets of the Company and the subsidiary guarantors, in each case subject to certain exceptions.
2014 Senior Unsecured Notes
In February 2014 the Company issued $450.0 million in aggregate principal amount of 7.50% senior unsecured notes due February 1, 2022 (the “Notes”) in a private placement, pursuant to which it entered into an indenture (the “Indenture”) with a commercial bank acting as trustee (the “Trustee”).
Interest on the Notes accrues at a rate of 7.50% per annum and is payable semiannually in arrears on each February 1 and August 1, commencing on August 1, 2014. Interest is computed on the basis
F-61
of a 360-day year comprised of twelve 30-day months. The Notes are generally required to be guaranteed by each of the Company’s restricted subsidiaries that guarantees the Credit Facility or that guarantees other material indebtedness of the Company or other Note guarantors.
Except for offers to purchase Notes upon certain asset sales or a change in control of the Company, no mandatory redemption or sinking fund payment is required with respect to the Notes.
Prior to February 1, 2017, the Company may redeem all or a portion of the Notes at a redemption price equal to the principal amount redeemed, plus unpaid interest accruing on the principal amount redeemed to (but excluding) the redemption date, plus a make whole premium equal to the greater of (a) 1% of the principal amount redeemed and (b) (i) 105.625% of the principal amount redeemed) plus all required interest payments on that principal amount through February 1, 2017, discounted back to the Redemption Date, minus (ii) the principal amount redeemed.
On and after February 1, 2017, the Company may redeem all or a portion of the Notes at the applicable redemption prices set forth below (expressed as percentages of principal amount redeemed), plus unpaid interest accruing on the principal amount redeemed to, but excluding, the Redemption Date:
| Year | % |
| 2017 | 105.625% |
| 2018 | 103.750% |
| 2019 | 101.875% |
| 2020 and thereafter | 100.000% |
In addition, the Company may redeem all of the Notes at a redemption price equal to the principal amount redeemed, plus unpaid interest accruing to (but excluding) the redemption, upon certain adverse changes in applicable tax laws.
The Indenture does not require the Company to maintain compliance with any financial covenants. The Indenture does contain customary affirmative and negative covenants, including with respect to mergers, asset sales, restricted payments, restricted investments, issuance of debt and equity, liens, and affiliate transactions, subject to baskets and other exceptions. However, the Company will be exempt from many of the negative covenants if the Notes receive investment grade ratings from both Moody’s and S&P. The Indenture also contains customary events of default, such as for non-payment, breach of other covenants, misrepresentation, cross default to other material debt, bankruptcy events, unsatisfied judgments, and actual or asserted invalidity of guarantees.
As of October 31, 2014, the Company was in compliance with covenants in the Indenture.
Prior Credit Arrangements-$660 Million Credit Facility
On December 14, 2012, in connection with the Banner Acquisition, the Company entered into a credit agreement providing for a credit facility comprised of a secured term loan in the amount of $575.0 million and a secured revolving line of credit in the amount of $85.0 million. On March 11, 2014, this credit facility was repaid with the proceeds of the Credit Facility and was terminated.
Other Financing Arrangements
During the third quarter of fiscal 2013, the Company received assistance from the Italian government in the form of two loans. One loan is a subsidized loan for approximately €6.0 million, of which the Company received €5.4 million during the three months ended July 31, 2013 with the remaining €0.6 million to be received in fiscal 2015. The subsidized loan has an annual interest rate of 0.5%, a maturity date of June 30, 2020 and amortizes in fixed semi- annual installments. The second loan is a bank loan of approximately €0.7 million, of which the Company received €0.6 million during the three months ended July 31, 2013 with the remaining €0.1 million to be received in fiscal 2015. The bank loan bears interest at a 6-month Euribor rate plus 7.1%, has a maturity date of June 30, 2020 and amortizes in six variable semi-annual installments beginning in December 2017.
F-62
In addition to the two Italian loans issued in fiscal 2013 above, the Company was also approved to receive a grant for approximately €0.7 million to reimburse the Company for research and development costs incurred and was reflected in cost of goods sold in fiscal year 2013.
In connection with the DPP Acquisition on March 11, 2014, the Company assumed $12.0 million in third party debt which includes a loan for its Capua, Italy site (subsidized by the Italian government), Austrian government research and development loans and a capital lease for its Linz, Austria site.
In connection with the Gallus Acquisition on September 29, 2014, the Company assumed $4.0 million in seller financing previously incurred by Gallus. The debt is non-interest bearing with $0.2 million of imputed interest remaining until maturity.
Estimated minimum annual repayments of long-term debt and capital leases based on current exchange rates for the next five years are:
Long-term Debt |
Capital Leases |
|||||
| $ | $ | |||||
| 2015 | 21.0 | 1.8 | ||||
| 2016 | 21.0 | 0.1 | ||||
| 2017 | 18.4 | — | ||||
| 2018 | 17.7 | — | ||||
| 2019 | 17.1 | — | ||||
| Thereafter | 1,915.9 | — | ||||
| Total payments | 2,011.1 | 1.9 | ||||
9. OTHER LONG-TERM LIABILITIES
As of October 31, |
||||||
| 2014 | 2013 | |||||
| $ | $ | |||||
| Defined benefit pension plans | 75.8 | 17.6 | ||||
| Other post-employment benefits | 7.4 | 7.8 | ||||
| Unfunded termination indemnities | 6.8 | 6.4 | ||||
| Other long-term liabilities | 17.3 | 10.0 | ||||
107.3 | 41.8 | |||||
The unfunded termination indemnities relate to the employees of the Company’s Italian and Mexican subsidiaries.
In accordance with Italian severance pay statutes, an employee benefit is accrued for service to date and is payable when the employee’s employment with the Company ceases. The termination indemnity liability is calculated in accordance with local civil and labor laws based on each employee’s length of service, employment category and remuneration. The Italian termination liability is adjusted annually by a cost-of-living index provided by the government. Although there is no vesting period, the Italian government has established private accounts for these benefits and has required the Company to contribute $3.9 million in fiscal 2014 and $3.1 million in fiscal 2013 to these accounts, with additional contributions in the future. The liability recorded in the consolidated balance sheets is the amount to which the employees would be entitled if their employment with the Company ceased. The related expenses for fiscal 2014, 2013 and 2012 amounted to $3.1 million, $3.1 million and $3.0 million respectively.
The defined benefit and other benefit plans estimates above also do not include the unfunded termination indemnities related to the employees of the Company’s Mexican subsidiary, which the Company acquired as part of the Banner Acquisition. According to the Mexican labor law, a termination indemnity is payable when a company terminates an employment relationship without
F-63
justified cause (as defined in the labor law) and is equal to three months of salary and benefits, plus 20 days of salary and benefits per each credited service year. The termination indemnity liability is unfunded; therefore the liability is recognized through a reserve calculated by our actuaries. The related expenses for fiscal 2014, and 2013 amounted to $0.4 million, and $0.4 million, respectively. The Company has contributed $0.4 million and $0.3 million for fiscal 2014, and 2013, respectively.
Other long-term liabilities at October 31, 2014, primarily include $9.0 million in the Austrian jubilee plan, $1.1 million in long-term portion of foreign currency cashflow hedge liability, $0.8 million of post-employment benefits, $1.9 million for a deferred compensation plan and $0.7 million of deferred rent liability. Other long-term liabilities at October 31, 2013, primarily include $3.0 million of customer funded capital liabilities, $0.8 million of post-employment benefits, $2.5 million for a deferred compensation plan and $0.7 million of deferred rent liability.
10. EMPLOYEE FUTURE BENEFITS
Background
The Company has a number of defined benefit pension plans. In addition, it has other benefit plans that provide post-retirement healthcare and dental benefits. The Company measured the accrued benefit obligation and the fair value of plan assets for accounting purposes as of October 31, 2014 for the defined benefit pension and other benefit plans.
Information about the Company’s defined benefit pension and other benefit plans, in aggregate, is as follows:
| Defined Benefit Pension Plans 2014 |
Other Benefit Plans 2014 |
Defined Benefit Pension Plans 2013 |
Other Benefit Plans 2013 |
|||||||||
| $ | $ | $ | $ | |||||||||
| Change in benefit obligation |
||||||||||||
| Benefit obligation, beginning of the year | 133.0 | 7.8 | 112.4 | 8.0 | ||||||||
| Opening benefit obligation from Acquisition | 47.6 | — | 16.0 | — | ||||||||
| Current service cost | 2.3 | 0.1 | 2.1 | 0.1 | ||||||||
| Interest cost | 6.6 | 0.4 | 5.4 | 0.4 | ||||||||
| Member contributions during the year | — | — | 0.4 | — | ||||||||
| Settlement impact | (13.8 | ) |
— | — | — | |||||||
| Effect of curtailments | (2.3 | ) |
— | (1.6 | ) |
— | ||||||
| Benefits paid | (3.8 | ) |
(0.2 | ) |
(4.2 | ) |
(0.2 | ) |
||||
| Actuarial loss (gain) | 22.0 | 0.2 | 3.5 | (0.2 | ) |
|||||||
| Currency translation | (8.4 | ) |
(0.6 | ) |
(1.0 | ) |
(0.3 | ) |
||||
| Benefit obligation, end of the year | 183.2 | 7.7 | 133.0 | 7.8 | ||||||||
| Change in plan assets |
||||||||||||
| Market value of plan assets, beginning of year | 116.1 | — | 90.1 | — | ||||||||
| Opening market value of plan assets from Acquisition | 0.1 | — | 15.6 | — | ||||||||
| Actual return on plan assets | 4.4 | — | 8.9 | — | ||||||||
| Member contributions during the year | — | — | 0.4 | — | ||||||||
| Employer contributions | 6.8 | 0.2 | 6.4 | 0.2 | ||||||||
| Benefits paid | (3.8 | ) |
(0.2 | ) |
(4.2 | ) |
(0.2 | ) |
||||
| Settlement impact | (15.0 | ) |
— | — | — | |||||||
| Currency translation | (2.7 | ) |
— | (1.1 | ) |
— | ||||||
| Market value of plan assets, end of the year | 105.9 | — | 116.1 | — | ||||||||
| Unfunded status of plans at October 31, | (77.3 | ) |
(7.7 | ) |
(16.9 | ) |
(7.8 | ) |
||||
F-64
As of October 31, 2014 and 2013, other long-term liabilities included an accrued benefit liability of $85.0 million and $25.4 million, respectively, for the defined benefit pension plans and the other benefit plans. As of October 31, 2014 and 2013, other long-term assets included an accrued benefit asset of $0.0 million and $0.7 million, respectively. A total of $50.2 million and $27.0 million of combined net actuarial losses and unrecognized prior service costs are included in other comprehensive loss for fiscal 2014 and 2013, respectively, and have not yet been recognized as a component of net periodic pension costs.
Pension plan assumptions
The following weighted-average assumptions were used to determine the projected benefit obligation of the Company’s defined benefit and other post retirement plans at the end of the respective fiscal year:
Defined Benefit Plans |
Other Benefit Plans |
|||||||||||
| 2014 | 2013 | 2014 | 2013 | |||||||||
| Discount rate | 3.5 | % |
4.4 | % |
4.2 | % |
4.3 | % |
||||
| Rate of future compensation increases | 3.4 | % |
3.1 | % |
— | % |
— | % |
||||
The following weighted-average assumptions were used to determine the net periodic benefit cost of the Company’s defined benefit and other post retirement plans during the respective fiscal year:
Defined Benefit Plans |
Other Benefit Plans |
|||||||||||||||||
| 2014 | 2013 | 2012 | 2014 | 2013 | 2012 | |||||||||||||
| Discount rate | 4.0 | % |
4.6 | % |
4.9 | % |
4.6 | % |
4.3 | % |
5.2 | % |
||||||
| Expected long-term return on plan assets | 5.4 | % |
5.3 | % |
5.9 | % |
— | % |
— | % |
— | % |
||||||
| Rate of future compensation increases | 3.0 | % |
3.1 | % |
3.5 | % |
— | % |
— | % |
— | % |
||||||
The 3.5% weighted-average discount rate used to determine the projected benefit obligation of the Company’s plans at the end of fiscal 2014 was derived by reference to appropriate benchmark yields on high quality corporate bonds, with terms which approximate the duration of the benefit payments and the relevant benchmark bond indices considering the individual plan’s characteristics, to select a rate at which the Company believes the pension benefits could have been effectively settled.
The Company selects an expected long-term rate of return on its pension plan assets and, in doing so, considers a number of factors including, without limitation, recent and historical performance of plan assets, asset allocation and other third-party studies and surveys. The Company considered the pension plan portfolios’ asset allocations over a variety of time periods and compared them with third-party studies and reviewed the performance of the capital markets in recent years and other factors and advice from various third parties, such as the pension plans’ advisors, investment managers and actuaries. While the Company considered both the recent performance and the historical performance of pension plan assets, the Company’s assumptions are based primarily on its estimates of long-term prospective rates of return. Using the aforementioned methodologies, the Company selected the 5.4% long-term rate of return on plan assets assumption used for the pension plans during fiscal 2014. Differences between actual and expected asset returns are recognized in the net periodic benefit cost over the remaining service period of the active participating employees.
The rate of future compensation increases is an assumption used by our actuarial consultants for pension accounting and is determined based on the Company’s current expectation for such increases.
An approximate 7% annual rate of increase in the per capita cost of covered health care and dental benefits was assumed for fiscal 2014, with the assumption that the rate will decrease gradually to
F-65
6% and will remain at that level thereafter. The following table outlines the effects of a one-percentage-point increase and decrease in the assumed health care and dental benefit trend rates.
| (in millions of USD) | Benefit Obligation | Benefit Expense | ||||
| $ | $ | |||||
| Impact of: |
||||||
| 1% increase | 1.2 | 0.1 | ||||
| 1% decrease | (1.0 | ) |
(0.1 | ) |
||
The cost components of the Company’s defined benefit pension plan and other benefit plans in aggregate are as follows:
Fiscal years ended October 31, |
||||||||||||||||||
2014 |
2013 |
2012 |
||||||||||||||||
| Defined benefit pension plans |
Other benefit plans |
Defined benefit pension plans |
Other benefit plans |
Defined benefit pension plans |
Other benefit plans |
|||||||||||||
| $ | $ | $ | $ | $ | $ | |||||||||||||
| Service cost | 2.3 | 0.1 | 2.1 | 0.1 | 2.0 | 0.1 | ||||||||||||
| Interest cost | 6.6 | 0.4 | 5.4 | 0.4 | 5.1 | 0.4 | ||||||||||||
| Expected return on plan assets | (6.4 | ) |
— | (5.7 | ) |
— | (5.1 | ) |
— | |||||||||
| Curtailment gain | (1.6 | ) |
— | (0.7 | ) |
— | — | — | ||||||||||
| Settlement loss | 1.2 | — | — | — | — | — | ||||||||||||
| Amortization of prior service costs | — | — | 0.1 | — | 0.3 | — | ||||||||||||
| Amortization of actuarial loss | 0.9 | — | 1.2 | — | 1.1 | — | ||||||||||||
| Net periodic benefit costs | 3.0 | 0.5 | 2.4 | 0.5 | 3.4 | 0.5 | ||||||||||||
Based on current information available from actuarial estimates, the Company anticipates that contributions required under its defined benefit pension plans and other benefit plans for fiscal 2015 will be approximately $5.4 million compared to contributions of $7.0 million that were made in fiscal 2014. The decrease in the expected fiscal 2015 contributions compared to fiscal 2014 are as a result of the settlement of the Netherlands defined benefit plan in fiscal 2014 and a reduction in expected fiscal 2015 contributions to the UK defined benefit plan partially offset by the impact of holding defined benefit pension plans in Austria, Germany and Italy as a result of the DPP Acquisition for a full year in fiscal 2015. Required contributions to defined benefit pension plans in future years may vary and will be dependent upon a number of variables, including the long-term rate of return on plan assets.
The Company also provides retirement benefits for the majority of its employees at its Canadian, U.S., U.K., Netherlands and Puerto Rican sites under defined contribution pension plans. The total expense for the plans amounted to $10.4 million, $4.8 million and $4.5 million for fiscal 2014, 2013 and 2012 respectively. The year over year increase from 2013 to 2014 was driven primarily by the DPP Acquisition.
The Company terminated its Netherlands Pension Plan as of December 31, 2013 and replaced it with a defined contribution plan. All current and future employees in the Netherlands are eligible to participate in the defined contribution plan. The accrued benefits under the terminated pension plan were settled with non-participating annuity contracts. These events were accounted for as a curtailment and a settlement. The curtailment impact reduced the projected benefit obligation by $1.7 million. This resulting curtailment gain was applied first against the accumulated unrecognized net actuarial losses in other comprehensive (loss) income of $0.8 million and the remaining $0.9 million was recognized in the consolidated statement of operations. The settlement resulted in a loss of $1.2 million that was recorded in the consolidated statement of operations.
F-66
Total cash payments for employee future benefits were $17.4 million, $11.4 million and $10.3 million for fiscal 2014, 2013 and 2012, respectively, consisting of cash contributed by the Company to its defined benefit pension plans of $6.8 million $6.4 million and $5.6 million, cash payments directly to beneficiaries for its other benefit plans of $0.2 million $0.2 million and $0.2 million, and cash contributed to its defined contribution plans of $10.4 million, $4.8 million and $4.5 million, respectively.
Pension plan assets
The pension committee for the Company’s defined benefit plans (the “Pension Committee”) has adopted (and revises from time to time) an investment policy for the Canadian, U.K., and Mexico defined benefit plans with the objective of meeting or exceeding, over time, the expected long-term rate of return on plan assets assumption, weighed against a reasonable risk level. In connection with this objective, the Pension Committee retains professional investment managers that invest plan assets in the following asset classes: equity and fixed income securities and cash and other investments, which may include hedge funds and private equity and global balanced strategies.
The Company’s defined benefit plans currently have the following targets for these asset classes, which are intended to be flexible guidelines for allocating the plans’ assets among various classes of assets, and are reviewed periodically and considered for readjustment when an asset class weighting is outside of its target (recognizing that these are flexible targets that may vary from time to time) with the objective of achieving the expected long-term rate of return on plan assets assumption, weighed against a reasonable risk level, as follows:
| Defined Benefit Plans Canada |
Defined Benefit Plans U.K. |
Defined Benefit Plans Mexico |
|||||||
| Asset Category: |
|||||||||
| Equity securities | 5-65 | % |
25 | % |
0-5 | % |
|||
| Debt securities | 30-50 | % |
25 | % |
95-100 | % |
|||
| Other | 0-20 | % |
50 | % |
— | % |
|||
The fair value hierarchy must have the following levels: (a) quoted prices (unadjusted) in active markets for identical assets or liabilities (Level 1); (b) inputs other than quoted prices included in Level 1 that are observable for the asset or liability, either directly (i.e., as prices) or indirectly (i.e., derived from prices) (Level 2); and (c) inputs for the asset or liability that are not based on observable market data (unobservable inputs) (Level 3).
The fair values of the defined benefit plans’ assets at October 31, 2014, by asset categories were as follows:
| Defined Benefit Plans | Total | Level 1 | Level 2 | Level 3 | ||||||||
| $ | $ | $ | $ | |||||||||
| Asset Category: |
||||||||||||
| Equity securities | 40.4 | 0.1 | 40.3 | — | ||||||||
| Debt securities | 27.1 | 2.1 | 25.0 | — | ||||||||
| Cash and other investments | 38.4 | 1.1 | 37.3 | — | ||||||||
| Total pension plan assets at fair value | 105.9 | 3.3 | 102.6 | — | ||||||||
F-67
The fair values of the defined benefit plans’ assets at October 31, 2013, by asset categories were as follows:
| Defined Benefit Plans | Total | Level 1 | Level 2 | Level 3 | ||||||||
| $ | $ | $ | $ | |||||||||
| Asset Category: |
||||||||||||
| Equity securities | 40.6 | — | 40.6 | — | ||||||||
| Debt securities | 37.2 | 2.1 | 35.1 | — | ||||||||
| Cash and other investments | 38.3 | 0.6 | 37.7 | — | ||||||||
| Total pension plan assets at fair value | 116.1 | 2.7 | 113.4 | — | ||||||||
Within the equity securities asset class, the investment policy adopted by the Pension Committee provides for investments in a broad range of publicly-traded securities ranging from domestic and international stocks and small to large capitalization stocks. Within the debt securities asset class, the investment policy provides for investments in a broad range of publicly-traded debt securities, including domestic and international treasury issues, and corporate debt securities. In the cash and other investments asset class, investments may be in cash and cash equivalents and other investments, which may include hedge funds and private equity not covered in the classes listed above, provided that such investments are approved by the Pension Committee prior to their selection.
The Pension Committee’s investment policy does not allow the use of derivatives for speculative purposes, but such policy does allow its investment managers to use derivatives for the purpose of reducing risk exposures or to replicate exposures of a particular asset class.
Estimated future benefit payments
The following benefit payments, which reflect expected future service, as appropriate, are expected to be paid out of the Company’s defined benefit plans and other post-retirement benefit plans:
| Total Defined Benefit Plan Payments |
Total Other Benefit Plan Payments |
|||||
| $ | $ | |||||
| 2015 | 4.3 | 0.2 | ||||
| 2016 | 4.6 | 0.2 | ||||
| 2017 | 5.2 | 0.2 | ||||
| 2018 | 5.4 | 0.2 | ||||
| 2019 | 6.3 | 0.2 | ||||
| 2020 through 2024 | 36.1 | 1.5 | ||||
61.9 | 2.5 | |||||
The Company expects to incur approximately $1.8 million of amortization from actuarial losses as part of its pension costs in fiscal 2015.
11. MEMBERS’ (DEFICIT)/STOCKHOLDERS’ EQUITY
Membership interests
On the closing of the DPP Acquisition on March 11, 2014, the Patheon business and the DPP Business were combined into DPx, a wholly owned subsidiary of Patheon Holdings. Following completion of the transaction, Patheon restricted voting shares were delisted from the Toronto Stock Exchange, ceased to be registered with the United States Securities and Exchange Commission and were cancelled. Under the DPP Acquisition, each restricted voting share outstanding
F-68
immediately prior to the DPP Acquisition, including any restricted voting shares issued upon the exercise of any options, held by shareholders other than JLL were transferred to the Company in exchange for $9.32 per share. A summary of the share repurchase is as follows:
| $ | |||
| Purchase of Patheon equity - JLL portion | 731.9 | ||
| Purchase of Patheon equity - non-JLL portion | 581.6 | ||
| Purchase or settlement of Patheon employee options | 75.7 | ||
| Total paid to shareholders | 1,389.2 | ||
| JLL portion of purchase of Patheon equity invested in Patheon Holdings | (500.0 | ) |
|
| Total paid to Patheon shareholders, net of amounts reinvested by JLL | 889.2 | ||
The Company has 1,000 voting membership interests in proportion to the members’ capital contribution. The membership interests are held indirectly by the Partnership. The Partnership is owned 51.0% by JLL and 49.0% by DSM. The Partnership holds 954 voting membership interests in the Company while DSM NewCo B.V. holds 45 voting interests and JLL/Delta Patheon G.P. holds one voting membership interest. A summary of the Patheon Holdings equity sources is as follows:
| $ | |||
| JLL contribution for a 51% interest in Patheon Holdings | 500.0 | ||
| DSM contribution of DPP business for a 49% interest in Patheon Holdings | 480.4 | ||
| Preferred interest in the Partnership to DSM | 49.9 | ||
| Earnout to DSM related to Biologics business | 3.5 | ||
| Total membership interest in Patheon Holdings | 1,033.8 | ||
| JLL portion of purchase of Patheon equity invested in Patheon Holdings | (500.0 | ) |
|
| Net membership interests in Patheon Holdings | 533.8 | ||
Patheon Inc. Restricted voting shares
As Patheon Inc. was the acquirer in the DPP Acquisition, the capital structure prior to March 11, 2014 included restricted voting shares which were cancelled as a result the Company’s going private transaction.
Patheon Inc.’s articles were amended on April 26, 2007 to re-designate the common shares as restricted voting shares. This occurred in connection with the issuance of the Class I, Preferred Shares, Series D. The holders of the Class I, Preferred Shares, Series D had the right to elect three of nine members of the Board of Directors. The holders of Patheon’s restricted voting shares have the right to elect the remaining members of the Board of Directors. Under the rules of the TSX, voting equity securities are not to be designated, or called, common shares unless they have a right to vote in all circumstances that is not less, on a per share basis, than the voting rights of each other class of voting securities.
On December 31, 2012, the Company completed an offering of $30.0 million of transferable subscription rights, with every 13.75 rights entitling each holder of the Company’s outstanding restricted voting shares to subscribe for one whole restricted voting share at a price of, at such holder’s choice, either US$3.19 per whole share or CAD$3.19 per whole share (the “Rights Offering”).
Patheon Inc. issued 9,403,483 restricted voting shares as a result of the Rights Offering. This issuance represented approximately 7.2% of the Company’s restricted voting shares issued and outstanding prior to the Rights Offering. Upon the issuance of these new restricted voting shares, the Company had 139,701,375 restricted voting shares outstanding. The Company used the proceeds from the Rights Offering to partially finance the Banner Acquisition.
An affiliate of JLL Partners Fund V, L.P., a related party of the Company (“JLL Partners Fund V”), exercised its subscription rights in full, including its over-subscription privilege, up to the full amount of the Rights Offering. All excess subscription payments received from over-subscribing
F-69
rights holders, including JLL Partners Fund V, were returned, without interest or penalty. As a result of the rights offering, JLL Partners Fund V received 5,786,805 restricted voting shares (524,392 of which were received pursuant to the exercise of its over-subscription privilege), and as a result, JLL Partners Fund V’s ownership of restricted voting shares, together with its affiliates, is approximately 56.0% (78,524,986 Patheon Inc. restricted voting shares) of the Company’s issued and outstanding restricted voting shares.
The following table summarizes information regarding Patheon Inc. outstanding preferred shares, and restricted voting shares as of October 31, 2013:
| Outstanding | |||
| Class I preferred shares series D | 150,000 | ||
| Restricted voting shares | 140,930,525 | ||
Long-term incentive plans and stock-based compensation
The DPP Acquisition constituted a change in control as defined in the stock option plan since DSM indirectly owns more than 30% of the voting shares of Patheon. The stock option plan included a provision to make outstanding stock options immediately exercisable upon a change in control and as such the employees met the requisite service period since they were not required to provide additional service towards vesting of their awards. As a result all outstanding stock options were fully vested upon the DPP Acquisition and the Company recorded approximately $4.2 million of compensation expense in connection with this accelerated vesting. Cash paid to employees by the Company to repurchase the options was $45.4 million which is included in the total cash consideration paid to Patheon shareholders in the accompanying consolidated statement of changes in shareholders (deficit) equity.
In addition, on March 11, 2014, certain executives of Patheon entered into option waiver and termination agreements (the “Termination Agreements”). Under the Termination Agreements, certain option awards to these executives would terminate prior to but dependent on the closing of the DPP Acquisition (the Terminated Options). As consideration for agreeing to terminate their option awards and not be paid cash for these options upon the change in control, the executives each were given management units in JLL Patheon Co-Investment Fund L.P. which had a fair value equal to the terminated options.
Management Equity Incentive Plan
The Partnership adopted the Plan with an effective date of March 11, 2014. The purpose of the Plan is to provide eligible participants with an opportunity to receive grants of profits interests of the Partnership designated as management units. The award of management units pursuant to this Plan is intended to compensate employees of the Partnership and its subsidiaries. The participants in the Plan, as a group, are eligible to participate in the gain on the investment earned by JLL and DSM on their Patheon Holdings investment once certain specified distribution thresholds have been achieved.
The aggregate number, class and tranche of management units (the “Units”) that may be issued or transferred under this Plan is determined from time to time by the Board of Directors (the “Partnership Board”) of JLL/Delta Patheon G.P. Ltd., the general partner of the Partnership, subject to the conditions and limitations set forth in the Partnership’s partnership agreement. The Partnership may grant awards to eligible participants, upon such terms and conditions as the Partnership Board shall determine, and as set forth by the Board in an award agreement.
F-70
The following Units were granted to the Company’s management in fiscal 2014 :
| Service/ Performance/ Market-based |
Service- based |
Wtd Avg Fair Value |
|||||||
| $ | |||||||||
| Class B Units | 14,800 | 37,000 | 697.35 | ||||||
| Class C Units | 7,400 | — | 672.89 | ||||||
| Class D Units | 7,400 | — | 629.32 | ||||||
| Class E Units | 7,400 | — | 585.05 | ||||||
| Totals | 37,000 | 37,000 | |||||||
The Company uses a Monte Carlo simulation model under the option pricing method to value the Units. This model incorporates various assumptions including equity value, volatility, time to liquidity, risk-free rates and expected dividends.
The fair value of the Units for purposes of determining compensation expense was estimated on the grant date using the following weighted average assumptions:
| 2014 | |||
| Expected time to liquidity (in years) | 6.0 | ||
| Estimated equity volatility | 50 | % |
|
| Risk free rate | 1.93 | % |
|
| Dividend rate | — | % |
|
The Company estimated the expected time to a liquidity event, as defined below, for the Units and estimated the volatility based upon the volatility observed for certain guideline companies and considering the Partnership’s expected financial leverage. The interpolated yield on treasury notes with maturities closest to the expected time to the liquidity event, as defined, was used (adjusted for continuous compounding). The Company does not intend to pay dividends in the foreseeable future and, accordingly, used a dividend rate of zero in the Monte Carlo simulation model.
71.4286% of the Class B units only have a service-based component for vesting. Accordingly, the Company recorded $4.7 million of compensation expense in fiscal 2014 related to the service-based portion of these Class B units, which is being amortized over the four year vesting period. The remaining Units vest upon the achievement of a specified return on investment received by JLL and DSM or an Exit Event, as defined below. As such, no expense has been recognized for the other Units as of October 31, 2014 as the achievement of the distribution thresholds and exit event is deemed to not be probable until the occurrence of the event since the Company currently does not intend to pay dividends or make any distributions to its shareholders.
An Exit Event is defined as the earlier of: (a) a change of control, and (b) in connection with or following an Initial Public Offering (“IPO”), the sale or disposition by JLL Holdco or any of its affiliates of equity securities such that, immediately following such sale or disposition, either (i) JLL Holdco and its affiliates own less than 20.0% of the outstanding equity securities of the Partnership or the Partnership offeror, calculated on a fully-diluted basis, or (ii) JLL Holdco and its affiliates have received, in the aggregate, distributions in respect of such sale or disposition (together with any sale or disposition occuring prior thereto) equal to or in excess of 250.0% of the initial capital contributions and any additional capital contributions made by JLL Holdco and its affiliates for all equity securities of the Partnership or the Partnership offeror held by JLL Holdco and its affiliates prior to such sale or disposition.
As of October 31, 2014, the total unrecognized compensation cost related to the non-vested Class B units with a service condition of $21.1 million, which is expected to be recognized through fiscal 2018, (weighted-average remaining vesting period of 2.31 years). The total unrecognized fair value of the Class B (service/performance/market-based), C, D, and E units is $24.3 million.
F-71
Incentive stock option plan
Prior to the DPP Acquisition, Patheon Inc. had an incentive stock option plan in which directors, officers and key employees of the Company and its subsidiaries, as well as other persons engaged to provide ongoing management or consulting services to Patheon, were eligible to participate. As of March 10, 2014 and October 31, 2013, the total number of restricted voting shares issuable under the plan was 15,500,151 shares, of which there were stock options outstanding to purchase 10,996,225 shares and 11,017,225 shares, respectively, under the plan.
On June 18, 2012 Patheon Inc. granted 1,291,750 options to its executive committee members with a vesting based upon the parameters that all granted options will have cliff performance vesting which will vest at the earlier of the achievement of an Adjusted EBITDA target or five years after date of grant.
For the purposes of calculating the stock-based compensation expense in connection with the Company’s incentive stock option plan, the fair value of stock options was estimated at the date of the grant using the Black-Scholes option pricing model and the cost is amortized over the vesting period.
The company recorded stock-based compensation expense related to stock options in fiscal 2014, 2013 and 2012 of $5.3 million, $3.2 million and $3.1 million respectively.
A summary of the plan activity during the twelve months ended October 31, 2014 is as follows:
2014 |
|||||||||
| (Dollar amounts in US dollars) | Number of shares |
Weighted- average exercise price |
Aggregate intrinsic value |
||||||
| $ | $ | ||||||||
| Outstanding, beginning of the year | 11,017,225 | 2.46 | 28,871,065 | ||||||
| Exercised | (6,677,225 | ) |
9.31 | 45,395,345 | |||||
| Forfeited/Cancelled | (4,340,000 | ) |
9.31 | 30,350,212 | |||||
| Outstanding, end of the year | — | — | — | ||||||
The Company issued 2,229,150 and 129,966 restricted voting shares with an intrinsic value of approximately $3.1 million and $0.2 million under the stock option plan during fiscal 2013 and 2012, respectively.
For purposes of calculating the stock-based compensation expense in connection with the Company’s incentive stock option plan, the fair value of stock options is estimated at the date of the grant using the Black-Scholes option pricing model and the cost is amortized over the vesting period.
The weighted-average fair value per share of stock options granted during fiscal 2013 and 2012 was $2.17 and $1.08, respectively. There were no stock options granted in fiscal 2014 and there are no options outstanding at the end of the period. The fair value of stock options for purposes of determining stock-based compensation was estimated on the date of grant using the following assumptions:
| 2013 | 2012 | |||||
| Risk free interest rate | 1.4 | % |
1.3 | % |
||
| Expected volatility | 60 | % |
58 | % |
||
| Expected weighted-average life of options (in years) | 5.1 | 5.5 | ||||
| Expected dividend yield | 0 | % |
0 | % |
||
As of October 31, 2014, the there was no unrecognized compensation cost remaining as there were no awards outstanding at that date. As a result of the Company’s going private transaction on March 11, 2014, the stock option program was canceled and there have been no new additional optioned shares granted.
F-72
12. OTHER INFORMATION
Foreign exchange
During fiscal 2014, the Company recorded foreign exchange losses of $8.7 million in the consolidated statement of operations. These losses were primarily from a combination of both hedge settlement losses and operating exposures. During fiscal 2013, the Company recorded foreign exchange losses of $0.8 million in the consolidated statement of operations. These losses were primarily from operating exposures, partially offset by hedge gains. During fiscal 2012, the Company recorded a foreign exchange loss on cash flow hedges and transactions related to operating exposure of $0.5 million.
Net change in non-cash working capital balances related to continuing operations
The net changes in non-cash working capital balances related to continuing operations are as follows:
| 2014 | 2013 | 2012 | |||||||
| $ | $ | $ | |||||||
| Accounts receivable | (28.1 | ) |
28.2 | (16.5 | ) |
||||
| Inventories | 7.4 | (3.0 | ) |
(3.6 | ) |
||||
| Prepaid expenses and other | (1.8 | ) |
(1.3 | ) |
0.7 | ||||
| Accounts payable and accrued liabilities | 30.0 | (11.4 | ) |
5.1 | |||||
| Income taxes receivable / payable | 2.2 | (2.5 | ) |
7.7 | |||||
9.7 | 10.0 | (6.6 | ) |
||||||
Non-cash investing and financing activities
| Non-cash investing and financing activities: | 2014 | ||
| $ | |||
| DSM Contribution of DPP for a 49% interest in Patheon Holdings | 480.4 | ||
| Contribution of DSM preferred interest in JLL/Delta Patheon Holdings L.P. | 49.9 | ||
| Contribution of earn-out value to DSM related to Biologics business | 3.5 | ||
| Bourgoin equipment capitalized under capital lease | 0.8 | ||
| Management option awards settled upon change in control and profit units issued (See Note 11) | 30.3 | ||
Within financing activities on the statement of cash flows for fiscal 2014, the $500.0 million related JLL contribution for a 51% interest in Patheon Holdings (See Note 11) was deemed to be a reinvestment of equity since Patheon and Patheon Holdings were under common control. As such, this amount is presented as a reduction of the cash paid to acquire Patheon’s restricted voting shares.
Related party transactions
The Company has a service agreement with JLL Partners Inc., and certain of its affiliates, and DSM whereby the Company will reimburse JLL Partners Inc., and certain of its affiliates, and DSM for any management, consulting, financial, and other business services as provided under the agreement. The amount spent on these services in fiscal 2014, 2013 and 2012 was $0.6 million, $0.1 million and $0.2 million, respectively. Amounts payable for these services as of October 31, 2014 and 2013 were $0.0 million and $0.1 million, respectively.
During fiscal 2013, the board of directors of the Company authorized management to provide the support and resources of the Company to JLL in connection with the DPP Acquisition (see Note 3). JLL agreed to reimburse the Company from time to time, within 30 days following its receipt of demand therefor and reasonably detailed invoices related thereto, for certain reasonable expenses incurred by the Company in connection with, among other things, but not limited to, expenses incurred in connection with the due diligence review, tax structuring, and integration strategy and planning related to the DPP Acquisition. As of October 31, 2013, the Company had $3.6 million as a receivable due from JLL which was fully reimbursed to the Company in fiscal 2014.
F-73
The Company has transition service agreements (“TSA”) with DSM resulting from the DPP Acquisition whereby DSM performs certain shared service functions on behalf of the Company. The amount spent on these services during the period from March 11, 2014 through October 31, 2014 was $32.3 million. Amounts payable to DSM for these services as of October 31, 2014 were $11.4 million. Additionally, the Company performs certain services on behalf of DSM. Revenues for these services for the period from March 11, 2014 through October 31, 2014 were $24.0 million. Amounts receivable from DSM as of October 31, 2014 were $13.5 million. The Company decided not to extend a majority of the service agreements covered by the TSA beyond December 31, 2014 and as such notified DSM in the first fiscal quarter of 2015. This triggered a €11.4 million liability for termination costs and an additional €2.1 million associated with certain R&D contracts and other costs associated with the service agreements transition. A total of €13.5 million will be recognized in the first fiscal quarter of 2015 which is then expected to be settled during the remainder of fiscal 2015.
As a result of the DPP Acquisition, the Company holds a 50.0% interest in Percivia, a limited liability company for the purpose of performing research and development activities and licensing certain technology, and a 47.5% interest in ChemiePark, tasked with providing modern and powerful fire protection for the chemicals site in Linz, Austria. Both of these investments are accounted for using the equity method. As of October 31, 2014 the value of the Company’s investment in Percivia and ChemiePark was $6.3 million and $0.1 million, respectively. For the period from March 11, 2014 through October 31, 2014 the Company recorded other income for Percivia and ChemiePark of $0.3 million and $0.0 million, respectively. Additionally, Percevia returned capital to the Company of $1.3 million in fiscal 2014.
As of October 31, 2014 and October 31, 2013, the Company had an investment of $5.6 million and $5.2 million, respectively, representing an 18% interest in two Italian companies (collectively referred to as “BSP Pharmaceuticals”) whose largest investor was an officer of the Company until December 31, 2009. These companies specialize in the manufacture of cytotoxic pharmaceutical products. As a result of the shareholders’ agreement with the other investors in BSP Pharmaceuticals that provides the Company with significant influence over BSP Pharmaceuticals’ operations, the Company accounts for its investment in BSP Pharmaceuticals using the equity method. Accordingly, for fiscal 2014, 2013 and 2012, the Company recorded other income of approximately $0.8 million, $1.9 million and $1.4 million respectively.
In connection with its investment in BSP Pharmaceuticals, the Company has a management services agreement with BSP Pharmaceuticals that provides on-going sales and marketing services, and provided engineering and operational services during the construction of the BSP facility which was completed in 2008. There were no management fees recorded under this agreement for fiscal 2014, 2013 and 2012. There was no accounts receivable balance at October 31, 2014 and October 31, 2013 in connection with the management services agreement.
In connection with certain of BSP Pharmaceuticals’ bank financing, the Company had made commitments that, if needed, it would irrevocably inject equity (pro-rata) on an ongoing basis in order to ensure BSP complies with certain specific bank covenants. The Company has not made any such injections since the fiscal year ended October 31, 2010.
F-74
13. FINANCIAL INSTRUMENTS, FAIR VALUE AND RISK MANAGEMENT
Categories of financial assets and liabilities
The carrying values of the Company’s financial instruments, including those held for sale on the consolidated balance sheets are classified into the following categories:
| As of October 31, | 2014 | 2013 | ||||
| $ | $ | |||||
| Held-for-trading(1) | 86.5 | 64.1 | ||||
| Loans and receivables(2) | 334.9 | 167.2 | ||||
| Other financial liabilities(3) | 2,455.1 | 830.5 | ||||
| Derivatives designated as effective hedges(4)—loss | 6.9 | 4.2 | ||||
| Other derivatives(5) | 0.5 | 0.2 | ||||
| Available-for-sale(6) | 1.5 | — | ||||
(1) Includes cash and cash equivalents in bank accounts bearing interest rates up to 1% as well as held for trading investments of $1.9 million and $2.5 million related to the Company’s US deferred compensation plan as of October 31, 2014 and 2013, respectively, which is invested in mutual funds and common/collective trusts measured at net asset value.
(2) Includes accounts receivable, net of an allowance for doubtful accounts of $2.8 million and $1.8 million at October 31, 2014 and 2013, respectively.
(3) Includes short-term borrowings, accounts payable, accrued liabilities and long-term debt.
(4) Includes the Company’s forward contracts and collars in fiscal 2014 and fiscal 2013.
(5) Includes the contingent consideration receivable related to the Burlington sale.
(6) Includes Republic of Austria bonds obtained as a part of the DPP Acquisition.
The Company has determined the estimated fair values of its financial instruments based on appropriate valuation methodologies; however, considerable judgment is required to develop these estimates. The fair values of the Company’s financial instruments are not materially different from their carrying values.
Fair value measurements
The Company classifies and discloses its fair value measurements using a fair value hierarchy that reflects the significance of the inputs used in making the measurements. The fair value hierarchy has the following levels: (a) quoted prices (unadjusted) in active markets for identical assets or liabilities (Level 1); (b) inputs other than quoted prices included in Level 1 that are observable for the asset or liability, either directly (i.e., as prices) or indirectly (i.e., derived from prices) (Level 2); and (c) inputs for the asset or liability that are not based on observable market data (unobservable inputs) (Level 3).
The fair value is principally applied to financial assets and liabilities such as derivative instruments consisting of foreign exchange forward contracts and collars and investments classified as available-for-sale or trading. The following table provides a summary of the financial assets and liabilities that are measured at fair value as of October 31, 2014 and 2013:
| Assets measured at fair value | Fair value measurement at October 31, 2014 using: |
Fair value measurement at October 31, 2013 using: |
||||||||||||||||||||||
| Level 1 | Level 2 | Level 3 | Total | Level 1 | Level 2 | Level 3 | Total | |||||||||||||||||
| $ | $ | $ | $ | $ | $ | $ | $ | |||||||||||||||||
| Contingent consideration receivable | — | — | 0.5 | 0.5 | — | — | 0.2 | 0.2 | ||||||||||||||||
| Available-for-sale securities | 1.5 | — | — | 1.5 | — | — | — | — | ||||||||||||||||
| Held-for-trading securities | — | 1.9 | — | 1.9 | — | 2.5 | — | 2.5 | ||||||||||||||||
| Total assets | 1.5 | 1.9 | 0.5 | 3.9 | — | 2.5 | 0.2 | 2.7 | ||||||||||||||||
F-75
| Liabilities measured at fair value | Fair value measurement at October 31, 2014 using: |
Fair value measurement at October 31, 2013 using: |
||||||||||||||||||||||
| Level 1 | Level 2 | Level 3 | Total | Level 1 | Level 2 | Level 3 | Total | |||||||||||||||||
| $ | $ | $ | $ | $ | $ | $ | $ | |||||||||||||||||
| Derivatives designated as hedging instruments: |
||||||||||||||||||||||||
| Foreign exchange forward contracts | — | 6.9 | — | 6.9 | — | 3.4 | — | 3.4 | ||||||||||||||||
| Foreign exchange collars | — | — | — | — | — | 0.8 | — | 0.8 | ||||||||||||||||
| Total liabilities | — | 6.9 | — | 6.9 | — | 4.2 | — | 4.2 | ||||||||||||||||
The following table presents the fair value of the Company’s derivative financial instruments and their classifications on the consolidated balance sheets as of October 31, 2014 and October 31, 2013:
| Fair values of derivative instruments and investments: |
Asset derivatives as of October 31, 2014 |
Asset derivatives as of October 31, 2013 |
||||||||||
| Balance sheet location | Fair value |
Balance sheet location | Fair value |
|||||||||
| $ | $ | |||||||||||
| Derivatives designated as hedging instruments: |
||||||||||||
| Contingent consideration receivable | Accounts receivable, net | 0.5 | Accounts receivable, net | 0.2 | ||||||||
| Investments: |
||||||||||||
| Available-for-sale securities | Investments | 1.5 | Investments | — | ||||||||
| Held-for-trading securities | Investments | 1.9 | Investments | 2.5 | ||||||||
| Investments Total | 3.4 | 2.5 | ||||||||||
Liability derivatives as of October 31, 2014 |
Liability derivatives as of October 31, 2013 |
|||||||||||
| Balance sheet location | Fair value |
Balance sheet location | Fair value |
|||||||||
| $ | $ | |||||||||||
| Derivatives designated as hedging instruments: |
||||||||||||
| Foreign exchange forward contracts | Accounts payable and accrued liabilities | 5.9 | Accounts payable and accrued liabilities | 2.6 | ||||||||
| Foreign exchange forward contracts | Other long-term liabilities | 1.0 | Other long-term liabilities | 0.8 | ||||||||
| Foreign exchange collars | Accounts payable and accrued liabilities | — | Accounts payable and accrued liabilities | 0.8 | ||||||||
| Total designated derivatives | 6.9 | 4.2 | ||||||||||
On August 31, 2012, the Company completed the sale of its global secondary clinical packaging and clinical distribution services business to Bellwyck Packaging Solutions. The total consideration for the sale of this business was approximately $2.7 million, of which $1.35 million was paid in cash at closing and $1.35 million was to be paid in 24 months from the closing date if certain revenue targets were met by the new owner. The Company received the final amount on the earnout target of $0.5 million in November 2014. The value of the earn-out as of October 31, 2014 was adjusted to be equal to the amount of the final payout.
F-76
The following is a summary of goodwill and indefinite-lived intangible asset impairments that were recorded in fiscal 2014 and 2013:
| Goodwill and indefinite-lived intangible impairment table |
2014 | 2013 | Valuation Technique |
Input levels | Reference | ||||
| $ | $ | ||||||||
| In-process research and development impairments | 9.7 | 1.3 | Income approach | Level 3 | Note 5 | ||||
| Biosolutions goodwill impairment | 1.3 | — | Income approach | Level 3 | Note 4 | ||||
| Total goodwill and indefinite-lived intangible assets impaired | 11.0 | 1.3 | |||||||
As of October 31, 2014, the fair values and carrying values of the Company’s long-term debt, including the current portion of long-term debt, are categorized in the table below:
Fair Value |
|||||||||||||||
| Liabilities: | Level 1 | Level 2 | Level 3 | Level 4 | Carrying Value | ||||||||||
| $ | $ | $ | $ | $ | |||||||||||
| Long-term debt, including current portion | — | 1,994.0 | — | 1,994.0 | 1,998.1 | ||||||||||
As of October 31, 2013, the fair values and carrying values of the Company’s long-term debt, including the current portion of long-term debt, are categorized in the table below:
Fair Value |
|||||||||||||||
| Liabilities: | Level 1 | Level 2 | Level 3 | Level 4 | Carrying Value | ||||||||||
| $ | $ | $ | $ | $ | |||||||||||
| Long-term debt, including current portion | — | 629.7 | — | 629.7 | 606.0 | ||||||||||
The fair value of the Company’s long-term debt, including the current portion of long-term debt, is based on the quoted market prices for the same issues or on the current rates offered for debt of similar remaining maturities.
Foreign exchange forward contracts and other hedging arrangements
The Company utilizes financial instruments to manage the risk associated with fluctuations in foreign exchange and interest rates. The Company formally documents all relationships between hedging instruments and hedged items, as well as its risk management objective and strategy for undertaking various hedge transactions. The below forward and collar hedges are designated as cash flow hedges under ASC 815 Derivatives and Hedging.
As of October 31, 2014, the Company’s Canadian operations had entered into foreign exchange forward contracts to sell an aggregate amount of US $123.3 million. These contracts hedge the Canadian operations’ expected exposure to U.S. dollar denominated receivables and mature at the latest on July 6, 2016, at an average exchange rate of $1.0701 Canadian. The mark-to-market value of these financial instruments as of October 31, 2014 was an unrealized loss of $6.9 million, which has been recorded in accumulated other comprehensive income in members’/shareholders’ deficit, net of associated income tax.
As of October 31, 2014, all of the Company’s Canadian operations’ foreign exchange collars had matured.
As of October 31, 2013, the Company’s Canadian operations had entered into foreign exchange forward contracts to sell an aggregate amount of US $106.3 million. These contracts hedge the Canadian operations’ expected exposure to U.S. dollar denominated cash flows and mature at the
F-77
latest on July 2, 2015, at an average exchange rate of $1.0162 Canadian. The mark-to-market value of these financial instruments as of October 31, 2013 was an unrealized loss of $3.4 million, which has been recorded in accumulated other comprehensive income in shareholders’ equity, net of associated income tax.
As of October 31, 2013, the Company’s Canadian operations had entered into foreign exchange collars to sell an aggregate amount of US $24.2 million. These contracts hedge the Canadian operations’ expected exposure to U.S. dollar denominated cash flows and mature at the latest on July 2, 2014, at an average exchange rate of $0.9938 Canadian. The mark-to-market value of these financial instruments as of October 31, 2013 was an unrealized loss of $0.8 million, which has been recorded in accumulated other comprehensive income in shareholders’ equity, net of associated income tax.
Risks arising from financial instruments and risk management
The Company’s activities expose it to a variety of financial risks: market risk (including foreign exchange and interest rate), credit risk and liquidity risk. The Company’s overall risk management program focuses on the unpredictability of financial markets and seeks to minimize potential adverse effects on the Company’s financial performance. The Company uses derivative financial instruments to hedge certain risk exposures. The Company does not purchase any derivative financial instruments for speculative purposes.
Financial risk management is the responsibility of the Company’s corporate finance team. The corporate finance team works with the Company’s operational personnel to identify, evaluate and, where appropriate, hedge financial risks. The Company’s corporate finance team also monitors material risks and discusses them with the Audit Committee of the Board.
Foreign exchange risk
As of October 31, 2014, the Company operated in Canada, the United States, Italy, France, the United Kingdom, The Netherlands, Australia, Germany, Austria, Mexico and Japan. Foreign exchange risk arises because the value of the local currency receivable or payable for transactions denominated in foreign currencies may vary due to changes in exchange rates (“transaction exposures”) and because the non-U.S. dollar denominated financial statements of the Company may vary on consolidation into the reporting currency of U.S. dollars (“translation exposures”).
The Company’s most significant transaction exposures arise in its Canadian operations. Approximately 90% of the revenues of the Canadian operations and approximately 10% of its operating expenses are transacted in U.S. dollars. As a result, the Company may experience transaction exposures because of volatility in the exchange rate between the Canadian and U.S. dollar. Based on the Company’s current U.S. denominated net inflows, as of October 31, 2014, fluctuations of +/-10% would, everything else being equal, have an effect on (loss) income before income taxes of approximately +/- $19.1 million, prior to hedging activities.
The objective of the Company’s foreign exchange risk management activities is to minimize transaction exposures and the resulting volatility of the Company’s earnings. The Company manages this risk by entering into foreign exchange contracts. As of October 31, 2014, the Company has entered into foreign exchange contracts to cover approximately 81% of its Canadian-U.S. dollar cash flow exposures for fiscal 2015.
As of October 31, 2014, the Company has designated its €320.0 million of Euro denominated debt (further discussed in Note 8) as a hedge against its net investment in its subsidiaries in Austria, The Netherlands, Germany, France and Italy. This hedge was designated at the time of the DPP Acquisition and the related refinancing that occurred on March 11, 2014 and is re-designated on a quarterly basis. Exchange gains of $33.0 million as of October 31, 2014 arising from this debt, from the date so designated, are recorded in accumulated other comprehensive income (loss) in members’/shareholders’ (deficit) equity.
Translation gains and losses related to certain foreign currency denominated intercompany loans are included as part of the net investment in certain foreign subsidiaries, and are included in accumulated other comprehensive income (loss) in members’/shareholders’ equity.
F-78
Credit risk
Credit risk arises from cash and cash equivalents held with banks and financial institutions, derivative financial instruments (foreign exchange contracts with positive fair values), and credit exposure to customers, including outstanding accounts receivable. The maximum exposure to credit risk is equal to the carrying value of the financial assets.
The objective of managing counterparty credit risk is to prevent losses in financial assets. The Company regularly assesses the credit quality of the counterparties, taking into account their financial position, past experience and other factors. Management also regularly monitors the utilization of credit limits. In cases where the credit quality of a customer does not meet the Company’s requirements, a cash deposit is received before any services are provided. As of October 31, 2014 and October 31, 2013, the Company held deposits of $12.6 million and $16.7 million, respectively.
Liquidity risk
Liquidity risk arises when financial obligations exceed financial assets available at a particular point in time. The Company’s objective in managing liquidity risk is to maintain sufficient readily available reserves in order to meet its liquidity requirements at all times. The Company mitigates liquidity risk by maintaining cash and cash equivalents on-hand and through the availability of funding from credit facilities. As of October 31, 2014, the Company was holding unrestricted cash and cash equivalents of $84.6 million and had undrawn lines of credit available to it of $208.1 million.
14. INCOME TAXES
The differences between the Company’s consolidated income tax expense (benefit) attributable to continuing operations and the tax expense (benefit) computed at the Dutch statutory income tax rate of 25.0% were as follows:
As of October 31, |
|||||||||
| 2014 | 2013 | 2012 | |||||||
| $ | $ | $ | |||||||
| Expected income tax benefit using statutory tax rates | (28.8 | ) |
(10.4 | ) |
(15.8 | ) |
|||
| Change in valuation allowance | 66.6 | 19.9 | 56.9 | ||||||
| Permanent differences and other: |
|||||||||
| Foreign | 3.2 | (4.3 | ) |
3.4 | |||||
| Domestic | (15.6 | ) |
(5.5 | ) |
(2.1 | ) |
|||
| Foreign rate differentials | (21.5 | ) |
(5.4 | ) |
1.5 | ||||
| Other | 0.2 | 0.2 | (0.2 | ) |
|||||
| Provision for (benefit from) income taxes | 4.1 | (5.5 | ) |
43.7 | |||||
| Effective tax rate | (3.6 | )% |
13.3 | % |
(69.4 | )% |
|||
Permanent foreign differences reconciling expected income tax expense using statutory tax rates to the provision for income taxes were primarily non-deductible transaction costs, recording research and development investment tax credits, employee costs, salary and benefits that are not deductible in Italy, France, Canada and the United States and meals and entertainment costs. Other differences are due to the book versus tax treatment of foreign exchange in Canada resulting from the change in functional currency of the Company’s corporate division in Canada to U.S. dollars (as previously disclosed). Domestic differences related to non-deductible transaction costs and book versus tax treatment of foreign exchange resulting in the difference of the functional currency being other than reporting currency and non-deductible benefits.
F-79
The tax effects of significant items comprising the Company’s net deferred income tax assets and liabilities are as follows:
| 2014 | 2013 | |||||
| $ | $ | |||||
| Net operating loss carry-forward | 188.0 | 31.0 | ||||
| Accounting provisions not currently deductible for tax purposes | 33.6 | 26.3 | ||||
| Unrealized foreign exchange losses (gains) on debt | 15.1 | 3.0 | ||||
| Deferred financing costs | 10.7 | 4.5 | ||||
| Deferred revenue | 13.0 | 11.1 | ||||
| Unclaimed R&D expenditures | 15.8 | 17.4 | ||||
| Investment tax credits and other credits | 29.1 | 27.9 | ||||
| Other | 11.6 | 0.3 | ||||
| Tax depreciation in excess of book depreciation | (21.0 | ) |
(40.0 | ) |
||
| Valuation allowance | (282.7 | ) |
(93.0 | ) |
||
| Purchased intangibles | (42.2 | ) |
(26.5 | ) |
||
(29.0 | ) |
(38.0 | ) |
|||
The short-term and long-term deferred income tax assets and liabilities after netting are as follows:
| 2014 | 2013 | |||||
| $ | $ | |||||
| Short-term deferred income tax assets | 21.6 | 6.9 | ||||
| Long-term deferred income tax assets | 3.4 | 0.1 | ||||
| Short-term deferred income tax liabilities | (1.2 | ) |
(0.1 | ) |
||
| Long-term deferred income tax liabilities | (52.8 | ) |
(44.9 | ) |
||
(29.0 | ) |
(38.0 | ) |
|||
The Company has tax-effected net operating losses, consisting of federal, state and foreign, of $192.0 million; $148.6 million of the losses have an indefinite life and $43.4 million have expiry dates ranging from October 31, 2018 to October 31, 2034. The Company has tax credits of $42.4 million with expiry dates beginning October 31, 2017. As a result of certain realization requirements of ASC 718, the table of deferred tax assets and liabilities does not include certain deferred tax assets as of October 31, 2014 that arose directly from tax deductions related to the equity compensation that are greater than the compensation recognized for financial statement purposes. The company will use ASC 740 in determining when excess tax benefits are to be realized.
The Company has not recorded deferred tax liabilities on the unremitted earnings of foreign subsidiaries as the Netherlands currently intends to reinvest these earnings in its foreign operations indefinitely. Under Dutch tax laws, the Company’s unremitted earnings from its foreign subsidiaries are exempt from income tax but may be subject to withholding tax at the source upon distribution. Determination of this withholding tax liability is not practicable.
Valuation allowances are provided to reduce the related deferred income tax assets to an amount which will, more likely than not, be realized. In the current year, the Company determined that it is more likely than not that a portion of its tax assets in the Netherlands, Mexico and United States will not be realized and therefore required a valuation allowance against them. The Company also determined that a portion of its Austrian and German tax assets will not be realized and adjusted goodwill accordingly. Additionally, as a result of the DPP Acquisition, the Company received deferred assets in certain jurisdictions that were already fully valued. The net effect was an increase to the valuation allowance on the Company’s tax assets.
The Company evaluates uncertain tax positions on a quarterly basis and consider various factors, including, but not limited to, changes in tax law, the measurement of tax positions taken or expected to be taken in tax returns, the effective settlement of matters subject to audit,
F-80
information obtained during in process audit activities and changes in facts or circumstances related to a tax position. The Company also accrues for potential interest and penalties related to unrecognized tax benefits within the provision for (benefit from) income taxes.
As of October 31, 2014 and 2013, unrecognized tax benefits were $10.0 million and $8.2 million, respectively. The increase is primarily related to assets acquired in the Banner Acquisition and timing of certain deductions in various jurisdictions. At October 31, 2014 and 2013, unrecognized tax benefits of $0.0 million and $3.0 million, respectively, related to permanent income tax differences, will have a favorable effect on the Company’s effective tax rate if recognized; the remaining balance would result in a reclassification on the Company’s consolidated balance sheet.
The Company classifies interest recognized under ASC 740 as a component of interest expense in the consolidated statements of operations. Penalties, if incurred, are recorded as other operating expenses in the consolidated statements of operations. The Company recorded no material amount of interest or penalty expense under ASC 740 for fiscal 2014 and 2013.
During 2013, the Company was notified by the Canada Revenue Agency that there will be an income tax audit of the 2011 and 2012 years. This audit is still ongoing as of October 31, 2014. During 2014, the authorities also initiated an audit of the Scientific Research and Experimental Development investment tax credits claimed in the 2012 tax year. The audit was not concluded as of the end of 2014.
During fiscal 2013, the U.S. Internal Revenue Service initiated an audit of the Company’s consolidated October 31, 2011 tax year. The file was closed in 2013 with no adjustments to taxable income. During fiscal 2013, the U.S. Internal Revenue Service initiated examination of Banner’s December 31, 2011 U.S. federal income tax returns. The file was closed in 2014 with no adjustments to taxable income.
During fiscal 2012, the U.S Internal Revenue Service conducted a desk review of the U.S. federal income tax return for the company related to the Company’s October 31, 2010 tax year as a result of a net operating loss carry-back. There were no adjustments proposed and the case was under review by the Joint Committee on Taxation. In fiscal 2013, the Joint Committee on Taxation accepted the findings of the Internal Revenue Service.
During fiscal 2014, the Italian Revenue Service initiated examination of Patheon Italia S.p.A’s 2010-2013 income tax returns. The audit was not concluded as of the end of 2014.
Statutes related to foreign and state jurisdictions are open from October 31, 2009 to October 31, 2014. Certain carry forward tax attributes generated in prior years remain subject to examination and adjustment.
During the next 12 months, the Company expects no material change in the total amount of unrecognized tax benefits. A reconciliation of the beginning and ending amounts of the tax reserves is as follows:
| Balance at October 31, 2011 | $ | 0.8 | |
| Changes in tax positions taken in the current year | — | ||
| Balance at October 31, 2012 | $ | 0.8 | |
| Increase related to tax positions taken in a prior year | 3.0 | ||
| Decrease based on tax positions taken in a prior year | (0.1 | ) |
|
| Increase based on tax positions taken in the current year | 4.6 | ||
| Reductions related to lapse of applicable statute of limitations | (0.1 | ) |
|
| Balance at October 31, 2013 | $ | 8.2 | |
| Increase based on tax positions taken in the current year | 2.2 | ||
| Reductions related to lapse of applicable statute of limitations | (0.4 | ) |
|
| Balance at October 31, 2014 | $ | 10.0 |
F-81
Below is a breakout of the Company’s loss from continuing operations before income taxes and applicable provision for (benefit from) income taxes:
Years ended October 31, |
|||||||||
| 2014 | 2013 | 2012 | |||||||
| $ | $ | $ | |||||||
| Loss from continuing operations before income taxes |
|||||||||
| Domestic | (97.5 | ) |
(30.1 | ) |
(15.2 | ) |
|||
| Foreign | (17.6 | ) |
(11.3 | ) |
(47.8 | ) |
|||
(115.1 | ) |
(41.4 | ) |
(63.0 | ) |
||||
Years ended October 31, |
|||||||||
| 2014 | 2013 | 2012 | |||||||
| $ | $ | $ | |||||||
| Provision for (benefit from) income taxes |
|||||||||
| Domestic - Current | 0.5 | — | — | ||||||
| Domestic - Deferred | 0.2 | — | 34.9 | ||||||
| Foreign - Current | 20.3 | 8.7 | 9.2 | ||||||
| Foreign - Deferred | (16.9 | ) |
(14.2 | ) |
(0.4 | ) |
|||
4.1 | (5.5 | ) |
43.7 | ||||||
15. SEGMENT INFORMATION
An operating segment is a component of the Company (a) that engages in business activities from which it may earn revenues and incur expenses, (b) whose operating results are regularly reviewed by the Company’s chief operating decision maker (our Chief Executive Officer) to make decisions about resources to be allocated to the segment and to assess its performance, and (c) for which discrete financial information is available.
The Company’s seven operating segments are: North America DPS, Europe DPS, PDS, DSS, DFC, BLS and Biosolutions. The North America DPS, and Europe DPS operating segments met the aggregation criteria to be presented as one DPS reportable segment. As a result, the Company has determined it has four reportable segments: DPS, PDS, DSS and DFC. The DPS, PDS and DSS operating segments comprise the Patheon business unit, the DFC segment comprises the DPx Fine Chemicals business unit. BLS, Biosolutions, and Corporate are not individually reportable segments since the quantitative thresholds have not been met and, as such, have been reported in Other.
The DPS segment includes commercial manufacturing outsourcing services, and the PDS segment includes pharmaceutical development services. The DSS segment includes active pharmaceutical ingredients and pharmaceutical intermediates. DFC includes agricultural and crop protection chemicals focused on custom synthesis aimed at pharmaceutical and fine chemicals markets, and production of maleic anhydride and derivatives. The BLS business includes activities in connection with the research and development, in-licensing, out-licensing and commercialization of innovative formulation technologies, as well as the marketing of prescription, over the counter and nutritional proprietary products. Biosolutions produces products manufactured from microbial fermentation, including many types of anti-infectives, enzymes and pharmaceutical and non-pharmaceutical proteins. Corporate expenses primarily relate to general, administrative and sales and marketing expenses related to the corporate organization. These expenses are recorded in unallocated corporate expenses as these items are centrally directed and controlled and are not included in internal measures of segment operating performance. The CODM does not evaluate its operating segments using discrete asset information.
F-82
As of and for the year ended October 31, 2014 |
|||||||||||||||||||||
| DPS | PDS | DSS | DFC | Other | Intersegment Eliminations |
Total | |||||||||||||||
| $ | $ | $ | $ | $ | $ | $ | |||||||||||||||
| Revenues | 1,115.9 | 165.2 | 188.9 | 167.8 | 157.3 | (90.3 | ) |
1,704.8 | |||||||||||||
| Adjusted EBITDA | 231.2 | 51.2 | 3.2 | 31.9 | (44.1 | ) |
— | 273.4 | |||||||||||||
| Depreciation and amortization | 58.2 | 4.0 | 15.1 | 6.9 | 8.7 | — | 92.9 | ||||||||||||||
| Impairment charge | 4.3 | — | — | — | 17.8 | — | 22.1 | ||||||||||||||
| Capital expenditures | 66.3 | 9.3 | 3.1 | 7.4 | 6.5 | — | 92.6 | ||||||||||||||
As of and for the year ended October 31, 2013 |
|||||||||||||||||||||
| DPS | PDS | DSS | DFC | Other | Intersegment Eliminations |
Total | |||||||||||||||
| $ | $ | $ | $ | $ | $ | $ | |||||||||||||||
| Revenues | 839.2 | 147.6 | — | — | 111.1 | (78.2 | ) |
1,019.7 | |||||||||||||
| Adjusted EBITDA | 138.9 | 40.5 | — | — | (34.5 | ) |
— | 144.9 | |||||||||||||
| Depreciation and amortization | 43.0 | 3.9 | — | — | 1.7 | — | 48.6 | ||||||||||||||
| Impairment charge | 11.8 | — | — | — | 1.3 | — | 13.1 | ||||||||||||||
| Capital expenditures | 45.4 | 4.3 | — | — | 0.1 | — | 49.8 | ||||||||||||||
As of and for the year ended October 31, 2012 |
|||||||||||||||||||||
| DPS | PDS | DSS | DFC | Other | Intersegment Eliminations |
Total | |||||||||||||||
| $ | $ | $ | $ | $ | $ | $ | |||||||||||||||
| Revenues | 609.6 | 138.4 | — | — | — | — | 748.0 | ||||||||||||||
| Adjusted EBITDA | 92.2 | 30.7 | — | — | (35.7 | ) |
— | 87.2 | |||||||||||||
| Depreciation and amortization | 35.2 | 4.9 | — | — | 0.9 | — | 41.0 | ||||||||||||||
| Impairment charge | 55.1 | 2.8 | — | — | — | — | 57.9 | ||||||||||||||
| Capital expenditures | 47.3 | 4.7 | — | — | 1.4 | — | 53.4 | ||||||||||||||
The Company accounts for inter-segment sales between DPS and BLS at cost plus a specified mark-up.
During fiscal 2014, as a result of the annual impairment testing of indefinite-lived intangible assets (IPR&D), the Company incurred impairment losses of $9.7 million, stemming from changes in market factors and expected commercialization timing; $5.4 million related to BLS IPR&D and $4.3 million is related to Greenville commercial IPR&D. In addition the Company impaired its Biosolutions business unit capital assets, intangible assets and goodwill by $12.4 million (see Note 4 for further discussion).
In fiscal 2013, the Company announced the closure of its Olds, Canada facility and recorded impairment charges of $11.8 million to its DPS segment. Additionally, during fiscal 2013 the DPS segment recorded product returns from the packaging site and inventory write-offs of $6.1 million, related to a manufacturing problem at Banner due to a change in raw materials and operational processes qualified prior to the acquisition that did not perform as expected, which are reflected in gross profit in the consolidated statements of operations. In regard to the BLS segment, the Company impaired certain IPR&D projects resulting in a charge of $1.3 million in fiscal 2013.
In fiscal 2012, the Company, recorded impairment charges of $57.9 million related to its Swindon facility.
The Company evaluates the performance of its segments based on segment Adjusted EBITDA. The Company’s Adjusted EBITDA is income (loss) from continuing operations before repositioning expenses, interest expense, foreign exchange losses reclassified from other comprehensive income (loss), refinancing expenses, acquisition and integration costs (including certain product returns and inventory write-offs recorded in gross profit), gains and losses on sale of capital assets, income
F-83
taxes, impairment charges, depreciation and amortization, stock-based compensation expense, consulting costs related to our operational initiatives, purchase accounting adjustments, acquisition-related litigation expenses and other income and expenses. “Adjusted EBITDA margin” is Adjusted EBITDA as a percentage of revenues. The Company’s presentation of Adjusted EBITDA may not be comparable to similarly-titled measures used by other companies and is not equivalent to “Consolidated EBITDA” as defined in the Credit Agreement (as discussed in Note 8).
Below is a reconciliation of Adjusted EBITDA to its closest U.S. GAAP measure.
Fiscal years ended October 31, |
|||||||||
| 2014 | 2013 | 2012 | |||||||
| $ | $ | $ | |||||||
| Total Adjusted EBITDA | 273.4 | 144.9 | 87.2 | ||||||
| Depreciation and amortization | (92.9 | ) |
(48.6 | ) |
(41.0 | ) |
|||
| Repositioning expenses | (53.5 | ) |
(15.8 | ) |
(6.1 | ) |
|||
| Acquisition and integration costs | (60.4 | ) |
(20.2 | ) |
(3.2 | ) |
|||
| Interest expense, net | (90.4 | ) |
(47.8 | ) |
(26.5 | ) |
|||
| Impairment charge | (22.1 | ) |
(13.1 | ) |
(57.9 | ) |
|||
| Gain (loss) on sale of capital assets | 0.1 | 1.3 | (0.4 | ) |
|||||
| (Provision for) benefit from income taxes | (4.1 | ) |
5.5 | (43.7 | ) |
||||
| Refinancing expenses | (28.2 | ) |
(27.3 | ) |
— | ||||
| Operational initiatives related consulting costs | (10.1 | ) |
(2.3 | ) |
(13.3 | ) |
|||
| Acquisition-related litigation expenses | (10.2 | ) |
(6.4 | ) |
— | ||||
| Stock-based compensation expense | (10.0 | ) |
(3.2 | ) |
(3.1 | ) |
|||
| Purchase accounting adjustments | (11.8 | ) |
(5.0 | ) |
— | ||||
| Other | 1.0 | 2.1 | 1.3 | ||||||
| Net loss from continuing operations | (119.2 | ) |
(35.9 | ) |
(106.7 | ) |
|||
As illustrated in the table below, revenues are attributed to countries based on the location of the customer’s billing address, capital assets are attributed to the country in which they are located and goodwill is attributed to the country in which the entity to which the goodwill pertains is located:
As of and for the year ended October 31, 2014 |
|||||||||||||||
| Canada | US* | Europe | Other** | Total | |||||||||||
| $ | $ | $ | $ | $ | |||||||||||
| Revenues | 28.8 | 948.2 | 617.0 | 110.8 | 1,704.8 | ||||||||||
| Capital assets | 106.7 | 395.3 | 391.6 | 29.4 | 923.0 | ||||||||||
| Impairment | — | 9.7 | 12.4 | — | 22.1 | ||||||||||
| Goodwill | 3.1 | 155.7 | 6.5 | 5.5 | 170.8 | ||||||||||
| Intangible assets | — | 225.8 | 23.3 | 7.9 | 257.0 | ||||||||||
* Includes Puerto Rico
** Includes Mexico, Other Latin America, Asia, and Australia.
As of and for the year ended October 31, 2013 |
|||||||||||||||
| Canada** | US* | Europe | Other*** | Total | |||||||||||
| $ | $ | $ | $ | $ | |||||||||||
| Revenues | 21.9 | 603.9 | 333.5 | 60.4 | 1,019.7 | ||||||||||
| Capital assets | 116.3 | 181.7 | 192.6 | 7.5 | 498.1 | ||||||||||
| Impairment | 11.8 | 1.3 | — | — | 13.1 | ||||||||||
| Goodwill | 3.3 | 35.1 | 7.0 | 3.1 | 48.5 | ||||||||||
| Intangible assets | 1.0 | 48.0 | 12.2 | 8.0 | 69.2 | ||||||||||
* Includes Puerto Rico
** Canada assets reflect the fiscal 2013 impairment of Olds, Canada assets.
*** Includes Mexico
F-84
As of and for the year ended October 31, 2012 |
|||||||||||||||
Canada |
US* |
Europe |
Other |
Total |
|||||||||||
| $ | $ | $ | $ | $ | |||||||||||
| Revenues | 13.7 | 433.0 | 259.3 | 42.0 | 748.0 | ||||||||||
| Capital assets | 115.4 | 145.9 | 155.2 | 1.5 | 418.0 | ||||||||||
| Impairment | — | — | 57.9 | — | 57.9 | ||||||||||
| Goodwill | 3.5 | — | — | — | 3.5 | ||||||||||
* Includes Puerto Rico
During fiscal 2014 and 2013, the Company did not have any one customer that accounted for more than 10% of its total revenues. During fiscal 2012, the Company had one customer that accounted for approximately 11% of total revenues.
16. COMMITMENTS AND CONTINGENCIES
Operating leases
The Company has entered into long-term rental agreements expiring at various dates until 2023. The future rental payments for the next five years and thereafter are estimated as follows:
| $ | |||
| 2015 | 8.8 | ||
| 2016 | 6.5 | ||
| 2017 | 4.4 | ||
| 2018 | 3.8 | ||
| 2019 | 3.1 | ||
| Thereafter | 5.2 | ||
| Total payments | 31.8 | ||
The Company’s total rental expenses related to its operating leases for fiscal 2014, 2013 and 2012 periods were $12.7 million, $9.4 million and $7.5 million respectively.
Management long-term incentive plan
Also on March 11, 2014, the Company adopted the Management Long-Term Incentive Plan (the “LTIP”) to provide long-term incentives to select key management employees of Patheon Holdings and its subsidiaries who have contributed and are expected to contribute materially to the success of the Company, and to reward outstanding performance by such employees. Leadership, key positions or identified key talent may be invited to participate in the LTIP during an identified plan year. Compensation is payable under this plan upon an Exit Event by the controlling investors of the Company (JLL and DSM), if the participant is still employed by the Company, or a qualifying termination, as defined.
Not later than 90 days following commencement of each applicable Company fiscal year that would end during the term of the LTIP, the Compensation Committee will determine, in its sole and absolute discretion, with respect to such fiscal year, (i) the Participants (as defined in the LTIP) with respect to that fiscal year, (ii) the EBITDA Target (as defined in the LTIP), and (iii) the targeted amount of each Award. Each award shall be evidenced by a written notice and shall be deemed granted on the first day of the fiscal year with respect to which the Compensation Committee resolves to grant such award (the “Grant Date”). Awards are denominated as a percentage of the Participant’s base salary, with the target percentage based on the Participant’s level within the organization, as determined by the Compensation Committee in its sole and absolute discretion. All awards will be paid in the form of cash, or other property having a value equal to such cash payment, as determined by the Compensation Committee in its sole and absolute discretion.
Under the LTIP the Company granted $6.3 million in awards during fiscal 2014, all of which vest over a five-year period. The Company did not report any compensation expense for the LTIP during fiscal 2014 as this plan becomes payable only as a result of an event which is deemed to not be probable until the occurrence of the event.
F-85
Contingencies
On December 10, 2012, Procaps S.A. (“Procaps”) filed a complaint against Patheon Inc., a subsidiary of Patheon Holdings (“Patheon”), in the United States District Court for the Southern District of Florida (Case No. 12-cv-24356-DLG). The complaint involves Patheon’s collaboration agreement with Procaps, pursuant to which both companies agreed to work together with respect to the marketing of a line of certain prescription pharmaceutical soft-gel development and manufacturing services. Procaps alleges that Patheon’s acquisition of Banner, a business that historically has generated less than 10% of its revenues from softgel services for prescription pharmaceuticals, transformed the collaboration agreement into an anticompetitive restraint of trade and an agreement between direct competitors to set prices, divide markets and/or allocate geographic territories. Procaps seeks (i) a declaratory judgment that the collaboration agreement must cease and/or terminate; (ii) an injunction requiring that Patheon divest all of Banner’s soft-gel manufacturing capabilities; and (iii) monetary damages under federal and state antitrust and unfair competition laws, including treble damages for violations of the Sherman Act. Patheon subsequently answered Procaps’ complaint and filed its affirmative defenses to the complaint. In July 2014, upon Motion for Summary Judgment by Patheon, the court dismissed Procaps’ unfair competition claims, leaving only the antitrust claims in dispute. The trial will likely not commence until late 2015 at the earliest.
The Company has not included any accrual in the consolidated financial statements as of October 31, 2014 related to this matter as a result of its assessment that the likelihood of a material loss in connection with the matter is not probable. Due to the early stage of the lawsuit, an estimate of the potential damages or range of damages cannot be made at this time. However, an adverse outcome in this matter could have a material adverse effect on the Company’s business, results of operations and financial condition.
One putative class action is pending in the United States against the Company and one of its customers in connection with the recall of certain lots of allegedly defective products manufactured by the Company for the customer. The customer has given the Company notice of its intent to seek indemnification from the Company for all damages, costs and expenses, pursuant to the manufacturing services agreement between the customer and the Company. As this case is at an early stage, the Company is unable to estimate the number of potential damages for which the Company may be directly or indirectly liable.
Other
The Company may be subject to lawsuits, investigations and other claims, including environmental, labor, product, customer disputes and other matters in the normal course of operations and otherwise. The Company believes that adequate provisions have been recorded in its consolidated financial statements where required. Although it is not possible to estimate the extent of potential costs, if any, the Company believes that the ultimate resolution of such contingencies will not have a material adverse impact on its results of operations, financial position or liquidity.
The Company’s tax filings are subject to audit by taxation authorities. Although the Company believes that it has adequately provided for income taxes based on the information available, the outcome of audits cannot be known with certainty and the potential impact on the financial statements is not determinable.
17. REPOSITIONING EXPENSES
During fiscal 2014, the Company incurred $53.5 million in repositioning expenses, which related to DPP integration initiatives, the shutdown of the Venlo and Caguas facilities, outsourcing of certain back-office support functions and other operational initiatives. During fiscal 2013, the Company incurred $15.8 million in repositioning expenses, which related to Banner synergy initiatives; the plan of termination the Company announced on May 9, 2012 (the “Plan of Termination”), which is discussed below; restructuring initiatives at the Bourgoin, France facility; and the shutdown of the Caguas facility. During fiscal 2012, the company incurred $6.1 million in repositioning expense which related to the Plan of Termination, as defined below, and the shutdown of the Caguas facility.
F-86
On July 2, 2014, the Company announced it intends to close its facility in Venlo, The Netherlands dependent on works council and trade union approvals. The Company plans to wind down the facility’s operations by early calendar 2015 and any remaining production will be transferred to other Patheon Holdings facilities. Because the business in the Venlo facility is being transferred within the existing site network, its results of operations will be included in continuing operations in the consolidated financial statements. The company expects to incur approximately $26.2 million in severance for approximately 105 employees and approximately $12.1 million in other shut down related costs, most of which will be paid out over the course of the next fiscal year. The severance expense of $26.2 million and contract termination costs of $6.8 million, a total of $33.0 million, were incurred in fiscal 2014.
On May 9, 2012, the Company announced the Plan of Termination to reduce the Company’s workforce across the Company’s global operations. The Company anticipates that it may further adjust the size of the workforce at the Swindon or other facilities as it continues its transformation process.
The following is a summary of these expenses and other charges associated with operational improvements as of and for the fiscal years ended October 31, 2014 and 2013:
As of and for the year ended October 31, 2014 |
||||||||||||||||||
| DPS | PDS | DSS | DFC | Other | Total | |||||||||||||
| $ | $ | $ | $ | $ | $ | |||||||||||||
| Total repositioning liabilities at October 31, 2013 | 7.7 | |||||||||||||||||
| Employee-related expenses | 13.4 | 0.5 | 27.2 | — | 3.8 | 44.9 | ||||||||||||
| Consulting, professional and project management costs | 1.5 | — | 6.8 | — | 0.3 | 8.6 | ||||||||||||
| Total expenses | 14.9 | 0.5 | 34.0 | — | 4.1 | 53.5 | ||||||||||||
| Repositioning expenses paid, net of liabilities acquired | (12.7 | ) |
||||||||||||||||
| Total repositioning liabilities at October 31, 2014 | 48.5 | |||||||||||||||||
$48.4 million of the total repositioning liabilities as of October 31, 2014 was recorded in accounts payable and accrued liabilities while $0.1 million was recorded in other long-term liabilities on the consolidated balance sheet.
As of and for the year ended October 31, 2013 |
||||||||||||||||||
| DPS | PDS | DSS | DFC | Other | Total | |||||||||||||
| $ | $ | $ | $ | $ | $ | |||||||||||||
| Total repositioning liabilities at October 31, 2012 | 5.5 | |||||||||||||||||
| Employee-related expenses | 9.9 | 1.8 | — | — | 3.8 | 15.5 | ||||||||||||
| Consulting, professional and project management costs | 0.3 | — | — | — | — | 0.3 | ||||||||||||
| Total expenses | 10.2 | 1.8 | — | — | 3.8 | 15.8 | ||||||||||||
| Repositioning expenses paid | (13.6 | ) |
||||||||||||||||
| Total repositioning liabilities at October 31, 2013 | 7.7 | |||||||||||||||||
F-87
As of and for the year ended October 31, 2012 |
||||||||||||||||||
| DPS | PDS | DSS | DFC | Other | Total | |||||||||||||
| $ | $ | $ | $ | $ | $ | |||||||||||||
| Total repositioning liabilities at October 31, 2011 | 6.7 | |||||||||||||||||
| Employee-related expenses | 2.8 | 1.8 | — | — | — | 4.6 | ||||||||||||
| Consulting, professional and project management costs | 1.4 | 0.1 | — | — | — | 1.5 | ||||||||||||
| Total expenses | 4.2 | 1.9 | — | — | — | 6.1 | ||||||||||||
| Repositioning expenses paid | (7.3 | ) |
||||||||||||||||
| Total repositioning liabilities at October 31, 2012 | 5.5 | |||||||||||||||||
Total repositioning liabilities as of October 31, 2013, and 2012 were recorded in accounts payable and accrued liabilities on the consolidated balance sheet.
18. REFINANCING EXPENSES
During fiscal 2014, the Company incurred $28.2 million of refinancing expense comprised of the write-off of the original issue discount on the previous term loan of $7.0 million, payment of bridge financing fees of $7.5 million, $13.7 million related to the write-off of deferred financing costs on the previous term loans and revolving line, and other related charges. In addition, new creditor and third party fees of $60.9 million were capitalized in long-term assets and an original issue discount of $8.5 million related to the new term loans was capitalized and recorded as a reduction to the carrying value of the related debt. Both the capitalized fees and the original issue discount will be amortized to interest expense over the terms of the Credit Agreement and Notes as applicable. Please refer to Note 8 for further information.
During fiscal 2013, the Company incurred $27.3 million of refinancing expense comprised of an early redemption penalty related to the repayment of the Notes ($23.8 million in total, of which $1.9 million was capitalized in long-term assets), and $5.3 million related to the write-off of deferred financing costs on the then outstanding Notes and ABL credit facility and other related charges. In addition, new creditor and third party fees of $22.7 million were capitalized in long term assets and an original issue discount of $17.3 million was capitalized and netted against the carrying value of the related debt. Both the new fees and the original issue discount will be amortized to interest expense over the term of the Credit Agreement. Please refer to Note 8 for further information.
19. SUBSEQUENT EVENTS
On March 4, 2015, the Company announced it reached a definitive agreement to acquire IRIX Pharmaceuticals, a company headquartered in Florence, S.C., that specializes in difficult to manufacture active pharmaceutical ingredient needs for drugs from early and late development, through commercial launch. The Company purchased IRIX for approximately $160.6 million and closed the transaction during the second quarter of fiscal 2015. The Company funded the purchase price through cash, equity, and the raising of additional debt. In connection with this transaction, the Company entered into Amendment no. 2 to the Credit Agreement which added two incremental term loans to the Credit Agreement, a euro denominated term loan in the amount of €155 million, or $168 million, and a USD denominated term loan in the amount of $20 million.
On March 9, 2015, the Company announced it reached a definitive agreement to acquire Agere Pharmaceuticals, a recognized leader in complex solubility technology, to expand its early stage pharmaceutical development capabilities. The Company purchased Agere for approximately $26.0 million and closed the transaction during the second quarter of fiscal 2015. The Company funded the purchase price through the use of available cash and equity.
On May 6, 2015, the Company’s Subsidiary JLL/Delta Dutch Pledgeco B.V. (“Pledgeco”), closed on a $550.0 million aggregate principal amount of its 8.75%/9.50% senior PIK toggle note due 2020.
F-88
Pledgeco intends to use the proceeds to pay a dividend or other distribution to the Partnership along with certain related transaction fees and expenses as a result of the $550.0 million debt offering.
On May 12, 2015, the Company announced the closing of the deal to sell its Banner Pharmacaps entity in Mexico to the Perrigo Company plc for approximately $34.0 million.
F-89
Gallus Biopharmaceuticals, LLC
Unaudited Balance Sheets
| June 30, 2014 |
December 31, 2013 |
|||||
| Assets |
||||||
| Current assets: |
||||||
| Cash | $ | 894,087 | $ | 567,741 | ||
| Accounts receivable, net | 9,569,912 | 5,967,949 | ||||
| Prepaid expenses and other current assets | 11,347,238 | 5,607,497 | ||||
| Restricted cash | 400,640 | 400,640 | ||||
| Total current assets | 22,211,877 | 12,543,827 | ||||
| Property and equipment, net | 63,936,039 | 65,515,921 | ||||
| Intangible assets, net | 5,078,941 | 5,853,765 | ||||
| Long-term restricted cash | 552,597 | 986,815 | ||||
| Other long-term assets | 2,576,828 | 1,658,002 | ||||
| Total assets | $ | 94,356,282 | $ | 86,558,330 | ||
| Liabilities and members’ equity |
||||||
| Current liabilities: |
||||||
| Accounts payable | $ | 6,327,933 | $ | 3,985,107 | ||
| Accrued expenses and other current liabilities | 4,664,374 | 6,255,145 | ||||
| Deferred revenue | 13,813,298 | 11,141,751 | ||||
| Deferred payments to seller, current portion | 2,000,000 | 4,000,000 | ||||
| Long-term debt, current portion | 2,200,000 | 1,000,000 | ||||
| Total current liabilities | 29,005,605 | 26,382,003 | ||||
| Deferred revenue, net of current portion | 7,219,035 | 4,230,685 | ||||
| Deferred payments to seller, net of current portion | 1,512,677 | 3,183,306 | ||||
| Long-term debt, net of current portion | 17,649,829 | 7,645,227 | ||||
| Other non-current liabilities | 596,827 | 1,089,312 | ||||
| Total liabilities | 55,983,973 | 42,530,533 | ||||
| Members’ equity: |
||||||
| Members’ capital accounts | 25,228,658 | 25,228,658 | ||||
| Retained earnings | 13,143,651 | 18,799,139 | ||||
| Total members’ equity | 38,372,309 | 44,027,797 | ||||
| Total liabilities and members’ equity | $ | 94,356,282 | $ | 86,558,330 | ||
See accompanying notes.
F-90
Gallus Biopharmaceuticals, LLC
Unaudited Statements of Operations and Comprehensive Loss
Six Months Ended |
||||||
| June 30, 2014 |
June 30, 2013 |
|||||
| Revenues | $ | 31,938,846 | $ | 21,608,620 | ||
| Cost of revenues | 33,487,792 | 20,125,741 | ||||
| Gross profit | (1,548,946 | ) |
1,482,879 | |||
| Operating expenses: |
||||||
| General and administrative | 2,540,206 | 1,821,013 | ||||
| Selling and marketing | 1,228,143 | 1,112,833 | ||||
| Total operating expenses | 3,768,349 | 2,933,846 | ||||
| Loss from operations | (5,317,295 | ) |
(1,450,967 | ) |
||
| Other income (expense): |
||||||
| Interest expense | (675,954 | ) |
(734,647 | ) |
||
| Other income | 337,795 | 335,831 | ||||
| Total other expense, net | (338,159 | ) |
(398,816 | ) |
||
| Net loss | $ | (5,655,454 | ) |
$ | (1,849,783 | ) |
| Comprehensive loss | $ | (5,655,454 | ) |
$ | (1,849,783 | ) |
See accompanying notes.
F-91
Gallus Biopharmaceuticals, LLC
Unaudited Statements of Cash Flows
Six Months Ended |
||||||
| June 30, 2014 |
June 30, 2013 |
|||||
| Operating activities |
||||||
| Net loss | $ | (5,655,454 | ) |
$ | (1,849,783 | ) |
| Adjustments to reconcile net loss to net cash provided by operating activities: |
||||||
| Depreciation expense | 3,486,106 | 2,874,758 | ||||
| Amortization expense | 774,824 | 536,654 | ||||
| Non-cash interest expense | 286,988 | 594,564 | ||||
| Changes in operating assets and liabilities: |
||||||
| Accounts receivable | (3,601,963 | ) |
(293,660 | ) |
||
| Prepaid expenses and other assets | (6,675,507 | ) |
(675,164 | ) |
||
| Restricted cash | 434,218 | (473,076 | ) |
|||
| Accounts payable | 2,672,306 | (549,597 | ) |
|||
| Accrued expenses and other current/non-current liabilities | (1,637,858 | ) |
543,944 | |||
| Deferred revenue | 5,659,896 | 1,619,665 | ||||
| Net cash (used in) provided by operating activities | (4,256,444 | ) |
2,328,305 | |||
| Investing activities |
||||||
| Capital expenditures | (2,681,103 | ) |
(2,730,369 | ) |
||
| Net cash used in investing activities | (2,681,103 | ) |
(2,730,369 | ) |
||
| Financing activities |
||||||
| Repurchase of members’ interest | — | (179,170 | ) |
|||
| Borrowings on revolving credit facility | 23,037,679 | 15,925,003 | ||||
| Payments under revolving credit facility | (19,740,453 | ) |
(13,225,000 | ) |
||
| Borrowings on term loan | 10,700,000 | — | ||||
| Payments under term loan | (2,733,333 | ) |
— | |||
| Payment of deferred payment to seller | (4,000,000 | ) |
(2,500,000 | ) |
||
| Net cash provided by financing activities | 7,263,893 | 20,833 | ||||
| Net increase (decrease) in cash and cash equivalents | 326,346 | (381,231 | ) |
|||
| Cash at beginning of period | 567,741 | 1,172,923 | ||||
| Cash at end of period | $ | 894,087 | $ | 791,692 | ||
See accompanying notes.
F-92
Gallus BioPharmaceuticals, LLC
Notes to Unaudited Consolidated Financial Statements
1. Basis of Presentation
Gallus BioPharmaceuticals, LLC (the Company) was incorporated in the state of Delaware on June 14, 2010. Gallus is a contract manufacturer of clinical and commercial-grade bulk biologics products. Gallus operates FDA-approved, commercially-certified facilities in St. Louis, Missouri, and Princeton, New Jersey. The Gallus facilities have capabilities for mammalian cell culture and protein purification in both perfusion and fed batch modes, and offer production scale-up from product development through clinical services to full commercial volumes. Target customers are small biotechnology firms to large pharmaceutical companies who desire dedicated manufacturing capability without the large up-front capital investment in facilities.
On September 30, 2013, the Company acquired the stock of Laureate Biopharmaceutical Services, Inc., for consideration of approximately $2.5 million. The acquired business is complementary to that of Gallus. Gallus has renamed the acquired business Gallus BioPharmaceuticals NJ, LLC. The financial statements of Gallus BioPharmaceuticals NJ, LLC have been consolidated into the Company’s financial statements since September 30, 2013. All material intercompany transactions and balances have been appropriately eliminated.
The accompanying interim condensed consolidated financial statements are unaudited and have been prepared in conformity with the instructions of the Securities and Exchange Commission (SEC) Regulation S-X, Article 10, Rule 10-01 for interim financial statements. Accordingly, they do not include all of the information and footnotes required by accounting principles generally accepted in the United States of America (GAAP) for complete financial statements. The accompanying unaudited consolidated financial statements contain all adjustments, consisting only of normal recurring accruals, necessary for a fair presentation of the Company’s financial position at June 30, 2014, results of our operations for the six months ended June 30, 2014 and 2013 and cash flows for the six months ended June 30, 2014 and 2013. The results for the six months ended June 30, 2014 are not necessarily indicative of future results.
On September 29, 2014, all outstanding membership interests (Class A, B, and C units) of the Company were acquired by DPx Holdings B.V. for an aggregate purchase price of $257.2 million.
2. Fair Value Measurements
ASC 820, Fair Value Measurements and Disclosures, defines fair value, and establishes a framework for measuring fair value in accordance with GAAP, and expands disclosures about fair value measurements. ASC 820 codifies the definition of fair value as the price that would be received to sell an asset or paid to transfer a liability in an orderly transaction between market participants at the measurement date, clarifies the principle that fair value should be based on the assumptions market participants would use when pricing the asset or liability, and establishes a fair value hierarchy that prioritizes the information used to develop those assumptions. The valuation hierarchy is based upon the transparency of inputs to the valuation of an asset or liability as of the measurement date.
Fair value measurements are classified and disclosed in one of the following three categories:
Level 1 – Quoted prices in active markets for identical assets or liabilities.
Level 2 – Inputs other than Level 1 that are observable, either directly or indirectly, such as quoted prices for similar assets or liabilities; quoted prices in markets that are not active; or other inputs that are observable or can be corroborated by observable market data for substantially the full term of the assets or liabilities.
Level 3 – Unobservable inputs that are supported by little or no market activity, and that are significant to the fair value of assets or liabilities.
As of June 30, 2014 and December 31, 2013, there are no assets or liabilities that are required to be re-measured to fair value on a recurring basis by the Company.
F-93
3. Prepaid Expenses and Other Current Assets
Prepaid expenses and other current assets consist of the following:
| June 30, 2014 | December 31, 2013 | |||||
| Prepaid expenses | $ | 5,992,208 | $ | 3,235,866 | ||
| Manufacturing supplies | 4,940,138 | 2,275,671 | ||||
| Other current assets | 414,892 | 95,960 | ||||
| Total prepaid expenses and other current assets | $ | 11,347,238 | $ | 5,607,497 | ||
4. Accrued Expenses and Other Current Liabilities
Accrued expenses and other current liabilities consist of the following:
| June 30, 2014 | December 31, 2013 | |||||
| Accrued payroll and payroll-related expenses | $ | 2,975,187 | $ | 4,494,355 | ||
| Accrued professional fees | 162,200 | 334,152 | ||||
| Accrued utilities | 254,420 | 176,423 | ||||
| Deferred gain, current portion | 87,950 | 86,439 | ||||
| Other | 1,184,617 | 1,163,776 | ||||
| Total accrued expenses and other current liabilities | $ | 4,664,374 | $ | 6,255,145 | ||
5. Debt
On February 3, 2014, the Company and its bank modified the existing term loan and revolving credit commitment (the Amended Loan Agreement). The original term loan of $2,000,000, with a pay-down provision of $1,000,000 on May 13, 2014, was replaced with a term loan of $11,000,000 to be drawn at the Company’s discretion, provided it continues to meet its obligations under the term loan. The modified term loan has a five year repayment schedule and is due in full in February 2019. Interest on the loan is tiered at LIBOR plus 3.50% to 4.50%. In addition the $10,000,000 revolving credit facility due to expire on June 1, 2014, was replaced with a $10,000,000 revolving credit facility maturing in February 2016. The modified revolving credit facility has a tiered interest rate at LIBOR plus 3.25% to 4.25%. The Amended Loan Agreement contains certain financial and other covenants, including a fixed charge coverage ratio and leverage ratio. The Amended Loan Agreement is secured by all personal property and real estate assets of the Company. The Company evaluated the modification to the Amended Loan Agreement and concluded that it was not an extinguishment of the existing term loan and revolving credit commitment. The term loan was repaid in conjunction with the acquisition of the Company by DPx Holdings, B.V.
6. Commitments and Contingencies
Operating Leases
Commitments at June 30, 2014, consist of real estate and office equipment leases. Minimum rental payments under these leases are as follows:
| 2014 | $ | 964,714 | |
| 2015 | 1,697,030 | ||
| 2016 and beyond | 2,010,156 | ||
| Total | $ | 4,671,900 |
Other
Various governmental approvals and permits are required for operation of the Company’s business. The Company maintains a comprehensive program to monitor compliance with the rules and regulations promulgated by such agencies. The Company is not aware of any contingent liabilities as of June 30, 2014.
F-94
7. Subsequent Events
The FASB established general standards of accounting for disclosures of events that occur after the balance sheet date but before financial statements are issued or are available to be issued. The Company has evaluated subsequent events through June 4, 2015, the date that the financial statements were available to be issued.
Sale of the Company
On September 29, 2014, the Company was acquired by DPx Holdings, B.V. (DPx Holdings). Pursuant to the terms of the agreement, all outstanding membership interests (Class A, B, and C units) of the Company were acquired by DPx Holdings for an aggregate purchase price of $257.2 million.
F-95
Report of Independent Auditors
The Board of Managers
Gallus BioPharmaceuticals, LLC
We have audited the accompanying consolidated financial statements of Gallus BioPharmaceuticals, LLC, which comprise the consolidated balance sheet as of December 31, 2013, and the related consolidated statement of income and comprehensive income, members’ equity, and cash flows for the year then ended, and the related notes to the consolidated financial statements.
Management’s Responsibility for the Financial Statements
Management is responsible for the preparation and fair presentation of these financial statements in conformity with U.S. generally accepted accounting principles; this includes the design, implementation, and maintenance of internal control relevant to the preparation and fair presentation of financial statements that are free of material misstatement, whether due to fraud or error.
Auditor’s Responsibility
Our responsibility is to express an opinion on these financial statements based on our audit. We conducted our audit in accordance with auditing standards generally accepted in the United States. Those standards require that we plan and perform the audit to obtain reasonable assurance about whether the financial statements are free of material misstatement.
An audit involves performing procedures to obtain audit evidence about the amounts and disclosures in the financial statements. The procedures selected depend on the auditor’s judgment, including the assessment of the risks of material misstatement of the financial statements, whether due to fraud or error. In making those risk assessments, the auditor considers internal control relevant to the entity’s preparation and fair presentation of the financial statements in order to design audit procedures that are appropriate in the circumstances, but not for the purpose of expressing an opinion on the effectiveness of the entity’s internal control. Accordingly, we express no such opinion. An audit also includes evaluating the appropriateness of accounting policies used and the reasonableness of significant accounting estimates made by management, as well as evaluating the overall presentation of the financial statements.
We believe that the audit evidence we have obtained is sufficient and appropriate to provide a basis for our audit opinion.
Opinion
In our opinion, the financial statements referred to above present fairly, in all material respects, the consolidated financial position of Gallus Biopharmaceuticals, LLC at December 31, 2013, and the consolidated results of its operations and its cash flows for the year then ended, in conformity with U.S. generally accepted accounting principles.
/s/ Ernst & Young LLP
July 31, 2014
Boston, Massachusetts
F-96
Gallus Biopharmaceuticals, LLC
Balance Sheet
| December 31 2013 |
|||
| Assets |
|||
| Current assets: |
|||
| Cash | $ | 567,741 | |
| Accounts receivable | 5,967,949 | ||
| Prepaid expenses and other current assets | 5,607,497 | ||
| Restricted cash | 400,640 | ||
| Total current assets | 12,543,827 | ||
| Property and equipment, net | 65,515,921 | ||
| Intangible assets, net | 5,853,765 | ||
| Deferred financing costs | 135,011 | ||
| Long-term restricted cash | 986,815 | ||
| Other long-term assets | 1,522,991 | ||
| Total assets | $ | 86,558,330 | |
| Liabilities and members’ interest |
|||
| Current liabilities: |
|||
| Accounts payable | $ | 3,985,107 | |
| Accrued expenses and other current liabilities | 6,255,145 | ||
| Deferred revenue | 11,141,751 | ||
| Deferred payments to seller, current portion | 4,000,000 | ||
| Debt, current portion | 1,000,000 | ||
| Total current liabilities | 26,382,003 | ||
| Customer deposit | 986,815 | ||
| Deferred revenue, net of current portion | 4,230,685 | ||
| Deferred gain, net of current portion | 102,497 | ||
| Deferred payments to seller, net of current portion | 3,183,306 | ||
| Debt, net of current portion | 7,645,227 | ||
| Members’ equity: |
|||
| Members’ capital accounts | 25,228,658 | ||
| Retained earnings | 18,799,139 | ||
| Total members’ equity | 44,027,797 | ||
| Total liabilities and members’ equity | $ | 86,558,330 | |
See accompanying notes.
F-97
Gallus Biopharmaceuticals, LLC
Statement of Income and Comprehensive Income
| Year Ended December 31 2013 |
|||
| Revenues | $ | 51,394,289 | |
| Cost of revenues | 46,968,704 | ||
| Gross profit | 4,425,585 | ||
| Operating expenses: |
|||
| General and administrative | 3,612,283 | ||
| Selling and marketing | 2,478,509 | ||
| Transaction related expenses | 511,002 | ||
| Total operating expenses | 6,601,794 | ||
| Income (loss) from operations | (2,176,209 | ) |
|
| Other income (expense): |
|||
| Interest income | 113,682 | ||
| Interest expense | (1,338,204 | ) |
|
| Other income | 671,676 | ||
| Gain on bargain purchase (Note 3) | 3,645,255 | ||
| Total other income / (expense), net | 3,092,409 | ||
| Net income | $ | 916,200 | |
| Comprehensive income | $ | 916,200 | |
See accompanying notes.
F-98
Gallus Biopharmaceuticals, LLC
Statement of Members’ Equity
Class A |
Class B-1 |
Class B-2 |
Retained Earnings (Deficit) |
Members’ Equity |
||||||||||||||||||||
| Units | Amount | Units | Amount | Units | Amount | |||||||||||||||||||
| Balance at December 31, 2012 | 25,750,000 | $ | 25,256,173 | 2,722,143 | $ | 145,474 | 5,444,286 | $ | 24,246 | $ | 17,882,939 | $ | 43,308,832 | |||||||||||
| Repurchase of members’ interest | (125,000 | ) |
(157,122 | ) |
(441,429 | ) |
(53,716 | ) |
(882,857 | ) |
(7,227 | ) |
— | (218,065 | ) |
|||||||||
| Compensation expense for capital interests issued | — | — | — | 17,855 | — | 2,975 | — | 20,830 | ||||||||||||||||
| Net income | — | — | — | — | — | — | 916,200 | 916,200 | ||||||||||||||||
| Balance at December 31, 2013 | 25,625,000 | $ | 25,099,051 | 2,280,714 | $ | 109,613 | 4,561,429 | $ | 19,994 | $ | 18,799,139 | $ | 44,027,797 | |||||||||||
See accompanying notes.
F-99
Gallus Biopharmaceuticals, LLC
Statement of Cash Flows
| Year Ended December 31 2013 |
|||
| Operating activities |
|||
| Net income | $ | 916,200 | |
| Adjustments to reconcile net income to net cash provided by operating |
|||
| Depreciation expense | 6,071,315 | ||
| Amortization expense | 1,095,338 | ||
| Stock-based compensation expense | 20,830 | ||
| Gain on bargain purchase | (3,645,255 | ) |
|
| Non-cash interest expense | 1,095,010 | ||
| Changes in operating assets and liabilities: |
|||
| Accounts receivable | (1,002,530 | ) |
|
| Prepaid expenses and other assets | (2,631,899 | ) |
|
| Restricted cash | (800,723 | ) |
|
| Accounts payable | (501,888 | ) |
|
| Accrued expenses and other liabilities | 306,734 | ||
| Deferred gain | (86,439 | ) |
|
| Deferred revenue | 5,036,222 | ||
| Net cash provided by operating activities | 5,872,915 | ||
| Investing activities |
|||
| Acquisition of business | (2,485,865 | ) |
|
| Capital expenditures | (7,951,909 | ) |
|
| Net cash used in investing activities | (10,437,774 | ) |
|
| Financing activities |
|||
| Repurchase of members’ interest | (218,065 | ) |
|
| Borrowings on revolving credit facility | 40,077,742 | ||
| Payments under revolving credit facility | (33,400,000 | ) |
|
| Payment of deferred payment to seller | (2,500,000 | ) |
|
| Net cash provided by financing activities | 3,959,677 | ||
| Net decrease in cash and cash equivalents | (605,182 | ) |
|
| Cash at beginning of year | 1,172,923 | ||
| Cash at end of year | $ | 567,741 | |
| Supplemental disclosure of cash flow information |
|||
| Cash paid for interest | $ | 311,327 | |
See accompanying notes.
F-100
Gallus BioPharmaceuticals, LLC
Notes to Consolidated Financial Statements
December 31, 2013
1. Basis of Presentation
Description of Business
Gallus BioPharmaceuticals, LLC (the Company) was formed in the state of Delaware on June 14, 2010. Gallus is a contract manufacturer of clinical and commercial-grade bulk biologics products. Gallus operates FDA-approved, commercially-certified facilities in St. Louis, Missouri, and Princeton, New Jersey. The Gallus facilities have capabilities for mammalian cell culture and protein purification in both perfusion and fed batch modes, and offer production scale-up from product development through clinical services to full commercial volumes. Target customers are small biotechnology firms to large pharmaceutical companies who desire dedicated manufacturing capability without the large up-front capital investment in facilities.
As described in Note 3, on September 30, 2013, the Company acquired the stock of Laureate Biopharmaceutical Services, Inc., for consideration of approximately $2.5 million. The transaction was accounted for as a business combination and it resulted in a gain of approximately $3.6 million related to a bargain purchase. The acquired business is complementary to that of Gallus. Subsequent to the acquisition, Gallus converted the acquired company to a limited liability company and renamed it Gallus BioPharmaceuticals NJ, LLC. The financial statements of Gallus BioPharmaceuticals NJ, LLC have been consolidated into the Company’s financial statements since September 30, 2013. All material intercompany transactions and balances have been appropriately eliminated.
2. Significant Accounting Policies
Use of Estimates
The preparation of the consolidated financial statements in conformity with accounting principles generally accepted in the United States requires management to make estimates and assumptions that affect the reported amounts of assets and liabilities, such as values assigned to assets acquired and liabilities assumed in connection with business acquisitions, and disclosure of contingent assets and liabilities at the date of the financial statements, the fair value of members’ equity units, and the reported amounts of revenues and expenses during the reporting period. Actual results could differ from those estimates.
Revenue Recognition
The Company derives its revenue from providing commercial manufacturing and pharmaceutical development services. Revenue is recognized when services are completed in accordance with the specific agreements with its customers when evidence of arrangement exists, fees are fixed or determinable, and collection is reasonably assured.
A portion of the Company’s revenue is derived from fees received in exchange for maintaining manufacturing capacity, operational readiness and available equipment, and the commercial manufacture of product. The Company accounts for the arrangement as a service transaction, as the compensation received is not impacted by the amount of inventory produced. Revenue is recorded using a proportional performance method, generally on a straight-line basis over the service period.
The Company also enters into contracts in which it provides a variety services to its customers. The terms of these agreements contain multiple deliverables, which may include process validation, analytical method development, cGMP manufacturing, and stability studies. The Company identifies the deliverables included within the agreement, and evaluates which deliverables represent separate units of accounting. The Company accounts for those components as separate elements when the following criteria are met: (i) the delivered items have value to the customer on a
F-101
stand-alone basis, and, (ii) if there is a general right of return relative to the delivered items, delivery or performance of the undelivered items is considered probable and within its control. The consideration received is allocated among the separate units of accounting based on management’s best estimate of selling price, and the applicable revenue recognition criteria are applied to each of the separate units. The determination that multiple elements in an arrangement meet the criteria for separate units of accounting requires the Company to exercise its judgment.
The determination of whether revenue should be recognized on a gross or net basis involves judgment based on the relevant facts and circumstances, which relate primarily to whether the Company acts as a principal or agent in the process of generating revenues. In making this assessment, the Company considers whether it is the primary obligor in the arrangement, and whether it has the risks and rewards of ownership.
Cash and Cash Equivalents
Cash and cash equivalents include cash on hand and investments with original maturities of less than 90 days. The Company’s financial covenants related to its loan agreement require it to maintain a minimum cash balance of $1.5 million, inclusive of restricted cash on deposit.
Property and Equipment
Property and equipment is recorded at cost, and depreciated using the straight-line method over the estimated useful lives of the related assets. Property and equipment acquired in a business combination is recorded at fair value at the date of acquisition. The Company reviews its property and equipment whenever events or changes in circumstances indicate that the carrying amount of certain assets might not be recoverable, and recognizes an impairment loss when it is probable that the estimated cash flows are less than the carrying value of the related asset. The Company expenses repair and maintenance costs as incurred.
Deferred Financing Costs
Deferred financing costs relate to costs incurred to obtain long-term debt financing. Financing fees paid to third parties are capitalized as an asset. Financing fees paid directly to the lenders are included as a reduction of the carrying value of the term loans in the accompanying consolidated balance sheets. Deferred financing costs are amortized over the financing term of the related debt using the effective-interest method. The deferred financing costs associated with the revolving line of credit are amortized on a straight-line basis over the term of the line of credit. The deferred financing costs are included in other assets on the consolidated balance sheets.
Income Taxes
The Company is a limited liability company and, accordingly, its income is taxed at the individual member level. Under these provisions, the entity does not pay federal corporate income taxes on its taxable income. Instead, the members are liable for all income taxes on a pass-through basis. Therefore, only the state excise tax is recognized and recorded in general and administrative expenses. The Company does not have a provision for income taxes.
Fair Value of Financial Instruments
ASC 825, Financial Instruments, requires disclosure of the fair value of financial instruments. For financial instruments, including cash and cash equivalents, accounts receivable, other receivables, accounts payable, and accrued expenses, the carrying amount approximates fair value because of their short-term nature. The carrying value of the Company’s debt approximates fair value as the interest rates for the debt approximated market rates of interest available to the Company for similar instruments.
Fair Value Measurements
ASC 820, Fair Value Measurements and Disclosures, defines fair value, establishes a framework for measuring fair value in accordance with GAAP, and expands disclosures about fair value measurements. ASC 820 codifies the definition of fair value as the price that would be received to
F-102
sell an asset or paid to transfer a liability in an orderly transaction between market participants at the measurement date, clarifies the principle that fair value should be based on the assumptions market participants would use when pricing the asset or liability, and establishes a fair value hierarchy that prioritizes the information used to develop those assumptions. The valuation hierarchy is based upon the transparency of inputs to the valuation of an asset or liability as of the measurement date.
Fair value measurements are classified and disclosed in one of the following three categories:
Level 1 – Quoted prices in active markets for identical assets or liabilities.
Level 2 – Inputs other than Level 1 that are observable, either directly or indirectly, such as quoted prices for similar assets or liabilities; quoted prices in markets that are not active; or other inputs that are observable or can be corroborated by observable market data for substantially the full term of the assets or liabilities.
Level 3 – Unobservable inputs that are supported by little or no market activity, and that are significant to the fair value of assets or liabilities.
As of December 31, 2013, there are no assets or liabilities that are required to be re-measured to fair value on a recurring basis by the Company.
Concentration of Credit Risk and Off-Balance Sheet Risk
Financial instruments that potentially subject the Company to credit risk consist of accounts receivable. The nature of the Company’s business entails working on a small number of high-dollar contracts. The following table summarizes the customers that individually comprise greater than 10% of revenues and accounts receivable, and their respective percentage of total revenues and accounts receivable:
| Accounts Receivable December 31 2013 |
Revenue December 31 2013 |
|||||
| Customer A | * |
70 | % |
|||
| Customer B | 17 | % |
* |
|||
| Customer C | 24 | % |
* |
|||
| Customer D | — | * |
||||
* Less than 10%
Accounts Receivable
Accounts receivable includes amounts billed to customers in accordance with contract terms, as well as unbilled receivables, which represent amounts recognized as revenue for which invoices have not yet been sent to customers due to contract terms. At December 31, 2013, unbilled receivables were approximately $1,135,000.
The Company assesses the ability to collect outstanding accounts receivable based on a combination of factors, including current delinquencies, characteristics of existing accounts, historical loss experience, and general economic conditions and trends. Generally, the Company does not require collateral to secure accounts receivable. Accounts receivable are written off when they are deemed uncollectible.
The Company has a dispute with a customer related to the services that were performed by the Company. The customer represents approximately $650,000 of accounts receivable at December 31, 2013, and approximately $1,200,000 of revenue during 2013. The Company believes that it has properly provided services to this customer and is owed the amounts that are due, however, given the uncertainty with respect to this dispute, the Company has provided a reserve of $250,000 against the receivable, which is the Company’s best estimate of the amount that may be deemed uncollectible. The matter has been referred to arbitration per the terms of the contract. The Company believes that, in the event of an opinion from the arbitrator in favor of the customer, its errors and omissions insurance will cover the loss that results from the arbitration.
F-103
The allowance for doubtful accounts is $250,000 as of December 31, 2013.
Manufacturing Supplies
The Company purchases manufacturing supplies and materials in advance for use in future manufacturing services. The manufacturing materials are recorded in other current assets, and are expensed when they are utilized in production. The Company reviews the balances for realizability on a regular basis, or upon an occurrence of an event that would indicate the costs incurred will not be realizable. At December 31, 2013, the Company had recorded $2,275,671 of these costs within prepaid expenses and other current assets.
Advertising Expenses
The Company accounts for advertising costs as expense in the period in which they are incurred. Advertising expense for the year ended December 31, 2013 was $144,628.
Stock-Based Compensation
The Company grants certain membership units that vest over time as well as options to purchase membership units. The Company measures compensation costs for equity-based awards to employees equal to the grant date fair value, as determined by the Board of Managers, and expenses such compensation over the service period. For awards that vest based on service conditions, the Company uses the straight-line method to allocate compensation expense to reporting periods.
The Company records the expense for options subject to performance-based milestone vesting over the remaining service period when management determines that achievement of the milestone is probable. Management evaluates when the achievement of a performance-based milestone is probable based on the relative satisfaction of the performance conditions as of the reporting date.
Other Long-term Assets
During 2013, the Company purchased equipment to be used for manufacturing for specific clients and that is paid for by those clients. The Company capitalizes the equipment as a long-term asset and amortizes the asset to cost of sales over the period the related service is performed. At December 31, 2013, the Company had long-term assets of $1,522,991.
Long-Lived Assets
The Company accounts for long-lived assets, including intangible assets, in accordance with the provisions of ASC 360-10, Property, Plant and Equipment – Impairment or Disposal of Long-Lived Assets. At each occurrence of a triggering event or change in circumstances, the Company evaluates the realizability of long-lived assets based on profitability expectations, using the undiscounted cash flow method, for each long-lived asset or group of assets. If an impairment is indicated, the related long-lived assets are written down to their estimated fair value. Factors that management considers in performing this evaluation include current operating results, trends, product demand, competition, and other economic factors, both domestic and international. Based on its most recent analysis, the Company believes that no impairment of long-lived assets existed at December 31, 2013.
Recently Adopted Accounting Standards
The Financial Accounting Standards Board issued amended guidance applicable to revenue recognition that will be effective for the Company for the year ending December 31, 2018, with early adoption permitted for the year ending December 31, 2017. The new guidance must be adopted using either a full retrospective approach for all periods presented or a modified retrospective approach. The new guidance applies a more principles-based approach in recognizing revenue. The Company is evaluating the new guidance and the expected effect on the Company’s consolidated financial statements.
F-104
3. Acquisition
On September 30, 2013, the Company acquired all the stock of Laureate Biopharmaceutical Services, Inc., for consideration of approximately $2.5 million. Laureate operates a process development and manufacturing business in Princeton, New Jersey. The transaction was accounted for as a business combination in accordance with ASC 805, Business Combinations, and as such, the assets and liabilities were recorded at fair value at the date of acquisition, and all transaction costs were expensed as incurred. The Company conducted a valuation of the tangible and intangible assets acquired. The fair value of the intangible assets was determined using the income approach. Under the income approach, the expected future cash flows from each asset were estimated and discounted to their net present values at an appropriate risk-adjusted rate of return. Significant factors considered in the calculation of the rate of return were the weighted-average cost of capital and return on assets, as well as the risks inherent in the development process, including the likelihood of achieving market acceptance. Future cash flows for each asset were estimated based on forecasted revenue and costs. Management also obtained a valuation of the personal property acquired. The assets were valued using a disposition value approach. The Company used observable inputs, such as selling prices of similar equipment in similar condition, and adjusted these inputs based on the age, condition, or functional or economic obsolescence of the assets, if necessary, in order to determine the fair value of the property and equipment acquired.
The following table summarizes the allocation of the purchase price to the assets acquired and liabilities assumed at the date of acquisition:
| Cash paid | $ | 2,485,865 | |
| Other current assets | 5,128,028 | ||
| Property and equipment | 5,575,775 | ||
| Intangible assets | 4,400,000 | ||
| Other long term assets | 92,610 | ||
| Accounts payable and other current liabilities | (5,274,301 | ) |
|
| Deferred revenue | (3,790,992 | ) |
|
| Fair value of net assets acquired | 6,131,120 | ||
| Bargain purchase price attributed to other income | $ | 3,645,255 |
The Company believes that it was able to acquire the Princeton business for less than the fair value of its assets because (i) there were a limited set of buyers interested in this specialized production set up, (ii) the sellers had limited time available as a going concern, and (iii) the seller’s cost of shutting down the operation, even under a bankruptcy filing, would have been considerable.
The fair value of the net assets acquired was approximately $6.1 million, which exceeded the purchase price of $2.5 million. Accordingly, the Company recognized the excess of the fair value of the net assets over the purchase price of approximately $3.6 million as a bargain purchase gain.
In conjunction with the acquisition, the Company incurred transaction fees of approximately $0.5 million, which were expensed as incurred.
4. Restricted Cash
At December 31, 2013, the Company had a certificate of deposit for $200,640, which represented collateral as security deposits for Company credit cards. At December 31, 2013, the Company also had $200,000 in a trust account to satisfy potential environmental claims to be identified by the New Jersey Department of Environmental Protection in connection with the acquisition of the Princeton site. The Company believes it probable that it will receive a reimbursement of the trust account once environmental review is complete, which is expected within the next twelve months.
In addition, the Company entered into a manufacture and supply agreement with a customer. Under the terms of the agreement, the Company received a deposit of $1.3 million to be used solely for the purchase of certain manufacturing materials. The customer will provide further funds, with
F-105
its approval, for the purchase of additional manufacturing materials upon the depletion of the initial deposit. Upon termination of the agreement, the deposit will be refunded to the customer. At December 31, 2013, the balance of the customer deposit, which is recorded as restricted cash, was $986,815.
5. Property and Equipment
Property and equipment consists of the following:
| Year Ended December 31 2013 |
|||
| Land | $ | 2,113,565 | |
| Buildings (8-30 years) | 37,016,641 | ||
| Equipment (4-7 years) | 26,342,206 | ||
| Computer equipment and software (2-5 years) | 5,008,130 | ||
| Vehicles (3-5 years) | 67,176 | ||
| Office furniture and fixtures (4-7 years) | 878,499 | ||
| Construction in process | 6,621,898 | ||
| Total property and equipment, at cost | 78,048,115 | ||
| Accumulated depreciation | (12,532,194 | ) |
|
| Property and equipment, net | $ | 65,515,921 | |
During 2013, the Company capitalized interest of $86,021 as a part of the historical costs of assets that required a period of time in which to carry out the activities necessary to bring them to the condition and location necessary for their intended use.
6. Intangible Assets
Intangible assets consist of the following:
| Year Ended December 31, 2013 |
|||
| Customer relationships (3-5 years) | $ | 8,660,000 | |
| Backlog (3 years) | 1,340,000 | ||
| Accumulated amortization | (4,146,235 | ) |
|
| Intangible assets, net | $ | 5,853,765 | |
An intangible asset for the customer relationships has been recorded at cost, and is amortized using the straight-line method over a three or five year estimated useful life. Estimated amortization expense for the years 2014 through 2018 is approximately $1.5 million, $1.5 million, $1.4 million, $0.9 million, and $0.5 million, respectively.
F-106
7. Accrued Expenses and Other Current Liabilities
Accrued expenses and other current liabilities consist of the following:
| December 31 2013 |
|||
| Accrued expenses | $ | 1,163,776 | |
| Accrued payroll and payroll-related expenses | 4,494,355 | ||
| Accrued professional fees | 334,152 | ||
| Accrued utilities | 176,423 | ||
| Deferred gain, current portion | 86,439 | ||
| Total accrued expenses and other current liabilities | $ | 6,255,145 | |
8. Tax Incentives
The Company is the beneficiary of a number of tax incentives offered by the state of Missouri and St. Louis County.
Development Tax Credits
The Company was awarded tax credits totaling $550,000 from the Missouri Department of Economic Development in exchange for a commitment to make an agreed investment in the facility, and provide a certain number of jobs. The credits will be received in annual installments over a five-year period, and subject to clawback if employee levels are not maintained. The Company sold the tax credits to a third party in 2011, for total proceeds of $432,196, net of transaction fees. As the credit is subject to clawback from the state if the minimum employment requirements are not maintained, the Company has recorded the net proceeds as a deferred gain, which will be recognized on a straight-line basis over the remainder of the five-year period. The Company continues to maintain the minimum hiring requirement as of December 31, 2013. The Company recorded other income of $86,439 for the portion of the incentive that was earned for the years ended December 31, 2013 and 2012.
BUILD Missouri Revenue Bonds
In April 2011, the Company entered into an agreement to receive tax incentives under the Missouri Department of Economic Development Build Program. The program is designed to create a financial incentive for businesses to undergo large-scale projects. Under the program, the Company simultaneously borrowed $4,130,700 and purchased $4,130,700 of BUILD Missouri Revenue Bonds from a trustee designated by the State of Missouri. The principal and interest payments owed by Gallus on the loan are equal to the principal and interest proceeds received from the bonds. The bonds and the loan both have a ten-year maturity, with identical semi-annual principal and interest payments and 5% interest rates. The loans can be prepaid and bonds can be redeemed at any time without premium or penalty. The Company has determined that it has a legal right of offset for the obligations under the loan agreement with the proceeds receivable from the Build Missouri Revenue Bonds, and intends to offset the balance, and as such, the equal offsetting amounts have not been recorded in the financial statements. The Company is subject to an annual program fee of 0.05% of the principal outstanding on the bonds. The Company is able to apply for a tax credit equal to the principal and interest payment made on the loan and certain program fees. The Company is required to hire and maintain a minimum number of employees to receive the tax incentive. The Company continues to maintain the minimum hiring requirement as of December 31, 2013. The benefit for this incentive is received by the Company’s members upon filing their individual tax returns. The Company recorded the program fee of $18,109 for the year ended December 31, 2013 as general and administrative expense in the consolidated statements of income and comprehensive income. The Company will apply for tax credits in 2014 for the payments required to service the debt in accordance with the provisions of the program in 2013.
F-107
Chapter 100 Bonds
In May 2011, the Company entered into an agreement with St. Louis County. Under the Chapter 100 program, the Company transferred title of its buildings and property to St. Louis County in exchange for St. Louis County, Missouri Taxable Industrial Revenue Bonds (Chapter 100 Bonds) of equal value. The Company then simultaneously leased back the land and facility. The proceeds of principal and interest on the Chapter 100 Bonds are equal to the lease payment obligations on the Loan. The term of the loan is through December 21, 2021, which is consistent with the maturity date of the Chapter 100 Bonds. The Company has determined that it has a legal right of offset for the obligations under the lease agreement with the proceeds receivable from the Chapter 100 Bonds and intends to offset the balance, and as such, the equal offsetting amounts have not been recorded in the financial statements. In addition to the terms of the bonds indicated above, the Company also entered into an agreement under which it makes PILOT fee payments in lieu of property taxes, which is equal to 50% of the property taxes that would have otherwise been payable on the property. The PILOT fees will increase in years which the Company has not maintained the minimum number of employees as required by the agreement on a prospective basis. During 2013 the Company paid approximately $318,000 in PILOT fees. The PILOT payments are accrued in the year in which they apply, and are included in operating expense.
Gallus has possessory and equitable title to the property, and at any time can purchase legal title for a nominal fee. In addition, as the holder of the bonds, Gallus can waive any default on the rent payments. As the Company retains all benefits of ownership and can take title at any time, at which point the bonds it holds would be redeemed to settle its obligations under the lease agreement, the Company has concluded that the land and personal property continue to be its assets and are recorded on the consolidated balance sheets.
Quality Jobs
The Company received an incentive under the Missouri Quality Jobs Program for creating new jobs. Gallus was accepted in the program based on creating a minimum number of jobs over five years. In return, Gallus retains the state withholding tax generated by these jobs, and is entitled to credits against state income taxes totaling approximately 7% of qualified payroll, less the retained withholding taxes. While the Company’s taxes are passed through to the members, the Company receives a cash refund for withholding tax amounts. As such, the Company has recorded other income of $611,347 during the year ended December 31, 2013 for the incentives earned. At December 31, 2013 the Company recorded a receivable from the state of Missouri of $23,933.
9. Debt
Outstanding debt consists of the following:
| December 31 2013 |
|||
| Deferred payments to Seller, due May 13, 2012, through May 13, 2016, net of debt discount of $816,694. | $ | 7,183,306 | |
| Revolving credit | 6,677,742 | ||
| Term loan, with maturities on May 13, 2014 and May 13, 2016, net of debt discount of $32,515 in 2013 | 1,967,485 | ||
| Total debt | 15,828,533 | ||
| Current portion of long-term debt | (5,000,000 | ) |
|
| Total long-term debt | $ | 10,828,533 | |
Deferred payments to Seller
A provision of the Asset Purchase Agreement dated November 23, 2010, as amended, for the acquisition of the St. Louis facility included deferred payments of $11,000,000. There are five annual payments due starting on May 13, 2012, and ending on May 13, 2016, of $0.5 million, $2.5 million,
F-108
$4.0 million, $2.0 million, and $2.0 million, respectively. The payments have no stated interest rate. The Company has recorded the deferred payments at fair value using an imputed 9% interest rate over the five year term.
Term Loan
On May 13, 2011, Gallus entered into a loan agreement (the “Loan Agreement”) with a bank for a term loan for $2,000,000. The obligations under the Loan Agreement are senior to the Company’s other obligations and are secured by all personal property and real estate assets of the Company. The interest rate for the term loan is 9% for the first three years and 11% for the remaining two years. The term loan has a maturity date of May 13, 2016, with a $1 million payment due on May 13, 2014.
The Loan Agreement contains certain financial and other covenants that, among other things, include a restriction on capital expenditures. The Company is also required to maintain a minimum fixed charge coverage ratio, and a minimum cash balance of $1.5 million, inclusive of restricted cash. As of December 31, 2013, the Company was in compliance with its financial covenants.
In addition, the loan and security agreement contains a subjective acceleration clause whereby an event of default and immediate acceleration of the borrowing under the security and loan agreement occurs if there is a material adverse change in the business, operations, or condition (financial or otherwise) of the Company or a material impairment of the prospect of repayment of any portion of the obligations. The lender has not exercised its right under this clause as there have been no such events. The Company believes that the likelihood of the lender exercising this right is remote.
Reducing Revolving Credit Commitment
Pursuant to the Loan Agreement dated May 13, 2011, the Company obtained a revolving credit facility of $14,000,000 subject to the same covenants as the Term Loan. The interest rate for the revolving credit facility is the LIBOR base rate plus 3.5%. The outstanding balance on the revolving credit facility at December 31, 2013, was $6,677,742. The balance available reduced to $10,000,000 on January 1, 2014. This revolving credit facility expires on December 31, 2014. The revolving credit facility has a fee related to the unused portion of the revolving credit facility of 0.25% per annum. The amount of revolving credit facility available for borrowing as of December 31, 2013 was $3,322,258.
In connection with the debt issued for the term loan and the line of credit, the Company recorded deferred financing costs of $1,133,371. The costs are capitalized are amortized to interest expense over the life of the related debt. The unamortized deferred financing costs at December 31, 2013 was $459,037.
At December 31, 2013, scheduled maturities of the deferred payments to the seller and the term loan for each of the next three years were as follows:
| Deferred Payments to Seller |
Term Loan |
|||||
| 2014 | $ | 4,000,000 | $ | 1,000,000 | ||
| 2015 | 2,000,000 | — | ||||
| 2016 | 2,000,000 | 1,000,000 | ||||
| Total | 8,000,000 | 2,000,000 | ||||
| Less: Discount for issuance costs and adjustment to fair value of deferred payments to seller | (816,694 | ) |
(32,515 | ) |
||
| Total | 7,183,306 | 1,967,485 | ||||
| Less: Current portion | (4,000,000 | ) |
(1,000,000 | ) |
||
| Long-term portion | $ | 3,183,306 | $ | 967,485 | ||
F-109
10. Commitments and Contingencies
Operating Leases
Commitments at December 31, 2013, consist of real estate and office equipment leases. Minimum rental payments under these leases are as follows:
| 2014 | $ | 1,273,321 | |
| 2015 | 1,212,303 | ||
| 2016 and beyond | 1,375,774 | ||
| Total | $ | 3,861,398 |
The Company recorded rent expense of $416,417 for the year ended December 31, 2013.
Other
Various governmental approvals and permits are required for operation of the Company’s business. The Company maintains a comprehensive program to monitor compliance with the rules and regulations promulgated by such agencies. The Company is not aware of any contingent liabilities as of December 31, 2013.
11. Members’ Equity and Stockholders’ Equity
Members’ Equity
Ownership of the Company is comprised of members, whose interest in the Company is represented by units. The Company has five classes of units, each class having varying rights, preferences, and privileges. The classes of units currently authorized are Class A Units (Capital Interest), Class B-1 and Class B-2 Units (Profits Interests), and Class C-1 and Class C-2 Units (Equity Incentive Profits Interest).
The number of units authorized, and the number of units issued and outstanding by class as of December 31, 2013, were as follows:
| Authorized | Issued and Outstanding |
|||||
| Class A Units (Capital Interest) | 25,750,000 | 25,625,000 | ||||
| Class B-1 Units (Profits Interests) | 2,722,143 | 2,280,715 | ||||
| Class B-2 Units (Profits Interests) | 5,444,286 | 4,561,429 | ||||
| Class C-1 Units (Profit Interest Options) | 956,429 | 875,151 | ||||
| Class C-2 Units (Profit Interest Options) | 1,912,857 | 1,750,302 | ||||
The various classes of units differ primarily with respect to distribution preferences and vesting, as well as allocation of net income and losses of Gallus Biopharmaceuticals, LLC. Net income, if any, of Gallus Biopharmaceuticals, LLC is generally distributed first to the Class A Unit members to the extent of their liquidation preference including a required return on investment. The liquidation preference is equal to the initial contributions made for members’ units plus an 8% per annum cumulative, quarterly compounded return. The liquidation preference as of December 31, 2013, was $31,562,984. Profits are further allocated among the Class A, B, and C Unit holders, initially to Class A Capital Interests, Class B-1 Profit Interests, and vested Class C-1 Profit Interest Options as a group up to a specified return. Remaining profits are allocated to all Unit Classes in a formula specified in the LLC agreement. Distributions, if any, are allocated to members in a manner similar to the allocation of net income, in that members receive distributions in the same priority and amounts as allocated to net income. Members’ liabilities for the obligations of the Company are limited to the balance in their capital accounts.
The Class A Units, are redeemable, at the election of the holders of a majority of the Class A units at any time on or after the fifth anniversary of the effective date of the agreement, or upon the sale of the Company or any liquidation, termination, or winding-up of the Company. The redemption
F-110
price is equal to the Class A liquidation preference plus the fair market value of the residual equity interest in the Class A units as of the redemption date. If the funds available for redemption are not sufficient to redeem all Class A units, the proportionate amount of the total redeemable units for each investor will be redeemed.
In 2011, the Company issued 2,722,143 Class B-1 units and 5,444,286 Class B-2 units, which vest over a two-year period beginning on May 13, 2011. The Company recorded compensation expense of $20,830 in the years ended December 31, 2013 related to the vesting of these units. The Class B-1 and B-2 units had a grant date fair value of $0.06.
Each Class A unit (Capital Interest) shall vote as a single class, and have one vote per unit in connection with the election of managers and on all matters to be voted by upon by the members of the Company.
Through December 31, 2013, the Company has granted 875,151 C-1 and 1,750,302 C-2 options. The grant date fair value of these options was determined using a Black-Scholes option pricing model. The membership units generally vest annually over a five-year period, but only become exercisable upon the sale of the Company or upon an initial public offering. Unrecognized compensation expense related to these options of $269,573 will be recorded only when the achievement of the vesting conditions becomes probable. The weighted-average remaining contractual term of these options is 8.20 years.
12. Related-Party Transactions
During 2013 the Company engaged a member of the Company to provide consulting services. In 2012, pursuant to a management agreement, the Company contracted for consulting services with a member of the board of managers. The Company made $15,696 in payments under these agreements during 2013.
13. Employment Retirement/Savings Plan
The Company maintains an employee retirement/savings plan (the Retirement Plan) which permits participants to make tax deferred contributions by salary reduction pursuant to Section 401(k) of the Internal Revenue Code. The Company expensed approximately $638,000 during 2013 in matching contributions to the Retirement Plan.
14. Subsequent Events
The FASB established general standards of accounting for disclosures of events that occur after the balance sheet date but before financial statements are issued or are available to be issued. The Company has evaluated subsequent events through July 31, 2014, the date that the financial statements were available to be issued.
On February 3, 2014, the Company and its bank modified the existing term loan and revolving credit commitment (the Amended Loan Agreement). The original term loan of $2,000,000, with a pay-down provision of $1,000,000 on May 13, 2014, was replaced with a term loan of $11,000,000 to be drawn at the Company’s discretion, provided it continues to meet its obligations under the term loan. The modified term loan has a five year repayment schedule and is due in full in February 2019. Interest on the loan is tiered at LIBOR plus 3.50% to 4.50%. In addition the $10,000,000 revolving credit facility due to expire on December 31, 2014, was replaced with a $10,000,000 revolving credit facility maturing in February 2016. The modified revolving credit facility has a tiered interest rate at LIBOR plus 3.25% to 4.25%. The Amended Loan Agreement contains certain financial and other covenants, including a fixed charge coverage ratio and leverage ratio. The Amended Loan Agreement is secured by all personal property and real estate assets of the Company.
F-111
DSM Pharmaceutical Products Group
Combined statements of comprehensive income
| EUR (thousands) | Notes | 31 December 2013 |
31 December 2012 |
31 December 2011 |
||||||||
| Revenue | 8 | 607,522 | 589,301 | 555,912 | ||||||||
| Cost of sales | 9 | (115,537 | ) |
(124,752 | ) |
(123,208 | ) |
|||||
| Gross profit | 491,985 | 464,549 | 432,705 | |||||||||
| Other income | 10 | 3,378 | 12,499 | 5,522 | ||||||||
| Work subcontracted and other external expenses | 11 | (276,944 | ) |
(283,868 | ) |
(261,928 | ) |
|||||
| Personnel expenses | 12 | (182,761 | ) |
(179,968 | ) |
(168,057 | ) |
|||||
| Other operating expenses | 14 | (10,171 | ) |
(13,963 | ) |
(7,840 | ) |
|||||
| Earnings before interest, tax, depreciation and amortization | 25,487 | (751 | ) |
401 | ||||||||
| Depreciation, amortization and impairment | 13 | (171,717 | ) |
(61,180 | ) |
(47,388 | ) |
|||||
| Results from operating activities | (146,230 | ) |
(61,931 | ) |
(46,987 | ) |
||||||
| Finance income | 15 | 2,669 | 6,553 | 8,613 | ||||||||
| Finance expense | 15 | (13,395 | ) |
(25,524 | ) |
(25,003 | ) |
|||||
| Net finance expense | (10,726 | ) |
(18,971 | ) |
(16,390 | ) |
||||||
| Share of profit / (loss) of joint ventures, net of tax | (1,553 | ) |
(3,924 | ) |
- | |||||||
| Profit / (loss) before tax | (158,509 | ) |
(84,826 | ) |
(63,377 | ) |
||||||
| Income tax credit / (expense) | 16 | 11,681 | 24,506 | 13,475 | ||||||||
| Profit / (loss) for the year attributable to owners of the Group | (146,828 | ) |
(60,320 | ) |
(49,902 | ) |
||||||
| Foreign currency translation differences of foreign operations | 15 | (5,095 | ) |
(3,446 | ) |
2,990 | ||||||
| Net change in fair value of cash flow hedges | 15 | 23 | 281 | (364 | ) |
|||||||
| - related income tax credit/(expense) | (6 | ) |
(70 | ) |
- | |||||||
| Net other comprehensive income to be reclassified to profit or loss in subsequent periods | (5,078 | ) |
(3,235 | ) |
2,626 | |||||||
| Defined benefit plan actuarial gains (losses) | (4,419 | ) |
(5,726 | ) |
(3,625 | ) |
||||||
| Tax on other comprehensive income | 1,093 | 2,628 | 1,467 | |||||||||
| Net other comprehensive income not being reclassified to profit or loss in subsequent periods | (3,326 | ) |
(3,098 | ) |
(2,158 | ) |
||||||
| Other comprehensive income / (loss), net of tax | (8,404 | ) |
(6,333 | ) |
468 | |||||||
| Total comprehensive income / (loss) attributable to owners of the Group | (155,232 | ) |
(66,653 | ) |
(49,434 | ) |
||||||
Due to the implementation of IFRS 11, the net result of Percivia LLC is shown on the line ‘Share of profit/(loss) of joint ventures, net of tax’ in 2013 and 2012, rather than being proportionally consolidated into each lines of the combined statement of comprehensive income in 2011. The year 2011 has not been adjusted for the implementation of IFRS 11.
F-112
DSM Pharmaceutical Products Group
Combined balance sheets
| EUR (thousands) | Notes | 31 December 2013 |
31 December 2012 |
||||||
| Assets |
|||||||||
| Intangible assets | 17 | 45,162 | 183,442 | ||||||
| Property, plant and equipment | 18 | 293,336 | 301,256 | ||||||
| Shares in joint ventures | 19 | 23,200 | 25,729 | ||||||
| Other non-current assets | 522 | 2,436 | |||||||
| Deferred tax assets | 16 | 16,953 | 12,556 | ||||||
| Total non-current assets | 379,173 | 525,419 | |||||||
| Inventories | 20 | 196,178 | 150,664 | ||||||
| Trade and other receivables | 21 | 102,193 | 130,903 | ||||||
| Receivable from related parties for carve-out adjustments | 22 | 146,516 | 162,032 | ||||||
| Loans to related parties | 23 | - | 287,000 | ||||||
| Cash and cash equivalents | 24 | 614,323 | 323,264 | ||||||
| Total current assets | 1,059,210 | 1,053,863 | |||||||
| Total assets | 1,438,383 | 1,579,282 | |||||||
| Net assets attributable to owners of the Group | 25 | 662,407 | 810,497 | ||||||
| Net Assets | 662,407 | 810,497 | |||||||
| Liabilities |
|||||||||
| Interest-bearing loans and borrowings | 27 | 290,786 | 224,141 | ||||||
| Post employment benefit obligation | 28 | 35,940 | 31,941 | ||||||
| Non-current provisions | 26 | 14,383 | 11,379 | ||||||
| Other non-current liabilities | 29 | 20,564 | 15,355 | ||||||
| Deferred tax liabilities | 16 | - | 4,158 | ||||||
| Total non-current liabilities | 361,673 | 286,974 | |||||||
| Interest-bearing loans and borrowings | 27 | 239,503 | 316,117 | ||||||
| Trade and other payables | 30 | 168,620 | 156,951 | ||||||
| Post employment benefit obligation | 28 | 1,146 | 1,318 | ||||||
| Current provisions | 26 | 5,034 | 7,425 | ||||||
| Total current liabilities | 414,303 | 481,811 | |||||||
| Total liabilities | 775,976 | 768,785 | |||||||
| Total net assets and liabilities | 1,438,383 | 1,579,282 | |||||||
Due to the implementation of IFRS 11, the net assets of Percivia LLC are shown on the line ‘Shares in joint ventures’ at the end of 2013 and 2012, rather than being proportionally consolidated into mainly the intangible assets line item of the combined balance sheet at the end of 2011. The year 2011 has not been adjusted for the implementation of IFRS 11.
F-113
DSM Pharmaceutical Products Group
Combined statements of changes in net assets attributable to owners of the Group
| EUR (thousands) | Notes | Total net assets |
||||
| Balance at 1 January 2011 | 916,175 | |||||
| Total comprehensive income for the year |
||||||
| Profit / (loss) for the year | (49,902 | ) |
||||
| Other comprehensive income |
||||||
| Foreign currency translation differences of foreign operations | 15 | 2,990 | ||||
| Net changes in fair value of cash flow hedges | 15 | (364 | ) |
|||
| - Related income tax credit/(expense) | 15 | 91 | ||||
| Defined benefit plan actuarial gains (losses) | (3,625 | ) |
||||
| - Related income tax credit/(expense) | 1,375 | |||||
| Other comprehensive income for the year | 467 | |||||
| Total comprehensive income for the year | (49,435 | ) |
||||
| Transactions with owners of the Group, recorded directly in equity: |
||||||
| Capital contribution | 25 | 17,532 | ||||
| Total transactions with owners of the Group | 17,532 | |||||
| Balance at 31 December 2012 | 884,272 | |||||
F-114
DSM Pharmaceutical Products Group
Combined statement of changes in net assets attributable to owners of the Group (continued)
| EUR (thousands) | Notes | Total net assets |
||||
| Balance at 1 January 2012 | 884,272 | |||||
| Total comprehensive income for the year |
||||||
| Profit / (loss) for the year | (60,320 | ) |
||||
| Other comprehensive income |
||||||
| Foreign currency translation differences of foreign operations | 15 | (3,446 | ) |
|||
| Net changes in fair value of cash flow hedges | 15 | 281 | ||||
| - Related income tax credit/(expense) | (70 | ) |
||||
| Defined benefit plan actuarial gains (losses) | (5,726 | ) |
||||
| - Related income tax credit/(expense) | 2,628 | |||||
| Other comprehensive income for the year | (6,333 | ) |
||||
| Total comprehensive income for the year | (66,653 | ) |
||||
| Transactions with owners of the Group, recorded directly in net assets: |
||||||
| Capital contribution | 25 | 1,878 | ||||
| Capital refund | 25 | (9,000 | ) |
|||
| Total transactions with owners of the Group | (7,122 | ) |
||||
| Balance at 31 December 2012 | 810,497 | |||||
| Total comprehensive income for the year |
||||||
| Profit / (loss) for the year | (146,828 | ) |
||||
| Other comprehensive income |
||||||
| Foreign currency translation differences of foreign operations | 15 | (5,095 | ) |
|||
| Net changes in fair value of cash flow hedges | 15 | 23 | ||||
| - Related income tax credit/(expense) | (6 | ) |
||||
| Defined benefit plan actuarial gains (losses) | (4,419 | ) |
||||
| - Related income tax credit/(expense) | 1,093 | |||||
| Other comprehensive income for the year | (8,404 | ) |
||||
| Total comprehensive income for the year | (155,232 | ) |
||||
| Transactions with owners of the Group, recorded directly in net assets: |
||||||
| Capital contribution | 25 | 7,142 | ||||
| Total transactions with owners of the Company | 7,142 | |||||
| Balance at 31 December 2013 | 662,407 | |||||
F-115
DSM Pharmaceutical Products Group
Combined cash flow statements
| EUR (thousands) | Notes | 31 December 2013 |
31 December 2012 |
31 December 2011 |
||||||||
| Cash flows from operating activities |
||||||||||||
| Profit for the year | (146,828 | ) |
(60,320 | ) |
(49,902 | ) |
||||||
| Income tax | 16 | (11,681 | ) |
(24,506 | ) |
(13,475 | ) |
|||||
| Profit before income tax benefit | (158,509 | ) |
(84,826 | ) |
(63,377 | ) |
||||||
| Share of the profit of joint ventures | 1,553 | 3,924 | - | |||||||||
| Other financial income and expense | 15 | 1,099 | 58 | 2 | ||||||||
| Interest costs | 15 | 9,627 | 18,913 | 16,388 | ||||||||
| Operating profit | (146,230 | ) |
(61,931 | ) |
(46,987 | ) |
||||||
| Depreciation, amortization and impairments | 13 | 171,717 | 61,180 | 47,388 | ||||||||
| Earnings before interest, tax, depreciation and amortization | 25,487 | (751 | ) |
401 | ||||||||
| Adjustment for: |
||||||||||||
| Change in provisions | 612 | 4,721 | (536 | ) |
||||||||
| Defined benefit plans | (230 | ) |
19 | 218 | ||||||||
| Government grants received / (released) | 1,602 | 6,330 | (479 | ) |
||||||||
| Other | 7,065 | (462 | ) |
(829 | ) |
|||||||
| Exchange rate difference | (4,218 | ) |
(3,096 | ) |
84 | |||||||
4,831 | 7,512 | (1,542 | ) |
|||||||||
| Interest received | 2,682 | 6,577 | 8,645 | |||||||||
| Interest paid | (12,309 | ) |
(25,486 | ) |
(25,028 | ) |
||||||
| Income tax received | 31,748 | 23,119 | 13,014 | |||||||||
| Income tax paid | (5,815 | ) |
(1,654 | ) |
- | |||||||
16,306 | 2,556 | (3,369 | ) |
|||||||||
| Decrease / (increase) in inventories | (47,225 | ) |
(14,569 | ) |
(10,014 | ) |
||||||
| Decrease / (increase) in trade and other receivables | 8,961 | 36,261 | 2,997 | |||||||||
| Increase / (decrease) in payables | 26,406 | 7,001 | 15,202 | |||||||||
| Changes in other working capital | (2,200 | ) |
121,389 | 13,742 | ||||||||
| Net cash from (used in) operating activities | 32,566 | 159,399 | 17,417 | |||||||||
| Cash flows from investing activities |
||||||||||||
| Purchase of property, plant and equipment | 18 | (37,267 | ) |
(47,287 | ) |
(26,836 | ) |
|||||
| Purchase of intangible assets | 17 | (3,219 | ) |
(2,109 | ) |
(3,175 | ) |
|||||
| Proceeds from disposal of property, plant and equipment | 18 | 25 | 686 | 43 | ||||||||
| Change in fixed-term deposits | - | (46 | ) |
1,812 | ||||||||
| Change in loans granted | 287,000 | - | (3 | ) |
||||||||
| Capital payments and acquisitions | - | (3,126 | ) |
(14 | ) |
|||||||
| Proceeds from disposals | - | - | 2 | |||||||||
| Net cash used in investing activities | 246,539 | (51,882 | ) |
(28,171 | ) |
|||||||
| Cash flows from financing activities |
||||||||||||
| Loans taken up | 120,742 | 197,232 | 55,898 | |||||||||
| Capital refund | 25 | - | (9,000 | ) |
- | |||||||
| Repayment of loans | (125,532 | ) |
(287,233 | ) |
(33,648 | ) |
||||||
| Change in in-house cash | 9,228 | (13,991 | ) |
8,342 | ||||||||
| Capital contributions | 25 | 7,142 | 1,878 | 17,531 | ||||||||
| Net cash from financing activities | 11,580 | (111,114 | ) |
48,123 | ||||||||
| Net increase / (decrease) in cash and cash equivalents | 290,685 | (3,597 | ) |
37,369 | ||||||||
| Cash and cash equivalents at 1 January | 323,264 | 326,882 | 290,927 | |||||||||
| Translation differences on cash and bank balances | 374 | (21 | ) |
(37 | ) |
|||||||
| Cash and cash equivalents at 31 December | 614,323 | 323,264 | 328,260 | |||||||||
Due to the implementation of IFRS 11, the cash flows of Percivia LLC are not shown in each line item of the combined cash flow statements of 2013 and 2012. In 2011 the cash flows are proportionally consolidated into each line item. The year 2011 has not been adjusted for the implementation of IFRS 11.
F-116
DSM Pharmaceutical Products Group
Notes to the non-statutory combined financial statements
1. Corporate information
DSM Pharmaceutical Products Group (DPP) is a business group within Koninklijke DSM N.V. (Royal DSM).The ultimate parent of the group is Royal DSM. The entities were under common control of Royal DSM during the reporting period. The reporting period comprises 2013, 2012 and 2011. During the reporting period the single entities acted as separate reporting entities within Royal DSM.
Furthermore, the combined group of entities have been subject to a separate business group management during the reporting period.
The DPP group is one of the world’s leading suppliers of high-quality custom manufacturing and development services to the pharmaceutical, biopharmaceutical and crop protection industries. Many of today’s medicines around the world contain ingredients produced by DPP. Customers around the world are serviced from two research and development sites and seven manufacturing sites with a range of clinical to commercial capacity in the US and Europe.
Among these customers are nine of the top ten pharmaceutical companies as well as the top crop protection companies. In addition, DPP serves a large number of biotech, specialty and emerging pharma companies across the globe. DPP’s facilities have been approved by the US Food and Drug Administration (FDA) and similar agencies in Europe, the Middle East, Africa and Japan. DSM Pharmaceuticals, lnc. is licensed by the US Drug Enforcement Administration to manufacture scheduled drugs.
The underlying non-statutory combined financial statements, prepared for the purpose of providing updated financial information to the prospective shareholders of the Group and lenders who are party to the financing of the third party joint venture transaction, were approved by the DPP business group management on 14 March 2014. The combined financial statements contained in this registration statement represent the previously issued non-statutory combined financial statements for the year ended 31 December 2013 and 31 December 2012 and also includes financial information for the year ended 31 December 2011 (hereafter: combined financial statements).
The financial information for the year ended 31 December 2011 has been derived from the non-statutory combined financial statements of the Group for the years ended 31 December 2010, 2011 and 2012 that were prepared for the purpose of including the financial information in a prospectus in view of a potential third party joint venture transaction and approved by the DPP business group management on 16 October 2013. Financial information for the year ended 31 December 2011, included in these non-statutory combined financial statements have therefore not been adjusted for the implementation of IFRS 11 effective 1 January 2013 (see Note 5).
DPP’s registered business group office was located at 45 Waterview Boulevard, Parsippany (US).
2. Basis of preparation
The Group’s combined financial statements combine the accounts of the top holding companies and their direct and indirect subsidiaries. This scope corresponds to all business operations supervised and controlled by DPP group management. DPP management is appointed and empowered by the Managing Board of Royal DSM, the ultimate shareholders of the Group, holding all of the shares of the top holding companies, referred to above, and their direct and indirect subsidiaries.
Although no single legal parent company exists, management believes that DPP meets the definition of a reporting entity under International Financial Reporting Standards (IFRS).
The Group represents a defined area of economic activities whose financial information has the potential to be useful to users of financial statements and has the following features:
| • | The economic activities can be objectively distinguished from those of other entities and from the economic environment in which the Group exists; and |
F-117
| • | Financial information about the economic activities of the Group has the potential to be useful in making decisions about providing resources to the Group and in assessing whether management has made efficient and effective use of the resources provided. |
Due to the inherent limitations of carving out activities from larger entities, these combined financial statements may not necessarily reflect the Group’s results of operations, financial position, and cash flows for future periods, nor do they reflect the results of operations, financial position, and cash flows that would have been realized had the Group been a stand-alone entity during the periods presented.
As a result management believes that this basis of preparation results in a true and fair presentation of management’s financial position, financial performance, cash flows and that the combined financial statements comply in all material aspects with IFRS.
The combined financial statements of DPP have been prepared to present the financial position, the financial performance and the cash flows of this Group. Consequently, the combined financial statements of DPP are a combination of the accounts of the entities described in the basis of the combination in note 3.
The combined financial statements of DPP have been prepared in accordance with IFRS as issued by the International Accounting Standards Board (IASB) and have been prepared in accordance with IFRS effective at 1 January 2013.
The combined financial statements of DPP have been prepared based on combining the reporting packages of the single entities, resulting in the combined statement of financial position, the combined statement of comprehensive income, the combined statement of changes in net assets attributable to owners of the Group and the combined statement of cash flows. The reporting packages of the entities are prepared for the same reporting period as the parent company.
The single entities submitted their reporting packages within Royal DSM based on DSM Accounting Rules (DAR), which are in line with International Financial Reporting Standards as adopted by the EU. As described in Note 5, DPP applies IFRS 11 from 1 January 2013 onwards. Financial information for the year ended 31 December 2012 has been adjusted for IFRS 11. However, financial information for the year ended 31 December 2011 has not been adjusted for IFRS 11. Otherwise, IFRS has been applied consistently during the years 2011, 2012 and 2013 and no other change in accounting framework is applicable. These combined financial statements are based on full IFRS, which in this case is similar to IFRS as adopted by the EU, as the exemption which is not adopted by the EU is not applicable for DPP.
In preparation of these combined financial statements, certain carve-out adjustments were made in order to more properly reflect the financial position of the combined group of entities which will be contributed into the potential partnership. The following adjustments have been made to the combined statements:
Corporate provisions – Provisions related to DPP, which were recorded on a DSM corporate level during the reporting period, have been included in the financial statements, impacting both the balance sheet and income statement.
Greenville Land – The land of the site in Greenville which was recorded entirely within DPP is split between DPP and Royal DSM for the purposes of these combined financial statements. The split is based on the actual total acres, impacting the property, plant, and equipment and receivables, as it is expected that the amount will be settled with Royal DSM.
Shares in subsidiaries – The shares of non-DPP entities that were included in DPP have been eliminated, impacting the shares in subsidiaries, share in results of subsidiaries and receivables, as it is expected that the amount will be settled with Royal DSM.
Taxes – Certain tax positions will not be included in the joint venture transaction and therefore have been carved out in view of these combined financial statements, impacting the tax positions and receivables, as it is expected that the amount will be settled with Royal DSM.
F-118
Receivable from related parties for carve out adjustments – The impact of the carve-out adjustments has been reflected in a receivable from related parties. It is assumed that the settlement of these items will be made with Royal DSM.
The above described basis of preparation has a specific impact on mainly three accounts included in these combined financial statements:
Net assets attributable to the owners
This account represents the accumulated equity of the top holding entity included in the Group.
Finance structure
The finance structure of the Group, which may change after a transaction, has been accounted for as reported by the entities and reflects the actual finance structure on the balance sheet date.
Receivable from related parties for carve-out adjustments
This account relates to the settlement with Royal DSM after a transaction and with that settlement excludes all non-DPP related items.
Amounts are stated in Euros, rounded to the nearest thousand, unless otherwise indicated.
3. Basis of combination
As of 31 December 2013, the Group includes all managerial units of DPP along with the related legal holding companies to which they belong, the particulars of which are set out below:
| Place of incorporation |
Currency | Nominal value of issued share capital |
Percentage of equity attributable to the Group |
|||||||||||||
| Company | 2013 | 2012 | 2011 | |||||||||||||
| DSM Pharma Chemicals Regensburg.GmbH | Germany | EUR | € 10,225,838 | 100 | % |
100 | % |
100 | % |
|||||||
| DSM Pharma Chemicals Venlo BV | The Netherlands | EUR | € 228,251 | 100 | % |
100 | % |
100 | % |
|||||||
| DSM Pharmaceutical Products Inc | USA | USD | € 73 | 100 | % |
100 | % |
100 | % |
|||||||
| DSM Pharmaceuticals Inc. | USA | USD | € 482,833,200 | 100 | % |
100 | % |
100 | % |
|||||||
| Percivia LLC | USA | USD | € 21,201,919 | 50 | % |
50 | % |
50 | % |
|||||||
| DSM Pharma Chemicals North America, Inc | USA | USD | € (4,464,102 | ) |
100 | % |
100 | % |
100 | % |
||||||
| DSM Fine Chemicals Austria Nfg GmbH Co | Austria | EUR | € 10,900,925 | 100 | % |
100 | % |
100 | % |
|||||||
| DSM Biologics Company BV | The Netherlands | EUR | € 1,932,650 | 100 | % |
100 | % |
100 | % |
|||||||
| DSM Biologics Company Australia Pty LTD | Australia | AUD | € 8,537,372 | 100 | % |
100 | % |
100 | % |
|||||||
| DSM Biologics Holdings Inc. | Canada | CAD | € 19,642,373 | 100 | % |
100 | % |
100 | % |
|||||||
| DSM BioSolutions BV | The Netherlands | EUR | € 7,335,000 | 100 | % |
100 | % |
100 | % |
|||||||
| DSM Capua SPA | Italy | EUR | € 31,370,000 | 100 | % |
100 | % |
100 | % |
|||||||
| DSM Life Science Products International GmbH | Austria | EUR | € 130,474,217 | 100 | % |
100 | % |
100 | % |
|||||||
| DSM Agro Services BV | The Netherlands | EUR | € 72,604,835 | 100 | % |
100 | % |
100 | % |
|||||||
| DSM Fine Chemicals GmbH | Austria | EUR | € 17,500 | 100 | % |
100 | % |
100 | % |
|||||||
| Chemiepark Linz Betriebsfeuerwher Gmbh | Austria | EUR | € 143,925 | 48 | % |
48 | % |
48 | % |
|||||||
All units of DPP with 100% of equity attributable to the Group are combined on the individual line items of the combined financial statements. For the years 2013 and 2012 the units of DPP with 50% or less equity attributable to the Group are accounted for using the equity method in the combined financial statements and presented wholly on the share in joint ventures line for the net asset balance and on the share in profits or losses in joint ventures line on the combined statement of income and comprehensive income. For the year 2011 the unit with 50% equity attributable to the Group (Percivia LLC) was proportionately consolidated in the combined financial statements on a 50% proportionate basis. The different accounting treatment is a result of the implementation of IFRS 11 as per 1 January 2013 (with adjustment of the information for the financial year up to 31 December 2012), reference is made to paragraph 5 for more details on this matter.
All intra-group balances, transactions, unrealized gains and losses resulting from intra-group transactions and dividends are eliminated on combination.
F-119
4. Significant accounting judgment, estimates and assumptions
The management of the Group makes various judgments and estimates when applying the accounting policies and rules for preparing the financial statements. The main principal judgments and estimates, including underlying assumptions, are set out below.
4.1 Impairment
Plant, machinery and other equipment are recorded at cost, and depreciation is recorded on a straight-line basis over the useful lives of the assets. Management use their experience to estimate the remaining useful life and residual value of an asset.
When there are indications that the carrying amount of a noncurrent asset (an intangible asset or an item of property, plant and equipment) may exceed the estimated recoverable amount (the higher of its value in use and fair value less costs to sell), the possible existence of an impairment loss is investigated. If an asset does not generate largely independent cash flows, the recoverable amount is determined for the cash generating unit to which the asset belongs. In assessing the value in use, the estimated future cash flows are discounted to their present value using a pre-tax discount rate that reflects current market interest rates and the risks specific to the asset.
When the recoverable amount of a non-current asset is less than its carrying amount, the carrying amount is impaired to its recoverable amount and an impairment charge is recognized in the income statement. An impairment loss is reversed when there has been a change in estimate that is relevant for the determination of the asset’s recoverable amount since the last impairment loss was recognized. All financial assets are reviewed for impairment. If there is objective evidence of impairment as a result of one or more events after initial recognition, an impairment loss is recognized in the income statement. Impairment losses for goodwill are not reversed.
The annual impairment tests for non-current assets are performed in the fourth quarter. The recoverable amount of the cash generating units concerned is based on a value-in-use calculation. The cash flow projections are derived from the Group’s business plan (Business Strategy Dialogue). Cash flow projections beyond the Group’s business plan planning period are extrapolated taking into account the growth rates or specific actions that have been determined to apply for the specific cash generating unit in the Annual Strategic Review.
The growth rates are determined based on market developments in the global and regional pharmaceutical industry and are above market developments in case specific growth possibilities are available for specific cash generating units.
The terminal value for the period after ten years is determined with the assumption of no growth except for investments which are included based on an assessment of useful life and on-going maintenance investments.
The pre-tax discount rate used is based on the identified risk profile of the cash generating unit and the global approach to funding in the Group and disclosed in note 17 in detail.
4.2 Percentage of completion
Within DPP, the percentage of completion method is utilized to recognize revenue related to single customer, make to order business where the production only occurs when firm orders are in place. Under the percentage of completion method, revenue is recognized in the accounting periods in which the services are rendered. Actual production is monitored on a monthly basis to ensure that it is in-line with the firm order with the customer. Recognition of sales and margin are based on the production schedule and therefore determining the level of production is deemed to an important judgment in view of revenue recognition.
4.3 Deferred tax assets
Deferred tax assets related to compensating tax losses not set-off are formed in so far as it is probable that profit for tax purposes will be available against which this can be set-off. In order to
F-120
determine the value of the deferred tax assets arising from tax losses compensating, a considerable degree of management assessment is required regarding the probable timing and level of the future taxable profits, combined with future fiscal planning strategies.
4.4 Pension benefits
The cost of the defined benefit pension plan and other post-employment medical benefits and the present value of the pension obligation are determined using actuarial valuations. An actuarial valuation involves making various assumptions that may differ from actual developments in the future. These include the determination of the discount rate, future salary increases, mortality rates and future pension increases. Due to the complexity of the valuation and its long-term nature, a defined benefit obligation is highly sensitive to changes in these assumptions. All assumptions are reviewed at each reporting date.
5. Impact of application of new IFRS standards
The following new IFRS standards have been identified:
IAS 1, Presentation of Items of Other Comprehensive Income – Amendments to IAS 1
The amendments to IAS 1 change the grouping of items presented in other comprehensive income (OCI). Items that could be reclassified (or ‘recycled’) to profit or loss at a future point in time (for example, net gain on hedge of net investment, exchange differences on translation of foreign operations, net movement on cash flow hedges and net loss or gain on available-for-sale financial assets) would be presented separately from items that will not be reclassified (for example, actuarial gains and losses on defined benefits plans and revaluation of land and buildings). The amendment affects presentation only and has no impact on the Group’s financial position or results.
IAS 19R Employee Benefits
IAS 19R ‘Employee Benefits’ came into effect from 1 January 2013 and various amendments have been introduced that, among other things, result in the removal of the corridor mechanism, a change in the concept of expected returns on plan assets and in the presentation of interest expense and return on plan assets in financial income and expense. From 1 January 2013 onwards DPP applies the revised IAS 19 ‘Employee Benefits’. This has resulted in a changed presentation for pension costs and in a different approach to measurement. The expected return on pension assets is no longer used for the determination of annual pension costs. Instead, interest costs or benefits are calculated on the net balance of pension assets and liabilities. Furthermore, return on plan assets and interest costs on defined benefit obligations, which used to be reported in EBITDA as part of ‘Personnel expenses’, are reported in financial income and expense from 1 January 2013 onwards. There is no impact on total net assets since the amount only shifts from in EBITDA to below EBITDA. The impact of these changes on prior year financial statements is not material, therefore no restatements have been presented in these financial statements.
IAS 28 Investments in Associates and Joint Ventures (as revised in 2011)
As a consequence of the new IFRS 11 Joint Arrangements, and IFRS 12 Disclosure of Interests in Other Entities, IAS 28 Investments in Associates, has been renamed IAS 28 Investments in Associates and Joint Ventures, and describes the application of the equity method to investments in joint ventures in addition to associates. This had no impact on these combined financial statements.
IAS 36 Impairment of Assets – Recoverable Amount Disclosures for Non-financial Assets
The amendments remove the unintended consequences of IFRS 13 on the disclosures required under IAS 36. In addition, these amendments require disclosure of the recoverable amounts for the assets or CGUs for which impairment losses have been recognized or reversed during the period. These
F-121
amendments are effective retrospectively for annual periods beginning on or after 1 January 2014 with earlier application permitted, provided IFRS 13 is also applied. The amendments to IAS 36 have been early adopted and their impact is shown in the relevant notes in these combined financial statements.
IFRS 7 Disclosures Offsetting Financial Assets and Financial Liabilities — Amendments to IFRS 7
These amendments require an entity to disclose information about rights to set-off and related arrangements (e.g., collateral agreements). The disclosures would provide users with information that is useful in evaluating the effect of netting arrangements on an entity’s financial position. The new disclosures are required for all recognized financial instruments that are set off in accordance with IAS 32 Financial Instruments: Presentation. The disclosures also apply to recognized financial instruments that are subject to an enforceable master netting arrangement or similar agreement, irrespective of whether they are set off in accordance with IAS 32. The amendment has no impact on the Group.
IFRS 10 Consolidated Financial Statements, IAS 27 Separate Financial Statements
IFRS 10 establishes a single control model that applies to all entities including special purpose entities. IFRS 10 replaces the parts of previously existing IAS 27 Consolidated and Separate Financial Statements that dealt with consolidated financial statements and SIC-12 Consolidation – Special Purpose Entities. IFRS 10 changes the definition of control such that an investor controls an investee when it is exposed, or has rights, to variable returns from its involvement with the investee and has the ability to affect those returns through its power over the investee. To meet the definition of control in IFRS 10, all three criteria must be met, including: (a) an investor has power over an investee; (b) the investor has exposure, or rights, to variable returns from its involvement with the investee; and (c) the investor has the ability to use its power over the investee to affect the amount of the investor’s returns. IFRS 10 had no impact on the consolidation of investments held by the Group.
IFRS 11 Joint Arrangements and IAS 28 Investment in Associates and Joint Ventures
IFRS 11 replaces IAS 31 Interests in Joint Ventures and SIC-13 Jointly-controlled Entities — Non-monetary Contributions by Venturers. IFRS 11 removes the option to account for jointly controlled entities (JCEs) using proportionate consolidation. Instead, JCEs that meet the definition of a joint venture under IFRS 11 must be accounted for using the equity method. The application of this new standard impacted the financial position of the Group by replacing proportionate consolidation of the joint venture with the equity method of accounting. IFRS 11 is effective for annual periods beginning on or after 1 January 2013. From 1 January 2013 onwards DPP applies IFRS 11, 'Joint Arrangements', which mandates the use of the equity method for jointly controlled entities that meet the new definition of a joint venture. Due to the introduction of this new standard the investment in Percivia LLC is presented as a joint venture and proportionate consolidation is terminated. Comparative numbers have been adjusted accordingly. As a result of the change, the primary impact on the balance sheet resulted in the exclusion of intangible assets of € 24.0 million as of 31 December 2013 and € 25.9 million as of 31 December 2012. These amounts make up the majority of the balance now shown as the shares in associates. There is no impact on total net assets since the amount only shifts from individual line items to a net amount presented as shares in joint ventures. The impact on the income statement as a result of the change is the exclusion of EBITDA in the amount of € 0.3 million for the period 1 January 2013 – 31 December 2013 and negative € 3.6 million for the period 1 January 2012 – 31 December 2012. The EBITDA impact, which was primarily related to net sales, work subcontracted and other operating expenses in 2012 and net sales and work subcontracted in 2013, is now included as part of a net amount on the line ‘Share of profit / (loss) of associates, net of tax’. Financial information for the year ended 31 December 2011 has not been adjusted for the implementation of IFRS 11 effective 1 January 2013.
F-122
IFRS 12 Disclosure of Interests in Other Entities
IFRS 12 includes all of the disclosures that were previously in IAS 27 related to consolidated financial statements, as well as all of the disclosures that were previously included in IAS 31 and IAS 28. These disclosures relate to an entity’s interests in subsidiaries, joint arrangements, associates and structured entities. A number of new disclosures are also required, which are included in these combined financial statements.
IFRS 13 Fair Value Measurement
IFRS 13 establishes a single source of guidance under IFRS for all fair value measurements. IFRS 13 does not change when an entity is required to use fair value, but rather provides guidance on how to measure fair value under IFRS when fair value is required or permitted. The application of IFRS 13 has not materially impacted the fair value measurements carried out by the Group. IFRS 13 also requires specific disclosures on fair values, some of which replace existing disclosure requirements in other standards, including IFRS 7 Financial Instruments: Disclosures. Some of these disclosures are specifically required for financial instruments by IAS 34.16A(j), thereby affecting the combined financial statements period.
6. Summary of significant accounting policies
6.1 Foreign currency translation
The presentation currency of the group is the euro.
Each entity of the Group records transactions and balance sheet in its functional currency. Transactions denominated in currency other than the functional currency are recorded at the spot exchange rates prevailing at the date of the transactions. Monetary assets and liabilities denominated in a currency other than the functional currency of the entity are translated at the closing rates. Exchange differences resulting from the settlement of these transactions and from the translation of monetary items are recognized in the income statement.
Non-monetary assets denominated in a currency other than the functional currency continue to be translated against the rate at initial recognition and will not result in exchange differences.
On combination, the balance sheets of subsidiaries and joint ventures whose functional currency is not the euro are translated into euro at the closing rate. The income statements of these entities are translated into euro at the average rates for the relevant period. Goodwill paid on acquisition is recorded in the functional currency of the acquired entity. Exchange differences arising from the translation of the net investment in entities with a functional currency other than the euro are recorded in Other comprehensive income. The same applies to exchange differences arising from borrowings and other financial instruments in so far as they hedge the currency risk related to the net investment. On disposal of an entity with a functional currency other than the euro, the cumulative exchange differences relating to the translation of the net investment are recognized in the income statement.
6.2 Distinction between current and non-current
An asset (liability) is classified as current when it is expected to be realized (settled) within 12 months after the balance sheet date.
6.3 Impairment of assets
When there are indications that the carrying amount of a noncurrent asset (an intangible asset or an item of property, plant and equipment) may exceed the estimated recoverable amount (the higher of its value in use and fair value less costs to sell), the possible existence of an impairment loss is investigated. If an asset does not generate largely independent cash flows, the recoverable amount is determined for the cash generating unit to which the asset belongs. In assessing the value in use, the estimated future cash flows are discounted to their present value using a pre-tax discount rate that reflects current market interest rates and the risks specific to the asset.
F-123
When the recoverable amount of a non-current asset is less than its carrying amount, the carrying amount is impaired to its recoverable amount and an impairment charge is recognized in the income statement. An impairment loss is reversed when there has been a change in estimate that is relevant for the determination of the asset’s recoverable amount since the last impairment loss was recognized.
All financial assets are reviewed for impairment. If there is objective evidence of impairment as a result of one or more events after initial recognition, an impairment loss is recognized in the income statement. Impairment losses for goodwill and other participations are never reversed.
6.4 Intangible assets
Business combinations are accounted for using the acquisition method. The cost of an acquisition is measured as the aggregate of the consideration transferred measured at acquisition date fair value and the amount of any non-controlling interests in the acquiree. For each business combination, the Group elects whether to measure the non-controlling interests in the acquiree at fair value or at the proportionate share of the acquiree’s identifiable net assets. Acquisition-related costs are expensed as incurred and included in administrative expenses.
When the Group acquires a business, it assesses the financial assets and liabilities assumed for appropriate classification and designation in accordance with the contractual terms, economic circumstances and pertinent conditions as at the acquisition date. This includes the separation of embedded derivatives in host contracts by the acquiree.
If the business combination is achieved in stages, any previously held equity interest is re-measured at its acquisition date fair value and any resulting gain or loss is recognised in the statement of comprehensive income. It is then considered in the determination of goodwill.
Goodwill is initially measured at cost, being the excess of the aggregate of the consideration transferred and the amount recognised for non-controlling interests, and any previous interest held, over the net identifiable assets acquired and liabilities assumed. If the fair value of the net assets acquired is in excess of the aggregate consideration transferred, the Group re-assesses whether it has correctly identified all of the assets acquired and all of the liabilities assumed and reviews the procedures used to measure the amounts to be recognised at the acquisition date. If the re-assessment still results in an excess of the fair value of net assets acquired over the aggregate consideration transferred, then the gain is recognised in the statement of comprehensive income.
After initial recognition, goodwill is measured at cost less any accumulated impairment losses. For the purpose of impairment testing, goodwill acquired in a business combination is, from the acquisition date, allocated to each of the Group’s cash-generating units that are expected to benefit from the combination, irrespective of whether other assets or liabilities of the acquiree are assigned to those units.
Intangible assets acquired in a business combination are recognized at fair value on the date of acquisition and subsequently amortized over their expected useful lives, which vary from 4 to 20 years.
Acquired licenses, patents and application software are carried at historical cost less straight-line amortization and less any impairment losses. The expected useful lives vary from 4 to 15 years. Costs of software maintenance are expensed when incurred. Capital expenditure that is directly related to the development of application software is recognized as an intangible asset and amortized over its estimated useful life, which vary from 5 to 8 years.
Research costs are expensed when incurred. Development expenditure is capitalized if the recognition criteria are met and if it is demonstrated that it is technically feasible to complete the asset, that the entity intends to complete the asset, that the entity is able to sell the asset, that the asset is capable of generating future economic benefits, that adequate resources are available to complete the asset and that the expenditure attributable to the asset can be reliably measured. Development expenditure is amortized over the asset’s useful life, which vary from 4 to 10 years.
F-124
6.5 Property, plant and equipment
Property, plant and equipment are measured at cost less depreciation calculated on a straight-line basis and less any impairment losses. Interest during construction is capitalized. Expenditures relating to major scheduled turnarounds are capitalized and depreciated over the period up to the next turnaround.
Property, plant and equipment are systematically depreciated over their estimated useful lives. The estimated remaining lives of assets are reviewed every year, taking account of commercial and technological obsolescence as well as normal wear and tear. The initially assumed expected useful lives are in principle as follows: for buildings 10-50 years, for plant and machinery 5-15 years, for other equipment 4-10 years. Land is not depreciated.
An item of property, plant and equipment is derecognized upon disposal or when no future economic benefits are expected to arise from the continued use or the sale of the asset. Any gain or loss arising on derecognition of the asset is recorded in the income statement.
6.6 Associates and joint ventures
An associate is an entity over which the Group has significant influence. Significant influence is the power to participate in the financial and operating policy decisions of the investee, but is not control or joint control over those policies.
A joint venture is a type of joint arrangement whereby the parties that have joint control of the arrangement have rights to the net assets of the joint venture. Joint control is the contractually agreed sharing of control of an arrangement, which exists only when decisions about the relevant activities require unanimous consent of the parties sharing control.
The considerations made in determining significant influence or joint control are similar to those necessary to determine control over subsidiaries.
The Group’s investments in its associate and joint venture are accounted for using the equity method.
Under the equity method, the investment in an associate or a joint venture is initially recognized at cost. The carrying amount of the investment is adjusted to recognize changes in the Group’s share of net assets of the associate or joint venture since the acquisition date. Goodwill relating to the associate or joint venture is included in the carrying amount of the investment and is neither amortized nor individually tested for impairment.
The statement of profit or loss reflects the Group’s share of the results of operations of the associate or joint venture. Any change in OCI of those investees is presented as part of the Group’s OCI. In addition, when there has been a change recognized directly in the equity of the associate or joint venture, the Group recognizes its share of any changes, when applicable, in the statement of changes in equity. Unrealized gains and losses resulting from transactions between the Group and the associate or joint venture are eliminated to the extent of the interest in the associate or joint venture.
The aggregate of the Group’s share of profit or loss of an associate and a joint venture is shown on the face of the statement of comprehensive income outside EBITDA and represents profit or loss after tax and non-controlling interests in the subsidiaries of the associate or joint venture.
The financial statements of the associate or joint venture are prepared for the same reporting period as the Group. When necessary, adjustments are made to bring the accounting policies in line with those of the Group.
After application of the equity method, the Group determines whether it is necessary to recognize an impairment loss on its investment in its associate or joint venture. At each reporting date, the Group determines whether there is objective evidence that the investment in the associate or joint
F-125
venture is impaired. If there is such evidence, the Group calculates the amount of impairment as the difference between the recoverable amount of the associate or joint venture and its carrying value, then recognizes the loss as ‘Share of profit of an associate and a joint venture’ in the statement of profit or loss.
Upon loss of significant influence over the associate or joint control over the joint venture, the Group measures and recognizes any retained investment at its fair value. Any difference between the carrying amount of the associate or joint venture upon loss of significant influence or joint control and the fair value of the retained investment and proceeds from disposal is recognized in profit or loss.
As mentioned in paragraph 3, as per 1 January 2013 DPP implemented IFRS 11. Therefore for 2013 and 2012 joint ventures are accounted for using the equity method. For the year 2011 joint ventures were proportionately consolidated in the combined financial statements.
6.7 Other financial assets
Other financial assets comprise other participations, other receivables and other deferred items.
Other participations comprise equity interests in entities in which DSM has no significant influence; they are accounted for as available-for-sale securities. These other participations are measured against fair value, with changes in fair value being recognized in Other comprehensive income. A significant or prolonged decline of the fair value of an equity interest below cost represents an impairment, which is recognized in the income statement. On disposal, the cumulative fair value adjustments of the related other participations are released from equity and included in the income statement. If a reliable fair value cannot be established, the other participations are recognized at cost. The proceeds from these other participations and the gain or loss upon their disposal are recognized in the income statement.
Loans and long-term receivables are measured at fair value upon initial recognition and subsequently at amortized cost, if necessary after deduction of a value adjustment for bad debts. The proceeds from these assets and the gain or loss upon their disposal are recognized in the income statement.
6.8 Financial derivatives
The group uses financial derivatives such as foreign currency forward contracts and interest rate swaps to hedge risks associated with foreign currency and interest rate fluctuations. Financial derivatives are initially recognized in the balance sheet at fair value excluding transaction costs and subsequently measured at their fair value on each balance sheet date. Changes in fair value are recognized in the income statement unless cash flow hedge accounting or net investment hedge accounting is applied.
Changes in the fair value of financial derivatives designated and qualifying as cash flow hedges are recognized in Other comprehensive income (Hedging reserve) to the extent that the hedge is effective. Upon recognition of the related asset or liability the cumulative gain or loss is transferred from the Hedging reserve and included in the carrying amount of the hedged item if it is a non-financial asset or liability. If the hedged item is a financial asset or liability, the cumulative gain or loss is transferred to profit or loss. Changes in the fair value of financial derivatives designated and qualifying as net investment hedges are recognized in Other comprehensive income to the extent that the hedge is effective and the change in fair value is caused by changes in currency exchange rates. Accumulated gains and losses are released from Other comprehensive income and are included in the income statement when the net investment is disposed of. Changes in the fair value of financial derivatives designated and qualifying as fair value hedges are immediately recognized in the income statement, together with any changes in the fair value of the hedged assets or liabilities attributable to the hedged risk.
6.9 Inventories
Inventories are stated at the lower of cost and net realizable value. The first in, first out (FIFO) method of valuation is used unless the nature of the inventories requires the use of a different cost
F-126
formula, in which case the weighted average cost method is used. The cost of intermediates and finished goods includes directly attributable costs and related production overhead expenses. Net realizable value is determined as the estimated selling price in the ordinary course of business, less the estimated costs of completion and the estimated costs necessary to make the sale. Products whose manufacturing costs cannot be calculated because of joint cost components are stated at net realizable value after deduction of a margin for selling and distribution efforts.
6.10 Current receivables
Current receivables are measured at amortized cost, which generally corresponds to nominal value, less an adjustment for bad debts.
6.11 Cash and cash equivalents
Cash and cash equivalents comprise cash at bank and in hand and deposits held at call with banks with a maturity of less than three months at inception. Bank overdrafts are included in current liabilities. Cash and cash equivalents are measured at nominal value.
6.12 Net assets attributable to owners of the Group
DPP’s net assets represent the combination of the retained earnings of the group along with net capital contributions by the owners of the Group. This amount is adjusted based on the impact of foreign currency translation adjustments of foreign operations, net changes in fair value of cash flow hedges, and any actuarial gains or losses on defined benefit plans.
6.13 Provisions
Provisions are recognized when all of the following conditions are met: 1) there is a present legal or constructive obligation as a result of past events; 2) it is probable that a transfer of economic benefits will settle the obligation; and 3) a reliable estimate can be made of the amount of the obligation.
The probable amount required to settle long-term obligations is discounted if the effect of discounting is material. Where discounting is used, the increase in the provision due to the passage of time is recognized as interest costs. However, the interest costs relating to pension obligations are included in pension costs.
6.14 Loans and borrowings
Borrowings are initially recognized at cost, being the fair value of the proceeds received, net of transaction costs. Subsequently, borrowings are stated at amortized cost using the effective interest method. Amortized cost is calculated by taking into account any discount or premium. Interest expenses are accrued and recorded in the income statement for each period.
6.15 Borrowing costs
Borrowing costs directly attributable to the acquisition, construction or production of an asset that necessarily takes a substantial period of time to get ready for its intended use or sale are capitalized as part of the costs of the assets. All other borrowing costs are expensed in the period they occur. Borrowing costs consist of interest and other costs that an entity incurs in connection with the borrowing of funds.
6.16 Other current liabilities
Other current liabilities are measured at amortized cost, which generally corresponds to the nominal value.
6.17 Revenue recognition
Revenue is recognised to the extent that it is probable that the economic benefits will flow to the Group and the revenue can be reliably measured, regardless of when the payment is being made. Revenue is measured at the fair value of the consideration received or receivable, taking into account contractually defined terms of payment and excluding taxes or duty. The Group has
F-127
concluded that it is the principal in all of its revenue arrangements since it is the primary obligor in all the revenue arrangements, has pricing latitude and is also exposed to inventory and credit risks. The specific recognition criteria described below must also be met before revenue is recognized.
Sale of goods
Revenue from the sale of goods is recognized when the significant risks and rewards of ownership of the goods have passed to the buyer, usually on delivery of the goods.
Rendering of services
Revenue from services is recognised by reference to the stage of completion.
Interest income
For all financial instruments measured at amortised cost and interest-bearing financial assets classified as available-for-sale, interest income is recorded using the effective interest rate (EIR). EIR is the rate that exactly discounts the estimated future cash payments or receipts over the expected life of the financial instrument or a shorter period, where appropriate, to the net carrying amount of the financial asset or liability. Interest income is included in finance income in the statement of comprehensive income.
Plant and equipment received from customers
The Group receives funds from customers for the acquisition of specific equipment for its manufacturing process. The funds are accounted for as non-current liability and released in the statement of comprehensive income in line with the useful life of the related equipment compensating the depreciation charges.
6.18 Government grants
Government grants are recognized at their fair value if there is reasonable assurance that the grant will be received and all related conditions will be complied with. Cost grants are recognized as income over the periods necessary to match the grant on a systematic basis to the cost that it is intended to compensate. If the grant is an investment grant, its fair value is initially recognized as deferred income in Other non-current liabilities and then released to the income statement over the expected useful life of the relevant asset by equal annual amounts.
6.19 Pensions and other post-employment benefits
DPP has both defined contribution plans and defined benefit plans. In the case of defined contribution plans, obligations are limited to the payment of contributions which are recognized as Employee benefits costs. In the case of defined benefit plans, the aggregate of the value of the defined benefit obligation and the fair value of plan assets for each plan is recognized as a net defined benefit liability or asset. Defined benefit obligations are determined using the projected unit credit method. Plan assets are recognized at fair value. If the fair value of plan assets exceeds the present value of the defined benefit obligation, a net asset is only recognized to the extent that the asset is available for refunds to the employer or for reductions in future contributions to the plan. Defined benefit pension costs consist of three elements: service costs, net interest, and re-measurements. Service costs are part of Employee benefits costs and consist of current service costs, past service costs and results of plan settlements. Net interest is part of Other financial income and expense and is determined on the basis of the value of the net defined benefit asset or liability at the start of the year and the interest on high quality corporate bonds. Re-measurements are actuarial gains and losses, the return on plan assets excluding amounts included in net interest and changes in the effect of the asset ceiling. These re-measurements are recognized in Other comprehensive income as they occur and not recycled through profit or loss at a later stage.
6.20 Income taxes
Income tax expense is recognized in the income statement except to the extent that it relates to an item recognized directly within Other comprehensive income.
F-128
Current tax is the expected tax payable on the taxable income for the year, using tax rates enacted at the balance sheet date, and any adjustment to tax payable in respect to previous years. Deferred tax assets and liabilities are recognized for the expected tax consequences of temporary differences between the carrying amount of assets and liabilities and their tax base. Deferred tax assets and liabilities are measured at the tax rates and under the tax laws that have been enacted or substantially enacted at the balance sheet date and are expected to apply when the related deferred tax assets are realized or the deferred tax liabilities are settled. Deferred tax assets, including assets arising from losses carried forward, are recognized to the extent that it is probable that future taxable profits will be available against which the deductible temporary differences and unused tax losses can be utilized.
Deferred tax assets and liabilities are stated at nominal value. Deferred taxes are not provided for the following temporary differences: the initial recognition of goodwill, the initial recognition of assets or liabilities that affect neither accounting nor taxable profit, and differences relating to investments in subsidiaries to the extent that they will probably not reverse in the foreseeable future.
Deferred tax assets and deferred tax liabilities are offset and presented net when there is a legally enforceable right to set off, and the assets and liabilities relate to income taxes levied by the same taxation authority.
6.21 Related parties
A party is considered to be related to the Group if the party is a person or a close member of that person's family and that person, has control or joint control over the Group, has significant influence over the Group or is a member of the key management personnel of the Group or of a parent of the Group. Or the party is an entity where any of the following conditions applies:
| • | the entity and the Group are members of the same Group; |
| • | one entity is an associate or joint venture of the other entity (or of a parent, subsidiary or fellow subsidiary of the other entity); |
| • | the entity and the Group are joint ventures of the same third party; |
| • | one entity is a joint venture of a third entity and the other entity is an associate of the third entity; |
| • | the entity is a post-employment benefit plan for the benefit of employees of either the Group or an entity related to the Group; |
| • | the entity is controlled or jointly controlled by a person with a significant influence over the entity or is a member of the key management personnel of the entity (or of a parent of the entity). |
6.22 Cash flow statement
The cash flow statement has been drawn up using the indirect method. The cash and cash equivalents in the cash flow statement consist of cash at bank and in hand.
Cash flows denominated in foreign currencies are translated at estimated average exchange rates. Cash exchange differences are included separately in the cash flow statement.
Interest received and paid, dividends received and profits tax are included in cash flow from operating activities.
Dividend distributions are included under cash flow from financing activities as well as capital contributions.
Transactions for which no cash or cash equivalents are exchanged, including finance leases are not included in the cash flow statement. Lease payments under finance lease contracts are considered
F-129
to be cash outflows from financing activities to the extent that they relate to repayment instalments and as cash outflows from operating activities to the extent that they relate to interest payments. Income from sale and financial leaseback transactions is presented as cash inflow from financing activities.
6.23 Fair value
The Group measures financial instruments, such as, derivatives, at fair value at each balance sheet date. Also, fair values of financial instruments measured at amortised cost are disclosed in note 32. Fair value is the price that would be received to sell an asset or paid to transfer a liability in an orderly transaction between market participants at the measurement date. The fair value measurement is based on the presumption that the transaction to sell the asset or transfer the liability takes place either:
| • | In the principal market for the asset or liability, or |
| • | In the absence of a principal market, in the most advantageous market for the asset or liability. |
The principal or the most advantageous market must be accessible to by the Group.
The fair value of an asset or a liability is measured using the assumptions that market participants would use when pricing the asset or liability, assuming that market participants act in their economic best interest. A fair value measurement of a non-financial asset takes into account a market participant's ability to generate economic benefits by using the asset in its highest and best use or by selling it to another market participant that would use the asset in its highest and best use.
The Group uses valuation techniques that are appropriate in the circumstances and for which sufficient data are available to measure fair value, maximising the use of relevant observable inputs and minimising the use of unobservable inputs. All assets and liabilities for which fair value is measured or disclosed in the financial statements are categorised within the fair value hierarchy, described as follows, based on the lowest level input that is significant to the fair value measurement as a whole:
| • | Level 1 — Quoted (unadjusted) market prices in active markets for identical assets or liabilities |
| • | Level 2 — Valuation techniques for which the lowest level input that is significant to the fair value measurement is directly or indirectly observable |
| • | Level 3 — Valuation techniques for which the lowest level input that is significant to the fair value measurement is unobservable |
For assets and liabilities that are recognised in the financial statements on a recurring basis, the Group determines whether transfers have occurred between Levels in the hierarchy by re-assessing categorisation (based on the lowest level input that is significant to the fair value measurement as a whole) at the end of each reporting period.
7. Effect of forthcoming accounting standards
The standards and interpretations that are issued, but not yet effective, up to the date of issuance of the Group’s combined financial statements are disclosed below. The Group intends to adopt these standards, if applicable, when they become effective.
IFRS 9 Financial Instruments: Classification and Measurement
IFRS 9, as issued, reflects the first phase of the IASB’s work on the replacement of IAS 39 and applies to classification and measurement of financial assets and financial liabilities as defined in IAS 39. The standard was initially effective for accounting periods beginning on or after 1 January 2013, but Amendments to IFRS 9. Mandatory Effective Date of IFRS 9 and Transition Disclosures, issued in December 2011, moved the mandatory effective date to 1 January 2018. In subsequent phases, the IASB will address hedge accounting and impairment of financial assets. The adoption of the first phase of IFRS 9 will have an effect on the classification and measurement of the Group’s financial
F-130
assets, but will not have an impact on classification and measurements of financial liabilities. The Group will quantify the effect in conjunction with the other phases, when the final standard including all phases is issued.
IAS 19 Employee Benefits – Defined Benefit Plans: Employee Contributions
The amendment simplifies the accounting for contributions from employees or third parties to defined benefit plans that are independent of the number of years of employee service. The Group is currently assessing the impact of this standard. The amendment becomes effective for financial years beginning on or after 1 January 2015.
IAS 32 Financial Instruments: Presentation – Offsetting Financial Assets and Financial Liabilities
The amendments clarify the meaning of “currently has a legally enforceable right to set-off” and the criteria for non-simultaneous settlement mechanisms of clearing houses to qualify for offsetting. As the Group is not setting off financial instruments in accordance with IAS 32 and does not have relevant offsetting arrangements, the amendment will not have an impact on DPP. The amendments become effective for financial years beginning on or after 1 January 2014.
IAS 39 Financial Instruments: Recognition and Measurement - Novation of Derivatives and Continuation of Hedge Accounting
These amendments provide relief from discontinuing hedge accounting when novation of a derivative designated as a hedging instrument meets certain criteria. DPP has not novated its derivatives during the current period. However, these amendments would be considered for future novations. The amendments become effective for financial years beginning on or after 1 January 2014.
IFRIC 21 Levies
IFRIC 21 clarifies that an entity recognises a liability for a levy when the activity that triggers payment, as identified by the relevant legislation, occurs. For a levy that is triggered upon reaching a minimum threshold, the interpretation clarifies that no liability should be anticipated before the specified minimum threshold is reached. This interpretation will have no impact on the Group’s financial position and performance. IFRIC 21 becomes effective for financial years beginning on or after 1 January 2014.
Improvements to IFRSs 2010-2012 Cycle (Issued December 2013)
The IASB issued the 2010-2012 cycle improvements to its standards and interpretations, primarily with a view to removing inconsistencies and clarifying wording.
| • | IFRS 2 Share-based Payment: The performance condition and service condition definitions were clarified to address several issues. |
| • | IFRS 3 Business Combinations: It was clarified that contingent consideration in a business combination that is not classified as equity is subsequently measured at fair value through profit or loss whether or not it falls within the scope of IFRS 9 ‘Financial Instruments’. |
| • | IFRS 13 Fair Value Measurement: It was clarified in the Basis for Conclusions that short-term receivables and payables with no stated interest can be held at invoice amounts when the effect of discounting is immaterial. |
| • | IAS 16 Property, Plant & Equipment and IAS 38 Intangible Assets: The revaluation method was clarified: accumulated depreciation or amortization is eliminated so that the gross carrying amount and carrying amount equal the market value. |
| • | IAS 24 Related Party Disclosures: It was clarified that a management entity - an entity that provide key management personnel services - is a related party subject to related party disclosure requirements. An entity that uses a management entity is required to disclose the expenses incurred for management services. |
F-131
DPP is currently assessing the impact of this standard. The improvements become effective for financial years beginning on or after 1 July 2014.
Improvements to IFRSs 2011-2013 Cycle (Issued December 2013)
The IASB issued the 2011-2013 cycle improvements to its standards and interpretations, primarily with a view to removing inconsistencies and clarifying wording.
| • | IFRS 3 Business Combinations: It was clarified that joint arrangements, and not only joint ventures, are outside the scope of IFRS 3. It was further clarified that the scope exemption only applies to the accounting in the financial statements of the joint arrangement itself. |
| • | IFRS 13 fair Value measurement: It was clarified that the portfolio exception can be applied to financial assets, financial liabilities and other contracts. |
| • | IAS 40 Investment Property: The interrelationship between IFRS 3 and IAS 40 was clarified. The description of ancillary services in IAS 40 differentiates between investment property and owner-occupied property. IFRS 3 is used to determine if the transaction is the purchase of an asset or a business combination. |
DPP is currently assessing the impact of this standard. The improvements become effective for financial years beginning on or after 1 July 2014.
8. Revenue
| EUR (thousands) | 2013 | 2012 | 2011 | ||||||
| Net sales third parties - goods | 478,420 | 453,740 | 495,541 | ||||||
| Net sales third parties - services | 84,898 | 83,535 | - | ||||||
| Net sales related parties - goods | 24,920 | 36,719 | 41,348 | ||||||
| Net sales related parties - services | 19,284 | 15,307 | 19,023 | ||||||
| Total | 607,522 | 589,301 | 555,912 | ||||||
| Net sales by origin EUR (thousands) |
2013 | 2012 | 2011 | ||||||
| The Netherlands | 33,092 | 31,415 | 32,307 | ||||||
| Germany | 7,152 | 5,287 | 4,432 | ||||||
| Italy | 5,397 | 13,940 | 9,948 | ||||||
| Austria | 364,692 | 349,396 | 355,141 | ||||||
| USA | 197,189 | 189,263 | 154,084 | ||||||
| Total | 607,522 | 589,301 | 555,912 | ||||||
9. Cost of sales
The costs of sales in 2013 amounts to € 115.5 million (2012: € 124.8 million, 2011: €123.2 million), with the resulting gross margin as a percentage of net sales in 2013 equaling approximately 81% (2012: 79%,2011: 78%).
10. Other income
| EUR (thousands) | 2013 | 2012 | 2011 | ||||||
| Percivia license agreement settlement | - | 6,648 | - | ||||||
| Other income | 3,378 | 5,851 | 5,522 | ||||||
| Total | 3,378 | 12,499 | 5,522 | ||||||
The settlement agreement of 2012 of € 6.6 million relates to received funds from a third party as compensation for income and opportunities in the biosimilar product development business of Percivia LLC that are foregone as a result of termination of the program.
F-132
The other income mainly relates to insurance benefits received, sales of scrap materials and gains on disposal of PPE.
11. Work subcontracted and other external expenses
| EUR (thousands) | 2013 | 2012 | 2011 | ||||||
| Corporate overhead allocation from a related party | (17,673 | ) |
(17,462 | ) |
(17,675 | ) |
|||
| External fixed costs & others | (259,271 | ) |
(266,406 | ) |
(244,253 | ) |
|||
| Total | (276,944 | ) |
(283,868 | ) |
(261,928 | ) |
|||
External fixed costs & others includes operational costs such as IT costs, site utilities and maintenance, hired personnel and infrastructure costs. Additional costs include travel, training and consulting costs.
Corporate overhead allocations contain the costs that are distributed to all business groups by Royal DSM. This includes costs for corporate overhead related to the staff departments of Royal DSM corporate, research activities related to Royal DSM in total and corporate project costs for projects that benefit Royal DSM in total.
12. Personnel expenses
| EUR (thousands) | 2013 | 2012 | 2011 | ||||||
| Wages and salaries | (146,713 | ) |
(142,714 | ) |
(133,053 | ) |
|||
| Social security costs | (27,209 | ) |
(26,671 | ) |
(25,124 | ) |
|||
| Pension charges | (8,839 | ) |
(10,583 | ) |
(9,880 | ) |
|||
| Total | (182,761 | ) |
(179,968 | ) |
(168,057 | ) |
|||
13. Depreciation, amortization and impairments
| EUR (thousands) | 2013 | 2012 | 2011 | ||||||
| Amortization of intangible assets | (2,592 | ) |
(4,190 | ) |
(3,372 | ) |
|||
| Depreciation of property, plant and equipment | (35,995 | ) |
(41,869 | ) |
(44,016 | ) |
|||
| Impairment losses | (135,308 | ) |
(6,721 | ) |
|||||
| Impairment included in the net asset value of joint ventures | - | (8,400 | ) |
||||||
| Reversal of impairment losses | 2,178 | - | |||||||
| Total | (171,717 | ) |
(61,180 | ) |
(47,388 | ) |
|||
For a detailed disclosure about the impairments, we refer to note 17 ‘Intangible fixed assets’ and note 18 ‘Property, plant and equipment’.
14. Other operating expenses
Other operating expenses in 2013 of € 10.2 million (2012: € 14.0 million, 2011: €7.8 million) are primarily related to additions to corporate provisions. See note 26 ‘Provisions’ for additional detail on the movement. Also included within other operating expenses are gains and losses related to exchange rate differences, insurance settlements, costs of bad debts and other operating costs.
F-133
15. Financial income and expense
| EUR (thousands) | 2013 | 2012 | 2011 | ||||||
| Finance expense |
|||||||||
| Interest paid on related party loans | (12,296 | ) |
(25,466 | ) |
(25,001 | ) |
|||
| Other finance expenses | (1,099 | ) |
(58 | ) |
(2 | ) |
|||
| Total finance expense | (13,395 | ) |
(25,524 | ) |
(25,003 | ) |
|||
| Finance income |
|||||||||
| Interest income on loans and receivables from related parties | 2,669 | 6,553 | 8,613 | ||||||
| Total finance income | 2,669 | 6,553 | 8,613 | ||||||
| Net finance income/(expense) in profit and loss | (10,726 | ) |
(18,971 | ) |
(16,390 | ) |
|||
| Other financial income and expense |
|||||||||
| Foreign currency translation differences of foreign operations | (5,095 | ) |
(3,446 | ) |
2,990 | ||||
| Net change in fair value of cash flow hedges | 23 | 281 | (364 | ) |
|||||
| Defined benefit plan actuarial gains (losses) | (4,419 | ) |
(5,726 | ) |
- | ||||
| Tax on other comprehensive income | 1,093 | 2,628 | 91 | ||||||
| Finance income / (costs) in other comprehensive income | (8,398 | ) |
(6,263 | ) |
2,717 | ||||
The overall average interest rate of the total borrowings decreased in 2013 (2.5%) compared to 2012 (4.7%) and 2011 (3.82%), resulting in a significant decrease in the interest paid on related party loans. The decrease in the overall average interest rate is primarily a result of new borrowings with a more favourable interest rate. Reference is made to note 27 for a more detailed overview of the borrowings.
16. Income taxes
The income tax credit on the result 2013 was € 11.7 million (2012: income tax credit of € 24.5 million, 2011: income tax credit of € 13.5 million) and can be broken down as follows:
| EUR (thousands) | 2013 | 2012 | 2011 | ||||||
| Current tax (expense) / credit |
|||||||||
| Current year | 4,789 | 20,896 | 20,825 | ||||||
| Prior-year adjustments | (1,244 | ) |
(3,448 | ) |
607 | ||||
3,545 | 17,448 | 21,432 | |||||||
| Deferred tax (expense) / credit |
|||||||||
| Current year | 6,603 | 2,114 | (8,730 | ) |
|||||
| Prior-year | 747 | 4,805 | 547 | ||||||
| Change in tax rate | 786 | 139 | 226 | ||||||
8,136 | 7,058 | (7,957 | ) |
||||||
| Total income tax (expense) / credit | 11,681 | 24,506 | 13,475 | ||||||
F-134
The effective income tax rate on the result from continuing operations was 7.4% in 2013 (2012: 28.9%,2011: 21.3%). This decrease was mainly caused by tax-exempt expense resulting from the impairment of goodwill. The tax rate for continuing operations for 2014 will be at about the same level as 2012 due to exclusion of tax-exempt expenses recognized in 2013. The relationship between the income tax rate in the Netherlands and the effective tax rate on the result from continuing operations is as follows:
| 2013 | 2012 | 2011 | |||||||
| Domestic income tax rate | 25.0 | 25.0 | 25.0 | ||||||
| Tax effects of: |
|||||||||
| - Deviating rates | -0.2 | 13.3 | 9.3 | ||||||
| - Tax-exempt loss | -22.0 | -1.5 | 1.2 | ||||||
| - Tax losses (not) recognized | 4.6 | -7.9 | -14.2 | ||||||
| Effective tax rate | 7.4 | 28.9 | 21.3 | ||||||
The balance of deferred tax assets and deferred tax liabilities increased by € 8.6 million due to the changes presented in the table below:
| EUR (thousands) | 2013 | 2012 | ||||
| At 1 January |
||||||
| Deferred tax assets | 12,556 | 12,104 | ||||
| Deferred tax liabilities | (4,158 | ) |
(11,754 | ) |
||
| Total | 8,398 | 350 | ||||
| Changes: |
||||||
| Income tax expense in income statement | 8,136 | 7,058 | ||||
| Income tax expense in other comprehensive income | 1,093 | 2,628 | ||||
| Other | (674 | ) |
(1,638 | ) |
||
| Total | 8,555 | 8,048 | ||||
| At 31 December |
||||||
| Deferred tax assets | 16,953 | 12,556 | ||||
| Deferred tax liabilities | - | (4,158 | ) |
|||
| Total | 16,953 | 8,398 | ||||
Other changes mainly contain exchange differences.
The Group offsets tax assets and liabilities if and only if it has a legally enforceable right and intend to set off current tax assets and current tax liabilities and the deferred tax assets and deferred tax liabilities relate to income taxes levied by the same tax authority.
F-135
The deferred tax assets and liabilities relate to the following balance sheet items:
| Deferred tax assets/(liabilities) EUR (thousands) |
2013 | 2012 | ||||
| Intangible assets | 7,263 | 8,549 | ||||
| Property, plant and equipment | (4,013 | ) |
(4,208 | ) |
||
| Other non-current assets | (866 | ) |
27 | |||
| Inventories | 5,585 | 5,524 | ||||
| Receivables | (1,535 | ) |
(6,796 | ) |
||
| Cash and equivalents | - | - | ||||
| Equity | - | - | ||||
| Current provisions | 1 | 2 | ||||
| Non-current provisions | 4,215 | 3,449 | ||||
| Current borrowings | 100 | 97 | ||||
| Non-current borrowings | 47 | 147 | ||||
| Other current liabilities | 765 | 867 | ||||
| Derivatives | 586 | - | ||||
| Other non-current liabilities | 23 | (78 | ) |
|||
| Total | 12,171 | 7,580 | ||||
| Tax losses carry forward | 4,420 | 717 | ||||
| Set off of tax components | 362 | 101 | ||||
| Net deferred tax assets and liabilities | 16,953 | 8,398 | ||||
No deferred tax assets were recognized for loss carry forwards amounting to € 373 million (2012: € 379 million). The unrecognized tax losses have an indefinite period of time, as they relate to Austrian tax losses. The valuation of deferred tax assets depends on the probability of the reversal of temporary differences and the utilization of tax loss carry forwards. Deferred tax assets are recognized for future tax benefits arising from temporary differences and for tax loss carry forwards to the extent that the tax benefits are likely to be realized. DPP has to assess the likelihood that deferred tax assets will be recovered from future taxable profit. This assessment is primarily based on the Group’s business plan (Business Strategy Dialogue).
Deferred tax assets are reduced if, and to the extent that, it is not probable that all or some portion of the deferred tax assets will be realized. In the event that actual future results differ from estimates, and depending on tax strategies that DPP may be able to implement, changes to the measurement of deferred taxes could be required, which could impact on the Group's financial position and profit for the year.
F-136
17. Intangible fixed assets
| Licenses and patents |
Goodwill | Development projects |
Other intangible assets |
Under construction |
Total | |||||||||||||
| Balance at 1 January 2012 |
||||||||||||||||||
| Cost | 6,401 | 336,521 | - | 36,999 | 497 | 380,418 | ||||||||||||
| Amortization and impairment losses | (720 | ) |
(166,809 | ) |
- | (23,456 | ) |
- | (190,985 | ) |
||||||||
| Carrying amount | 5,681 | 169,712 | - | 13,543 | 497 | 189,433 | ||||||||||||
| Changes in carrying amount |
||||||||||||||||||
| - Capital expenditure | 462 | - | - | - | 1,647 | 2,109 | ||||||||||||
| - Put into operations | - | - | - | 450 | (450 | ) |
- | |||||||||||
| - Amortization | (574 | ) |
- | - | (3,616 | ) |
- | (4,190 | ) |
|||||||||
| - Exchange differences | - | (3,785 | ) |
- | (84 | ) |
(41 | ) |
(3,910 | ) |
||||||||
(112 | ) |
(3,785 | ) |
- | (3,250 | ) |
1,156 | (5,991 | ) |
|||||||||
| Balance at 31 December 2012 |
||||||||||||||||||
| Cost | 6,863 | 332,736 | - | 37,365 | 1,653 | 378,617 | ||||||||||||
| Amortization and impairment losses | (1,294 | ) |
(166,809 | ) |
- | (27,072 | ) |
- | (195,175 | ) |
||||||||
| Carrying amount | 5,569 | 165,927 | - | 10,293 | 1,653 | 183,442 | ||||||||||||
| Changes in carrying amount | ||||||||||||||||||
| - Capital expenditure | - | - | - | - | 3,219 | 3,219 | ||||||||||||
| - Put into operations | 1,841 | - | - | 885 | (2,726 | ) |
- | |||||||||||
| - Amortization | 7 | - | - | (2,599 | ) |
- | (2,592 | ) |
||||||||||
| - Impairment losses | - | (131,000 | ) |
- | (508 | ) |
- | (131,508 | ) |
|||||||||
| - Exchange differences | - | (7,223 | ) |
- | (113 | ) |
(90 | ) |
(7,426 | ) |
||||||||
| - Other reclassifications | - | - | - | 27 | - | 27 | ||||||||||||
1,848 | (138,223 | ) |
- | (2,308 | ) |
403 | (138,280 | ) |
||||||||||
| Balance at 31 December 2013 |
||||||||||||||||||
| Cost | 8,704 | 325,513 | - | 38,164 | 2,056 | 374,437 | ||||||||||||
| Amortization and impairment losses | (1,287 | ) |
(297,809 | ) |
- | (30,179 | ) |
- | (329,275 | ) |
||||||||
| Carrying amount | 7,417 | 27,704 | - | 7,985 | 2,056 | 45,162 | ||||||||||||
The annual impairment tests for non-current assets are performed in the fourth quarter. The recoverable amount of the cash generating units concerned is based on a value-in-use calculation. The cash flow projections for the period 2013 – 2015 are derived from the Group’s business plan (Business Strategy Dialogue) and 2014 budget. Cash flow projections beyond the 2015 planning period are extrapolated taking into account the growth rates or specific actions that have been determined to apply for the specific cash generating unit in the Annual Strategic Review. The key assumptions in the cash flow projections relate to the market growth for the cash generating units and the related revenue projections. The below table summarizes the assumed growth rates used in the impairment tests of the cash generating units for the next 10 years. The terminal value for the period after ten years is determined with the assumption of no growth. The growth rate for Biologics is noted as being higher due to the additional business expected with the expanded facilities in Groningen and the new production facility in Brisbane.
| in % | 2013 | 2012 |
| DSM Biologics | 7% | 10% |
| DSM BioSolutions | 5% | 5% |
| DSM Fine Chemicals | 0% | 0% |
| DSM Pharmaceuticals | 3% | 5% |
The pre-tax discount rate is 11% (2012 & 2011: 10%), except for the DSM Biologics cash generating unit which is 14% (2012: 14%), based on the risk profile of the cash generating unit.
A stress test was performed on the impairment tests of the cash generating units. This showed that the conclusions of these tests would not have been different if reasonably possible adverse changes in key parameters had been assumed. The value-in-use of cash generating units with significant amounts of goodwill clearly exceeds their carrying amount.
The goodwill at DSM Pharmaceuticals, Inc was acquired in 2000 with the purchase of the Greenville NC location from a third party by the Group. The book value of the goodwill as of 31 December
F-137
2013 was € 158.7 million (2012: € 165.9 million). In December 2013 a mandatory impairment test was performed on this goodwill. The impairment test was partly based on the assumptions which were also used during the valuation of the business in view of the joint venture agreement between Royal DSM and JLL.
The recoverable amount for the DPI cash-generating-unit was calculated at € 168.1 million (2012: € 390.5 million). This resulted in an impairment loss of € 131.0 million in 2013. The recoverable amount of DPI is based on the value in use and key assumptions used are the pre-tax discount rate, growth rate and projected future cash-flows, which have been disclosed above.
Key assumption in this respect is the pre-tax discount rate which has been estimated by management on 11%. An increase of 1% of the discount rate would result in an additional impairment charge of € 24.4 million and a decrease of 1% of the discount rate result in a release of the impairment charge of € 32.1 million. A pre-tax discount rate of 8.5% would result in a recoverable amount that is equal to the carrying amount.
Impairments
| EUR (thousands) | 31 December 2013 |
31 December 2012 |
||||
| Impairment DPI Goodwill | (131,000 | ) |
- | |||
| Impairment DPI | (508 | ) |
- | |||
| Total Impairment | (131,508 | ) |
- | |||
18. Property, plant and equipment
| EUR (thousands) | Land and buildings |
Plant and machinery |
Other equipment |
Under construction |
Total | ||||||||||
| Balance at 1 January 2012 |
|||||||||||||||
| Cost | 190,954 | 714,805 | 34,515 | 31,404 | 971,678 | ||||||||||
| Depreciation and impairment losses | (109,981 | ) |
(526,636 | ) |
(29,215 | ) |
- | (665,832 | ) |
||||||
| Carrying amount | 80,973 | 188,169 | 5,300 | 31,404 | 305,846 | ||||||||||
| Changes in carrying amount |
|||||||||||||||
| - Capital expenditure | - | (1,536 | ) |
100 | 48,723 | 47,287 | |||||||||
| - Put into operations | 7,689 | 23,787 | 1,333 | (32,809 | ) |
- | |||||||||
| - Disposals | (686 | ) |
- | - | - | (686 | ) |
||||||||
| - Depreciation | (7,403 | ) |
(33,192 | ) |
(1,275 | ) |
- | (41,870 | ) |
||||||
| - Impairment losses | (4,577 | ) |
(1,246 | ) |
- | (898 | ) |
(6,721 | ) |
||||||
| - Exchange differences | (781 | ) |
(1,325 | ) |
(17 | ) |
(477 | ) |
(2,600 | ) |
|||||
| - Other | 467 | (467 | ) |
- | - | - | |||||||||
(5,291 | ) |
(13,979 | ) |
141 | 14,539 | (4,590 | ) |
||||||||
| Balance at 31 December 2012 |
|||||||||||||||
| Cost | 197,643 | 735,264 | 35,931 | 46,841 | 1,015,679 | ||||||||||
| Depreciation and impairment losses | (121,961 | ) |
(561,074 | ) |
(30,490 | ) |
(898 | ) |
(714,423 | ) |
|||||
| Carrying amount | 75,682 | 174,190 | 5,441 | 45,943 | 301,256 | ||||||||||
| Changes in carrying amount |
|||||||||||||||
| - Capital expenditure | - | 43 | 119 | 37,105 | 37,267 | ||||||||||
| - Put into operations | 1,038 | 23,441 | 5,797 | (30,276 | ) |
- | |||||||||
| - Disposals | (14 | ) |
(11 | ) |
- | - | (25 | ) |
|||||||
| - Depreciation | (6,668 | ) |
(28,291 | ) |
(1,036 | ) |
- | (35,995 | ) |
||||||
| - Impairment losses | - | (3,800 | ) |
- | - | (3,800 | ) |
||||||||
| - Reversal impairment | 73 | 2,105 | - | - | 2,178 | ||||||||||
| - Exchange differences | (1,398 | ) |
(2,350 | ) |
(25 | ) |
(3,973 | ) |
(7,746 | ) |
|||||
F-138
| EUR (thousands) | Land and buildings |
Plant and machinery |
Other equipment |
Under construction |
Total | ||||||||||
| - Other | 810 | (510 | ) |
- | (99 | ) |
201 | ||||||||
(6,159 | ) |
(9,373 | ) |
4,855 | 2,757 | (7,920 | ) |
||||||||
| Balance at 31 December 2013 |
|||||||||||||||
| Cost | 198,079 | 755,877 | 41,822 | 49,598 | 1,045,376 | ||||||||||
| Depreciation and impairment losses | (128,556 | ) |
(591,060 | ) |
(31,526 | ) |
(898 | ) |
(752,040 | ) |
|||||
| Carrying amount | 69,523 | 164,817 | 10,296 | 48,700 | 293,336 | ||||||||||
In 2013 an impairment reversal of property, plant and equipment of € 2.2 million was recognized. This is primarily related to the 2012 impairment of € 5.7 million at DSM Capua SpA related to two production facilities at the site that were closed as part of a restructuring program. Due to a change in business conditions during the course of business in 2013, it was determined in discussions with customers that certain components of the 2012 impaired assets could be used in revenue production contracts going forward. The impairment related to these identified assets was reversed and a true-up for missed depreciation was completed.
Based on the 2013 impairment test a recoverable amount for the BioSolutions cash-generating-unit was calculated at € 26.0 million (2012: € 29.5 million). This resulted in an impairment loss of € 3.8 million in 2013. The recoverable amount of BioSolutions is based on the value in use and key assumptions used are the pre-tax discount rate, growth rate and projected future cash-flows, which have been disclosed in note 17.
In 2012 an impairment of property, plant, and equipment of € 6.7 million was recognized. This is partially due to an impairment of € 5.7 million at DSM Capua SpA related to two production facilities at the site that were closed as part of a restructuring program. The remaining impairment of € 1.0 million is related to equipment that will not be used further for production related activities and the book value was fully impaired as of 31 December 2012. All assets included in the impairments were taken down to a zero book value and offset through depreciation expense.
| EUR (thousands) | 31 December 2013 |
31 December 2012 |
||||
| Impairment Equipment | - | (1,737 | ) |
|||
| Impairment Capua | (3,800 | ) |
(5,662 | ) |
||
| Total Impairment | (3,800 | ) |
(7,399 | ) |
||
| Reversal Capua | 2,178 | - | ||||
| Total Impairment | 2,178 | - | ||||
19. Shares in joint ventures
The Group has a 50% interest in Percivia LLC that is accounted for using the equity method in the combined financial statements. Percivia licenses the Per.C6 technology which has a strong relationship with the Group’s biopharmaceutical divisions. Reference is made to note 5 on the impact of the change in accounting of this joint venture in 2013.
F-139
Summarized financial information of the joint venture, based on its IFRS financial statements, and reconciliation with the carrying amount of the investment in combined financial statements are set out below:
| EUR (thousands) | 2013 | 2012 | ||||
| Current assets, including cash and cash equivalents | 1,967 | 1,439 | ||||
| Intangible assets | 48,012 | 51,735 | ||||
| Current liabilities | (2 | ) |
(25 | ) |
||
| Non-current deferred tax liabilities | (3,578 | ) |
(1,691 | ) |
||
| Net Assets | 46,399 | 51,458 | ||||
| Proportion of the Group's ownership | 50 | % |
50 | % |
||
| Carrying amount of the investment | 23,200 | 25,729 | ||||
Summarized statement of profit or loss of Percivia LLC:
| EUR (thousands) | 2013 | 2012 | ||||
| Revenue | 950 | 2,101 | ||||
| Earnings before interest, tax, depreciation and amortization | 636 | (7,123 | ) |
|||
| Depreciation, amortization and impairment | (5,033 | ) |
5,486 | |||
| Results from operating activities | (4,397 | ) |
(1,637 | ) |
||
| Net finance costs | 1 | 1 | ||||
| Income tax credit / (expense) | 1,290 | (6,212 | ) |
|||
| Profit / (loss) for the year | (3,106 | ) |
(7,848 | ) |
||
| Proportion of the Group’s ownership | 50 | % |
50 | % |
||
| Group’s share of profit for the year | (1,553 | ) |
(3,924 | ) |
||
| Foreign currency translation differences of foreign operations | (976 | ) |
(506 | ) |
||
| Net other comprehensive income to be reclassified to profit or loss in subsequent periods | (976 | ) |
(506 | ) |
||
| Other comprehensive income / (loss), net of tax | (976 | ) |
(506 | ) |
||
| Total comprehensive income / (loss) attributable to owners of the Group | (2,529 | ) |
(4,430 | ) |
||
Movement schedule for carrying amount of the investment
| EUR (thousands) | 2013 | 2012 | ||||
| January 1 | 25,729 | 35,606 | ||||
| Exchange Rate | (976 | ) |
(506 | ) |
||
| Capital Contribution | - | (5,447 | ) |
|||
| profit share | (1,553 | ) |
(3,924 | ) |
||
| Profit / (loss) for the year | 23,200 | 25,729 | ||||
20. Inventories
| EUR (thousands) | 31 December 2013 |
31 December 2012 |
||||
| Raw materials and consumables | 64,925 | 60,061 | ||||
| Intermediates and finished goods | 144,777 | 102,513 | ||||
| Less: adjustments to lower net realizable value | (13,524 | ) |
(11,910 | ) |
||
| Total | 196,178 | 150,664 | ||||
F-140
Inventories are carried at the lowest of cost or net realizable value. The recognized adjustment to net realizable value amount € 13.5 million (2012: € 11.9 million) and relates to a gross inventory value of € 40.4 million (2012: € 36.2 million).
The changes in the adjustment to net realizable value were as follows:
| EUR (thousands) | 2013 | 2012 | ||||
| Balance at 1 January | (11,910 | ) |
(11,106 | ) |
||
| Additions charged to income statement | (10,973 | ) |
(5,026 | ) |
||
| Utilization / reversals | 8,866 | 4,120 | ||||
| Other | 156 | - | ||||
| Exchange difference | 337 | 102 | ||||
| Balance at 31 December | (13,524 | ) |
(11,910 | ) |
||
21. Trade and other receivables
| EUR (thousands) | 31 December 2013 |
31 December 2012 |
||||
| Trade receivables | 65,142 | 73,686 | ||||
| Less: Allowance for doubtful debts | (560 | ) |
(727 | ) |
||
| Receivables from related parties | 8,345 | 10,258 | ||||
| VAT | 10,199 | 9,666 | ||||
| Income tax receivable from related parties | 9,519 | 28,563 | ||||
| Income tax receivable from tax authorities | 2,966 | - | ||||
| Other | 6,582 | 9,457 | ||||
| Total | 102,193 | 130,903 | ||||
Below is the aging overview on trade receivables given in percentages (%):
| in % | 2013 | 2012 |
| Neither past due nor impaired | 81% | 83% |
| 1-29 days overdue | 16% | 16% |
| 30-89 days overdue | 3% | 1% |
| 90 or more days overdue | 0% | 0% |
22. Receivable from related parties for carve-out adjustments
The impact of the carve-out adjustments of € 146.5 million (2012: € 162.0 million) has been reflected in a receivable from related parties. It is assumed that the settlement of these items will be made with Royal DSM once a joint venture transaction is finalized.
23. Loans to related parties
The loan to related parties of € 287 million in 2012 represents a loan granted by DSM Life Science Products International GmbH to DSM Verwaltung GmbH. This loan originates from the transfer of several DSM companies from DSM Life Science Products International GmbH to DSM Verwaltung GmbH. The loan had tenure of 1 year, and was extended annually. The Interest basis of the loan was 1 year EURIBOR + margin of 0.5%. The loan was settled during Q4 2013.
F-141
24. Cash and cash equivalents
| EUR (thousands) | 31 December 2013 |
31 December 2012 |
||||
| In-house cash | 613,334 | 320,936 | ||||
| Cash in bank | 956 | 450 | ||||
| Payment in transit | 33 | 302 | ||||
| Short term deposit | - | 1,576 | ||||
| Balance at 31 December | 614,323 | 323,264 | ||||
Included in the cash balance as per 31 December 2013, is an amount of € 613.3 million (31 December 2012: € 320.9 million), which relates to a related party in-house cash pool at Royal DSM.
25. Net assets attributable to owners of the Group
| EUR (thousands) | 31 December 2013 |
31 December 2012 |
||||
| Balance at 1 January | 810,497 | 884,272 | ||||
| Net profit / (loss) | (146,828 | ) |
(60,320 | ) |
||
| Foreign currency translation differences of foreign operations | (5,095 | ) |
(3,446 | ) |
||
| Net changes in fair value of cash flow hedges | 23 | 281 | ||||
| - Related income tax credit/(expense) | (6 | ) |
(70 | ) |
||
| Defined benefit plan actuarial gains (losses) | (4,419 | ) |
(5,726 | ) |
||
| - Related income tax credit/(expense) | 1,093 | 2,628 | ||||
| Capital refund | - | (9,000 | ) |
|||
| Capital contribution | 7,142 | 1,878 | ||||
| Balance at 31 December | 662,407 | 810,497 | ||||
The capital contribution primarily relates to an amount of € 6.6 million which was received by DSM Biologics Company Australia Pty Ltd from Royal DSM as part of the further development of the company in 2013.
26. Provisions
| EUR (thousands) | 2013 | 2012 | ||||
| At 1 January | 18,804 | 14,083 | ||||
| - Additions | 16,542 | 12,198 | ||||
| - Releases | (8,674 | ) |
(1,138 | ) |
||
| - Uses | (7,136 | ) |
(6,226 | ) |
||
| - Exchange differences | (119 | ) |
(113 | ) |
||
| At 31 December | 19,417 | 18,804 | ||||
| Analysis of provisions: |
||||||
| Non-current | 14,383 | 11,379 | ||||
| Current | 5,034 | 7,425 | ||||
| At 31 December | 19,417 | 18,804 | ||||
DPP has provisions for the following types of liabilities; 1) Restructuring costs and termination benefits, 2) Environmental costs, 3) Other long-term employee benefits and 4) Other general provisions.
F-142
The total balance by provision type is as follows:
| EUR (thousands) | 31 December 2013 |
31 December 2012 |
||||
| Restructuring costs and termination benefits | 8,453 | 9,373 | ||||
| Environmental costs | 2,359 | 3,288 | ||||
| Other long-term employee benefits | 6,971 | 6,228 | ||||
| Other general provisions | 1,634 | (85 | ) |
|||
| Total | 19,417 | 18,804 | ||||
The provisions for restructuring costs and termination benefits mainly relate to the costs of redundancy schemes connected to the dismissal and transfer of employees and costs of termination of contracts. These provisions have an average life of 1 to 3 years.
The provisions for environmental costs relate to soil clean-up obligations, among other things. These provisions have an average life of more than 10 years.
The provisions for other long-term employee benefits mainly relate to length-of-service and end-of-service payments.
Several items have been combined under Other provisions, for example onerous contracts. These provisions have an average life of 1 to 3 years.
The additions in 2013 and 2012 mainly relate to restructuring costs and termination benefits for restructuring projects in connection with the DSM profit improvement program.
27. Interest bearing loans and borrowings
| EUR (thousands) | 31 December 2013 |
31 December 2012 |
||||
| Non-current borrowings |
||||||
| Loans from credit institutions | 3,047 | 5,301 | ||||
| Borrowings from related parties | 287,739 | 218,840 | ||||
| Total non-current borrowings | 290,786 | 224,141 | ||||
| Current borrowings |
||||||
| Loans from credit institutions | 1,743 | 2,001 | ||||
| Borrowings from related parties | 46,143 | 131,727 | ||||
| Total | 47,886 | 133,728 | ||||
| In-house cash | 191,617 | 182,389 | ||||
| Total current borrowings | 239,503 | 316,117 | ||||
The shift from current borrowing to non-current borrowings is the effect of repaying a current borrowing in April 2013 (on the due date) and arranging a new borrowing with a maturity date of 2017.
Non-current loans and borrowings
The effective interest rate for interest bearing loans is determined without regard to discounts and premiums, since their effect is only marginal. No agreement was made on different interest rates for the remaining term. The interest rate is fixed and does not depend on the future changes in specific factors.
F-143
The terms of the loans were not renegotiated for any of the loans payable here mentioned. All loans mature during the year of maturity included in the below table. Reference is made to note 32.4, showing the payment schedule of the borrowings accounted for as per yearend. No debt coverage ratio covenants are applicable.
| Terms and conditions schedule of outstanding non current loans : | |||||||||||||||||||||
| Face value |
Carrying amount |
Face value |
Carrying amount |
||||||||||||||||||
| EUR (thousands) | Currency | Nominal interest rate |
Year of maturity |
31 December 2013 |
31 December 2013 |
31 December 2012 |
31 December 2012 |
||||||||||||||
| Royal Bank of Scotland | USD | 3.71 | % |
2014 | - | - | 1,541 | 1,541 | |||||||||||||
| Italian Ministry of Productive Activities | EUR | 2.1 | % |
2016 | 115 | 115 | 170 | 170 | |||||||||||||
| Italian Ministry of Productive Activities | EUR | 2.2 | % |
2016 | 72 | 72 | 107 | 107 | |||||||||||||
| Volkskreditbank AG | EUR | 1.1 | % |
2015 | 190 | 190 | 590 | 590 | |||||||||||||
| The Austrian Reasearch Promotion Agency (FFG) | EUR | 2.0 | % |
2015 | 169 | 169 | 169 | 169 | |||||||||||||
| Bank Austria | EUR | 2.6 | % |
2014 | - | - | 198 | 198 | |||||||||||||
| Bank Austria | EUR | 3.7 | % |
2014 | - | - | 170 | 170 | |||||||||||||
| Bank Austria | EUR | 3.3 | % |
2015 | 185 | 185 | 556 | 556 | |||||||||||||
| Bank Austria | EUR | 3.2 | % |
2015 | 176 | 176 | 350 | 350 | |||||||||||||
| Bank Austria | EUR | 3.3 | % |
2016 | 590 | 590 | 931 | 931 | |||||||||||||
| Bank Austria | EUR | 1.8 | % |
2017 | 1,022 | 1,022 | 520 | 520 | |||||||||||||
| Bank Austria | EUR | 1.6 | % |
2018 | 528 | 528 | - | - | |||||||||||||
| Total loans from credit institutions | 3,047 | 3,047 | 5,302 | 5,302 | |||||||||||||||||
| DSM Holding Company USA Inc | USD | 4.2 | % |
2014 | - | - | 39,900 | 39,900 | |||||||||||||
| DSM Holding Company USA Inc | USD | 3.2 | % |
2017 | 148,734 | 148,734 | 155,503 | 155,503 | |||||||||||||
| DSM Holding Company USA Inc | USD | 2.8 | % |
2018 | 116,085 | 116,085 | - | - | |||||||||||||
| DSM Finance BV | EUR | 2.8 | % |
2017 | 20,600 | 20,600 | 20,600 | 20,600 | |||||||||||||
| DSM Finance (Belgium) CV | AUD | 5.4 | % |
2017 | 2,320 | 2,320 | 2,836 | 2,836 | |||||||||||||
| Total borrowings from related parties | 287,739 | 287,739 | 218,839 | 218,839 | |||||||||||||||||
| Total | 290,786 | 290,786 | 224,141 | 224,141 | |||||||||||||||||
F-144
Current loans and borrowings
The terms of the loans were not renegotiated for any of the loans payable here mentioned. Reference is made to note 32.4, showing the payment schedule of the borrowings accounted for as per yearend. No debt coverage ratio covenants are applicable.
| Terms and conditions schedule of outstanding current loans : | |||||||||||||||||||||
| EUR (thousands) | Currency | Nominal interest rate |
Year of maturity |
Face value |
Carrying amount |
Face value |
Carrying amount |
||||||||||||||
| 31 December 2013 |
31 December 2013 |
31 December 2012 |
31 December 2012 |
||||||||||||||||||
| Italian Ministry of Productive Activities | EUR | 2.12 | % |
2016 | 55 | 55 | 55 | 55 | |||||||||||||
| Italian Ministry of Productive Activities | EUR | 2.16 | % |
2016 | 35 | 35 | 34 | 34 | |||||||||||||
| Volkskreditbank AG | EUR | 1.1 | % |
2015 | 400 | 400 | 386 | 386 | |||||||||||||
| Bank Austria | EUR | 5.6 | % |
2013 | - | - | 330 | 330 | |||||||||||||
| Bank Austria | EUR | 2.6 | % |
2014 | 198 | 198 | 395 | 395 | |||||||||||||
| Bank Austria | EUR | 3.7 | % |
2014 | 170 | 170 | 170 | 170 | |||||||||||||
| Bank Austria | EUR | 3.3 | % |
2015 | 371 | 371 | 371 | 371 | |||||||||||||
| Bank Austria | EUR | 3.2 | % |
2015 | 175 | 175 | 175 | 175 | |||||||||||||
| Bank Austria | EUR | 3.3 | % |
2016 | 338 | 338 | 85 | 85 | |||||||||||||
| Total loans from credit institutions | 1,742 | 1,742 | 2,001 | 2,001 | |||||||||||||||||
| DSM Holding Company USA Inc | USD | 5.2 | % |
2013 | - | - | 117,576 | 117,576 | |||||||||||||
| DSM Holding Company USA Inc | USD | 0.85 | % |
2013 | - | - | 4,551 | 4,551 | |||||||||||||
| DSM Holding Company USA Inc | USD | 4.2 | % |
2014 | 38,163 | 38,163 | - | - | |||||||||||||
| DSM Holding Company USA Inc | USD | 0.76 | % |
2014 | 7,981 | 7,981 | - | - | |||||||||||||
| DSM Finance BV | EUR | 0.61 | % |
2013 | - | - | 9,600 | 9,600 | |||||||||||||
| Total borrowings from related parties | 46,144 | 46,144 | 131,727 | 131,727 | |||||||||||||||||
| Total | 47,886 | 47,886 | 133,728 | 133,728 | |||||||||||||||||
28. Post-employment benefits obligation
The DPP group companies have various pension plans, which are geared to the local regulations and practices in the countries in which they operate. As these plans are designed to comply with the statutory framework, tax legislation, local customs and economic situation of the countries concerned, it follows that the nature of the plans varies from country to country. The plans are based on local legal and contractual obligations. The pension plans are generally funded by payments from employees and from the relevant group companies.
Reference is made to note 5 on the impact of the change in accounting of pensions in 2013.
Defined benefit plans are applicable to certain employees in Germany, the US and Austria. The rights that can be derived from these plans are based primarily on length of service and the majority of the plans are based on final salary.
Post-employment benefits relate to obligations that will be settled in the future and require assumptions to project benefit obligations. Post-employment benefit accounting is intended to reflect the recognition of post-employment benefits over the employee’s approximate service period, based on the terms of the plans and the investment and funding. The accounting requires management to make assumptions regarding variables such as discount rate, future salary increases, life expectancy, and future healthcare costs. Management consults with external actuaries regarding these assumptions at least annually for significant plans.
Changes in these key assumptions can have a significant impact on the projected defined benefit obligations, funding requirements and periodic costs incurred.
F-145
The charges for pensions costs recognized in the income statement (note 12) relate to the following:
| 2013 | 2012 | |||||
| Defined benefit plans: |
||||||
| - Pension plans (major plans) | 1,036 | 2,066 | ||||
| - Pension plans included in Financial income and expense | 1,120 | - | ||||
| - Other post-employment benefits | 627 | 578 | ||||
| Defined contribution plans | 7,176 | 7,954 | ||||
| Total continuing activities | 9,959 | 10,598 | ||||
Royal DSM agreed with the labor unions to change the Dutch pension plan as of 2011. The plan was converted from final-pay to average-pay and as of 1 January 2012 the pensionable age was raised from 65 to 66 years, in line with developments in the Netherlands. The new agreement covers a period of 5 years and obliges DPP to pay a fixed premium. In view of the fact that DPP has no further obligation than to pay the agreed premium, the changed plan has been accounted for as a defined contribution plan since 2011.
Changes in current and non-current employee benefits liabilities recognized in the balance sheet are disclosed in the following overview:
| 2013 | 2012 | |||||
| Current employee benefits liabilities | (1,318 | ) |
(1,417 | ) |
||
| Non-current employee benefits liabilities | (31,941 | ) |
(24,228 | ) |
||
| Balance at 1 January | (33,259 | ) |
(25,645 | ) |
||
| Changes: |
||||||
| Balance of actuarial gains/(losses) | (4,331 | ) |
(7,623 | ) |
||
| Employee benefits costs | (2,782 | ) |
(2,645 | ) |
||
| Contributions by employer | 3,315 | 2,672 | ||||
| Other changes | (29 | ) |
(18 | ) |
||
| Total changes | (3,827 | ) |
(7,614 | ) |
||
| Balance at 31 December | (37,086 | ) |
(33,259 | ) |
||
| Of which: |
||||||
| Current employee benefits liabilities | (1,146 | ) |
(1,318 | ) |
||
| Non-current employee benefits liabilities | (35,940 | ) |
(31,941 | ) |
||
In 2014 DPP is expected to contribute € 1 million (actual 2013: € 3 million) to its defined benefit plans.
The most important unfunded plans are in Germany and Austria. Together they amount to € 36.0 million (2012: € 32.5 million). Therefore the following schedules only relate to these two plans.
F-146
The changes in the present value of the defined benefit obligations and in the fair value of plan assets of the major plans are listed below:
| Present value of defined benefit obligations | 2013 | 2012 | ||||
| Balance at 1 January | (32,483 | ) |
(24,919 | ) |
||
| Changes: |
||||||
| Service costs | (1,030 | ) |
(770 | ) |
||
| Interest costs | (1,093 | ) |
(1,283 | ) |
||
| Actuarial (gains)/losses | (3,994 | ) |
(7,622 | ) |
||
| Benefits paid | 2,645 | 2,111 | ||||
| Other changes | - | |||||
| Balance at 31 December | (35,955 | ) |
(32,483 | ) |
||
| Fair value of plan assets | 2013 | 2012 | ||||
| Balance at 1 January | - | - | ||||
| Changes: |
- | - | ||||
| Contributions by employer | 2,645 | 2,111 | ||||
| Benefits paid | (2,645 | ) |
(2,111 | ) |
||
| Balance at 31 December | - | - | ||||
The amounts recognized in the balance sheet are as follows:
| 2013 | 2012 | |||||
| Present value of funded obligations | - | - | ||||
| Fair value of plan assets | - | - | ||||
| Present value of unfunded obligations | (35,955 | ) |
(32,483 | ) |
||
| Unfunded status | (35,955 | ) |
(32,483 | ) |
||
| Net liabilities / net assets | (35,955 | ) |
(32,483 | ) |
||
| Of which: |
||||||
| Liabilities (Employee benefits liabilities) | (35,955 | ) |
(32,483 | ) |
||
The changes in the net assets / liabilities recognized in the balance sheet are as follows:
| 2013 | 2012 | |||||
| Balance at 1 January | (32,483 | ) |
(24,919 | ) |
||
| Expense recognized in the income statement | (2,123 | ) |
(2,053 | ) |
||
| Actuarial gains/(losses) recognized directly in Other comprehensive income during the year | (3,994 | ) |
(7,622 | ) |
||
| Asset ceiling recognized directly in Other comprehensive income during the year |
||||||
| Contributions by employer | 2,645 | 2,111 | ||||
| Exchange differences on foreign plans |
||||||
| Balance at 31 December | (35,955 | ) |
(32,483 | ) |
||
The total expense recognized in the income statement is as follows:
| 2013 | 2012 | 2011 | |||||||
| Current service costs | 1,030 | 770 | 773 | ||||||
| Interest on obligation | 1,093 | 1,283 | 1,224 | ||||||
| (Gains)/losses on curtailments and settlements | - | - | 58 | ||||||
| Costs related to defined benefit plans | 2,123 | 2,053 | 2,055 | ||||||
F-147
The main actuarial assumptions for the year (weighted averages) are:
2013 |
2012 |
|||||||||||
| Austria | Germany | Austria | Germany | |||||||||
| Discount rate | 3.20 | % |
3.40 | % |
3.40 | % |
3.50 | % |
||||
| Price inflation | n.a. | n.a. | n.a. | n.a. | ||||||||
| Salary increase | 3.50 | % |
2.50 | % |
2.50 | % |
2.50 | % |
||||
| Pension increase | 2.00 | % |
1.75 | % |
1.50 | % |
1.75 | % |
||||
Sensitivities of significant actuarial assumptions
The discount rate, the future increase in wages and salaries and the pension increase rate were identified as significant actuarial assumptions. The following impacts on the defined benefit obligation are to be expected:
| • | A 0.25% increase/decrease in the discount rate would lead to a decrease/increase of 3.3% in the defined benefit obligation. |
| • | A 0.25% increase/decrease in the expected increase in salaries/wages would lead to an increase/decrease of 1.6% in the defined benefit obligation. |
| • | A 0.25% increase/decrease in the expected increase in the rate of pension increase would lead to an increase/decrease of less than 1.6% in the defined benefit obligation. |
The sensitivity analysis is based on realistically possible changes as of the end of the reporting year. Each change in a significant actuarial assumption was analyzed separately as part of the test. Interdependencies were not taken into account.
Year-end amounts for the current and previous periods are as follows:
| 2013 | 2012 | |||||
| Defined benefit obligations | (35,955 | ) |
(32,483 | ) |
||
| Unfunded status of asset/(liability) | (35,955 | ) |
(32,483 | ) |
||
| Experience adjustments on plan liabilities, gain/(loss) | (426 | ) |
(955 | ) |
||
| Gain/(loss) on liabilities due to changes in assumptions | (3,568 | ) |
(6,667 | ) |
||
29. Other non-current liabilities
| EUR (thousands) | 31 December 2013 |
31 December 2012 |
||||
| Government grants | 7,872 | 7,290 | ||||
| Deferred revenue | 11,599 | 7,855 | ||||
| Financial lease liability | 912 | - | ||||
| Other | 181 | 210 | ||||
| Total | 20,564 | 15,355 | ||||
The deferred revenue balance of € 11.6 million (2012: € 7.9 million; 2011: € 8.4 million) primarily relates to customer funded capital projects.
The government grants primarily relate to DSM Biologics Company Australia Pty Ltd. The grants will only be applied to support the infrastructure required to produce products from mammalian cells at the related facility. Breach of this requirement will require repayment of the grant and interest accrued.
F-148
30. Trade and other payables
| EUR (thousands) | 31 December 2013 |
31 December 2012 |
||||
| Income tax payable to related parties | (21 | ) |
595 | |||
| Income tax payable to tax authorities | 595 | 6,689 | ||||
| VAT payable | 285 | 123 | ||||
| Other tax payable | 866 | 766 | ||||
| Trade accounts payable | 100,875 | 72,025 | ||||
| Investment creditors payable | 4,410 | 8,983 | ||||
| Social security payable | 2,251 | 2,189 | ||||
| Other payables non-trade | 24,024 | 22,192 | ||||
| Interest and salary payable to related parties | 3,697 | 8,003 | ||||
| Other payables to related parties | 5,445 | 8,431 | ||||
| Deferred revenue | 26,193 | 26,932 | ||||
| Derivatives | - | 23 | ||||
| Total | 168,620 | 156,951 | ||||
31. Contingencies and commitments
31.1 Legal claim
The Group has a process in place to monitor legal claims periodically and systematically.
The Group is involved in several legal proceedings, most of which are related to the ordinary course of business. DPP does not expect these proceedings to result in liabilities that have a material effect on the Group's financial position. In case where it is probable that the outcome of the proceedings will be unfavorable, and the financial outcome can be measured reliably, a provision has been recognized in the financial statements.
31.2 Future commitments
DSM Biologics Company Australia has entered into a 10 year building lease with a third party that started in May 2013 and will expire in May 2023. The lease amount is € 0.8 million per year with an option to extend the lease at the end of the 10 year term.
32. Financial risk management objective and policies
The financial risk management objective and policies have been developed and applied from the Royal DSM perspective.
32.1 Financial risk management
The main financial risks faced by the Group relate to market risk (comprising interest rate risk, currency risk, price risk and credit risk) and liquidity risk. The Group’s financial policy is aimed at minimizing the effects of fluctuations in currency-exchange and interest rates on its results in the short term and following market rates in the long term. The Group uses average rate currency forward contracts and spot contracts to manage financial risks relating to business operations and does not enter into speculative derivative positions.
32.2 Market risk
32.2.1 Foreign currency risk
Foreign currency risk is the risk that the fair value or future cash flows of a financial instrument will fluctuate because of changes in foreign exchange rates. The Group’s exposure to the risk of changes in foreign exchange rates relates primarily to the Group’s operating activities (when revenue or expense is denominated in a different currency from the Group’s presentation currency).
It is the Group’s policy to hedge 100% of the currency risks resulting from sales and purchases at the moment of recognition of the trade receivables and trade payables (only if in excess of € 50
F-149
thousand equivalent value of a non-functional currency). The currency giving rise to these risks are primarily the US dollar. The risks arising from currency exposures are regularly reviewed and hedged when appropriate. The Group uses average-rate currency forward contracts and spot contracts to hedge the exposure to fluctuations in foreign exchange rates. At year-end, these instruments had remaining maturities of less than one year.
32.2.2 Foreign currency risk sensitivity
The following analysis of the sensitivity of loans with credit institutions and borrowings from related parties to US dollar, against Euro assumes a 10% change in all foreign currency rates against the euro from their level on 31 December 2013, with all other variables held constant. A +10% change indicates a strengthening of the foreign currencies against the euro. A -10% change represents a weakening of the foreign currencies against the Euro. No other financial assets or liabilities in a foreign currency of a material nature were noted.
| 2013 EUR (thousands) |
Increase/decrease in exchange rate |
Effect on profit and loss |
Effect on net assets |
||||
| US dollar | +10% | - | 28,269 | ||||
| -10% | - | (28,269 | ) |
||||
| 2012 EUR (thousands) |
Increase/decrease in exchange rate |
Effect on profit and loss |
Effect on net assets |
||||
| US dollar | +10% | - | 29,006 | ||||
| -10% | - | (29,006 | ) |
||||
| 2011 EUR (thousands) |
Increase/decrease in exchange rate |
Effect on profit and loss |
Effect on net assets |
||||
| US dollar | +10% | - | 40,880 | ||||
| -10% | - | (40,880 | ) |
||||
32.2.3 Interest rate risk
Interest rate risk is the risk that the fair value or future cash flows of financial instruments will fluctuate because of changes in market interest rates. The Group’s interest rate risk policy is aimed at minimizing the interest rate risks associated with the financing of the company and thus at the same time optimizing the net interest costs. During 2013, 2012 and 2011 the Group has not entered into any interest rate hedges.
32.2.4 Interest rate sensitivity
The following table demonstrates the sensitivity to a reasonably possible change in interest rates on that portion of loans and borrowings. Hedge accounting is not applied. With all other variables held constant, DPP’s profit before tax is affected through the impact on floating rate borrowings and Interest bearing other non-current assets as follows:
| 2013 EUR (thousands) |
Increase/decrease in Basis points |
Effect on profit and loss |
||
| Euro | +100 bps | (235 | ) |
|
| -100 bps | 235 | |||
| 2012 EUR (thousands) |
Increase/decrease in Basis points |
Effect on profit and loss |
||
| Euro | +100 bps | (340 | ) |
|
| -100 bps | 340 | |||
| 2011 EUR (thousands) |
Increase/decrease in Basis points |
Effect on profit and loss |
||
| Euro | +100 bps | (28 | ) |
|
| -100 bps | 28 | |||
F-150
32.3 Credit risk
The Group is highly exposed to the financial subsidiaries of Royal DSM. In general, Royal DSM is a listed company in The Netherlands with a triple A rating and also considered a related party of the Group. Therefore management of the Group has assessed the credit risk as limited.
The Group primary has the following financial assets and related credit risk:
| • | Receivables from related parties (trade and relating carve-out adjustments): these receivables all relate to Royal DSM. |
| • | Receivables from third parties: the Group performs a credit risk assessment for all major customers on a yearly basis reducing the credit risk. |
| • | Cash and cash equivalents: 99% of the cash and cash equivalents relate to Royal DSM. |
The maximum exposure to credit risk is represented by the carrying amounts of financial assets that are recognized in the balance sheet, including derivative financial instruments. No significant agreements or financial instruments were available at the reporting date that would reduce the maximum exposure to credit risk. Information about financial assets is presented in note 21 ‘Trade and other receivables’, 22 ‘Receivable from related parties for carve-out adjustments’ and note 24 ‘Cash and cash equivalents’.
32.4 Liquidity risk
The Group operates several legal entities in several countries. To address the risk of liquidity, the Group applies cash pooling in most of the countries as far as foreign currency exchange policies of countries allow this. Cash balances, at different companies within the group, relating to the cash pooling are not offset as there is no enforceable legal right to offset the recognised amounts. Each company has its own legal agreement with Royal DSM relating the in-house cash position. The Group also monitors with high frequency its cash-balances and cash forecasts. When required, additional debt or equity based money transfers between the Group’s entities are implemented.
The below table provides an overview of the maturity analysis for financial liabilities of the Group.
| EUR (thousands) | On demand | Less than 3 months |
3 to 12 months |
1 to 5 years | > 5 years | Total | ||||||||||||
| Interest-bearing loans and borrowings | 191,617 | - | 47,886 | 290,786 | - | 530,289 | ||||||||||||
| Interest payable on loans and borrowings | - | - | 8,930 | 29,544 | - | 38,474 | ||||||||||||
| Trade and other payables | - | 132,711 | 6,019 | - | - | 138,730 | ||||||||||||
| Total at 31 December 2013 | 191,617 | 132,711 | 62,835 | 320,330 | - | 707,493 | ||||||||||||
| EUR (thousands) | On demand | Less than 3 months |
3 to 12 months |
1 to 5 years | > 5 years | Total | ||||||||||||
| Interest-bearing loans and borrowings | 182,389 | - | 133,728 | 224,141 | - | 540,258 | ||||||||||||
| Interest payable | - | 9 | 13,846 | 18,906 | - | 32,762 | ||||||||||||
| Trade and other payables | - | 106,301 | 15,715 | - | - | 122,016 | ||||||||||||
| Total at 31 December 2012 | 182,389 | 106,310 | 163,289 | 243,047 | - | 695,036 | ||||||||||||
The outstanding interest-bearing loans and borrowings as well as any interest payable on those loans and borrowings will be settled with Royal DSM as of the date of closing. Any open trade and other payables will be settled via payment as part of the normal course of business.
F-151
32.5 Hedge accounting and derivatives
32.5.1 Derivatives that are not used in hedge accounting
To hedge intercompany loans, receivables and payables denominated in currencies other than the functional currency, the Group uses spot foreign exchange contracts with financial subsidiaries of Royal DSM.
32.5.2 Derivatives that are used in hedge accounting
Average rate currency forward contracts measured at fair value are designated as hedging instruments in cash flow hedges of future sales and purchases. These forecast transactions are highly probable. The average rate currency forward contract balances vary with the level of expected foreign currency sales and purchases and changes in foreign exchange forward rates.
The terms of the average rate currency forward contracts match the terms of the expected highly probable forecast transactions. As a result, no hedge ineffectiveness arises requiring recognition through profit or loss. The highly expected forecast cash flows are expected to occur during 2013.
The cash flow hedges of the expected future sales, with a notional amount of € 3 million (2012 notional value of € 3 million, 2011 notional value of € 6 million), were assessed to be highly effective and a net unrealized loss of € 11 thousand (2012: net unrealized loss of € 23 thousand; 2011: net unrealized loss of € 375 thousand), with a deferred tax liability of € 3 thousand (2012: € 6 thousand deferred tax liability; 2011: € 94 thousand deferred tax liability) relating to the hedging instruments, is included in other comprehensive income.
32.6 Fair value of financial instruments
The below table provides a comparison of the carrying amount and fair value of the financial instruments of the Group.
Carrying Amount |
Fair Value |
|||||||||||
2013 |
2012 |
2013 |
2012 |
|||||||||
| Financial Assets |
||||||||||||
| Other financial assets | ||||||||||||
| Loans and other receivables | - | 287,000 | - | 287,000 | ||||||||
| Total | - | 287,000 | - | 287,000 | ||||||||
| Financial Liabilities |
||||||||||||
| Interest-bearing loans and borrowings | ||||||||||||
| Floating rate borrowings | 23,510 | 31,711 | 25,078 | 33,509 | ||||||||
| Fixed rate borrowings | 315,162 | 326,157 | 328,620 | 349,493 | ||||||||
| Derivatives in effective hedges | - | 23 | - | 23 | ||||||||
| Total | 338,672 | 357,891 | 353,698 | 383,025 | ||||||||
For the above table, floating and fixed rate liabilities have been calculated using the relevant yield-curves of the respective years. The cash flows have been calculated in the original currency and translated into euro using the year-end exchange rate. The interest amounts used in the cash flows have been based on annual payments. In some cases this deviates from the actual interest schedule, but these differences are considered to be minimal.
For current assets, liabilities and in-house cash positions, the fair value is deemed to approximate the carrying amount due to the short-term nature.
DSM uses the following hierarchy for determining the fair value of financial instruments measured at fair value:
| • | Level 1: quoted prices in active markets for identical assets or liabilities |
| • | Level 2: other techniques for which all inputs that have a significant effect on the fair value are observable, either directly or indirectly |
F-152
| • | Level 3: techniques that use inputs that have a significant effect on the fair value that are not based on observable market data. |
For DPP, the fair value of floating and fixed rate borrowings and derivatives is deemed to be a level 2 hierarchy.
During the year there were no transfers between individual levels of the fair value hierarchy.
33. Workforce
The total headcount at year end of the Group was: 2,492 (2012: 2,462, 2011: 2,412). The average full time equivalent of the Group year to date (FTE) was: 2,458 (2012: 2,404, 2011: 2,343).
34. Remuneration of key management
Key management |
|||||||||
| EUR (thousands) | 31 December 2013 |
31 December 2012 |
31 December 2011 |
||||||
| Salary and other short term employee benefits | 2,240 | 2,216 | 2,327 | ||||||
| Post-employment benefits | 213 | 163 | 147 | ||||||
| Termination benefits | 510 | 342 | 293 | ||||||
| Total | 2,963 | 2,721 | 2,767 | ||||||
The key management of the Group includes the management team of the DPP Business Group along with the Business Unit Directors of the four DPP Business Units. The termination benefits are based on individual contract agreements.
35. Related party transactions
All Royal DSM entities qualify as a related party. In addition to the transactions and balances detailed elsewhere in the financial statements, the Group had the following arm’s length transactions and outstanding balances with these related parties during the year and at the end of the reporting period:
1. Related party transactions
The Group’s related party transactions with Royal DSM consist of the following:
| EUR (thousands) | 31 December 2013 |
31 December 2012 |
31 December 2011 |
||||||
| Net sales related parties | 44,204 | 52,026 | 60,371 | ||||||
| Interest paid on related party loans | (12,296 | ) |
(25,466 | ) |
(25,001 | ) |
|||
| Interest income on loans and receivables from related parties | 2,669 | 6,553 | 8,613 | ||||||
| Total | 34,577 | 33,113 | 43,983 | ||||||
F-153
2. Outstanding balances with related parties
The outstanding balances with related parties contain:
| EUR (thousands) | 31 December 2013 |
31 December 2012 |
||||
| Receivables from related parties | 8,345 | 10,258 | ||||
| Income tax receivable from related parties (NL and US Fiscal Unity) | 9,519 | 28,563 | ||||
| Receivable from related parties for carve-out adjustments | 146,516 | 162,032 | ||||
| Loan to related parties | - | 287,000 | ||||
| In-house cash | 613,334 | 320,936 | ||||
| Borrowings from related parties | (333,882 | ) |
(350,567 | ) |
||
| In-house cash borrowings | (191,617 | ) |
(182,389 | ) |
||
| Income tax payable to related parties (NL and US Fiscal Unity) | 21 | (595 | ) |
|||
| Interest payable to related parties | (3,697 | ) |
(8,003 | ) |
||
| Other payables to related parties | (5,445 | ) |
(8,431 | ) |
||
| Total | 243,094 | 258,804 | ||||
DPP is liable for tax liabilities due to being a member of the fiscal unity’s in the United States and The Netherlands.
36. Events after the balance sheet date
No significant changes in net assets occurred after the end of the financial year.
On 18 November 2013, Royal DSM, being the ultimate shareholder of the Group entered into a contribution agreement with JLL Partners (JLL) and agreed to contribute the DPP Business into a new company. JLL agreed to contribute approximately USD 400 million in cash and their 100% investment in Patheon Inc., a US based company which is the world’s leading provider of contract drug development and manufacturing services. At closing of the transaction on 11 March 2014, JLL owns a 51% equity interest in DPx Holdings B.V. and Royal DSM owns the remaining 49%. The DPP entities have been fully incorporated into the new company as of the 11 March 2014 transaction date.
F-154
Report of Independent Auditors
To Patheon Holdings Coöperatief U.A.
We have audited the accompanying combined financial statements of DSM Pharmaceutical Products Group (the “Group”), containing the entities as included in note 3 of the combined financial statements, which comprise the combined balance sheets as of 31 December 2013 and 2012, and the related combined statements of comprehensive income, changes in net assets attributable to owners of the Group and cash flow statements for each of the three years in the period ended 31 December 2013 and the related notes to the combined financial statements.
Management’s Responsibility for the Financial Statements
Management is responsible for the preparation and fair presentation of these financial statements in conformity with International Financial Reporting Standards as issued by the International Accounting Standards Board. This includes the design, implementation and maintenance of internal control relevant to the preparation and fair presentation of financial statements that are free of material misstatement, whether due to fraud or error.
Auditor’s Responsibility
Our responsibility is to express an opinion on these financial statements based on our audits. We conducted our audits in accordance with auditing standards generally accepted in the United States. Those standards require that we plan and perform the audit to obtain reasonable assurance about whether the financial statements are free of material misstatement.
An audit involves performing procedures to obtain audit evidence about the amounts and disclosures in the financial statements. The procedures selected depend on the auditor’s judgment, including the assessment of the risks of material misstatement of the financial statements, whether due to fraud or error. In making those risk assessments, the auditor considers internal control relevant to the entity’s preparation and fair presentation of the financial statements in order to design audit procedures that are appropriate in the circumstances, but not for the purpose of expressing an opinion on the effectiveness of the entity’s internal control. Accordingly, we express no such opinion. An audit also includes evaluating the appropriateness of accounting policies used and the reasonableness of significant accounting estimates made by management, as well as evaluating the overall presentation of the financial statements.
We believe that the audit evidence we have obtained is sufficient and appropriate to provide a basis for our audit opinion.
Opinion
In our opinion, the financial statements referred to above present fairly, in all material respects, the combined financial position of DSM Pharmaceutical Products Group at 31 December 2013 and 2012, and the combined results of its operations and its cash flows for each of the three years in the period ended 31 December 2013, in conformity with International Financial Reporting Standards as issued by the International Accounting Standards Board.
/s/ Ernst & Young Accountants LLP
Maastricht, Netherlands
4 June 2015
F-155
Shares
![]()
Common Stock
PRELIMINARY PROSPECTUS
| J.P. Morgan | Morgan Stanley | Jefferies | UBS Investment Bank |
Through and including , 2015 (the 25th day after the date of this prospectus), all dealers effecting transactions in these securities, whether or not participating in this offering, may be required to deliver a prospectus. This is in addition to a dealer’s obligation to deliver a prospectus when acting as an underwriter and with respect to an unsold allotment or subscription.
, 2015
PART II
INFORMATION NOT REQUIRED IN PROSPECTUS
Item 13. Other expenses of issuance and distribution.
Amount To Be Paid |
|||
| Registration fee | $ | 11,620 | |
| FINRA filing fee | 15,500 | ||
| Listing fees | * |
||
| Transfer agent’s fees | * |
||
| Printing and engraving expenses | * |
||
| Legal fees and expenses | * |
||
| Accounting fees and expenses | * |
||
| Blue Sky fees and expenses | * |
||
| Miscellaneous | * |
||
| Total | $ | * |
|
* To be filed by amendment.
Each of the amounts set forth above, other than the Registration fee and the FINRA filing fee, is an estimate.
Item 14. Indemnification of directors and officers.
Our directors and executive officers will enter into indemnification agreements with us. The agreements provide, to the fullest extent permitted by our amended and restated articles of association and the law of The Netherlands, that we will indemnify the directors and executive officers against any and all liabilities, claims, judgments, fines, penalties, interest and expenses, including attorneys’ fees, incurred in connection with any expected, threatened, pending or completed action, investigation or other proceeding, whether civil, criminal or administrative, involving a director or an executive officer by reason of his position as director or officer.
The articles of association provide that we will, to the full extent permitted by the law of The Netherlands, as amended from time to time, indemnify, and advance expenses to, each of its now acting and former board members, officers, employees and agents, whenever any such person is made a party, or threatened to be made a party, in any action, suit or proceeding by reason of his service with us. The articles of association also provide that we may purchase and maintain directors’ and officers’ liability insurance.
In any underwriting agreement we enter into in connection with the sale of common stock being registered hereby, the underwriters will agree to indemnify, under certain conditions, us, our directors, our officers and persons who control us, within the meaning of the Securities Act, against certain liabilities.
Item 15. Recent sales of unregistered securities.
In March 2014, the Registrant issued 954 membership interests to JLL/Delta Patheon Holdings, L.P., 45 membership units to DSM Newco B.V. and one membership unit to JLL/Delta Patheon GP, Ltd. The membership interests were issued in connection with the arrangement agreement between Patheon Inc. and a partnership formed by Koninklijke DSM N.V. (“DSM”) and JLL Patheon Co-Investment Fund L.P., pursuant to which DPx Holdings B.V. acquired all the outstanding equity securities of Patheon Inc. and DSM contributed its existing pharmaceutical products business to a subsidiary of the Registrant. The issuance was exempt from registration under the Securities Act of 1933, as amended, in reliance on Section 4(a)(2) of the Securities Act of 1933.
Item 16. Exhibits and financial statement schedules.
| a. | The Exhibit Index is hereby incorporated herein by reference. |
| b. | All schedules have been omitted because they are not required, are not applicable or the information is otherwise set forth in the Consolidated Financial Statements and related notes thereto. |
II-1
Item 17. Undertakings.
The undersigned registrant hereby undertakes to provide to the underwriters at the closing specified in the underwriting agreement certificates in such denominations and registered in such names as required by the underwriters to permit prompt delivery to each purchaser.
Insofar as indemnification for liabilities arising under the Securities Act of 1933 may be permitted to directors, officers and controlling persons of the registrant pursuant to the provisions referenced in Item 14 of this Registration Statement, or otherwise, the registrant has been advised that in the opinion of the SEC such indemnification is against public policy as expressed in the Act and is, therefore, unenforceable. In the event that a claim for indemnification against such liabilities (other than the payment by the registrant of expenses incurred or paid by a director, officer, or controlling person of the registrant in the successful defense of any action, suit or proceeding) is asserted by such director, officer or controlling person in connection with the securities being registered hereunder, the registrant will, unless in the opinion of its counsel the matter has been settled by controlling precedent, submit to a court of appropriate jurisdiction the question of whether such indemnification by it is against public policy as expressed in the Act and will be governed by the final adjudication of such issue.
The undersigned registrant hereby undertakes that:
(1) For purposes of determining any liability under the Securities Act of 1933, the information omitted from the form of prospectus filed as part of this Registration Statement in reliance upon Rule 430A and contained in a form of prospectus filed by the Registrant pursuant to Rule 424(b)(1) or (4) or 497(h) under the Securities Act shall be deemed to be part of this Registration Statement as of the time it was declared effective.
(2) For the purpose of determining any liability under the Securities Act of 1933, each post-effective amendment that contains a form of prospectus shall be deemed to be a new Registration Statement relating to the securities offered therein, and the offering of such securities at that time shall be deemed to be the initial bona fide offering thereof.
II-2
Signatures
Pursuant to the requirements of the Securities Act of 1933, the Registrant has duly caused this Registration Statement to be signed on its behalf by the undersigned, thereunto duly authorized, in New York, NY, on the 8th day of June, 2015.
| Patheon Holdings Coöperatief U.A. | |||
| By: |
/s/ James C. Mullen
|
||
| Name: | James C. Mullen | ||
| Title: | Chief Executive Officer | ||
| By: |
/s/ Stuart Grant
|
||
| Name: | Stuart Grant | ||
| Title: | Executive Vice President and | ||
| Chief Financial Officer | |||
Power of attorney
KNOW ALL MEN BY THESE PRESENTS, that each person whose signature appears below constitutes and appoints James C. Mullen, Stuart Grant and Eric Shebert, and each of them, his true and lawful attorneys-in-fact and agents, with full power to act separately and full power of substitution and resubstitution, for him and in his name, place and stead, in any and all capacities, to sign any and all amendments (including post-effective amendments) to this registration statement and all additional registration statements pursuant to Rule 462 of the Securities Act of 1933, as amended, and to file the same, with all exhibits thereto, and all other documents in connection therewith, with the SEC, granting unto each said attorney-in-fact and agent full power and authority to do and perform each and every act in person, hereby ratifying and confirming all that said attorneys-in-fact and agents or either of them or his or their substitute or substitutes may lawfully do or cause to be done by virtue hereof.
Pursuant to the requirements of the Securities Act of 1933, as amended, this registration statement has been signed by the following persons in the capacities, in the locations and on the dates indicated.
| Signature | Title | Date |
|
|
|
|
|
/s/ JAMES C. MULLEN
|
Chief Executive Officer (Principal Executive Officer) |
June 8, 2015 |
| James C. Mullen | ||
|
/s/ STUART GRANT
|
Executive Vice President and Chief Financial Officer Director (Principal Financial Officer) |
June 8, 2015 |
| Stuart Grant | ||
|
/s/ DEAN WILSON
|
Vice President and Corporate Controller (Principal Accounting Officer) |
June 8, 2015 |
| Dean Wilson | ||
|
/s/ ERIC SHERBET
|
Director | June 8, 2015 |
| Eric Sherbet | ||
|
/s/ DANIEL AGROSKIN
|
Director | June 8, 2015 |
| Daniel Agroskin | ||
|
/s/ JAMES UNSWORTH
|
Director | June 8, 2015 |
| James Unsworth |
II-3
Exhibit index
|
Exhibit Number |
Description |
| 1.1* | Form of Underwriting Agreement |
| 3.1* | Articles of association of Patheon Holdings Coöperatief U.A. currently in effect |
| 3.2* | Form of amended and restated articles of association of Patheon N.V. to be in effect prior to consummation of this offering |
| 5.1* | Opinion of De Brauw Blackstone Westbroek N.V. |
| 10.1* | Indenture, dated as of February 5, 2014, between the Registrant and Wells Fargo Bank, National Association, as trustee |
| 10.2* | Supplemental Indenture, dated March 11, 2014, to the Indenture dated as of February 5, 2014, between the Registrant and Wells Fargo Bank, National Association, as trustee |
| 10.3* | Second Supplemental Indenture, dated March 11, 2014, to the Indenture dated as of February 5, 2014, between the Registrant and Wells Fargo Bank, National Association, as trustee |
| 10.4* | Third Supplemental Indenture, dated November 17, 2014, to the Indenture dated as of February 5, 2014, between the Registrant and Wells Fargo Bank, National Association, as trustee |
| 10.5* | Fourth Supplemental Indenture, dated November 17, 2014, to the Indenture dated as of February 5, 2014, between the Registrant and Wells Fargo Bank, National Association, as trustee |
| 10.6* | Credit Agreement, dated as of March 11, 2014, among the Registrant, the lending institutions from time to time party thereto, UBS AG Stamford branch, as administrative agent, collateral agent, LC Issuer and Swing Line lender, JPMorgan Chase Bank, N.A, as syndication agent and an LC Issuer, Jeffries Finance LLC, KeyBank National Association and Morgan Stanley Senior Funding, Inc., as co-documentation agents, UBS AG Stamford branch, J.P. Morgan Securities LLC, Jeffries Finance LLC, KeyBank National Association and Morgan Stanley Senior Funding, Inc., as joint Lead-arrangers; UBS Securities LLC, J.P. Morgan Securities LLC, Barclays Bank PLC, Jeffries Finance LLC, KBCM Bridge LLC, Morgan Stanley Senior Funding, Inc. and Sumitomo Mitsui Banking Corp., as joint bookrunners |
| 10.7* | First Amendment to the Credit Agreement, dated September 29, 2014 |
| 10.8* | Second Amendment to the Credit Agreement, dated March 31, 2015 |
| 10.9* | Stockholders Agreement, dated , 2015, among the Registrant, and |
| 10.10* | Patheon N.V. Omnibus Equity Incentive Plan |
| 21.1* | Subsidiaries of the Registrant |
| 23.1 | Consent of Ernst & Young LLP, independent registered public accountants |
| 23.2 | Consent of Ernst & Young LLP, independent auditors |
| 23.3 | Consent of Ernst & Young Accountants LLP, independent auditors |
| 23.4* | Consent of De Brauw Blackstone Westbrock N.V. (included in Exhibit 5.1) |
| 99.1 | Consent of Paul Levy, to be named as a director |
| 99.2 | Consent of Michel Lagarde, to be named as a director |
| 99.3 | Consent of Nicholas O’Leary, to be named as a director |
| 99.4 | Consent of Stephan Tanda, to be named as a director |
| 99.5 | Consent of Hugh Welsh, to be named as a director |
| 99.6 | Consent of Philip Eykerman, to be named as a director |
* To be filed by amendment.
II-4