Attached files
| file | filename |
|---|---|
| EX-4.1 - EX-4.1 - Fogo de Chao, Inc. | d806502dex41.htm |
| EX-1.1 - EX-1.1 - Fogo de Chao, Inc. | d806502dex11.htm |
| EX-5.1 - EX-5.1 - Fogo de Chao, Inc. | d806502dex51.htm |
| EX-3.1 - EX-3.1 - Fogo de Chao, Inc. | d806502dex31.htm |
| EX-3.2 - EX-3.2 - Fogo de Chao, Inc. | d806502dex32.htm |
| EX-21.1 - EX-21.1 - Fogo de Chao, Inc. | d806502dex211.htm |
| EX-10.2 - EX-10.2 - Fogo de Chao, Inc. | d806502dex102.htm |
| EX-10.15 - EX-10.15 - Fogo de Chao, Inc. | d806502dex1015.htm |
| EX-10.18 - EX-10.18 - Fogo de Chao, Inc. | d806502dex1018.htm |
| EX-10.12 - EX-10.12 - Fogo de Chao, Inc. | d806502dex1012.htm |
| EX-10.14 - EX-10.14 - Fogo de Chao, Inc. | d806502dex1014.htm |
| EX-10.16 - EX-10.16 - Fogo de Chao, Inc. | d806502dex1016.htm |
| EX-23.1 - EX-23.1 - Fogo de Chao, Inc. | d806502dex231.htm |
| EX-23.2 - EX-23.2 - Fogo de Chao, Inc. | d806502dex232.htm |
| EX-10.17 - EX-10.17 - Fogo de Chao, Inc. | d806502dex1017.htm |
Table of Contents
As Filed with the Securities and Exchange Commission on June 8, 2015
Registration No. 333-203527
UNITED STATES
SECURITIES AND EXCHANGE COMMISSION
WASHINGTON D.C. 20549
AMENDMENT NO. 2
TO
FORM S-1
REGISTRATION STATEMENT
UNDER THE SECURITIES ACT OF 1933
FOGO DE CHAO, INC.
(Exact name of registrant as specified in its charter)
| Delaware | 5812 | 45-5353489 | ||
| (State or other jurisdiction of incorporation or organization) |
(Primary standard industrial classification code number) |
(I.R.S. employer identification number) |
Albert G. McGrath General Counsel 14881 Quorum Drive Suite 750 Dallas, TX 75254 (972) 960-9533
(Address, Including Zip Code, and Telephone Number, Including Area Code, of Agent for Service)
Copies to:
| Richard D. Truesdell, Jr., Esq. John B. Meade, Esq. Davis Polk & Wardwell LLP 450 Lexington Avenue New York, New York 10017 (212) 450-4000 |
Marc D. Jaffe, Esq. Ian D. Schuman, Esq. Latham & Watkins LLP 885 Third Avenue New York, New York 10022-4834 (212) 906-1200 |
Approximate date of commencement of proposed sale to the public: As soon as practicable after the effective date of this Registration Statement.
If any of the securities being registered on this Form are to be offered on a delayed or continuous basis pursuant to Rule 415 under the Securities Act of 1933, check the following box. ¨
If this Form is filed to register additional securities for an offering pursuant to Rule 462(b) under the Securities Act, check the following box and list the Securities Act registration statement number of the earlier effective registration statement for the same offering. ¨
If this Form is a post-effective amendment filed pursuant to Rule 462(c) under the Securities Act, check the following box and list the Securities Act registration statement number of the earlier effective registration statement for the same offering. ¨
If this Form is a post-effective amendment filed pursuant to Rule 462(d) under the Securities Act, check the following box and list the Securities Act registration statement number of the earlier effective registration statement for the same offering. ¨
Indicate by check mark whether the registrant is a large accelerated filer, an accelerated filer, a non-accelerated filer, or a smaller reporting company. See the definitions of “large accelerated filer,” “accelerated filer” and “smaller reporting company” in Rule 12b2 of the Exchange Act.
| Large accelerated filer | ¨ | Accelerated filer | ¨ | |||||
| Non-accelerated filer | x | (Do not check if a smaller reporting company) | Smaller reporting company | ¨ |
CALCULATION OF REGISTRATION FEE
|
| ||||||||
| Title of Each Class of Securities to be Registered |
Amount to be Registered(1) |
Proposed Maximum Offering Price Per Share |
Proposed Maximum Aggregate Offering Price(1) |
Amount of Registration Fee(2) | ||||
| Common Stock, par value $0.01 per share |
5,073,528 | $18.00 | $91,323,504 | $10,612 | ||||
|
| ||||||||
|
| ||||||||
| (1) | Estimated solely for purposes of calculating the registration fee in accordance with Rule 457(a) under the Securities Act of 1933, as amended. Includes the 661,764 shares of common stock that the underwriters have the option to purchase pursuant to their option to purchase additional shares. |
| (2) | $8,715 previously paid. |
The Registrant hereby amends this Registration Statement on such date or dates as may be necessary to delay its effective date until the Registrant shall file a further amendment which specifically states that this Registration Statement shall thereafter become effective in accordance with Section 8(a) of the Securities Act of 1933 or until the Registration Statement shall become effective on such date as the Securities and Exchange Commission, acting pursuant to said Section 8(a), may determine.
Table of Contents
Subject to Completion, Dated June 8, 2015
The information in this prospectus is not complete and may be changed. We may not sell these securities until the registration statement filed with the Securities and Exchange Commission is effective. This prospectus is not an offer to sell these securities and we are not soliciting offers to buy these securities in any state where the offer or sale is not permitted.
PRELIMINARY PROSPECTUS
4,411,764 Shares
Fogo de Chão, Inc.
Common Stock
We are offering 4,411,764 shares of our common stock. This is our initial public offering and no public market currently exists for our common stock. We expect our initial public offering price to be between $16.00 and $18.00 per share. We have applied to list our common stock on the NASDAQ Global Select Market under the symbol “FOGO.”
We are an “emerging growth company” as defined under the federal securities laws and, as such, will be subject to reduced public company reporting requirements.
Investing in our common stock involves a high degree of risk. Please read “Risk Factors”
beginning on page 16 of this prospectus.
Neither the Securities and Exchange Commission nor any state securities commission has approved or disapproved of these securities or determined if this prospectus is truthful or complete. Any representation to the contrary is a criminal offense.
PER SHARE TOTAL Public offering price $ $
Underwriting discounts and commissions* $ $
Proceeds, before expenses, to us $ $
* We refer you to “Underwriting (Conflicts of Interest)” beginning on page 130 of this prospectus for additional information regarding underwriting compensation.
Delivery of the shares of common stock is expected to be made on or about , 2015. We have granted the underwriters an option for a period of 30 days from the date of this prospectus to purchase from us an additional 661,764 shares of our common stock. If the underwriters exercise the option in full, the total underwriting discounts and commissions payable by us will be $ , and the total proceeds to us, before expenses, will be $ .
Jefferies J.P. Morgan
Credit Suisse Deutsche Bank Securities Piper Jaffray Wells Fargo Securities Macquarie Capital
Prospectus dated , 2015
Table of Contents

Table of Contents

Dallas, TX Kansas City, MO Denver, CO Portland, OR Las Vegas, NV Scottsdale, AZ San Diego, CA Beverly Hills, CA Los Angeles, CA San Jose, CA Minneapolis, MN Rosemont, IL Chicago, IL Indianapolis, IN Philadelphia, PA Boston, MA New York City, NY Baltimore, MD Washington, DC Atlanta, GA Orlando, FL Miami, FL Austin, TX San Antonio, TX Houston, TX San Juan Rio de Janeiro – Bota Fogo – Barra da Tijuca São Paulo – Vila Olimpia – Moema – Santo Amaro – Center Norte – Jardins Belo Horizonte Brasilia Salvador SALVADOR, BRAZIL DALLAS, TEXAS RIO DE JANEIRO, BRAZIL UNITED STATES BRAZIL PUERTO RICO
Table of Contents

Table of Contents
We are responsible for the information contained in this prospectus and in any related free-writing prospectus we may prepare or authorize to be delivered to you. We have not, and the underwriters have not, authorized anyone to give you any other information, and we and the underwriters take no responsibility for any other information that others may give you. We are not, and the underwriters are not, making an offer of these securities in any jurisdiction where the offer is not permitted. You should not assume that the information contained in this prospectus is accurate as of any date other than the date on the front of this prospectus, regardless of the time of delivery of this prospectus or of any sale of the common stock.
| Page | ||||
| ii | ||||
| ii | ||||
| iv | ||||
| 1 | ||||
| 16 | ||||
| 41 | ||||
| 43 | ||||
| 44 | ||||
| 45 | ||||
| 47 | ||||
| 49 | ||||
| 51 | ||||
| Management’s Discussion and Analysis of Financial Condition and Results of Operations |
58 | |||
| 87 | ||||
| 102 | ||||
| 108 | ||||
| 119 | ||||
| 121 | ||||
| 123 | ||||
| 126 | ||||
| 128 | ||||
| Underwriting (Conflicts of Interest) |
130 | |||
| 137 | ||||
| 137 | ||||
| 137 | ||||
| Fogo de Chão, Inc. Index to Consolidated Financial Statements |
F-1 | |||
Table of Contents
This prospectus includes industry and market data that we obtained from periodic industry publications such as those by the National Restaurant Association, third-party studies and surveys and internal company surveys. These sources include government and industry sources. Industry publications and surveys generally state that the information contained therein has been obtained from sources believed to be reliable. Although we believe the industry and market data to be reliable as of the date of this prospectus, this information could prove to be inaccurate. Industry and market data could be wrong because of the method by which sources obtained their data and because information cannot always be verified with complete certainty due to the limits on the availability and reliability of raw data, the voluntary nature of the data gathering process and other limitations and uncertainties. In addition, we do not know all of the assumptions regarding general economic conditions or growth that were used in preparing the forecasts from the sources relied upon or cited herein.
Unless the context otherwise requires, references in this prospectus to “Fogo de Chão, Inc.,” “we,” “us,” “our,” and “our company” are, collectively, to Fogo de Chão, Inc., a Delaware corporation, incorporated in 2012, the issuer of the common stock offered hereby, and its consolidated subsidiaries.
Fogo de Chão, Inc. (the “Successor”) was incorporated under the name Brasa (Parent) Inc. on May 24, 2012 in connection with the acquisition (the “Acquisition”) on July 21, 2012 of Fogo de Chão Churrascaria (Holdings) LLC, a Delaware limited liability company, and its parent company, FC Holdings Inc., a Cayman Islands exempt company, by a collaborative group consisting of funds affiliated with Thomas H. Lee Partners, L.P. (“THL” and along with such funds and their affiliates, the “THL Funds”) and other minority investors. The Successor owns 100% of Brasa (Purchaser) Inc. (“Brasa Purchaser”), which owns 100% of Brasa (Holdings) Inc. (“Brasa Holdings”). Brasa Holdings owns 100% of Fogo de Chão (Holdings) Inc. (“Fogo Holdings”), which owns the Successor’s domestic and foreign operating subsidiaries. Immediately prior to the Acquisition, (i) FC Holdings Inc. contributed all of its ownership interests in Fogo de Chão Churrascaria (Holdings) LLC to Fogo Holdings, (ii) Fogo de Chão Churrascaria (Holdings) LLC was merged with Fogo Holdings, which was the surviving corporation, and (iii) FC Holdings Inc. was domesticated into Brasa Holdings. Promptly thereafter, Brasa Parent acquired Brasa Holdings through a reverse subsidiary merger of its subsidiary, Brasa Merger Sub Inc., with Brasa Holdings, which was the surviving corporation. The Acquisition was financed by loans to Brasa Holdings and equity contributions by the THL Funds and certain members of management.
As a result of the Acquisition, the financial information for all periods after May 24, 2012 represents the financial information of the Successor. Prior to, and including, July 20, 2012, the consolidated financial statements include the accounts of the “Predecessor” company. Financial information in the Predecessor period relates to Fogo de Chão Churrascaria (Holdings) LLC and its subsidiaries. Due to the change in the basis of accounting resulting from the Acquisition, the Predecessor’s consolidated financial statements and the Successor’s consolidated financial statements are not necessarily comparable. From May 24, 2012 to July 20, 2012, Successor had no activities other than the incurrence of transaction costs related to the Acquisition.
We operate on a 52- or 53-week fiscal year that ends on the Sunday that is closest to December 31 of each year. Each fiscal year generally is comprised of four 13-week fiscal quarters, although in the years with 53 weeks the fourth quarter represents a 14-week period. Fiscal 2012, Fiscal 2013 and Fiscal 2014 ended on December 30, 2012, December 29, 2013 and December 28, 2014, respectively, and each were comprised of 52 weeks. Approximately every six or seven years a 53-week fiscal year occurs. Fiscal 2015 is a 53-week fiscal year.
Comparable restaurant sales growth reflects the change in year-over-year sales for comparable restaurants. We consider a restaurant to be comparable during the first full fiscal quarter following the eighteenth full month of operations. We adjust the sales included in the comparable restaurant calculation for restaurant closures, primarily as a result of remodels, so that the periods will be comparable. Changes in comparable restaurant sales reflect changes in sales for the comparable group of restaurants over a specified period of time. Changes in comparable restaurant sales reflect changes in guest count trends as well as changes in average check and highlight the performance of existing restaurants as the impact of new restaurant openings is excluded.
ii
Table of Contents
We measure average unit volumes (“AUVs”) on an annual (52-week) basis. AUVs consist of the average sales of all restaurants that have been open for a trailing 52-week period or longer. We adjust the sales included in AUV calculations for restaurant closures. This measurement allows us to assess changes in consumer spending patterns at our restaurants and the overall performance of our restaurant base.
Restaurant contribution is defined as revenue less restaurant operating costs (which include food and beverage costs, compensation and benefits costs and occupancy and certain other operating costs but exclude depreciation and amortization expense). Restaurant contribution margin is defined as restaurant contribution as a percentage of revenue. Restaurant contribution and restaurant contribution margin are supplemental measures of operating performance of our restaurants and our calculations thereof may not be comparable to those reported by other companies. Restaurant contribution and restaurant contribution margin are neither required by, nor presented in accordance with, United States generally accepted accounting principles (“GAAP”). Restaurant contribution and restaurant contribution margin have limitations as analytical tools, and you should not consider them in isolation or as substitutes for analysis of our results as reported under GAAP.
We believe that restaurant contribution and restaurant contribution margin are important tools for securities analysts, investors and other interested parties because they are widely-used metrics within the restaurant industry to evaluate restaurant-level productivity, efficiency and performance. We use restaurant contribution and restaurant contribution margin as key metrics to evaluate the profitability of incremental sales at our restaurants, to evaluate our restaurant performance across periods and to evaluate our restaurant financial performance compared with our competitors.
Cash-on-cash return for an individual restaurant is calculated by dividing restaurant contribution by our initial investment (net of pre-opening costs and tenant allowances). We believe that cash-on-cash return is an important tool for securities analysts, investors and other interested parties because it is a widely-used metric within the restaurant industry to evaluate new restaurant performance and return on capital we reinvest into our business. Cash-on-cash return is a supplemental measure of operating performance of our restaurants and our calculations thereof may not be comparable to those reported by other companies. Cash-on-cash return is neither required by, nor presented in accordance with, GAAP. Cash-on-cash return has limitations as an analytical tool, and you should not consider it in isolation or as a substitute for analysis of our results as reported under GAAP.
Adjusted EBITDA is defined as net income before interest, taxes and depreciation and amortization plus the sum of certain operating and non-operating expenses, including pre-opening costs, losses on modifications and extinguishment of debt, acquisition costs, equity-based compensation costs, management and consulting fees, retention agreement costs, IPO related costs, and other non-cash or similar adjustments. Adjusted EBITDA margin represents Adjusted EBITDA as a percentage of revenue. By monitoring and controlling our Adjusted EBITDA and Adjusted EBITDA margin, we can gauge the overall profitability of our company. Adjusted EBITDA as presented in this prospectus is a supplemental measure of our performance that is neither required by, nor presented in accordance with, GAAP. Adjusted EBITDA is not a measurement of our financial performance under GAAP and should not be considered as an alternative to net income (loss), operating income or any other performance measures derived in accordance with GAAP or as an alternative to cash flows from operating activities as a measure of our liquidity. In addition, in evaluating Adjusted EBITDA, you should be aware that in the future we will incur expenses or charges such as those added back to calculate Adjusted EBITDA. Our presentation of Adjusted EBITDA should not be construed as an inference that our future results will be unaffected by unusual or non-recurring items.
We believe Adjusted EBITDA facilitates operating performance comparisons from period to period by isolating the effects of some items that vary from period to period without any correlation to core operating performance or that vary widely among similar companies. These potential differences may be caused by variations in capital structures (affecting interest expense), tax positions (such as the impact on periods or companies of changes in effective tax rates or net operating losses) and the age and book depreciation of facilities and equipment (affecting relative depreciation expense). We also present Adjusted EBITDA because (i) we believe this measure is frequently used by securities analysts, investors and other interested parties to evaluate companies in our industry, (ii) we believe investors will find this measure useful in assessing our ability to service or incur indebtedness, and (iii) we use Adjusted EBITDA internally as a benchmark to compare our performance to that of our competitors.
iii
Table of Contents
Adjusted EBITDA has limitations as an analytical tool, and you should not consider it in isolation, or as a substitute for analysis of our results as reported under GAAP. Some of these limitations are (i) it does not reflect our cash expenditures, future requirements for capital expenditures or contractual commitments, (ii) it does not reflect changes in, or cash requirements for, our working capital needs, (iii) it does not reflect the significant interest expense, or the cash requirements necessary to service interest or principal payments, on our debt, (iv) although depreciation and amortization are non-cash charges, the assets being depreciated and amortized will often have to be replaced in the future, and Adjusted EBITDA does not reflect any cash requirements for such replacements, (v) it does not adjust for all non-cash income or expense items that are reflected in our statements of cash flows, (vi) it does not reflect the impact of earnings or charges resulting from matters we consider not to be indicative of our ongoing operations, and (vii) other companies in our industry may calculate this measure differently than we do, limiting its usefulness as a comparative measure.
We compensate for the limitations in our non-GAAP financial measures by providing specific information regarding the GAAP amounts excluded from such non-GAAP financial measure. We further compensate for the limitations in our use of such non-GAAP financial measure by presenting comparable GAAP measures more prominently.
Certain monetary amounts, percentages and other figures included in this prospectus have been subject to rounding adjustments. Percentage amounts included in this prospectus have not in all cases been calculated on the basis of such rounded figures but on the basis of such amounts prior to rounding. For this reason, percentage amounts in this prospectus may vary from those obtained by performing the same calculations using the figures in our consolidated financial statements. Certain other amounts that appear in this prospectus may not sum due to rounding.
Unless we specifically state otherwise, all dollar amounts listed in this prospectus are in US dollars.
We own or have rights to trademarks or trade names that we use in connection with the operation of our business, including our corporate names, logos and website names. This prospectus contains references to certain trademarks and brands. These include our original trademarks Fogo®, Fogo de Chão® and Bar Fogo®. We believe that we have full ownership rights to these brands. Solely for the convenience of the reader, we refer to these brands in this prospectus without the ™ or ® symbol, but we will assert, to the fullest extent under applicable law, our rights to our copyrights, trade names, trademarks and brands. Other trademarks, service marks or trade names referred to in this prospectus are the property of their respective owners.
iv
Table of Contents
This summary highlights some of the information contained elsewhere in this prospectus. This summary is not complete and does not contain all the information that you should consider before investing in our common stock. You should read the entire prospectus carefully, especially the risks of investing in our common stock discussed in the “Risk Factors” section of this prospectus and our consolidated financial statements and the related notes to those statements included elsewhere in this prospectus before making an investment decision to invest in our common stock.
Our Company
Fogo de Chão (fogo-dee-shoun) is a leading Brazilian steakhouse, or churrascaria, which has specialized for over 35 years in fire-roasting high-quality meats utilizing the centuries-old Southern Brazilian cooking technique of churrasco. We deliver a distinctive and authentic Brazilian dining experience through the combination of our high-quality Brazilian cuisine and our differentiated service model known as espeto corrido (Portuguese for “continuous service”) delivered by our gaucho chefs. We offer our guests a tasting menu of meats featuring up to 20 cuts, simply seasoned and carefully fire-roasted to expose their natural flavors.
Guests can begin their dining experience at the Market Table, which offers a wide variety of Brazilian-inspired side dishes, fresh-cut vegetables, seasonal salads, aged cheeses and cured meats, or they can receive immediate entrée service table-side from our gaucho chefs by turning a service medallion, found at each guest’s seat, green side up. Each gaucho chef rotates throughout the dining room, and is responsible for a specific cut of meat which they prepare, cook and serve to our guests continuously throughout their meal. Guests can pause the service at any time by turning the medallion to red and then back to green when they are ready to try additional selections and can communicate to our gauchos their preferred cut of meat, temperature and portion size. Our continuous service model allows customization and consumer engagement since our guests control the variety and quantity of their food and the pace of their dining experience. Through the combination of our authentic Brazilian cuisine, differentiated service model, prix fixe menu and engaging hospitality in an upscale restaurant atmosphere, we believe our brand delivers a differentiated dining experience relative to other specialty and fine-dining concepts and offers our guests a compelling value proposition.
Throughout our history, we have been recognized for our leading consumer appeal by both national and local media in the markets where we operate, including winning multiple “best of” restaurant awards from one of Brazil’s most prominent lifestyle publications, Veja Magazine, and numerous accolades in the United States, including awards from Nation’s Restaurant News, Zagat and Wine Spectator Magazine.
1
Table of Contents
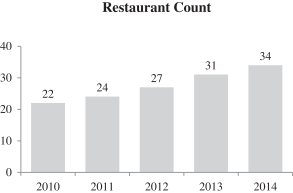
We opened our first restaurant in 1979 in Porto Alegre, Brazil. In 1986, we expanded to São Paulo, Brazil, a city in which we now operate five restaurants. Encouraged by our success in Brazil, we opened our first restaurant in the United States in 1997 in Addison, Texas, a suburb of Dallas, and have since expanded our footprint nationwide. We currently operate 26 restaurants in the United States, 10 in Brazil and one in Mexico, our first joint venture restaurant. From the 2010 to 2014 fiscal years, we grew our restaurant count by a compound annual growth rate (“CAGR”) of 11.5%.
|
|
We believe our dedication to serving high-quality Brazilian cuisine and our differentiated service model, combined with our disciplined focus on restaurant operations, have resulted in strong financial results illustrated by the following:
| • | In Fiscal 2014, we generated AUVs of approximately $8.0 million and a restaurant contribution margin of 32.5%, which we believe, based on an internal survey of our public competitors in the restaurant industry, are among the highest in the full-service dining category; |
| • | In Fiscal 2014, we opened three restaurants, increasing our restaurant base 9.7% from 31 restaurants in 2013 to 34 restaurants in 2014, and in the year-to-date Fiscal 2015 we have opened restaurants in San Juan, Puerto Rico and Rio de Janeiro, Brazil and our first joint venture restaurant in Mexico City, Mexico; and |
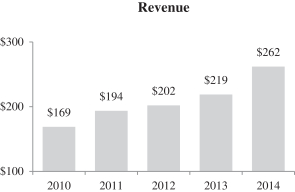
| • | From Fiscal 2013 to Fiscal 2014, revenue grew 19.6% to $262.3 million and our net income increased from a net loss of $0.9 million in Fiscal 2013 to net income of $17.6 million in Fiscal 2014. For the thirteen weeks ended March 29, 2015, revenue was $65.0 million and net income was $4.7 million, increases of 5.9% and 68.9%, respectively, as compared to the thirteen weeks ended March 30, 2014. In addition, from Fiscal 2013 to Fiscal 2014, restaurant contribution grew 23.9% to $85.1 million and Adjusted EBITDA grew 25.7% to $63.3 million, despite our investment of $4.2 million in additional fixed personnel costs during such period to develop key functional areas to support future growth. For the thirteen weeks ended March 29, 2015, restaurant contribution grew 13.6% to $20.5 million and Adjusted EBITDA grew 15.9% to $14.9 million as compared to the thirteen weeks ended March 30, 2014. For a reconciliation of Adjusted EBITDA and restaurant contribution, non-GAAP financial measures, to net income and revenue, respectively, see “Summary Consolidated Financial and Other Information.” |
2
Table of Contents
Our Competitive Strengths
We believe the following strengths differentiate us from our competitors and serve as the foundation for our continued growth:
Authentic Cuisine – A Culinary Journey to Brazil
We provide our guests with an experience that is distinctly Brazilian, and our food is at the heart of that experience. Our traditional Brazilian cuisine has been passed down from generation to generation in Brazil and lives on in the way our gaucho chefs prepare, season and continuously fire-roast our meats utilizing the traditional cooking method of churrasco – fire-roasted on skewers over an open flame to expose the natural flavors. Our entrée selection features a variety of carefully cooked and seasoned meats including Brazilian style cuts of beef such as the fraldinha and the picanha, our signature cut of steak, as well as other premium beef cuts such as filet mignon and rib eye, and lamb, chicken, pork and seafood items. Each cut is carved table-side by our gaucho chefs in a manner designed to both enhance the tenderness of each slice and meet our guests’ desired portion size and temperature. At Fogo de Chão, every table is a chef’s table. To complement our meat selection, a variety of sharable side dishes, including warm cheese bread, fried bananas and crispy polenta, are brought to each table and replenished throughout the meal. For guests preferring lighter fare, we also offer Brazilian-inspired à la carte seafood options, a “Market Table” only option and a selection of small plates. Our Market Table, which features a variety of gourmet side dishes, seasonal salads, Brazilian hearts of palm, fresh-cut vegetables, aged cheeses, smoked salmon and cured meats is immediately available once our guests are seated. We believe it pays homage to the kitchen tables of Southern Brazil where families share fresh produce and seasonal salads grown locally. Our menu is enhanced by an award-winning wine list and a full bar complete with a selection of signature Brazilian drinks such as the caipirinha.
Interactive, Approachable Fine-Dining Experience Delivered By Our Gaucho Chefs
We believe that we offer our guests an upscale, approachable and friendly atmosphere in elegant dining rooms that is complemented by the personalized, interactive experience with our gaucho chefs and team members. Skilled artisans trained in the centuries-old Southern Brazilian cooking tradition of churrasco and the culture and heritage of Southern Brazil, the home of churrasco, our gaucho chefs are central to our ability to maintain consistency and authenticity throughout our restaurants in Brazil and the United States. Due to our significant operations in Brazil, we are able to place many of our native Brazilian gaucho chefs in restaurants in the United States, which we believe preserves the distinctly Brazilian attributes of our brand. Our team members focus on anticipating guests’ needs and helping guests navigate our unique dining experience for a memorable visit.
Our gaucho chefs butcher, prepare, cook and serve our premium meats to each guest, as well as engage and interact with them. We utilize a continuous style of service, where each of our gaucho chefs approaches guests at their table with various selections of meat, providing our guests with the cut, temperature and quantity they desire. During these interactions, our gaucho chefs learn each guest’s specific preferences and are able to tailor their dining experience accordingly. In addition to providing an entertaining and engaging experience, our continuous service allows our guests to control the entrée variety, portions and pace of their meal, which we believe maximizes the customization of their experience and the satisfaction they receive from dining at our restaurants.
Award-Winning Concept with a Compelling Value Proposition and Broad Appeal
We believe that the combination of our high-quality Brazilian cuisine, differentiated dining experience and the competitive price point of our prix fixe menu leads our restaurants to appeal to a wide range of demographic, including both men and women, and socioeconomic groups. We believe our restaurants provide a preferred venue for various dining occasions, including intimate gatherings, family get-togethers, business functions, convention banquets and other celebrations. A majority of our guests dine at our restaurants multiple times per year. In Fiscal 2014, our average per-person spend was $59, which we estimate is approximately three-quarters of that of the traditional high-end steakhouse category.
3
Table of Contents
Our restaurants have received numerous awards and accolades from critics and reviewers in the United States and Brazil. For example, we have been nationally recognized by Nation’s Restaurant News, Zagat and Wine Spectator Magazine, and we have received awards from local media in the markets we operate, including Atlanta Magazine, Chicago Tribune, Dallas Observer and Houston Business Journal. Additionally, our restaurants are consistently included among the top upscale dining options by reputable online reviewers such as Yelp and Urban Spoon. We believe that the authenticity of our brand is demonstrated by the fact that we have received multiple “best of” restaurant awards from Veja Magazine.
Unique Operating Model Drives Industry-Leading Restaurant-Level Profitability
Through the consistent execution of our unique business model, we are able to produce what we believe is industry-leading restaurant-level profitability by optimizing labor and food costs. For Fiscal 2014, the sum of our food and beverage costs and compensation and benefits costs (or “prime costs”) as a percentage of revenue were 50.7%, which we believe, based on an internal survey of our public competitors in the full-service dining category, is approximately 750 basis points lower than the average within the full-service restaurant industry in the United States. Our favorable performance on the largest components of a restaurant’s cost structure, which drives our restaurant contribution margins, is due to the following unique structural characteristics of our operational model:
| • | The dual role our gaucho chefs play as both chef and server significantly reduces back-of-the-house labor costs; |
| • | Simple cooking technique and streamlined food offering, combined with table-side service and plating, allow for efficient kitchen and server operations, reducing labor costs; |
| • | Our gaucho chefs work as a team with cross-functional roles and responsibilities, increasing productivity, speed of service and guest satisfaction, while reducing labor costs; |
| • | Simple, space-efficient cooking technique and streamlined menu reduces our kitchen’s footprint and maximizes space devoted to front-of-the-house tables, which allows our restaurants to achieve higher sales per square foot and enables us to leverage our fixed costs such as occupancy; |
| • | Our self-service Market Table requires minimal staffing and kitchen preparation, thereby reducing labor costs, and provides us flexibility in the range of items we offer, which helps us manage food costs through seasons and market cycles; |
| • | In-house butchering by our highly skilled gaucho chefs maximizes the yield on our meat cuts, thereby reducing food costs; and |
| • | Our wide variety of proteins offered provides us flexibility in sourcing our meat selection, which help us optimize food costs. |
Industry-Leading Cash-on-Cash Returns Create New Restaurant Growth Opportunity
Our business model produces attractive unit volumes and restaurant contribution margins that drive what we believe are industry-leading cash-on-cash returns, based on an internal survey of our public competitors in the restaurant industry. For Fiscal 2014, we generated AUVs of approximately $8.0 million and a restaurant contribution margin of 32.5%. Since 2007, our new restaurants that have been open at least three years as of December 28, 2014, have generated an average year three cash-on-cash return of greater than 50%. We calculate our year three cash-on-cash return by dividing our restaurant contribution in the third year of operation by our initial investment costs (net of pre-opening costs and tenant allowances). Our restaurants perform well across a diverse range of geographic regions, population densities and real estate settings, which we believe demonstrates the portability of our concept to new markets. We believe the combination of our strong cash-on-cash returns, proven concept portability, and footprint of only 37 restaurants, including our first joint venture restaurant, supports further use of cash flow to grow our restaurant base and creates an attractive new restaurant growth opportunity.
4
Table of Contents
Highly Attractive Concept for Domestic and International Real Estate Developers Supports Growth
Due to the broad appeal of our brand, the diversity of our guest base and the relatively high number of weekly visits to our restaurants, our concept is a preferred tenant for real estate developers. Landlords and developers, both in the United States and internationally, seek out our restaurants to be anchors for their developments as they are highly complementary to national retailers. Our restaurants that opened prior to Fiscal 2014 have attracted, on average, approximately 137,000 guests per restaurant in Fiscal 2014, which we believe, based on an internal survey of our public fine-dining competitors, is approximately 60% more guests per restaurant than those competitors. Our ability to achieve AUVs that are comparable to those of other high-end steakhouses despite our lower average check demonstrates our capacity to attract more guests than many of our competitors. Our AUVs, brand recognition and relatively high guest traffic position us well to negotiate the prime location within a development and favorable lease terms, which enhance our return on invested capital.
We believe our concept has international appeal and makes us an attractive tenant for international real estate developers, and we believe we will be able to leverage our brand strength to negotiate attractive terms in desirable locations as we grow outside the United States and Brazil.
Experienced Leadership
Our senior management team has extensive operating experience with an average of over 26 years of experience in the restaurant industry. We are led by our CEO, Larry Johnson. Mr. Johnson first began working with Fogo de Chão in 1996 as Corporate Counsel. In 2007, Mr. Johnson joined us as CEO and has guided the growth of our company from 11 restaurants in 2007 to 37 restaurants as of the date of this prospectus. Under his leadership, our business has consistently achieved growth in revenue and Adjusted EBITDA year-over-year. Mr. Johnson leads a team of dedicated, experienced restaurant professionals including Barry McGowan, our President, Tony Laday, our CFO, and Selma Oliveira, our COO. Mrs. Oliveira, who was born in Brazil, joined us to help start our operations in the United States in 1996. Our senior management team is focused on executing our business plan and implementing our growth strategy, and we believe they are a key driver of our success and have positioned us well for long-term growth.
Our Growth Strategies
We plan to continue to expand our restaurant footprint and drive revenue growth, improve margins and enhance our competitive positioning by executing on the following strategies:
Grow Our Restaurant Base
We believe we are in the early stages of our growth with 37 current restaurants, 26 in the United States, 10 in Brazil and one in Mexico, our first joint venture restaurant. Based on internal analysis and a study prepared by Buxton, we believe there exists long-term potential for over 100 new domestic sites and additional new restaurants internationally, due to the broad appeal of our differentiated concept, industry leading cash-on-cash returns, flexible real estate strategy and successful history of opening new restaurants. We have a long track record of successful new restaurant development, evidenced by having grown our restaurant count by a multiple of 10 since 2000 and at a 11.5% CAGR since 2010. Since 2007, our new restaurants that have been open at least three years have generated an average year three cash-on-cash return of greater than 50%. We calculate our year three cash-on-cash return by dividing our restaurant contribution in the third year of operation by our initial investment costs (net of pre-opening costs and tenant allowances). We believe our concept has proven portability, with strong AUVs and cash-on-cash returns across a diverse range of geographic regions, population densities and real estate settings.
We will continue to pursue a disciplined new restaurant growth strategy primarily in the United States in both new and existing markets where we believe we are capable of achieving sales volumes and restaurant contribution margins that generate attractive cash-on-cash returns. We plan to open five to six restaurants during Fiscal 2015, which includes our first joint venture restaurant in Mexico City, which opened in May 2015. Over the next five years, we plan to increase our company-owned restaurant count by at least 10% annually, with North America being our primary market for new restaurant development. In addition, we plan to grow in other international markets.
5
Table of Contents
| • | Open New Restaurants in the United States. We believe the United States can support a considerable number of additional Fogo de Chão restaurants and will continue to be our primary market for new restaurant development. Based on internal analysis and a study prepared by Buxton, we estimate that there exists long-term potential for over 100 new domestic sites across large- and mid-sized markets as well as urban and suburban locations that can support Fogo de Chão restaurants. |
| • | Open New Restaurants in Brazil. Based on analysis performed by our development team, we believe there is an opportunity to open additional restaurants in Brazil, the birthplace of Fogo de Chão. Over the next five years, we plan to open three to five new restaurants throughout the country as attractive real estate locations become available. In addition to providing strong returns on invested capital, our operations in Brazil allow us to maintain our authentic and distinctive churrasco heritage and support the global growth of our brand. |
| • | Open New Restaurants in Other International Markets. We will selectively consider other international markets, as we believe attractive opportunities for opening new restaurants exist in large cities and business centers in certain international markets including Asia, Australia, Canada, Europe, the Middle East and South America. We will pursue growth in these markets through a combination of company-owned restaurant development and joint ventures, which we believe allow us to expand our brand with limited capital investment by us. In May 2015, we opened our first joint venture restaurant in Mexico City. |
Our current restaurant investment model targets an average cash investment of $4.5 million per restaurant, net of tenant allowances and pre-opening costs, assuming an average restaurant size of approximately 8,500 square feet, an AUV of $7.0 million and a cash-on-cash return in excess of 40% by the end of the third full year of operation. On average, our new company-owned restaurants opened since the beginning of 2007 have exceeded these AUV and cash-on-cash return targets within the third year of operation.
Grow Our Comparable Restaurant Sales
We believe the following strategies will allow us to grow our comparable restaurant sales:
| • | Food and Beverage Innovation. We seek to introduce innovative items that we believe align with evolving consumer preferences and broaden our appeal, and we will continue to explore ways to increase the number of occasions for guests to visit our restaurants. In order to drive guest frequency and broaden the appeal of our menu, we recently added seafood items and on-trend seasonal food and beverage offerings. Additionally, we believe there are significant day-part opportunities with our recently launched Bar Fogo, a “small plates” menu served at the bar, which we launched in April 2014, happy hour and special occasion menus. |
| • | Increase Our Per Person Average Spend. We believe there are opportunities to drive comparable restaurant sales growth through incremental food and beverage sales. For example, in February 2014 we launched our Malagueta Shrimp Cocktail, which guests can order in addition to our traditional prix fixe menu. Through Bar Fogo, we plan to generate incremental food sales as well as increase our alcohol sales by improving our guest experience in our bar. In Fiscal 2014, our alcohol mix was 16.7% of sales, which we believe is below that of our fine-dining peers. In addition to our Bar Fogo initiative, we believe we can increase our alcohol sales through our recently improved wine-by-the-glass program and the introduction of new Brazilian-inspired cocktails to our beverage menu. Finally, we believe the continued rollout of happy hour and special occasion menus will also increase our per person average spend. |
| • | Further Grow Our Large Group Dining Sales. We believe our differentiated dining experience, open restaurant layout, speed of service and compelling value proposition make us a preferred destination for group dining occasions of all types. For Fiscal 2014, large group sales represented 12.0% of US revenue, and we believe there is a significant opportunity to grow that aspect of our business. We have added group sales managers at most restaurants and introduced large group reception and meeting packages, which have generated significant momentum in group sales growth. In Fiscal 2014, we generated large group sales growth of 12.8% for our comparable restaurants over the prior year period, |
6
Table of Contents
| and we believe the investments we have made in our group sales business will continue to yield positive results. |
| • | Continue to Improve Our Marketing to Drive Traffic. We will continue to invest in marketing and advertising to drive guest trial and frequency. We continue to introduce new marketing initiatives through various channels, including social, online, print, digital advertising, TV and radio media, with the intent to promote brand awareness. We will continue to harness word of mouth and grow our social media and e-mail marketing fan base through thoughtful planning, unique promotions and rich content that reward loyalty and increase guest engagement with our brand. We intend to drive repeat traffic by becoming our guests’ preferred upscale restaurant destination and believe targeted marketing investments that heighten awareness, reinforce the premium image of our brand and highlight the authenticity of our dining experience will continue to generate guest loyalty and promote brand advocacy. |
| • | Opportunistically Remodel Select Restaurants. Beginning in 2015, we plan to launch an opportunistic remodel program with the target of remodeling three to four restaurants during the 2015 fiscal year. We believe our new design will enhance the guest experience, highlight our brand attributes and encourage guest trial and frequency. We also believe there are opportunities to optimize restaurant capacity and merchandising to maximize sales per square foot. |
Improve Margins by Leveraging Our Infrastructure and Investments in Human Capital
To support our future growth and improve our operations and management team, over the last three years we have invested over $5 million in incremental annual personnel costs by adding 18 positions to our corporate team and adding 16 local sales manager positions and five assistant manager positions at the restaurant level. These hires have bolstered key functional areas and supported future growth initiatives including senior leadership, new restaurant site selection and analysis, new restaurant design, group dining, product innovation and in-restaurant employee training. In addition, we have implemented initiatives in our restaurants to improve labor productivity, which we believe will further enhance restaurant profitability and the guest experience. As evidenced by our improvement in both comparable restaurant sales growth and restaurant contribution in 2014, these investments and initiatives have yielded positive results and we believe we will continue to benefit from these investments as we grow our business in the long-term. Furthermore, we expect our general and administrative expenses to decrease as a percentage of total revenue over time as we are able to leverage these investments by growing revenue faster than our fixed cost base. In addition, we have made substantial investments in our IT systems, and we expect to utilize our IT infrastructure for continued improvements in operational efficiency and margins through the use of labor productivity and training tools.
Our Sponsor
Thomas H. Lee Partners, L.P. (“THL”) is one of the world’s oldest and most experienced private equity firms. Founded in 1974, THL has raised approximately $20 billion of equity capital and invested in more than 100 portfolio companies with an aggregate value of over $150 billion. THL invests in growth-oriented businesses, headquartered primarily in North America, across three sectors: Business & Financial Services, Consumer & Healthcare, and Media & Information Services. The firm partners with portfolio company management to identify and implement operational and strategic improvements for long-term growth.
As of the date of this prospectus, the THL Funds own approximately 96% of our common stock. Upon completion of this offering and assuming no exercise of the underwriters’ option to purchase additional shares, the THL Funds will continue to beneficially own approximately 82% of our outstanding common stock (or 80% if the underwriters’ option to purchase additional shares is exercised in full). As a result, we expect to be a “controlled company” within the meaning of the corporate governance standards of the NASDAQ on which we have applied for our shares to be listed. See “Risk Factors—Risks Related to this Offering and Ownership of Our Common Stock—We will be a “controlled company” within the meaning of the NASDAQ rules and, as a result, will be exempt from certain corporate governance requirements.”
7
Table of Contents
The THL Funds engage in a range of investing activities, including investments in restaurants and other consumer-related companies in particular that could directly or indirectly compete with us. In the ordinary course of its business activities, the THL Funds may engage in activities where its interests conflict with our interests or those of our stockholders. See “Following this offering, the THL Funds will continue to have a substantial ownership interest in our common stock. Conflicts of interest may arise because some of our directors are principals of the THL Funds.”
Our Corporate Information
Fogo de Chão, Inc. was incorporated as a Delaware corporation as Brasa (Parent) Inc. on May 24, 2012 in connection with the Acquisition. On December 17, 2014 we changed our corporate name from Brasa (Parent) Inc. to Fogo de Chão, Inc. Our principal executive offices are located at 14881 Quorum Drive, Suite 750, Dallas, Texas 75254. Our telephone number is (972) 960 9533. The address of our website is www.fogodechao.com. The information contained on, or accessible through, our website is not incorporated in, and shall not be part of, this prospectus.
Concurrent Refinancing Transaction
Concurrently with, and conditioned upon, the consummation of our initial public offering, we intend to refinance our existing Senior Credit Facilities and enter into a new $250.0 million revolving credit facility (the “New Credit Facility”). We expect that the loans under our New Credit Facility will bear interest at a base rate plus a margin ranging from 0.50% to 1.50% or at LIBOR plus a margin ranging from 1.50% to 2.50% and will mature in 2020. We expect that the New Credit Facility will contain customary affirmative, negative and financial covenants applicable to us and certain of our subsidiaries, including financial maintenance covenants requiring us to maintain a maximum Total Rent Adjusted Leverage Ratio and a minimum Interest Coverage Ratio (each as defined in the New Credit Facility). Borrowings under the New Credit Facility may vary significantly from time to time depending on our cash needs at any given time, and upon consummation of our initial public offering we expect that approximately $188.9 million will be drawn under our New Credit Facility. See “Use of Proceeds” and “Management’s Discussion and Analysis of Financial Condition and Results of Operations—Liquidity and Capital Resources—Credit Facilities.”
8
Table of Contents
The Offering
| Issuer |
Fogo de Chão, Inc. | |
| Common stock offered by Fogo de Chão, Inc. |
4,411,764 shares (or 5,073,528 shares if the underwriters exercise their option to purchase additional shares in full). | |
| Option to purchase additional shares |
We have granted the underwriters an option for a period of 30 days to purchase up to 661,764 additional shares of common stock from us. | |
| Common stock outstanding immediately after this offering |
27,253,018 shares (or 27,914,782 shares if the underwriters exercise their option to purchase additional shares in full). | |
| Principal stockholders |
Upon completion of this offering, the THL Funds will continue to beneficially own a controlling interest in us. As a result, we intend to avail ourselves of the controlled company exemption under the corporate governance rules of the NASDAQ. See “Management—Board Composition.” | |
| Voting rights |
Holders of our common stock are entitled to one vote for each share held of record on all matters submitted to a vote of stockholders. | |
| Dividend policy |
We currently intend to retain all of our earnings for the foreseeable future to fund the operation and growth of our business and to repay indebtedness, and therefore, we do not anticipate paying any cash dividends in the foreseeable future. Any future determination to declare and pay cash dividends will be at the discretion of our board of directors and will depend on, among other things, our financial condition, results of operations, cash requirements, liquidity, contractual restrictions, general business conditions and such other factors as our board of directors deems relevant. In addition, our Senior Credit Facilities (as defined below) restrict, and our New Credit Facility will restrict, our ability to pay dividends. For additional information, see “Dividend Policy.” | |
9
Table of Contents
| Use of proceeds |
We estimate that the net proceeds to us from this offering will be approximately $66.9 million, or $77.4 million if the underwriters exercise their option to purchase additional shares in full, based upon an assumed initial public offering price of $17.00 per share of common stock, the midpoint of the price range on the cover of this prospectus, and after deducting the estimated underwriting discounts and commissions and estimated offering expenses payable by us.
We intend to use the net proceeds of this offering, together with borrowings under our New Credit Facility, to repay the outstanding indebtedness under our Senior Credit Facilities and to pay fees and expenses related to our initial public offering and the refinancing of our Senior Credit Facilities. See “Use of Proceeds.” | |
| Conflicts of Interest |
A portion of the proceeds from this offering will be used to repay the outstanding indebtedness under our Senior Credit Facilities. Because affiliates of Credit Suisse Securities (USA) LLC and Wells Fargo Securities, LLC are lenders under our First Lien Credit Facility and each will receive 5% or more of the net proceeds of this offering, Credit Suisse Securities (USA) LLC and Wells Fargo Securities, LLC are each deemed to have a “conflict of interest” under Rule 5121 of the Financial Industry Regulatory Authority, Inc., or FINRA. As a result, this offering will be conducted in accordance with FINRA Rule 5121. Pursuant to that rule, the appointment of a “qualified independent underwriter” is not required in connection with this offering as the members primarily responsible for managing the public offering do not have a conflict of interest, are not affiliates of any member that has a conflict of interest and meet the requirements of paragraph (f)(12)(E) of FINRA Rule 5121. See “Use of Proceeds” and “Underwriting (Conflicts of Interest).” | |
| Risk factors |
Investment in our common stock involves substantial risks. Please read this prospectus carefully, including the section entitled “Risk Factors” and the consolidated financial statements and the related notes to those statements included elsewhere in this prospectus before deciding to invest in our common stock. | |
10
Table of Contents
| Directed share program |
The underwriters have reserved for sale, at the initial public offering price, up to 5% of the shares of our common stock being offered for sale to our directors, officers, certain employees and certain other persons associated with us. The number of shares of common stock available for sale to the general public in this offering will be reduced to the extent these persons purchased reserved shares. Any reserved shares not purchased will be offered by the underwriters to the general public on the same terms as the other shares. See “Underwriting (Conflicts of Interest).” | |
| Expected NASDAQ Global Select Market symbol |
“FOGO” | |
The number of shares of our common stock to be issued and outstanding after the completion of this offering is based on 22,841,254 shares of our common stock issued and outstanding as of May 1, 2015. Unless otherwise indicated, information in this prospectus:
| • | assumes an initial public offering price of $17.00 per share of common stock, the midpoint of the price range on the cover of this prospectus; |
| • | assumes no exercise by the underwriters of their option to purchase up to an additional 661,764 shares of our common stock; |
| • | except in our historical financial statements included in this prospectus, gives effect to the consummation of a stock split effected upon the closing of this offering pursuant to which each share held by the holder of common stock will be reclassified into 25.4588 shares; |
| • | does not reflect (1) 783,590 shares of our common stock issuable upon exercise of stock options that will vest upon the consummation of this offering under our 2012 Plan (as defined herein) at a weighted average exercise price of $10.01, (2) 20,160 shares of our common stock issuable upon exercise of vested stock options outstanding as of May 1, 2015 under our 2012 Plan at a weighted average exercise price of $8.68, (3) 1,393,632 shares of our common stock underlying unvested stock options outstanding as of May 1, 2015 at a weighted average exercise price of $10.25 under our 2012 plan and (4) 317,799 shares of our common stock underlying other stock awards outstanding as of May 1, 2015 under our 2012 Plan; and |
| • | does not reflect an additional 1,200,000 shares of our common stock reserved for future grant under our 2015 Plan (as defined herein) which we expect to adopt in connection with this offering, including 138,000 shares of our common stock issuable upon the exercise of stock options we expect to grant to employees upon the closing of this offering at an exercise price per share equal to the initial public offering price. |
11
Table of Contents
Summary Consolidated Financial and Other Information
The following tables present summary consolidated financial information of the Company (Successor) as of March 29, 2015 and for the thirteen week periods ended March 29, 2015 and March 30, 2014, for the fiscal years ended December 28, 2014 and December 29, 2013 and for the period from May 24, 2012 to December 30, 2012 and summary historical consolidated financial information of Fogo de Chão Churrascaria (Holdings) LLC (Predecessor) and subsidiaries for the period from January 2, 2012 to July 20, 2012.
The summary historical consolidated statements of operations and cash flow data for the fiscal years ended December 28, 2014 and December 29, 2013 and for the periods May 24, 2012 (Inception) to December 30, 2012 (Successor) and January 2, 2012 to July 20, 2012 (Predecessor) have been derived from our audited consolidated financial statements included elsewhere in this prospectus. The summary historical consolidated statements of operations and cash flow data for the thirteen week periods ended March 29, 2015 and March 30, 2014 and the summary historical consolidated balance sheet data as of March 29, 2015 have been derived from our unaudited interim condensed consolidated financial statements included elsewhere in this prospectus. Historical results for any prior period are not necessarily indicative of results that may be expected in any future period, and results for any interim period are not necessarily indicative of results that may be expected for the entire year.
The following tables also set forth certain summary unaudited consolidated pro forma financial information as of and for the thirteen week period ended March 29, 2015 and for the fiscal year ended December 28, 2014, giving effect to (i) the consummation of a stock split effected upon the closing of this offering pursuant to which each share held by the holder of common stock will be reclassified into 25.4588 shares, (ii) the consummation of our initial public offering, assuming the issuance and sale by us of 4,411,764 shares of our common stock, assuming an initial public offering price of $17.00 per share, the midpoint of the price range on the cover of this prospectus, and after deducting estimated offering expenses and estimated underwriting discounts and commissions payable by us, (iii) the consummation of the refinancing of our existing Senior Credit Facilities and entry into, and effectiveness of, our New Credit Facility, (iv) the application of the net proceeds from our initial public offering and borrowings under our New Credit Facility as set forth under “Use of Proceeds” and (v) the termination of the advisory services agreement between us and an affiliate of THL and the one-time termination fee paid by us upon the consummation of this offering as set forth under the section “Unaudited Pro Forma Consolidated Financial Statements.” The summary consolidated pro forma financial information is presented for informational purposes only and does not purport to represent what our financial condition or results of operations actually would have been had the referenced events occurred on the dates indicated or to project our financial condition or results of operations as of any future date or for any future period. For additional information, see “Unaudited Pro Forma Consolidated Financial Statements.”
The Successor was incorporated under the name Brasa (Parent) Inc. on May 24, 2012 in connection with the Acquisition on July 21, 2012 of Fogo de Chão Churrascaria (Holdings) LLC, a Delaware limited liability company, and its parent company, FC Holdings Inc., a Cayman Islands exempt company, by a collaborative group consisting of the THL Funds. The Successor owns 100% of Brasa Purchaser, which owns 100% of Brasa Holdings. Brasa Holdings owns 100% of Fogo Holdings, which owns our domestic and foreign operating subsidiaries.
The Successor, Brasa Purchaser, Brasa Holdings, Brasa Merger Sub Inc. and Fogo de Chão (Holdings) Inc. were formed during 2012 for the purpose of effecting the Acquisition, which was consummated on July 21, 2012. As a result of the Acquisition, the financial information for all periods after May 24, 2012 represent the financial information of the “Successor” company. Prior to, and including, July 20, 2012, the consolidated financial statements include the accounts of the Predecessor. Financial information in the Predecessor period principally relates to Fogo de Chão Churrascaria (Holdings) LLC and its subsidiaries. From May 24, 2012 to July 20, 2012, Successor had no activities other than the incurrence of transaction costs related to the Acquisition.
For purposes of presenting a comparison of our Fiscal 2014 and Fiscal 2013 results to our Fiscal 2012 results, in addition to standalone results for the Successor for the period of May 24, 2012 (Inception) to December 30, 2012 and for the Predecessor for the period of January 2, 2012 to July 20, 2012, we have also
12
Table of Contents
presented summary historical consolidated financial information on a combined basis as the mathematical addition of the Predecessor and Successor periods. We believe that the presentation with mathematical addition provides meaningful information about our results of operations on a period to period basis. This approach is not consistent with GAAP, may yield results that are not strictly comparable on a period to period basis and may not reflect the actual results we would have achieved.
The data set forth in the following table should be read together with the sections of this prospectus entitled “Use of Proceeds,” “Capitalization,” “Selected Historical Consolidated Financial Information,” “Management’s Discussion and Analysis of Financial Condition and Results of Operations” and “Business” and in our consolidated financial statements and the related notes to those statements included elsewhere in this prospectus.
| Combined | Successor | Predecessor | ||||||||||||||||||||||||||||
| Period from January 2 to December 30, 2012 |
Period from (Inception) to |
Period from January 2 to July 20, 2012 |
||||||||||||||||||||||||||||
| Thirteen Week Periods Ended | Fiscal Year Ended | |||||||||||||||||||||||||||||
| (dollars in thousands, except for per share data) |
March 29, 2015 |
March 30, 2014 |
December 28, 2014 |
December 29, 2013 |
||||||||||||||||||||||||||
| Statement of Operations Data |
||||||||||||||||||||||||||||||
| Revenue |
$ | 64,959 | $ | 61,317 | $ | 262,280 | $ | 219,239 | $ | 202,360 | $ | 93,844 | $ | 108,516 | ||||||||||||||||
| Restaurant operating costs: |
||||||||||||||||||||||||||||||
| Food and beverage costs |
19,164 | 18,547 | 78,330 | 67,002 | 63,893 | 29,381 | 34,512 | |||||||||||||||||||||||
| Compensation and benefit costs |
14,100 | 13,891 | 54,673 | 46,860 | 43,473 | 21,125 | 22,348 | |||||||||||||||||||||||
| Occupancy and other operating expenses (excluding depreciation and amortization) |
11,174 | 10,820 | 44,156 | 36,703 | 33,539 | 15,478 | 18,061 | |||||||||||||||||||||||
| Total restaurant operating costs |
44,438 | 43,258 | 177,159 | 150,565 | 140,905 | 65,984 | 74,921 | |||||||||||||||||||||||
| Marketing and advertising costs |
1,402 | 1,442 | 5,585 | 6,188 | 4,830 | 2,342 | 2,488 | |||||||||||||||||||||||
| General and administrative costs |
5,708 | 4,668 | 21,419 | 18,239 | 18,372 | 8,143 | 10,229 | |||||||||||||||||||||||
| Pre-opening costs |
1,003 | 788 | 1,951 | 4,764 | 2,478 | 1,119 | 1,359 | |||||||||||||||||||||||
| Acquisition costs |
— | — | — | — | 18,951 | 11,988 | 6,963 | |||||||||||||||||||||||
| Loss on modification/extinguishment of debt |
— | — | 3,090 | 6,875 | 7,762 | — | 7,762 | |||||||||||||||||||||||
| Depreciation and amortization and other |
2,891 | 2,668 | 11,684 | 8,618 | 8,524 | 3,567 | 4,957 | |||||||||||||||||||||||
| Total costs and expenses |
55,442 | 52,824 | 220,888 | 195,249 | 201,822 | 93,143 | 108,679 | |||||||||||||||||||||||
| Income (loss) from operations |
9,517 | 8,493 | 41,392 | 23,990 | 538 | 701 | (163 | ) | ||||||||||||||||||||||
| Other expense: |
||||||||||||||||||||||||||||||
| Interest expense, net |
(3,757 | ) | (4,762 | ) | (17,121 | ) | (22,354 | ) | (18,267 | ) | (10,908 | ) | (7,359 | ) | ||||||||||||||||
| Other expenses |
(2 | ) | (4 | ) | (7 | ) | (101 | ) | (88 | ) | (20 | ) | (68 | ) | ||||||||||||||||
| Income (loss) before income taxes |
5,758 | 3,727 | 24,264 | 1,535 | (17,817 | ) | (10,227 | ) | (7,590 | ) | ||||||||||||||||||||
| Income tax expense (benefit) |
1,252 | 965 | 6,991 | 2,472 | 99 | (1,195 | ) | 1,294 | ||||||||||||||||||||||
| Net income (loss) |
4,506 | 2,762 | 17,273 | (937 | ) | (17,916 | ) | (9,032 | ) | (8,884 | ) | |||||||||||||||||||
| Less: Loss attributable to noncontrolling interests |
(159 | ) | — | (282 | ) | — | — | — | — | |||||||||||||||||||||
| Net income (loss) attributable to Fogo de Chão, Inc. |
$ | 4,665 | $ | 2,762 | $ | 17,555 | $ | (937 | ) | $ | (17,916 | ) | $ | (9,032 | ) | $ | (8,884 | ) | ||||||||||||
| Historical Earnings (Loss) Per Share Data(1): |
||||||||||||||||||||||||||||||
| Earnings (loss) per common share |
||||||||||||||||||||||||||||||
| Basic |
$ | 5.20 | $ | 3.10 | $ | 19.69 | $ | (1.06 | ) | * | $ | (10.21 | ) | * | ||||||||||||||||
| Diluted |
$ | 5.14 | $ | 3.06 | $ | 19.42 | $ | (1.06 | ) | * | $ | (10.21 | ) | * | ||||||||||||||||
| Weighted average common shares outstanding: |
||||||||||||||||||||||||||||||
| Basic |
896,679 | 890,439 | 891,523 | 885,940 | * | 884,850 | * | |||||||||||||||||||||||
| Diluted |
907,074 | 902,505 | 904,067 | 885,940 | * | 884,850 | * | |||||||||||||||||||||||
| Pro Forma Earnings Per Share Data(1): |
||||||||||||||||||||||||||||||
| Pro Forma Net Income |
$ | 6,507 | $ | 25,929 | ||||||||||||||||||||||||||
| Pro Forma earnings per common share: |
||||||||||||||||||||||||||||||
| Basic |
$ | 0.24 | $ | 0.96 | ||||||||||||||||||||||||||
| Diluted |
$ | 0.24 | $ | 0.95 | ||||||||||||||||||||||||||
| Pro Forma weighted average common shares outstanding: |
||||||||||||||||||||||||||||||
| Basic |
27,240,177 | 27,108,911 | ||||||||||||||||||||||||||||
| Diluted |
27,504,822 | 27,428,267 | ||||||||||||||||||||||||||||
| * | Not applicable. |
| (1) | Historical share and per share information does not give effect to the consummation of the stock split to be effected upon the closing of this offering. |
13
Table of Contents
| As of March 29, 2015 | ||||||||
| (dollars in thousands) | Actual | Pro Forma(1) | ||||||
| Consolidated Balance Sheet Data |
||||||||
| Cash and cash equivalents |
$ | 17,304 | $ | 17,304 | ||||
| Total assets |
460,098 | 459,986 | ||||||
| Total debt |
242,758 | 188,884 | ||||||
| Total equity |
145,896 | 203,907 | ||||||
| Combined | ||||||||||||||||||||
| Thirteen Week Periods Ended | Fiscal Year Ended | Period
from |
||||||||||||||||||
| (dollars in thousands) | March 29, 2015 |
March 30, 2014 |
December 28, 2014 |
December 29, 2013 |
||||||||||||||||
| Other Operating and Financial Data |
||||||||||||||||||||
| Number of total restaurants at end of period |
35 | 32 | 34 | 31 | 27 | |||||||||||||||
| Number of comparable restaurants at end of period |
27 | 25 | 27 | 25 | 22 | |||||||||||||||
| Comparable restaurant sales growth:(3) |
||||||||||||||||||||
| United States |
0.1 | % | (0.4 | )% | 2.9 | % | 1.4 | % | (1.1 | %) | ||||||||||
| Brazil |
2.3 | % | 0.8 | % | 11.4 | % | 1.1 | % | (2.1 | %) | ||||||||||
| System-wide(4) |
0.5 | % | (0.2 | )% | 4.9 | % | 1.3 | % | (1.3 | %) | ||||||||||
| Average unit volumes |
* | * | $ | 8,031 | $ | 7,931 | $ | 8,059 | ||||||||||||
| Restaurant contribution(5) |
$ | 20,521 | $ | 18,059 | $ | 85,121 | $ | 68,674 | $ | 61,455 | ||||||||||
| Restaurant contribution margin(5) |
31.6 | % | 29.5 | % | 32.5 | % | 31.3 | % | 30.4 | % | ||||||||||
| Adjusted EBITDA(6) |
$ | 14,938 | $ | 12,888 | $ | 63,319 | $ | 50,363 | $ | 49,244 | ||||||||||
| Adjusted EBITDA margin(6) |
23.0 | % | 21.0 | % | 24.1 | % | 23.0 | % | 24.3 | % | ||||||||||
| * | Not meaningful because management analyzes average unit volumes on a fiscal period basis. |
| (1) | Pro forma amounts give effect to (i) the consummation of a stock split effected upon the closing of this offering pursuant to which each share held by the holder of common stock will be reclassified into 25.4588 shares, (ii) the issuance and sale by us of 4,411,764 shares of our common stock in this offering, assuming an initial public offering price of $17.00 per share of common stock, the midpoint of the price range on the cover of this prospectus, and after deducting estimated offering expenses and estimated underwriting discounts and commissions payable by us, (iii) the consummation of the refinancing of our existing Senior Credit Facilities and entry into, and effectiveness of, our New Credit Facility, (iv) the application of the net proceeds from our initial public offering and borrowings under our New Credit Facility as set forth under “Use of Proceeds” and (v) the termination of the advisory services agreement between us and an affiliate of THL and the one-time termination fee paid by us upon the consummation of this offering as set forth under “Use of Proceeds.” See “Unaudited Pro Forma Consolidated Financial Statements,” “Use of Proceeds” and “Capitalization.” |
| (2) | From May 24, 2012 to July 20, 2012, Successor had no activities other than the incurrence of transaction costs related to the Acquisition. |
| (3) | We consider a restaurant to be comparable during the first full fiscal quarter following the eighteenth full month of operations. Comparable restaurant sales growth reflects the change in year-over-year sales for the comparable restaurant base. |
| (4) | Presented on a constant currency basis, which compares results between periods as if exchange rates had remained constant period-over-period. See “Management’s Discussion and Analysis of Financial Condition and Results of Operations – Supplemental Selected Constant Currency Information.” |
| (5) | Restaurant contribution is defined as revenue less restaurant operating costs. Restaurant contribution margin is defined as restaurant contribution as a percentage of revenue. Restaurant contribution is a supplemental measure of operating performance of our restaurants and our calculation thereof may not be comparable to that reported by other companies. See “Basis of Presentation” for a discussion of restaurant contribution and a description of its limitations as an analytical tool. |
14
Table of Contents
The following table sets forth the reconciliation of restaurant contribution to revenue:
| Combined | Successor | Predecessor | ||||||||||||||||||||||||||
| Thirteen Week Periods Ended |
Fiscal Year Ended | Period from |
Period
from |
Period |
||||||||||||||||||||||||
| (dollars in thousands) | March 29, 2015 |
March 30, 2014 |
December 28, 2014 |
December 29, 2013 |
||||||||||||||||||||||||
| Revenue |
$ | 64,959 | $ | 61,317 | $ | 262,280 | $ | 219,239 | $ | 202,360 | $ | 93,844 | $ | 108,516 | ||||||||||||||
| Total restaurant operating costs (excluding depreciation and amortization) |
(44,438 | ) | (43,258 | ) | (177,159 | ) | (150,565 | ) | (140,905 | ) | (65,984 | ) | (74,921 | ) | ||||||||||||||
| Restaurant contribution |
$ | 20,521 | $ | 18,059 | $ | 85,121 | $ | 68,674 | $ | 61,455 | $ | 27,860 | $ | 33,595 | ||||||||||||||
| (6) | Adjusted EBITDA is defined as net income before interest, taxes and depreciation and amortization plus the sum of certain operating and non-operating expenses, including pre-opening costs, losses on modifications and extinguishment of debt, acquisition costs, equity-based compensation costs, management and consulting fees, retention agreement costs, IPO related costs, and other non-cash or similar adjustments. Adjusted EBITDA margin represents Adjusted EBITDA as a percentage of revenue. See “Basis of Presentation” for a discussion of Adjusted EBITDA and a description of its limitations as an analytical tool. |
The following table sets forth the reconciliation of Adjusted EBITDA to our net income (loss):
| Combined | Successor | Predecessor | ||||||||||||||||||||||||||
| Thirteen Week Periods Ended |
Fiscal Year Ended | Period from |
Period
from |
Period |
||||||||||||||||||||||||
| (dollars in thousands) | March 29, 2015 |
March 30, 2014 |
December 28, 2014 |
December 29, 2013 |
||||||||||||||||||||||||
| Net income (loss) attributable to Fogo de Chão, Inc. |
$ | 4,665 | $ | 2,762 | $ | 17,555 | $ | (937 | ) | $ | (17,916 | ) | $ | (9,032 | ) | $ | (8,884 | ) | ||||||||||
| Depreciation and amortization expense |
3,004 | 2,737 | 11,638 | 8,989 | 8,850 | 3,736 | 5,114 | |||||||||||||||||||||
| Interest expense, net |
3,757 | 4,762 | 17,121 | 22,354 | 18,267 | 10,908 | 7,359 | |||||||||||||||||||||
| Income tax expense (benefit) |
1,252 | 965 | 6,991 | 2,472 | 99 | (1,195 | ) | 1,294 | ||||||||||||||||||||
| EBITDA |
12,678 | 11,226 | $ | 53,305 | $ | 32,878 | $ | 9,300 | $ | 4,417 | $ | 4,883 | ||||||||||||||||
| Pre-opening costs(a) |
849 | 788 | 1,717 | 4,764 | 2,478 | 1,119 | 1,359 | |||||||||||||||||||||
| Non-cash loss on modification/extinguishment of debt |
— | — | 3,090 | 6,875 | 7,762 | — | 7,762 | |||||||||||||||||||||
| Acquisition costs |
— | — | — | 18,951 | 11,988 | 6,963 | ||||||||||||||||||||||
| Equity-based compensation |
130 | 189 | 765 | 1,364 | 8,574 | 4,504 | 4,070 | |||||||||||||||||||||
| Management and consulting fees(b) |
341 | 215 | 859 | 2,524 | 338 | 338 | — | |||||||||||||||||||||
| Retention agreement payments(c) |
312 | 312 | 1,250 | 1,250 | 1,250 | 521 | 729 | |||||||||||||||||||||
| IPO related expense(d) |
384 | 26 | 1,666 | — | — | — | — | |||||||||||||||||||||
| Non-cash adjustments(e) |
244 | 132 | 667 | 708 | 591 | 309 | 282 | |||||||||||||||||||||
| Adjusted EBITDA |
$ | 14,938 | $ | 12,888 | $ | 63,319 | $ | 50,363 | $ | 49,244 | $ | 23,196 | $ | 26,048 | ||||||||||||||
| (a) | Excludes $0.2 million of pre-opening costs incurred by our joint venture in Mexico during the thirteen week period ended March 29, 2015 and during the fiscal year ended December 28, 2014, respectively. |
| (b) | Consists primarily of payments to an affiliate of THL and advisors engaged by an affiliate of THL for advisory and consulting services. Upon consummation of this offering, our agreement with an affiliate of THL will terminate in accordance with its terms and we will pay a termination fee of approximately $7.8 million to an affiliate of THL. See “Certain Relationships and Related Party Transactions.” |
| (c) | Consists of cash payments to our regional managers pursuant to retention and non-compete agreements put in place by our prior owner. The final payments under these agreements are due in October 2015. |
| (d) | Represents external professional service costs incurred as the Company assessed and initiated the process of becoming a public company. These costs include accounting and legal fees for public readiness services, documentation of internal controls to comply with Section 404 of the Sarbanes-Oxley Act and external auditor fees incurred for review of all fiscal quarters included in the filing. |
| (e) | Consists of non-cash portion of straight line rent expense. |
15
Table of Contents
Investing in our common stock involves a high degree of risk. You should carefully consider the following risk factors and the other information included in this prospectus before deciding to purchase shares of our common stock. Any of these risks may have a material adverse effect on our business, results of operations, financial condition and prospects. Consequently, the trading price of our common stock could decline, and you could lose all or part of your investment. The risks described below are those known to us and that we currently believe may materially affect us. Additional risks not presently known to us or that we currently consider immaterial may also negatively affect us.
Risks Related to Our Business and Industry
The restaurant industry in general, and the specialty and fine-dining segment in particular, are affected by changes in economic conditions, including continuing effects from the recent recession, which could negatively affect our guest traffic, business, financial condition and results of operations.
Dining at restaurants is a discretionary activity for consumers, and, therefore, we are subject to the effects of any economic conditions. Our restaurants cater to both business and social guests. Accordingly, our business is susceptible to economic factors that may result in reduced discretionary spending by our clientele. We also believe that consumers generally tend to make fewer discretionary expenditures, including for high-end restaurant meals, during periods of actual or perceived negative economic conditions. The recession from late 2007 to mid-2009 reduced consumer confidence to historic lows, impacting the public’s ability and desire to spend discretionary dollars as a result of job losses, home foreclosures, significantly reduced home values, investment losses, bankruptcies and reduced access to credit, resulting in lower levels of customer traffic and lower average check sizes in our restaurants. Changes in spending habits as a result of another economic slowdown, inflation or lower consumer confidence are likely to decrease the number of restaurant guests and average revenue per guest and put pressure on pricing, which would adversely affect our business and financial performance.
The United States, Brazil or the specific markets in which we operate may suffer from depressed economic activity, recessionary economic cycles, higher fuel or energy costs, low consumer confidence, high levels of unemployment, reduced home values, increases in home foreclosures, investment losses, personal bankruptcies, reduced access to credit or other economic factors that may affect consumer discretionary spending. During the recent economic crisis and recession, our business was materially adversely affected by a significant decrease in revenues from our restaurants in the United States and Brazil due to adverse economic conditions in those areas. If negative economic conditions persist for a long period of time or become more pervasive, consumers might make long-lasting changes to their discretionary spending behavior, including dining out less frequently on a permanent basis and generating lower average check sizes at our restaurants. If restaurant revenue decreases, our profitability could decline as we spread fixed costs across a lower level of revenue. Reductions in staff levels, asset impairment charges and potential restaurant closures could result from prolonged negative restaurant sales. There can be no assurance that the macroeconomic environment or the regional economics in which we operate will improve significantly or that government stimulus efforts will improve consumer confidence, liquidity, credit markets, home values or unemployment, among other things.
The future performance of the United States and Brazilian economies is uncertain and may be affected by economic, political and other factors that are beyond our control. These factors, which also affect consumer spending on restaurant meals, include, among others, national, regional and local economic conditions, levels of disposable consumer income, consumer confidence and the effects of geopolitical incidents. We believe that any negative developments relating to these factors, whether actual or perceived, could adversely impact our business and financial performance.
We face significant competition from other restaurant companies, which could adversely affect our business and financial performance and make it difficult to expand in new and existing markets.
We must compete successfully with other restaurant companies in existing or new markets in order to maintain and enhance our overall financial performance. The restaurant industry in the United States, Brazil and internationally is highly competitive in terms of price, quality of service, restaurant location, atmosphere, and type and quality of food. We compete with restaurant chains and independently owned restaurants (including, among others, churrascaria operators) for guests, restaurant locations and experienced management and staff. Some of our competitors have
16
Table of Contents
greater financial and other resources, have been in business for a longer period of time, have greater name recognition and are more established in the markets where we currently operate and where we plan to open new restaurants. Any inability to compete successfully with other restaurant companies may harm our ability to maintain or increase our revenue, force us to close one or more of our restaurants or limit our ability to expand our restaurant base. Restaurant closings would reduce our revenue and could subject us to significant costs, including severance payments to employees, write-downs of leasehold improvements, equipment, furniture and fixtures, and legal expenses. In addition, we could remain liable for remaining future lease obligations for any terminated restaurant locations.
Churrascaria operators and other competitors in the steakhouse sector of our industry have continued to open restaurants in recent years. If we overestimate demand for our restaurants or underestimate the popularity of competing restaurants, we may be unable to realize anticipated revenue from existing or new restaurants. Similarly, if any of our competitors opens additional restaurants in existing or targeted markets, we may realize lower than expected revenue from our restaurants. Any decrease in the number of restaurant guests for any of our existing or new restaurants due to competition could reduce our revenue and adversely affect our business and financial performance, which could cause the market price of our common stock to decline.
Our Brazilian operations, and any other future international operations, expose us to economic, regulatory and other risks associated with such countries.
We have long-standing operations in Brazil, where we now have 10 restaurants. Our Brazilian restaurants accounted for 25.9% of our total revenue in 2013, 23.7% in 2014 and 19.6% in the thirteen weeks ended March 30, 2014 and 15.8% in the thirteen weeks ended March 29, 2015. While we do not currently operate any restaurants outside of the United States, Brazil and our joint venture restaurant in Mexico, we intend to expand into other international markets in the future. Our lack of experience in operating restaurants outside of the United States and Brazil increases the risk that any international expansion efforts that we may undertake may not be successful. In addition, international operations, including our operations in Brazil and Mexico, subject us to a number of risks, including:
| • | fluctuations in currency exchange rates; |
| • | foreign and legal regulatory requirements; |
| • | difficulties in managing and staffing international operations; |
| • | potentially adverse tax consequences, including complexities of international tax systems and restrictions on the repatriation of earnings; |
| • | expropriation or governmental regulation restricting foreign ownership or requiring divestiture; |
| • | increases in the cost of labor (as a result of unionization or otherwise); |
| • | the burdens of complying with different legal standards; and |
| • | political, social and economic conditions. |
We may begin to operate in countries known to have a reputation for corruption and are subject to the US Foreign Corrupt Practices Act of 1977 (“FCPA”), the US Treasury Department’s Office of Foreign Assets Control (“OFAC”) regulations, other United States laws and regulations governing our international operations and similar laws in other countries. Any violation of the FCPA, OFAC regulations or other applicable anti-corruption laws, by us, our affiliated entities or their respective officers, directors, employees and agents could result in substantial fines, sanctions, civil and/or criminal penalties and curtailment of operations in certain jurisdictions and could adversely affect our financial condition, results of operations, cash flows or our availability of funds under our revolving line of credit. Further, detecting, investigating, and resolving actual or alleged violations is expensive and can consume significant time and attention of our management.
If we are unable to account for these risks while operating abroad, our reputation and brand value could be harmed. The occurrence of any of these risks could negatively affect our Brazilian operations and any future expansion into new geographic markets, which would have a material adverse effect on our business and results of operations.
17
Table of Contents
We are a multinational organization faced with increasingly complex tax issues in the jurisdictions in which we operate, including in Brazil, and we could be obligated to pay additional taxes in those jurisdictions.
As a multinational organization that operates in several jurisdictions, including the United States and Brazil, we may be subject to taxation in jurisdictions with increasingly complex tax laws, the application of which can be uncertain. The tax positions that we have taken or may take in the future may be subject to challenge on audit, and the authorities in these jurisdictions, including Brazil, could successfully assert that we are obligated to pay additional taxes, interest and penalties. In addition, the amount of taxes we pay could increase substantially as a result of changes in the applicable tax principles, including increased tax rates, new tax laws or revised interpretations of existing tax laws and precedents, which could have a material adverse effect on our liquidity and operating results. The authorities could also claim that various withholding requirements apply to us or our subsidiaries or assert that benefits of tax treaties are not available to us or our subsidiaries, any of which could have a material impact on us and the results of our operations.
Brazilian economic, political and other conditions, and Brazilian government policies or actions in response to these conditions, may negatively affect our business, results of operations and financial performance, as well as the market price of our common stock.
The Brazilian economy has been characterized by frequent and occasionally extensive intervention by the Brazilian government and unstable economic cycles. The Brazilian government has often changed monetary, taxation, credit, tariff and other policies to influence the course of the country’s economy. For example, the government’s actions to control inflation have at times involved setting wage and price controls, imposing exchange controls and limiting imports into Brazil. Additionally, in March and April of 2015, a series of protests began in Brazil against the current government and President. The initial protests occurred in cities throughout Brazil, including in Rio de Janeiro and Sao Paolo, on March 15, with protestors generally reported to number around a million, and continued throughout the remainder of March and into April. We have no control over, and cannot predict, what policies or actions the Brazilian government may take in the future, including in response to recent protesting activities. These factors, as well as uncertainty over whether the Brazilian government may implement changes in policy or regulations relating to these factors, could adversely affect us and our business, results of operations, financial performance and the market price of our common stock. We cannot predict what policies may be implemented by the Brazilian federal or state governments and whether these policies will negatively affect our business, financial condition, results of operations and prospects.
Our business, results of operations, financial condition and prospects may be adversely affected by exchange control policies, interest rates, liquidity of domestic capital and lending markets, social and political instability, and other economic, political, diplomatic and social developments affecting Brazil.
The Brazilian government regularly implements changes to tax regimes that may increase our tax burden. These changes include modifications in the rate of assessments, non-renewal of existing tax relief and, on occasion, enactment of temporary taxes the proceeds of which are earmarked for designated governmental purposes. Increases in our overall tax burden could negatively affect our overall financial performance and profitability.
Our reporting currency is the US dollar but a substantial portion of our revenue and costs and expenses are in the Brazilian real, so that exchange rate movements may affect our financial performance.
We generate revenue, and incur costs and expenses, in our Brazilian operations denominated in Brazilian reais. The results of our Brazilian operations are translated from reais into US dollars upon consolidation when we prepare our consolidated financial statements. When the US dollar weakens relative to the Brazilian real, the contribution of our Brazilian operations to our overall results of operations increases. By contrast, when the US dollar strengthens against the real, the contribution of our Brazilian operations tends to decrease.
The Brazilian currency has historically been subject to significant exchange rate fluctuations in relation to the US dollar and other currencies and has been devalued frequently over the past four decades. These exchange rate movements have been attributable to economic conditions in Brazil, Brazilian governmental policies and actions, developments in global foreign exchange markets and other factors. The real depreciated by 8.5% against the US dollar in
18
Table of Contents
2012, by 14.3% in 2013 and by 11.4% in 2014 and depreciated further by 29.4% on a year-over-year basis in the thirteen weeks ended March 29, 2015. Our reported consolidated results of operations have periodically been affected by the strength of the US dollar relative to the Brazilian real and further appreciation of the US dollar in the future periods could affect adversely our consolidated results of operations in those periods. Disruptions in financial markets may also result in significant changes in foreign exchange rates in relatively short periods of time which further increases the risk of an adverse currency effect. We do not currently use financial derivatives or hedging agreements to manage our currency exposure. In the future, we may choose to use a combination of natural hedging techniques and financial derivatives to protect against foreign currency exchange rate risks. However, such activities may be ineffective or may not offset more than a portion of the adverse financial effect resulting from foreign currency variations.
Our company’s principal asset is its ownership interest in Fogo de Chão (Holdings) Inc. and if that subsidiary or our other subsidiaries are restricted from distributing or repatriating funds to us, pursuant to law, regulation or otherwise, our liquidity, financial condition or results of operations could be materially and adversely affected.
We have no material assets other than our ownership of the equity interests in our subsidiaries and no independent means of generating revenue. To the extent that we need funds, and our subsidiaries are restricted from making such distributions under applicable law or regulation, or is otherwise unable to provide such funds, such restrictions or inability could materially adversely affect our liquidity, financial condition and results of operations.
Brazilian law permits the Brazilian government to impose temporary restrictions on conversions of Brazilian currency into foreign currencies and on remittances to foreign investors of proceeds from their investments in Brazil, whenever there is a serious imbalance in Brazil’s balance of payments or there are reasons to expect a pending serious imbalance. Any imposition of restrictions on conversions and remittances could hinder or prevent our Brazilian subsidiaries from converting Brazilian currency into US dollars or other foreign currencies and remitting abroad dividends or distributions. As a result, any imposition of exchange controls restrictions could reduce the market prices of the shares of our common stock.
Additionally, the terms of our Senior Credit Facilities include, and the terms of our New Credit Facility will include, a number of restrictive covenants that impose restrictions on our subsidiaries’ ability to, among other things, make certain restricted payments, including dividends to us.
Cash repatriation restrictions and exchange controls may also limit our ability to convert foreign currencies such as the real into US dollars or to remit payments by our Brazilian subsidiaries or businesses located in or conducted within a country imposing restrictions or controls. We may face similar risks in other international jurisdictions in which we operate. While we have repatriated cash historically, in the future we do not intend to repatriate or convert cash held in countries that have significant restrictions or controls in place, but should we need to do so to fund our operations, we may be unable to repatriate or convert such cash, or unable to do so without incurring substantial costs which may have a material adverse effect on our operating results and financial condition.
Our future success depends upon the continued appeal of our restaurant concept and we are vulnerable to changes to consumer preferences.
Our success depends, in considerable part, on the popularity of our menu offerings and the overall dining experience provided to guests by our restaurants. Any shift in consumer preferences away from our restaurant concept could negatively affect our financial performance. The restaurant industry is characterized by the continual introduction of new concepts and is subject to rapidly changing consumer preferences, tastes and dining habits. There can be no assurance that consumers will continue to regard churrascaria-inspired or steakhouse-based food favorably or that we will be able to develop new products that appeal to consumer preferences. Our business, financial condition and results of operations depend in part on our ability to anticipate, identify and respond to changing consumer preferences. Any failure by us to anticipate and respond to changing guest preferences could make our restaurants less appealing and adversely affect our business.
19
Table of Contents
Our historical revenue and AUVs may not be indicative of our future financial performance.
Our revenue and AUVs have historically been, and will continue to be, affected by, among others, the following factors:
| • | our ability to execute effectively our business strategy; |
| • | initial sales performance by new restaurants; |
| • | competition; |
| • | consumer and demographic trends, in particular for ethnic foods, and levels of beef consumption; and |
| • | general economic conditions and conditions specific to the restaurant industry. |
Existing restaurants may fail to maintain revenue and AUV levels consistent with our historical experience. New restaurants may not reach the historical revenue and AUV levels of our existing restaurants according to our plans, if at all. Any decrease in our revenue or AUVs would negatively affect our financial performance, which could cause the price of our common stock to fluctuate substantially.
Our future growth depends on our ability to open new restaurants in existing and new markets and to operate these restaurants profitably.
Our future financial performance will depend on our ability to execute our business strategy—in particular, to open new restaurants on a profitable basis. We currently operate 26 restaurants in the United States, 10 restaurants in Brazil and one joint venture restaurant in Mexico. We plan to open five to six restaurants during Fiscal 2015, which includes our first joint venture restaurant in Mexico City, which opened in May 2015. Over the next five years, we plan to increase our company-owned restaurant count by at least 10% annually, with North America being our primary market for new restaurant development. In addition, we plan to grow in Brazil as well as other international markets, however there is no guarantee that we will be able to increase the number of our restaurants in North America or in international markets. Our ability to successfully open new restaurants is, in turn, dependent upon a number of factors, many of which are beyond our control, including:
| • | finding and securing quality locations on acceptable financial terms; |
| • | complying with applicable zoning, land use and environmental regulations; |
| • | obtaining, for an acceptable cost, required permits and approvals; |
| • | having adequate financing for construction, opening and operating costs; |
| • | controlling construction and equipment costs for new restaurants; |
| • | weather, natural disasters and disasters beyond our control resulting in delays; |
| • | hiring, training and retaining management and other employees necessary to meet staffing needs; and |
| • | successfully promoting new restaurants and competing in the markets in which these are located. |
We continuously review potential sites for future restaurants. Typically, we experience a “start-up” period before a new restaurant achieves our targeted level of operating and financial performance which may include an initial start-up period of sales volatility. In addition, we face higher operating costs caused by start-up costs including higher food, labor and other direct operating expenses and other temporary inefficiencies associated with opening new restaurants. We may also face challenges such as lack of brand recognition, market familiarity and acceptance when we enter new markets.
20
Table of Contents
Our long-term success is highly dependent on our ability to successfully identify appropriate sites and develop and expand our operations in existing and new markets.
We intend to develop new restaurants in our existing markets, and selectively enter into new markets. There can be no assurance that any new restaurant that we open will have similar operating results to those of existing restaurants. There is no guarantee that a sufficient number of suitable restaurant sites will be available in desirable areas or on terms that are acceptable to us, and we may not be able to open our planned new restaurants on a timely basis, if at all. Further, if opened, these restaurants may not be operated profitably. As part of our growth strategy, we may enter into geographic markets in which we have little or no prior operating experience. Consumer recognition of our brand has been important in the success of restaurants in our existing markets and recognition may be lacking in new geographic markets. In addition, restaurants we open in new markets may take longer to reach expected sales and profit levels on a consistent basis and may have higher construction, occupancy or operating expenses than restaurants we open in existing markets, thereby affecting our overall profitability. Any failure on our part to recognize or respond to these challenges may adversely affect the success of any new restaurants.
The number and timing of new restaurants opened during any given period, and their associated contribution to operating growth, may be negatively impacted by a number of factors including, without limitation:
| • | identification and availability of appropriate locations that will increase the number of restaurant guests and sales per unit; |
| • | inability to generate sufficient funds from operations or to obtain acceptable financing to support our development; |
| • | recruitment and training of qualified operating personnel in the local market; |
| • | availability of acceptable lease arrangements; |
| • | construction and development cost management; |
| • | timely delivery of the leased premises to us from our landlords and punctual commencement of our buildout construction activities; |
| • | delays due to the customized nature of our restaurant concepts and decor, construction and pre-opening processes for each new location; |
| • | obtaining all necessary governmental licenses and permits, including our liquor licenses, on a timely basis to construct or remodel and operate our restaurants; |
| • | inability to comply with certain covenants under our Senior Credit Facilities or our New Credit Facility that could limit our ability to open new restaurants; |
| • | consumer tastes in new geographic regions and acceptance of our restaurant concept; |
| • | competition in new markets, including competition for restaurant sites; unforeseen engineering or environmental problems with the leased premises; |
| • | adverse weather during the construction period; anticipated commercial, residential and infrastructure development near our new restaurants; and |
| • | other unanticipated increases in costs, any of which could give rise to delays or cost overruns. |
If we are unable to successfully open new restaurants, our financial results or revenue growth could be adversely affected and our business negatively affected as we expect a portion of our growth to come from new restaurants.
21
Table of Contents
Our failure to manage our growth effectively could harm our business and operating results.
Our growth plan includes opening a number of new restaurants. Our existing restaurant management systems, administrative staff, financial and management controls and information systems may be inadequate to support our planned expansion. Those demands on our infrastructure and resources may also adversely affect our ability to manage our existing restaurants. Managing our growth effectively will require us to continue to enhance these systems, procedures and controls and to hire, train and retain managers, gaucho chefs and other team members. We may not respond quickly enough to the changing demands that our expansion will impose on our management, restaurant teams and existing infrastructure which could harm our business, financial condition and results of operations.
We believe our gaucho culture is an important contributor to our success. As we grow, however, we may have difficulty maintaining our culture or adapting it sufficiently to meet the needs of our operations. Our business, financial condition and results of operations could be materially adversely affected if we do not maintain our infrastructure and culture as we grow.
We have a history of net losses and may incur losses in the future.
We incurred net losses in Fiscal 2012 and Fiscal 2013. We may incur net losses in the future and we cannot assure you that we will achieve or sustain profitability.
Increases in the prices of, or reductions in the availability of, top-quality beef could reduce our operating margins and revenue.
We purchase substantial quantities of beef, particularly Angus Beef® (and its equivalent in Brazil), which is subject to significant price fluctuations due to conditions affecting livestock markets, weather, feed prices, industry demand and other factors. Our meat costs accounted for approximately 59% of our total food and beverage costs in the United States during 2013, approximately 57% during 2014 and approximately 58% during the thirteen weeks ended March 29, 2015. Because our restaurants in the United States feature Angus Beef®, we generally would expect to purchase this type of beef even in the face of significant price increases. If the price for beef increases in the future and we choose not to pass, or cannot pass, these increases on to our guests, our operating margins could decrease significantly. In addition, if key beef items become unavailable for us to purchase, our revenue could decrease.
We may experience higher operating costs, including increases in supplier prices and employee salaries and benefits, which could adversely affect our financial performance.
Our ability to maintain consistent quality throughout our restaurants depends, in part, upon our ability to acquire fresh food products, including Angus Beef® (and its equivalent in Brazil), and related items from reliable sources in accordance with our specifications and in sufficient quantities. We have pricing agreements in place with a few suppliers for our beef purchases in the United States and short term contracts with a limited number of suppliers for the distribution of our other food purchases and other supplies for our restaurants. We do not have any supply agreements or pricing agreements in place in Brazil, and therefore we are subject to risks of shortages and price fluctuations with respect to our food purchases for our restaurants in Brazil. Our largest supplier of beef accounted for 70% of our beef purchases in the United States in 2013, 77% in 2014 and 99% in the thirteen weeks ended March 29, 2015. Our dependence on a limited number of suppliers subjects us to risks of shortages, delivery interruptions and price fluctuations. If our suppliers do not perform adequately or otherwise fail to distribute supplies to our restaurants, we may be unable to replace them in a short period of time on acceptable terms. Any inability to so replace suppliers could increase our costs or cause shortages at our restaurants of food and other items that may cause us to remove popular items from a restaurant’s menu or temporarily close a restaurant, which could result in a loss of guests and, consequently, revenue during the time of the shortage and thereafter, if our guests change their dining habits as a result.
If we pay higher prices for food items or other supplies or increase compensation or benefits to our employees, we will sustain an increase in our operating costs. Many factors affect the prices paid for food and other items, including conditions affecting livestock markets, weather, changes in demand and inflation. Factors that may affect compensation and benefits paid to our employees include changes in minimum wage and employee benefits laws (as
22
Table of Contents
discussed below). Other factors that could cause our operating costs to increase include fuel prices, occupancy and related costs, maintenance expenditures and increases in other day-to-day expenses. If we are unable or unwilling to increase our menu prices or take other actions to offset increased operating costs, we could experience a decline in our financial performance.
We rely heavily on certain vendors, suppliers and distributors, which could adversely affect our business.
Our ability to maintain consistent price and quality throughout our restaurants depends in part upon our ability to acquire specified food products and supplies in sufficient quantities from third-party vendors, suppliers and distributors at a reasonable cost. We rely on US Foods, Inc. (“US Foods”) as one of our primary distributors. In Fiscal 2013 and 2014, and the thirteen weeks ended March 29, 2015, we spent approximately 70%,72%, and 72%, respectively, of our food and beverage costs in the United States on products and supplies procured from US Foods. Our agreement with US Foods can be terminated by either us or US Foods upon 60 days’ written notice. We do not control the businesses of our vendors, suppliers and distributors, and our efforts to specify and monitor the standards under which they perform may not be successful. Furthermore, certain food items are perishable, and we have limited control over whether these items will be delivered to us in appropriate condition for use in our restaurants. If any of our vendors, suppliers or distributors are unable to fulfill their obligations to our standards, or if we are unable to find replacement providers in the event of a supply or service disruption, we could encounter supply shortages and incur higher costs to secure adequate supplies, which could materially adversely affect our business, financial condition and results of operations.
Our marketing programs may not be successful.
We believe our brand is critical to our business. We incur costs and expend other resources in our marketing efforts to raise brand awareness and attract and retain guests. These initiatives may not be successful, resulting in expenses incurred without the benefit of higher revenue. Additionally, some of our competitors have greater financial resources, which enable them to spend significantly more than we are able to on marketing and advertising. Should our competitors increase spending on marketing and advertising or our marketing funds decrease for any reason, or should our advertising and promotions be less effective than our competitors, there could be a material adverse effect on our results of operations and financial condition.
Any negative publicity surrounding our restaurants or our sector of the industry could adversely affect the number of restaurant guests, which could reduce revenue in our restaurants.
We believe that any adverse publicity concerning the quality of our food and our restaurants generally could damage our brand and adversely affect the future success of our business. Company-specific adverse publicity, including inaccurate publicity, could take different forms, such as negative reviews by restaurant or word-of-mouth criticisms emanating from our guest base. Also, there has been a recent increase in the use of social media platforms and similar devices, including weblogs (blogs), social media websites, and other forms of Internet-based communications which allow individuals access to a broad audience of consumers and other interested persons. Many social media platforms immediately publish the content their subscribers and participants can post, often without filters or checks on accuracy of the content posted. There is significant opportunity for dissemination of information, including inaccurate information. Information concerning our company may be posted on such platforms at any time. Information posted may be adverse to our interests or may be inaccurate, either of which may harm our business and financial performance. The harm may be immediate without affording us an opportunity for redress or correction.
Negative publicity relating to the consumption of beef, including in connection with food-borne illness, could result in reduced consumer demand for our menu offerings, which could reduce sales.
Instances of food-borne illness, including Bovine Spongiform Encephalopathy, which is also known as BSE, and aphthous fever, as well as hepatitis A, lysteria, salmonella and e-coli, whether or not found in the United States or Brazil or traced directly to one of our suppliers or our restaurants, could reduce demand for our menu offerings. We cannot guarantee that our internal controls and training will be fully effective in preventing all food safety issues at our restaurants, including instances of food-borne illnesses. Any negative publicity relating to these and other health-related matters may affect consumers’ perceptions of our restaurants and the food that we offer, reduce guest visits to our restaurants and negatively impact demand for our menu offerings. Adverse publicity relating to any of these matters, beef in general or other similar concerns could adversely affect our business and results of operations.
23
Table of Contents
Our company could face lawsuits relating to workplace and employment laws and fair credit reporting requirements, which, if determined adversely, could result in negative publicity or in payment of substantial damages by us.
Various federal and state labor laws govern our relationships with our employees and affect operating costs. These laws include employee classifications as exempt or non-exempt, minimum wage requirements, unemployment tax rates, workers’ compensation rates, citizenship requirements and other wage and benefit requirements for employees classified as non-exempt. Our business may be adversely affected by legal or governmental proceedings brought by or on behalf of our employees or guests. Although we require all workers to provide us with government-specified documentation evidencing their employment eligibility, some of our employees may, without our knowledge, be unauthorized workers. We currently participate in the “E-Verify” program, an Internet-based, free program run by the United States government to verify employment eligibility, in states in which participation is required. However, use of the “E-Verify” program does not guarantee that we will properly identify all applicants who are ineligible for employment. Unauthorized workers are subject to deportation and may subject us to fines or penalties, and if any of our workers are found to be unauthorized we could experience adverse publicity that negatively impacts our brand and may make it more difficult to hire and keep qualified employees. Termination of a significant number of employees who were unauthorized employees may disrupt our operations, cause temporary increases in our labor costs as we train new employees and result in additional adverse publicity. We could also become subject to fines, penalties and other costs related to claims that we did not fully comply with all record-keeping obligations of federal and state immigration compliance laws. These factors could have a material adverse effect on our business, financial condition and results of operations.
In recent years, a number of restaurant companies, including our company, have been subject to lawsuits and other claims, including class action lawsuits, alleging violations of federal and state law governing workplace and employment matters such as various forms of discrimination, wrongful termination, harassment and similar matters and violations of fair credit reporting requirements. A number of these lawsuits and claims against other companies have resulted in various penalties, including the payment of substantial damages by the defendants. In addition, lawsuits by employees are common in Brazil after termination of employment and we have been subject to a number of these lawsuits. Insurance may not be available at all or in sufficient amounts to cover all liabilities with respect to these matters. Accordingly, we may incur substantial damages and expenses resulting from claims and lawsuits, which would increase our operating costs, decrease funds available for the development of our business and result in charges to our income statements resulting in decreased profitability or net losses. Employee claims against us also create not only legal and financial liability but negative publicity that could adversely affect us and divert our financial and management resources that would otherwise be used to benefit the future performance of our operations.
Litigation concerning food quality, health, employee conduct and other issues could require us to incur additional liabilities or cause guests to avoid our restaurants.
Restaurant companies have from time to time faced lawsuits alleging that a guest suffered illness or injury during or after a visit to a restaurant, including actions seeking damages resulting from food borne illness and relating to notices with respect to chemicals contained in food products required under state law. Similarly, food tampering, employee hygiene and cleanliness failures or improper employee conduct at our restaurants could lead to product liability or other claims. To date, we have not been a defendant in any lawsuit asserting such a claim. However, we cannot assure you that such a lawsuit will not be filed against us and we cannot guarantee to consumers that our internal controls and training will be fully effective in preventing claims. We are also subject to various claims arising in the ordinary course of our business, including personal injury claims, contract claims and other matters. In addition, we could become subject to class action lawsuits related to these and other matters in the future. Regardless of whether any claims against us are valid or whether we are ultimately held liable, claims may be expensive to defend and may divert management attention and other resources from our operations and hurt our financial performance. A judgment significantly in excess of our insurance coverage for any claims would materially adversely affect our results of operations and financial condition. In addition, adverse publicity resulting from any such claims may negatively impact revenue at one or more of our restaurants.
24
Table of Contents
Our business is subject to extensive regulation and we may incur additional costs or liabilities as a result of government regulation of our restaurants.
Our business is subject to extensive federal, state, local and foreign government regulation, including, among others, regulations related to the preparation and sale of food, the sale of alcoholic beverages, zoning and building codes, land use and employee, health, sanitation and safety matters.
Typically, our licenses to sell alcoholic beverages must be renewed annually and may be suspended or revoked at any time for cause. Alcoholic beverage control regulations govern various aspects of daily operations of our restaurants, including the minimum age of guests and employees, hours of operation, advertising, wholesale purchasing and inventory control, handling and storage. Any failure by any of our restaurants to obtain and maintain, on a timely basis, liquor or other licenses, permits or approvals required to serve alcoholic beverages or food, as well as any associated negative publicity, could delay or prevent the opening of, or adversely impact the viability of, and could have an adverse effect on, that restaurant and its operating and financial performance. We apply for our liquor licenses with the advice of outside legal counsel and licensing consultants. Because of the many and various state and federal licensing and permitting requirements, there is a significant risk that one or more regulatory agencies could determine that we have not complied with applicable licensing or permitting regulations or have not maintained the approvals necessary for us to conduct business within its jurisdiction. Any changes in the application or interpretation of existing laws may adversely impact our restaurants in that state, and could also cause us to lose, either temporarily or permanently, the licenses, permits and regulations necessary to conduct our restaurant operations, and subject us to fines and penalties.
There is also a potential for increased regulation of certain food establishments in the United States, where compliance with a Hazard Analysis and Critical Control Points (“HACCP”) approach would be required. HACCP refers to a management system in which food safety is addressed through the analysis and control of potential hazards from production, procurement and handling, to manufacturing, distribution and consumption of the finished product. Many states have required restaurants to develop and implement HACCP Systems, and the United States government continues to expand the sectors of the food industry that must adopt and implement HACCP programs. For example, the Food Safety Modernization Act (the “FSMA”), signed into law in January 2011, granted the FDA new authority regarding the safety of the entire food system, including through increased inspections and mandatory food recalls. Although restaurants are specifically exempted from or not directly implicated by some of these new requirements, we anticipate that the new requirements may impact our industry. Additionally, our suppliers may initiate or otherwise be subject to food recalls that may impact the availability of certain products, result in adverse publicity or require us to take actions that could be costly for us or otherwise impact our business.
Our restaurants in the United States are subject to state “dram shop” laws, which generally allow a person to sue us if that person was injured by an intoxicated person who was wrongfully served alcoholic beverages at one of our restaurants. Recent litigation against restaurant chains has resulted in significant judgments, including punitive damages, under dram shop laws. A judgment against us under a dram shop law could exceed our liability insurance coverage policy limits and could result in substantial liability for us and have a material adverse effect on our results of operations. Our inability to continue to obtain such insurance coverage at reasonable cost also could have a material adverse effect on us. Regardless of whether any claims against us are valid or whether we are liable, we may be adversely affected by publicity resulting from such laws.
The costs of operating our restaurants may increase in the event of changes in laws governing minimum hourly wages, working conditions, overtime and tip credits, health care, workers’ compensation insurance rates, unemployment tax rates, sales taxes or other laws and regulations, such as those governing access for the disabled (including the Americans with Disabilities Act). If any of these costs were to increase and we were unable or unwilling to pass on such costs to our guests by increasing menu prices or by other means, our business and results of operations could be negatively affected.
Failure to comply with federal, state or local regulations could cause our licenses to be revoked and force us to cease the sale of alcoholic beverages at certain restaurants. Any difficulties, delays or failures in obtaining such licenses, permits or approvals could delay or prevent the opening of a restaurant in a particular area or increase the costs associated
25
Table of Contents
therewith. In addition, in certain states, including states where we have existing restaurants or where we plan to open a restaurant, the number of liquor licenses available is limited, and licenses are traded on the open market. Liquor, beer and wine sales comprise a significant portion of our revenue. If we are unable to maintain our existing licenses, our guest patronage, revenue and results of operations would be adversely affected. Or, if we choose to open a restaurant in those states where the number of licenses available is limited, the cost of a new license could be significant.
Any failure to protect and maintain our intellectual property rights could adversely affect the value of our brand.
We have registered our principal trademarks including the FOGO, FOGO DE CHÃO and BAR FOGO marks, the campfire design and other marks used by our restaurants as trade names, trademarks or service marks with the United States Patent and Trademark Office, in Brazil and in numerous foreign countries. The trademarks we currently use have not been registered in all of the countries outside of the United States in which we do business or may do business in the future. We may never register such trademarks in all of these countries and, even if we do, the laws of some foreign countries do not protect intellectual property rights to the same extent as the laws of the United States. We believe that our intellectual property are valuable assets that are critical to our success. The success of our business depends on our continued ability to use our intellectual property in order to increase our brand awareness, and the unauthorized use or other misappropriation of our intellectual property in the United States or any foreign countries could diminish the value of our brands and restaurant concept and may cause a decline in our revenue. We are also aware of names similar to those of our restaurants used by third parties in certain limited geographical areas in the United States, Brazil and elsewhere. Protective actions taken by us with respect to these rights may fail to prevent unauthorized usage or imitation by others, which could harm our reputation, brands or competitive position and, if we commence litigation to enforce our rights, cause us to incur significant legal expenses.
In January 2015, the Brazilian Patent and Trademark Office published a request by Churrasciaria Vento Norte Ltda. (doing business as Vento Haragano) to partially nullify our trademark registration in Brazil for Fogo de Chão on the grounds that it violates the Brazilian Industrial Property Act for being descriptive. Vento Haragano has requested that the Brazilian Patent and Trademark Office declare that we not have exclusive rights to use the trademark Fogo de Chão at our locations in Brazil. If we lose the exclusive rights to use the trademark Fogo de Chão in Brazil, we could suffer damage or diminution of value to our brand. In addition, third parties may claim infringement by us in the future. Any such claim, whether or not it has merit, could be time consuming, result in costly legal expenses, cause delays in the launch of new products, or require us to enter into royalty or licensing agreements, all of which could harm our business and results of operations.
The impact of negative economic factors, including the availability of credit, on our landlords and other retail center tenants could negatively affect our financial results.
Negative effects on our existing and potential landlords due to any inaccessibility of credit and other unfavorable economic factors may, in turn, adversely affect our business and results of operations. If our landlords are unable to obtain financing or remain in good standing under their existing financing arrangements, they may be unable to provide construction contributions or satisfy other lease covenants to us. If any landlord files for bankruptcy protection, the landlord may be able to reject our lease in the bankruptcy proceedings. While we would have the option to retain our rights under the lease, we could not compel the landlord to perform any of its obligations and would be left with damages as our sole recourse. In addition, if our landlords are unable to obtain sufficient credit to continue to properly manage their retail sites, we may experience a drop in the level of quality of such retail centers. Our development of new restaurants may also be adversely affected by the negative financial situations of developers and potential landlords.
We occupy most of our restaurants under long-term non-cancelable leases, which we may be unable to renew at the end of the lease terms or which may limit our flexibility to move to new locations.
All but two of our restaurants in the United States are located in leased premises and all of our restaurants in Brazil are located in leased premises. Many of our current leases in the United States are non-cancelable and usually have terms ranging from 10 to 20 years, with renewal options for terms ranging from five to 10 years. We anticipate that leases that we enter into in the future in the United States will also be long-term and non-cancelable and have similar renewal options. If we were to close or fail to open a restaurant at a leased location, we would generally remain
26
Table of Contents
committed to perform our obligations under the applicable lease, which could include, among other things, payment of the base rent for the balance of the lease term. Our obligation to continue making rental payments and fulfilling other lease obligations under leases for closed or unopened restaurants could have a material adverse effect on our business and results of operations. In addition, lease rates in Brazil are typically readjusted every three years and the rent amounts are not predetermined as they are in the United States. If the landlord and we cannot agree on an adjusted rate, the dispute is submitted to a judicial resolution process. As a result, our lease rates in Brazil are subject to more volatility than those in the United States and we may not always be able to predict these rates due to the unpredictable nature of the judicial resolution process, which could be unfavorable to us.
At the end of the lease term and any renewal period for a restaurant, we may be unable to renew the lease without substantial additional cost, if at all. If we are unable to renew our restaurant leases, we may be forced to close or relocate a restaurant, which could subject us to significant construction and other costs. For example, closing a restaurant, even for a brief period to permit relocation, would reduce the revenue contribution of that restaurant to our total revenue. Additionally, the revenue and profit, if any, generated at a relocated restaurant may not equal the revenue and profit generated at the previous restaurant location.
Long-term leases can, however, limit our flexibility to move a restaurant to a new location. For example, current locations may no longer be attractive in the event that demographic patterns shift or neighborhood conditions decline. In addition, long-term leases may affect our ability to take advantage of more favorable rent levels due to changes in local real estate market conditions. These and other location-related issues may affect the financial performance of individual restaurants.
Our rent expense could increase our vulnerability to adverse economic and industry conditions and could limit our operating and financial flexibility.
Our rent expense accounted for approximately 7.1% of our revenue in 2013, 6.4% in 2014 and 6.8% in the thirteen weeks ended March 29, 2015. We expect that new restaurants will typically be leased by us under operating leases. Substantial operating lease obligations could have significant negative consequences, including:
| • | increasing our vulnerability to adverse economic and industry conditions; |
| • | requiring a substantial portion of our available cash to be applied to pay our rental obligations, thus reducing cash available for other purposes; |
| • | limiting our ability to obtain any necessary financing; and |
| • | limiting our flexibility in planning for, or reacting to, changes in our business or our industry. |
We depend on cash flow from operations to pay our lease obligations and to fulfill our other cash requirements. If our restaurants do not generate sufficient cash flow and sufficient funds are not otherwise available to us from borrowings under bank loans or from other sources, we may not be able to meet our lease obligations, grow our business, respond to competitive challenges or fund our other liquidity and capital needs, which would have a material adverse effect on us.
Opening new restaurants in existing markets may negatively affect sales at our existing restaurants.
The consumer target area of our restaurants varies by location, depending on a number of factors, including population density, other local retail and business attractions, area demographics and geography. As a result, the opening of a new restaurant in or near markets in which we already have restaurants could adversely affect sales at these existing restaurants. Existing restaurants could also make it more difficult to build our consumer base for a new restaurant in the same market. Our core business strategy does not entail opening new restaurants that we believe will materially affect sales at our existing restaurants, but we may selectively open new restaurants in and around areas of existing restaurants that are operating at or near capacity to effectively serve our guests. Sales cannibalization between our restaurants may become significant in the future as we continue to expand our operations and could affect our sales growth, which could, in turn, materially adversely affect our business, financial condition and results of operations.
27
Table of Contents
Labor shortages or increases in labor costs could slow our growth and adversely affect our ability to operate our restaurants.
Our success depends, in part, upon our ability to attract, motivate and retain qualified employees, including restaurant managers and gaucho chefs necessary to meet the needs of our existing restaurants and to support our expansion program. Qualified personnel to fill these positions may be in short supply in some areas. If we are unable to continue to recruit and retain sufficiently qualified personnel, our business and our growth could be adversely affected. Any future inability to recruit and retain qualified personnel may delay openings of new restaurants and could adversely impact existing restaurants. Any such delays, any material increases in employee turnover rates in existing restaurants or any employee dissatisfaction could have a material adverse effect on our business and results of operations. In addition, competition for qualified employees could require us to pay higher wages, which could result in higher labor costs, which could, in turn, have a material adverse effect on our financial performance.
Increases in minimum wages or unionization activities could substantially increase our labor costs.
Under the minimum wage laws in most jurisdictions in the United States, we are permitted to pay certain hourly employees a wage that is less than the base minimum wage for general employees because these employees receive tips as a substantial part of their income. As of March 29, 2015, approximately 33.7% of our employees in the United States earn this lower minimum wage in their respective locations as tips constitute a substantial part of their income. If federal, state or local governments change their laws to require that all employees be paid the general employee minimum base wage regardless of supplemental tip income, our labor costs would increase substantially. Our labor costs would also increase if the minimum base wage increases. We may be unable or unwilling to increase our prices in order to pass increased labor costs on to our guests, in which case our operating margins would be adversely affected. Also, although none of our employees in the United States are currently covered under collective bargaining agreements, our employees in Brazil participate in industry-wide trade union programs. Additionally, our employees in the United States may elect or attempt to be represented by labor unions in the future. If a significant number of our employees were to become unionized and collective bargaining agreement terms were significantly different from our current compensation arrangements, it could adversely affect our business, financial condition and results of operations.
Our growth may be hindered by immigration restrictions, our inability to obtain necessary visas and work permits for foreign workers and changes in United States immigration laws and regulations, particularly with respect to L-1B visa eligibility.
Our future success could depend on our ability to attract and retain employees with specialized culinary skills. Many of our gaucho chefs in the United States are Brazilian nationals whose ability to work in the United States depends on obtaining and maintaining necessary visas and work permits (which may or may not be tied to their employment with us).
Immigration and work permit laws and regulations in the United States are subject to changes, both in substance as well as in the application of standards and enforcement. Immigration and work permit laws and regulations can be significantly affected by political considerations and economic conditions in the United States. We have been, and may in the future be, unable to obtain visas or work permits to bring necessary employees to the United States for any number of reasons including, among others, limits set by the US Department of Homeland Security or the US Department of State. The Department of Homeland Security’s Bureau of Citizenship & Immigration Services (USCIS, formerly INS) began to narrow its interpretation of L-1B visa eligibility as to all corporate petitioners in 2007 and 2008. Beginning in 2009, the USCIS ceased approving our L-1B visas and recommended that the petitions of 10 current L-1B visa holders be revoked. We contested the adverse actions before USCIS, and then sued USCIS in US District Court. The US District Court affirmed the USCIS denials in 2013, but we appealed that determination, and on October 21, 2014, the US Court of Appeals for the D.C. Circuit granted our appeal, rejected the USCIS denial, and remanded the representative L-1B petition in question to the district court, with instructions to vacate the denial and to remand to USCIS for further consideration in light of the Court’s correction of USCIS’s factual and legal adjudication errors. We anticipate that USCIS may reopen the representative L-1B petition following remand to the district court.
Due to the current climate and uncertainty relative to the process of requesting and obtaining L-1B visas, as well as recent denials of certain requests, we will continue to explore all available legal means to bring employees from Brazil to work in our restaurants in the United States. Continued compliance with existing US or foreign immigration
28
Table of Contents
laws or changes in such laws, making it more difficult to hire foreign nationals or limiting our ability to retain visas or work permits for current employees in the United States, could materially adversely affect our expansion strategy and, more generally, our business and financial performance.
The effect of changes to healthcare laws in the United States may increase the number of employees who choose to participate in our healthcare plans, which may significantly increase our healthcare costs and negatively impact our financial results.
In 2010, the Patient Protection and Affordable Care Act (“PPACA”) was signed into law in the United States to require health care coverage for many uninsured individuals and expand coverage to those already insured. We currently offer and subsidize a portion of comprehensive healthcare coverage, primarily for our salaried employees. The healthcare reform law will require us to offer healthcare benefits to all full-time employees (including full-time hourly employees) that meet certain minimum requirements of coverage and affordability, or face penalties. If we elect to offer such benefits we may incur substantial expense. If we fail to offer such benefits, or the benefits we elect to offer do not meet the applicable requirements, we may incur penalties. The healthcare reform law also requires individuals to obtain coverage or face individual penalties, so employees who are currently eligible but elect not to participate in our healthcare plans may find it more advantageous to do so when such individual mandates take effect. It is also possible that by making changes or failing to make changes in the healthcare plans offered by us we will become less competitive in the market for our labor. Finally, implementing the requirements of healthcare reform is likely to impose additional administrative costs. The costs and other effects of these new healthcare requirements cannot be determined with certainty, but they may significantly increase our healthcare coverage costs and could materially adversely affect our, business, financial condition and results of operations.
Legislation and regulations requiring the display and provision of nutritional information for our menu offerings, and new information or attitudes regarding diet and health or adverse opinions about the health effects of consuming our menu offerings, could affect consumer preferences and negatively impact our results of operations.
Government regulation and consumer eating habits may impact our business as a result of changes in attitudes regarding diet and health or new information regarding the health effects of consuming our menu offerings. These changes have resulted in, and may continue to result in, the enactment of laws and regulations that impact the ingredients and nutritional content of our menu offerings, or laws and regulations requiring us to disclose the nutritional content of our food offerings.
The PPACA establishes a uniform, federal requirement for certain restaurants to post certain nutritional information on their menus. Specifically, the PPACA amended the Federal Food, Drug and Cosmetic Act to require chain restaurants with 20 or more locations operating under the same name and offering substantially the same menus to publish the total number of calories of standard menu items on menus and menu boards, along with a statement that puts this calorie information in the context of a total daily calorie intake. The PPACA also requires covered restaurants to provide to consumers, upon request, a written summary of detailed nutritional information for each standard menu item, and to provide a statement on menus and menu boards about the availability of this information. The PPACA further permits the United States Food and Drug Administration to require covered restaurants to make additional nutrient disclosures, such as disclosure of trans-fat content. An unfavorable report on, or reaction to, our menu ingredients, the size of our portions or the nutritional content of our menu items could negatively influence the demand for our offerings.
Furthermore, a number of states, counties and cities have enacted menu labeling laws requiring multi-unit restaurant operators to disclose certain nutritional information to guests, or have enacted legislation restricting the use of certain types of ingredients in restaurants. California is one of these, although its menu labeling law has been superseded by the PPACA.
Compliance with current and future laws and regulations regarding the ingredients and nutritional content of our menu items may be costly and time-consuming. Additionally, some government authorities are increasing regulations regarding trans-fats and sodium, which may require us to limit or eliminate trans-fats and sodium in our offerings, switch to higher cost ingredients or may hinder our ability to operate in certain markets. Some jurisdictions have banned certain cooking ingredients, such as trans-fats, or have discussed banning certain products, such as large sodas.
29
Table of Contents
Removal of these products and ingredients from our menus could affect product tastes, guest satisfaction levels, and sales volumes, whereas if we fail to comply with these laws or regulations, our business could experience a material adverse effect.
We cannot make any assurances regarding our ability to effectively respond to changes in consumer health perceptions or our ability to successfully implement the nutrient content disclosure requirements and to adapt our menu offerings to trends in eating habits. The imposition of additional menu-labeling laws could have an adverse effect on our results of operations and financial position, as well as on the restaurant industry in general.
A breach of security of confidential consumer information related to our electronic processing of credit and debit card transactions could substantially affect our reputation and financial results.
A significant majority of our sales are by credit or debit cards. Other restaurants and retailers have experienced security breaches in which credit and debit card information has been stolen. We may in the future become subject to claims for purportedly fraudulent transactions arising out of the actual or alleged theft of credit or debit card information, and we may also be subject to lawsuits or other proceedings relating to these types of incidents. In addition, most states have enacted legislation requiring notification of security breaches involving personal information, including credit and debit card information. Any such claim or proceeding could cause us to incur significant unplanned expenses, which could have an adverse impact on our financial condition and results of operations. Further, adverse publicity resulting from these allegations may have a material adverse effect on us and our restaurants.
We rely heavily on information technology, and any material failure, weakness, interruption or breach of security could prevent us from effectively operating our business.
We rely heavily on information systems, including point-of-sale processing in our restaurants, for management of our supply chain, payment of obligations, collection of cash, credit and debit card transactions and other processes and procedures. Our ability to efficiently and effectively manage our business depends significantly on the reliability and capacity of these systems. Our operations depend upon our ability to protect our computer equipment and systems against damage from physical theft, fire, power loss, telecommunications failure or other catastrophic events, as well as from internal and external security breaches, viruses and other disruptive problems. The failure of these systems to operate effectively, maintenance problems, upgrading or transitioning to new platforms, expanding our systems as we grow or a breach in security of these systems could result in delays in guest service and reduce efficiency in our operations. Remediation of such problems could result in significant, unplanned capital investments.
The historical financial information, including the combined historical financial information for the 2012 fiscal year, in this prospectus may not accurately predict our results or our costs of operations in the future.
The historical financial information in this prospectus does not reflect the added costs we expect to incur as a public company or the resulting changes that will occur in our capital structure and operations. The estimates used in our as adjusted financial information may not be similar to our actual experience as a public company. For purposes of presenting a comparison of our Fiscal 2012 results to the fiscal years ended December 29, 2013 and December 28, 2014, we have presented our Fiscal 2012 results as the mathematical addition of the respective Predecessor and Successor periods. We believe that this presentation provides meaningful information about our results of operations. This approach is not consistent with US GAAP, may yield results that are not strictly comparable on a period-to-period basis and may not reflect the actual results we would have achieved. Accordingly, the historical financial information in this prospectus may not be indicative of our future financial performance.
Changes to estimates related to our property, fixtures and equipment or operating results that are lower than our current estimates at certain restaurant locations may cause us to incur impairment charges on certain long-lived assets, which may adversely affect our results of operations.
In accordance with accounting guidance as it relates to the impairment of long-lived assets, we make certain estimates and projections with regard to individual restaurant operations, as well as our overall performance, in connection with our impairment analyses for long-lived assets. When impairment triggers are deemed to exist for any
30
Table of Contents
location, the estimated undiscounted future cash flows are compared to its carrying value. If the carrying value exceeds the undiscounted cash flows, an impairment charge equal to the difference between the carrying value and the fair value is recorded. The projections of future cash flows used in these analyses require the use of judgment and a number of estimates and projections of future operating results. If actual results differ from our estimates, additional charges for asset impairments may be required in the future. If future impairment charges are significant, our reported operating results would be adversely affected.
Changes to accounting rules or regulations may adversely affect our results of operations.
Changes to existing accounting rules or regulations may impact our future results of operations or cause the perception that we are more highly leveraged. Other new accounting rules or regulations and varying interpretations of existing accounting rules or regulations have occurred and may occur in the future. For example, accounting regulatory authorities have indicated that they may begin to require lessees to capitalize operating leases in their financial statements in the next few years. If adopted, such change would require us to record significant capital lease obligations on our balance sheet and make other changes to our financial statements. This and other future changes to accounting rules or regulations could materially adversely affect our business, financial condition and results of operations.
Loss of key management personnel could hurt our business and inhibit our ability to operate and grow successfully.
Our success will continue to depend, to a significant extent, on our leadership team and other key management personnel. If we are unable to attract and retain sufficiently experienced and capable management personnel, our business and financial results may suffer. If members of our leadership team or other key management personnel leave, we may have difficulty replacing them, and our business may suffer. There can be no assurance that we will be able to successfully attract and retain our leadership team and other key management personnel that we need. We also do not maintain any key man life insurance policies for any of our employees.
Our current insurance policies may not provide adequate levels of coverage against all claims, and we may incur losses that are not covered by our insurance.
We maintain insurance coverage for a significant portion of our risks and associated liabilities with respect to general liability, property and casualty liability, liquor liability, employer’s liability and other insurable risks. However, there are types of losses we may incur that cannot be insured against or that we believe are not commercially reasonable to insure. For example, insurance covering liability for violations of wage and hour laws has not generally been available. We also self-insure for workers’ compensation and health benefits under plans with high deductibles. Losses for such uninsured claims, if they occur, could have a material adverse effect on our business and results of operations.
Compliance with environmental laws may negatively affect our business.
We are subject to national, provincial, state and local laws and regulations in the United States, Brazil and Mexico concerning waste disposal, pollution, protection of the environment, and the presence, discharge, storage, handling, release and disposal of, and exposure to, hazardous or toxic substances. These environmental laws provide for significant fines and penalties for noncompliance and liabilities for remediation, sometimes without regard to whether the owner or operator of the property knew of, or was responsible for, the release or presence of hazardous toxic substances. Third parties may also make claims against owners or operators of properties for personal injuries and property damage associated with releases of, or actual or alleged exposure to, such hazardous or toxic substances at, on or from our restaurants. Environmental conditions relating to releases of hazardous substances at prior, existing or future restaurant sites could materially adversely affect our business, financial condition and results of operations. Further, environmental laws, and the administration, interpretation and enforcement thereof, are subject to change and may become more stringent in the future, each of which could materially adversely affect our business, financial condition and results of operations.
Our ability to use our net operating loss carryforwards and certain other tax attributes may be limited.
As of December 28, 2014, we had federal net operating loss carryforwards of approximately $31.5 million and state net operating loss carryforwards of approximately $22.9 million. Under Sections 382 and 383 of the Internal
31
Table of Contents
Revenue Code of 1986, as amended, or the Code, if a corporation undergoes an “ownership change,” its ability to use its prechange net operating loss carryforwards and other pre-change tax attributes to offset its post-change income may be limited. In general, an “ownership change” generally occurs if there is a cumulative change in our ownership by “5-percent shareholders” that exceeds 50 percentage points over a rolling three-year period. Similar rules may apply under state tax laws. We have experienced an ownership change in the past and may experience ownership changes in the future as a result of this issuance or future transactions in our stock, some of which may be outside our control. As a result, if we earn net taxable income, our ability to use our pre-change net operating loss carryforwards, or other prechange tax attributes, to offset US federal and state taxable income may be subject to significant limitations. As of December 28, 2014, none of the operating loss carryforwards are subject to limitation.
The amount of money that we have borrowed and may, in the future borrow, may adversely affect our financial condition and operating activities.
As of March 29, 2015, we had total aggregate principal amount of outstanding debt of approximately $247.9 million (which is reduced by outstanding letters of credit). In addition, as of March 29, 2015, on a pro forma basis after giving effect to the consummation of our initial public offering, the consummation of the refinancing of our existing Senior Credit Facilities and entry into, and effectiveness of, our New Credit Facility and our use of proceeds therefrom as set forth under “Use of Proceeds” we would have had $188.9 million of outstanding debt and $59.4 million available to be borrowed under our New Credit Facility (which is reduced by outstanding letters of credit). Our Senior Credit Facilities, our New Credit Facility and any other debt incurred in the future, may have important consequences to holders of our common stock, including the following:
| • | our ability to obtain additional financing for working capital, capital expenditures, acquisitions or other purposes may be impaired; |
| • | we may use a substantial portion of our cash flow from operations to service our indebtedness, rather than for operations or other purposes; |
| • | our level of indebtedness could place us at a competitive disadvantage compared to our competitors with proportionately less debt; and |
| • | our flexibility in planning for, or reacting to, changes in our business and the industry in which we operate may be limited. |
We expect that we will depend primarily upon cash flow from operations to pay interest and other amounts due under our New Credit Facility and any other indebtedness we may incur in the future. Our ability to make these payments depends on our future performance, which will be affected by business, financial, economic and other factors, many of which we cannot control. If we do not have sufficient funds, we may be required to refinance all or part of our then existing debt, sell assets or borrow more money. We may not be able to accomplish any of these alternatives on terms acceptable to us, if at all. In addition, the terms of existing or future debt agreements, including our Senior Credit Facilities and our New Credit Facility, may restrict us from adopting any of these alternatives.
Our Senior Credit Facilities impose, and our New Credit Facility will impose, operating and financial restrictions that may impair our ability to respond to changing business and industry conditions.
Our Senior Credit Facilities contain, and our New Credit Facility will contain, restrictions and covenants that generally limit our ability to, among other things:
| • | incur additional indebtedness; |
| • | make investments; |
| • | use assets as collateral in other transactions; |
| • | sell assets or merge with or into other companies; |
32
Table of Contents
| • | pay dividends to, or purchase stock from, our stockholders; |
| • | enter into transactions with affiliates; |
| • | sell stock or other ownership interests in our subsidiaries; and |
| • | create or permit restrictions on our subsidiaries’ ability to make payments to us. |
Our Senior Credit Facilities limit, and our New Credit Facility will limit, our ability to engage in these types of transactions even if we believed that a specific transaction would contribute to our future growth or improve our results of operations. Our Senior Credit Facilities require us to meet specified financial and operating results and maintain compliance with specified financial ratios. We are required to maintain two financial covenants, which include a Total Rent Adjusted Leverage Ratio and a Consolidated Interest Coverage Ratio (each as defined in the Senior Credit Facilities). These required ratios vary by quarter until maturity. Under the First Lien Credit Facility, we are required to maintain a maximum Total Rent Adjusted Leverage Ratio of 6.50 to 1 and a minimum Consolidated Interest Coverage Ratio of 2.05 to 1 for the first quarter of 2015 (7.00 to 1 and 1.55 to 1, respectively, under the Second Lien Credit Facility). As of March 29, 2015, our Total Rent Adjusted Leverage Ratio was 4.35 to 1 and our Consolidated Interest Coverage Ratio was 4.15 to 1 (each as defined in the Senior Credit Facilities). Under our New Credit Facility, we will be required to maintain a maximum Total Rent Adjusted Leverage Ratio (as defined under our New Credit Facility), at levels that may vary by quarter until maturity, and a minimum Consolidated Interest Coverage Ratio (as defined under our New Credit Facility), which, beginning with the third quarter ending September 27, 2015, will be 5.50 to 1 and 2.00 to 1, respectively. In addition, as of March 29, 2015, on a pro forma basis after giving effect to the consummation of our initial public offering, the consummation of the refinancing of our existing Senior Credit Facilities and entry into, and effectiveness of, our New Credit Facility and our use of proceeds therefrom as set forth under “Use of Proceeds,” our Total Rent Adjusted Leverage Ratio would have been 3.69 to 1 and our Interest Coverage Ratio would have been 13.38 to 1 (each as defined in the Senior Credit Facilities). As of the date hereof, we were in compliance with our Senior Credit Facilities’ financial covenants. However, breach of these provisions or failure to comply with these financial ratios could result in a default under the Senior Credit Facilities or our New Credit Facility, in which case our lenders would have the right to declare borrowings to be immediately due and payable. Our lenders may also accelerate payment of borrowings upon the occurrence of certain change of control events relating to us. If we are unable to repay borrowings when due, whether at maturity or following a default or change of control event, our lenders would have the right to take or sell assets pledged as collateral to secure the indebtedness. Any such actions taken by our lenders or other creditors would have a material adverse effect on our business and financial condition.
Risks Related to this Offering and Ownership of Our Common Stock
Following this offering, the THL Funds will continue to have a substantial ownership interest in our common stock. Conflicts of interest may arise because some of our directors are principals of the THL Funds.
After the consummation of this offering, the THL Funds will collectively beneficially own approximately 82% of our outstanding common stock, and approximately 80% of our outstanding common stock if the underwriters’ option to purchase additional shares is exercised in full. See “Principal Stockholders.” As a consequence, the THL Funds will be able to control matters requiring stockholder approval, including the election of directors, a merger, consolidation or sale of all or substantially all of our assets, and any other significant transaction. The interests of the THL Funds may not always coincide with our interests or the interests of our other stockholders.
The THL Funds could invest in entities that directly or indirectly compete with us. As a result of these relationships, when conflicts arise between the interests of the THL Funds and the interests of our stockholders, these directors may not be disinterested. The representatives of the THL Funds on our Board of Directors, by the terms of our amended and restated certificate of incorporation and a stockholders’ agreement that will be entered into in connection with this offering, are not required to offer us any transaction opportunity of which they become aware and could take any such opportunity for themselves or offer it to other companies in which they have an investment, unless such opportunity is expressly offered to them solely in their capacity as our directors.
33
Table of Contents
The THL Funds will own a substantial portion of our capital stock after this offering and may have conflicts of interest with other stockholders in the future.
The THL Funds will collectively beneficially own approximately 82% (or 80% if the underwriters’ option to purchase additional shares is exercised in full) of our outstanding common stock following the completion of this offering. As a result, the THL Funds could exert significant influence over, and could control, matters requiring stockholder approval, including the election of directors and approval of major corporate transactions. In addition, this concentration of ownership may delay or prevent a change of control of our company and make some transactions more difficult or impossible without the support of the THL Funds.
The interests of the THL Funds may not always be consistent with the interests of our company or of other stockholders. Accordingly, the THL Funds could cause us to enter into transactions or agreements of which holders of our common stock would not approve or make decisions with which such holders would disagree.
The THL Funds are in the business of making investments in companies and could from time to time acquire and hold interests in businesses that compete with us. The THL Funds may also pursue acquisition opportunities that may be complementary to our business, and as a result, desirable acquisitions may not be available to us.
An active market for our common stock may not develop, which could make it difficult for you to sell your shares at or above the initial public offering price.
Prior to this offering, there has been no public market for shares of our capital stock. We have applied to list our common stock on the NASDAQ under the symbol “FOGO.” However, we cannot assure you that an active public trading market for our common stock will develop on that exchange or elsewhere or, if developed, that any market will be active or sustained. Accordingly, we cannot assure you as to the liquidity of any such market, your ability to sell your shares of common stock or the prices that you may obtain upon sale of your shares. As a result, you could lose all or part of your investment in our common shares.
We will be a “controlled company” within the meaning of NASDAQ rules and, as a result, will be exempt from certain corporate governance requirements.
Upon completion of this offering, the THL Funds will continue to hold capital stock representing a majority of our outstanding voting power. So long as the THL Funds maintain holdings of more than 50% of the voting power of our capital stock, we will be a “controlled company” within the meaning of NASDAQ corporate governance standards. Under these standards, a company need not comply with certain corporate governance requirements, including:
| • | the requirement that a majority of our board of directors consist of “independent directors” as defined under NASDAQ rules; |
| • | the requirement that we have a compensation committee that is composed entirely of independent directors with a written charter addressing the committee’s purpose and responsibilities; |
| • | the requirement that we have a nominating and corporate governance committee that is composed entirely of independent directors with a written charter addressing the committee’s purpose and responsibilities, or otherwise have director nominees selected by vote of a majority of the independent directors; and |
| • | the requirement for an annual performance evaluation of the nominating and corporate governance and compensation committees. |
If we are eligible to do so following this offering, we intend to utilize these exemptions. As a result, we would not have a majority of independent directors on our board of directors and our compensation committee and nominating and corporate governance committee would not consist entirely of independent directors and will not be subject to annual performance evaluations. If we are no longer eligible to rely on the controlled company exception, we will comply with all applicable NASDAQ corporate governance requirements, but we will be able to rely on phase-in periods for certain of these requirements in accordance with NASDAQ rules. Accordingly, our stockholders may not have the same protections afforded to stockholders of companies that are subject to all NASDAQ corporate governance requirements.
34
Table of Contents
The market price of our common stock may decline, and you could lose all or a significant part of your investment.
The initial public offering price for our common stock was determined by negotiations between us and the underwriters and does not purport to be indicative of market prices after this offering. The market price of, and trading volume for, our common stock may be influenced by many factors, some of which are beyond our control, including, among others, the following:
| • | variations in our quarterly or annual operating results; |
| • | changes in our earnings estimates (if provided) or differences between our actual financial and operating results and those expected by investors and analysts; |
| • | initiatives undertaken by our competitors, including, for example, the opening of restaurants in our existing markets; |
| • | actual or anticipated fluctuations in our or our competitors’ results of operations, and our and our competitors’ growth rates; |
| • | the failure of securities analysts to cover our common stock after this offering, or changes in estimates by analysts who cover us and competitors in our industry; |
| • | recruitment or departure of key personnel; |
| • | adoption or modification of laws, regulations, policies, procedures or programs applicable to our business or announcements relating to these matters; |
| • | any increased indebtedness we may incur in the future; |
| • | actions by shareholders; |
| • | announcements by us or our competitors of significant contracts, acquisitions, dispositions, strategic relationships, joint ventures or capital commitments; |
| • | the expiration of lock-up agreements entered into by our existing stockholders in connection with this offering; |
| • | economic conditions; |
| • | geopolitical incidents; and |
| • | investor perceptions of us, our competitors and our industry. |
As a result of these and other factors, investors in our common stock may experience a decrease, which could be substantial, in the value of their investment, including decreases unrelated to our financial performance or prospects.
The market price and trading volume of our common stock may be volatile, which could result in rapid and substantial losses for our stockholders and you may lose all or part of your investment.
Even if an active trading market develops, the market price of our common stock may be highly volatile and could be subject to wide fluctuations. In addition, the trading volume in our common stock may fluctuate and cause significant price variations to occur. If the market price of our common stock declines significantly, you may be unable to resell your shares at or above your purchase price, if at all. The market price of our common stock may fluctuate or decline significantly in the future and you could lose all or part of your investment.
35
Table of Contents
Certain broad market and industry factors may materially decrease the market price of our common stock, regardless of our actual operating performance. The stock market in general has from time to time experienced extreme price and volume fluctuations, including recently. In addition, in the past, following periods of volatility in the overall market and decreases in the market price of a company’s securities, securities class action litigation has often been instituted against these companies. This litigation, if instituted against us, could result in substantial costs and a diversion of our management’s attention and resources.
Future sales of our common stock could cause the market price of such shares to fall.
If our existing stockholders sell substantial amounts of our common stock following this offering, the market price of our common stock could decrease significantly. The perception in the public market that major stockholders might sell substantial amounts of our common stock could also depress the market price of our common stock.
Immediately after completion of this offering, we will have 27,253,018 shares of common stock outstanding, including shares that will be beneficially owned by the THL Funds. In general, the common stock sold in this offering will be freely transferable without restriction or additional registration under the Securities Act of 1933, as amended, or the Securities Act. In addition, under lock-up agreements entered into by us, our officers, directors and holders of all or substantially all our outstanding common stock in connection with this offering, the remaining shares of our common stock outstanding immediately after this offering will become eligible for sale in the public markets from time to time, subject to Securities Act restrictions, following expiration of an 180-day lock-up period.
Jefferies LLC and J.P. Morgan Securities LLC may, in their sole discretion and at any time or from time to time, without notice, release all or any portion of the shares of common stock subject to the lock-up agreements for sale in the public and private markets prior to expiration of the 180-day lock-up period. The market price for our common stock may drop significantly when the restrictions on resale by our existing stockholders lapse or if those restrictions on resale are waived. A decline in the market price of our common stock might impede our ability to raise capital through the issuance of additional shares of our common stock or other equity securities.
Future offerings of equity by us may adversely affect the market price of our common stock.
In the future, we may attempt to obtain financing or to further increase our capital resources by issuing additional shares of our common stock or by offering debt or other equity securities, including senior or subordinated notes, debt securities convertible into equity or shares of preferred stock. Opening new restaurants in existing and new markets could require substantial additional capital in excess of cash from operations. We would expect to finance the capital required for new restaurants through a combination of additional issuances of equity, corporate indebtedness and cash from operations.
Issuing additional shares of our common stock or other equity securities or securities convertible into equity may dilute the economic and voting rights of our existing stockholders or reduce the market price of our common stock or both. Upon liquidation, holders of such debt securities and preferred shares, if issued, and lenders with respect to other borrowings would receive a distribution of our available assets prior to the holders of our common stock. Debt securities convertible into equity could be subject to adjustments in the conversion ratio pursuant to which certain events may increase the number of equity securities issuable upon conversion. Preferred shares, if issued, could have a preference with respect to liquidating distributions or a preference with respect to dividend payments that could limit our ability to pay dividends to the holders of our common stock. Our decision to issue securities in any future offering will depend on market conditions and other factors beyond our control, which may adversely affect the amount, timing or nature of our future offerings. Thus, holders of our common stock bear the risk that our future offerings may reduce the market price of our common stock and dilute their stockholdings in us. See “Description of Capital Stock.”
We do not intend to pay cash dividends for the foreseeable future.
We intend to retain all of our earnings for the foreseeable future to fund the operation and growth of our business and to repay indebtedness, and therefore, we do not anticipate paying any cash dividends to holders of our capital stock for the foreseeable future. Any future determination regarding the payment of any dividends will be made at the discretion of our board of directors and will depend on our financial condition, results of operations, capital
36
Table of Contents
requirements, liquidity, contractual restrictions, general business conditions and other factors that our board of directors may deem relevant. Consequently, investors must rely on sales of their common stock after price appreciation, which may never occur, as the only way to realize any future gains on their investment. Investors seeking cash dividends should not invest in our common stock.
Our future capital requirements are uncertain, and we may have difficulty raising money in the future on acceptable terms, if at all.
Our capital requirements depend on many factors, including the amounts required to open new restaurants and to service our indebtedness. To the extent that our capital resources are insufficient to meet these requirements, we may need to raise additional funds through financings or curtail our growth, reduce our costs and expenses, or sell certain of our assets. Any additional equity offerings or debt financings may be on terms that are not favorable to us. Equity offerings could result in dilution to our stockholders, and equity or debt securities issued in the future may have rights, preferences and privileges that are senior to those of our common stock. If our need for capital arises because of significant losses, the occurrence of these losses may make it more difficult for us to raise the necessary capital.
Purchasers of common stock in this offering will experience immediate and substantial dilution.
If you purchase shares of our common stock in this offering, the value of those shares based on our book value will immediately be less than the price you paid. This reduction in the value of your shares is known as dilution. Dilution occurs mainly because our earlier investors paid substantially less than the initial public offering price when they acquired their shares of our capital stock. If you purchase shares in this offering, you will incur immediate dilution of $20.85 in the net tangible book value per share. In addition, if we raise funds through equity offerings in the future, the newly issued shares will further dilute your percentage ownership interest in our company.
As a result of the completion of this offering, we will record a significant non-cash equity-based compensation charge due to the vesting of stock option rights and we may record a significant loss in the fiscal quarter in which this offering is completed.
Certain of our executive officers and employees have been granted stock options pursuant to our 2012 Plan. Of the 2,197,382 stock options outstanding as of May 1, 2015, 2,177,222 have performance-based vesting conditions and do not vest until the completion of a liquidity event occurs. We account for stock options granted to employees and directors with performance-based vesting conditions in accordance with Accounting Standards Codification Topic 718, Compensation—Stock Compensation (“ASC 718”). In accordance with ASC 718, we do not recognize compensation expense for awards with performance-based vesting conditions until the outcome of such performance condition becomes probable. Accordingly, upon the completion of this offering, we will record a non-cash equity-based compensation charge of approximately $5.7 million. As a result, we may incur a net loss during the fiscal quarter in which this offering is completed.
Provisions of our charter documents, Delaware law and other documents could discourage, delay or prevent a merger or acquisition at a premium price.
Our amended and restated certificate of incorporation and bylaws include provisions that:
| • | permit us to issue preferred stock in one or more series and, with respect to each series, fix the number of shares constituting the series and the designation of the series, the voting powers, if any, of the shares of the series and the preferences and other special rights, if any, and any qualifications, limitations or restrictions, of the shares of the series; |
| • | restrict the ability of stockholders to act by written consent or to call special meetings; |
| • | require the affirmative vote of 662/3% of the outstanding shares entitled to vote to approve certain transactions or to amend certain provisions of our certificate of incorporation or bylaws; |
| • | limit the ability of stockholders to amend our certificate of incorporation and bylaws; |
37
Table of Contents
| • | require advance notice for nominations for election to the board of directors and for stockholder proposals; and |
| • | establish a classified board of directors with staggered three-year terms. |
These provisions may discourage, delay or prevent a merger or acquisition of our company, including a transaction in which the acquiror may offer a premium price for our common stock.
Our 2012 Plan also permits vesting of stock options and restricted stock, and payments to be made to the employees thereunder, in connection with a change of control of our company, which could discourage, delay or prevent a merger or acquisition at a premium price. In addition, our Senior Credit Facilities include, and our New Credit Facility will include, and other debt incurred by us in the future may include, provisions entitling the lenders to demand immediate repayment of borrowings upon the occurrence of certain change of control events relating to our company, which also could discourage, delay or prevent a business combination transaction.
The market price of our common stock could decline if securities or industry analysts do not publish research or reports about our company or if they downgrade us or other restaurant companies in our industry.
The market price of our common stock will depend, in part, on the research and reports that securities or industry analysts publish about us or our business. We do not influence or control the reporting of these analysts. In addition, if no analysts provide coverage of our company or if one or more of the analysts who do cover us downgrade shares of our company or other companies in our industry, the market price of our common stock could be negatively impacted. If one or more of these analysts cease coverage of our company, we could lose visibility in the market, which could, in turn, cause the market price of our common stock to decline.
We may be required to make payments to the underwriters if participants in our directed share program fail to pay for and accept shares that were subject to properly confirmed orders.
At our request, the underwriters have reserved for sale to our directors, officers, certain employees and certain other related parties at the initial public offering price up to 5% of the shares of our common stock being offered in this offering. We do not know if any of these persons will choose to purchase all or any portion of the reserved shares, but any purchases made by them will reduce the number of shares available to the general public. If all of these reserved shares are not purchased, the underwriters will offer the remainder to the general public on the same terms as the other shares of our common stock in this offering. In connection with the sale of these reserved shares, we have agreed to indemnify the underwriters against certain liabilities, including those that may be caused by the failure of the participants in the directed share program to pay for and accept delivery of shares of our common stock which were subject to a properly confirmed agreement to purchase. As a result, if participants in the directed share program fail to pay for and accept delivery of the shares of our common stock which they agreed to purchase, we will be required to indemnify the underwriters for losses incurred by them as a result of such failure.
The future issuance of additional common stock in connection with our incentive plans, acquisitions or otherwise will dilute all other stockholdings.
After this offering, assuming the underwriters exercise their option to purchase additional shares in full, we will have an aggregate of 1,200,000 shares of common stock authorized but unissued and not reserved for issuance under our incentive plans (including 138,000 shares of our common stock issuable upon the exercise of stock options we expect to grant to employees upon the closing of this offering at an exercise price per share equal to the initial public offering price). We may issue all of these shares of common stock without any action or approval by our stockholders, subject to certain exceptions. Any common stock issued in connection with our incentive plans, the exercise of outstanding stock options or otherwise would dilute the percentage ownership held by the investors who purchase common stock in this offering.
Our costs could increase significantly as a result of operating as a public company, and our management will be required to devote substantial time to complying with public company regulations.
As a public company and particularly after we cease to be an “emerging growth company” (to the extent that we take advantage of certain exceptions from reporting requirements that are available under the JOBS Act as an “emerging growth company”), we could incur significant legal, accounting and other expenses not presently incurred.
38
Table of Contents
In addition, Sarbanes-Oxley, as well as rules promulgated by the SEC and the NASDAQ, require us to adopt corporate governance practices applicable to US public companies. These rules and regulations may increase our legal and financial compliance costs.
Sarbanes-Oxley, as well as rules and regulations subsequently implemented by the SEC and the NASDAQ, have imposed increased disclosure and enhanced corporate governance practices for public companies. We are committed to maintaining high standards of corporate governance and public disclosure, and our efforts to comply with evolving laws, regulations and standards are likely to result in increased expenses and a diversion of management’s time and attention from revenue-generating activities to compliance activities. We may not be successful in implementing these requirements and implementing them could adversely affect our business, results of operations and financial condition. In addition, if we fail to implement the requirements with respect to our internal accounting and audit functions, our ability to report our financial results on a timely and accurate basis could be impaired.
We are an “emerging growth company” and may elect to comply with reduced reporting requirements applicable to emerging growth companies, which could make our common stock less attractive to investors.
We are an “emerging growth company,” as defined in the JOBS Act, and we may take advantage of certain exemptions from various reporting requirements that are applicable to other public companies that are not emerging growth companies, including, but not limited to, not being required to comply with the auditor attestation requirements of Section 404 of Sarbanes-Oxley, reduced disclosure obligations regarding executive compensation in our periodic reports and proxy statements, and exemptions from the requirements of holding a nonbinding advisory vote on executive compensation and shareholder approval of any golden parachute payments not previously approved. In addition, even if we comply with the greater obligations of public companies that are not emerging growth companies immediately after the initial public offering, we may avail ourselves of the reduced requirements applicable to emerging growth companies from time to time in the future. We cannot predict if investors will find our common stock less attractive if we choose to rely on these exemptions. If some investors find our common stock less attractive as a result, there may be a less active trading market for our common stock and our stock price may be more volatile.
Section 107 of the JOBS Act also provides that an “emerging growth company” can take advantage of the extended transition period provided in Section 7(a)(2)(B) of the Securities Act for complying with new or revised accounting standards. However, we are choosing to opt out of any extended transition period, and as a result we will comply with new or revised accounting standards on the relevant dates on which adoption of such standards is required for non-emerging growth companies. Section 107 of the JOBS Act provides that our decision to opt out of the extended transition period for complying with new or revised accounting standards is irrevocable.
We will remain an “emerging growth company” for up to five years, or until the earliest of (i) the last day of the first fiscal year in which our annual gross revenues exceed $1 billion, (ii) the date that we become a “large accelerated filer” as defined in Rule 12b-2 under the Securities Exchange Act of 1934, as amended (the “Exchange Act”), which would occur if the market value of our common stock that is held by non-affiliates exceeds $700 million as of the last business day of our most recently completed second fiscal quarter, or (iii) the date on which we have issued more than $1 billion in non-convertible debt during the preceding three year period.
We have identified material weaknesses in our internal control over financial reporting, and if we are unable to establish and maintain effective internal controls in accordance with Section 404 of the Sarbanes-Oxley Act it could have a material adverse effect on our business and stock price.
We are not currently required to comply with the rules of the SEC implementing Section 404 of the Sarbanes-Oxley Act and therefore are not required to make a formal assessment of the effectiveness of our internal control over financial reporting for that purpose. Upon the completion of this offering, we will be required to comply with the SEC’s rules implementing Section 302 and 404 of the Sarbanes-Oxley Act, which will require management to certify financial and other information in our quarterly and annual reports and provide an annual management report on the effectiveness of control over financial reporting. Though we will be required to disclose changes made in our internal controls and procedures on a quarterly basis, we will not be required to make our first annual assessment of our internal control over financial reporting pursuant to Section 404 until the year following our first annual report required to be filed with the
39
Table of Contents
SEC. In order to have effective internal control over financial reporting, we will need to implement additional control activities, implement restricted access and other IT general controls, write and implement formal accounting policies, and hire additional qualified accounting, financial, and legal staff. Pursuant to the JOBS Act, our independent registered public accounting firm will not be required to attest to the effectiveness of our internal control over financial reporting until the later of the year following our first annual report required to be filed with the SEC or the date we are no longer an emerging growth company, which may be up to five full fiscal years following this offering.
In connection with the audit of our financial statements for the period ended December 29, 2013, for the Successor period from May 24, 2012 to December 30, 2012, and the Predecessor period from January 2, 2012 to July 20, 2012, we and our independent registered public accounting firm identified material weaknesses in internal control over financial reporting. A “material weakness” is a deficiency, or a combination of deficiencies, in internal control over financial reporting such that there is a reasonable possibility that a material misstatement of our annual or interim financial statements will not be prevented or detected on a timely basis. In particular, we did not design an effective control environment with sufficient personnel with the appropriate level of accounting knowledge, experience and training to assess the completeness and accuracy of the technical accounting matters, principally related to accounting for business combinations and accounting for modifications of debt instruments, nor did we have a sufficient number of accounting personnel to allow for appropriate segregation of duties or thorough review and supervision of our financial closing process. We also did not design, maintain or implement effective control activities relating to formal accounting policies. Specifically, we did not design, maintain or implement policies and procedures to adequately review and account for transactions that arise in the normal course of business, which limited our ability to make accounting decisions and to detect and correct accounting errors.
The lack of adequate staffing levels and effective policies and controls resulted in several audit adjustments and a restatement of our operating subsidiary financial statements for the Successor period ended December 30, 2012 and the Predecessor period ended July 20, 2012. Additionally, these resulted in a revision to our December 29, 2013 consolidated financial statements. As of the date hereof, we have not fully re-designed, implemented and tested internal controls to remediate the material weaknesses. While we have begun the process of evaluating the design and operation of our internal control over financial reporting, we are in the early phases and may not complete our evaluation until after this offering is completed. We cannot predict the outcome of our evaluation at this time. During the course of the evaluation, we may identify additional control deficiencies, which could give rise to other material weaknesses, in addition to the material weaknesses described above. Each of the material weaknesses described above or any newly identified material weakness could result in a misstatement of our financial statements or disclosures that would result in a material misstatement of our annual or interim consolidated financial statements that would not be prevented or detected.
We have taken initial steps to remediate the material weaknesses such as hiring additional accounting personnel in Fiscal 2014, including a chief financial officer, a director of financial reporting and a corporate treasury analyst. We cannot be certain that these measures will successfully remediate the material weaknesses or that other material weaknesses and control deficiencies will not be discovered in the future. If our efforts are not successful or other material weaknesses or control deficiencies occur in the future, we may be unable to report our financial results accurately on a timely basis or help prevent fraud, which could cause our reported financial results to be materially misstated and result in the loss of investor confidence or delisting and cause the market price of our common stock to decline.
Internal control over financial reporting has inherent limitations. Internal control over financial reporting is a process that involves human diligence and compliance and is subject to lapses in judgment and breakdowns resulting from human failures. Internal control over financial reporting also can be circumvented by collusion or improper management override. Because of such limitations, there is a risk that material misstatements will not be prevented or detected on a timely basis by internal control over financial reporting. However, these inherent limitations are known features of the financial reporting process. Therefore, it is possible to design into the process safeguards to reduce, though not eliminate, this risk. If we are unable to maintain proper and effective internal controls, we may not be able to produce timely and accurate financial statements, and we and our independent registered public accounting firm may conclude that our internal control over financial reporting is not effective. If that were to happen, the market price of our stock could decline and we could be subject to sanctions or investigations by the SEC or other regulatory authorities. Testing and maintaining internal controls could also divert our management’s attention from other matters that are important to the operation of our business.
40
Table of Contents
SPECIAL NOTE REGARDING FORWARD-LOOKING STATEMENTS
Some of the statements contained in this prospectus constitute forward-looking statements. Forward-looking statements relate to expectations, beliefs, projections, future plans and strategies, anticipated events or trends and similar expressions concerning matters that are not historical facts, such as statements regarding our future financial condition or results of operations, our prospects and strategies for future growth, the development and introduction of new products, and the implementation of our marketing and branding strategies. In many cases, you can identify forward-looking statements by terms such as “may,” “will,” “should,” “expects,” “plans,” “anticipates,” “believes,” “estimates,” “predicts,” “potential,” “seeks,” “intends,” “targets” or the negative of these terms or other comparable terminology.
The forward-looking statements contained in this prospectus reflect our current views about future events and are subject to risks, uncertainties, assumptions and changes in circumstances that may cause events or our actual activities or results to differ significantly from those expressed in any forward-looking statement. Although we believe that our assumptions are reasonable, we cannot guarantee future events, results, actions, levels of activity, performance or achievements. Readers are cautioned not to place undue reliance on these forward-looking statements. A number of important factors could cause actual results to differ materially from those indicated by the forward-looking statements, including, but not limited to, those factors described in “Risk Factors” and “Management’s Discussion and Analysis of Financial Condition and Results of Operations.” These factors include without limitation:
| • | changes in general economic or market conditions, both in the United States and Brazil; |
| • | increased competition in our industry; |
| • | risk associated with our Brazilian operations and any other future international operations; |
| • | our ability to manage operations at our current size or manage growth effectively; |
| • | our ability to successfully expand in the United States and other new markets; |
| • | our ability to locate suitable locations to open new restaurants and to attract guests to our restaurants; |
| • | the fact that we will rely on our operating subsidiaries to provide us with distributions to fund our operating activities, which could be limited by law, regulation or otherwise; |
| • | our ability to continually innovate and provide our consumers with innovative dining experiences; |
| • | our ability to maintain recent levels of comparable revenue or average revenue per square foot; |
| • | the ability of our suppliers to deliver beef in a timely or cost-effective manner; |
| • | our lack of long-term supplier contracts, our concentration of suppliers and distributors and potential increases in the price of beef; |
| • | our ability to raise money and maintain sufficient levels of cash flow; |
| • | conflicts of interest with the THL Funds; |
| • | the fact that upon listing of our common stock, we will be considered a “controlled company” and exempt from certain corporate governance rules primarily relating to board independence, and we intend to use some or all of these exemptions; |
| • | our entry into, and effectiveness of, our New Credit Facility and the terms and conditions we will be subject to thereunder; |
| • | our ability to effectively market and maintain a positive brand image; |
| • | changes in government regulation |
| • | our ability to attract and maintain the services of our senior management and key employees; |
41
Table of Contents
| • | the availability and effective operation of management information systems and other technology; |
| • | changes in consumer preferences or changes in demand for upscale dining experiences; |
| • | our ability to accurately anticipate and respond to seasonal or quarterly fluctuations in our operating results; |
| • | our ability to maintain effective internal controls or the identification of additional material weaknesses; |
| • | our expectations regarding the time during which we will be an emerging growth company under the JOBS Act; |
| • | changes in accounting standards; and |
| • | other risks described in the “Risk Factors” section of this prospectus. |
Although we believe that the assumptions inherent in the forward-looking statements contained in this prospectus are reasonable, undue reliance should not be placed on these statements, which only apply as of the date hereof. Except as required by applicable securities law, we undertake no obligation to update any forward-looking statement to reflect events or circumstances after the date on which the statement is made or to reflect the occurrence of unanticipated events.
42
Table of Contents
We estimate that the net proceeds to us from this offering will be approximately $66.9 million, or $77.4 million if the underwriters exercise their option to purchase additional shares in full, based upon an assumed initial public offering price of $17.00 per share of common stock, the midpoint of the price range on the cover of this prospectus, and after deducting estimated underwriting discounts and commissions and estimated offering expenses payable by us.
A $1.00 increase or decrease in the assumed initial public offering price of $17.00 per share would increase or decrease, respectively, the net proceeds to us from this offering by approximately $4.1 million, assuming the number of shares offered by us, as set forth on the cover of this prospectus, remains the same and after deducting estimated underwriting discounts and commissions and estimated offering expenses payable by us.
We intend to use the net proceeds of this offering, together with borrowings under our New Credit Facility, to repay the outstanding indebtedness under our Senior Credit Facilities and to pay fees and expenses related to our initial public offering and the refinancing of our Senior Credit Facilities. Affiliates of certain of the underwriters are lenders under our First Lien Credit Facility and will be repaid with a portion of the proceeds of this offering. Because affiliates of Credit Suisse Securities (USA) LLC and Wells Fargo Securities, LLC are lenders under our First Lien Credit Facility and each will receive 5% or more of the net proceeds of this offering, Credit Suisse Securities (USA) LLC and Wells Fargo Securities, LLC are each deemed to have a “conflict of interest” under Rule 5121 of the Financial Industry Regulatory Authority, Inc., or FINRA. As a result, this offering will be conducted in accordance with FINRA Rule 5121. Pursuant to that rule, the appointment of a “qualified independent underwriter” is not required in connection with this offering as the members primarily responsible for managing the public offering do not have a conflict of interest, are not affiliates of any member that has a conflict of interest and meet the requirements of paragraph (f)(12)(E) of FINRA Rule 5121. See “Use of Proceeds” and “Underwriting (Conflicts of Interest).”
43
Table of Contents
We do not expect to pay dividends on our common stock for the foreseeable future. Instead, we anticipate that all of our earnings in the foreseeable future, if any, will be used for the operation and growth of our business or to repay indebtedness.
Any future determination to declare and pay cash dividends will be at the discretion of our board of directors and will depend on, among other things, our financial condition, results of operations, cash requirements, liquidity, contractual restrictions, restrictions imposed by our current and future financing arrangements and such other factors as our board of directors deems relevant. The terms of our Senior Credit Facilities also restrict, and the terms of our New Credit Facility will restrict, our ability to pay dividends on our common stock. See “Management’s Discussion and Analysis of Financial Condition and Results of Operations—Senior Credit Facilities.”
Accordingly, you may need to sell your shares of our common stock to realize a return on your investment, and you may not be able to sell your shares at or above the price you paid for them. See “Risk Factors—Risks Related to This Offering and Ownership of Our Common Stock—We do not intend to pay cash dividends for the foreseeable future.”
44
Table of Contents
The following table describes our cash and cash equivalents and capitalization as of March 29, 2015. Our capitalization is presented:
| • | on an actual basis; and |
| • | on a pro forma basis, reflecting (i) the consummation of a stock split effected upon the closing of this offering pursuant to which each share held by the holder of common stock will be reclassified into 25.4588 shares, (ii) the sale by us of 4,411,764 shares of our common stock in this offering at the assumed initial public offering price of $17.00 per share of common stock, the midpoint of the price range on the cover of this prospectus, and after deducting estimated offering expenses and estimated underwriting discounts and commissions payable by us, (iii) the consummation of the refinancing of our existing Senior Credit Facilities and entry into, and effectiveness, of our New Credit Facility, (iv) the application of the net proceeds from our initial public offering and borrowings under our New Credit Facility as set forth under “Use of Proceeds” and (v) the termination of the advisory services agreement between us and an affiliate of THL and the one-time termination fee paid by us to an affiliate of THL upon the consummation of this offering as set forth under the section “Unaudited Pro Forma Consolidated Financial Statements.” |
You should read the information below with the sections entitled “Use of Proceeds,” “Selected Historical Consolidated Financial Information,” “Management’s Discussion and Analysis of Financial Condition and Results of Operations,” “Unaudited Pro Forma Consolidated Financial Statements,” “Description of Capital Stock” and our consolidated financial statements and the related notes included elsewhere in this prospectus.
| As of March 29, 2015 | ||||||||
| Actual | Pro Forma(1) | |||||||
| (dollars in thousands) | ||||||||
| Cash and cash equivalents |
$ | 17,304 | $ | 17,304 | ||||
|
|
|
|
|
|||||
| Debt: |
||||||||
| Revolving line of credit |
$ | — | $ | — | ||||
| First Lien Term Loan |
218,975 | — | ||||||
| Second Lien Term Loan |
23,783 | — | ||||||
| New Credit Facility(2) |
— | 188,884 | ||||||
|
|
|
|
|
|||||
| Total debt, including current portion(3) |
242,758 | 188,884 | ||||||
| Equity(4): |
||||||||
| Fogo de Chão, Inc. shareholders’ equity |
||||||||
| Preferred stock, $0.01 par value; no shares authorized, actual; 15,000,000 shares authorized, none issued and outstanding pro forma |
— | — | ||||||
| Common stock, $0.01 value; 1,200,000 shares authorized, 897,184 issued and outstanding, actual; 200,000,000 authorized, 27,253,018 issued and outstanding, pro forma |
9 | 272 | ||||||
| Additional paid-in capital |
176,637 | 243,324 | ||||||
| Retained earnings |
12,251 | 3,312 | ||||||
| Accumulated other comprehensive loss |
(45,175 | ) | (45,175 | ) | ||||
|
|
|
|
|
|||||
| Total Fogo de Chão, Inc. shareholders’ equity |
143,722 | 201,733 | ||||||
| Noncontrolling interest |
2,174 | 2,174 | ||||||
|
|
|
|
|
|||||
| Total equity |
145,896 | 203,907 | ||||||
|
|
|
|
|
|||||
| Total capitalization |
$ | 388,654 | $ | 392,791 | ||||
|
|
|
|
|
|||||
| (1) | A $1.00 increase or decrease in the assumed public offering price of $17.00 per share of common stock, the midpoint of the price range on the cover of this prospectus, would increase or decrease, respectively, each of additional paid-in capital, total stockholders’ equity and total capitalization by $4.1 million, assuming the number of shares offered by us, as set forth on the cover page of this prospectus, remains the same and after deducting estimated underwriting discounts and commissions and estimated offering expenses payable by us. |
| (2) | Concurrently with the consummation of our initial public offering, we intend to refinance our existing Senior Credit Facilities and enter into the New Credit Facility. We expect that the loans under our New Credit Facility will bear interest at a base rate plus a margin ranging from 0.50% to 1.50% or at LIBOR plus a margin ranging from 1.50% to 2.50% and will mature in 2020. Borrowings under our New Credit Facility may vary significantly from time to time depending on our cash needs at any given time, and upon consummation of our initial public offering we expect that approximately $188.9 million will be drawn under our New Credit Facility. |
45
Table of Contents
| (3) | As of March 29, 2015, total debt was comprised of: (i) our $25 million revolving line of credit, (ii) our $224 million First Lien Credit Facility, and (iii) our $25 million Second Lien Credit Facility. As of March 29, 2015, we had letters of credit and letters of guaranty totaling $1.7 million, which reduces the aggregate amount eligible to be drawn under our revolving line of credit by a corresponding amount. As of March 29, 2015, the total amount available to be borrowed under our revolving line of credit was approximately $23.3 million. On a pro forma basis, total debt would have been comprised of our New Credit Facility. As of March 29, 2015, on a pro forma basis, the total amount that would have been available to be borrowed under our New Credit Facility would have been approximately $59.4 million. |
| (4) | Actual amounts do not give effect to the consummation of the stock split to be effected upon the closing of this offering. |
46
Table of Contents
If you invest in our common stock in this offering, your interest will be diluted to the extent of the difference between the initial public offering price per share of our common stock and the pro forma net tangible book value per share of our common stock after this offering.
Our historical net tangible book value as of March 29, 2015 was approximately $(164.7) million, or approximately $(183.59) per share (without giving any effect to the consummation of the stock split to be effected upon the closing of this offering). Historical net tangible book value per share is determined by dividing the amount of our net tangible book value, or total tangible assets less total liabilities, as of March 29, 2015 by the number of shares of our common stock outstanding as of March 29, 2015.
Dilution to new investors represents the difference between the amount per share paid by investors in this offering and the pro forma net tangible book value per share of our common stock immediately after the completion of this offering. After giving effect to (i) the consummation of a stock split effected upon the closing of this offering pursuant to which each share held by the holder of common stock will be reclassified into 25.4588 shares, (ii) our sale of the shares offered hereby at an assumed initial public offering price of $17.00 per share of common stock, the midpoint of the price range on the cover of this prospectus, and after deducting estimated underwriting discounts and commissions and estimated offering expenses payable by us, (iii) the consummation of the refinancing of our existing Senior Credit Facilities and entry into, and effectiveness, of our New Credit Facility, (iv) the application of the net proceeds therefrom as set forth under “Use of Proceeds” and (v) the termination of the advisory services agreement between us and an affiliate of THL and the one-time termination fee paid by us upon the consummation of this offering, our pro forma net tangible book value as of March 29, 2015 would have been $(105.0) million, or $(3.85) per share. This represents an immediate increase in pro forma net tangible book value of $179.74 per share to existing stockholders and an immediate dilution in pro forma net tangible book value of $20.85 per share to new investors. The following table illustrates this per share dilution:
| Assumed initial public offering price per share |
$ | 17.00 | ||||||
| Historical net tangible book value per share as of March 29, 2015 |
$ | (183.59 | ) | |||||
| Increase in historical net tangible book value per share attributable to new investors |
179.74 | |||||||
|
|
|
|||||||
| Pro forma net tangible book value per share after this offering |
(3.85 | ) | ||||||
|
|
|
|||||||
| Dilution in pro forma net tangible book value per share to new investors |
$ | 20.85 | ||||||
|
|
|
A $1.00 increase (decrease) in the assumed public offering price of $17.00 per share of common stock, the midpoint of the price range on the cover of this prospectus, would increase (decrease) our pro forma net tangible book value after this offering by $4.1 million, our pro forma net tangible book value per share after this offering by $0.15 per share of common stock, and the dilution in pro forma net tangible book value to new investors in this offering by $0.85 per share of common stock, assuming the number of shares on the cover of this prospectus remains the same.
If the underwriters’ option to purchase additional shares is fully exercised, the pro forma net tangible book value per share after this offering as of March 29, 2015, would be approximately $(3.39) per share and the dilution to new investors per share after this offering would be $20.39 per share.
The following table sets forth, on a pro forma basis as of March 29, 2015, the total number of shares of common stock purchased from us, the total consideration paid to us and the average price per share paid to us by existing stockholders and by new investors who purchase shares of common stock in this offering, before deducting the estimated underwriting discounts and commissions and estimated offering expenses payable by us, assuming an initial public offering price of $17.00 per share of common stock, the midpoint of the price range on the cover of this prospectus and before deducting estimated underwriting discounts and commissions and estimated offering expenses payable by us:
| Shares Purchased | Total Consideration | Average Price | ||||||||||||||||||
| (dollars in thousands) | Number | Percent | Amount | Percent | Per Share | |||||||||||||||
| Existing stockholders |
22,841,254 | 83.8 | % | $ | 172,351 | 69.7 | % | $ | 7.55 | |||||||||||
| New investors |
4,411,764 | 16.2 | % | $ | 75,000 | 30.3 | % | $ | 17.00 | |||||||||||
|
|
|
|
|
|
|
|
|
|||||||||||||
| Total |
27,253,018 | 100.0 | % | $ | 247,351 | 100.0 | % | |||||||||||||
|
|
|
|
|
|
|
|
|
|||||||||||||
47
Table of Contents
A $1.00 increase (decrease) in the assumed public offering price of $17.00 per share of common stock, the midpoint of the price range on the cover of this prospectus, would increase (decrease) total consideration paid by new investors by approximately $4.4 million, and increase (decrease) the percent of total consideration paid by all new investors by 1.2% (assuming the number of shares on the cover of this prospectus remains the same).
Upon completion of this offering, our existing stockholders will own 83.8%, and new investors will own 16.2% of the total number of shares of common stock outstanding after this offering. If the underwriters exercise their option to purchase additional shares in full, our existing stockholders would own 81.8%, and new investors would own 18.2%, of the total number of shares of common stock outstanding after this offering.
The foregoing tables and calculations assume no exercise of any stock-based awards outstanding as of March 29, 2015. Specifically, these tables and calculations exclude 2,247,790 shares of our common stock issuable upon exercise of outstanding options at a weighted average exercise price of $10.21 per share and 317,799 shares of unvested restricted stock outstanding as of March 29, 2015. If all of these awards were exercised and vested, then:
| • | pro forma net tangible book value per share would increase to $(2.75) and would decrease dilution to new investors by $1.10 per share; and |
| • | our existing stockholders, including the holders of these options, would own 85.2%, and our new investors would own 14.8%, of the total number of shares of our common stock outstanding upon the completion of this offering. |
48
Table of Contents
SELECTED HISTORICAL CONSOLIDATED FINANCIAL INFORMATION
The following tables present selected historical consolidated financial information of the Company (Successor) as of March 29, 2015 and for the thirteen week periods ended March 29, 2015 and March 30, 2014, as of December 28, 2014 and December 29, 2013, and for the fiscal years ended December 28, 2014 and December 29, 2013 and for the period from May 24, 2012 to December 30, 2012 and selected historical consolidated financial information of Fogo de Chão Churrascaria (Holdings) LLC (Predecessor) and subsidiaries for the period from January 2, 2012 to July 20, 2012.
The selected historical consolidated balance sheet data as of December 28, 2014 and December 29, 2013 and the consolidated statements of operations and cash flow data for the fiscal years ended December 28, 2014 and December 29, 2013 and for the periods May 24, 2012 (Inception) to December 30, 2012 (Successor) and January 2, 2012 to July 20, 2012 (Predecessor), have been derived from our audited consolidated financial statements included elsewhere in this prospectus. The selected consolidated statements of operations and cash flow data for the thirteen week periods ended March 29, 2015 and March 30, 2014 and the consolidated balance sheet data as of March 29, 2015 have been derived from our unaudited interim condensed consolidated financial statements included elsewhere in this prospectus. Historical results for any prior period are not necessarily indicative of results that may be expected in any future period, and results for any interim period are not necessarily indicative of results that may be expected for the entire year.
The Successor was incorporated under the name Brasa (Parent) Inc. on May 24, 2012 in connection with the Acquisition on July 21, 2012 of Fogo de Chão Churrascaria (Holdings) LLC, a Delaware limited liability company, and its parent company, FC Holdings Inc., a Cayman Islands exempt company, by the THL Funds. The Successor owns 100% of Brasa Purchaser, which owns 100% of Brasa Holdings. Brasa Holdings owns 100% of Fogo Holdings, which owns our domestic and foreign operating subsidiaries.
The Successor, Brasa Purchaser, Brasa Holdings, Brasa Merger Sub Inc. and Fogo de Chão (Holdings) Inc. were formed during 2012 for the purpose of effecting the Acquisition, which was consummated on July 21, 2012. As a result of the Acquisition, the financial information for all periods after May 24, 2012 represent the financial information of the “Successor” company. Prior to, and including, July 20, 2012, the consolidated financial statements include the accounts of the Predecessor. Financial information in the Predecessor period principally relates to Fogo de Chão Churrascaria (Holdings) LLC and its subsidiaries. From May 24, 2012 to July 20, 2012, Successor had no activities other than the incurrence of transaction costs related to the Acquisition.
49
Table of Contents
You should read these tables in conjunction with the information contained under the headings “Use of Proceeds,” “Capitalization,” “Management’s Discussion and Analysis of Financial Condition and Results of Operations” and “Business” and our consolidated financial statements and the related notes to those statements included elsewhere in this prospectus.
| Successor | Predecessor | |||||||||||||||||||||||||
| Thirteen Week Periods Ended | Fiscal Year Ended | May 24 (Inception) to December 30, 2012 |
January 2 to July 20, 2012 |
|||||||||||||||||||||||
| (dollars in thousands) | March 29, 2015 |
March 30, 2014 |
December 28, 2014 |
December 29, 2013 |
||||||||||||||||||||||
| Statement of Operations Data |
||||||||||||||||||||||||||
| Revenue |
$ | 64,959 | $ | 61,317 | $ | 262,280 | $ | 219,239 | $ | 93,844 | $ | 108,516 | ||||||||||||||
| Restaurant operating costs: |
||||||||||||||||||||||||||
| Food and beverage costs |
19,164 | 18,547 | 78,330 | 67,002 | 29,381 | 34,512 | ||||||||||||||||||||
| Compensation and benefit costs |
14,100 | 13,891 | 54,673 | 46,860 | 21,125 | 22,348 | ||||||||||||||||||||
| Occupancy and other operating expenses (excluding depreciation and amortization) |
11,174 | 10,820 | 44,156 | 36,703 | 15,478 | 18,061 | ||||||||||||||||||||
| Total restaurant operating costs |
44,438 | 43,258 | 177,159 | 150,565 | 65,984 | 74,921 | ||||||||||||||||||||
| Marketing and advertising costs |
1,402 | 1,442 | 5,585 | 6,188 | 2,342 | 2,488 | ||||||||||||||||||||
| General and administrative costs |
5,708 | 4,668 | 21,419 | 18,239 | 8,143 | 10,229 | ||||||||||||||||||||
| Pre-opening costs |
1,003 | 788 | 1,951 | 4,764 | 1,119 | 1,359 | ||||||||||||||||||||
| Acquisition costs |
— | — | — | — | 11,988 | 6,963 | ||||||||||||||||||||
| Loss on modification/extinguishment of debt |
— | — | 3,090 | 6,875 | — | 7,762 | ||||||||||||||||||||
| Depreciation and amortization and other |
2,891 | 2,668 | 11,684 | 8,618 | 3,567 | 4,957 | ||||||||||||||||||||
| Total costs and expenses |
55,442 | 52,824 | 220,888 | 195,249 | 93,143 | 108,679 | ||||||||||||||||||||
| Income (loss) from operations |
9,517 | 8,493 | 41,392 | 23,990 | 701 | (163 | ) | |||||||||||||||||||
| Other Expense: |
||||||||||||||||||||||||||
| Interest expense, net |
(3,757 | ) | (4,762 | ) | (17,121 | ) | (22,354 | ) | (10,908 | ) | (7,359 | ) | ||||||||||||||
| Other expenses |
(2 | ) | (4 | ) | (7 | ) | (101 | ) | (20 | ) | (68 | ) | ||||||||||||||
| Income (loss) before income taxes |
5,758 | 3,727 | 24,264 | 1,535 | (10,227 | ) | (7,590 | ) | ||||||||||||||||||
| Income tax expense (benefit) |
1,252 | 965 | 6,991 | 2,472 | (1,195 | ) | 1,294 | |||||||||||||||||||
| Net income (loss) |
4,506 | 2,762 | 17,273 | (937 | ) | (9,032 | ) | (8,884 | ) | |||||||||||||||||
| Less: Loss attributable to noncontrolling interests |
(159 | ) | — | (282 | ) | — | — | — | ||||||||||||||||||
| Net income (loss) attributable to |
$ | 4,665 | $ | 2,762 | $ | 17,555 | $ | (937 | ) | $ | (9,032 | ) | $ | (8,884 | ) | |||||||||||
| Earnings (loss) per common share(1) |
||||||||||||||||||||||||||
| Basic |
$ | 5.20 | $ | 3.10 | $ | 19.69 | $ | (1.06 | ) | $ | (10.21 | ) | * | |||||||||||||
| Diluted |
$ | 5.14 | $ | 3.06 | $ | 19.42 | $ | (1.06 | ) | $ | (10.21 | ) | * | |||||||||||||
| Weighted average common shares outstanding: |
||||||||||||||||||||||||||
| Basic |
896,679 | 890,439 | 891,523 | 885,940 | 884,850 | * | ||||||||||||||||||||
| Diluted |
907,074 | 902,505 | 904,067 | 885,940 | 884,850 | * | ||||||||||||||||||||
| * | Not applicable |
| (1) | Historical share and per share information does not give effect to the consummation of the stock split to be effected upon the closing of this offering. |
| (dollars in thousands) | As of March 29, 2015 |
As of December 28, 2014 |
As of December 29, 2013 |
|||||||||
| Consolidated Balance Sheet Data |
||||||||||||
| Cash and cash equivalents |
$ | 17,304 | $ | 19,387 | $ | 16,010 | ||||||
| Total assets |
460,098 | 477,169 | 481,899 | |||||||||
| Total debt |
242,758 | 243,045 | 252,283 | |||||||||
| Total equity |
145,896 | 155,459 | 150,322 | |||||||||
50
Table of Contents
UNAUDITED PRO FORMA CONSOLIDATED FINANCIAL STATEMENTS
The following unaudited pro forma consolidated financial statements were prepared to give effect to (i) the consummation of a stock split effected upon the closing of this offering pursuant to which each share held by the holder of common stock will be reclassified into 25.4588 shares, (ii) the issuance and sale by us of 4,411,764 shares of our common stock in this offering, assuming an initial public offering price of $17.00 per share of common stock, the midpoint of the price range on the cover of this prospectus, and after deducting estimated offering expenses and estimated underwriting discounts and commissions payable by us, which represents only the shares offered by us and use of the net proceeds therefrom to repay outstanding indebtedness under our Senior Credit Facilities, (iii) the consummation of the refinancing of our existing Senior Credit Facilities and entry into, and effectiveness of, our New Credit Facility, (iv) the application of the net proceeds from our initial public offering and borrowings under our New Credit Facility as set forth under “Use of Proceeds” and (v) the termination of the advisory services agreement between us and an affiliate of THL and the one-time termination fee paid by us upon the consummation of this offering. The unaudited pro forma consolidated balance sheet as of March 29, 2015 gives effect to the transactions above as if they had been completed on March 29, 2015. The unaudited pro forma consolidated statements of operations for the thirteen week period ended March 29, 2015 and the fiscal year ended December 28, 2014 give effect to the transactions above as if they occurred on December 30, 2013 (the first day of Fiscal 2014). The unaudited pro forma consolidated financial statements are derived from, and should be read in conjunction with, our audited consolidated historical financial statements and the related notes to those statements included elsewhere in this prospectus.
The unaudited pro forma consolidated financial information was prepared in accordance with the rules and regulations of the Securities and Exchange Commission (“SEC”) and should not be considered indicative of the consolidated financial position or results of operations that would have occurred if the transactions above had been completed on the dates indicated, nor are they necessarily indicative of our future consolidated financial position or results of operations. Our historical consolidated financial statements have been adjusted in the unaudited pro forma consolidated financial information to give effect to pro forma events that are (1) directly attributable to transactions above, (2) factually supportable and (3) with respect to the statements of operations, expected to have a continuing impact on the consolidated results.
51
Table of Contents
Fogo de Chão, Inc.
Unaudited Pro Forma Consolidated Balance Sheet
(in thousands)
| Historical | Pro Forma | |||||||||||||||
| March 29, |
Pro Forma Adjustments |
Note | March 29, 2015 |
|||||||||||||
| Assets |
||||||||||||||||
| Current assets: |
||||||||||||||||
| Cash and cash equivalents |
$ | 17,304 | $ | — | A | $ | 17,304 | |||||||||
| Accounts receivable |
7,530 | — | 7,530 | |||||||||||||
| Inventories |
4,701 | — | 4,701 | |||||||||||||
| Deferred tax assets |
1,211 | — | 1,211 | |||||||||||||
| Prepaid expenses and other current assets |
3,692 | — | 3,692 | |||||||||||||
| Total current assets |
34,438 | — | 34,438 | |||||||||||||
| Property and equipment, net |
112,267 | — | 112,267 | |||||||||||||
| Prepaid rent |
573 | — | 573 | |||||||||||||
| Goodwill |
212,344 | — | 212,344 | |||||||||||||
| Intangible assets, net |
96,557 | — | 96,557 | |||||||||||||
| Other assets |
3,919 | (112 | ) | B | 3,807 | |||||||||||
| Total assets |
$ | 460,098 | $ | (112 | ) | $ | 459,986 | |||||||||
| Liabilities and Equity |
||||||||||||||||
| Current liabilities: |
||||||||||||||||
| Accounts payable and accrued expenses |
$ | 23,149 | $ | (4,249 | ) | C | $ | 18,900 | ||||||||
| Current portion of long-term debt |
4,788 | (4,788 | ) | D | — | |||||||||||
| Deferred revenue |
4,285 | — | 4,285 | |||||||||||||
| Total current liabilities |
32,222 | (9,037 | ) | 23,185 | ||||||||||||
| Deferred rent |
11,670 | — | 11,670 | |||||||||||||
| Long-term debt, less current portion |
237,970 | (49,086 | ) | D | 188,884 | |||||||||||
| Deferred tax liabilities |
31,019 | — | 31,019 | |||||||||||||
| Other noncurrent liabilities |
1,321 | — | 1,321 | |||||||||||||
| Total liabilities |
314,202 | (58,123 | ) | 256,079 | ||||||||||||
| Equity: |
||||||||||||||||
| Fogo de Chão, Inc. shareholders’ equity: |
||||||||||||||||
| Common stock |
9 | 263 | E | 272 | ||||||||||||
| Additional paid-in capital |
176,637 | 66,687 | E | 243,324 | ||||||||||||
| Retained earnings |
12,251 | (8,939 | ) | F | 3,312 | |||||||||||
| Accumulated other comprehensive loss |
(45,175 | ) | — | (45,175 | ) | |||||||||||
| Total Fogo de Chão, Inc. shareholders’ equity |
143,722 | 58,011 | 201,733 | |||||||||||||
| Noncontrolling interests |
2,174 | — | 2,174 | |||||||||||||
| Total equity |
145,896 | 58,011 | 203,907 | |||||||||||||
| Total liabilities and equity |
$ | 460,098 | $ | (112 | ) | $ | 459,986 | |||||||||
52
Table of Contents
Fogo de Chão, Inc.
Unaudited Pro Forma Consolidated Statement of Operations
(in thousands, except per share amounts)
| Historical | Pro Forma | |||||||||||||||
| Thirteen Week |
Pro Forma |
Note | Thirteen Week Period |
|||||||||||||
| Revenue |
$ | 64,959 | $ | — | $ | 64,959 | ||||||||||
| Restaurant operating costs: |
||||||||||||||||
| Food and beverage costs |
19,164 | — | 19,164 | |||||||||||||
| Compensation and benefit costs |
14,100 | — | 14,100 | |||||||||||||
| Occupancy and other operating expenses (excluding depreciation and amortization) |
11,174 | — | 11,174 | |||||||||||||
| Total restaurant operating costs |
44,438 | — | 44,438 | |||||||||||||
| Marketing and advertising costs |
1,402 | — | 1,402 | |||||||||||||
| General and administrative costs |
5,708 | (341 | ) | G | 5,367 | |||||||||||
| Pre-opening costs |
1,003 | — | 1,003 | |||||||||||||
| Depreciation and amortization |
3,004 | — | 3,004 | |||||||||||||
| Other operating (income) expense, net |
(113 | ) | — | (113 | ) | |||||||||||
| Total costs and expenses |
55,442 | (341 | ) | 55,101 | ||||||||||||
| Income from operations |
9,517 | 341 | 9,858 | |||||||||||||
| Other income (expense): |
||||||||||||||||
| Interest expense, net |
(3,757 | ) | 2,676 | H | (1,081 | ) | ||||||||||
| Other income (expense), net |
(2 | ) | — | (2 | ) | |||||||||||
| Total other income (expense), net |
(3,759 | ) | 2,676 | (1,083 | ) | |||||||||||
| Income before income taxes |
5,758 | 3,017 | 8,775 | |||||||||||||
| Income tax expense |
1,252 | 1,175 | I | 2,427 | ||||||||||||
| Net income |
4,506 | 1,842 | 6,348 | |||||||||||||
| Less: Loss attributable to noncontrolling interest |
(159 | ) | — | (159 | ) | |||||||||||
| Net income attributable to Fogo de Chão, Inc. |
$ | 4,665 | $ | 1,842 | $ | 6,507 | ||||||||||
| Earnings per common share attributable to Fogo de Chão, Inc.:(1) |
||||||||||||||||
| Basic |
$ | 5.20 | J | $ | 0.24 | |||||||||||
| Diluted |
$ | 5.14 | J | $ | 0.24 | |||||||||||
| Weighted average common shares outstanding: |
||||||||||||||||
| Basic |
896,679 | 26,343,498 | J | 27,240,177 | ||||||||||||
| Diluted |
907,074 | 26,597,748 | J | 27,504,822 | ||||||||||||
| (1) | Historical share and per share information does not give effect to the consummation of the stock split to be effected upon the closing of this offering. |
53
Table of Contents
Fogo de Chão, Inc.
Unaudited Pro Forma Consolidated Statement of Operations
(in thousands, except per share amounts)
| Historical | Pro Forma | |||||||||||||||
| Fiscal Year Ended |
Pro Forma |
Note | Fiscal Year Ended |
|||||||||||||
| Revenue |
$ | 262,280 | $ | — | $ | 262,280 | ||||||||||
| Restaurant operating costs: |
||||||||||||||||
| Food and beverage costs |
78,330 | — | 78,330 | |||||||||||||
| Compensation and benefit costs |
54,673 | — | 54,673 | |||||||||||||
| Occupancy and other operating expenses (excluding depreciation and amortization) |
44,156 | — | 44,156 | |||||||||||||
| Total restaurant operating costs |
177,159 | — | 177,159 | |||||||||||||
| Marketing and advertising costs |
5,585 | — | 5,585 | |||||||||||||
| General and administrative costs |
21,419 | (781 | ) | K | 20,638 | |||||||||||
| Pre-opening costs |
1,951 | — | 1,951 | |||||||||||||
| Loss on modification of debt |
3,090 | — | 3,090 | |||||||||||||
| Depreciation and amortization |
11,638 | — | 11,638 | |||||||||||||
| Other operating (income) expense, net |
46 | — | 46 | |||||||||||||
| Total costs and expenses |
220,888 | (781 | ) | 220,107 | ||||||||||||
| Income from operations |
41,392 | 781 | 42,173 | |||||||||||||
| Other income (expense): |
||||||||||||||||
| Interest expense, net |
(17,121 | ) | 12,933 | L | (4,188 | ) | ||||||||||
| Other income (expense), net |
(7 | ) | — | (7 | ) | |||||||||||
| Total other income (expense), net |
(17,128 | ) | 12,933 | (4,195 | ) | |||||||||||
| Income before income taxes |
24,264 | 13,714 | 37,978 | |||||||||||||
| Income tax expense |
6,991 | 5,340 | M | 12,331 | ||||||||||||
| Net income |
17,273 | 8,374 | 25,647 | |||||||||||||
| Less: Loss attributable to noncontrolling interest |
(282 | ) | — | (282 | ) | |||||||||||
| Net income attributable to Fogo de Chão, Inc. |
$ | 17,555 | $ | 8,374 | $ | 25,929 | ||||||||||
| Earnings per common share attributable to Fogo de Chão, Inc.:(1) |
||||||||||||||||
| Basic |
$ | 19.69 | N | $ | 0.96 | |||||||||||
| Diluted |
$ | 19.42 | N | $ | 0.95 | |||||||||||
| Weighted average common shares outstanding: |
||||||||||||||||
| Basic |
891,523 | 26,217,388 | N | 27,108,911 | ||||||||||||
| Diluted |
904,067 | 26,524,200 | N | 27,428,267 | ||||||||||||
| (1) | Historical share and per share information does not give effect to the consummation of the stock split to be effected upon the closing of this offering. |
54
Table of Contents
Fogo de Chão, Inc.
Notes to Unaudited Pro Forma Consolidated Financial Statements
(in thousands, except share amounts)
1. Description of Transactions
Concurrently with, and conditioned upon, the issuance and sale by us of 4,411,764 shares of our common stock in this offering, assuming an initial public offering price of $17.00 per share of common stock, the midpoint of the price range on the cover of this prospectus, and after deducting estimated offering expenses and estimated underwriting discounts and commissions payable by us, we intend to refinance our existing Senior Credit Facilities and enter into our New Credit Facility. We expect that the loans under our New Credit Facility will bear interest at a base rate plus a margin ranging from 0.50% to 1.50% or at LIBOR plus a margin ranging from 1.50% to 2.50% and will mature in 2020. Upon consummation of our initial public offering, we expect that approximately $188,884 will be drawn under our New Credit Facility and that we will use the net proceeds from our initial public offering as well as borrowings under the New Credit Facility to repay the outstanding existing debt under our Senior Credit Facilities. See “Use of Proceeds” and “Management’s Discussion and Analysis and Results of Operations—Liquidity and Capital Resources—Credit Facilities.” In addition, upon consummation of this offering, our advisory services agreement with an affiliate of THL will terminate and we will pay a termination fee of approximately $7,796 to an affiliate of THL.
2. Pro Forma Adjustments
The following pro forma adjustments are included in the Company’s unaudited pro forma consolidated financial information related to the transactions described above:
Unaudited Pro Forma Consolidated Balance Sheet Adjustments
| (A) | Cash — An adjustment was recorded to increase cash by $67,884 to reflect net proceeds from this offering, which will be used to repay principal outstanding under our Senior Credit Facilities. |
An adjustment was recorded to increase cash by $186,384 to reflect net proceeds from our New Credit Facility, which will be drawn upon the consummation of our initial public offering.
An adjustment was recorded to decrease cash by $246,472 to reflect the repayment of principal and interest outstanding under our Senior Credit Facilities upon the consummation of our initial public offering.
An adjustment was recorded to decrease cash by $7,796 to reflect the one-time termination fee that will be paid by us to an affiliate of THL upon the consummation of this offering.
| (B) | Other assets – An adjustment was recorded to increase other assets by $2,500 to reflect the capitalized issuance costs incurred by us in connection with borrowings under our New Credit Facility. |
An adjustment was recorded to decrease other assets by $1,707 to reflect the reclassification of deferred offering costs incurred in connection with this offering to stockholders’ equity upon the consummation of this offering.
An adjustment was recorded to decrease other assets by $905 to reflect the removal of deferred financing costs associated with our Senior Credit Facilities, which will be repaid and extinguished upon the closing of this offering.
| (C) | Accounts payable and accrued expenses – An adjustment was recorded to decrease accounts payable and accrued expenses by $3,476 to reflect the payment of accrued interest under our Senior Credit Facilities upon the consummation of our initial public offering. |
An adjustment was recorded to decrease accounts payable and accrued expenses by $773 to reflect the payment of accrued initial public offering costs upon the consummation of this offering.
55
Table of Contents
Fogo de Chão, Inc.
Notes to Unaudited Pro Forma Consolidated Financial Statements (Continued)
(in thousands, except share amounts) (Continued)
| (D) | Long-term debt and current portion of long-term debt — Adjustments were recorded to decrease current portion of long-term debt and long-term debt by $4,788 and $237,970, respectively, to reflect the repayment of principal under our Senior Credit Facilities in connection with the consummation of our initial public offering. |
Adjustments were recorded to increase long-term debt by $188,884 to reflect the entry into and borrowings under our New Credit Facility in connection with, and conditioned upon, the consummation of our initial public offering.
| (E) | Common stock and additional paid-in capital — Adjustments were recorded to increase common stock and additional paid-in capital by $263 and $66,687, respectively, to reflect (i) shares issued in this offering whose proceeds will be used to repay outstanding principal under our Senior Credit Facilities and (ii) the 1-for-25.4588 stock split, which will be effected upon the closing of this offering. |
| (F) | Accumulated earnings — An adjustment was recorded to decrease accumulated earnings by $7,796 to reflect the one-time termination fee that will be paid by us to an affiliate of THL upon the consummation of this offering. |
An adjustment was recorded to decrease accumulated earnings by $1,143 to reflect the loss on the extinguishment of debt and the write-off of debt issuance costs as a result of the repayment of outstanding indebtedness under our Senior Credit Facilities as described above.
Unaudited Pro Forma Consolidated Statement of Operations Adjustments
Thirteen Weeks Ended March 29, 2015
| (G) | General and administrative costs — An adjustment was recorded to eliminate general and administrative costs of $341 related to our advisory services agreement with an affiliate of THL, which will terminate upon the consummation of this offering. |
| (H) | Interest expense — An adjustment of $1,252 was recorded to record interest expense for the thirteen week period ended March 29, 2015 related to our New Credit Facility, which will be entered into in connection with the consummation of this offering. The New Credit Facility will bear interest, at a base rate plus a margin ranging from 0.50% to 1.50% or at LIBOR plus a margin ranging from 1.50% to 2.50%. For the purpose of preparing these unaudited pro forma consolidated financial statements, an interest rate of 2.30% was assumed, which reflects the rate in effect as of the date of this offering. A 1/8th percent increase in the LIBOR rate would result in an increase to the above noted interest expense of approximately $59. |
An adjustment of $3,928 was recorded to reduce interest expense for the thirteen week period ended March 29, 2015 to reflect the repayment of principal under our Senior Credit Facilities as described under “Use of Proceeds” as if such repayment had occurred on December 30, 2013.
| (I) | Income tax expense — An adjustment of $1,175 was recorded to increase income tax expense for the thirteen week period ended March 29, 2015 to reflect the impact of the pro forma adjustments noted above using a blended federal and state statutory tax rate of 38.94%. |
| (J) | Weighted average shares outstanding basic and diluted — The weighted average shares outstanding used to compute basic and diluted net income per share for the thirteen week period ended March 29, 2015 have been adjusted to give effect to the issuance of shares issued in this offering whose proceeds will be used to repay outstanding principal under our Senior Credit Facilities, as if such issuances had occurred on December 30, 2013, as well as the 1-for-25.4588 stock split, which will be effected upon the closing of this offering. |
56
Table of Contents
Fogo de Chão, Inc.
Notes to Unaudited Pro Forma Consolidated Financial Statements (Continued)
(in thousands, except share amounts) (Continued)
Year Ended December 28, 2014
| (K) | General and administrative costs — An adjustment was recorded to eliminate general and administrative costs of $781 related to our advisory services agreement with an affiliate of THL, which will terminate upon the consummation of this offering. |
| (L) | Interest expense — An adjustment of $5,002 was recorded to record interest expense for the fiscal year ended December 28, 2014 related to our New Credit Facility, which will be entered into in connection with the consummation of this offering. The New Credit Facility will bear interest, at a base rate plus a margin ranging from 0.50% to 1.50% or at LIBOR plus a margin ranging from 1.50% to 2.50%. For the purpose of preparing these unaudited pro forma consolidated financial statements, an interest rate of 2.30% was assumed, which reflects the rate in effect as of the date of this offering. A 1/8th percent increase in the LIBOR rate would result in an increase to the above noted interest expense of approximately $236. |
An adjustment of $17,935 was recorded to reduce interest expense for the fiscal year ended December 28, 2014 to reflect the repayment of principal under our Senior Credit Facilities as described under “Use of Proceeds” as if such repayment had occurred on December 30, 2013.
| (M) | Income tax expense — An adjustment of $5,340 was recorded to increase income tax expense for the fiscal year ended December 28, 2014 to reflect the impact of the pro forma adjustments noted above using a blended federal and state statutory tax rate of 38.94%. |
| (N) | Weighted average shares outstanding basic and diluted — The weighted average shares outstanding used to compute basic and diluted net income per share for the fiscal year ended December 28, 2014 have been adjusted to give effect to the issuance of shares issued in this offering whose proceeds will be used to repay outstanding principal under our Senior Credit Facilities, as if such issuances had occurred on December 30, 2013, as well as the 1-for-25.4588 stock split, which will be effected upon the closing of this offering. |
The unaudited pro forma consolidated statements of operations do not include the following adjustments, which are one-time in nature and not expected to have a continuing impact on our results of operations:
| • | An adjustment of approximately $7,796 to reflect the one-time termination fee to be paid by us to an affiliate of THL upon the consummation of this offering; and |
| • | An adjustment of approximately $1,143 to reflect the loss on the extinguishment of debt and the write-off of debt issuance costs as a result of the repayment of outstanding indebtedness under our Senior Credit Facilities as described above. |
57
Table of Contents
MANAGEMENT’S DISCUSSION AND ANALYSIS OF FINANCIAL CONDITION AND RESULTS OF OPERATIONS
You should read the following discussion and analysis of our financial condition and results of operations in conjunction with the “Selected Historical Consolidated Financial Information” section of this prospectus and our consolidated financial statements and related notes appearing elsewhere in this prospectus. In addition to historical information, this discussion and analysis contains forward-looking statements based on current expectations that involve risks, uncertainties and assumptions, such as our plans, objectives, expectations and intentions set forth in the “Special Note Regarding Forward-Looking Statements” section and included elsewhere in this prospectus. Our actual results and the timing of events may differ materially from those anticipated in these forward-looking statements as a result of various factors, including those set forth in the “Risk Factors” section and included elsewhere in this prospectus.
We operate on a 52- or 53-week fiscal year that ends on the Sunday that is closest to December 31 of that year. Each fiscal year generally is comprised of four 13-week fiscal quarters, although in the years with 53 weeks the fourth quarter represents a 14-week period. Fiscal 2012, Fiscal 2013 and Fiscal 2014 ended on December 30, 2012, December 29, 2013 and December 28, 2014, respectively, and each were comprised of 52 weeks. Fiscal 2015 is a 53-week fiscal year.
Overview
Fogo de Chão (fogo-dee-shoun) is a leading Brazilian steakhouse, or churrascaria, which has specialized for over 35 years in fire-roasting high-quality meats utilizing the centuries-old Southern Brazilian cooking technique of churrasco. We deliver a distinctive and authentic Brazilian dining experience through the combination of our high-quality Brazilian cuisine and our differentiated service model known as espeto corrido (Portuguese for “continuous service”) delivered by our gaucho chefs. We offer our guests a tasting menu of meats featuring up to 20 cuts, simply seasoned and carefully fire-roasted to expose their natural flavors.
Guests can begin their dining experience at the Market Table, which offers a wide variety of Brazilian-inspired side dishes, fresh-cut vegetables, seasonal salads, aged cheeses and cured meats, or they can receive immediate entrée service table-side from our gaucho chefs by turning a service medallion, found at each guest’s seat, green side up. Each gaucho chef rotates throughout the dining room, and is responsible for a specific cut of meat which they prepare, cook and serve to our guests continuously throughout their meal. Guests can pause the service at any time by turning the medallion to red and then back to green when they are ready to try additional selections and can communicate to our gauchos their preferred cut of meat, temperature and portion size. Our continuous service model allows customization and consumer engagement since our guests control the variety and quantity of their food and the pace of their dining experience. Through the combination of our authentic Brazilian cuisine, unique service model, prix fixe menu and engaging hospitality in an upscale restaurant atmosphere, we believe our brand delivers a differentiated dining experience relative to other specialty and fine-dining concepts and offers our guests a compelling value proposition.
Our Growth Strategies and Outlook
Our growth is based on the following strategies:
| • | Grow our restaurant base; |
| • | Grow our comparable restaurant sales; and |
| • | Improve margins by leveraging our infrastructure and investments in human capital. |
We believe we are in the early stages of our growth with 37 current restaurants, 26 in the United States, 10 in Brazil and one in Mexico, our first joint venture restaurant. Based on internal analysis and a study prepared by Buxton, we believe there exists a long-term growth potential for over new 100 domestic sites, with additional new restaurants internationally. We have a long track record of successful new restaurant development, having grown our restaurant count by a multiple of 10 since 2000, and at a 11.5% CAGR since 2010. While new restaurants are expected to be a key driver of our growth, we believe positive comparable restaurant sales growth and margin expansion through leveraging our infrastructure will also contribute to strong future growth.
58
Table of Contents
Highlights and Trends
Restaurant Development
Restaurant openings reflects the number of new restaurants opened during a particular reporting period. We plan to open five to six restaurants during Fiscal 2015, including our first joint venture restaurant in Mexico City, which opened in May 2015. We believe our international joint venture restaurants will allow us to expand our restaurant footprint with limited capital investment by us. Over the next five years, we plan to increase our company-owned restaurant count by at least 10% annually, with North America being our primary market for new restaurant development. In addition, over the next five years, we plan to open three to five new restaurants in Brazil.
| Thirteen Week Period Ended |
Fiscal Year | |||||||||||||||||||
| March 29, 2015 | 2014 | 2013 | 2012 | 2011 | ||||||||||||||||
| Restaurant Activity |
||||||||||||||||||||
| Beginning of period |
34 | 31 | 27 | 24 | 22 | |||||||||||||||
| Openings |
1 | 3 | 4 | 3 | 2 | |||||||||||||||
| Closings |
— | — | — | — | — | |||||||||||||||
|
|
||||||||||||||||||||
| Restaurants at end of period |
35 | 34 | 31 | 27 | 24 | |||||||||||||||
2014 FIFA World Cup and Recent Events in Brazil
The 2014 World Cup (the “World Cup”) took place in Brazil from June 12 to July 13, 2014. The event positively impacted our operating results for Fiscal 2014 because our Brazil restaurants are located in cities that hosted World Cup matches. Of the 64 World Cup matches, 32 were hosted in cities where we operate. We estimate that the World Cup positively impacted revenue by approximately $5.0 million for Fiscal 2014. Comparable restaurant sales for our Brazil restaurants grew approximately 11.4% for Fiscal 2014. Adjusting comparable restaurant sales to exclude the impact of the World Cup we estimate that comparable restaurant sales for our Brazil restaurants grew approximately 1.7% for Fiscal 2014. As a result of the impact the World Cup had on our 2014 results in Brazil, we expect our comparable restaurant sales in Brazil to be lower in the second and the third quarter of 2015 as compared to the same quarters of 2014. We estimate the impact of the World Cup to be approximately $5.0 million of which between 55 to 60% of the impact was in the second quarter of 2014. Brazilian comparable restaurant revenue totaled $14.3 million and $14.6 million in the second and third quarter of 2014, respectively.
Additionally, in March and April of 2015, a series of protests began in Brazil against the current government and President. The initial protests occurred in cities throughout Brazil, including in Rio de Janeiro and Sao Paolo, on March 15, with protestors generally reported to number around a million, and continued throughout the remainder of March and into April. As a result of the protests, our restaurants in Brazil experienced reduced guest traffic in the second half of March and in April. Protests currently continue throughout Brazil and we anticipate that our results of operations in the second quarter of Fiscal 2015 could be impacted by the ongoing political activity.
New Credit Facility
Concurrently with, and conditioned upon, the consummation of our initial public offering, we intend to refinance our existing Senior Credit Facilities and enter into a new $250.0 million revolving credit facility (the “New Credit Facility”). We expect that the loans under our New Credit Facility will bear interest at a base rate plus a margin ranging from 0.50% to 1.50% or at LIBOR plus a margin ranging from 1.50% to 2.50% and will mature in 2020. We expect that the New Credit Facility will contain customary affirmative, negative and financial covenants applicable to us and certain of our subsidiaries, including financial maintenance covenants requiring us to maintain a maximum Total Rent Adjusted Leverage Ratio and a minimum Interest Coverage Ratio (each as defined in the New Credit Facility). Borrowings under our New Credit Facility may vary significantly from time to time depending on our cash needs at any given time, and upon consummation of our initial public offering we expect that approximately $188.9 million will be drawn under our New Credit Facility.
Investments in Human Capital to Support Growth
To support our future growth and enhance our operations and management team, we have made substantial investments in personnel. Since January 2012, we have added 39 positions at an approximate annualized cost of $3.5 million at the corporate level and $2.0 million at the restaurant level in key functional corporate and restaurant areas including senior leadership, new restaurant site selection and analysis, new restaurant design, group dining, product innovation and in-restaurant employee training. Specifically, we have incurred $0.4 million in incremental personnel costs in 2012, $1.9 million in 2013 and $4.2 million in 2014 as a result of these investments.
59
Table of Contents
2014 Credit Facility Refinancing
In April 2014, we refinanced $205 million of borrowings under our First Lien Credit Facility (as defined below), borrowed an additional $20 million under our First Lien Credit Facility and repaid $20 million of our Second Lien Credit Facility (as defined below) (the “2014 Credit Facility Refinancing”). Our $224 million new First Lien Credit Facility matures on July 20, 2019 and bears interest at LIBOR plus a spread of 4.00%, with a LIBOR floor of 1.00%. Our $25 million Second Lien Credit Facility matures on January 20, 2020, and bears interest at LIBOR plus a spread of 9.50%, with a LIBOR floor of 1.50%. Our revolving line of credit has an interest rate of LIBOR plus a spread of 4.00%, with a LIBOR floor of 1.00%, and has a maturity date of July 20, 2017. Following the completion of the 2014 Credit Facility Refinancing, interest rates decreased 110 basis points as compared to prior interest rates resulting in a $2.7 million decrease to our annual interest expense. For a further description of our Senior Credit Facilities (as defined below), see “Liquidity and Capital Resources—Senior Credit Facilities.” We intend to use the net proceeds from this offering to repay outstanding indebtedness under our Senior Credit Facilities. See “Use of Proceeds.”
Acquisition by Thomas H. Lee Partners, L.P.
Fogo de Chão, Inc. was incorporated under the name Brasa (Parent) Inc. on May 24, 2012, in connection with the Acquisition. The Company owns 100% of Brasa Purchaser, which owns 100% of Brasa Holdings. Brasa Holdings owns 100% of Fogo Holdings, which owns the Company’s domestic and foreign operating subsidiaries. Immediately prior to the Acquisition, (i) FC Holdings Inc. contributed all of its ownership interests in Fogo de Chão Churrascaria (Holdings) LLC to Fogo Holdings, (ii) Fogo de Chão Churrascaria (Holdings) LLC was merged with Fogo Holdings, which was the surviving corporation, and (iii) FC Holdings Inc. was domesticated in the state of Delaware into Brasa Holdings. Promptly thereafter, Brasa Parent acquired Brasa Holdings through a reverse subsidiary merger with Brasa Holdings, which was the surviving corporation. The Acquisition was financed by loans to Brasa Holdings and equity contributions by the THL Funds and certain members of management.
Initial Public Offering
This is our initial public offering of 4,411,764 shares of common stock at an assumed price to the public of $17.00 per share, the midpoint of the price range on the cover of this prospectus. Upon the consummation of this offering, after deducting underwriters discounts and commissions and offering expenses, we expect to receive net proceeds of approximately $66.9 million, or $77.4 million if the underwriters exercise their option to purchase additional shares in full, based upon an assumed initial public offering price of $17.00 per share of common stock, the midpoint of the price range on the cover of this prospectus, and after deducting the estimated underwriting discounts and commissions and estimated offering expenses payable by us. We intend to use the net proceeds of this offering, together with borrowings under our New Credit Facility, to repay the outstanding indebtedness under our Senior Credit Facilities and to pay fees and expenses related to our initial public offering and the refinancing of our Senior Credit Facilities. See “Use of Proceeds.”
As a result of the IPO, we plan to make a one-time non-recurring payment of $7.8 million in connection with the termination of our Advisory Services Agreement with an affiliate of THL. We expect to benefit from savings on management fees that we incurred as a private company, but we also expect to incur incremental costs as a public company such as legal, accounting, insurance and other compliance costs. We will continue to use our operating cash flows to fund capital expenditures to support restaurant growth, as well as to invest in our existing restaurants, infrastructure and information technology. See “Liquidity and Capital Resources.”
Performance Indicators
We use the following key metrics in evaluating the performance of our restaurants:
New Restaurant Openings
Our ability to successfully open new restaurants and expand our restaurant base is critical to adding revenue capacity to meet our goals for growth. New restaurant openings contribute additional operating weeks and revenue to our business. Before a new restaurant opens, we incur pre-opening costs, as described below. New restaurants often open with an initial start-up period of sales volatility and sales and margins tend to stabilize within six to nine months of opening. New restaurants typically experience normal inefficiencies in the form of higher food, labor and other direct operating expenses and, as a result, restaurant contribution margins are generally lower during the start-up period of operation.
60
Table of Contents
Comparable Restaurant Sales
We consider a restaurant to be comparable during the first full fiscal quarter following the eighteenth full month of operations. We adjust the sales included in the comparable restaurant calculation for restaurant closures, primarily as a result of remodels, so that the periods will be comparable. Changes in comparable restaurant sales reflect changes in sales for the comparable group of restaurants over a specified period of time. Changes in comparable sales reflect changes in guest count trends as well as changes in average check, as described below. As of December 28, 2014, December 29, 2013 and December 30, 2012, there were 27, 25 and 22 restaurants, respectively, in our comparable restaurant base and as of March 29, 2015 and March 30, 2014 there were 27 and 25, respectively. This measure highlights performance of existing restaurants, as the impact of new restaurant openings is excluded.
Average Check Per Person
Average check is calculated by dividing total comparable restaurant sales by comparable restaurant guest counts for a given time period. Average check is influenced by menu prices and menu mix. Management uses this indicator to analyze trends in guests’ preferences, the effectiveness of menu offerings and per guest expenditures.
Average Unit Volumes
We measure average unit volumes (“AUVs”) on an annual (52-week) basis. AUVs consist of the average sales of all restaurants that have been open for a trailing 52-week period or longer. We adjust the sales included in AUV calculations for restaurant closures. This measurement allows us to assess changes in consumer spending patterns at our restaurants and the overall performance of our restaurant base.
Guest Counts
Guest counts are measured by the number of entrées ordered at our restaurants over a given time period.
Restaurant Contribution and Restaurant Contribution Margin
Restaurant contribution is defined as revenue less restaurant operating costs (which include food and beverage costs, compensation and benefits costs and occupancy and certain other operating costs but exclude depreciation and amortization expense). Restaurant contribution margin is defined as restaurant contribution as a percentage of revenue. Restaurant contribution and restaurant contribution margin are neither required by, nor presented in accordance with, GAAP. See “Basis of Presentation” and “Summary Consolidated Financial and Other Information” for more information regarding restaurant contribution and restaurant contribution margin and a reconciliation to revenue.
Adjusted EBITDA and Adjusted EBITDA Margin
Adjusted EBITDA is defined as net income before interest, taxes and depreciation and amortization plus the sum of certain operating and non-operating expenses, including pre-opening costs, losses on modifications and extinguishment of debt, acquisition costs, equity-based compensation costs, management and consulting fees, retention agreement costs, IPO related costs, and other non-cash or similar adjustments. Adjusted EBITDA Margin represents Adjusted EBITDA as a percentage of revenue. By monitoring and controlling our Adjusted EBITDA and Adjusted EBITDA Margin, we can gauge the overall profitability of our company. See “Basis of Presentation” and “Summary Consolidated Financial and Other Information” for more information regarding Adjusted EBITDA and Adjusted EBITDA Margin and a reconciliation to net income (loss).
Significant Components of Our Results of Operations
Revenue
Revenue primarily consists of food and beverage sales, net of any employee meals and complimentary meals. Revenue is recognized when food and beverage products are sold at our restaurants net of any discounts. Revenue in a given period is directly influenced by the number of operating weeks in such period, the number of restaurants we
61
Table of Contents
operate and comparable restaurant sales growth. Proceeds from the sale of gift cards that do not have expiration dates are recorded as deferred revenue at the time of the sale and recognized as revenue when the gift card is redeemed by the holder. The portion of gift cards sold which are never redeemed is commonly referred to as gift card breakage. We recognize gift card “breakage” revenue for gift cards when the likelihood of redemption becomes remote and we determine there is no legal obligation to remit the value of the unredeemed gift cards to governmental agencies.
Food and Beverage Costs
Food and beverage costs include the direct costs associated with food, beverage and distribution of our menu items. We measure food and beverage costs by tracking the cost as a percentage of revenue. Food and beverage costs as a percentage of revenue are generally influenced by the cost of food and beverage items, distribution costs and sales mix. These components are variable in nature, increase with revenue, are subject to increases or decreases based on fluctuations in commodity costs, including beef, lamb, pork, chicken and seafood prices, and depend in part on the controls we have in place to manage costs at our restaurants.
Compensation and Benefit Costs
Compensation and benefits costs comprise restaurant and regional management salaries and bonuses, hourly staff payroll and other payroll-related expenses, including bonus expenses, equity-based compensation, vacation pay, payroll taxes, fringe benefits and health insurance expenses and are measured by tracking hourly and total labor as a percentage of revenue.
Occupancy and Other Operating Expenses
Occupancy and other operating expenses comprise all occupancy costs, consisting of both fixed and variable portions of rent, common area maintenance charges, utility costs, credit card fees, real estate property taxes and other related restaurant supply and occupancy costs, but exclude depreciation and amortization expense, and are measured by tracking occupancy and other operating expenses as a percentage of revenue.
Marketing and Advertising Costs
Marketing and advertising costs include all media, production and related costs for both local restaurant advertising and national marketing. We measure the efficiency of our marketing and advertising expenditures by tracking these costs as a percentage of total revenue.
General and Administrative Costs
General and administrative costs are comprised of costs related to certain corporate and administrative functions that support development and restaurant operations. These expenses are generally fixed and reflect management, supervisory and staff salaries, employee benefits and bonuses, share-based compensation, travel expense, information systems, training, corporate rent, professional and consulting fees, technology and market research. We measure general and administrative costs by tracking general and administrative costs as a percentage of revenue.
Pre-opening Costs
Pre-opening costs are costs incurred prior to, and directly associated with, opening a restaurant, and primarily consist of manager salaries, relocation costs, recruiting expenses, employee payroll and related training costs for new employees, including rehearsal of service activities, as well as straight line lease costs incurred prior to opening. In addition, pre-opening costs include public relations costs incurred prior to opening. We typically start incurring pre-opening costs four months prior to opening and these costs tend to increase four weeks prior to opening as we begin training activities.
Depreciation and Amortization Expense
Depreciation and amortization expense includes depreciation of fixed assets and certain definite life intangible assets. We depreciate capitalized leasehold improvements over the shorter of the total expected lease term or their estimated useful life.
62
Table of Contents
Income Tax Expense
Income tax expense depends on the statutory tax rates in the countries where we operate. Historically we have generated taxable income in the United States and Brazil. Our provision includes federal, state and local current and deferred income tax expense.
Segment Reporting
We operate our restaurants using a single restaurant concept and brand. Each restaurant under our single global brand operates with similar types of products and menu, providing a continuous service style, similar contracts, customers and employees, irrespective of location. We have identified two operating segments: United States and Brazil, which is how we organize our restaurants for making operating decisions and assessing performance. Our joint venture in Mexico is included in the United States for segment reporting purposes as the operations of the joint venture are monitored by the United States segment management.
63
Table of Contents
Results of Operations
The following tables summarizes key components of our consolidated results of operations for the periods indicated, both in dollars and as a percentage of revenue:
Fiscal Quarter Ended March 29, 2015 (13 weeks) Compared to Fiscal Quarter Ended March 30, 2014 (13 weeks)
| Fiscal Quarter Ended | Fiscal Quarter Ended | |||||||||||||||||||||||||||
| March 29, 2015 | March 30, 2014 | |||||||||||||||||||||||||||
| (13 weeks) | (13 weeks) | Increase / (Decrease) | ||||||||||||||||||||||||||
| (dollars in thousands) | Dollars | %(a) | Dollars | %(a) | Dollars | %(b) | %(c) | |||||||||||||||||||||
| Revenue |
||||||||||||||||||||||||||||
| U.S. Restaurant |
$ | 54,702 | 84.2 | % | $ | 49,324 | 80.4 | % | $ | 5,378 | 10.9 | % | 3.8 | % | ||||||||||||||
| Brazil Restaurant |
10,243 | 15.8 | 11,993 | 19.6 | (1,750 | ) | (14.6 | ) | (3.8 | ) | ||||||||||||||||||
| Other |
14 | 0.0 | — | — | 14 | * | * | |||||||||||||||||||||
| Total revenue |
$ | 64,959 | 100.0 | % | $ | 61,317 | 100.0 | % | $ | 3,642 | 5.9 | % | * | |||||||||||||||
| Restaurant operating costs |
||||||||||||||||||||||||||||
| Food and beverage costs |
19,164 | 29.5 | 18,547 | 30.2 | 617 | 3.3 | (0.7 | ) | ||||||||||||||||||||
| Compensation and benefit costs |
14,100 | 21.7 | 13,891 | 22.7 | 209 | 1.5 | (1.0 | ) | ||||||||||||||||||||
| Occupancy and other operating expenses (excluding depreciation and amortization) |
11,174 | 17.2 | 10,820 | 17.6 | 354 | 3.3 | (0.4 | ) | ||||||||||||||||||||
| Total restaurant operating costs |
$ | 44,438 | 68.4 | % | $ | 43,258 | 70.5 | % | $ | 1,180 | 2.7 | % | (2.1 | %) | ||||||||||||||
| Marketing and advertising costs |
1,402 | 2.2 | 1,442 | 2.4 | (40 | ) | (2.8 | ) | (0.2 | ) | ||||||||||||||||||
| General and administrative costs |
5,708 | 8.8 | 4,668 | 7.6 | 1,040 | 22.3 | 1.2 | |||||||||||||||||||||
| Pre-opening costs |
1,003 | 1.5 | 788 | 1.3 | 215 | 27.3 | 0.2 | |||||||||||||||||||||
| Depreciation and amortization |
3,004 | 4.6 | 2,737 | 4.5 | 267 | 9.8 | 0.1 | |||||||||||||||||||||
| Other operating (income) expense, net |
(113 | ) | (0.2 | ) | (69 | ) | (0.1 | ) | 44 | 63.8 | 0.1 | |||||||||||||||||
| Total costs and expenses |
$ | 55,442 | 85.3 | % | $ | 52,824 | 86.1 | % | $ | 2,618 | 5.0 | % | (0.8 | %) | ||||||||||||||
| Income from operations |
$ | 9,517 | 14.7 | % | $ | 8,493 | 13.9 | % | $ | 1,024 | 12.1 | % | 0.8 | % | ||||||||||||||
| Other income (expense): |
||||||||||||||||||||||||||||
| Interest expense, net |
(3,757 | ) | (5.8 | ) | (4,762 | ) | (7.8 | ) | (1,005 | ) | (21.1 | ) | (2.0 | ) | ||||||||||||||
| Other income (expense), net |
(2 | ) | (0.0 | ) | (4 | ) | (0.0 | ) | (2 | ) | (50.0 | ) | (0.0 | ) | ||||||||||||||
| Total other income (expense), net |
$ | (3,759 | ) | (5.8 | %) | $ | (4,766 | ) | (7.8 | %) | $ | (1,007 | ) | (21.1 | %) | (2.0 | %) | |||||||||||
| Income before income taxes |
5,758 | 8.9 | 3,727 | 6.1 | 2,031 | 54.5 | 2.8 | |||||||||||||||||||||
| Income tax expense |
1,252 | 1.9 | 965 | 1.6 | 287 | 29.7 | 0.3 | |||||||||||||||||||||
| Net income |
4,506 | 6.9 | 2,762 | 4.5 | 1,744 | 63.1 | 2.4 | |||||||||||||||||||||
| Less: Loss attributable to noncontrolling interest |
(159 | ) | (0.2 | ) | — | — | * | * | * | |||||||||||||||||||
| Net income attributable to |
$ | 4,665 | 7.2 | % | $ | 2,762 | 4.5 | % | $ | 1,903 | 68.9 | % | 2.7 | % | ||||||||||||||
| (a) | Calculated as a percentage of total revenue. |
| (b) | Calculated percentage increase / (decrease) in dollars. |
| (c) | Calculated increase / (decrease) in percentage of total revenue. |
| * | Not meaningful. |
64
Table of Contents
Revenue
Total revenue increased $3.6 million, or 5.9%, for the first quarter of Fiscal 2015, primarily due to a $5.5 million increase in non-comparable restaurant sales for new restaurants opened in 2014 and 2015. Total comparable restaurant sales increased 0.5% primarily driven by an increase in average check, offset by a reduction in guest traffic, all offset by a negative foreign exchange impact of $2.1 million.
U.S. restaurant revenue increased $5.4 million, or 10.9%, primarily due to increased non-comparable restaurant sales of $5.3 million and a 0.1% increase in comparable restaurant sales.
Brazil restaurant revenue decreased $1.8 million, or 14.6%, primarily due to a negative foreign exchange impact of $2.1 million, partially offset by a 2.3% increase in comparable restaurant sales.
Food and Beverage Costs
Food and beverage costs increased $0.6 million, or 3.3%, for the first quarter of Fiscal 2015, primarily due to a $1.5 million increase in food costs from new restaurants opened since the end of the prior period and the full period of operation of restaurants opened in the prior period, partially offset by a positive foreign exchange impact of $0.7 million. As a percentage of total revenue, total food and beverage costs decreased from 30.2% to 29.5%, due to management’s focus on waste reduction and production efficiencies.
Compensation and Benefit Costs
Compensation and benefit costs increased $0.2 million, or 1.5%, for the first quarter of Fiscal 2015, primarily due to a $0.9 million increase in additional labor needs resulting from new restaurants opened since the end of the prior period and the full period of operation of restaurants opened in the prior period, offset by foreign exchange impact of $0.3 million. As a percentage of total revenue, total compensation and benefits costs decreased from 22.7% to 21.7%, due to improved labor productivity and leverage on higher revenue at our comparable restaurants.
Occupancy and Other Operating Expenses
Occupancy and other operating expenses increased $0.4 million, or 3.3%, for the first quarter of Fiscal 2015, primarily due to a $0.8 million increase in expense resulting from new restaurants opened since the end of the prior period and the full period of operation of restaurants opened in the prior period, partially offset by a positive foreign exchange impact of $0.4 million and an overall reduction in restaurant supplies expense. As a percentage of total revenue, total occupancy and other operating costs decreased from 17.6% to 17.2%, primarily due to leverage on higher revenue at our comparable restaurants, and improving efficiencies in our non-comparable locations as they ramp up.
Marketing and Advertising Costs
Marketing and advertising costs were unchanged at $1.4 million for the first quarter of Fiscal 2015. As a percentage of total revenue, marketing and advertising costs decreased from 2.4% to 2.2%.
General and Administrative Costs
General and administrative costs increased $1.0 million, or 22.3%, for the first quarter of Fiscal 2015, due to a $0.4 million increase in compensation and benefit costs due to hiring additional corporate resources to enhance key functional areas and support future growth and a $0.6 million increase in legal and other professional services primarily attributable to establishing our joint ventures and preparing for the initial public offering of our common stock. As a percentage of total revenue, general and administrative costs increased from 7.6% to 8.8%.
Pre-opening Costs
Pre-opening costs increased $0.2 million to $1.0 million for the first quarter of Fiscal 2015, due to three restaurants incurring preopening costs during the first quarter of Fiscal 2015 versus two restaurants during the first quarter of Fiscal 2014.
65
Table of Contents
Interest Expense
Interest expense, net of interest income and capitalized interest, decreased $1.0 million, or 21.1%, for the first quarter of Fiscal 2015, due to a reduction in interest rates on our Senior Credit Facilities resulting from our 2014 Credit Facility Refinancing, as well as a decrease in outstanding principal balance owed on our Second Lien Credit Facility.
Income Tax Expense
Income tax expense increased $0.3 million to $1.3 million for the first quarter of Fiscal 2015, due to an increase in net income before income taxes of $2.0 million, offset by the release of the valuation allowance of $0.7 million and a $0.3 million discrete tax benefit recognized in the first quarter of Fiscal 2015 related to a true-up of the deferred tax asset on Fiscal 2014 alternative minimum tax credits.
Restaurant Contribution
| Fiscal Quarter Ended March 29, 2015 |
Fiscal Quarter Ended March 30, 2014 |
Increase / (Decrease) | ||||||||||||||||||||||||||
| (13 weeks) | (13 weeks) | |||||||||||||||||||||||||||
| (dollars in thousands) | Dollars | %(a) | Dollars | %(a) | Dollars | %(b) | %(c) | |||||||||||||||||||||
| Revenue |
||||||||||||||||||||||||||||
| U.S. Restaurant |
$ | 54,702 | 84.2 | % | $ | 49,324 | 80.4 | % | $ | 5,378 | 10.9 | % | 3.8 | % | ||||||||||||||
| Brazil Restaurant |
10,243 | 15.8 | 11,993 | 19.6 | (1,750 | ) | (14.6 | ) | (3.8 | ) | ||||||||||||||||||
| Other |
14 | 0.0 | — | 0.0 | 14 | * | * | |||||||||||||||||||||
| Total revenue |
$ | 64,959 | 100.0 | % | $ | 61,317 | 100.0 | % | $ | 3,642 | 5.9 | % | * | |||||||||||||||
| Restaurant operating costs |
||||||||||||||||||||||||||||
| U.S. |
$ | 37,083 | 67.8 | % | $ | 34,303 | 69.5 | % | $ | 2,780 | 8.1 | % | (1.7 | %) | ||||||||||||||
| Brazil |
7,355 | 71.8 | 8,955 | 74.7 | (1,600 | ) | (17.9 | ) | (2.9 | ) | ||||||||||||||||||
| Total restaurant operating costs |
$ | 44,438 | 68.4 | % | $ | 43,258 | 70.5 | % | $ | 1,180 | 2.7 | % | (2.1 | %) | ||||||||||||||
| Restaurant contribution |
||||||||||||||||||||||||||||
| U.S. |
$ | 17,619 | 32.2 | % | $ | 15,021 | 30.5 | % | $ | 2,598 | 17.3 | % | 1.7 | % | ||||||||||||||
| Brazil |
2,888 | 28.2 | 3,038 | 25.3 | (150 | ) | (4.9 | ) | 2.9 | |||||||||||||||||||
| Other |
14 | * | — | — | * | * | * | |||||||||||||||||||||
| Total restaurant contribution |
$ | 20,521 | 31.6 | % | $ | 18,059 | 29.5 | % | $ | 2,462 | 13.6 | % | 2.1 | % | ||||||||||||||
| (a) | Calculated as a percentage of total revenue or segment revenue where applicable. |
| (b) | Calculated percentage increase / (decrease) in dollars. |
| (c) | Calculated increase / (decrease) in percentage of total revenue or segment revenue where applicable. |
| * | Not meaningful. |
Total restaurant contribution increased $2.5 million, or 13.6%, for the first quarter of Fiscal 2015, primarily due to a $2.3 million increase attributable to non-comparable restaurants. As a percentage of revenue, total restaurant contribution increased from 29.5% to 31.6%.
As a percentage of U.S. restaurant revenue, contribution margin increased 1.7% from 30.5% to 32.2%, due to a 0.3% reduction in food and beverage costs primarily due to management’s focus on waste reduction, a 1.4% reduction in compensation and benefit costs due to increased labor productivity, and a 0.1% decrease in occupancy and other operating expenses.
As a percentage of Brazil restaurant revenue, contribution margin improved 2.9% from 25.3% to 28.2%, due to a 1.1% reduction food and beverage costs primarily due to management’s focus on waste reduction, a 0.3% reduction in compensation and benefit costs due to leverage on higher revenue at our comparable restaurants and a 1.5% reduction in occupancy and other operating expenses due to leverage on higher revenue at our comparable stores and reduction in restaurant supplies expense.
66
Table of Contents
Fiscal Year Ended December 28, 2014 (52 weeks) Compared to Fiscal Year Ended December 29, 2013 (52 weeks)
| Fiscal Year Ended | Fiscal Year Ended | |||||||||||||||||||||||||||
| December 28, 2014 | December 29, 2013 | |||||||||||||||||||||||||||
| (52 weeks) | (52 weeks) | Increase / (Decrease) | ||||||||||||||||||||||||||
| (dollars in thousands) | Dollars | %(a) | Dollars | %(a) | Dollars | %(b) | %(c) | |||||||||||||||||||||
| Revenue |
||||||||||||||||||||||||||||
| U.S. Restaurant |
$ | 199,131 | 75.9 | % | $ | 162,442 | 74.1 | % | $ | 36,689 | 22.6 | % | 1.8 | % | ||||||||||||||
| Brazil Restaurant |
62,270 | 23.7 | 56,797 | 25.9 | 5,473 | 9.6 | (2.2 | ) | ||||||||||||||||||||
| Other |
879 | 0.3 | — | — | 879 | * | * | |||||||||||||||||||||
| Total revenue |
$ | 262,280 | 100.0 | % | $ | 219,239 | 100.0 | % | $ | 43,041 | 19.6 | % | * | |||||||||||||||
| Restaurant operating costs |
||||||||||||||||||||||||||||
| Food and beverage costs |
78,330 | 29.9 | 67,002 | 30.6 | 11,328 | 16.9 | (0.7 | ) | ||||||||||||||||||||
| Compensation and benefit costs |
54,673 | 20.8 | 46,860 | 21.4 | 7,813 | 16.7 | (0.6 | ) | ||||||||||||||||||||
| Occupancy and other operating expenses (excluding depreciation and amortization) |
44,156 | 16.8 | 36,703 | 16.7 | 7,453 | 20.3 | 0.1 | |||||||||||||||||||||
| Total restaurant operating costs |
$ | 177,159 | 67.5 | % | $ | 150,565 | 68.7 | % | $ | 26,594 | 17.7 | % | (1.2 | %) | ||||||||||||||
| Marketing and advertising costs |
5,585 | 2.1 | 6,188 | 2.8 | (603 | ) | (9.7 | ) | (0.7 | ) | ||||||||||||||||||
| General and administrative costs |
21,419 | 8.2 | 18,239 | 8.3 | 3,180 | 17.4 | (0.1 | ) | ||||||||||||||||||||
| Pre-opening costs |
1,951 | 0.7 | 4,764 | 2.2 | (2,813 | ) | (59.0 | ) | (1.5 | ) | ||||||||||||||||||
| Loss on modification of debt |
3,090 | 1.2 | 6,875 | 3.1 | (3,785 | ) | (55.1 | ) | (1.9 | ) | ||||||||||||||||||
| Depreciation and amortization |
11,638 | 4.4 | 8,989 | 4.1 | 2,649 | 29.5 | 0.3 | |||||||||||||||||||||
| Other operating (income) expense, net |
46 | 0.0 | (371 | ) | (0.2 | ) | (417 | ) | (112.4 | ) | (0.2 | ) | ||||||||||||||||
| Total costs and expenses |
$ | 220,888 | 84.2 | % | $ | 195,249 | 89.1 | % | $ | 25,639 | 13.1 | % | (4.9 | %) | ||||||||||||||
| Income from operations |
$ | 41,392 | 15.8 | % | $ | 23,990 | 10.9 | % | $ | 17,402 | 72.5 | % | 4.9 | % | ||||||||||||||
| Other income (expense): |
||||||||||||||||||||||||||||
| Interest expense, net |
(17,121 | ) | (6.5 | ) | (22,354 | ) | (10.2 | ) | (5,233 | ) | (23.4 | ) | (3.7 | ) | ||||||||||||||
| Other income (expense), net |
(7 | ) | (0.0 | ) | (101 | ) | (0.0 | ) | (94 | ) | (93.1 | ) | (0.0 | ) | ||||||||||||||
| Total other income (expense), net |
$ | (17,128 | ) | (6.5 | %) | $ | (22,455 | ) | (10.2 | %) | $ | (5,327 | ) | (23.7 | %) | (3.7 | %) | |||||||||||
| Income before income taxes |
24,264 | 9.3 | 1,535 | 0.7 | 22,729 | * | 8.6 | |||||||||||||||||||||
| Income tax expense |
6,991 | 2.7 | 2,472 | 1.1 | 4,519 | * | 1.6 | |||||||||||||||||||||
| Net income (loss) |
17,273 | 6.6 | (937 | ) | (0.4 | ) | 18,210 | * | 7.0 | |||||||||||||||||||
| Less: Loss attributable to noncontrolling interest |
(282 | ) | (0.1 | ) | — | — | (282 | ) | * | * | ||||||||||||||||||
| Net income (loss) attributable to |
$ | 17,555 | 6.7 | % | $ | (937 | ) | (0.4 | %) | $ | 18,492 | * | * | |||||||||||||||
| (a) | Calculated as a percentage of total revenue. |
| (b) | Calculated percentage increase / (decrease) in dollars. |
| (c) | Calculated increase / (decrease) in percentage of total revenue. |
| * | Not meaningful. |
Revenue
Total revenue increased $43.0 million, or 19.6%, for Fiscal 2014, primarily due to a $36.9 million increase in non-comparable restaurant sales for new restaurants opened in 2013 and 2014. Total comparable restaurant sales increased 4.9%, primarily driven by an increase in average check and guest traffic.
U.S. restaurant revenue increased $36.7 million, or 22.6%, due to increased non-comparable restaurant sales of $32.3 million and U.S. comparable restaurant sales increase of 2.9%, primarily driven by an increase in average check and guest traffic.
Brazil restaurant revenue increased $5.5 million, or 9.6%, due to increased comparable restaurant sales of 11.4% attributable to an increase in average check and guest traffic due to the World Cup in Brazil, an increase in non-comparable restaurant sales of $4.6 million, partially offset by a negative foreign exchange impact of $5.0 million.
67
Table of Contents
Other revenue includes gift card breakage revenue recognized by our U.S. operating segment during Fiscal 2014 related to gift cards whose likelihood of redemption was determined to be remote.
Food and Beverage Costs
Food and beverage costs increased $11.3 million, or 16.9%, for Fiscal 2014, primarily due to a $10.5 million increase in food costs from new restaurants opened since the end of the prior period and the full period of operation of restaurants opened in the prior period. As a percentage of total revenue, total food and beverage costs decreased from 30.6% to 29.9%, due to favorable pricing on beef contracts executed in 2014, and management’s focus on waste reduction and production efficiencies.
Compensation and Benefit Costs
Compensation and benefit costs increased $7.8 million, or 16.7%, for Fiscal 2014, primarily due to a $9.5 million increase in additional labor needs resulting from new restaurants opened since the end of the prior period and the full period of operation of restaurants opened in the prior period. As a percentage of total revenue, total compensation and benefits costs decreased from 21.4% to 20.8%, due to improved labor productivity and a reduction in benefits expense, and leverage on higher revenue at our comparable restaurants.
Occupancy and Other Operating Expenses
Occupancy and other operating expenses increased $7.5 million, or 20.3%, for Fiscal 2014, primarily due to a $7.1 million increase in expense resulting from new restaurants opened since the end of the prior period and the full period of operation of restaurants opened in the prior period. As a percentage of total revenue, total occupancy and other operating costs increased from 16.7% to 16.8%, primarily due to increased rent as a percentage of revenue for the new restaurants noted above partially offset by leverage on higher revenue at our comparable restaurants.
Marketing and Advertising Costs
Marketing and advertising costs decreased $0.6 million, or 9.7%, for Fiscal 2014. As a percentage of total revenue, marketing and advertising costs decreased from 2.8% to 2.1% primarily due to a reduction in national television spend during the fourth quarter of Fiscal 2014 compared to Fiscal 2013, as we focused on optimizing our marketing spend across various media.
General and Administrative Costs
General and administrative costs increased $3.2 million, or 17.4%, for Fiscal 2014, due to a $1.6 million increase in compensation expense due to hiring additional corporate resources to enhance key functional areas and support future growth. As a percentage of total revenue, general and administrative costs decreased from 8.3% to 8.2% as revenue growth exceeded our fixed base of general and administrative costs despite our continued investments in personnel to support future growth and increased legal and travel expenses associated with establishing our joint ventures.
Pre-opening Costs
Pre-opening costs decreased $2.8 million to $2.0 million for Fiscal 2014, due to three restaurants incurring pre-opening costs during Fiscal 2014 versus five restaurants in Fiscal 2013.
Loss on Modification of Debt
Loss on modification of debt was $3.1 million in Fiscal 2014, due to non-cash charges related to our 2014 Credit Facility Refinancing.
Interest Expense
Interest expense decreased $5.2 million, or 23.4%, for Fiscal 2014, primarily due to a reduction in interest rates on our Senior Credit Facilities resulting from our 2014 Credit Facility Refinancing.
68
Table of Contents
Income Tax Expense
Income tax expense increased $4.5 million to $7.0 million for Fiscal 2014, due to an increase in net income before income taxes of $22.7 million, offset by a reduction in the valuation allowance of $1.7 million in the current period.
During Fiscal 2014, we identified errors of $0.6 million in consolidated income tax expense for Fiscal 2013, and $0.6 million in consolidated comprehensive loss for the period from May 24, 2012 to December 30, 2012. The errors related to accounting entries made in connection with deferred tax assets recorded on cumulative translation adjustments in Fiscal 2012, and the subsequent recording of a valuation allowance on such adjustments in Fiscal 2013. The Company corrected these errors in the fourth quarter of Fiscal 2014, which had an effect of reducing income tax expense by $0.6 million, and reducing other comprehensive income for Fiscal 2014.
| Restaurant Contribution |
||||||||||||||||||||||||||||
| Fiscal Year Ended December 28, 2014 |
Fiscal Year Ended December 29, 2013 |
Increase /(Decrease) | ||||||||||||||||||||||||||
| (52 weeks) | (52 weeks) | |||||||||||||||||||||||||||
| (dollars in thousands) | Dollars | %(a) | Dollars | %(a) | Dollars | %(b) | %(c) | |||||||||||||||||||||
| Revenue |
||||||||||||||||||||||||||||
| U.S. Restaurant |
$ | 199,131 | 75.9 | % | $ | 162,442 | 74.1 | % | $ | 36,689 | 22.6 | % | 1.8 | % | ||||||||||||||
| Brazil Restaurant |
62,270 | 23.7 | 56,797 | 25.9 | 5,473 | 9.6 | (2.2 | ) | ||||||||||||||||||||
| Other |
879 | 0.3 | — | — | 879 | * | * | |||||||||||||||||||||
| Total revenue |
$ | 262,280 | 100.0 | % | $ | 219,239 | 100.0 | % | $ | 43,041 | 19.6 | % | * | |||||||||||||||
| Restaurant operating costs |
||||||||||||||||||||||||||||
| U.S. |
$ | 137,007 | 68.8 | % | $ | 113,111 | 69.6 | % | $ | 23,896 | 21.1 | % | (0.8 | %) | ||||||||||||||
| Brazil |
40,152 | 64.5 | 37,454 | 65.9 | 2,698 | 7.2 | (1.4 | ) | ||||||||||||||||||||
| Total restaurant operating costs |
$ | 177,159 | 67.5 | % | $ | 150,565 | 68.7 | % | $ | 26,594 | 17.7 | % | (1.2 | %) | ||||||||||||||
| Restaurant contribution |
||||||||||||||||||||||||||||
| U.S. |
$ | 62,124 | 31.2 | % | $ | 49,331 | 30.4 | % | $ | 12,793 | 25.9 | % | 0.8 | % | ||||||||||||||
| Brazil |
22,118 | 35.5 | 19,343 | 34.1 | 2,775 | 14.3 | 1.4 | |||||||||||||||||||||
| Other |
879 | * | — | — | * | * | * | |||||||||||||||||||||
| Total restaurant contribution |
$ | 85,121 | 32.5 | % | $ | 68,674 | 31.3 | % | $ | 16,447 | 23.9 | % | 1.2 | % | ||||||||||||||
| (a) | Calculated as a percentage of total revenue or segment revenue where applicable. |
| (b) | Calculated percentage increase / (decrease) in dollars. |
| (c) | Calculated increase / (decrease) in percentage of total revenue or segment revenue where applicable. |
| * | Not meaningful. |
Total restaurant contribution increased $16.4 million, or 23.9%, for Fiscal 2014, primarily due to a $9.8 million increase in new restaurants opened since the end of the prior period and the full period of operation of restaurants opened in the prior period. As a percentage of revenue, total restaurant contribution increased from 31.3% to 32.5%.
As a percentage of U.S. restaurant revenue, contribution margin increased 0.8% from 30.4% to 31.2%, due to a 0.7% reduction in food and beverage costs due to favorable pricing on beef contracts executed in Fiscal 2014, management’s focus on waste reduction and a 0.6% reduction in compensation and benefit costs due to increased labor productivity, partially offset by a 0.5% increase in occupancy and other operating expenses attributable to the new restaurants noted above.
As a percentage of Brazil restaurant revenue, contribution margin improved 1.4% from 34.1% to 35.5%, due to a 1.0% reduction in compensation and benefit costs and a 0.7% reduction in occupancy and other operating expenses due to leverage on higher revenue at our comparable restaurants for labor and operating expenses, offset by commodity increases on our food and beverage costs.
Other revenue includes gift card breakage revenue recognized by our U.S. operating segment during Fiscal 2014 related to gift cards whose likelihood of redemption was determined to be remote.
69
Table of Contents
Financial Presentation
The historical consolidated financial information has been derived from the financial statements and accounting records of Fogo de Chão, Inc. (Successor) for periods on and after May 24, 2012, and from the financial statements and accounting records of the “Predecessor” company for the period prior to July 21, 2012. Financial information in the Predecessor period relates to Fogo de Chão Churrascaria (Holdings) LLC and its subsidiaries. For purposes of presenting a comparison of our Fiscal 2013 results to Fiscal 2012, we have presented our 2012 results first as standalone results for the Predecessor for the period from January 2, 2012 to July 20, 2012 and the Successor for the period from May 24, 2012 (Inception) to December 30, 2012 and next as the mathematical addition of the Predecessor and Successor periods. We believe that the presentation with mathematical additions provides meaningful information about our results of operations on a period-to-period basis. This approach is not consistent with US GAAP, may yield results that are not strictly comparable on a period-to-period basis and may not reflect the actual results we would have achieved. The table and discussion showing the period from May 24, 2012 (Inception) to December 30, 2012 is presented first and the table and discussion showing the combined 2012 results follow.
Fiscal Year Ended December 29, 2013 (52 weeks) Compared to the Period from May 24 (Inception) to December 30, 2012 (23 operating weeks)
| Successor | Predecessor | |||||||||||||||||||||||||||||||||
| Fiscal Year Ended December 29, 2013 |
Period from May 24 (Inception) to December 30, 2012 |
Period from January 2 to July 20, 2012 |
||||||||||||||||||||||||||||||||
| (52 weeks) | (23 weeks) | Increase / (Decrease) | (29 weeks) | |||||||||||||||||||||||||||||||
| (dollars in thousands) | Dollars | %(a) | Dollars | %(a) | Dollars | %(b) | %(c) | Dollars | ||||||||||||||||||||||||||
| Revenue |
||||||||||||||||||||||||||||||||||
| U.S. Restaurant |
$ | 162,442 | 74.1 | % | $ | 66,853 | 71.2 | % | $ | 95,589 | 143.0 | % | 2.9 | % | $ | 79,327 | ||||||||||||||||||
| Brazil Restaurant |
56,797 | 25.9 | 26,991 | 28.8 | 29,806 | 110.4 | (2.9 | ) | 29,189 | |||||||||||||||||||||||||
| Total revenue |
$ | 219,239 | 100.0 | % | $ | 93,844 | 100.0 | % | $ | 125,395 | 133.6 | % | * | $ | 108,516 | |||||||||||||||||||
| Restaurant operating costs |
||||||||||||||||||||||||||||||||||
| Food and beverage costs |
67,002 | 30.6 | 29,381 | 31.3 | 37,621 | 128.0 | (0.7 | ) | 34,512 | |||||||||||||||||||||||||
| Compensation and benefit costs |
46,860 | 21.4 | 21,125 | 22.5 | 25,735 | 121.8 | (1.1 | ) | 22,348 | |||||||||||||||||||||||||
| Occupancy and other operating expenses (excluding depreciation and amortization) |
36,703 | 16.7 | 15,478 | 16.5 | 21,225 | 137.1 | 0.2 | 18,061 | ||||||||||||||||||||||||||
| Total restaurant operating costs |
$ | 150,565 | 68.7 | % | $ | 65,984 | 70.3 | % | $ | 84,581 | 128.2 | % | (1.6 | %) | $ | 74,921 | ||||||||||||||||||
| Marketing and advertising costs |
6,188 | 2.8 | 2,342 | 2.5 | 3,846 | 164.2 | 0.3 | 2,488 | ||||||||||||||||||||||||||
| General and administrative costs |
18,239 | 8.3 | 8,143 | 8.7 | 10,096 | 124.0 | (0.4 | ) | 10,229 | |||||||||||||||||||||||||
| Pre-opening costs |
4,764 | 2.2 | 1,119 | 1.2 | 3,645 | 325.7 | 1.0 | 1,359 | ||||||||||||||||||||||||||
| Acquisition costs |
— | 0.0 | 11,988 | 12.8 | (11,988 | ) | * | (12.8 | ) | 6,963 | ||||||||||||||||||||||||
| Loss on modification/extinguishment of debt |
6,875 | 3.1 | — | 0.0 | 6,875 | * | 3.1 | 7,762 | ||||||||||||||||||||||||||
| Depreciation and amortization |
8,989 | 4.1 | 3,736 | 4.0 | 5,253 | 140.6 | 0.1 | 5,114 | ||||||||||||||||||||||||||
| Other operating (income) expense, net |
(371 | ) | (0.2 | ) | (169 | ) | (0.2 | ) | (202 | ) | 119.5 | 0.0 | (157 | ) | ||||||||||||||||||||
| Total costs and expenses |
$ | 195,249 | 89.1 | % | $ | 93,143 | 99.3 | % | $ | 102,106 | 109.6 | % | (10.2 | %) | $ | 108,679 | ||||||||||||||||||
| Income (loss) from operations |
$ | 23,990 | 10.9 | % | $ | 701 | 0.7 | % | $ | 23,289 | * | 10.2 | % | $ | (163 | ) | ||||||||||||||||||
| Other income (expense): |
||||||||||||||||||||||||||||||||||
| Interest expense, net |
(22,354 | ) | (10.2 | ) | (10,908 | ) | (11.6 | ) | 11,446 | 104.9 | (1.4 | ) | (7,359 | ) | ||||||||||||||||||||
| Other income (expense), net |
(101 | ) | 0.0 | (20 | ) | 0.0 | 81 | 405.0 | 0.0 | (68 | ) | |||||||||||||||||||||||
| Total other income (expense), net |
$ | (22,455 | ) | (10.2 | %) | $ | (10,928 | ) | (11.6 | %) | $ | 11,527 | 105.5 | % | (1.4 | %) | $ | (7,427 | ) | |||||||||||||||
| Income (loss) before income taxes |
1,535 | 0.7 | (10,227 | ) | (10.9 | ) | 11,762 | * | 11.6 | (7,590 | ) | |||||||||||||||||||||||
| Income tax expense (benefit) |
2,472 | 1.1 | (1,195 | ) | (1.3 | ) | 3,667 | * | 2.4 | 1,294 | ||||||||||||||||||||||||
| Net income (loss) |
$ | (937 | ) | (0.4 | %) | $ | (9,032 | ) | (9.6 | %) | $ | 8,095 | 89.6 | % | 9.2 | % | $ | (8,884 | ) | |||||||||||||||
| (a) | Calculated percentage of total revenue. |
| (b) | Calculated percentage increase / (decrease) in dollars. |
70
Table of Contents
| (c) | Calculated increase / (decrease) in percentage of total revenue. |
| * | Not meaningful. |
Revenue
Total revenue increased $125.4 million, or 133.6%, for Fiscal 2013, primarily due to 29 additional company operating weeks in the current period.
U.S. restaurant revenue increased $95.6 million, or 143.0%, for Fiscal 2013, primarily due to 29 additional company operating weeks in the current period.
Brazil restaurant revenue increased $29.8 million, or 110.4%, for Fiscal 2013, primarily due to 29 additional company operating weeks in the current period.
Food and Beverage Costs
Food and beverage costs increased $37.6 million, or 128.0%, for Fiscal 2013, primarily due to 29 additional company operating weeks in the current period.
Compensation and Benefit Costs
Compensation and benefit costs increased $25.7 million, or 121.8%, for Fiscal 2013, primarily due to 29 additional company operating weeks in the current period. As a percentage of total revenue, total compensation and benefit costs decreased from 22.5% during the period from May 24, 2012 to December 30, 2012 to 21.4% during Fiscal 2013.
Occupancy and Other Operating Expenses
Occupancy and other operating expenses increased $21.2 million, or 137.1%, for Fiscal 2013, primarily due to 29 additional company operating weeks in the current period. As a percentage of total revenue, total occupancy and other operating expenses increased from 16.5% during the period from May 24, 2012 to December 30, 2012 to 16.7% during Fiscal 2013.
Marketing and Advertising Costs
Marketing and advertising costs increased $3.8 million, or 164.2%, for Fiscal 2013, primarily due to 29 additional company operating weeks in the current period. As a percentage of total revenue, marketing and advertising costs increased from 2.5% during the period from May 24, 2012 to December 30, 2012 to 2.8% during Fiscal 2013.
General and Administrative Costs
General and administrative costs increased $10.1 million, or 124.0%, for Fiscal 2013, primarily due to 29 additional company operating weeks in the current period. As a percentage of total revenue, general and administrative costs decreased from 8.7% during the period from May 24, 2012 to December 30, 2012 to 8.3% during Fiscal 2013.
Pre-opening Costs
Pre-opening costs increased $3.6 million to $4.8 million for Fiscal 2013, primarily due to five restaurants incurring pre-opening costs during the current period compared to one in the prior period.
Loss on Modification of Debt
Loss on modification of debt was $6.9 million in Fiscal 2013 due to non-cash charges related to the re-pricing of our First Lien Credit Facility in August 2013.
Depreciation and Amortization Expense
Depreciation and amortization expense increased $5.3 million, or 140.6%, for Fiscal 2013, primarily due to 29 additional company operating weeks in the current period.
71
Table of Contents
Interest Expense
Interest expense increased $11.4 million, or 104.9%, for Fiscal 2013, primarily due to 29 additional company operating weeks in the current period.
Income Tax Expense (Benefit)
Income tax expense increased to $2.5 million for Fiscal 2013, from a benefit of $1.2 million for the period from May 24, 2012 to December 30, 2012, primarily due to net income before tax of $1.5 million in the current period compared to a net loss before tax of $10.2 million in the prior period.
Restaurant Contribution
| Successor | Predecessor | |||||||||||||||||||||||||||||||||
| Fiscal Year Ended December 29, 2013 |
Period from May 24 (Inception) to December 30, 2012 |
Period from January 2 to July 20, 2012 |
||||||||||||||||||||||||||||||||
| (52 weeks) | (23 weeks) | Increase / (Decrease) | (29 weeks) | |||||||||||||||||||||||||||||||
| (dollars in thousands) | Dollars | %(a) | Dollars | %(a) | Dollars | %(b) | %(c) | Dollars | ||||||||||||||||||||||||||
| Revenue |
||||||||||||||||||||||||||||||||||
| U.S. Restaurant |
$ | 162,442 | 74.1 | % | $ | 66,853 | 71.2 | % | $ | 95,589 | 143.0 | % | 2.9 | % | $ | 79,327 | ||||||||||||||||||
| Brazil Restaurant |
56,797 | 25.9 | 26,991 | 28.8 | 29,806 | 110.4 | (2.9 | ) | 29,189 | |||||||||||||||||||||||||
| Total revenue |
$ | 219,239 | 100.0 | % | $ | 93,844 | 100.0 | % | $ | 125,395 | 133.6 | % | * | $ | 108,516 | |||||||||||||||||||
| Restaurant operating costs |
||||||||||||||||||||||||||||||||||
| U.S. |
$ | 113,111 | 69.6 | % | $ | 49,336 | 73.8 | % | $ | 63,775 | 129.3 | % | (4.2 | %) | $ | 56,343 | ||||||||||||||||||
| Brazil |
37,454 | 65.9 | 16,648 | 61.7 | 20,806 | 125.0 | 4.2 | 18,578 | ||||||||||||||||||||||||||
| Total restaurant operating costs |
$ | 150,565 | 68.7 | % | $ | 65,984 | 70.3 | % | $ | 84,581 | 128.2 | % | (1.6 | %) | $ | 74,921 | ||||||||||||||||||
| Restaurant contribution |
||||||||||||||||||||||||||||||||||
| U.S. |
$ | 49,331 | 30.4 | % | $ | 17,517 | 26.2 | % | $ | 31,814 | 181.6 | % | 4.2 | % | $ | 22,984 | ||||||||||||||||||
| Brazil |
19,343 | 34.1 | 10,343 | 38.3 | 9,000 | 87.0 | (4.2 | ) | 10,611 | |||||||||||||||||||||||||
| Total restaurant contribution |
$ | 68,674 | 31.3 | % | $ | 27,860 | 29.7 | % | $ | 40,814 | 146.5 | % | 1.6 | % | $ | 33,595 | ||||||||||||||||||
| (a) | Calculated as a percentage of total revenue or segment revenue where applicable. |
| (b) | Calculated percentage increase / (decrease) in dollars. |
| (c) | Calculated increase / (decrease) in percentage of total revenue or segment revenue where applicable. |
| * | Not meaningful. |
Total restaurant contribution increased $40.8 million, or 146.5%, for Fiscal 2013, primarily due to 29 additional operating weeks in Fiscal 2013.
U.S. contribution margin increased $31.8 million, or 181.6%, for Fiscal 2013, primarily due to 29 additional operating weeks in Fiscal 2013.
Brazil contribution margin increased $9.0 million, or 87.0%, for Fiscal 2013, primarily due to 29 additional operating weeks in Fiscal 2013.
72
Table of Contents
Supplemental Comparison of Fiscal Year Ended December 29, 2013 (52 weeks) Compared to the Combined Period from January 2, 2012 to December 30, 2012 (52 weeks)
| Successor | Predecessor | |||||||||||||||||||||||||||||||||||
| Combined | Period from May 24 (Inception) to December 30, |
Period from January 2 to July 20, 2012 |
||||||||||||||||||||||||||||||||||
| Fiscal Year Ended December 29, 2013 |
Fiscal Year Ended December 30, 2012 |
|||||||||||||||||||||||||||||||||||
| (52 weeks) | (52 weeks) | Increase / (Decrease) | (23 weeks) | (29 weeks) | ||||||||||||||||||||||||||||||||
| (dollars in thousands) | Dollars | %(a) | Dollars | %(a) | Dollars | %(b) | %(c) | Dollars | Dollars | |||||||||||||||||||||||||||
| Revenue |
||||||||||||||||||||||||||||||||||||
| U.S. Restaurant |
$ | 162,442 | 74.1 | % | $ | 146,180 | 72.2 | % | $ | 16,262 | 11.1 | % | 1.9 | % | $ | 66,853 | $ | 79,327 | ||||||||||||||||||
| Brazil Restaurant |
56,797 | 25.9 | 56,180 | 27.8 | 617 | 1.1 | (1.9 | ) | 26,991 | 29,189 | ||||||||||||||||||||||||||
| Total revenue |
$ | 219,239 | 100.0 | % | $ | 202,360 | 100.0 | % | $ | 16,879 | 8.3 | % | * | $ | 93,844 | $ | 108,516 | |||||||||||||||||||
| Restaurant operating costs |
||||||||||||||||||||||||||||||||||||
| Food and beverage costs |
67,002 | 30.6 | 63,893 | 31.6 | 3,109 | 4.9 | (1.0 | ) | 29,381 | 34,512 | ||||||||||||||||||||||||||
| Compensation and benefit costs |
46,860 | 21.4 | 43,473 | 21.5 | 3,387 | 7.8 | (0.1 | ) | 21,125 | 22,348 | ||||||||||||||||||||||||||
| Occupancy and other operating expenses (excluding depreciation and amortization) |
36,703 | 16.7 | 33,539 | 16.6 | 3,164 | 9.4 | 0.1 | 15,478 | 18,061 | |||||||||||||||||||||||||||
| Total restaurant operating costs |
$ | 150,565 | 68.7 | % | $ | 140,905 | 69.6 | % | $ | 9,660 | 6.9 | % | (0.9 | %) | $ | 65,984 | $ | 74,921 | ||||||||||||||||||
| Marketing and advertising costs |
6,188 | 2.8 | 4,830 | 2.4 | 1,358 | 28.1 | 0.4 | 2,342 | 2,488 | |||||||||||||||||||||||||||
| General and administrative costs |
18,239 | 8.3 | 18,372 | 9.1 | (133 | ) | (0.7 | ) | (0.8 | ) | 8,143 | 10,229 | ||||||||||||||||||||||||
| Pre-opening costs |
4,764 | 2.2 | 2,478 | 1.2 | 2,286 | 92.3 | 1.0 | 1,119 | 1,359 | |||||||||||||||||||||||||||
| Acquisition costs |
— | 0.0 | 18,951 | 9.4 | (18,951 | ) | * | (9.4 | ) | 11,988 | 6,963 | |||||||||||||||||||||||||
| Loss on modification/extinguishment of debt |
6,875 | 3.1 | 7,762 | 3.8 | (887 | ) | * | (0.7 | ) | — | 7,762 | |||||||||||||||||||||||||
| Depreciation and amortization |
8,989 | 4.1 | 8,850 | 4.4 | 139 | 1.6 | (0.3 | ) | 3,736 | 5,114 | ||||||||||||||||||||||||||
| Other operating (income) expense, net |
(371 | ) | (0.2 | ) | (326 | ) | (0.2 | ) | (45 | ) | 13.8 | 0.0 | (169 | ) | (157 | ) | ||||||||||||||||||||
| Total costs and expenses |
$ | 195,249 | 89.1 | % | $ | 201,822 | 99.7 | % | $ | (6,573 | ) | (3.3 | %) | (10.6 | %) | $ | 93,143 | $ | 108,679 | |||||||||||||||||
| Income (loss) from operations |
$ | 23,990 | 10.9 | % | $ | 538 | 0.3 | % | $ | 23,452 | * | 10.6 | % | $ | 701 | $ | (163 | ) | ||||||||||||||||||
| Other income (expense): |
||||||||||||||||||||||||||||||||||||
| Interest expense, net |
(22,354 | ) | (10.2 | ) | (18,267 | ) | (9.0 | ) | 4,087 | 22.4 | 1.2 | (10,908 | ) | (7,359 | ) | |||||||||||||||||||||
| Other income (expense), net |
(101 | ) | 0.0 | (88 | ) | 0.0 | 13 | 14.8 | 0.0 | (20 | ) | (68 | ) | |||||||||||||||||||||||
| Total other income (expense), net |
$ | (22,455 | ) | (10.2 | %) | $ | (18,355 | ) | (9.1 | %) | $ | 4,100 | 22.3 | % | 1.1 | % | $ | (10,928 | ) | $ | (7,427 | ) | ||||||||||||||
| Income (loss) before income taxes |
1,535 | 0.7 | (17,817 | ) | (8.8 | ) | 19,352 | * | 9.5 | (10,227 | ) | (7,590 | ) | |||||||||||||||||||||||
| Income tax expense (benefit) |
2,472 | 1.1 | 99 | 0.0 | 2,373 | * | 1.1 | (1,195 | ) | 1,294 | ||||||||||||||||||||||||||
| Net income (loss) |
$ | (937 | ) | (0.4 | %) | $ | (17,916 | ) | (8.9 | %) | $ | 16,979 | 94.8 | % | 8.5 | % | $ | (9,032 | ) | $ | (8,884 | ) | ||||||||||||||
| (a) | Calculated percentage of total revenue. |
| (b) | Calculated percentage increase / (decrease) in dollars. |
| (c) | Calculated increase / (decrease) in percentage of total revenue. |
| * | Not meaningful. |
73
Table of Contents
Revenue
Total revenue increased $16.9 million, or 8.3%, for Fiscal 2013, primarily due to a $19.3 million increase in non-comparable restaurant sales for new restaurants opened in 2012 and 2013. Comparable restaurant sales increased 1.3% primarily driven by an increase in average check. The increase in comparable sales was offset by a $4.6 million foreign exchange impact.
U.S. restaurant revenue increased $16.3 million, or 11.1%, for Fiscal 2013, due to increased non-comparable restaurant sales of $14.4 million and U.S. comparable restaurant sales increase of 1.4%, primarily driven by an increase in average check.
Brazil restaurant revenue increased $0.6 million, or 1.1%, due to increased non-comparable restaurant sales of $5.0 million, and Brazil comparable restaurant sales increase of 1.1% primarily driven by an increase in average check, offset by a negative foreign exchange impact of $4.6 million.
Food and Beverage Costs
Food and beverage costs increased $3.1 million, or 4.9%, for Fiscal 2013, due to a $5.5 million increase in food costs from new restaurants opened in the prior period, offset by a $2.4 million decrease due to a focus on waste reduction and optimizing our mix of proteins, as well as favorable beef pricing from contracts executed in Fiscal 2013. As a percentage of total revenue, total food and beverage costs decreased from 31.6% to 30.6%, primarily due to the food cost initiatives noted above, partially offset by inflation in commodity costs in Brazil.
Compensation and Benefit Costs
Compensation and benefit costs increased $3.4 million, or 7.8%, for Fiscal 2013, primarily due to a $4.4 million increase in additional labor needs resulting from new restaurants opened since the end of the prior period and the full period operation in the current period of restaurants opened in the prior period. The increase in labor costs was offset by a reduction in share-based compensation expense recognized in 2013 of $2.1 million. The share-based compensation expense in 2013 was reduced relative to 2012 primarily due to the Acquisition in the prior year. As a percentage of total revenue, total compensation and benefit costs decreased from 21.5% to 21.4%, due to improved labor productivity and a reduction in share-based compensation expense recognized, offset by inflation in hourly wages in Brazil.
Occupancy and Other Operating Expenses
Occupancy and other operating expenses increased $3.2 million, or 9.4%, for Fiscal 2013, primarily due to a $3.1 million increase in expenses resulting from new restaurants that opened since the end of the prior period and the full period operation in the current period of the restaurants that opened in the prior period. As a percentage of total revenue, total occupancy and other operating expenses increased from 16.6% to 16.7% primarily due to increased rent as a percentage of revenue for the new restaurants noted above.
Marketing and Advertising Costs
Marketing and advertising costs increased $1.4 million, or 28.1%, for Fiscal 2013, primarily due to an increase in production costs and television advertising in the fourth quarter of 2013 related to the launch of a new advertising campaign. As a percentage of total revenue, marketing and advertising costs increased from 2.4% to 2.8% due to increased costs noted above.
General and Administrative Costs
General and administrative costs decreased $0.1 million, or 0.7%, for Fiscal 2013. The decrease is attributable to approximately $5.1 million in equity-based compensation expense primarily related to the Acquisition in the prior year. The decrease was offset by increased costs due to incremental personnel in key functional areas as we invested to support future growth. As a percentage of total revenue, general and administrative costs decreased from 9.1% to 8.3% due to the share-based compensation expense primarily related to the Acquisition in the prior year. Excluding the equity-based compensation expense in the prior year attributable to the Acquisition, general and administrative expense as a percentage of total revenue increased from 6.4% in 2012 to 8.3% in 2013 due to personnel investments to support future growth.
74
Table of Contents
Pre-opening Costs
Pre-opening costs increased $2.3 million to $4.8 million for Fiscal 2013, due to five restaurants incurring pre-opening costs during the current period compared to three in the prior period.
Loss on Modification of Debt
Loss on modification of debt was $6.9 million for Fiscal 2013, due to a non-cash charge related to the re-pricing of our First Lien Credit Facility in August 2013. Loss on modification of debt was $7.8 million for Fiscal 2012, due to non-cash charges related to the financing of the Acquisition in July 2012.
Interest Expense
Interest expense increased $4.1 million, or 22.4%, for Fiscal 2013, due to a higher average debt balance in 2013 versus 2012 due to the additional debt incurred to finance the Acquisition in July 2012.
Income Tax Expense
Income tax expense increased $2.4 million to $2.5 million for Fiscal 2013, due to an increase in net income of $1.5 million from a net loss of $17.8 million in the prior year. Additionally, in Fiscal 2013 we recorded a $2.5 million charge to income tax expense to establish a valuation allowance on deferred tax assets.
Restaurant Contribution
| Successor | Predecessor | |||||||||||||||||||||||||||||||||||||
| Combined | Period from May 24 (Inception) to December 30, 2012 |
Period from January 2 to July 20, 2012 |
||||||||||||||||||||||||||||||||||||
| Fiscal Year Ended December 29, 2013 |
Fiscal Year Ended December 30, 2012 |
|||||||||||||||||||||||||||||||||||||
| (52 weeks) | (52 weeks) | Increase / (Decrease) | (23 weeks) | (29 weeks) | ||||||||||||||||||||||||||||||||||
| (dollars in thousands) | Dollars | %(a) | Dollars | %(a) | Dollars | %(b) | %(c) | Dollars | Dollars | |||||||||||||||||||||||||||||
| Revenue |
||||||||||||||||||||||||||||||||||||||
| U.S. Restaurant |
$ | 162,442 | 74.1 | % | $ | 146,180 | 72.2 | % | $ | 16,262 | 11.1 | % | 1.9 | % | $ | 66,853 | $ | 79,327 | ||||||||||||||||||||
| Brazil Restaurant |
56,797 | 25.9 | 56,180 | 27.8 | 617 | 1.1 | (1.9 | ) | 26,991 | 29,189 | ||||||||||||||||||||||||||||
| Total revenue |
$ | 219,239 | 100.0 | % | $ | 202,360 | 100.0 | % | $ | 16,879 | 8.3 | % | * | $ | 93,844 | $ | 108,516 | |||||||||||||||||||||
| Restaurant operating costs |
||||||||||||||||||||||||||||||||||||||
| U.S. |
$ | 113,111 | 69.6 | % | $ | 105,679 | 72.3 | % | $ | 7,432 | 7.0 | % | (2.7 | %) | $ | 49,336 | $ | 56,343 | ||||||||||||||||||||
| Brazil |
37,454 | 65.9 | 35,226 | 62.7 | 2,228 | 6.3 | 3.2 | 16,648 | 18,578 | |||||||||||||||||||||||||||||
| Total restaurant operating costs |
$ | 150,565 | 68.7 | % | $ | 140,905 | 69.6 | % | $ | 9,660 | 6.9 | % | (0.9 | %) | $ | 65,984 | $ | 74,921 | ||||||||||||||||||||
| Restaurant contribution |
||||||||||||||||||||||||||||||||||||||
| U.S. |
$ | 49,331 | 30.4 | % | $ | 40,501 | 27.7 | % | $ | 8,830 | 21.8 | % | 2.7 | % | $ | 17,517 | $ | 22,984 | ||||||||||||||||||||
| Brazil |
19,343 | 34.1 | 20,954 | 37.3 | (1,611 | ) | (7.7 | ) | (3.2 | ) | 10,343 | 10,611 | ||||||||||||||||||||||||||
| Total restaurant contribution |
$ | 68,674 | 31.3 | % | $ | 61,455 | 30.4 | % | $ | 7,219 | 11.7 | % | 0.9 | % | $ | 27,860 | $ | 33,595 | ||||||||||||||||||||
| (a) | Calculated as a percentage of total revenue or segment revenue where applicable. |
| (b) | Calculated percentage increase / (decrease) in dollars. |
| (c) | Calculated increase / (decrease) in percentage of total revenue or segment revenue where applicable. |
| * | Not meaningful. |
Total restaurant contribution increased $7.2 million, or 11.7%, for Fiscal 2013, primarily due to a $6.2 million increase related to new restaurants opened since the end of the prior period as well as the full period of operation of restaurants opened in the prior period. As a percentage of total revenue, total restaurant contribution increased from 30.4% to 31.3%.
As a percentage of U.S. restaurant revenue, U.S. contribution margin increased 2.7% from 27.7% to 30.4%, due to a 1.6% reduction in food and beverage costs due to favorable pricing on beef contracts executed in 2013 and management’s focus on waste reduction, a 1.0% reduction in compensation and benefit costs due to improved labor productivity and a reduction in share-based compensation expense recognized.
75
Table of Contents
As a percentage of Brazil restaurant revenue, Brazil contribution margin decreased 3.2% from 37.3% to 34.1%, due to 1.6% increase in compensation and benefits costs due to inflation in hourly wages, a 0.9% increase in food and beverage costs due to commodity increases and a 0.8% increase in occupancy and other operating costs due to new stores, all partially offset by leverage on higher average check at our comparable restaurants.
Unaudited Quarterly Statements of Operations
The following tables present our unaudited quarterly results of operations for the fiscal quarter ended March 29, 2015 and for each of the eight fiscal quarters in the period ended December 28, 2014. You should read the following tables in conjunction with our audited and unaudited consolidated financial statements and related notes appearing at the end of this prospectus. We have prepared the unaudited financial information on a basis consistent with our audited consolidated financial statements and have included all adjustments, consisting of normal recurring adjustments, which, in the opinion of management, are necessary to fairly present our operating results for the quarters presented. Our historical unaudited quarterly results of operations are not necessarily indicative of results for any future quarter or for a full year.
Our quarterly results of operations have historically varied due to a variety of factors, including the timing of new restaurant openings and related expenses, profitability of new restaurants, weather, increases or decreases in comparable restaurant sales, foreign exchange fluctuations, general economic conditions, consumer confidence in the economy, changes in consumer preferences, competitive factors, changes in food costs, changes in labor costs and rising gas prices. In the past, we have experienced significant variability in restaurant pre-opening costs from quarter to quarter primarily due to the timing of restaurant openings. Accordingly, the number and timing of new restaurant openings in any quarter has had, and is expected to continue to have, a significant impact on quarterly restaurant pre-opening costs, labor and direct operating and occupancy costs. As such, we believe that comparisons of our quarterly results of operations should not be relied upon as an indication of our future performance.
| Fiscal Quarter Ended |
Fiscal 2014 Quarter Ended | Fiscal 2013 Quarter Ended | ||||||||||||||||||||||||||||||||||
| (dollars in thousands) | March 29, 2015 |
December 28 | September 28 | June 29 | March 30 | December 29 | September 29 | June 30 | March 31 | |||||||||||||||||||||||||||
| Revenue |
$ | 64,959 | $ | 68,727 | $ | 63,694 | $ | 68,542 | $ | 61,317 | $ | 60,852 | $ | 48,780 | $ | 53,768 | $ | 55,839 | ||||||||||||||||||
| Restaurant operating costs: |
||||||||||||||||||||||||||||||||||||
| Food and beverage costs |
19,164 | 20,185 | 18,819 | 20,779 | 18,547 | 18,780 | 15,175 | 15,969 | 17,078 | |||||||||||||||||||||||||||
| Compensation and benefit costs |
14,100 | 13,954 | 13,047 | 13,781 | 13,891 | 12,697 | 11,136 | 11,244 | 11,783 | |||||||||||||||||||||||||||
| Occupancy and other operating expenses (excluding depreciation and amortization) |
11,174 | 11,115 | 11,056 | 11,165 | 10,820 | 9,834 | 8,972 | 8,983 | 8,914 | |||||||||||||||||||||||||||
| Total restaurant operating costs |
$ | 44,438 | $ | 45,254 | $ | 42,922 | $ | 45,725 | $ | 43,258 | $ | 41,311 | $ | 35,283 | $ | 36,196 | $ | 37,775 | ||||||||||||||||||
| Marketing and advertising costs |
1,402 | 1,305 | 1,431 | 1,407 | 1,442 | 3,043 | 1,100 | 1,072 | 973 | |||||||||||||||||||||||||||
| General and administrative costs |
5,708 | 5,885 | 5,730 | 5,136 | 4,668 | 4,085 | 5,386 | 4,603 | 4,165 | |||||||||||||||||||||||||||
| Pre-opening costs |
1,003 | 543 | 170 | 450 | 788 | 2,041 | 2,683 | 40 | — | |||||||||||||||||||||||||||
| Loss on modification of debt |
— | — | — | 3,090 | — | — | 6,875 | — | — | |||||||||||||||||||||||||||
| Depreciation and amortization |
3,004 | 2,918 | 2,995 | 2,988 | 2,737 | 2,463 | 2,135 | 2,135 | 2,256 | |||||||||||||||||||||||||||
| Other operating (income) expense, net |
(113 | ) | 98 | 61 | (44 | ) | (69 | ) | (146 | ) | (55 | ) | (131 | ) | (39 | ) | ||||||||||||||||||||
| Total costs and expenses |
$ | 55,442 | $ | 56,003 | $ | 53,309 | $ | 58,752 | $ | 52,824 | $ | 52,797 | $ | 53,407 | $ | 43,915 | $ | 45,130 | ||||||||||||||||||
| Income (loss) from operations |
$ | 9,517 | $ | 12,724 | $ | 10,385 | $ | 9,790 | $ | 8,493 | $ | 8,055 | $ | (4,627 | ) | $ | 9,853 | $ | 10,709 | |||||||||||||||||
| Other income (expense), net: |
||||||||||||||||||||||||||||||||||||
| Interest expense, net |
(3,757 | ) | (3,778 | ) | (3,962 | ) | (4,619 | ) | (4,762 | ) | (4,491 | ) | (5,733 | ) | (5,971 | ) | (6,159 | ) | ||||||||||||||||||
| Other income |
(2 | ) | (2 | ) | (1 | ) | — | (4 | ) | (42 | ) | (56 | ) | (2 | ) | (1 | ) | |||||||||||||||||||
| Total other income (expense), net |
$ | (3,759 | ) | $ | (3,780 | ) | $ | (3,963 | ) | $ | (4,619 | ) | $ | (4,766 | ) | $ | (4,533 | ) | $ | (5,789 | ) | $ | (5,973 | ) | $ | (6,160 | ) | |||||||||
| Income (loss) before income taxes |
5,758 | 8,944 | 6,422 | 5,171 | 3,727 | 3,522 | (10,416 | ) | 3,880 | 4,549 | ||||||||||||||||||||||||||
| Income tax expense (benefit) |
1,252 | 2,436 | 2,104 | 1,486 | 965 | 4,928 | (6,786 | ) | 2,201 | 2,129 | ||||||||||||||||||||||||||
| Net income (loss) |
$ | 4,506 | $ | 6,508 | $ | 4,318 | $ | 3,685 | $ | 2,762 | $ | (1,406 | ) | $ | (3,630 | ) | $ | 1,679 | $ | 2,420 | ||||||||||||||||
76
Table of Contents
The following table provides a reconciliation of restaurant contribution to revenue
| Fiscal Quarter Ended |
Fiscal 2014 Quarter Ended | Fiscal 2013 Quarter Ended | ||||||||||||||||||||||||||||||||||
| March 29, 2015 |
December 28 | September 28 | June 29 | March 30 | December 29 | September 29 | June 30 | March 31 | ||||||||||||||||||||||||||||
| Revenue |
$ | 64,959 | $ | 68,727 | $ | 63,694 | $ | 68,542 | $ | 61,317 | $ | 60,852 | $ | 48,780 | $ | 53,768 | $ | 55,839 | ||||||||||||||||||
| Total restaurant operating costs (excluding depreciation and amortization) |
(44,438 | ) | (45,254 | ) | (42,922 | ) | (45,725 | ) | (43,258 | ) | (41,311 | ) | (35,283 | ) | (36,196 | ) | (37,775 | ) | ||||||||||||||||||
| Restaurant contribution |
$ | 20,521 | $ | 23,473 | $ | 20,772 | $ | 22,817 | $ | 18,059 | $ | 19,541 | $ | 13,497 | $ | 17,572 | $ | 18,064 | ||||||||||||||||||
| Restaurant contribution margin |
31.6 | % | 34.2 | % | 32.6 | % | 33.3 | % | 29.5 | % | 32.1 | % | 27.7 | % | 32.7 | % | 32.4 | % | ||||||||||||||||||
Supplemental Selected Constant Currency Information
As exchange rates are an important factor in understanding period-to-period comparisons, we believe the presentation of certain results on a constant currency basis in addition to reported results helps improve investors’ ability to understand our operating results and evaluate our performance in comparison to prior periods. Constant currency information compares results between periods as if exchange rates had remained constant period-over-period. We use results on a constant currency basis as one measure to evaluate our performance. We calculate constant currency by retranslating results across all prior periods presented using a derived exchange rate for the most current year-to-date period based on actual results. The tables set forth below calculate constant currency at a foreign currency exchange rate of 2.8445 Brazilian reais to 1 US dollar, which represents the derived exchange rate for the first quarter of Fiscal 2015 calculated as explained above. These results should be considered in addition to, not as a substitute for, results reported in accordance with US GAAP. Results on a constant currency basis, as we present them, may not be comparable to similarly titled measures used by other companies and are not measures of performance presented in accordance with GAAP.
| Combined | ||||||||||||||||||||
| Fiscal Quarter Ended | Fiscal Year Ended | Period from January 2 to December 30, 2012 |
||||||||||||||||||
| (dollars in thousands) | March 29, 2015 |
March 30, 2014 |
December 28, 2014 |
December 29, 2013 |
||||||||||||||||
| Revenue as reported |
$ | 64,959 | $ | 61,317 | $ | 262,280 | $ | 219,239 | $ | 202,360 | ||||||||||
| Effect of foreign currency translation |
— | (2,013 | ) | (10,611 | ) | (13,804 | ) | (17,424 | ) | |||||||||||
|
|
|
|||||||||||||||||||
| Revenue at constant currency |
$ | 64,959 | $ | 59,304 | $ | 251,669 | $ | 205,435 | $ | 184,936 | ||||||||||
| Adjusted EBITDA |
$ | 14,938 | $ | 12,888 | $ | 63,319 | $ | 50,363 | $ | 49,244 | ||||||||||
| Effect of foreign currency translation |
— | (357 | ) | (3,029 | ) | (3,573 | ) | (4,923 | ) | |||||||||||
|
|
|
|||||||||||||||||||
| Adjusted EBITDA at constant currency |
$ | 14,938 | $ | 12,531 | $ | 60,290 | $ | 46,790 | $ | 44,321 | ||||||||||
|
|
|
|||||||||||||||||||
| Adjusted EBITDA margin at constant currency |
23.0 | % | 21.1 | % | 24.0 | % | 22.8 | % | 24.0 | % | ||||||||||
| Restaurant contribution |
$ | 20,521 | $ | 18,059 | $ | 85,121 | $ | 68,674 | $ | 61,455 | ||||||||||
| Effect of foreign currency translation |
— | (505 | ) | (3,878 | ) | (4,703 | ) | (6,482 | ) | |||||||||||
|
|
|
|||||||||||||||||||
| Restaurant contribution at constant currency |
$ | 20,521 | $ | 17,554 | $ | 81,243 | $ | 63,971 | $ | 54,973 | ||||||||||
|
|
|
|||||||||||||||||||
| Restaurant contribution margin at constant currency |
31.6 | % | 29.6 | % | 32.3 | % | 31.1 | % | 29.7 | % | ||||||||||
Liquidity and Capital Resources
Our liquidity and capital requirements are principally the build out cost of new restaurants, renovations of existing restaurants and corporate infrastructure, as well as for payments of principal and interest on our outstanding indebtedness and lease obligations. Historically, our main sources of liquidity have been cash flow from operating activities and borrowings under our existing and previous revolving line of credit. We have no material assets other than our ownership of the equity interest in our subsidiaries and no independent means of generating revenue. The terms of our Senior Credit Facilities include, and the terms of our New Credit Facility will include, a number of restrictive covenants that impose restrictions on our subsidiaries’ ability to, among other things, pay dividends to us. In Fiscal 2011, 2012, 2013 and 2014, we repatriated $9.6 million, $16.5 million, $3.0 million and $14.9 million respectively, through cash distributions between our consolidated subsidiaries. We did not repatriate any funds during
77
Table of Contents
the first quarter of Fiscal 2015. Our parent company has never received distributions from our consolidated subsidiaries, unconsolidated subsidiaries or 50% or less owned persons. Nonetheless, our Brazilian operations are typically funded from cash generated within Brazil and our United States operations are typically funded from cash generated in the United States and we do not depend on dividends from Brazil for sufficient liquidity. We intend to spend approximately $24.0 million to $28.0 million in 2015 on capital expenditures, including $21.0 million to $25.0 million for new restaurant development and $1.0 million to $2.0 million on opportunistic restaurant remodeling.
At March 29, 2015, our working capital deficit (excluding cash and cash equivalents) was $15.1 million and our cash and cash equivalents were $17.3 million. We believe that our cash from operations, proceeds from our initial public offering and borrowings under our New Credit Facility will be adequate to meet our liquidity needs and capital expenditure requirements for at least the next 12 months. In addition, we may make discretionary capital improvements with respect to our restaurants or systems such as our planned opportunistic restaurant remodel program, which we could fund through the issuance of debt or equity securities or other external financing sources to the extent we were unable to fund such capital expenditures out of our cash from operations.
The following table presents the primary components of net cash flows provided by and used in operating, investing and financing activities for the periods indicated.
| Successor | Predecessor | |||||||||||||||||||||||
| Fiscal Quarter Ended | Fiscal Year Ended | Period from May 24 (Inception) to December 30, 2012 |
Period from January 2 to July 20, 2012 |
|||||||||||||||||||||
| March 29, 2015 |
March 30, 2014 |
December 28, 2014 |
December 29, 2013 |
|||||||||||||||||||||
| (dollars in thousands) | (13 weeks) | (13 weeks) | (52 weeks) | (52 weeks) | (23 weeks) | (29 weeks) | ||||||||||||||||||
| Net cash provided by (used in) |
||||||||||||||||||||||||
| Operating activities |
$ | 1,987 | $ | (3,465 | ) | $ | 34,053 | $ | 32,340 | $ | (1,912 | ) | $ | 7,675 | ||||||||||
| Investing activities |
(3,264 | ) | (5,982 | ) | (17,448 | ) | (29,544 | ) | (396,382 | ) | (8,908 | ) | ||||||||||||
| Financing activities |
(89 | ) | 6,481 | (11,965 | ) | 4,421 | 407,928 | (4,143 | ) | |||||||||||||||
| Effect of foreign exchange |
(717 | ) | 203 | (1,263 | ) | (789 | ) | (52 | ) | (308 | ) | |||||||||||||
| Net increase (decrease) in cash |
$ | (2,083 | ) | $ | (2,763 | ) | $ | 3,377 | $ | 6,428 | $ | 9,582 | $ | (5,684 | ) | |||||||||
Operating Activities
Net cash provided by operating activities increased by $5.5 million to $2.0 million for the first quarter of Fiscal 2015, from net cash flows used in operating activities of $3.5 million for the first quarter of Fiscal 2014. The increase is primarily due to an increase in net income of $1.7 million and a reduction in payables due to restaurants under construction at year end 2013 which were paid in the first quarter of Fiscal 2014.
For the fiscal year ended December 28, 2014, compared to the fiscal year ended December 29, 2013, net cash provided by operating activities increased by $1.7 million primarily due to an increase in net income of $18.2 million partially offset by a reduction in payables due to restaurants under construction at year end 2013. Additionally, the 2014 Credit Facility Refinancing resulted in payment of all accrued liabilities thereunder in the fiscal year ended December 28, 2014.
Net cash provided by operating activities increased by $34.3 million in Fiscal 2013 versus the period from May 24 to December 30, 2012 primarily due to 29 additional operating weeks in Fiscal 2013 as well as acquisition costs of $12.0 million recorded during the period from May 24 to December 30, 2012.
Investing Activities
For the first quarter of Fiscal 2015, compared to the first quarter of Fiscal 2014, cash used in investing activities decreased by $2.7 million primarily due to the timing of capital expenditures related to new restaurant construction.
78
Table of Contents
For the fiscal year ended December 28, 2014, compared to the fiscal year ended December 29, 2013, cash used in investing activities decreased by $12.1 million primarily due to timing of capital expenditures related to new restaurant construction.
Cash used in investing activities decreased by $366.8 million in Fiscal 2013 versus the period from May 24 to December 30, 2012 primarily due to cash consideration in connection with the Acquisition totaling $387.1 million and the timing of capital expenditures.
Financing Activities
Net cash flows provided by financing activities decreased $6.6 million, from $6.5 million net cash flows provided by financing activities for the first quarter of Fiscal 2014, to $0.1 million net cash used in financing activities for the first quarter of Fiscal 2015, primarily due a decrease in borrowings on our revolving line of credit ($7.0 million in borrowings during the first quarter of Fiscal 2014, no borrowings during the first quarter of Fiscal 2015).
For the fiscal year ended December 28, 2014, compared to the fiscal year ended December 29, 2013, cash used in financing activities increased by $16.4 million primarily due to repayments on the revolving line of credit under our Senior Credit Facilities.
Cash provided by financing activities decreased by $403.5 million in Fiscal 2013 versus the period from May 24 to December 30, 2012 due to financing the Acquisition in 2012 through capital contributions of $172.1 million and debt proceeds of $235.9 million.
Under the terms of the Senior Credit Facilities, we are required to make mandatory prepayments with a portion of our Excess Cash Flow, as defined in the Senior Credit Facilities. During Fiscal 2014, we reclassified $1.9 million of long-term debt to current as a result of this provision.
Senior Credit Facilities
On July 20, 2012, we entered into the following credit facilities:
| • | First Lien Credit Agreement (the “First Lien Credit Facility”) dated as of July 20, 2012, among Brasa (Holdings) Inc. as Borrower, Brasa (Purchaser) Inc., as Holdings, JPMorgan Chase Bank, N.A., as Administrative Agent, L/C Issuer and Swing Line Lender, Jefferies Finance LLC and Golub Capital LLC, as Co-Syndication Agents, and the other Lenders party thereto; and |
| • | Second Lien Credit Agreement (the “Second Lien Credit Facility” and together with the First Lien Credit Facility, the “Senior Credit Facilities”) dated as of July 20, 2012, among Brasa (Holdings) Inc. as Borrower, Brasa (Purchaser) Inc., as Holdings, Wilmington Trust, National Association, as Administrative Agent, JPMorgan Chase Bank, N.A. and Jefferies Finance LLC as Co-Syndication Agents, and the other Lenders party thereto. |
Our Senior Credit Facilities contain a number of covenants that, among other things, restrict, subject to certain exceptions, our ability to (i) incur additional indebtedness, (ii) issue preferred stock, (iii) create liens on assets, (iv) engage in mergers or consolidations, (v) sell assets, (vi) make investments, loans or advances, (vii) make certain acquisitions, (viii) engage in certain transactions with affiliates, (ix) authorize or pay dividends and (x) change our lines of business or fiscal year. In addition, we are required to maintain two financial covenants, which include a Total Rent Adjusted Leverage Ratio and a Consolidated Interest Coverage Ratio (each as defined in the Senior Credit Facilities). These required ratios vary by quarter until maturity. Under the First Lien Credit Facility, we are required to maintain a maximum Total Rent Adjusted Leverage Ratio of 6.50 to 1 and a minimum Consolidated Interest Coverage Ratio of 2.05 to 1 for the first quarter of 2015 (7.00 to 1 and 1.55 to 1, respectively, under the Second Lien Credit Facility). As of the date of this prospectus, we were in compliance with our Senior Credit Facilities’ financial covenants. We intend to use the net proceeds of this offering, together with borrowings under our New Credit Facility, to repay outstanding indebtedness under our Senior Credit Facilities. See “Use of Proceeds.”
79
Table of Contents
New Credit Facility
Concurrently with, and conditioned upon, the consummation of our initial public offering, we intend to refinance our existing Senior Credit Facilities and enter into the New Credit Facility.
Our New Credit Facility will contain a number of covenants that, among other things, restrict, subject to certain exceptions, our ability to (i) incur additional indebtedness, (ii) issue stock, (iii) create liens on assets, (iv) engage in mergers or consolidations, (v) sell assets, (vi) make investments, loans or advances, (vii) make certain acquisitions, (viii) engage in certain transactions with affiliates, (ix) authorize or pay dividends and (x) change our lines of business or fiscal year. In addition, we will be required to maintain two financial covenants, which include a maximum Total Rent Adjusted Leverage Ratio (at levels that may vary by quarter until maturity) and a minimum Consolidated Interest Coverage Ratio (each as defined in the New Credit Facility). Beginning with the third quarter ending September 27, 2015, these required ratios will be 5.50 to 1 and 2.00 to 1, respectively.
We expect that the loans under our New Credit Facility will bear interest at a base rate plus a margin ranging from 0.50% to 1.50% or at LIBOR plus a margin ranging from 1.50% to 2.50% and will mature in 2020. Borrowings under our New Credit Facility may vary significantly from time to time depending on our cash needs at any given time, and upon consummation of our initial public offering we expect that approximately $188.9 million will be drawn under our New Credit Facility.
Contractual Obligations and Commitments
Leases
We lease certain restaurant locations, storage spaces, buildings and equipment under non-cancelable operating leases. Our restaurant leases generally have initial terms of between 10 and 20 years, and generally can be extended only in five-year increments. Our leases expire at various dates between 2016 and 2033, excluding extensions at our option. Some of our restaurant leases include renewal options and certain of our leases include rent escalation clauses, rent abatements and leasehold rental incentives, none of which are reflected in the following table. Some of our leases also include contingent rental payments based on sales volume, the impact of which also are not reflected in the following table.
The following table summarizes our contractual arrangements at March 29, 2015 on actual basis and the timing and effect that such commitments are expected to have on our liquidity and cash flows in future periods:
| Payments due by Period | ||||||||||||||||||||
| Total | Less than 1 Year |
2-3 Years | 4-5 Years | More than 5 Years |
||||||||||||||||
| Long-term debt obligations |
$ | 247,864 | $ | 4,218 | $ | 4,560 | $ | 214,086 | $ | 25,000 | ||||||||||
| Scheduled interest payments(1) |
60,077 | 10,461 | 27,428 | 22,035 | 153 | |||||||||||||||
| Operating lease (minimum rent) |
141,802 | 10,906 | 30,481 | 24,118 | 76,297 | |||||||||||||||
| Total |
$ | 449,743 | $ | 25,585 | $ | 62,469 | $ | 260,239 | $ | 101,450 | ||||||||||
| (1) | The table above assumes an interest rate of 5.00% for our Term Loan A (3-month LIBOR plus a spread of 4.00% with a LIBOR floor value of 1.00%) and an interest rate of 11.00% for our Term Loan B (LIBOR plus a spread of 9.50% with a LIBOR floor value of 1.50%), based on the applicable rates in effect as of March 29, 2015. |
Off-Balance Sheet Arrangements
We enter into standby letters of credit to secure certain of our obligations, including insurance programs and lease obligations. As of March 29, 2015, letters of credit and letters of guaranty totaling $1.7 million have been issued.
Other than these standby letters of credit, we do not have any off-balance sheet arrangements, investments in special purpose entities or undisclosed borrowings or debt. In addition, we have not entered into any derivative contracts or synthetic leases.
80
Table of Contents
Critical Accounting Policies and Estimates
Our discussion and analysis of our financial condition and consolidated results of operations are based upon our consolidated financial statements, which have been prepared in accordance with generally accepted accounting principles in the United States. The preparation of our consolidated financial statements requires us to make estimates and assumptions that affect the reported amounts of assets, liabilities, revenue and expenses and related disclosure of contingent assets and liabilities. We base these estimates on historical experience and various other assumptions that we believe to be reasonable under the circumstances, the results of which form the basis for making judgments about the carrying values of assets and liabilities that are not readily apparent from other sources. Our actual results may differ from these estimates.
We believe that the following critical accounting policies affect our more significant estimates and judgments used in the preparation of our consolidated financial statements:
Use of Estimates
The preparation of financial statements in conformity with GAAP requires management to make estimates and assumptions, such as the valuation of long-lived, definite and indefinite-lived assets, estimated useful lives of assets, the reasonably assured lease terms of operating leases, valuation of the workers’ compensation and Company sponsored employee health insurance program liabilities, the fair value of share-based compensation, and deferred tax valuation allowances, that affect the reported amounts of assets and liabilities and disclosure of contingent assets and liabilities at the date of the financial statements and the reported amounts of revenue and expenses during the reporting period. Actual results could differ from those estimates.
Fair Value Measurements
As of March 29, 2015 and December 28, 2014, the fair value of cash and cash equivalents, accounts receivable, accounts payable, accrued expenses, and other current liabilities approximated their carrying value due to their short-term nature. The carrying amounts of the long-term debt approximate fair value as interest rates vary with the market interest rates and negotiated terms and conditions are consistent with current market rates.
Insurance Reserves
Beginning in Fiscal 2013, the Company became self-insured for certain losses related to workers’ compensation claims and Company-sponsored employee health insurance programs. We estimate the accrued liabilities for all self-insurance programs at the end of each reporting period. Accrued liabilities include the estimated incurred but unreported costs to settle unpaid claims. To limit exposure to losses, we maintain stop-loss coverage through third-party insurers. The deductibles range from approximately $200 to $250 per claim. The accrued liability attributable to all self-insurance programs was approximately $1.3 million and $1.2 million as of March 29, 2015 and December 28, 2014, respectively, and is included in accounts payable and accrued expenses in the consolidated balance sheet. The estimated liability is not discounted and is based on a number of assumptions and factors, including historical trends and actuarial assumptions.
Variable Interest Entities (“VIEs”)
The consolidated financial statements include the accounts of our wholly-owned subsidiaries, and joint ventures of which we are the primary beneficiary. We consolidate VIEs in which we are deemed to have a controlling interest as a result of our having both the power to direct the activities that significantly impact the entity’s economic performance and the right to receive the benefits that could potentially be significant to the VIE. If we have a controlling interest in a VIE the assets, liabilities, and results of the operations of the VIE are included in the consolidated financial statements.
Segment Reporting
We own and operate full-service, Brazilian steakhouses in the United States and Brazil using a single restaurant concept and brand. Each restaurant under our single global brand operates with similar types of products and menu, providing a continuous service style, similar contracts, customers and employees, irrespective of location. ASC 280, “Segment Reporting” requires use of the “management approach” model for segment reporting. The management
81
Table of Contents
approach model is based on the way a company’s management organizes segments within the company for making operating decisions and assessing performance. We have identified two operating segments: United States and Brazil. The Company’s joint venture in Mexico is included in the United States for segment reporting purposes as the operations of the joint venture are monitored by the United States segment management. Operations in the United States accounted for 84% and 80% of total consolidated revenue for the first fiscal quarters of Fiscal 2015 and Fiscal 2014, respectively, and 76% and 74% of total consolidated revenue for the fiscal year ended December 28, 2014 and December 29, 2013, respectively. The remaining revenue was attributable to our Brazilian subsidiary.
Impairment of Long-Lived Assets
We review property and equipment and definite-lived intangible assets for impairment when events or circumstances indicate these assets may not be recoverable. Factors considered include, significant underperformance relative to expected historical or projected future operating results, significant changes in the manner of use of the acquired assets or the strategy for the overall business and significant negative industry or economic trends. The recoverability is assessed by comparing the carrying value of the asset to the undiscounted cash flows expected to be generated by the asset. If impairment exists, the amount of impairment is measured as the excess of the carrying amount over the estimated fair value, as determined by each location’s projected future discounted cash flows. This assessment process requires the use of estimates and assumptions regarding future cash flows and estimated useful lives, which are subject to a significant degree of judgment. If these assumptions change in the future, we may be required to record impairment charges for these assets. We have not recorded any impairment related to long-lived assets in any of the periods presented.
Revenue
Revenue from restaurant sales is recognized when food and beverage products are sold and is presented net of employee meals and complimentary meals. Proceeds from the sale of gift cards that do not have expiration dates are recorded as deferred revenue at the time of the sale and recognized as revenue when the gift card is redeemed by the holder. The portion of gift cards sold which are never redeemed is commonly referred to as gift card breakage. We recognize gift card “breakage” revenue for gift cards when the likelihood of redemption becomes remote and we determine there is no legal obligation to remit the value of the unredeemed gift cards to governmental agencies. We estimate the gift card breakage rate based upon the pattern of historical redemptions. Prior to the third quarter of Fiscal 2014, we did not recognize any breakage revenue because we did not have sufficient historical data to allow management to reasonably estimate a pattern of historical redemptions. During the third quarter of Fiscal 2014, we concluded we had accumulated sufficient historical data from a large pool of homogeneous transactions to allow management to reasonably and objectively determine an estimated pattern of historical gift card redemptions. Accordingly, we accounted for this change prospectively as a change in estimate and recorded an adjustment during the third quarter of Fiscal 2014 to recognize previously unrecognized breakage revenue in the amount of $0.7 million on gift cards whose likelihood of redemption was determined to be remote. During the fourth quarter of 2014 we recognized an additional $0.2 million in gift card breakage revenue.
Operating Leases and Deferred Rent
We operate the majority of our restaurants in leased premises. We record the minimum base rents including option periods which are reasonably assured of renewal. For purposes of calculating straight-line rents, the lease term commences on the date we obtain control of the property, which is normally when the property is ready for normal tenant improvements (build-out period). The difference between rent expense and rent paid is recorded as a deferred rent liability. Allowances for tenant improvements are included in the deferred rent liability and recognized over the life of the lease by reducing rent expense.
Contingent rent expense is recognized, and subsequently accrued, when it becomes probable that we will achieve restaurant sales above a specified target amount, evaluated on a per lease basis.
Income Taxes (Predecessor)
For the Period from January 2, 2012 to July 20, 2012, the Predecessor operated as a Limited Liability Company, or LLC. As an LLC, the Predecessor did not pay federal corporate income taxes on its taxable income in the United States. Instead, the members were liable for individual federal and state income tax on their share of the Predecessor’s taxable income. Income taxes relate to the Predecessor’s foreign subsidiary in Brazil, margin tax and state tax in certain
82
Table of Contents
jurisdictions in the United States. The Predecessor calculated the provision for income taxes for the foreign subsidiary under the presumed profits method. Under the presumed profits method, the tax authority applies a percentage of the Predecessor’s revenue as the profit margin, and taxes the profits at the current federal rate in Brazil. Given the structure of the Predecessor as a pass-through entity in the United States and the nature of the operations of the Predecessor in Brazil, there were no significant deferred tax assets or liabilities.
Income Taxes (Successor)
Immediately prior to the Acquisition, (i) FC Holdings Inc. contributed all of its ownership interests in Fogo de Chão Churrascaria (Holdings) LLC to Fogo Holdings, (ii) Fogo de Chão Churrascaria (Holdings) LLC was merged with Fogo Holdings, which was the surviving corporation, and (iii) FC Holdings Inc. was domesticated into Brasa Holdings by continuation out of the Cayman Islands into the state of Delaware.
Effective May 24, 2012, the Successor accounts for income taxes in accordance with ASC Topic 740, “Accounting for Income Taxes.” This statement requires an asset and liability approach for financial accounting and reporting of income taxes. Under ASC Topic 740, income taxes are accounted for based upon the future tax consequences attributable to differences between the financial statement carrying amounts of existing assets and liabilities and their respective tax basis and operating loss and tax credit carry-forwards. We estimate our annual effective tax rate at each interim period based on the facts and circumstances available at that time while the actual effective tax rate is calculated at year-end. We are subject to income taxes in both the United States and Brazil.
In evaluating its ability to recover its deferred tax assets, we consider all available positive and negative evidence, including scheduled reversals of deferred tax liabilities, projected future taxable income, tax planning strategies and recent financial operations. In projecting future taxable income, we begin with historical results adjusted for the results of discontinued operations and changes in accounting policies, incorporate assumptions including the amount of future state, federal and foreign pretax operating income, the reversal of temporary differences, and the implementation of feasible and prudent tax planning strategies. These assumptions require significant judgment about the forecasts of future taxable income and are consistent with the plans and estimates we use to manage its underlying businesses in evaluating the objective income (loss).
At December 28, 2014 and December 29, 2013, we had a valuation allowance of $2.8 million and $4.0 million, respectively, against our deferred tax assets because losses in the United States in recent periods represented sufficient negative evidence to require a full valuation allowance against certain deferred tax assets related to these operating losses. At March 29, 2015, we determined that we have sufficient current year income and deferred tax liabilities to support the realization of these deferred tax assets, and as a result we released $0.7 million of the valuation allowance in the first quarter of Fiscal 2015.
We recognize tax liabilities in accordance with ASC 740, and adjusts those liabilities when judgments change as a result of evaluation of new information not previously available. Significant judgment is required in assessing, among other things, the timing and amounts of deductible and taxable items. Due to the complexity of some of these uncertainties, the ultimate resolution may result in payment that is materially different from our current estimate of the tax liabilities. These differences will be reflected as increases or decreases to income tax expense in the period in which they are determined.
Income taxes relate to our domestic federal income tax, tax in our foreign subsidiary in Brazil, margin tax and state tax in certain jurisdictions in the United States. The provision for income taxes for the foreign subsidiary is calculated under the presumed profits method. Under the presumed profits method, the tax authority applies a percentage of the foreign subsidiary’s revenue as the profit margin, and taxes the profits at the current federal rate in Brazil.
Given the structure of the Successor as a C-corporation subsequent to the Acquisition, there were deferred tax assets and liabilities recorded by the Successor as part of the business combination and subsequently thereafter.
We apply the authoritative guidance related to uncertainty in income taxes. We concluded that there were no uncertain tax positions identified during its analysis. We recognize interest and penalties, if any, in the period in which they occur in income tax expense. There was no interest expense or penalties incurred, or recorded during the thirteen weeks ended March 29, 2015, during the fiscal years ended December 28, 2014 or December 29, 2013, or during the period from May 24, 2012 to December 30, 2012 (successor period).
83
Table of Contents
Share-based Compensation
The Company measures share-based awards granted to employees and non-employee directors based on the fair value on the date of grant. Stock options granted to employees and non-employee directors are measured at fair value on the date of the grant using the Black-Scholes option-pricing model. The fair value of the awards is recognized as expense, net of estimated forfeitures, over the requisite service period, which is generally the vesting period of the respective award. For awards with both service and performance conditions, the expense is recognized using the graded vesting method. For awards with only service conditions, the expense is recognized using the straight-line method.
For liability-classified awards, compensation expense is recognized over the period during which services are rendered by the employee until completed. At the end of each financial reporting period prior to completion of the service, the fair value of these awards is re-measured using the then-current fair value of the Company’s common stock and updated assumption inputs in the Black-Scholes option-pricing model. The Company did not have any liability-classified awards outstanding as of March 29, 2015, December 28, 2014 or December 29, 2013.
We classify share-based compensation expense in our consolidated statement of operations and comprehensive income (loss) in the same manner in which the award recipient’s payroll costs are classified or in which the award recipient’s service payments are classified.
We recognize compensation expense for only the portion of awards that are expected to vest. In developing a forfeiture estimate, we have considered our historical experience to estimate pre-vesting forfeitures for service-based awards. The impact of a forfeiture rate adjustment will be recognized in full in the period of adjustment, and if the actual forfeiture rate is materially different from our estimate, we may be required to record adjustments to share-based compensation expense future periods.
Foreign Currency Translation
We consider the Brazilian real the functional currency of our Brazilian subsidiary because it conducts substantially all of its business in that currency. The Mexican peso is the functional currency of our joint venture in Mexico because substantially all of the business of the joint venture is conducted in that currency. The assets and liabilities of our subsidiary in Brazil and of our joint venture in Mexico are translated into US dollars, which is our reporting currency, at exchange rates existing at the balance sheet dates. Revenue and expenses are translated at average exchange rates and shareholders’ equity balances are translated at historical exchange rates. Adjustments resulting from translating foreign functional currency financial statements into US dollars are included in the foreign currency translation adjustment, a component of accumulated other comprehensive income (loss). The functional currency of our other subsidiaries is the US dollar.
Recently Adopted Accounting Standards
In April 2014, the FASB issued ASU No. 2014-08, “Presentation of Financial Statements (Topic 205) and Property, Plant, and Equipment (Topic 360): Reporting Discontinued Operations and Disclosures of Disposals of Components of an Entity.” ASU No. 2014-08 improves the definition of discontinued operations by limiting discontinued operations reporting to disposals of components of an entity that represent strategic shifts that have (or will have) a major effect on an entity’s operations and financial results. Prior to ASU No. 2014-08, many disposals, some of which may have been routine in nature and not a change in an entity’s strategy, were reported in discontinued operations. Additionally, the amendments in this ASU require expanded disclosures for discontinued operations. The amendments in this ASU also require an entity to disclose the pretax profit or loss of an individually significant component of an entity that does not qualify for discontinued operations reporting. The ASU is effective for annual financial statements with years that begin on or after December 15, 2014. We adopted this guidance effective December 29, 2014, which was the first day of our 2015 fiscal year. The adoption of this guidance did not have an impact on our consolidated financial statements.
Recently Issued Accounting Standards
Recent accounting pronouncements not included below are not expected to have a material impact on the Company’s consolidated financial position or results of operations.
84
Table of Contents
In May 2014, the FASB issued ASU No. 2014-09, “Revenue from Contracts with Customers.” The core principle of the standard is that an entity recognizes revenue to depict the transfer of promised goods or services to customers in an amount that reflects the consideration to which the entity expects to be entitled in exchange for those goods or services. The ASU will replace most existing revenue recognition guidance in GAAP. New qualitative and quantitative disclosure requirements aim to enable financial statement users to understand the nature, amount, timing, and uncertainty of revenue and cash flows arising from contracts with customers. The new standard is effective for annual periods beginning after December 15, 2016, including interim periods within that reporting period. We will be required to adopt this new standard in the first quarter of Fiscal 2017. Early adoption is not permitted. The ASU permits the use of either the retrospective or cumulative effect transition method. We have not yet selected a transition method or determined the effect, if any, that this ASU will have on our consolidated financial statements and related disclosures.
In August 2014, the FASB issued ASU No. 2014-15, “Presentation of Financial Statements—Going Concern (Subtopic 205-40): Disclosure of Uncertainties about an Entity’s Ability to Continue as a Going Concern.” ASU 2014-15 will require management to evaluate whether there are conditions or events that raise substantial doubt about the entity’s ability to continue as a going concern for one year from the date the financial statements are issued. The new standard is effective for the annual period ending after December 15, 2016, and for annual periods and interim periods thereafter. We will be required to adopt this new standard Fiscal 2016. We do not expect the adoption of this ASU to have a material impact on our consolidated financial statements.
In February 2015, the FASB issued ASU No. 2015-2, “Consolidation (Topic 820): Amendments to the Consolidation Analysis.” ASU 2015-2 provides a revised consolidation model for all reporting entities to use in evaluating whether they should consolidate certain legal entities. All legal entities will be subject to reevaluation under this revised consolidation model. The revised consolidation model, among other things, (i) modifies the evaluation of whether limited partnerships and similar legal entities are VIEs or voting interest entities, (ii) eliminates the presumption that a general partner should consolidate a limited partnership, and (iii) modifies the consolidation analysis of reporting entities that are involved with VIEs through fee arrangements and related party relationships. ASU 2015-2 is effective for fiscal years, and for interim periods within those fiscal years, beginning after December 15, 2015. We will be required to adopt this new standard Fiscal 2016. We are currently in the process of evaluating what impact, if any, the adoption of this ASU will have on our consolidated financial statements.
In April 2015, the FASB issued ASU 2015-03, “Simplifying the Presentation of Debt Issuance Costs,” which changes the presentation of debt issuance costs in financial statements. ASU 2015-03 requires an entity to present such costs in the balance sheet as a direct deduction from the related debt liability rather than as an asset. Amortization of the costs will continue to be reported as interest expense. It is effective for fiscal years, and interim reporting periods within those fiscal years, beginning after December 15, 2015. We will be required to adopt this new standard in the first quarter of Fiscal 2016. The new guidance will be applied retrospectively to each prior period presented. We are currently in the process of evaluating the impact of adoption of the ASU on our consolidated balance sheets.
Quantitative and Qualitative Disclosures About Market Risk
Market risk represents the risk of loss that may impact our financial position due to adverse changes in financial market prices and rates. Our market risk exposure is primarily a result of fluctuations in interest rates and foreign currency exchange rates. We do not hold or issue financial instruments for trading purposes.
Foreign Currency Exchange Risk
The reporting currency for our consolidated financial statements is the US dollar. However, during the thirteen weeks ended March 29, 2015 and the fiscal year ended December 28, 2014 we generated approximately 15.8% and 23.7%, respectively, of our revenue in Brazil. As a result, we have been impacted by changes in exchange rates and may be impacted materially for the foreseeable future. For example, if the US dollar strengthens it would have a negative impact on our Brazilian operating results upon translation of those results into US dollars for the purposes of consolidation. The exchange rate of the Brazilian real against the US dollar is currently near a multi-year high. Any hypothetical loss in revenue could be partially or completely offset by lower food and beverage costs and lower selling, general and administrative costs that are generated in Brazilian reais. A 10% appreciation in the relative value of the US dollar compared to the Brazilian real would have resulted in lost income from operations of approximately $0.9 million in Fiscal 2013, approximately $1.2 million in Fiscal 2014 and approximately $0.1 million in the thirteen weeks ended March 29, 2015. To the extent the ratio between our revenue generated in Brazilian reais increases as compared
85
Table of Contents
to our expenses generated in Brazilian reais, we expect that our results of operations will be further impacted by changes in exchange rates. We do not currently hedge foreign currency fluctuations. However, in the future, in an effort to mitigate losses associated with these risks, we may at times enter into derivative financial instruments, although we have not historically done so. These may take the form of forward sales contracts and option contracts. We do not, and do not intend to, engage in the practice of trading derivative securities for profit.
Interest Rate Risk
We are exposed to market risk from changes in interest rates on our debt, which bears interest at variable rates and has a LIBOR floor ranging from 1.00% to 1.50%. As of March 29, 2015, we had total aggregate principal amount of outstanding borrowings of approximately $247.9 million. A 1.00% increase in the effective interest rate applied to these borrowings would result in an interest expense increase of $2.5 million on an annualized basis. We manage our interest rate risk through normal operating and financing activities and, when determined appropriate, through the use of derivative financial instruments.
Inflation
Inflationary factors such as increases in food, beverage and overhead costs may adversely affect our operating results. Although we do not believe that inflation has had a material impact on our financial position or results of operations to date, a high rate of inflation in the future may have an adverse effect on our ability to maintain current levels of gross margin and selling, general and administrative costs as a percentage of revenue if our menu prices do not increase with these increases.
86
Table of Contents
Overview
Our Company
Fogo de Chão (fogo-dee-shoun) is a leading Brazilian steakhouse, or churrascaria, which has specialized for over 35 years in fire-roasting high-quality meats utilizing the centuries-old Southern Brazilian cooking technique of churrasco. We deliver a distinctive and authentic Brazilian dining experience through the combination of our high-quality Brazilian cuisine and our differentiated service model known as espeto corrido (Portuguese for “continuous service”) delivered by our churrasqueiros, which we refer to as our gaucho chefs. We offer our guests a tasting menu of meats featuring up to 20 cuts, simply seasoned and carefully fire-roasted to expose their natural flavors.
Guests can begin their dining experience at the Market Table, which offers a wide variety of Brazilian-inspired side dishes, fresh-cut vegetables, seasonal salads, aged cheeses and cured meats, or they can receive immediate entrée service table-side from our gaucho chefs by turning a service medallion, found at each guest’s seat, green side up. Each gaucho chef rotates throughout the dining room, and is responsible for a specific cut of meat which they prepare, cook and serve to our guests continuously throughout their meal. Guests can pause the service at any time by turning the medallion to red and then back to green when they are ready to try additional selections and can communicate to our gauchos their preferred cut of meat, temperature and portion size. Our continuous service model allows customization and consumer engagement since our guests control the variety and quantity of their food and the pace of their dining experience. Through the combination of our authentic Brazilian cuisine, differentiated service model, prix fixe menu and engaging hospitality in an upscale restaurant atmosphere, we believe our brand delivers a differentiated dining experience relative to other specialty and fine-dining concepts and offers our guests a compelling value proposition.
Throughout our history, we have been recognized for our leading consumer appeal by both national and local media in the markets where we operate, including winning multiple “best of” restaurant awards from one of Brazil’s most prominent lifestyle publications, Veja Magazine, and numerous accolades in the United States, including awards from Nation’s Restaurant News, Zagat and Wine Spectator Magazine.
We opened our first restaurant in 1979 in Porto Alegre, Brazil. In 1986, we expanded to São Paulo, Brazil, a city in which we now operate five restaurants. Encouraged by our growth in Brazil, we opened our first restaurant in the United States in 1997 in Addison, Texas, a suburb of Dallas, and have since expanded our footprint nationwide. We currently operate 26 restaurants in the United States, 10 in Brazil and one in Mexico, our first joint venture restaurant. From the 2010 to 2014 fiscal years, we grew our restaurant count by a compound annual growth rate (“CAGR”) of 11.5%.
|
|
|
We believe our dedication to serving high-quality Brazilian cuisine and our differentiated service model, combined with our disciplined focus on restaurant operations, have resulted in strong financial results illustrated by the following:
| • | In Fiscal 2014, we generated AUVs of approximately $8.0 million and a restaurant contribution margin of 32.5%, which we believe, based on an internal survey of our public competitors in the restaurant industry are among the highest in the full-service dining category; |
87
Table of Contents
| • | In Fiscal 2014, we opened three restaurants, increasing our restaurant base 9.7% from 31 restaurants in 2013 to 34 restaurants in 2014, and in the year-to-date Fiscal 2015 we have opened restaurants in San Juan, Puerto Rico and Rio de Janeiro, Brazil and our first joint venture restaurant in Mexico City, Mexico; and |
| • | From Fiscal 2013 to Fiscal 2014, revenue grew 19.6% to $262.3 million and our net income increased from a net loss of $0.9 million in Fiscal 2013 to net income of $17.6 million in Fiscal 2014. For the thirteen weeks ended March 29, 2015, revenue was $65.0 million and net income was $4.7 million, increases of 5.9% and 68.9%, respectively, as compared to the thirteen weeks ended March 30, 2014. In addition, from Fiscal 2013 to Fiscal 2014, restaurant contribution grew 23.9% to $85.1 million and Adjusted EBITDA grew 25.7% to $63.3 million, despite our investment of $4.2 million in additional fixed personnel costs during such period to develop key functional areas to support future growth. For the thirteen weeks ended March 29, 2015, restaurant contribution grew 13.6% to $20.5 million and Adjusted EBITDA grew 15.9% to $14.9 million as compared to the thirteen weeks ended March 30, 2014. For a reconciliation of Adjusted EBITDA and restaurant contribution, non-GAAP financial measures, to net income and revenue, respectively, see “Summary Consolidated Financial and Other Information.” |
Our Competitive Strengths
We believe the following strengths differentiate us from our competitors and serve as the foundation for our continued growth:
Authentic Cuisine – A Culinary Journey to Brazil
We provide our guests with an experience that is distinctly Brazilian, and our food is at the heart of that experience. Our traditional Brazilian cuisine has been passed down from generation to generation in Brazil and lives on in the way our gaucho chefs prepare, season and continuously fire-roast our meats utilizing the traditional cooking method of churrasco – fire-roasted on skewers over an open flame to expose the natural flavors. Our entrée selection features a variety of carefully cooked and seasoned meats including Brazilian style cuts of beef such as the fraldinha and the picanha, our signature cut of steak, as well as other premium beef cuts such as filet mignon and rib eye, and lamb, chicken, pork and seafood items. Each cut is carved table-side by our gaucho chefs in a manner designed to both enhance the tenderness of each slice and meet our guests’ desired portion size and temperature. At Fogo de Chão, every table is a chef’s table. To complement our meat selection, a variety of sharable side dishes, including warm cheese bread, fried bananas and crispy polenta, are brought to each table and replenished throughout the meal. For guests preferring lighter fare, we also offer Brazilian-inspired à la carte seafood options, a “Market Table” only option and a selection of small plates. Our Market Table, which features a variety of gourmet side dishes, seasonal salads, Brazilian hearts of palm, fresh-cut vegetables, aged cheeses, smoked salmon and cured meats is immediately available once our guests are seated. We believe it pays homage to the kitchen tables of Southern Brazil where families share fresh produce and seasonal salads grown locally. Our menu is enhanced by an award-winning wine list and a full bar complete with a selection of signature Brazilian drinks such as the caipirinha.
Interactive, Approachable Fine-Dining Experience Delivered By Our Gaucho Chefs
We believe that we offer our guests an upscale, approachable and friendly atmosphere in elegant dining rooms that is complemented by the personalized, interactive experience with our gaucho chefs and team members. Skilled artisans trained in the centuries-old Southern Brazilian cooking tradition of churrasco and the culture and heritage of Southern Brazil, the home of churrasco, our gaucho chefs are central to our ability to maintain consistency and authenticity throughout our restaurants in Brazil and the United States. Due to our significant operations in Brazil, we are able to place many of our native Brazilian gaucho chefs in restaurants in the United States, which we believe preserves the distinctly Brazilian attributes of our brand. Our team members focus on anticipating guests’ needs and helping guests navigate our unique dining experience for a memorable visit.
Our gaucho chefs butcher, prepare, cook and serve our premium meats to each guest, as well as engage and interact with them. We utilize a continuous style of service, where each of our gaucho chefs approaches guests at their table with various selections of meat, providing our guests with the cut, temperature and quantity they desire. During these interactions, our gaucho chefs learn each guest’s specific preferences and are able to tailor their dining experience accordingly. In addition to providing an entertaining and engaging experience, our continuous service allows our guests to control the entrée variety, portions and pace of their meal, which we believe maximizes the customization of their experience and the satisfaction they receive from dining at our restaurants.
88
Table of Contents
Award-Winning Concept with a Compelling Value Proposition and Broad Appeal
We believe that the combination of our high-quality Brazilian cuisine, differentiated dining experience and the competitive price point of our prix fixe menu leads our restaurants to appeal to a wide range of demographic, including both men and women, and socioeconomic groups. We believe our restaurants provide a preferred venue for various dining occasions, including intimate gatherings, family get-togethers, business functions, convention banquets and other celebrations. A majority of our guests dine at our restaurants multiple times per year. In Fiscal 2014, our average per-person spend was $59, which we estimate is approximately three-quarters of that of the traditional high-end steakhouse category.
Our restaurants have received numerous awards and accolades from critics and reviewers in the United States and Brazil. For example, we have been nationally recognized by Nation’s Restaurant News, Zagat and Wine Spectator Magazine, and we have received awards from local media in the markets we operate, including Atlanta Magazine, Chicago Tribune, Dallas Observer and Houston Business Journal. Additionally, our restaurants are consistently included among the top upscale dining options by reputable online reviewers such as Yelp and Urban Spoon. We believe that the authenticity of our brand is demonstrated by the fact that we have received multiple “best of” restaurant awards from Veja Magazine.
Unique Operating Model Drives Industry-Leading Restaurant-Level Profitability
Through the consistent execution of our unique business model, we are able to produce what we believe is industry-leading restaurant-level profitability by optimizing labor and food costs. For Fiscal 2014, the sum of our food and beverage costs and compensation and benefits costs (or “prime costs”) as a percentage of revenue were 50.7%, which we believe, based on an internal survey of our public competitors in the full-service dining category, is approximately 750 basis points lower than the average within the full-service restaurant industry in the United States. Our favorable performance on the largest components of a restaurant’s cost structure, which drives our restaurant contribution margins, is due to the following unique structural characteristics of our operational model:
| • | The dual role our gaucho chefs play as both chef and server significantly reduces back-of-the-house labor costs; |
| • | Simple cooking technique and streamlined food offering, combined with table-side service and plating, allow for efficient kitchen and server operations, reducing labor costs; |
| • | Our gaucho chefs work as a team with cross-functional roles and responsibilities, increasing productivity, speed of service and guest satisfaction, while reducing labor costs; |
| • | Simple, space-efficient cooking technique and streamlined menu reduces our kitchen’s footprint and maximizes space devoted to front-of-the-house tables, which allows our restaurants to achieve higher sales per square foot and enables us to leverage our fixed costs such as occupancy; |
| • | Our self-service Market Table requires minimal staffing and kitchen preparation, thereby reducing labor costs, and provides us flexibility in the range of items we offer, which helps us manage food costs through seasons and market cycles; |
| • | In-house butchering by our highly skilled gaucho chefs maximizes the yield on our meat cuts, thereby reducing food costs; and |
| • | Our wide variety of proteins offered provides us flexibility in sourcing our meat selection, which help us optimize food costs. |
Industry-Leading Cash-on-Cash Returns Create New Restaurant Growth Opportunity
Our business model produces attractive unit volumes and restaurant contribution margins that drive what we believe are industry-leading cash-on-cash returns, based on an internal survey of our public competitors in the restaurant industry. For Fiscal 2014, we generated AUVs of approximately $8.0 million and an average restaurant
89
Table of Contents
contribution margin of 32.5%. Since 2007, our new restaurants that have been open at least three years as of December 28, 2014, have generated an average year three cash-on-cash return of greater than 50%. We calculate our year three cash-on-cash return by dividing our restaurant contribution in the third year of operation by our initial investment costs (net of pre-opening costs and tenant allowances). Our restaurants perform well across a diverse range of geographic regions, population densities and real estate settings, which we believe demonstrates the portability of our concept to new markets. We believe the combination of our strong cash-on-cash returns, proven concept portability, and footprint of only 37 restaurants, including our first joint venture restaurant, supports further use of cash flow to grow our restaurant base and creates an attractive new restaurant growth opportunity.
Highly Attractive Concept for Domestic and International Real Estate Developers Supports Growth
Due to the broad appeal of our brand, the diversity of our guest base and the relatively high number of weekly visits to our restaurants, our concept is a preferred tenant for real estate developers. Landlords and developers, both in the United States and internationally, seek out our restaurants to be anchors for their developments as they are highly complementary to national retailers. Our restaurants that opened prior to Fiscal 2014 have attracted, on average, approximately 137,000 guests per restaurant in Fiscal 2014, which we believe, based on an internal survey of our public fine-dining competitors, is approximately 60% more guests per restaurant than those competitors. Our ability to achieve AUVs that are comparable to those of other high-end steakhouses despite our lower average check demonstrates our capacity to attract more guests than many of our competitors. Our AUVs, brand recognition and relatively high guest traffic position us well to negotiate the prime location within a development and favorable lease terms, which enhance our return on invested capital.
We believe our concept has international appeal and makes us an attractive tenant for international real estate developers, and we believe we will be able to leverage our brand strength to negotiate attractive terms in desirable locations as we grow outside the United States and Brazil.
Experienced Leadership
Our senior management team has extensive operating experience with an average of over 26 years of experience in the restaurant industry. We are led by our CEO, Larry Johnson. Mr. Johnson first began working with Fogo de Chão in 1996 as Corporate Counsel. In 2007, Mr. Johnson joined us as CEO and has guided the growth of our company from 11 restaurants in 2007 to 37 restaurants as of the date of this prospectus. Under his leadership, our business has consistently achieved growth in revenue and Adjusted EBITDA year-over-year. Mr. Johnson leads a team of dedicated, experienced restaurant professionals including Barry McGowan, our President, Tony Laday, our CFO, and Selma Oliveira, our COO. Mrs. Oliveira, who was born in Brazil, joined us to help start our operations in the United States in 1996. Our senior management team is focused on executing our business plan and implementing our growth strategy, and we believe they are a key driver of our success and have positioned us well for long-term growth.
Our Growth Strategies
We plan to continue to expand our restaurant footprint and drive revenue growth, improve margins and enhance our competitive positioning by executing on the following strategies:
Grow Our Restaurant Base
We believe we are in the early stages of our growth with 37 current restaurants, 26 in the United States, 10 in Brazil and one in Mexico, our first joint venture restaurant. Based on internal analysis and a study prepared by Buxton, we believe there exists long-term total restaurant potential for over 100 new domestic sites and additional new restaurants internationally, due to the broad appeal of our differentiated concept, industry leading cash-on-cash returns, flexible real estate strategy and successful history of opening new restaurants. We have a long track record of successful new restaurant development, evidenced by having grown our restaurant count by a multiple of 10 since 2000 and at a 11.5% CAGR since 2010. Since 2007, our new restaurants that have been open at least three years have generated an average year three cash-on-cash return of greater than 50%. We calculate our year three cash-on-cash return by dividing our restaurant contribution in the third year of operation by our initial investment costs (net of pre-opening costs and tenant allowances). We believe our concept has proven portability, with strong AUVs and cash-on-cash returns across a diverse range of geographic regions, population densities and real estate settings.
90
Table of Contents
We will continue to pursue a disciplined new restaurant growth strategy primarily in the United States in both new and existing markets where we believe we are capable of achieving sales volumes and restaurant contribution margins that generate attractive cash-on-cash returns. We plan to open five to six restaurants during Fiscal 2015, which includes our first joint venture restaurant in Mexico City, which opened in May 2015. Over the next five years, we plan to increase our company-owned restaurant count by at least 10% annually, with North America being our primary market for new restaurant development. In addition, we plan to grow in other international markets.
| • | Open New Restaurants in the United States. We believe the United States can support a considerable number of additional Fogo de Chão restaurants and will continue to be our primary market for new restaurant development. Based on internal analysis and a study prepared by Buxton, we estimate that there exists long-term potential for over 100 new domestic sites across large- and mid-sized markets as well as urban and suburban locations that can support Fogo de Chão restaurants. |
| • | Open New Restaurants in Brazil. Based on analysis performed by our development team, we believe there is an opportunity to open additional restaurants in Brazil, the birthplace of Fogo de Chão. Over the next five years, we plan to open three to five new restaurants throughout the country as attractive real estate locations become available. In addition to providing strong returns on invested capital, our operations in Brazil allow us to maintain our authentic and distinctive churrasco heritage and support the global growth of our brand. |
| • | Open New Restaurants in Other International Markets. We will selectively consider other international markets, as we believe attractive opportunities for opening new restaurants exist in large cities and business centers in certain international markets including Asia, Australia, Canada, Europe, the Middle East and South America. We will pursue growth in these markets through a combination of company-owned restaurant development and joint ventures, which we believe allow us to expand our brand with limited capital investment by us. In May 2015, we opened our first joint venture restaurant in Mexico City. |
Our current restaurant investment model targets an average cash investment of $4.5 million per restaurant, net of tenant allowances and pre-opening costs, assuming an average restaurant size of approximately 8,500 square feet, an AUV of $7.0 million and a cash-on-cash return in excess of 40% by the end of the third full year of operation. On average, our new company-owned restaurants opened since the beginning of 2007 have exceeded these AUV and cash-on-cash return targets within the third year of operation.
Grow Our Comparable Restaurant Sales
We believe the following strategies will allow us to grow our comparable restaurant sales:
| • | Food and Beverage Innovation. We seek to introduce innovative items that we believe align with evolving consumer preferences and broaden our appeal, and we will continue to explore ways to increase the number of occasions for guests to visit our restaurants. In order to drive guest frequency and broaden the appeal of our menu, we recently added seafood items and on-trend seasonal food and beverage offerings. Additionally, we believe there are significant day-part opportunities with our recently launched Bar Fogo, a “small plates” menu served at the bar, which we launched in April 2014, happy hour and special occasion menus. |
| • | Increase Our Per Person Average Spend. We believe there are opportunities to drive comparable restaurant sales growth through incremental food and beverage sales. For example, in February 2014 we launched our Malagueta Shrimp Cocktail, which guests can order in addition to our traditional prix fixe menu. Through Bar Fogo, we plan to generate incremental food sales as well as increase our alcohol sales by improving our guest experience in our bar. In Fiscal 2014, our alcohol mix was 16.7% of sales, which we believe is below that of our fine-dining peers. In addition to our Bar Fogo initiative, we believe we can increase our alcohol sales through our recently improved wine-by-the-glass program and the introduction of new Brazilian-inspired cocktails to our beverage menu. Finally, we believe the continued rollout of happy hour and special occasion menus will also increase our per person average spend. |
| • | Further Grow Our Large Group Dining Sales. We believe our differentiated dining experience, open restaurant layout, speed of service and compelling value proposition make us a preferred destination for group dining occasions of all types. For Fiscal 2014, large group sales represented 12.0% of US revenue, and |
91
Table of Contents
| we believe there is a significant opportunity to grow that aspect of our business. We have added group sales managers at most restaurants and introduced large group reception and meeting packages, which have generated significant momentum in group sales growth. In Fiscal 2014, we generated large group sales growth of 12.8% for our comparable restaurants over the prior year period, and we believe the investments we have made in our group sales business will continue to yield positive results. |
| • | Continue to Improve Our Marketing to Drive Traffic. We will continue to invest in marketing and advertising to drive guest trial and frequency. We continue to introduce new marketing initiatives through various channels, including social, online, print, digital advertising, TV and radio media, with the intent to promote brand awareness. We will continue to harness word of mouth and grow our social media and e-mail marketing fan base through thoughtful planning, unique promotions and rich content that reward loyalty and increase guest engagement with our brand. We intend to drive repeat traffic by becoming our guests’ preferred upscale restaurant destination and believe targeted marketing investments that heighten awareness, reinforce the premium image of our brand and highlight the authenticity of our dining experience will continue to generate guest loyalty and promote brand advocacy. |
| • | Opportunistically Remodel Select Restaurants. Beginning in 2015, we plan to launch an opportunistic remodel program with the target of remodeling three to four restaurants during the 2015 fiscal year. We believe our new design will enhance the guest experience, highlight our brand attributes and encourage guest trial and frequency. We also believe there are opportunities to optimize restaurant capacity and merchandising to maximize sales per square foot. |
Improve Margins by Leveraging Our Infrastructure and Investments in Human Capital
To support our future growth and improve our operations and management team, over the last three years we have invested over $5 million in incremental annual personnel costs by adding 18 positions to our corporate team and adding 16 local sales manager positions and five assistant manager positions at the restaurant level. These hires have bolstered key functional areas and supported future growth initiatives including senior leadership, new restaurant site selection and analysis, new restaurant design, group dining, product innovation and in-restaurant employee training. In addition, we have implemented initiatives in our restaurants to improve labor productivity, which we believe will further enhance restaurant profitability and the guest experience. As evidenced by our improvement in both comparable restaurant sales growth and restaurant contribution in 2014, these investments and initiatives have yielded positive results and we believe we will continue to benefit from these investments as we grow our business in the long-term. Furthermore, we expect our general and administrative expenses to decrease as a percentage of total revenue over time as we are able to leverage these investments by growing revenue faster than our fixed cost base. In addition, we have made substantial investments in our IT systems, and we expect to utilize our IT infrastructure for continued improvements in operational efficiency and margins through the use of labor productivity and training tools.
Properties
As of the date of this prospectus, we operate 26 restaurants in the United States, 10 restaurants in Brazil and one joint venture restaurant in Mexico. We operate a variety of restaurant formats, including in-line and free-standing locations. Our restaurants range in size from approximately 7,000 to 16,000 square feet, with seating from 200 to 500 guests. Going forward we plan to open restaurants that will range from approximately 7,000 to 10,000 square feet per restaurant and may vary depending on site specific opportunities.
We currently lease all of our restaurants except for two locations. Our leases generally have initial terms of between 10 and 20 years and can be extended only in five-year increments. All of our leases in the United States require a fixed annual rent, and many require the payment of additional rent if restaurant sales exceed a negotiated amount. Generally, our leases are “net” leases, which require us to pay all of the cost of insurance, taxes, maintenance and utilities. We generally cannot cancel these leases at our option.
In addition, we lease approximately 14,000 square feet of office space in Dallas, Texas which we use as our corporate headquarters. This lease expires in 2017, with options to renew until 2022. We utilize approximately 4,600 square feet of office space above our Santo Amaro restaurant in São Paulo for our corporate office in Brazil.
92
Table of Contents
The general location and opening date for each of our restaurants are set forth below:
| United States |
International | |||||||||||
| Location | Date Opened | Location | Date Opened | Location | Date Opened | |||||||
| Addison, TX* | August 1997 | Kansas City, MO |
January 2009 |
São Paulo, Moema | March 1986 | |||||||
| Houston, TX* | February 2000 | Denver, CO |
July 2009 |
São Paulo, Santo Amaro | June 1987 | |||||||
| Atlanta, GA | February 2001 | San Antonio, TX |
August 2009 |
São Paulo, Vila Olimpia | October 2003 | |||||||
| Chicago, IL | August 2002 | Las Vegas, NV |
November 2011 |
Belo Horizonte, Sevassi | September 2006 | |||||||
| Beverly Hills, CA | March 2005 | Orlando, FL |
March 2012 |
Brasilia | May 2007 | |||||||
| Washington, D.C. | December 2005 | Boston, MA |
November 2012 |
Salvador | June 2008 | |||||||
| Philadelphia, PA | December 2006 | San Diego, CA |
August 2013 |
Rio de Janeiro | June 2011 | |||||||
| Minneapolis, MN | April 2007 | Rosemont, IL |
September 2013 |
São Paulo, Center Norte | October 2012 | |||||||
| Baltimore, MD | August 2007 | New York, NY |
December 2013 |
São Paulo, Jardins | November 2013 | |||||||
| Austin, TX | November 2007 | San Jose, CA |
February 2014 |
Rio de Janeiro | April 2015 | |||||||
| Indianapolis, IN | May 2008 | Portland, OR |
May 2014 |
|||||||||
| Miami Beach, FL | October 2008 | Los Angeles, CA |
December 2014 |
Mexico City, Mexico | May 2015** | |||||||
| Scottsdale, AZ | December 2008 | San Juan, Puerto Rico |
February 2015 |
|||||||||
| * | Indicates restaurant on property owned by us. |
| ** | Indicates joint venture restaurant. |
Site Selection and Development
New Restaurant Development
We will continue to pursue a disciplined restaurant growth strategy in markets where we believe we are capable of achieving sales volumes and restaurant contribution margins that achieve attractive cash-on-cash returns. We plan to open five to six restaurants during Fiscal 2015, which includes our first joint venture restaurant in Mexico City, which opened in May 2015. Over the next five years, we plan to increase our company-owned restaurant count by at least 10% annually.
We believe we are in the early stages of our growth and view the United States as our primary market for new restaurant development. Our restaurants perform well across a diverse range of geographic regions, population densities and real estate settings. Based on internal analysis and studies by Buxton, we believe there is long-term potential for over 100 new sites in the United States to support Fogo de Chão restaurants. In Brazil, we plan to open three to five new restaurants throughout the country over the next five years as attractive real estate locations become available. We will continue to selectively consider other international markets, as we believe attractive opportunities for opening new restaurants exist in international markets, including Asia, Australia, Canada, Europe, Mexico, the Middle East and South America.
We will pursue international expansion beyond Brazil in large cities through a combination of company-owned restaurant development and joint ventures. We have developed a joint venture strategy to grow our restaurant base in new international jurisdictions by leveraging the capital and local market expertise of restaurant operating partners to enable us to enter these new markets efficiently. We recently entered into a joint venture agreement with Minajaro, S.A. de C.V. and opened our first joint venture restaurant in Mexico City in May 2015. We will pursue growth in Mexico through this joint venture, which we believe will allow us to expand our brand with limited capital investment by us. In addition, during the first quarter of 2015 we entered into a new joint venture agreement, pursuant to which we currently expect to open our second joint venture restaurant in Dubai in 2016.
There is no guarantee that we will be able to increase the number of our restaurants. We may be unsuccessful in expanding within our existing or into new markets for a variety of reasons described herein under “Risk Factors,” including competition for guests, sites, employees, licenses and financing.
Market and Site Selection Process
We consider market and site selection to be critical to our long-term success because the location of a restaurant is a critical variable in its long-term success, and we accordingly devote considerable resources to market analysis, real estate planning and site selection.
93
Table of Contents
We use a combination of our internal development committee as well as a national real estate broker interfacing with local networks in our target markets to identify and assess potential sites for new restaurant development. Our in-house real estate team has over 93 years of combined experience with a wide range of national restaurant brands. We utilize sophisticated analytical tools designed to uncover characteristics that we believe drive successful restaurant openings. In the United States, we utilize two complementary site selection tools for market planning: (i) Buxton, which utilizes transaction data based on actual guest zip codes to identify the most valuable psychographic guest segments and maps those segments to uncover trade areas that contain the highest concentration of our core guests in Designated Market Areas (“DMAs”) to help us prioritize market and site selection and (ii) Intalytics, which also uses psychographic criteria as well as site-specific features, location of competitors and customer surveys to further refine the search within potential DMAs.
Criteria for evaluating market expansion opportunities include total population and population density, guest demographics, total DMA restaurant sales, gross domestic product per capita, labor force and unemployment rates, availability of premier site locations, competition penetration and projected unit economics, among other things. We seek out locations with high average household income and commercial density as well as traffic drivers such as high daytime population and proximity to luxury hotels, meeting spaces and airports and sites with a strong mix of retail co-tenancy.
Our real estate process is led by our internal development committee, which is comprised of senior management and members of our real estate team. The development committee meets periodically to review new site opportunities and recommends new locations to our board of directors for approval. Once a location has been approved by the board of directors, we begin a design process to align the characteristics of the site to our brand attributes.
Restaurant Design
We place significant emphasis on the unique design and atmosphere of our restaurants. Each of our restaurants has a unique layout to optimize available space, and we have a flexible restaurant design. This flexibility enhances our growth opportunity, since our concept performs well in a diverse range of property types, building sizes and locations from high-density urban to less dense suburban markets with either in-line or free-standing building types.
Restaurant design is handled by our in-house architectural team utilizing in-house resources as well as local third-party architects in the markets where we develop restaurants. In designing our restaurants, our goal is to provide guests with an open, interactive layout that complements the continuous style of service provided by our gaucho chefs. We believe our restaurant design highlights our Southern Brazilian roots in a modern, contemporary way. This is accomplished through our choice of color palette, imagery and décor, which we believe creates an atmosphere that enhances our guests’ dining experience. Depending on the location and size of the restaurant, guests will find unique elements incorporated in the restaurant design. For example, many restaurants include a glass-enclosed pit roaster prominently displayed with large cuts of meat cooking over an open flame. While all of our restaurants share similar design elements, each restaurant is customized to accommodate the specifics of the location and the available floor space. Our restaurant floor plans have ample space, allowing for a fluid and dynamic setup and provide flexibility to accommodate large groups. Because of the simplicity of our back-of-house operations, we are able to dedicate more floor space for the seating area than some of our competitors, thereby optimizing our restaurant locations and increasing revenue per square foot. Beginning in 2015, we plan to launch an opportunistic remodel program with the target of remodeling three to four restaurants during the 2015 fiscal year. We believe our new design will enhance the guest experience, highlight our brand attributes and encourage guest trial and frequency.
Construction
Restaurant construction is overseen by our construction team, which includes our Vice President of Development, in-house architects and our in-house construction manager. Construction of a new restaurant in the United States typically takes approximately four to six months. We generally construct restaurants in in-line leased retail space or free-standing buildings on leased properties. Our restaurant investment model targets a cash build-out cost of $3.0 to $5.0 million per restaurant, net of tenant allowances and pre-opening costs.
94
Table of Contents
Our Dining Experience
Our restaurants offer a differentiated prix fixe menu as well as select à la carte options. For the full churrasco experience, the prix fixe menu includes two courses. Guests can begin at the Market Table, which features a variety of gourmet side dishes, seasonal salads, Brazilian hearts of palm, fresh-cut vegetables, aged cheeses, smoked salmon and cured meats, and is available immediately after the guests are seated.
The second course of the menu is the rodizio (meat) service. We offer a selection of up to 20 cuts of beef, lamb, pork and chicken fire-roasted over open flames in the traditional Brazilian style. Gaucho chefs rotate through the dining room, with each server responsible for a single cut of meat that is carved table-side to guests’ specifications. Some of our most popular Brazilian style cuts include the picanha, our signature cut (a part of the sirloin), alcatra (cut from the top sirloin), new beef ancho (the prime part of the rib eye), fraldinha (bottom sirloin), linguica (robust pork sausages) and costela (beef ribs).
Each guest has beside them a two-sided medallion with one side red and one side green. When a guest is ready to begin enjoying the various selections of meat they simply turn the medallion to green. This signals our gaucho chefs to visit that table and offer whatever cut of meat they are serving. Guests can pause the service at any time by turning the medallion to red and then back to green when they are ready to try additional selections, and can communicate to our gauchos any specific cut of meat they prefer. The medallion allows customization so the guest can control the pace and choice of meats. Each cut is carved by our gaucho chefs in a manner designed to both enhance the tenderness of each slice as well as meet our guests’ desired portion size and temperature.
To complement the meats, a variety of sharable side dishes, including warm cheese bread, fried bananas and crispy polenta, among various other selections, are brought to each table and replenished throughout the meal. Our restaurants also offer a selection of traditional desserts, including papaya cream and tres leches.
For guests preferring lighter fare, we also offer Brazilian-inspired à la carte seafood options, which we introduced in February 2014 across our restaurant base to increase guest frequency and broaden the appeal of our menu. We also offer the option to have only food from the Market Table. Our menu options are enhanced by an award-winning wine list and a full bar complete with a selection of signature Brazilian drinks such as the caipirinha. In March 2014, we introduced Bar Fogo, a “small-plates” menu offered at the bar designed to enhance our bar experience, increase alcohol sales and drive higher spend per guest. We believe there is substantial opportunity to increase guest frequency and spend per guest through continued menu innovation and day-part expansion.
Restaurant Management and Operations
Restaurant Organizational Structure
Each restaurant typically employs approximately 60 to 85 people. There are approximately 10 to 12 gaucho chefs per restaurant. Supporting the gaucho chefs are approximately 10 to 30 servers and approximately 10 to 30 bussers and kitchen staff as well as other operating personnel. Our gaucho chefs butcher, prepare, fire-roast and serve all our meats. Each restaurant has a general manager and an assistant general manager, and half of our restaurants in the United States employ a second assistant manager. To promote authenticity, continuity of the churassaco culture and improved operations, most of our employees holding management-level positions and our general managers are former gaucho chefs.
We emphasize a culture of collaboration within the management of our restaurants to facilitate the continuous development of “best practices” regarding guest service, cost control and growth opportunities. In both our United States and Brazilian operations, our general managers meet each week to discuss performance and opportunities for improvement.
Our Gaucho Chefs
Our highly-trained and skilled gaucho chefs perform a combination of “back-of-the-house” and “front-of-the-house” duties. The skill set required to perform as one of our gaucho chefs illustrates the importance of the position in the organization. The responsibilities and skills fall into three general categories – culinary, service, and authenticity:
95
Table of Contents
Culinary
| • | Assess meat quality; |
| • | Butcher, season and marinate meats; |
| • | Cook meats to restaurant and guest specification; |
| • | Forecast nightly business flow and adjust the types and quantities of meats to be cooked to ensure quality and utilize procedures to minimize meat waste; and |
| • | Cooking temperature management (each meat requires different temperature management techniques). |
Service
| • | Ability to serve in high energy “espeto corrido” style in a safe manner; |
| • | Delivery and presentation of skewered meats to each table; |
| • | Customized carving of meats to satisfy the preferences of the guest; |
| • | Monitor the tables and coordinate with each other, ensuring that each guest is presented with all available cuts of meat; and |
| • | Ensure that the pace and style of the presentation of each meal is consistent with authentic gaucho traditions. |
Authenticity
| • | Knowledgeable regarding culture, history, and lifestyle of Southern Brazil and its gauchos; |
| • | Knowledgeable regarding traditional gaucho cuisine, including the different cuts of meat and the style of cooking; |
| • | Ability to answer guests’ questions regarding gaucho tradition, culture and cuisine; and |
| • | Train employees in the United States in authentic service, monitor service delivery at each meal and make any corrections needed to preserve the authentic nature of presentation. |
We maintain very high standards for the gaucho chef position. Once selected, the employee must successfully complete an apprenticeship program of 18 to 24 months, which primarily consists of on-the-job training before being certified for the position. The training is not completed after this initial program, as we have implemented a program of continuous training and mentoring. We credit our stringent hiring and intense training practices for our ability to deliver a consistent and authentic product to our guests, which we believe differentiates us from our competition. These practices have also resulted in strong retention rates in our restaurants, with our gaucho chefs having been employed with us for an average of over three years and our restaurant managers having been employed with us for an average of 10 years.
Talent Acquisition, Training and Leadership Development
Our talent management begins with attracting, selecting and training talent that aligns with our values. We believe this approach has been a cornerstone of our success and we continue to focus on our training efforts to ensure our brand standards are maintained globally. Our talent strategy is focused on three core tenets, underpinned by a technology-based platform and web-based tools, including:
| • | Selection, On-Boarding and Cultural Immersion. We take a balanced approach on selection by attracting and developing like-minded, guest- and hospitality-focused leaders for future management needs. All leaders at all levels of our organization, are immersed in the culture and heritage of Fogo de Chão. |
96
Table of Contents
| • | Competency-Based Learning. After passing an interview and selection process, managers must be certified through an eight- to 12-week in-restaurant management development program. During the onboarding process, newly promoted or hired leaders learn all of the functional positions in the restaurant and develop strong guest-oriented management routines. Training takes place in one of our six training restaurants. All Fogo employees, irrespective of level in the organization, are coached and developed in the competency their role requires and are certified through a validation process. |
| • | Next Level Leadership. We continue to identify future leaders through our rigorous succession-management process and develop tailored, competency-based development action plans in partnership with direct supervisors at every level of our organization. Our learning and development platforms continue to track development action plans to ensure our Fogo employees are prepared to meet current and future needs. |
Our learning and development platforms are web-based and are delivered with interactive content that engage users and test for retained knowledge. This video-based approach allows us to deliver our learning and development platforms in multiple languages and maintain version control, keeping learning consistent internationally as we continue to develop new content.
Brazilian Gaucho Chef Development and Mentor Process
To help to create an exceptional dining experience and authenticity, we utilize our Brazilian operations as a training ground and recruitment base for our restaurants in the United States, selecting talented gaucho chefs to transfer to the United States. We pay for English lessons, travel expenses, and immigration expenses for our gaucho chefs.
Since opening our first location in the United States in 1997, we have brought gaucho chefs to the United States from Brazil utilizing the L-1B “specialized knowledge” visa which generally permits an employee to remain in the United States for up to five years. We also utilize the L-1A “intracompany manager” visa for our employees who qualify. The L-1A visa generally permits an employee to remain in the United States for up to seven years. We have applied for and received permanent resident alien (“green card”) immigration status for a number of these transferees.
Since 2013, we have also brought Brazilian gaucho chefs to the United States on one-year corporate training programs through use of the J-1 “cultural exchange” visa. The primary focus of this program is training and cultural exchange, including classroom instruction.
Marketing and Advertising
Our marketing goals are to:
| • | Increase comparable restaurant sales by attracting new guests; |
| • | Increase frequency (return visits) of existing guests; |
| • | Support new restaurant openings to achieve sales and profit goals; and |
| • | Communicate and promote brand positioning as a leading Brazilian Steakhouse through our focus on high-quality ingredients, a high level of service and commitment to the traditional gaucho method of cooking. |
All advertising is coordinated by our corporate office. We utilize various advertising channels to create awareness and drive trial of the brand. These channels may include digital, social media, print, out-of-home, radio and television advertising as well as local restaurant marketing. Other areas of marketing include travel publications and advertising to support the growing social media platforms.
Social media
Social media is an increasingly important and growing marketing channel. We maintain a strong presence on several social platforms including Facebook, Twitter, YouTube and Instagram, allowing us to maintain a high level of guest engagement and brand awareness. Our United States and Brazilian Facebook pages have increased our “likes” by
97
Table of Contents
154% since December 2013. We periodically conduct promotions and provide content on various social platforms to further drive a unique level of guest engagement. We believe our social presence allows us to meaningfully connect with our guests and harness positive word of mouth.
Local restaurant marketing
A key strategy utilized by our management teams at the local level is to maintain strong relationships with concierge desks at key area hotels. At various restaurants, managers will also host networking events with chambers and associations to create awareness and goodwill among community organizations.
New restaurant openings
New restaurants are supported first by bringing on a local public relations firm to assist in introducing the brand to the market and promoting the brand through media relations. Advertising spend is optimized depending on the market and includes a combination of digital and social advertising, print, out-of-home, radio and television.
Group sales
We believe our restaurants are preferred group dining venues because of the quality and variety of our menu offering, the efficiency of our service model in handling large groups and our attractive private dining areas. Group sales managers prospect for new business with local businesses and organizations and work with existing guests on larger event planning. We define large groups as reservations with more than 15 guests. Over the last two years, we have invested in hiring group sales managers for almost all of our locations. We believe this investment has yielded strong results, as we generated large group sales growth of 12.8% for the fiscal year ended December 28, 2014 over the prior year period for our comparable restaurants. We expect to have group sales coverage at each of our United States locations by mid-2015, and believe continued increases in our group sales business represents a large growth opportunity.
Purchasing, Innovation and Quality Control
Our purchasing strategy is to offer our guests high-quality ingredients while leveraging the flexibility of our operating model to optimize costs. Since our menu does not require exact menu specifications, we innovate utilizing high-quality seasonal items to continually introduce new products while achieving the best available price for a range of proteins, including beef, chicken, lamb and pork, as well as Market Table ingredients. This advantage allows us to shift the mix of our ingredients to offset inflationary pressure and optimize the cost of the basket of products we deliver without compromising the guest experience. Our belief is that all innovation begins with focused, seasonal procurement that keeps our menu on-trend and maintains our affordable price positioning.
In addition, we have flexibility in the type and weights of proteins we purchase and serve, which helps us to manage our food costs. We have national supplier arrangements in the United States ranging from three months to one year depending on the product and season. We monitor contracts monthly, and shift the mix of our products served to respond to changes in pricing, thus optimizing the cost of the ingredients we offer in our restaurants. Finally, management of food waste through proper training and procedures at the restaurant level represents another lever through which we control our food costs given our prix fixe menu. From 2013 to 2014, pounds of meat consumed per guest has decreased from 2.07 to 2.00 for all restaurants due to improved training protocols regarding food waste management.
As evidence of our ability to manage our food costs without compromising our guest experience given our unique operating and service model, our food and beverage costs as a percentage of revenue decreased from 30.6% in the fiscal year ended December 29, 2013 to 29.9% in the fiscal year ended December 28, 2014 despite a 19% increase in beef prices over the same period. These costs as a percentage of revenue decreased further to 29.5% in the thirteen weeks ended March 29, 2015. Additionally, over this period, we have maintained strong guest satisfaction scores from New Brand Analytics, highlighting our ability to reduce our costs while providing an excellent guest experience.
We maintain strict quality standards at our restaurants. Each employee is expected to adhere to these standards, and it is the responsibility of the general managers and the gaucho chefs to ensure that these standards are upheld. We
98
Table of Contents
are committed to providing guests with high quality, fresh products and superior service. Through the use of our training programs, extensive experience requirements for our gaucho chefs and our commitment to hiring and developing staff, we are able to maintain high standards and guidelines for all menu items across our restaurants. Similarly, we rely on a quality assurance team to conduct regular, comprehensive audits of our suppliers to ensure we are offering our guests high-quality products.
Management Information Systems
All of our restaurants use computerized point-of-sale and back-office systems that we believe are scalable to support our continued growth. The systems provide a touch screen interface and integrated, high-speed credit card and gift card processing. The point-of-sale computers are designed specifically for the restaurant industry and the system is used to collect daily transaction data which generates information about daily sales, product mix and average check totals that we actively analyze. Applications inside the restaurant capture guest and reservation information, aiding in the management of the restaurant’s tables during service and optimizing our guests’ experience.
Our corporate systems provide our management with operating reports that show restaurant performance comparisons with budget and prior year results. These systems allow us to monitor restaurant sales, food and beverage costs, operating expenses and other restaurant trends on a regular basis and enable regular communication and collaboration between restaurants and the corporate office.
In early 2014, we developed a multi-year information technology strategy to further transform information technology into a growth-enabling function by focusing on building infrastructure, increasing technical staff, creating a technology platform to support sales growth and enabling productivity improvements. During 2013 and 2014, we invested in an enterprise-level Human Resources Information System, reservation and seating management tools and high-speed guest internet in our restaurants. In 2015, we expect to enhance our corporate office and restaurant information system infrastructure for continued improvements to our operational efficiency by pursuing technologies for mobile ordering, mobile payments, Customer Relationship Management tools and comprehensive training platforms.
Competition
The restaurant industry is highly competitive. The number, size and strength of our competitors vary widely by region. There are many different segments within the restaurant industry, which are distinguished based on the type of food, food quality, service, location, associated price-to-value relationship and overall dining experience. Our restaurants compete with a number of restaurants within their markets, both locally owned restaurants and other restaurants that are members of regional or national chains based on the quality and variety of our menu offering, our service model and our authentic Brazilian cuisine. Our competition continues to intensify as competitors increase the breadth and depth of their product offerings and open new restaurants. We compete in the full-service dining category with other Brazilian-style steakhouses and local and national upscale steakhouses such as Ruth’s Chris, Del Frisco’s and the Capital Grille.
Our Employees
As of March 29, 2015, we had 2,515 employees, of which 1,827 were employed in the United States and 688 were employed in Brazil. Of the 1,827 employees employed in the United States, 1,746 were employed in our restaurants and 81 performed selling, general and administration functions. Of the 688 employees employed in Brazil, 656 were employed in our restaurants and 32 performed selling, general and administration functions. None of our employees in the United States are currently covered by a collective bargaining agreement though some of our employees in Brazil participate in industry-wide trade union programs. We have had no labor-related work stoppages, and we believe our relations with our employees are excellent.
Government Regulation
Our restaurants are subject to licensing and regulation by state and local health, safety, fire and other authorities, including licensing and regulation requirements for the sale of alcoholic beverages and food. Failure to obtain or retain food or other licenses would adversely affect the operations of restaurants. We maintain the necessary restaurant,
99
Table of Contents
alcoholic beverage and retail licenses, permits and approvals. The development and construction of additional restaurants will also be subject to compliance with applicable zoning, land use and environmental regulations. We are subject to federal, state and local laws and regulations concerning waste disposal, pollution, protection of the environment, and the presence, discharge, storage, handling, release and disposal of, and exposure to, hazardous or toxic substances. Federal and state labor laws govern our relationship with our employees and affect operating costs. These laws include minimum wage requirements, overtime, unemployment tax rates, workers’ compensation rates, citizenship requirements and sales taxes. We are also subject to the Fair Labor Standards Act, the Immigration Reform and Control Act of 1986 and various federal and state laws governing such matters as minimum wages, overtime, tips, tip credits and other working conditions.
Our restaurants are subject in each state in which we operate to “dram shop” laws, which allow, in general, a person to sue us if that person was injured by an intoxicated person who was wrongfully served alcoholic beverages at one of our restaurants. Please see “Risk Factors—Risks Related to Our Business and Industry—Our business is subject to extensive regulation and we may incur additional costs or liabilities as a result of government regulation of our restaurants.”
Environmental Matters
Our operations are also subject to national, provincial, state and local laws and regulations in the United States and Brazil relating to environmental protection, including regulation of discharges into the air and water, storage and disposal of waste and clean-up of contaminated soil and groundwater. Under various national, provincial, state and local laws, an owner or operator of real estate may be liable for the costs of removal or remediation of hazardous or toxic substances on, in or emanating from such property. Such liability may be imposed without regard to whether the owner or operator knew of, or was responsible for, the presence of such hazardous or toxic substances.
Intellectual Property
Our principal trademarks include FOGO, FOGO DE CHÃO, BAR FOGO, and our campfire design, which we have registered with the United States Patent and Trademark Office. We have also registered or applied for registration of the FOGO EXPRESS, FOGO GRILL, BAR FOGO, FOGO TO GO, THE GAUCHO WAY OF PREPARING MEAT, and various designs as trademarks in the United States. In addition, we have registered or applied for FOGO DE CHÃO, FOGO’S, various FOGO and FOGO DE CHÃO-formative terms, our campfire design, and other terms as trademarks in Brazil. Several of our principal marks are also registered or applied-for in numerous foreign countries.
We believe that our trademarks, service marks and other intellectual property rights have significant value and are important to the marketing and reputation of our brand. An important part of our intellectual property strategy is the monitoring and enforcement of our rights in markets in which our restaurants currently exist or markets which we intend to enter in the future. We monitor international trademark registers to discover and oppose third-party trademark applications for confusingly similar trademarks to preserve and enhance the scope of protection for our brands.
We enforce our rights through a number of methods, including sending cease-and-desist letters or making infringement claims in federal court. We are aware of third-party restaurants with names similar to our trademarks in certain limited geographical areas such as Brazil and Illinois and are pursuing enforcement of our rights. However, we cannot predict whether steps taken to protect such rights will be adequate. See “Risk Factors—Risks Related to Our Business and Industry—Any failure to protect and maintain our intellectual property rights could adversely affect the value of our brand.”
Legal Proceedings
Since opening our first location in the United States in 1997, we have brought churrasqueiros, or gaucho chefs, to the United States from Brazil utilizing the L-1B “specialized knowledge” visa which generally permits an employee to remain in the United States for up to five years. We also utilize the L-1A “intracompany manager” visa for our employees who qualify. The L-1A visa generally permits an employee to remain in the United States for up to seven years.
100
Table of Contents
The Department of Homeland Security’s Bureau of Citizenship & Immigration Services (USCIS, formerly INS) began to narrow its interpretation of L-1B visa eligibility as to all corporate petitioners in 2007. Beginning in 2009, the USCIS ceased approving our L-1B visas and recommended that the petitions of 10 current L-1B visa holders be revoked. We contested the adverse actions before USCIS, and then sued USCIS in US District Court. The US District Court affirmed the USCIS denials in 2013, but we appealed that determination, and on October 21, 2014, the US Court of Appeals for the D.C. Circuit granted our appeal, reversed the USCIS denial, and remanded the representative L-1B petition in question to the district court, with instructions to vacate the denial and to remand to USCIS for further consideration in light of the Court’s correction of USCIS’s factual and legal adjudication errors. We anticipate USCIS may repoen the matter following remand to the district court and render a new decision in accordance with the D.C. Circuit’s decision, but to date there has been no final resolution of the representative L-1B petition and no specific indication of how USCIS will adjudicate the reopened matter.
We are currently involved in various claims, investigations and legal actions that arise in the ordinary course of our business, including claims and investigations resulting from employment-related matters. None of these matters, most of which are covered by insurance, has had a material effect on us, and as of the date of this prospectus, we are not party to any material pending legal proceedings and are not aware of any claims that could have a material adverse effect on our business, financial condition, results of operations or cash flows. However, a significant increase in the number of these claims or an increase in amounts owing under successful claims could materially and adversely affect our business, financial condition, results of operations or cash flows.
101
Table of Contents
Set forth below is the name, age (as of December 28, 2014), position and a description of the business experience of each of our executive officers, directors and other key employees:
| Name |
Age | Position | ||||
| Lawrence J. Johnson |
62 | Director and Chief Executive Officer | ||||
| George B. McGowan |
49 | President | ||||
| Anthony D. Laday |
48 | Chief Financial Officer | ||||
| Selma Oliveira |
57 | Chief Operating Officer | ||||
| Michael A. Prentiss |
39 | Chief Accounting Officer | ||||
| Jandir Dalberto |
48 | President, Brazil Operations | ||||
| Albert G. McGrath |
57 | General Counsel | ||||
| Todd M. Abbrecht |
46 | Director | ||||
| Gerald W. Deitchle |
63 | Director | ||||
| Douglas A. Haber |
32 | Director | ||||
| Neil Moses |
56 | Director | ||||
| Douglas R. Pendergast |
47 | Director | ||||
| Jeff T. Swenson |
39 | Director | ||||
Background of Executive Officers and Directors
Executive Officers
Lawrence Johnson has served as our Chief Executive Officer since April 2007 and has been a member of our board of directors since 2012. Prior to that, Mr. Johnson was a partner at Baker & McKenzie LLP, where he was employed since 1978. Mr. Johnson has a B.A. from Arizona State University and a J.D. from Southern Methodist University. Mr. Johnson also serves as a member of our board of directors. Based on his extensive industry and management experience, his tenure with our company and familiarity with us and his deep understanding of restaurant operations, Mr. Johnson is well-qualified to lead us and to serve on our board.
George B. McGowan has served as our President since 2013. Mr. McGowan has 33 years of experience in the restaurant industry including more than 10 years with Brinker International. He served as Chief Operating Officer of Macaroni Grill from 2010 to 2013 and as President and Chief Executive Officer of Waterloo Restaurants from 2002 to 2010. Waterloo Restaurants filed for Chapter 11 bankruptcy protection in March 2012. With his prior experience, we believe Mr. McGowan brings a broad range of operational knowledge and perspective to the company. Mr. McGowan holds a B.S. in Hotel Restaurant Management from the University of North Texas and a Graduate Certificate in Finance from Southern Methodist University.
Anthony D. Laday has served as our Chief Financial Officer since April 2014. Prior to that, Mr. Laday served as Vice-President-Finance, Treasurer and Investor Relations of Brinker International from 2010 to 2013 where he previously was Senior Director-Financial Planning and Analysis from 2007 to 2010. Mr. Laday holds a B.A. in Business Administration and an M.B.A. from Southern Methodist University.
Selma Oliveira has served as our Chief Operating Officer since 2006. Prior to that, she held the positions of Director of Operations and General Manager for us. She previously worked for the Marriott Corporation from 1986 to 1998 holding a number of managerial positions. Mrs. Oliveira holds a degree in education from the Mackenzie Institute in São Paulo, Brazil.
Michael Prentiss has served as our Chief Accounting Officer since 2014. Prior to that Mr. Prentiss served as our Chief Financial Officer from August 2011 to April 2014 and our Controller from September 2007 to August 2011. Mr. Prentiss served as Assistant Controller of Landry’s Restaurants from September 2003 to September 2007. Mr. Prentiss holds a B.B.A. in Accounting from Sam Houston State University.
Jandir Dalberto has served as our President, Brazil Operations since July 2012 and previously served as Operations Director since 2006. Mr. Dalberto also serves as General Manager for our restaurant in São Paulo, Vila Olimpia, a role in which he has served since the opening of that restaurant in 2002. Mr. Dalberto graduated from the Dom Pedro School in Santo Antônio do Sudoeste in the Paraná state of Brazil.
102
Table of Contents
Albert G. McGrath has served as our General Counsel since October 2014. Prior to that, Mr. McGrath was a partner at Baker & McKenzie LLP, from April 2000. Mr. McGrath holds a B.A. from Texas A&M University and a J.D. from Southern Methodist University.
Directors
Todd M. Abbrecht has been a member of our board of directors since May 2014. Mr. Abbrecht is a Managing Director of Thomas H. Lee Partners, which he joined in 1992. Mr. Abbrecht is currently a director of Aramark Corporation, Curo Health Services, Intermedix Corporation, inVentiv Health, Inc. and Party City. His prior directorships include Affordable Residential Communities, Inc., Dunkin’ Brands Group, Inc., Michael Foods, Inc., National Waterworks, Inc., and Warner Chilcott plc. Mr. Abbrecht holds a B.S.E. in Finance from the Wharton School of the University of Pennsylvania and an M.B.A. from Harvard Business School. Mr. Abbrecht was nominated to serve on our board of directors by Thomas H. Lee Partners in accordance with the Stockholders Agreement. Because of his strong background in banking and finance, his many years of experience overseeing our company and other corporations and his knowledge of management and strategy, Mr. Abbrecht is well-qualified to serve on our board.
Gerald W. Deitchle has been a member of our board of directors since January 2015. Mr. Deitchle has served on the board of directors of BJ’s Restaurants, Inc. since November 2004 and as its Chairman of the Board since June 2008. He served as President of BJ’s Restaurants, Inc. from February 2005 until December 2012 and as its Chief Executive Officer from February 2005 until his retirement in February 2013. From April 2004 to January 2005, Mr. Deitchle served as President, Chief Operating Officer and a director of Fired Up, Inc., a privately held company that owns, operates and franchises the Johnny Carino’s Italian restaurant concept. From 1995 to 2004, he was a member of the executive management team at The Cheesecake Factory Incorporated, a publicly held operator of upscale casual dining restaurants, with his last position as corporate President. Mr. Deitchle currently serves as a consultant to BJ’s Restaurants, Inc. and as a part-time advisor to privately held businesses. Mr. Deitchle holds a B.B.A. from Texas A&M University and an M.B.A. from the University of Texas at San Antonio and also holds an active C.P.A. license in Texas. Because of his strong background in the restaurant industry, his years of experience overseeing similar corporations and his knowledge of management and strategy, Mr. Deitchle is well-qualified to serve on our board.
Douglas A. Haber has been a member of our board of directors since July 2012. Mr. Haber is a Principal at Thomas H. Lee Partners, which he joined in 2006. Prior to joining Thomas H. Lee Partners, Mr. Haber worked at Goldman, Sachs & Co. in its Investment Banking Division’s Industrials and Natural Resources Group. Mr. Haber is currently a director of 1-800 CONTACTS, Inc. Mr. Haber holds a B.A., summa cum laude, in Economics and History from Middlebury College and an M.B.A. from Harvard Business School. Mr. Haber was nominated to serve on our board of directors by Thomas H. Lee Partners in accordance with the Stockholders Agreement. Because of his strong background in banking and finance, his years of experience overseeing our company and other corporations and his knowledge of management and strategy, Mr. Haber is well-qualified to serve on our board.
Neil Moses has been a member of our board of directors since November 2013. Mr. Moses has served as EnerNOC, Inc.’s Chief Operating Officer since April 2014, its Chief Financial Officer since April 2013 and its Treasurer since August 2013. From June 2012 until March 2013, Mr. Moses served as the Chief Global Strategy Officer of Dunkin’ Brands Group, Inc., a franchisor of quick service restaurants. From November 2010 until June 2012, Mr. Moses served as the Chief Financial Officer of Dunkin’ Brands Group, Inc. From 2003 until November 2010, Mr. Moses served as the Chief Financial Officer and Executive Vice President of Parametric Technology Corporation, a software company. Mr. Moses holds a B.A. in Psychology from Bowdoin College and an M.B.A. from the Tuck School of Business at Dartmouth. Because of his strong background in the restaurant industry, his years of experience in finance and his knowledge of management and strategy, Mr. Moses is well-qualified to serve on our board.
Douglas R. Pendergast has been a member of our board of directors since December 2014. Since January 2015, Mr. Pendergast has served as President and Chief Executive Officer of Quiznos. Mr. Pendergast served as the President and Chief Executive Officer of The Krystal Company, Inc. from April 2012 to September 2014. He previously served as the Chief Development and Franchise Officer of CraftWorks Restaurants & Breweries, Inc. from November 2010 to March 2012 and as Chief Franchise Officer of Church’s Chicken from February 2005 to March 2010. He is currently a board member at Quiznos and was previously a board member at Love’s Travel Stops. Mr. Pendergast holds a B.S. in
103
Table of Contents
Chemical Engineering from Georgia Institute of Technology and an M.B.A. from Harvard Business School. Because of his strong background in the restaurant industry, his years of experience overseeing similar corporations and his knowledge of management and strategy, Mr. Pendergast is well-qualified to serve on our board.
Jeff T. Swenson has been a member of our board of directors since July 2012. Mr. Swenson is a Managing Director at Thomas H. Lee Partners, which he joined in 2004. Prior to joining Thomas H. Lee Partners, Mr. Swenson worked in the private equity group at Bain Capital, LLC. Mr. Swenson also worked as a management consultant at Bain & Company. Mr. Swenson is currently a director of 1-800 CONTACTS, Inc., CTI Foods and Phillips Pet Food & Supplies. He was previously a director of Acosta Sales and Marketing, GrubHub Seamless Holdings Corporation, Intermedix Corporation, West Corporation and a board observer at Dunkin’ Brands, Inc. Mr. Swenson holds a B.A., with honors, in Economics from Northwestern University and an M.B.A. from Harvard Business School. Mr. Swenson was nominated to serve on our board of directors by Thomas H. Lee Partners in accordance with the Stockholders Agreement. Because of his strong background in banking and finance, his many years of experience overseeing our company and other corporations and his knowledge of management and strategy, Mr. Swenson is well-qualified to serve on our board.
Board Composition
Following the offering, our amended and restated certificate of incorporation will provide that our board of directors will be divided into three classes of directors as follows:
| • | the Class I directors will be Messrs. Abbrecht, Johnson and Moses, whose terms will expire at the annual meeting of stockholders to be held in 2016; |
| • | the Class II directors will be Messrs. Swenson and Pendergast, whose terms will expire at the annual meeting of stockholders to be held in 2017; and |
| • | the Class III directors will be Messrs. Haber and Deitchle, whose terms will expire at the annual meeting of stockholders to be held in 2018. |
A classified board of directors may have the effect of deterring or delaying any attempt by any person or group to obtain control of us by a proxy contest since such third party would be required to have its nominees elected at two separate annual meetings of our board of directors in order to elect a majority of the members of our board of directors. See “Risk Factors—Risks Related to this Offering and Ownership of Our Common Stock—Provisions of our charter documents, Delaware law and other documents could discourage, delay or prevent a merger or acquisition at a premium price.”
At each annual meeting of stockholders, the successors to the directors whose terms will then expire will be elected to serve from the time of election and qualification until the third annual meeting following such election and until their successors are duly elected and qualified or until his or her earlier death, resignation or removal. Any vacancies in our classified board of directors will be filled by the remaining directors, and the elected person will serve the remainder of the term of the class to which he or she is appointed.
Following the completion of this offering, we expect to be a “controlled company” under the rules of the because more than 50% of our outstanding voting power will be held by the THL Funds. We intend to rely upon the “controlled company” exception relating to the board of directors and committee independence requirements under the rules of the NASDAQ. Pursuant to this exception, we will be exempt from the rules that would otherwise require that our board of directors consist of a majority of independent directors and that our compensation committee and nominating and corporate governance committee be composed entirely of independent directors. The “controlled company” exception does not modify the independence requirements for the audit committee, and we intend to comply with the requirements of the Exchange Act and the rules of the NASDAQ.
No director will be deemed to be independent unless our board of directors determines that the director has no relationship which would interfere with the exercise of independent judgment in carrying out the responsibilities of a director. Our board of directors has determined that Messrs. Moses and Deitchle are independent for purposes of the listing standards of the NASDAQ and pursuant to other governing laws and applicable regulations.
104
Table of Contents
Board Committees
Before the completion of this offering, our board of directors will establish an audit committee, a compensation committee, a nominating and corporate governance committee and a development committee, each of which will operate pursuant to a charter that will be adopted by our board of directors. The composition of each committee will be effective upon the closing of this offering.
Audit Committee
The primary responsibilities of our audit committee will be to oversee our corporate accounting and financial reporting process. The audit committee will report to the board of directors periodically on any issues that arise with respect to the quality or integrity of our financial statements, our compliance with legal or regulatory requirements, the independence and performance of our independent auditor, the performance of the internal audit function and any other matters that the audit committee deems appropriate or is requested to include by the board of directors. The responsibilities of our audit committee, which will be set forth in a written charter to be adopted by our board of directors upon completion of this offering and reviewed and reassessed annually by the audit committee, include:
| • | evaluate the independence and qualifications of and determine the selection of, the compensation of, and if necessary, the replacement/rotation of, our independent registered public accounting firm; |
| • | discuss with our independent registered public accounting firm its responsibilities under generally accepted auditing standards and review and approve the planned scope and timing of the annual audit plans; |
| • | oversee the work of our independent registered public accounting firm and review and discuss our annual audited financial statements, quarterly financial statements and any significant findings from the audit; |
| • | review with management our financial reports and analyses; |
| • | review management’s report on its assessment of the design and effectiveness of our internal controls; |
| • | evaluate the performance, responsibilities, budget and staffing of our internal audit function; |
| • | review our major financial risk exposures with management; |
| • | pre-approve all audit and permitted non-audit services and related fees; |
| • | recommend to the board of directors policies for our hiring of partners, employees, former partners or former employees of the independent registered public accounting firm who participated in our audit; |
| • | establish and review policies for approving related party transactions between us and our directors, officers or employees; and |
| • | adopt procedures for receipt, retention and treatment of complaints received by us regarding accounting, internal accounting controls or auditing matters. |
Upon the completion of this offering, our audit committee will be composed of Messrs. Moses (Chair), Deitchle and Haber. Our board of directors has determined that Mr. Moses qualifies as an “audit committee financial expert” as that term is defined in Item 407(d) of Regulation S-K of the Securities Exchange Commission and the applicable standards of the NASDAQ.
Messrs. Moses and Deitchle have been determined to be independent by our board of directors. Although our audit committee includes only two instead of at least three independent directors as required by the NASDAQ, a company listing in connection with its initial public offering is permitted to phase in its compliance with the independent committee requirements under the rules of the NASDAQ. Under those rules, our audit committee may continue with its current composition, with a majority of the members of audit committee meeting applicable independence requirements, until our first anniversary of initial NASDAQ listing. After the first anniversary of the effective date of the registration statement of which this prospectus forms a part, our audit committee will consist of all independent directors.
105
Table of Contents
Compensation Committee
The primary responsibilities of our compensation committee will be to administer the compensation program and employee benefit plans and practices for our named executive officers and members of the board of directors. We intend that our compensation committee will review and either approve, on behalf of the board of directors, or recommend to the board of directors for approval, (i) annual salaries, bonuses, and other compensation for our executive officers, and (ii) individual equity awards for our employees and executive officers. We intend that our compensation committee will also oversee our compensation policies and practices. The committee will periodically report to the board of directors. Each member of our compensation committee is intended to meet the requirements of a “non-employee director” pursuant to Rule 16b-3 under the Exchange Act and an “outside director” pursuant to Section 162(m) of the Code.
We intend that our compensation committee will also perform the following functions related to executive compensation:
| • | review and approve the goals and objectives relating to the compensation of our executive officers, including any long-term incentive components of our compensation programs; |
| • | evaluate the performance of our executive officers in light of the goals and objectives of our compensation programs and determine each executive officer’s compensation based on such evaluation; |
| • | evaluate each of our executive officers’ performance; |
| • | review and approve, subject, if applicable, to stockholder approval, our compensation programs; |
| • | review and recommend new executive compensation programs; |
| • | review the operation and efficacy of our executive compensation programs in light of their goals and objectives; |
| • | review and assess risks arising from our compensation programs; |
| • | periodically review that our executive compensation programs comport with the compensation committee’s stated compensation philosophy; |
| • | review our management succession planning, including policies regarding the selection of executives and succession in the event of incapacitation, retirement or removal; |
| • | annually produce reports for filings with government agencies in compliance with applicable law or regulation; |
| • | review and recommend to the board of directors the appropriate structure and amount of compensation for our directors; |
| • | review and approve, subject, if applicable, to stockholder approval, material changes in our employee benefit plans; |
| • | establish and periodically review policies for the administration of our equity compensation plans; and |
| • | review the adequacy of the compensation committee and its charter and recommend any proposed changes to the board of directors not less than annually. |
In deciding upon the appropriate level of compensation for our executive officers, the compensation committee regularly reviews our compensation programs relative to our strategic objectives and emerging market practice and other changing business and market conditions. In addition, the compensation committee also takes into consideration the recommendations of our Chief Executive Officer concerning compensation actions for our other executive officers.
106
Table of Contents
We intend that our compensation committee will administer the issuance of stock options and other awards under our 2012 Plan and our 2015 Plan. Upon completion of the offering, the compensation committee will be composed of Messrs. Abbrecht (Chair), Pendergast and Swenson.
Nominating and Corporate Governance Committee
The nominating and corporate governance committee will assist our board of directors in identifying individuals qualified to become executive officers and members of our board of directors consistent with criteria established by our board of directors and in developing our corporate governance principles.
We intend that our nominating and corporate governance committee will also perform the following functions:
| • | identifying and recommending candidates for membership on our board of directors; |
| • | reviewing and recommending our corporate governance guidelines and policies; |
| • | reviewing proposed waivers of the code of conduct for directors and executive officers; |
| • | overseeing the process of evaluating the performance of our board of directors; and |
| • | assisting our board of directors on corporate governance matters. |
Upon the completion of this offering, our nominating and corporate governance committee will be composed of Messrs. Abbrecht (Chair), Johnson and Swenson.
Development Committee
The development committee will assist our board of directors in overseeing our creation and execution of our annual and longer-term restaurant expansion plans, both domestically and internationally.
We intend that our development committee will perform the following functions:
| • | provide oversight, guidance and input to our senior leadership team with respect to the development and evaluation of both of our annual and longer-term new restaurant expansion plans and recommend their approval by the board of directors; |
| • | review relevant financial, statistical and demographic data (such as capital commitments, lease terms, financial projections and risk characterizations) underlying new restaurant locations proposed by our senior leadership team and recommend approval by the board of directors within the context of our approved annual and longer-term expansion and financial plans; |
| • | review the proposed terms of new restaurant joint venture or licensing arrangements, both domestically and internationally, and recommend approval to the board of directors; |
| • | review the ongoing actual financial results of each new restaurant and provide the board of directors with financial updates on all open company-operated locations; and |
| • | review any proposed material alterations to existing restaurants including space expansions and contractions that may involve significant capital expenditures or lease amendments. |
Upon the completion of this offering, our development committee will be composed of Messrs. Deitchle (Chair), Haber and Swenson.
Code of Business Conduct and Ethics
We have adopted a code of business conduct, applicable to our officers, directors and employees, that will be amended in connection with this offering and will be available on our corporate website at www.fogodechao.com.
Compensation Committee Interlocks and Insider Participation
We intend that members of our compensation committee will be Messrs. Abbrecht (Chair), Pendergast and Swenson. None of our executive officers serves as a member of the board of directors or compensation committee of any entity that has one or more executive offices serving as a member of our board of directors or compensation committee.
107
Table of Contents
Summary Compensation Table
The following table sets forth total compensation of our NEOs for the 2013 and 2014 fiscal years. The NEOs for the 2014 fiscal year are Lawrence J. Johnson, Selma Oliveira and Jandir Dalberto.
| Name and Principal Position |
Fiscal Year | Salary ($) | Bonus ($) | Stock Awards ($)(1) |
Option Awards ($)(1) |
All Other Compensation ($) |
Total ($) | |||||||||||||||||||||
| Lawrence J. Johnson, Chief Executive Officer |
2014 | $ | 702,569 | $ | 301,800 | — | — | |
— |
|
$ | 1,004,369 | ||||||||||||||||
| 2013 | $ | 700,000 | $ | 190,000 | — | — | $ | 13,671 | $ | 903,671 | ||||||||||||||||||
| Selma Oliveira, Chief Operating Officer |
2014 | $ | 397,569 | $ | 310,960 | — | — | |
— |
|
$ | 708,529 | ||||||||||||||||
| 2013 | $ | 260,000 | $ | 360,000 | — | — | $ | 13,425 | $ | 633,425 | ||||||||||||||||||
| Jandir Dalberto, President, Brazil Operations (2) |
2014 | $ | 261,689 | $ | 323,163 | — | — | — | $ | 584,852 | ||||||||||||||||||
| 2013 | $ | 234,662 | $ | 323,592 | — | — | — | $ | 558,254 | |||||||||||||||||||
| (1) | We did not grant stock awards or stock options to our NEOs in either 2013 or 2014. |
| (2) | Mr. Dalberto’s annual salary and bonus were paid in Brazilian reais. The applicable exchange rates used are 0.4269 and 0.4656 per Brazilian real based on the average exchange rate for the fiscal years 2014 and 2013, respectively. |
Outstanding Equity Awards at Fiscal Year-End
The following table sets forth certain information regarding outstanding equity awards of our NEOs as of December 28, 2014. The market value of the shares in the following table is the fair market value of such shares at December 28, 2014.
| Option Awards | Stock Awards | |||||||||||||||||||||||||
| Name |
Grant |
Number of Securities Underlying Unexercised Options (#) Exercisable |
Number of Securities Underlying Unexercised Options (#) Unexercisable |
Equity Incentive Plan Awards: Number of Securities Underlying Unexercised Unearned Options (#)(1) |
Option Exercise Price ($) |
Option Expiration Date |
Number of Shares or Units of Stock that Have Not Vested (#)(2) |
Market Value of Shares or Units of Stock that Have Not Vested ($) |
||||||||||||||||||
| Lawrence J. Johnson |
7/20/2012 | 417,525 | 7.64 | 7/20/2022 | — | — | ||||||||||||||||||||
| 120,929 | 15.27 | |||||||||||||||||||||||||
| Selma Oliveira |
7/20/2012 | 188,395 | 7.64 | 7/20/2022 | 34,497 | 586,449 | ||||||||||||||||||||
| 78,922 | 15.27 | |||||||||||||||||||||||||
| Jandir Dalberto |
7/20/2012 | 38,188 | 7.64 | 7/20/2022 | 57,664 | 979,948 | ||||||||||||||||||||
| 25,458 | 15.27 | |||||||||||||||||||||||||
| (1) | The stock option grants under the 2012 Plan vest and become exercisable upon the achievement of two conditions: a time vesting condition and a liquidity condition. Each stock option grant vests over five years in equal annual installments on the anniversary of the date of grant. In addition, in order for each stock option to become exercisable, either a public offering or change of control must occur. Stock options will only become exercisable upon the occurrence of both the time vesting and liquidity conditions. |
| (2) | On July 20, 2012, Ms. Oliveira was granted 52,801 shares of restricted stock that vest over four years and three months and 13,416 shares of restricted stock that vest over five years and three months. On July 20, 2012, Mr. Dalberto was granted 72,404 shares of restricted stock that vest over four years and three months and 35,769 share of restricted stock that vest over five years and three months. For all grants made to Ms. Oliveira and Mr. Dalberto, the restricted shares vest in equal annual installments commencing on the 15-month anniversary of the date of grant, i.e., October 20, 2013. |
108
Table of Contents
Agreements with Named Executive Officers
Lawrence J. Johnson
On July 20, 2012, we entered into an Amended and Restated Employment Agreement with Lawrence J. Johnson, our Chief Executive Officer.
The initial term of Mr. Johnson’s employment agreement expires on December 31, 2015, unless earlier terminated by us or Mr. Johnson. The agreement provides for automatic one-year renewals, unless either we or Mr. Johnson give notice of our or his intention not to extend at least 90 days prior to the expiration of any term. Under his employment agreement, Mr. Johnson receives a minimum annual base salary of $700,000. Mr. Johnson is also eligible to receive an annual performance bonus each year, if budget and performance goals established by our board of directors are met, and is entitled to participate in customary benefit plans.
If we terminate Mr. Johnson’s employment without cause, or if Mr. Johnson resigns for good reason, he will be entitled to the following: (i) payment of (x) accrued compensation and unpaid base salary through the date of such termination, (y) any amounts previously deferred by Mr. Johnson and (z) the payment or reimbursement for expenses incurred prior to the date of such termination; (ii) an amount equal to two times the sum of (x) base salary plus (y) all annual bonus and annual performance bonus paid or payable for the fiscal year immediately preceding the fiscal year in which such termination of employment occurs; and (iii) continued participation, at our expense, in our health and welfare programs for a period of two years after the date of termination. Any payments in accordance with (ii) above shall be paid in cash at the following times: 50% within 30 days following the termination date, 25% on the six-month anniversary of the termination date and the remaining 25% on the 12-month anniversary of the termination date.
For purposes of Mr. Johnson’s employment agreement with us, a termination for cause will be deemed to have occurred upon the happening of the following, subject to a cure right: (i) his misappropriation or theft of our or any of our subsidiary’s funds or property; (ii) his conviction or entering of a plea of nolo contendere of any fraud, misappropriation, embezzlement or similar act, felony or crime involving dishonesty or moral turpitude; (iii) his engagement in any conduct that is materially injurious to us; (iv) his material breach of his employment agreement or material failure to perform any of his duties owed to us; or (v) his commission of any act involving willful malfeasance or gross negligence or his failure to act involving material nonfeasance.
Under Mr. Johnson’s employment agreement with us, good reason means the following: (i) our assignment to Mr. Johnson of any duties that are materially inconsistent with his position, authority, duties or responsibilities or any actions by us that result in a material diminution in his position, authority, duties or responsibilities, subject to a 30-day remedial period; (ii) our material breach of Mr. Johnson’s employment agreement, which breach remains uncured for 10 days; (iii) any reduction of Mr. Johnson’s base salary or bonus amount, unless such reduction is applied to all of our executives, and our board of directors has determined in good faith that such reduction, not to exceed 20% in the aggregate, is necessary for us to comply with our financial obligations to third parties or to preserve our company as a going concern; (iv) our requiring Mr. Johnson (x) to be based at any office or location that is more than 50 miles from his initial location of employment in Dallas, Texas, unless the majority of our executive officers and directors are relocated to such location and Mr. Johnson receives relocation benefits pursuant to his employment agreement or (y) to be based at a location other than our principal executive offices; (v) any purported termination by us of Mr. Johnson’s employment other than as expressly permitted by his employment agreement; or (vi) our failure to require any of our successors to expressly assume and agree to perform our obligations under his employment agreement.
Under his employment agreement, Mr. Johnson is subject to restrictive covenants for two years after a termination of employment, for any reason, pursuant to which he cannot compete with us or solicit business or employees.
Selma Oliveira
On July 11, 2014, we entered into an Employment Agreement with Selma Oliveira, our Chief Operating Officer.
The initial term of Ms. Oliveira’s employment agreement expires on December 31, 2015, unless earlier terminated by us or Ms. Oliveira. The agreement provides for automatic one-year renewals, unless either we or Ms. Oliveira give notice of our or her intention not to extend at least 90 days prior to the expiration of any term. Under her employment
109
Table of Contents
agreement, Ms. Oliveira receives a minimum annual base salary of $320,000. Ms. Oliveira is eligible to receive an annual performance bonus each year, if performance goals established by our board of directors are met, and is entitled to participate in customary benefit plans. Ms. Oliveira also receives a retention payment of $150,000 for each of calendar years 2014 and 2015.
If we terminate Ms. Oliveira’s employment without cause, she will be entitled to the following: (i) payment of (x) accrued compensation and unpaid base salary through the date of such termination, (y) any amounts previously deferred by Ms. Oliveira and (z) the payment or reimbursement for expenses incurred prior to the date of such termination; (ii) an amount equal to one-third of the base salary and (iii) continued participation, at our expense, in our health and welfare programs for a period of two years after the date of termination.
Definition of cause under Ms. Oliveira’s employment agreement is the same as that in Mr. Johnson’s employment agreement.
Jandir Dalberto
We have not entered into an employment agreement with Jandir Dalberto, our President, Brazil Operations.
Equity-Based Awards
We believe our ability to grant equity-based awards is a valuable and necessary compensation tool that aligns the long-term financial interests of the employees and directors with the financial interests of our stockholders. In addition, we believe that our ability to grant stock options and other equity-based awards helps us to attract, retain and motivate qualified employees, and encourages them to devote their best efforts to our business and financial success. The material terms of our equity incentive plans are described below.
2012 Omnibus Equity Incentive Plan
General
Our 2012 Omnibus Equity Incentive Plan (the “2012 Plan”) was adopted July 20, 2012 in connection with the Acquisition. The following is a summary of the material features of the 2012 Plan. This summary is qualified in its entirety by the text of the 2012 Plan, a copy of which is filed as Exhibit 10.1 to the Registration Statement of which this prospectus forms a part.
Awards
Awards granted under the 2012 Plan may consist of incentive stock options (“ISOs”), nonqualified stock options, stock appreciation rights (“SARs”), restricted stock and other share-based awards. Each award is subject to the terms and conditions set forth in the 2012 Plan and to those other terms and conditions specified by the board and memorialized in a written award agreement.
Shares Subject to the 2012 Plan
Subject to adjustment in certain circumstances as discussed below, the 2012 Plan authorizes up to 2,291,292 shares of our common stock for issuance pursuant to the terms of the 2012 Plan, excluding the restricted stock issued in connection with the Acquisition. 640,263 shares underlying grants of restricted stock were issued in connection with the Acquisition. If and to the extent awards granted under the 2012 Plan, other than restricted stock issued in connection with the Acquisition, expire, are forfeited, are cancelled or are otherwise terminated without consideration, the shares subject to such awards will again be available for grant under the 2012 Plan. To the extent any shares subject to an award are tendered to or withheld by us as partial or full payment for the purchase price or to satisfy all or part of our tax withholding obligation with respect to an award, those shares will not be available for grant under the 2012 Plan.
In the event of any corporate event or transaction such as a merger, consolidation, reorganization, recapitalization, separation, stock dividend, stock split, reverse stock split, split-up, spin-off, combination of shares, exchange of shares, dividend in kind, extraordinary cash dividend, amalgamation, or other similar change in capital structure (other than
110
Table of Contents
normal cash dividends to our stockholders), or any similar corporate event or transaction, the board, to prevent dilution or enlargement of rights under the 2012 Plan, shall substitute or adjust, in its sole discretion, the number and kind of shares or other property that may be issued under the 2012 Plan or under particular forms of awards, the number and kind of shares or other property subject to outstanding awards, the option, grant or purchase price applicable to outstanding awards and/or other value determinations (including performance conditions) applicable to the 2012 Plan or outstanding awards.
Administration
The 2012 Plan is administered and interpreted by our board. Our board has full authority (i) to interpret and administer the 2012 Plan, (ii) to select the directors, employees and consultants to whom awards will be granted and (iii) to determine the type and amount of awards, as well as the terms and conditions of such awards, to be granted to each such director, employee or consultant. Our board also has full authority to specify the time(s) at which awards will be exercisable or settled. All actions taken and all interpretations and determinations made by the board will be final and binding on the participants of the 2012 Plan, us and all other interested individuals.
Eligibility
Employees, directors and consultants, as our board in its sole discretion determines and whom our board may designate from time to time to receive awards under the 2012 Plan, are eligible to participate in the 2012 Plan; provided that stock options and SARs may only be granted to those employees, directors and consultants with respect to whom we are an “eligible issuer” within the meaning of Section 409A of the Code.
Stock Options
Our board may grant stock options to purchase a stated number of shares at a price established by the board, subject to the terms and conditions described in the 2012 Plan and to such additional terms and conditions, as established by the board, in its sole discretion, that are consistent with the provisions of the 2012 Plan. Our board may grant nonqualified stock options and stock options qualifying as ISOs under Section 422 of the Code; provided that ISOs may only be granted to our employees.
The exercise price of any stock option granted under the 2012 Plan will be not less than the fair market value of our common stock, par value $0.01 per share, on the date the stock option is granted.
Our board may determine the term for each stock option; provided, however, that the term of any stock option may not exceed ten years from the date of grant. The vesting schedule for each stock option will be determined by our board and set forth in the applicable award agreement.
Generally, payment of the option exercise price must be made in full at the time of exercise and may be made using one of the following methods, at the election of the option holder: (a) in cash or its equivalent (e.g., by cashier’s check); (b) to the extent permitted by the board, in shares (whether or not previously owned) having a fair market value equal to the aggregate option exercise price for the shares being purchased and satisfying such other requirements as may be imposed by the board; (c) partly in cash and, to the extent permitted by the board, partly in such shares (as described in (b) above); (d) to the extent permitted by the board, by reducing the number of shares otherwise deliverable upon the exercise of the stock option by the number of shares having a fair market value equal to the option exercise price; or (e) if there is a public market for the shares at such time, subject to such requirements as may be imposed by the board, through the delivery of irrevocable instructions to a broker to sell shares obtained upon the exercise of the stock option and to deliver promptly to us an amount out of the proceeds of such sale equal to the aggregate option exercise price for the shares being purchased.
SARs
Our board is authorized to grant SARs to receive, upon exercise thereof, the excess of: (a) the fair market value of a specified number of shares on the date of exercise over (b) the grant price of the right as specified by the board on the date of the grant. Such payment may be in the form of cash, shares, other property or any combination thereof, as the board shall determine in its sole discretion. No SAR may have a term of more than ten years from the date of grant.
111
Table of Contents
Restricted Stock
Our board is authorized to grant awards of restricted stock, which awards are subject to forfeiture upon the occurrence of specified events. Participants shall be awarded restricted stock in exchange for consideration not less than the minimum consideration required by applicable law. Prior to the end of the restricted period, shares received as restricted stock may not be sold or disposed of by participants, and may be forfeited in the event of a termination of employment in certain circumstances. The board will determine and set forth in an award agreement whether an award of restricted stock entitles the participant to all of the rights of a stockholder, including the right to vote and the right to receive any dividends thereon.
Other Share-Based Awards
Our board is authorized to grant other share-based awards, valued in whole or in part, by reference to, or otherwise based on, the fair market value of shares of our common stock, including restricted stock units (“RSUs”), dividend equivalent rights and other phantom awards, under the 2012 Plan. The board will determine the terms and conditions of such other share-based awards.
Effects of Termination of Service with Us
Unless otherwise provided in an award agreement, in the event (a) a participant’s service is terminated for cause, (b) the participant’s service is terminated due to the participant’s resignation after an inquiry by the board as to the existence of cause has been initiated and the board determines that cause existed as of the date of such resignation, or (c) the board determines that a participant’s acts or omissions constitute cause, all outstanding awards held by the participant shall terminate and be forfeited without consideration, effective on the date the participant’s service is terminated for cause or the date the act or omission constituting cause is determined to have occurred, as applicable.
Unless otherwise provided in an award agreement, in the event a participant’s service is terminated due to death or disability (and cause does not exist as of such date): (a) all unvested awards held by the participant shall terminate and be forfeited without consideration, effective as of the date service is terminated and (b) all vested stock options and SARs shall terminate on the earlier of (i) one year following the termination of service and (ii) the expiration of the term of such stock options and SARs.
Unless otherwise provided in an award agreement, in the event a participant’s service is terminated for any reason other than cause, disability or death, (a) all unvested awards held by the participant shall terminate and be forfeited without consideration, effective as of the date the participant’s service is terminated and (b) all vested stock options and SARs shall terminate on the earlier of (i) 90 days following such termination of service and (ii) the expiration of the term of such stock options and SARs.
Amendment and Termination of the 2012 Plan
The 2012 Plan will terminate on the tenth anniversary of the effective date. Our board may amend, alter, suspend, discontinue or terminate the 2012 Plan, or any portion thereof, or any award (or award agreement) at any time, in its sole discretion; provided that no action taken by the board shall adversely affect the rights granted to any participant under any outstanding awards (other than pursuant to certain provisions of the 2012 Plan, or as the board deems necessary to comply with applicable law) without the participant’s written consent.
Change of Control
In the event of a change of control of us, our board is authorized (but not obligated) to make adjustments in the terms and conditions of outstanding awards, including (a) continuation or assumption of outstanding awards under the 2012 Plan by us (if we are the surviving company or corporation) or by the surviving company or corporation or its parent; (b) substitution by the surviving company or corporation or its parent of awards with substantially the same terms for outstanding awards (excluding the consideration payable upon settlement of the awards); (c) accelerated exercisability, vesting and/or lapse of restrictions under outstanding awards immediately prior to the occurrence of such event; (d) upon written notice, provide that any outstanding awards must be exercised, to the extent then exercisable, during a reasonable period of time immediately prior to the scheduled consummation of the event or such
112
Table of Contents
other period as determined by the board (contingent upon the consummation of the event); (e) cancellation of all or any portion of outstanding awards for fair value (in the form of cash, shares, other property or any combination thereof) as determined in the sole discretion of our board and which value may be zero and which will be equal to the applicable spread value, if any, in the case of options; and (f) cancellation of all or any portion of outstanding unvested and/or unexercisable awards for no consideration.
Unless otherwise specified in the award agreement, a change in control under the 2012 Plan means any transaction or a series of related transactions as a result of which any person or group of persons other than THL Funds (a) acquires (whether by purchase, exchange, tender offer, merger, consolidation, recapitalization, redemption, reorganization, issuance of capital stock or otherwise) directly or indirectly more than 50% of the voting power of us or more than 50% of common stock equivalents that were issued and outstanding immediately prior to such transaction or series of transactions, or (b) acquires assets constituting all or substantially all of our assets.
To the extent necessary to comply with Section 409A of the Code with respect to the payment of deferred compensation, a change of control under the 2012 Plan will be limited to a “change in control event” as defined in Treasury Regulations Section 1.409A-3(i)(5).
2015 Omnibus Incentive Plan
General
In connection with this offering, we intend to adopt our 2015 Omnibus Incentive Plan (the “2015 Plan”). All outstanding equity awards under the 2012 Plan will remain outstanding under the 2012 Plan and will be governed by the 2012 Plan and their respective award agreements. The following is a summary of the material features of the 2015 Plan. This summary is qualified in its entirety by the full text of the 2015 Plan, a copy of which will be filed as Exhibit 10.2 to an amendment to the Registration Statement of which this prospectus forms a part.
Awards
Awards granted under the 2015 Plan may consist of ISOs, nonqualified stock options, SARs, restricted stock, RSUs, other share-based awards and cash awards. Each award will be subject to the terms and conditions set forth in the 2015 Plan and to those other terms and conditions specified by the compensation committee and memorialized in a written agreement.
Shares Subject to the 2015 Plan
Subject to adjustment in certain circumstances as discussed below, the 2015 Plan authorizes up to 1,200,000 shares of our common stock for issuance pursuant to the terms of the 2015 Plan. The maximum number of shares available for granting ISOs under the 2015 Plan will be 1,000,000.
Shares of common stock subject to an award under the 2015 Plan that remain unissued upon the forfeiture, cancellation, termination or settlement in cash of the award will again become available for grant under the 2015 Plan.
Subject to adjustment in certain circumstances as discussed below, the maximum number of shares with respect to awards under the 2015 Plan that can be granted to any single individual during any plan year will be 210,000 for employees and consultants and 210,000 for non-employee directors. The maximum number of stock options that may be granted to any employee, non-employee director or consultant during any plan year will be 210,000, and the maximum number of SARs that may be granted to any employee, non-employee director or consultant in any plan year will be 210,000.
In the event of any corporate event or transaction involving us, a subsidiary and/or an affiliate (including, but not limited to, a change in our shares or our capitalization) such as a merger, consolidation, reorganization, recapitalization, separation, extraordinary stock dividend, stock split, reverse stock split, split up, spin-off, combination of shares, exchange of shares, dividend in kind, extraordinary cash dividend, amalgamation, or other similar change in capital structure (other than normal cash or stock dividends to our stockholders), or any similar corporate event or transaction, the compensation committee, to prevent dilution or enlargement of participants’ rights under the 2015 Plan, will, subject to compliance with Section 409A of the Code, substitute or adjust, in its sole discretion, the number and kind of shares or other property that
113
Table of Contents
may be issued under the 2015 Plan or under particular forms of awards, the number and kind of shares or other property subject to outstanding awards, the option exercise price, grant price or purchase price applicable to outstanding awards, the annual award limits and/or other value determinations applicable to the 2015 Plan or outstanding awards.
Administration
The 2015 Plan will be administered by our compensation committee. The compensation committee will have full authority to: (i) interpret and administer the 2015 Plan, (ii) select the eligible individuals who will receive awards, (iii) determine the type and number of awards to be granted to each such individual and (iv) determine the terms and conditions of those awards.
Eligibility
Employees, non-employee directors and consultants, as the compensation committee in its sole discretion determines and whom our compensation committee may designate from time to time to receive awards under the 2015 Plan, will be eligible to participate in the 2015 Plan.
Stock Options
Our compensation committee may grant stock options to purchase a stated number of shares at a price established by the compensation committee, subject to the terms and conditions described in the 2015 Plan and to such additional terms and conditions, as established by the compensation committee, in its sole discretion, that are consistent with the provisions of the 2015 Plan. Our compensation committee may grant nonqualified stock options and stock options qualifying as ISOs under Section 422 of the Code; provided that ISOs may only be granted to our employees.
The exercise price of any stock option granted under our 2015 Plan will not be less than 100% of the fair market value of our common stock on the date of grant, or 110% of fair market value in the case of ISOs granted to 10% stockholders. The maximum term of a stock option granted under our 2015 Plan will be ten years, or five years in the case of ISOs granted to 10% stockholders. The vesting schedule and performance goals, if any, for each stock option will be determined by the compensation committee.
SARs
Our compensation committee may grant SARs under the 2015 Plan either alone or in addition to other awards granted under the 2015 Plan. The grant price of each SAR will be not less than 100% of the fair market value of the related shares of common stock on the date of grant. The maximum term of all SARs granted under the 2015 Plan will be determined by the compensation committee, but may not exceed ten years. Upon exercise, each SAR may be settled in shares of common stock, cash, other property or any combination thereof.
Restricted Stock and RSUs
Our compensation committee may grant restricted stock and RSUs under the 2015 Plan. The compensation committee will determine the vesting schedule and performance goals, if any, applicable to the grant of restricted stock and RSUs. If the restrictions, performance goals or other conditions determined by the compensation committee are not satisfied, the restricted stock and RSUs will be forfeited.
Unless the applicable award agreement provides otherwise, participants with grants of restricted stock and RSUs will generally have none of the rights of a stockholder during the restricted period; provided that the compensation committee will determine and set forth in the applicable award agreement whether or not a participant holding restricted stock under the 2015 Plan has the right to exercise voting rights with respect to such restricted stock during the restricted period. Participants will have no right to receive dividends, dividend equivalents or other distributions on a current basis with respect to restricted stock or RSUs during the restricted period.
Other Share-Based Awards
Our compensation committee will be authorized to issue other share-based awards, valued in whole or in part by reference to, or otherwise based on, the fair market value of shares of our common stock, including phantom awards,
114
Table of Contents
under the 2015 Plan. The compensation committee will determine the terms and conditions of such other share-based awards.
Cash Awards
Bonuses that are payable solely in cash may also be granted under the 2015 Plan, and may be granted contingent upon the achievement of performance goals.
Performance Goals
The vesting of awards that are intended to qualify as “performance-based compensation” for purposes of Section 162(m) of the Code will be based upon a pre-established formula that includes one or more of the following criteria: (a) consolidated earnings before or after taxes (including EBITDA); (b) net income before or after taxes; (c) operating income; (d) earnings per share; (e) book value per share; (f) return on stockholders’ equity; (g) expense management; (h) return on investment; (i) improvements in capital structure; (j) profitability of an identifiable business unit or product; (k) maintenance or improvement of profit margins; (l) stock price; (m) market share; (n) revenue or sales; (o) costs; (p) cash flow (including, but not limited to, operating cash flow and free cash flow); (q) working capital; (r) return on assets; (s) attainment of objectives relating to store remodels or repair and maintenance; (t) staff training; (u) corporate social responsibility policy implementation; (v) economic value added; (w) debt reduction; (x) completion of acquisitions or divestitures; (y) operating efficiency; (z) sales per square foot; (aa) revenue mix; (bb) capital expenditures versus budgeted expenditures (total, exclusive of IT/Games, or maintenance only); (cc) operating income; (dd) income from franchise units; (ee) unit-level EBITDA less general and administrative expenses; (ff) manager’s operating contribution; (gg) regional operating contribution; (hh) profitability of various revenue streams; (ii) cash flow per share (before and after dividends or before and after debt payments); (jj) total stockholder return (relative to industry/peer group and/or absolute); (kk) lease executions; (ll) franchise unit growth; (mm) employee turnover/retention (for entire population or a subset of employee population); (nn) employee satisfaction; (oo) guest satisfaction (overall and/or specific metrics); (pp) guest traffic; (qq) guest loyalty (including but not limited to participation and satisfaction); (rr) attainment of strategic and operational initiatives; (ss) marketing/brand awareness scores; (tt) third-party operational/compliance audits; (uu) balanced scorecard; (vv) culinary product pipeline goals; (ww) guest experience; (xx) inventory turnover; (yy) brand positioning goals; (zz) comparable store sales (aaa) return on invested capital; (bbb) new store openings; (ccc) development pipeline goals; (ddd) attainment of objectives relating to acquisitions or divestitures; (eee) attainment of specified business expansion goals; and (fff) expansion of specified programs or initiatives.
Any performance measure may be (i) used to measure our performance, or that of any of our subsidiaries or affiliates, as a whole, any business unit thereof or any combination thereof against any goal including past performance or (ii) compared to the performance of a group of comparable companies, or a published or special index, in each case as the compensation committee, in its sole discretion, deems appropriate. To the extent permitted by Section 162(m) of the Code, the compensation committee may adjust the performance goals (including to prorate goals and payments for any partial year) in consideration of the following: (a) the effects of changes in accounting standards or principles and in tax rules or regulations; (b) extraordinary gains and losses; (c) any costs and/or expenses attributable to an acquisition, including those related to the negotiation, completion and/or integration of an acquisition, incurred during the plan year; (d) any costs related to the purchase accounting step up in the basis of tangible or intangible assets not classified as depreciation or amortization; (e) any costs and/or expenses associated with the sale or separation (or attempted sale or separation) of a business in the plan year; (f) the reported results of an acquisition completed in the plan year; (g) any costs and/or expenses attributable to a financing transaction; (h) any costs related to the opening and organizing of new restaurants; and (i) any significant or non-recurring items.
Amendment and Termination of the 2015 Plan
The 2015 Plan will terminate on the tenth anniversary of its effective date. The 2015 Plan will terminate sooner if, prior to the end of the ten-year term, the maximum number of shares available for issuance under the 2015 Plan has been issued.
The compensation committee may amend, alter, suspend, discontinue or terminate the 2015 Plan, but no such action may materially impair the rights of any participant with respect to outstanding awards without the participant’s
115
Table of Contents
consent. No amendment, alteration, suspension, discontinuance or termination of the 2015 Plan may be made without stockholder approval (i) if such approval is necessary to comply with any tax or regulatory requirement applicable to the 2015 Plan, (ii) if such action increases the number of shares available under the 2015 Plan unless otherwise permitted, (iii) if such action results in a material increase in benefits permitted under the 2015 Plan or (iv) for any action that results in a reduction of the option exercise price or grant price of any outstanding stock option or SAR or the cancellation of any outstanding stock option or SAR in exchange for cash.
Change of Control
In the event of a change of control of us, our compensation committee is authorized (but not obligated) to make adjustments in the terms and conditions of outstanding awards, including (i) continuation or assumption of outstanding awards under the 2015 Plan by us (if we are the surviving company or corporation) or by the surviving company or corporation or its parent; (ii) substitution by the surviving company or corporation or its parent of awards with substantially the same terms for outstanding awards (excluding the consideration payable upon settlement of the awards); (iii) accelerated exercisability, vesting and/or lapse of restrictions under outstanding awards immediately prior to the occurrence of such event; (iv) upon written notice, provide that any outstanding awards must be exercised, to the extent then exercisable, during a reasonable period of time immediately prior to the scheduled consummation of the event or such other period as determined by the compensation committee (contingent upon the consummation of the event); and (v) cancellation of all or any portion of outstanding awards for fair value as determined in the sole discretion of our compensation committee.
For purposes of the 2015 Plan, a “change of control” will mean the occurrence of one or more of the following: (i) a person or entity other than Thomas H. Lee Partners, L.P., Thomas H. Lee Equity Fund VI, L.P., Thomas H. Lee Parallel Fund VI, L.P., Thomas H. Lee Parallel (DT) Fund VI, L.P. or any affiliated fund becomes the beneficial owner of, or has acquired during the 12-month period ending on the date of the most recent acquisition by such person, 30% or more of our combined voting power; (ii) an unapproved change in the majority membership of our board during any period of 12 consecutive months; (iii) a reorganization, merger, consolidation or similar event to which we are a party or the consummation of a transaction (or series of transactions within a 12-month period) constituting a sale of all or substantially all of our assets other than (A) an event in which all or substantially all of the beneficial owners of our common stock immediately prior to such event are the beneficial owners, directly or indirectly of 50% or more of the combined voting power of the outstanding securities entitled to vote in the election of directors of any successor entity, (B) no person is the beneficial owner, directly or indirectly, of 30% or more of the combined voting securities entitled to vote in the election of directors of any successor entity, and (C) at least a majority of the members of the board of directors of any successor entity were members of the incumbent board; or (iv) stockholder approval of a complete liquidation or dissolution of us.
To the extent any award provides for accelerated vesting on a change of control of amounts that would constitute “deferred compensation” (as defined in Section 409A of the Code), if the event constituting a change of control does not also constitute a change in the ownership or effective control of us, or in the ownership of a substantial portion of our assets (in either case, as defined in Section 409A of the Code), such amount will not be distributed on the change of control but instead will vest as of the change of control and will be distributed on the scheduled distribution dates.
Compensation Recovery
If a participant receives compensation pursuant to an award based on financial statements that are subsequently required to be restated in a way that would decrease the value of such compensation, the participant will, upon the written request of the compensation committee and in the compensation committee’s sole discretion, forfeit and repay to us the difference between what the participant received and what the participant should have received based on the accounting restatement, in accordance with (a) our compensation recovery, “clawback” or similar policy, if any, as may be in effect from time to time and (b) any compensation recovery, “clawback” or similar policy made applicable by law.
Fogo de Chão, Inc. Management Incentive Plan
General
In connection with this offering, we intend to adopt our Management Incentive Plan to enhance our ability to attract and retain highly qualified executives, to provide additional financial incentives to such executives and to
116
Table of Contents
promote our and our subsidiaries’ success through awards of incentive compensation that satisfy the requirements for performance-based compensation under Section 162(m) of the Code.
Administration
The Management Incentive Plan will be administered by our compensation committee.
Eligible Employees
Not later than the 90th day of the start of the applicable performance period, our compensation committee will designate those of our executive officers who will be deemed our “covered employees,” as defined in Section 162(m) of the Code.
Performance Goals
The maximum amount of compensation payable to any such covered employee for the applicable performance period will be 6% of Adjusted EBITDA, which will be calculated as follows: (a) income from continuing operations; plus (b) income tax expense; plus (c) interest expense; minus (d) interest income; plus (e) depreciation expense; and plus (f) amortization expense. Adjusted EBITDA will be calculated without regard to: (i) the effects of changes in accounting standards or principles and in tax rules or regulations; (ii) any ongoing and/or one-time costs and/or expenses attributable to an acquisition, including those related to the negotiation, completion and/or integration of an acquisition, incurred during the applicable fiscal year; (iii) any costs related to the purchase accounting step up in the basis of tangible or intangible assets not classified as depreciation or amortization; (iv) any ongoing and/or one-time costs and/or expenses associated with the sale or separation (or attempted sale or separation) of a business in the applicable fiscal year; (v) the reported results of an acquisition completed in the applicable fiscal year; (vi) any ongoing and/or one-time costs and/or expenses attributable to a financing transaction; (vii) any pre-opening costs; and (vii) any significant or non-recurring items which are disclosed in management’s discussion and analysis of financial condition and results of operations in our Annual Report on Form 10-K for such period. Notwithstanding the foregoing, in the event that a business is sold or separated from us during the applicable fiscal year, such business’ target and adjusted actual results will be eliminated from all calculations.
Negative Discretion
At any time before an incentive amount for a performance period is paid, our compensation committee may, in its sole discretion, determine to pay an amount that is less than the maximum payable amount, or to pay no amount. The amount by which a covered employee’s maximum payable amount is reduced cannot be paid to any other covered employee.
Director Compensation
The following table sets forth the amount of compensation we paid to each of our non-employee directors during Fiscal 2014. Our employee director, Mr. Johnson, does not receive any compensation for his service as director. Other than compensation paid to Mr. Moses and Mr. Pendergast, we did not pay any of our other directors for service on our board of directors.
| Name |
Fees Earned or Paid in Cash ($) |
Stock Awards ($)(1) |
Option Awards ($)(1) |
All Other Compensation ($) |
Total ($) |
|||||||||||||||
| Neil Moses |
$ | 50,000 | $ | 24,983 | — | — | $ | 74,983 | ||||||||||||
| Douglas R. Pendergast(2) |
$ | 2,917 | $ | 24,983 | $ | 7,777 | — | $ | 35,677 | |||||||||||
| (1) | This column reflects the aggregate grant date fair value computed in accordance with FASB ASC Topic 718. These amounts reflect our accounting expense for these awards, and do not correspond to the actual value that will be realized by the director. The assumptions used in the calculation of the amounts are described in note to our consolidated financial statements included in this prospectus. |
| (2) | Mr. Pendergast has served as a director since December 2014. |
117
Table of Contents
We intend to provide compensation to each member of our board of directors who is not an employee and who is not affiliated with the THL Funds for their services following the completion of this offering pursuant to the following policy:
| • | Each director will be paid an annual cash retainer (pro-rated for partial-year service) of $35,000. |
| • | The chair of our audit, compensation, nominating and corporate governance and development committees will be paid an additional $15,000 annual retainer. |
| • | Directors will be reimbursed for reasonable expenses incurred in connection with attending meetings of the board of directors or its committees. |
| • | Equity compensation for non-employee directors will consist of an annual grant of restricted stock with an aggregate value of $25,000 (with the number of shares actually granted to be based on the closing price of our common stock on NASDAQ on the grant date, rounded down to the nearest whole share). Such restricted stock will be granted at the time of our annual meeting of stockholders and will vest ratably over two years, subject, in each case, to the director’s continued service as a member of our board of directors through such date. |
118
Table of Contents
CERTAIN RELATIONSHIPS AND RELATED PARTY TRANSACTIONS
Related Person Transactions
In accordance with the charter of our Audit Committee, which will become effective upon the closing of this offering, and our policy with respect to related person transactions, which our board of directors (acting through our Audit Committee) will adopt prior to the closing of this offering, our Audit Committee will be responsible for reviewing and approving related person transactions.
The policy with respect to related person transactions will apply to transactions, arrangements and relationships (or any series of similar transactions, arrangements or relationships) that meet the following criteria:
| • | the amount involved exceeds $120,000; |
| • | we or any of our subsidiaries is or will be a participant; and |
| • | our executive officers, directors, director nominees or 5% stockholders, or any immediate family member of any of our executive officers, directors, director nominees or 5% stockholders, have or will have a direct or indirect material interest in the transaction, arrangement or relationship (including any indebtedness or guarantee of indebtedness). |
In the course of its review and approval of related person transactions, our Audit Committee will consider the relevant facts and circumstances to decide whether to approve such transactions. In particular, our policy with respect to related person transactions will require our Audit Committee to consider, among other factors it deems appropriate:
| • | the benefits to us; |
| • | the impact on a director’s independence in the event the related person is a director, an immediate family member of a director or an entity in which a director has a position or relationship; |
| • | the actual or apparent conflict of interest of the related person and the materiality and character of the related person’s direct or indirect interest; |
| • | the availability and opportunity costs of other sources for comparable products or services; |
| • | the terms and commercial reasonableness of the transaction; and |
| • | the terms available to unrelated third parties or to employees generally. |
The Audit Committee may only approve those transactions that are in, or are not inconsistent with, our best interests and those of our stockholders, as the Audit Committee determines in good faith.
Agreements with Management
We have previously entered into employment agreements with certain of our executive officers. See “Executive Compensation—Agreements with Named Executive Officers.”
Advisory Services Agreement
At the time of the Acquisition, Brasa (Parent) Inc., Brasa (Purchaser) Inc., Brasa (Holdings) Inc., Fogo de Chão (Holdings) Inc. and THL Managers VI, LLC, an affiliate of THL, entered into an Advisory Services Agreement, under which THL Managers VI, LLC provides advice to us on, among other things, financing, operations, acquisitions and dispositions. Under the agreement, THL Managers VI, LLC is paid, in aggregate, an annual fee in the amount of the greater of $750,000 or 1.5% of Consolidated EBITDA, as defined in our Senior Credit Facilities. THL Managers VI, LLC received fees in the amount of $0.8 million in each fiscal year of 2014 and 2013 and $0.3 million during the period from July 21, 2012 to December 30, 2012. Additionally, at the time of the Acquisition, we paid THL Managers VI, LLC a non-recurring $5.0 million fee for certain services that were performed in conjunction with the consummation of the Acquisition. Members of our board are affiliated with THL. Upon consummation of this offering, the agreement will terminate in accordance with its terms and we will pay a termination fee of approximately $7.8 million to THL Managers VI, LLC.
119
Table of Contents
Stockholders Agreement
In connection with the Acquisition, we, the THL Funds and certain members of management entered into a stockholders agreement (the “Stockholders Agreement”). The Stockholders Agreement contains provisions related to the election of directors, governance, stock transfer restrictions, customary drag-along rights and customary tag-along rights and preemptive rights. Certain terms of the Stockholders Agreement terminate, subject to certain limited exceptions, upon the earlier of a consummation of (i) an initial public offering of us or any of our subsidiaries and (ii) a Take-Along Event (as defined in the Stockholders Agreement).
Pursuant to the terms of the Stockholders Agreement, the THL Funds and the other current stockholders who are parties to the Stockholders Agreement will be entitled to certain rights with respect to the registration of their shares of our common stock under the Securities Act after the completion of this offering. The Stockholders Agreement provides that if we determine to register any of our securities under the Securities Act after the initial public offering, either for our own account or for the account of a security holder or holders, the holders of registration rights are entitled to include their shares of our common stock in such registration. In addition, the THL Stockholders (as defined in the Stockholders Agreement) may demand that we use our best efforts to effect the registration of the holders’ shares of our common stock any time after our initial public offering. All of these registration rights are subject to certain conditions and limitations.
We intend, in connection with the completion of this offering, to enter into an amended and restated stockholders and registration rights agreement with the THL Funds and certain other current stockholders, which will provide, among other things and subject to certain exceptions and conditions, that we are required to register shares of common stock beneficially owned by the THL Funds and certain of our other stockholders under the Securities Act, and they will have the right to participate in future registrations of securities by us.
Sao Paulo Valet
Roma 5 Park Servicos de Estacionamento e Manobrista Ltda. (the “Valet Company”) provides valet services at four of our Sao Paulo locations pursuant to contracts for each location. We do not pay or receive any monies pursuant to the contracts. The Valet Company collects parking fees directly from parking patrons and assumes all liabilities with respect to the valet services. Mr. Dalberto’s spouse owns 65% of the valet company and one of our Brazilian employees owns 35%. During Fiscal 2014, the Valet Company collected approximately US$300,000 in revenue from parking patrons from its operations at the four Sao Paulo locations.
Indemnification Agreements and Directors and Officers Liability Insurance
Our amended and restated bylaws limit the personal liability of our directors to us or our stockholders for monetary damages for breaches of fiduciary duty as a director to the fullest extent permitted by the General Corporation Law of the State of Delaware. A general description of these provisions is contained under “Part II-Item 14. Indemnification of Directors and Officers” included in our Registration Statement, of which this prospectus forms a part. In addition, we will maintain directors’ and officers’ liability insurance to provide our directors and officers with insurance coverage for losses arising from claims based on breaches of duty, negligence, errors and other wrongful acts. We also intend to enter into agreements to indemnify our directors and executive officers. A general description of the provisions of these agreements is contained under “Part II-Item 14. Indemnification of Directors and Officers” included in our Registration Statement, of which this prospectus forms a part.
120
Table of Contents
The following table sets forth information known to us with respect to beneficial ownership of our common stock as of June 1, 2015 by:
| • | each person, or group of affiliated persons, known by us to own beneficially more than 5% of our outstanding shares of common stock; |
| • | each of our directors; |
| • | each of our named executive officers; and |
| • | all of our current executive officers and directors as a group. |
Beneficial ownership is determined in accordance with the rules of the SEC. Shares of our common stock subject to options or warrants currently exercisable or exercisable within 60 days of June 1, 2015 are deemed outstanding for calculating the percentage of outstanding shares of the person holding these options or warrants, but are not deemed outstanding for calculating the percentage of any other person. Percentage of beneficial ownership is based upon shares of our common stock (including shares of our restricted stock) that will exist as of June 1, 2015, and 28,767,868 shares of our common stock outstanding (including shares of our restricted stock) after this offering. To our knowledge, except as set forth in the footnotes to this table and subject to applicable community property laws, each person named in the table has sole voting and investment power with respect to the shares set forth opposite such person’s name. Except as otherwise indicated, the address of each of the persons in this table is as follows: c/o Fogo de Chão, Inc., 14881 Quorum Drive, Suite 750, Dallas, Texas 75254.
| Shares Beneficially Owned Before Offering |
Shares Beneficially Owned After Offering† |
|||||||||||||||
| Name and Address of Beneficial Owner |
Number | Percentage | Number | Percentage | ||||||||||||
| Named Executive Officers and Directors: |
||||||||||||||||
| Lawrence J. Johnson |
401,635 | 1.65 | % | 401,635 | 1.40 | % | ||||||||||
| Selma Oliveira(1) |
106,926 | * | 106,926 | * | ||||||||||||
| Jandir Dalberto(2) |
165,987 | * | 165,987 | * | ||||||||||||
| Todd M. Abbrecht |
22,324,323 | 91.66 | % | 22,324,323 | 77.60 | % | ||||||||||
| Gerald W. Deitchle(3) |
13,924 | * | 13,924 | * | ||||||||||||
| Douglas A. Haber |
22,324,323 | 91.66 | % | 22,324,323 | 77.60 | % | ||||||||||
| Neil Moses(4) |
17,820 | * | 17,820 | * | ||||||||||||
| Douglas R. Pendergast(5) |
13,924 | * | 13,924 | * | ||||||||||||
| Jeff T. Swenson |
22,324,323 | 91.66 | % | 22,324,323 | 77.60 | % | ||||||||||
| All Directors and Executive Officers as a Group (9 persons) |
23,375,678 | 95.97 | % | 23,375,678 | 81.26 | % | ||||||||||
| 5% Stockholders: |
||||||||||||||||
| Funds affiliated with Thomas H. Lee Partners, L.P.(6) |
22,324,323 | 91.66 | % | 22,324,323 | 77.60 | % | ||||||||||
| * | Represents beneficial ownership of less than one percent. |
| † | Assumes the exercise of the underwriters’ option to purchase additional shares in full. |
| (1) | Includes 34,496 shares of unvested restricted stock as to which such holder has directed distributions to us, which are made subject to forfeiture, and granted us an irrevocable proxy, until such shares of restricted stock vest in accordance with their terms. |
| (2) | Includes 57,665 shares of unvested restricted stock as to which such holder has directed distributions to us, which are made subject to forfeiture, and granted us an irrevocable proxy, until such shares of restricted stock vest in accordance with their terms. |
| (3) | Includes 2,316 shares of unvested restricted stock as to which such holder has directed distributions to us, which are made subject to forfeiture, and granted us an irrevocable proxy, until such shares of restricted stock vest in accordance with their terms. |
| (4) | Includes 3,870 shares of unvested restricted stock as to which such holder has directed distributions to us, which are made subject to forfeiture, and granted us an irrevocable proxy, until such shares of restricted stock vest in accordance with their terms. |
| (5) | Includes 2,316 shares of unvested restricted stock as to which such holder has directed distributions to us, which are made subject to forfeiture, and granted us an irrevocable proxy, until such shares of restricted stock vest in accordance with their terms. |
| (6) | Consists of: (i) 12,055,476 shares held by Thomas H. Lee Equity Fund VI, L.P.; (ii) 8,163,328 shares held by Thomas H. Lee Parallel Fund VI, L.P.; (iii) 1,425,975 shares held by Thomas H. Lee Parallel (DT) Fund VI, L.P. (the foregoing, collectively, the “THL VI Funds”); (iv) 415,870 shares held by THL Coinvestment Partners, L.P.; (v) 72,990 shares held by THL Operating |
121
Table of Contents
| Partners, L.P.; (vi) 62,730 shares held by Great-West Investors, LP; (vii) 62,501 shares held by Putnam Investments Employees’ Securities Company III, LLC; (viii) 58,911 shares held by THL Equity Fund VI Investors (Fogo), LLC and (ix) 6,542 shares held by THL Equity Fund VI Investors (Fogo) II, LLC (the foregoing, excluding the THL VI Funds collectively, the “THL Co-Investors”). The THL Co-Investors are co-investors of the THL VI Funds, are contractually obligated to coinvest and dispose of their shares alongside the THL VI Funds on a pro rata basis and look to the THL VI Funds with respect to voting and investment determinations with respect to their shares. THL Holdco, LLC is the managing member of Thomas H. Lee Advisors, LLC, which is the general partner of Thomas H. Lee Partners, L.P., which is the sole member of THL Equity Advisors VI, LLC, which is the general partner of the THL VI Funds. Voting and investment determinations with respect to the shares held or controlled by the THL VI Funds are made by the management committee of THL Holdco, LLC. Anthony J. DiNovi and Scott M. Sperling are the individuals who are members of the management committee of THL Holdco, LLC, and as such are the individuals who may be deemed to share beneficial ownership of the shares held or controlled by the THL VI Funds. Each of Messrs. DiNovi and Sperling disclaims beneficial ownership of such securities. The address of each of the THL VI Funds, the THL Co-Investors (other than those listed in the following two sentences) and Messrs. DiNovi and Sperling is c/o Thomas H. Lee Partners, L.P., 100 Federal Street, Boston, Massachusetts 02110. The address of Great-West Investors, LP is 8515 East Orchard Road, Greenwood Village, Colorado 80111. The address of Putnam Investments Employees’ Securities Company III LLC is c/o Putnam Investment, Inc., 1 Post Office Square, Boston, Massachusetts 02109. Thomas H. Lee Partners, L.P. and their affiliates did not purchase shares of the Company’s common stock outside the ordinary course of business as an investor or with, at the time of its acquisition of shares of the Company’s common stock, any agreements, understandings, or arrangements with any other persons, directly or indirectly, to dispose of the shares. |
122
Table of Contents
The following descriptions are summaries of the material terms of our amended and restated certificate of incorporation and our amended and restated bylaws, as each is anticipated to be in effect upon the closing of this offering. Reference is made to the more detailed provisions of, and the descriptions are qualified in their entirety by reference to, these documents, copies of which are filed with the SEC as exhibits to the registration statement of which this prospectus is a part, and applicable law.
General
Upon the closing of this offering, our authorized capital stock will consist of 200,000,000 shares of our common stock, par value $0.01 per share, and 15,000,000 shares of preferred stock, par value $0.01 per share. As of March 29, 2015, our common stock was held by approximately 30 individuals. The following description summarizes the terms of our capital stock. Because it is only a summary, it does not contain all the information that may be important to you. For a complete description you should refer to our form of amended and restated certificate of incorporation and our form of amended and restated bylaws, as in effect immediately following the closing of this offering, copies of which have been filed as exhibits to the registration statement of which this prospectus is a part.
Common Stock
Holders of our common stock are entitled to one vote for each share held of record on all matters on which stockholders are generally entitled to vote.
Holders of our common stock are entitled to receive dividends when and if declared by our board of directors out of funds legally available therefor, subject to any statutory or contractual restrictions on the payment of dividends and to any restrictions on the payment of dividends imposed by the terms of any outstanding preferred stock.
Holders of our common stock do not have preemptive, subscription, redemption or conversion rights.
The rights, preferences and privileges of holders of common stock are subject to the rights of the holders of shares of any series of preferred stock that we may designate and issue in the future.
Preferred Stock
Under our amended and restated certificate of incorporation, our board of directors has the authority, without action by our stockholders, to designate and issue shares of preferred stock in one or more series and to designate the rights, preferences and privileges of each series, which may be greater than the rights of our common stock. It is not possible to state the actual effect of the issuance of any shares of preferred stock upon the rights of holders of the common stock until our board of directors determines the specific rights of the holders of such preferred stock. However, the effects might include, among other things:
| • | restricting dividends on the common stock; |
| • | diluting the voting power of the common stock; |
| • | impairing the liquidation rights of the common stock; or |
| • | delaying or preventing a change in our control without further action by the stockholders. |
The issuance of our preferred stock could have the effect of delaying, deferring, or preventing a change in our control. Upon the completion of the offering, no shares of preferred stock will be outstanding, and we have no present plans to issue any shares of preferred stock.
Options to Purchase Common Stock
Upon completion of this offering, there will be outstanding options to purchase 2,197,382 shares of our common stock at a weighted average exercise price of $10.15 per share, excluding 138,000 shares of our common stock issuable upon the exercise of stock options we expect to grant to employees upon the closing of this offering at an exercise price equal to the initial public offering price.
123
Table of Contents
Anti-Takeover Effects of Provisions of Our Charter, Our Bylaws and Delaware Law
Certain provisions of our amended and restated certificate of incorporation and amended and restated bylaws that will be in effect upon completion of this offering, as summarized below, and applicable provisions of the Delaware General Corporation Law may make it more difficult for or prevent a third party from acquiring control of us or changing our board of directors and management. These provisions may have the effect of deterring hostile takeovers or delaying changes in our control or in our management. These provisions are intended to enhance the likelihood of continued stability in the composition of our board of directors and in the policies furnished by them and to discourage certain types of transactions that may involve an actual or threatened change in our control. These provisions are designed to reduce our vulnerability to an unsolicited acquisition proposal. The provisions also are intended to discourage certain tactics that may be used in proxy fights. However, these provisions could have the effect of discouraging others from making tender offers for our shares and, as a consequence, they also may inhibit fluctuations in the market price of our shares that could result from actual or rumored takeover attempts. Such provisions may also have the effect of preventing changes in our management.
Classified Board of Directors
In accordance with the terms of our amended and restated certificate of incorporation and amended and restated bylaws, our board of directors is divided into three classes, class I, class II and class III, with members of each class serving staggered three-year terms. Our amended and restated certificate of incorporation provides that the authorized number of directors may be changed only by resolution of the board of directors. Any additional directorships resulting from an increase in the number of directors will be distributed among the three classes so that, as nearly as possible, each class will consist of one-third of the directors. Our amended and restated certificate of incorporation and our bylaws also provide that, prior to the date on which THL owns less than 50% of our outstanding common stock, a director may be removed with or without cause by the affirmative vote of the holders of a majority of the voting power of our outstanding shares of capital stock entitled to vote generally in the election of directors, voting together as a single class. At and following the date on which THL owns less than 50% of our outstanding common stock a director may be removed only for cause by the affirmative vote of the holders of at least 75% of the voting power of our outstanding shares of capital stock entitled to vote generally in the election of directors, voting together as a single class. Any vacancy on our board of directors, including a vacancy resulting from an enlargement of our board of directors, may be filled only by vote of a majority of our directors then in office. Our classified board of directors could have the effect of delaying or discouraging an acquisition of us or a change in our management.
Special Meetings of Stockholders
Our bylaws provide that a special meeting of stockholders may be called only by the chairman of our board of directors or by a resolution adopted by a majority of our board of directors. Stockholders are not permitted to call a special meeting of stockholders, to require that the chairman call such a special meeting, or to require that our board request the calling of a special meeting of stockholders.
No Stockholder Action by Written Consent
Our amended and restated certificate of incorporation provides that, for so long as we remain a “controlled company” under the NASDAQ rules, stockholder action may be taken only at an annual meeting or special meeting of stockholders and may not be taken by written consent instead of a meeting, unless the action to be taken by written consent of stockholders and the taking of this action by written consent has been expressly approved in advance by the board of directors. Failure to satisfy any of the requirements for a stockholder meeting could delay, prevent or invalidate stockholder action.
Stockholder Advance Notice Procedure
Our amended and restated bylaws establish an advance notice procedure for stockholders to make nominations of candidates for election as directors or to bring other business before an annual meeting of our stockholders. The amended and restated bylaws provide that any stockholder wishing to nominate persons for election as directors at, or bring other business before, an annual meeting must deliver to our secretary advanced written notice of the stockholder’s intention to do so.
124
Table of Contents
Section 203 of the Delaware General Corporation Law
We have opted out of Section 203 of the DGCL. However, our amended and restated certificate of incorporation contains similar provisions providing that we may not engage in certain “business combinations” with any “interested stockholder” for a three-year period following the time that the stockholder became an interested stockholder, unless:
| • | prior to such time, our board of directors approved either the business combination or the transaction which resulted in the stockholder becoming an interested stockholder; |
| • | upon consummation of the transaction that resulted in the stockholder becoming an interested stockholder, the interested stockholder owned at least 85% of our voting stock outstanding at the time the transaction commenced, excluding certain shares; or |
| • | at or subsequent to that time, the business combination is approved by our board of directors and by the affirmative vote of holders of at least 66 2⁄3% of the outstanding voting stock that is not owned by the interested stockholder. |
Generally, a “business combination” includes a merger, asset or stock sale or other transaction resulting in a financial benefit to the interested stockholder. Subject to certain exceptions, an “interested stockholder” is a person who, together with that person’s affiliates and associates, owns, or within the previous three years owned, 15% or more of our voting stock.
Under certain circumstances, this provision will make it more difficult for a person who would be an “interested stockholder” to effect various business combinations with a corporation for a three-year period. This provision may encourage companies interested in acquiring our company to negotiate in advance with our board of directors because the stockholder approval requirement would be avoided if our board of directors approves either the business combination or the transaction which results in the stockholder becoming an interested stockholder. These provisions also may have the effect of preventing changes in our board of directors and may make it more difficult to accomplish transactions which stockholders may otherwise deem to be in their best interests.
Our amended and restated certificate of incorporation provides that the Sponsors, their respective affiliates and associates, and any of their respective direct or indirect transferees of at least 5% of our outstanding common stock and any group as to which such persons are party to, do not constitute “interested stockholders” for purposes of this provision.
Listing
We have applied to list our common stock on the NASDAQ Global Select Market under the symbol “FOGO.”
Transfer Agent and Registrar
Upon completion of this offering, the United States transfer agent and registrar for our common stock will be American Stock Transfer & Trust Company, LLC.
Independent Registered Public Accounting Firm
Our independent registered public accounting firm is PricewaterhouseCoopers LLP whose address is 2001 Ross Avenue, Suite 1800, Dallas, Texas 75201.
125
Table of Contents
SHARES ELIGIBLE FOR FUTURE SALE
Prior to this offering, there has been no public market for our common stock. Future sales of substantial amounts of our common stock in the public market could reduce prevailing market prices. Some shares will not be available for sale shortly after this offering because of contractual and legal restrictions on sale as described below. Sales of substantial amounts of our common stock in the United States or Canadian public market after any of these restrictions on sale lapse could adversely affect the prevailing market price of our common stock and impair our ability to raise equity capital in the future.
Upon the completion of this offering, 27,253,018 shares of our common stock will be outstanding (or 27,914,782 shares if the underwriters exercise their option to purchase additional shares in full). All shares of common stock sold in this offering, other than up to 220,588 shares to be sold in our directed share program that are subject to lock-up agreements, will be freely tradable in the United States, without restriction or registration under the Securities Act unless they are purchased by our “affiliates” as that term is defined in Rule 144 under the Securities Act, or by persons who are subject to the lock-up agreements described below to the extent sales of such shares are prohibited by the terms of such lock-up agreements. All remaining shares were issued and sold by us in private transactions and are eligible for public sale in the United States if registered under the Securities Act or sold in accordance with Rule 144 or Rule 701 under the Securities Act. These remaining shares are “restricted securities” within the meaning of Rule 144 under the Securities Act. Restricted securities may be sold in the public market in the United States only if registered or if they qualify for an exemption from registration under Rule 144 or Rule 701 under the Securities Act, as summarized below.
As a result of contractual lock-up agreements with us or the underwriters as described below, and subject to the provisions of Rules 144 and 701 under the Securities Act described below, these restricted securities will be available for sale in the public market set forth below.
Lock-Up Agreements
We, our directors, officers and holders of approximately 99% of our outstanding common stock, have entered into contractual lock-up agreements with representatives of the underwriters, pursuant to which, subject to certain exceptions, for a period of 180 days following the date of this prospectus, we and our directors, officers and such stockholders will not offer, sell, assign, transfer, pledge or contract to sell or otherwise dispose of or hedge any shares of our common stock or any securities convertible into or exchangeable for shares of our common stock or publicly announce an intention to do any of the foregoing without the prior written consent of Jefferies LLC and J.P. Morgan Securities LLC. Jefferies LLC and J.P. Morgan Securities LLC, in their sole discretion, at any time and without prior notice, may release all or any portion of the shares from the restrictions contained in any such lock-up agreements.
Jefferies LLC and J.P. Morgan Securities LLC have no present intent or arrangement to release any of the securities subject to these lock-up agreements. The release of any lock-up is considered on a case-by-case basis. Factors in deciding whether to release shares may include the length of time before the lock-up expires, the number of shares involved, the reason for the requested release, market conditions, the trading price of our common stock, historical trading volumes of our common stock and whether the person seeking the release is our officer, director or affiliate.
Rule 144
In general, under Rule 144 as in effect on the date of this prospectus, beginning 90 days after the effective date of this offering, a person who has beneficially owned restricted securities for at least six months, including the holding period of any prior owner other than one of our affiliates, and is not deemed to have been an affiliate of ours at any time during the three months preceding a sale, is entitled to sell a number of restricted shares in the public market in the United States within any three-month period that does not exceed the greater of:
| • | one percent of the number of shares of our common stock then outstanding, which will equal 272,530 shares immediately after this offering or 279,147 shares if the underwriters’ option to purchase additional shares is exercised in full; and |
| • | the average weekly trading volume of our common stock on the NASDAQ during the four calendar weeks preceding the filing with the SEC of a notice on Form 144 with respect to the sale. |
126
Table of Contents
Sales of restricted shares under Rule 144 in the United States are also subject to requirements regarding the manner of sale, notice, and the availability of current public information about us. Rule 144 also provides that, following a six-month holding period, affiliates may sell shares of our common stock that are not restricted shares in the United States, provided that they comply with the same restrictions applicable to restricted shares.
Rule 701
In general, and subject to expiration of the applicable lock-up restrictions, any of our employees, non-employee directors or officers who purchased shares from us in connection with a qualified compensatory stock or option plan or other written agreement before the effective date of this offering, or who purchased shares from us after that date upon the exercise of options granted before that date (subject to the lock-up agreements referred to below, as applicable), which qualify under Rule 701 promulgated under the Securities Act, are eligible to resell such shares in reliance upon Rule 144 beginning 90 days after the date of this prospectus. If such person is not an affiliate, the sale may be made under Rule 144 without compliance with the holding periods of Rule 144 and subject only to the manner-of-sale restrictions of Rule 144. If such a person is an affiliate, the sale may be made under Rule 144 without compliance with its one-year minimum holding period, but subject to the other Rule 144 restrictions.
As of the date of this prospectus, options to purchase a total of 2,197,382 shares of our common stock were outstanding, excluding 138,000 shares of our common stock issuable upon the exercise of stock options we expect to grant to employees upon the closing of this offering at an exercise price equal to the initial public offering price.
Form S-8 Registration Statements
We intend to file one or more registration statements on Form S-8 under the Securities Act upon consummation of this offering to register for the purposes of United States federal securities laws the shares of our common stock that are issuable pursuant to our 2012 Plan and our 2015 Plan. These registration statements are expected to be filed and become effective as soon as practicable after the effective date of this offering. Shares covered by these registration statements will then be eligible for sale in the public markets in the United States, subject to the lock-up agreements and, if applicable, to Rule 144 limitations applicable to affiliates.
Registration Rights
After this offering, and subject to the lock-up agreements, the THL Funds, which will hold approximately 82% (or 80% if the underwriters’ option to purchase additional shares is exercised in full) of our common stock after completion of this offering, will be entitled to certain rights with respect to the registration of their shares of our common stock under the Securities Act after the completion of this offering. For more information, see “Certain Relationships and Related Party Transactions—Stockholders Agreement.” After such registration, these shares of our common stock will become freely tradable without restriction under the Securities Act. These sales could have a material adverse effect on the prevailing market price of our common stock.
127
Table of Contents
US FEDERAL TAX CONSIDERATIONS FOR NON-US HOLDERS
The following is a general discussion of the material US federal income and estate tax consequences of the ownership and disposition of common stock by a “non-US holder.” A “non-US holder” is a beneficial owner of a share of our common stock that is, for US federal income tax purposes:
| • | a non-resident alien individual, other than a former citizen or resident of the United States subject to US tax as an expatriate, |
| • | a foreign corporation, or |
| • | a foreign estate or trust. |
If a partnership or other pass-through entity (including an entity or arrangement treated as a partnership or other type of pass-through entity for US federal income tax purposes) owns our common stock, the tax treatment of a partner or beneficial owner of the entity may depend upon the status of the owner, the activities of the entity and certain determinations made at the partner or beneficial owner level. Partners and beneficial owners in partnerships or other pass-through entities that own our common stock should consult their own tax advisors as to the particular US federal income and estate tax consequences applicable to them.
This discussion is based on the Internal Revenue Code of 1986, as amended, or the Code, and administrative pronouncements, judicial decisions and final, temporary and proposed Treasury Regulations, changes to any of which subsequent to the date of this prospectus may affect the tax consequences described herein (possibly with retroactive effect). This discussion does not address all aspects of US federal income and estate taxation that may be relevant to non-US holders in light of their particular circumstances and does not address any tax consequences arising under the laws of any state, local or foreign jurisdiction. Prospective holders are urged to consult their tax advisors with respect to the particular tax consequences to them of owning and disposing of our common stock, including the consequences under the laws of any state, local or foreign jurisdiction.
Dividends
As discussed under “Dividend Policy” above, we do not currently expect to pay dividends. In the event that we do pay dividends out of our current and accumulated earnings and profits (as determined under US federal income tax principles), such dividends paid to a non-US holder generally will be subject to US federal withholding tax at a 30% rate, or a reduced rate specified by an applicable income tax treaty. In order to obtain a reduced rate of withholding under an applicable income tax treaty, a non-US holder generally will be required to provide an Internal Revenue Service (“IRS”) Form W-8BEN or IRS Form W-8BEN-E, as applicable, certifying its entitlement to benefits under the treaty.
No amounts in respect of US federal withholding tax will be withheld from dividends paid to a non-US holder if the non-US holder provides an IRS Form W-8ECI certifying that the dividends are effectively connected with the non-US holder’s conduct of a trade or business within the United States. Instead, the effectively connected dividends will be subject to regular US income tax as if the non-US holder were a US resident, subject to an applicable income tax treaty providing otherwise. A non-US holder that is a corporation receiving effectively connected dividends may also be subject to an additional “branch profits tax” imposed at a rate of 30% (or a lower treaty rate) on its effectively connected earnings and profits (subject to certain adjustments).
Gain on Disposition of Common Stock
A non-US holder generally will not be subject to US federal income tax on gain realized on a sale or other disposition of common stock unless:
| • | the gain is effectively connected with a trade or business of the non-US holder in the United States, subject to an applicable income tax treaty providing otherwise, in which case the gain will be subject to US federal income tax generally in the same manner as effectively connected dividend income as described above; |
128
Table of Contents
| • | the non-US holder is an individual present in the United States for 183 days or more in the taxable year of disposition and certain other conditions are met, in which case the gain (net of certain US-source losses) generally will be subject to US federal income tax at a rate of 30% (or a lower treaty rate); or |
| • | we are or have been a United States real property holding corporation (as described below), at any time within the five-year period preceding the disposition or the non-US holder’s holding period, whichever period is shorter, and either (i) our common stock is not regularly traded on an established securities market prior to the beginning of the calendar year in which the sale or disposition occurs or (ii) the non-US holder has owned or is deemed to have owned, at any time within the five-year period preceding the disposition or the non-US holder’s holding period, whichever period is shorter, more than 5% of our common stock. |
We will be a United States real property holding corporation at any time that the fair market value of our “United States real property interests,” as defined in the Code and applicable Treasury Regulations, equals or exceeds 50% of the aggregate fair market value of our worldwide real property interests and our other assets used or held for use in a trade or business. We believe that we are not, and do not anticipate becoming in the foreseeable future, a United States real property holding corporation.
Information Reporting Requirements and Backup Withholding
Information returns will be filed with the IRS in connection with payments of dividends and the proceeds from a sale or other disposition of common stock. A non-US holder may have to comply with certification procedures to establish that it is not a United States person in order to avoid information reporting and backup withholding requirements. The certification procedures required to claim a reduced rate of withholding under a treaty will satisfy the certification requirements necessary to avoid backup withholding as well. The amount of any backup withholding from a payment to a non-US holder will be allowed as a credit against the non-US holder’s US federal income tax liability and may entitle the non-US holder to a refund, provided that the required information is furnished to the IRS in a timely manner.
FATCA Withholding Taxes
Payments to certain foreign entities of dividends on, and the gross proceeds of, dispositions of common stock of a US issuer will be subject to a withholding tax (separate and apart from, but without duplication of, the withholding tax described above) at a rate of 30%, unless various US information reporting and due diligence requirements (generally relating to ownership by US persons of interests in or accounts with those entities) have been satisfied or an exemption from these rules applies. The IRS has announced that Treasury Regulations implementing this withholding tax will defer the withholding obligation until January 1, 2017 for gross proceeds from dispositions of common stock of a US issuer. An intergovernmental agreement between the United States and an applicable foreign country may modify these requirements. Non-US holders should consult their tax advisors regarding the possible implications of this withholding tax on their investment in our common stock.
Federal Estate Tax
Individual non-US holders (as specifically defined for US federal estate tax purposes) and entities the property of which is potentially includible in such an individual’s gross estate for US federal estate tax purposes (for example, a trust funded by such an individual and with respect to which the individual has retained certain interests or powers) should note that the common stock will be treated as US situs property subject to US federal estate tax, unless an applicable estate tax treaty provides otherwise.
129
Table of Contents
UNDERWRITING (CONFLICTS OF INTEREST)
Subject to the terms and conditions set forth in the underwriting agreement between us and Jefferies LLC and J.P. Morgan Securities LLC, as the representatives of the underwriters named below and the joint book-running managers of this offering, we have agreed to sell to the underwriters, and each of the underwriters has agreed, severally and not jointly, to purchase from us, the respective number of shares of common stock shown opposite its name below:
| Underwriter |
Number of Shares |
|||
| Jefferies LLC |
||||
| J.P. Morgan Securities LLC |
||||
| Credit Suisse Securities (USA) LLC |
||||
| Deutsche Bank Securities Inc. |
||||
| Piper Jaffray & Co. |
||||
| Wells Fargo Securities, LLC |
||||
| Macquarie Capital (USA) Inc. |
||||
| Total |
4,411,764 | |||
The underwriting agreement provides that the obligations of the several underwriters are subject to certain conditions precedent, such as the receipt by the underwriters of officers’ certificates and legal opinions and approval of certain legal matters by their counsel. The underwriting agreement provides that the underwriters will purchase all of the shares of common stock if any of them are purchased. If an underwriter defaults, the underwriting agreement provides that the purchase commitments of the nondefaulting underwriters may be increased or the underwriting agreement may be terminated. We have agreed to indemnify the underwriters and certain of their controlling persons against certain liabilities, including liabilities under the Securities Act, and to contribute to payments that the underwriters may be required to make in respect of those liabilities.
The underwriters have advised us that, following the completion of this offering, they currently intend to make a market in the common stock as permitted by applicable laws and regulations. However, the underwriters are not obligated to do so, and the underwriters may discontinue any market-making activities at any time without notice in their sole discretion. Accordingly, no assurance can be given as to the liquidity of the trading market for the common stock, that you will be able to sell any of the common stock held by you at a particular time or that the prices that you receive when you sell will be favorable.
The underwriters are offering the shares of common stock subject to their acceptance of the shares of common stock from us and subject to prior sale. The underwriters reserve the right to withdraw, cancel or modify offers to the public and to reject orders in whole or in part. In addition, the underwriters have advised us that they do not intend to confirm sales to any account over which they exercise discretionary authority.
Commission and Expenses
The underwriters have advised us that they propose to offer the shares of common stock to the public at the initial public offering price set forth on the cover page of this prospectus and to certain dealers, which may include the underwriters, at that price less a concession not in excess of $ per share of common stock. The underwriters may allow, and certain dealers may reallow, a discount from the concession not in excess of $ per share of common stock to certain brokers and dealers. After the offering, the initial public offering price, concession and reallowance to dealers may be reduced by the representatives. No such reduction will change the amount of proceeds to be received by us as set forth on the cover page of this prospectus. Sales of shares made outside of the United States may be made by affiliates of the underwriters.
130
Table of Contents
The following table shows the public offering price, the underwriting discounts and commissions that we are to pay the underwriters and the proceeds, before expenses, to us in connection with this offering. Such amounts are shown assuming both no exercise and full exercise of the underwriters’ option to purchase additional shares.
| Per Share | Total | |||||||||||||||
| Without Option to Purchase Additional Shares |
With Option to Purchase Additional Shares |
Without Option to Purchase Additional Shares |
With Option to Purchase Additional Shares |
|||||||||||||
| Public offering price |
$ | $ | $ | $ | ||||||||||||
| Underwriting discounts and commissions |
$ | $ | $ | $ | ||||||||||||
| Proceeds, before expenses |
$ | $ | $ | $ | ||||||||||||
We estimate expenses payable by us in connection with this offering, other than the underwriting discounts and commissions referred to above, will be approximately $2.8 million. We have also agreed to reimburse the underwriters for certain of their expenses in an amount up to $25,000. The underwriters have also agreed to reimburse us for certain of our expenses in connection with this offering.
Determination of Offering Price
Prior to this offering, there has not been a public market for our common stock. Consequently, the initial public offering price for our common stock will be determined by negotiations between us and the representatives. Among the factors to be considered in these negotiations will be prevailing market conditions, our financial information, market valuations of other companies that we and the underwriters believe to be comparable to us, estimates of our business potential, the present state of our development and other factors deemed relevant.
We offer no assurances that the initial public offering price will correspond to the price at which the common stock will trade in the public market subsequent to the offering or that an active trading market for the common stock will develop and continue after the offering.
Listing
We have applied to have our common stock listed on the NASDAQ Global Select Market under the trading symbol “FOGO.”
Stamp Taxes
If you purchase shares of common stock offered in this prospectus, you may be required to pay stamp taxes and other charges under the laws and practices of the country of purchase, in addition to the offering price listed on the cover page of this prospectus.
Option to Purchase Additional Shares
We have granted to the underwriters an option, exercisable for 30 days from the date of this prospectus, to purchase, from time to time, in whole or in part, up to an aggregate of 661,764 shares at the public offering price on the cover of this prospectus, less underwriting discounts and commissions. If the underwriters exercise this option, each underwriter will be obligated, subject to specified conditions, to purchase a number of additional shares proportionate to that underwriter’s initial purchase commitment as indicated in the table above. This option may be exercised only if the underwriters sell more shares than the total number on the cover of this prospectus.
No Sales of Similar Securities
We, our officers, directors and holders of approximately 99% our outstanding capital stock have agreed, subject to specified exceptions, not to directly or indirectly:
| • | sell, offer, contract or grant any option to sell (including any short sale), pledge, transfer, establish an open “put equivalent position” within the meaning of Rule 16a-l(h) under the Securities Exchange Act of 1934, as amended, or |
131
Table of Contents
| • | otherwise dispose of any shares of common stock, options or warrants to acquire shares of common stock, or securities exchangeable or exercisable for or convertible into shares of common stock currently or hereafter owned either of record or beneficially, or |
| • | publicly announce an intention to do any of the foregoing for a period of 180 days after the date of this prospectus without the prior written consent of Jefferies LLC and J.P. Morgan Securities LLC. |
This restriction terminates after the close of trading of the common stock on and including the 180th day after the date of this prospectus.
Jefferies LLC and J.P. Morgan Securities LLC may, in their sole discretion and at any time or from time to time before the termination of the 180-day period, release all or any portion of the securities subject to lock-up agreements.
Stabilization
The underwriters have advised us that, pursuant to Regulation M under the Securities Exchange Act of 1934, as amended, certain persons participating in the offering may engage in short sale transactions, stabilizing transactions, syndicate covering transactions or the imposition of penalty bids in connection with this offering. These activities may have the effect of stabilizing or maintaining the market price of the common stock at a level above that which might otherwise prevail in the open market. Establishing short sales positions may involve either “covered” short sales or “naked” short sales.
“Covered” short sales are sales made in an amount not greater than the underwriters’ option to purchase additional shares of our common stock in this offering. The underwriters may close out any covered short position by either exercising their option to purchase additional shares of our common stock or purchasing shares of our common stock in the open market. In determining the source of shares to close out the covered short position, the underwriters will consider, among other things, the price of shares available for purchase in the open market as compared to the price at which they may purchase shares through the option to purchase additional shares.
“Naked” short sales are sales in excess of the option to purchase additional shares of our common stock. The underwriters must close out any naked short position by purchasing shares in the open market. A naked short position is more likely to be created if the underwriters are concerned that there may be downward pressure on the price of the shares of our common stock in the open market after pricing that could adversely affect investors who purchase in this offering.
A stabilizing bid is a bid for the purchase of shares of common stock on behalf of the underwriters for the purpose of fixing or maintaining the price of the common stock. A syndicate covering transaction is the bid for or the purchase of shares of common stock on behalf of the underwriters to reduce a short position incurred by the underwriters in connection with the offering. Similar to other purchase transactions, the underwriter’s purchases to cover the syndicate short sales may have the effect of raising or maintaining the market price of our common stock or preventing or retarding a decline in the market price of our common stock. As a result, the price of our common stock may be higher than the price that might otherwise exist in the open market. A penalty bid is an arrangement permitting the underwriters to reclaim the selling concession otherwise accruing to a syndicate member in connection with the offering if the common stock originally sold by such syndicate member are purchased in a syndicate covering transaction and therefore have not been effectively placed by such syndicate member.
None of us or any of the underwriters make any representation or prediction as to the direction or magnitude of any effect that the transactions described above may have on the price of our common stock. The underwriters are not obligated to engage in these activities and, if commenced, any of the activities may be discontinued at any time.
Electronic Distribution
A prospectus in electronic format may be made available by e-mail or on the websites or through online services maintained by one or more of the underwriters or their affiliates. In those cases, prospective investors may view offering terms online and may be allowed to place orders online. The underwriters may agree with us to allocate a specific number of shares of common stock for sale to online brokerage account holders. Any such allocation for online
132
Table of Contents
distributions will be made by the underwriters on the same basis as other allocations. Other than the prospectus in electronic format, the information on the underwriters’ websites and any information contained in any other website maintained by any of the underwriters is not part of this prospectus, has not been approved and/or endorsed by us or the underwriters and should not be relied upon by investors.
Directed Share Program
At our request, the underwriters have reserved for sale at the initial public offering price up to 5% of the shares offered hereby for our directors, officers, certain employees and certain other related parties who have expressed an interest in purchasing shares in the offering. The number of shares of common stock available for sale to the general public in the offering will be reduced to the extent these persons purchase the directed shares in the program. Any directed shares not so purchased will be offered by the underwriters to the general public on the same terms as the other shares. Except for certain participants who have entered into lock-up agreements as contemplated above, each person buying shares through the directed share program has agreed that, for a period of 180 days from and including the date of this prospectus, he or she will not, without the prior written consent of Jefferies LLC and J.P. Morgan Securities LLC, dispose of or hedge any shares of common stock or any securities convertible into or exchangeable for shares of common stock with respect to shares purchased in the program. For those participants who have entered into lock-up agreements as contemplated above, the lock-up agreements contemplated therein shall govern with respect to their purchases of shares of common stock in the program. Jefferies LLC and J.P. Morgan Securities LLC in their sole discretion may release any of the securities subject to these lock-up agreements at any time. We have agreed to indemnify the underwriters against certain liabilities and expenses, including liabilities under the Securities Act, in connection with sales of the directed shares.
Other Activities and Relationships
The underwriter and certain of its affiliates are full service financial institutions engaged in various activities, which may include securities trading, commercial and investment banking, financial advisory, investment management, investment research, principal investment, hedging, financing and brokerage activities. The underwriter and certain of its affiliates have, from time to time, performed, and may in the future perform, various commercial and investment banking and financial advisory services for us and our affiliates, for which they have received or will receive customary fees and expenses. In particular, certain of the underwriters or their affiliates serve as lenders and/or syndication agents under our First Lien Credit Facility and under our Second Lien Credit Facility and an affiliate of J.P. Morgan Securities LLC acts as administrative agent under our First Lien Credit Facility. Affiliates of Jefferies LLC, Credit Suisse Securities (USA) LLC and Wells Fargo Securities, LLC, who are lenders under our First Lien Term Loan will be repaid with a portion of the proceeds of this offering. Furthermore, affiliates of certain of the underwriters will be lenders under the New Credit Facility and an affiliate of Wells Fargo Securities, LLC will act as administrative agent thereunder. See “Summary,” “Use of Proceeds,” and “—Conflicts of Interest.”
In the ordinary course of their various business activities, the underwriter and certain of its affiliates may make or hold a broad array of investments and actively trade debt and equity securities (or related derivative securities) and financial instruments (including bank loans) for their own account and for the accounts of their customers, and such investment and securities activities may involve securities and/or instruments issued by us and our affiliates. The underwriters and certain of their respective affiliates may also communicate independent investment recommendations, market color or trading ideas and/or publish or express independent research views in respect of such securities or instruments and may at any time hold, or recommend to clients that they acquire, long and/or short positions in such securities and instruments.
Solebury Capital LLC (“Solebury”), a FINRA member, is acting as our financial advisor in connection with the offering. Solebury is not acting as an underwriter and will not sell or offer to sell any securities and will not identify, solicit or engage directly with potential investors. In addition, Solebury will not underwrite or purchase any of the offered securities or otherwise participate in any such undertaking.
Conflicts of Interest
A portion of the proceeds received by us from this offering will be used to repay the outstanding indebtedness under our Senior Credit Facilities. Because affiliates of Credit Suisse Securities (USA) LLC and Wells Fargo Securities, LLC are lenders under our First Lien Credit Facility and each will receive 5% or more of the net proceeds
133
Table of Contents
received by us from this offering, Credit Suisse Securities (USA) LLC and Wells Fargo Securities, LLC are each deemed to have a “conflict of interest” under FINRA Rule 5121. As a result, this offering will be conducted in accordance with FINRA Rule 5121. Pursuant to that rule, the appointment of a “qualified independent underwriter” is not required in connection with this offering as the members primarily responsible for managing the public offering do not have a conflict of interest, are not affiliates of any member that has a conflict of interest and meet the requirements of paragraph (f)(12)(E) of FINRA Rule 5121. Credit Suisse Securities (USA) LLC and Wells Fargo Securities, LLC will not confirm any sales to any account over which it exercises discretionary authority without the specific written approval of the account holder. See “Summary,” “Use of Proceeds” and “Underwriting (Conflicts of Interest)” for additional information.
Disclaimers About Non-US Jurisdictions
Other than in the United States, no action has been taken by us or the underwriters that would permit a public offering of the securities offered by this prospectus in any jurisdiction where action for that purpose is required. The securities offered by this prospectus may not be offered or sold, directly or indirectly, nor may this prospectus or any other offering material or advertisements in connection with the offer and sale of any such securities be distributed or published in any jurisdiction, except under circumstances that will result in compliance with the applicable rules and regulations of that jurisdiction. Persons into whose possession this prospectus comes are advised to inform themselves about and to observe any restrictions relating to the offering and the distribution of this prospectus. This prospectus does not constitute an offer to sell or a solicitation of an offer to buy any securities offered by this prospectus in any jurisdiction in which such an offer or a solicitation is unlawful.
Australia
This prospectus is not a disclosure document for the purposes of Australia’s Corporations Act 2001 (Cth) of Australia (the “Corporations Act”), has not been lodged with the Australian Securities & Investments Commission and is only directed to the categories of exempt persons set out below. Accordingly, if you receive this prospectus in Australia:
(a) You confirm and warrant that you are either:
| • | a “sophisticated investor” under Section 708(8)(a) or (b) of the Corporations Act; |
| • | a “sophisticated investor” under Section 708(8)(c) or (d) of the Corporations Act and that you have provided an accountant’s certificate to us which complies with the requirements of Section 708(8)(c)(i) or (ii) of the Corporations Act and related regulations before the offer has been made; |
| • | a person associated with us under Section 708(12) of the Corporations Act; or |
| • | a “professional investor” within the meaning of Section 708(11)(a) or (b) of the Corporations Act. |
To the extent that you are unable to confirm or warrant that you are an exempt sophisticated investor, associated person or professional investor under the Corporations Act, any offer made to you under this prospectus is void and incapable of acceptance.
(b) You warrant and agree that you will not offer any of the securities issued to you pursuant to this prospectus for resale in Australia within 12 months of those securities being issued unless any such resale offer is exempt from the requirement to issue a disclosure document under Section 708 of the Corporations Act.
European Economic Area
In relation to each member state of the European Economic Area which has implemented the Prospectus Directive (each, a “Relevant Member State”), an offer to the public of any common shares which are the subject of the offering contemplated by this prospectus may not be made in that Relevant Member State except that an offer to the public in that Relevant Member State of any common shares may be made at any time under the following exemptions under the Prospectus Directive, if they have been implemented in that Relevant Member State:
(a) to any legal entity which is a “qualified investor” as defined in the Prospectus Directive;
134
Table of Contents
(b) to fewer than 100 or, if the Relevant Member State has implemented the relevant provision of the 2010 PD Amending Directive, 150, natural or legal persons (other than qualified investors as defined in the Prospectus Directive), as permitted under the Prospectus Directive, subject to obtaining the prior consent of the underwriters or the underwriters nominated by us for any such offer; or
(c) in any other circumstances falling within Article 3(2) of the Prospectus Directive,
provided that no such offer of common shares shall require us or any of the underwriters to publish a prospectus pursuant to Article 3 of the Prospectus Directive or supplement a prospectus pursuant to Article 16 of the Prospectus Directive.
For the purposes of this provision, the expression an “offer of common shares to the public” in relation to the common shares in any Relevant Member State means the communication in any form and by any means of sufficient information on the terms of the offer and the common shares to be offered so as to enable an investor to decide to purchase or subscribe to the common shares, as the same may be varied in that Relevant Member State by any measure implementing the Prospectus Directive in that Relevant Member State, and the expression “Prospectus Directive” means Directive 2003/71/EC (and amendments thereto, including the 2010 PD Amending Directive, to the extent implemented in the Relevant Member State), and includes any relevant implementing measure in the Relevant Member State, and the expression “2010 PD Amending Directive” means Directive 2010/73/EU.
Hong Kong
No securities have been offered or sold, and no securities may be offered or sold, in Hong Kong, by means of any document, other than to persons whose ordinary business is to buy or sell shares or debentures, whether as principal or agent; or to “professional investors” as defined in the Securities and Futures Ordinance (Cap. 571) of Hong Kong (“SFO”) and any rules made under that Ordinance; or in other circumstances which do not result in the document being a “prospectus” as defined in the Companies Ordinance (Cap. 32) of Hong Kong (“CO”) or which do not constitute an offer or invitation to the public for the purpose of the CO or the SFO. No document, invitation or advertisement relating to the securities has been issued or may be issued or may be in the possession of any person for the purpose of issue (in each case, whether in Hong Kong or elsewhere), which is directed at, or the contents of which are likely to be accessed or read by, the public of Hong Kong (except if permitted under the securities laws of Hong Kong) other than with respect to securities which are or, are intended to be, disposed of only to persons outside Hong Kong or only to “professional investors” as defined in the SFO and any rules made under that Ordinance.
This prospectus has not been registered with the Registrar of Companies in Hong Kong. Accordingly, this prospectus may not be issued, circulated or distributed in Hong Kong, and the securities may not be offered for subscription to members of the public in Hong Kong. Each person acquiring the securities will be required, and is deemed by the acquisition of the securities, to confirm that he is aware of the restriction on offers of the securities described in this prospectus and the relevant offering documents and that he is not acquiring, and has not been offered any securities in circumstances that contravene any such restrictions.
Japan
The offering has not been and will not be registered under the Financial Instruments and Exchange Law of Japan (Law No. 25 of 1948 of Japan, as amended, or the “FIEL”), and the underwriters will not offer or sell any securities, directly or indirectly, in Japan, or to, or for the benefit of, any resident of Japan (which term as used herein means any person resident in Japan, including any corporation or other entity organized under the laws of Japan), or to others for re-offering or resale, directly or indirectly, in Japan or to, or for the benefit of, any resident of Japan, except pursuant to an exemption from the registration requirements of, and otherwise in compliance with, the FIEL and any other applicable laws, regulations and ministerial guidelines of Japan.
Singapore
This prospectus has not been and will not be lodged or registered as a prospectus with the Monetary Authority of Singapore. Accordingly, this prospectus and any other document or material in connection with the offer or sale, or invitation for subscription or purchase, of the securities may not be circulated or distributed, nor may the securities be
135
Table of Contents
offered or sold, or be made the subject of an invitation for subscription or purchase, whether directly or indirectly, to persons in Singapore other than (i) to an institutional investor under Section 274 of the Securities and Futures Act, Chapter 289 of Singapore (the “SFA”), (ii) to a relevant person pursuant to Section 275(1), or any person pursuant to Section 275(1A), and in accordance with the conditions specified in Section 275, of the SFA or (iii) otherwise pursuant to, and in accordance with the conditions of, any other applicable provision of the SFA.
Where the securities are subscribed or purchased under Section 275 of the SFA by a relevant person that is:
(a) a corporation (which is not an accredited investor (as defined in Section 4A of the SFA)) the sole business of which is to hold investments and the entire share capital of which is owned by one or more individuals, each of whom is an accredited investor; or
(b) a trust (where the trustee is not an accredited investor) whose sole purpose is to hold investments and each beneficiary of the trust is an individual who is an accredited investor, securities (as defined in Section 239(1) of the SFA) of that corporation or the beneficiaries’ rights and interest (howsoever described) in that trust shall not be transferred within six months after that corporation or that trust has acquired the securities pursuant to an offer made under Section 275 of the SFA except:
(i) to an institutional investor or to a relevant person defined in Section 275(2) of the SFA, or to any person arising from an offer referred to in Section 275(1A) or Section 276(4)(i)(B) of the SFA;
(ii) where no consideration is or will be given for the transfer;
(iii) where the transfer is by operation of law;
(iv) as specified in Section 276(7) of the SFA; or
(v) as specified in Regulation 32 of the Securities and Futures (Offers of Investments) (Shares and Debentures) Regulations 2005 of Singapore.
Switzerland
The securities may not be publicly offered in Switzerland and will not be listed on the SIX Swiss Exchange (“SIX”) or on any other stock exchange or regulated trading facility in Switzerland. This prospectus has been prepared without regard to the disclosure standards for issuance prospectuses under art. 652a or art. 1156 of the Swiss Code of Obligations or the disclosure standards for listing prospectuses under art. 27 ff. of the SIX Listing Rules or the listing rules of any other stock exchange or regulated trading facility in Switzerland. Neither this prospectus nor any other offering or marketing material relating to the securities or the offering may be publicly distributed or otherwise made publicly available in Switzerland.
Neither this prospectus nor any other offering or marketing material relating to the offering, us or the securities have been or will be filed with or approved by any Swiss regulatory authority. In particular, this prospectus will not be filed with, and the offer of securities will not be supervised by, the Swiss Financial Market Supervisory Authority FINMA, and the offer of securities has not been and will not be authorized under the Swiss Federal Act on Collective Investment Schemes (“CISA”). The investor protection afforded to acquirers of interests in collective investment schemes under the CISA does not extend to acquirers of securities.
United Kingdom
This prospectus is only being distributed to, and is only directed at, persons in the United Kingdom that are qualified investors within the meaning of Article 2(1)(e) of the Prospectus Directive that are also (i) investment professionals falling within Article 19(5) of the Financial Services and Markets Act 2000 (Financial Promotion) Order 2005, as amended (the “Order”) and/or (ii) high net worth entities falling within Article 49(2)(a) to (d) of the Order and other persons to whom it may lawfully be communicated (each such person being referred to as a “relevant person”).
136
Table of Contents
This prospectus and its contents are confidential and should not be distributed, published or reproduced (in whole or in part) or disclosed by recipients to any other persons in the United Kingdom. Any person in the United Kingdom that is not a relevant person should not act or rely on this document or any of its contents.
The validity of the shares of our common stock offered hereby will be passed upon for us by Davis Polk & Wardwell LLP, New York, New York. Certain legal matters in connection with this offering will be passed upon for the underwriters by Latham & Watkins LLP, New York, New York.
The consolidated financial statements as of December 28, 2014 and December 29, 2013, for the years ended December 28, 2014 and December 29, 2013 and for the periods May 24, 2012 (Inception) to December 30, 2012 (“Successor”) and January 2, 2012 to July 20, 2012 (“Predecessor”), included in this prospectus have been so included in reliance on the reports of PricewaterhouseCoopers LLP, an independent registered public accounting firm, given on the authority of said firm as experts in auditing and accounting.
WHERE YOU CAN FIND MORE INFORMATION
We filed with the SEC a registration statement on Form S-1, of which this prospectus is a part, under the Securities Act for the shares of our common stock to be sold in this offering. This prospectus does not contain all of the information in the registration statement and the exhibits that were filed with the registration statement. For further information with respect to us and our common stock, we refer you to the registration statement and the exhibits that were filed with the registration statement. Statements contained in this prospectus about the contents of any contract or any other document that is filed as an exhibit to the registration statement are not necessarily complete, and we refer you to the full text of the contract or other document filed as an exhibit to the registration statement. A copy of the registration statement and the exhibits that were filed with the registration statement may be inspected without charge at the public reference facilities maintained by the SEC in Washington, D.C. at 100 F Street, N.E., Washington, D.C. 20549, and copies of all or any part of the registration statement may be obtained from the SEC upon payment of the prescribed duplicating fee. Information on the operation of the public reference facilities may be obtained by calling the SEC at 1-800-SEC-0330. The SEC maintains a website that contains reports, proxy and information statements, and other information regarding registrants that file electronically with the SEC. The address of the site is http://www.sec.gov.
As a result of this offering, we will become subject to the information and periodic reporting requirements of the Exchange Act, and, in accordance with such requirements, will file periodic reports, proxy statements, and other information with the SEC. These periodic reports, proxy statements, and other information will be available for inspection and copying at the regional offices, public reference facilities and website of the SEC referred to above. We intend to furnish our stockholders with annual reports containing financial statements audited by our independent accountants.
137
Table of Contents
INDEX TO CONSOLIDATED FINANCIAL STATEMENTS
| Unaudited Condensed Consolidated Financial Statements: | ||||
| F-2 | ||||
| Unaudited Condensed Consolidated Statements of Operations and Comprehensive Income (Loss) |
F-3 | |||
| Unaudited Condensed Consolidated Statement of Shareholders’ Equity |
F-4 | |||
| F-5 | ||||
| Notes to Unaudited Condensed Consolidated Financial Statements |
F-6 | |||
| Audited Consolidated Financial Statements: | ||||
| Report of Independent Registered Public Accounting Firm—Successor |
F-19 | |||
| Report of Independent Registered Public Accounting Firm—Predecessor |
F-20 | |||
| F-21 | ||||
| Consolidated Statements of Operations and Comprehensive Income (Loss) |
F-22 | |||
| F-23 | ||||
| F-24 | ||||
| F-25 | ||||
F-1
Table of Contents
Fogo de Chão, Inc.
UNAUDITED CONDENSED CONSOLIDATED BALANCE SHEETS
(in thousands, except share and par value amounts)
| March 29, 2015 |
December 28, 2014 |
|||||||
| Assets |
||||||||
| Current assets: |
||||||||
| Cash and cash equivalents |
$ | 17,304 | $ | 19,387 | ||||
| Accounts receivable |
7,530 | 10,096 | ||||||
| Inventories |
4,701 | 5,456 | ||||||
| Deferred tax assets |
1,211 | 986 | ||||||
| Prepaid expenses and other current assets |
3,692 | 3,144 | ||||||
| Total current assets |
34,438 | 39,069 | ||||||
| Property and equipment, net |
112,267 | 113,206 | ||||||
| Prepaid rent |
573 | 656 | ||||||
| Goodwill |
212,344 | 220,316 | ||||||
| Intangible assets, net |
96,557 | 100,480 | ||||||
| Other assets |
3,919 | 3,442 | ||||||
| Total assets (a) |
$ | 460,098 | $ | 477,169 | ||||
| Liabilities and Equity |
||||||||
| Current liabilities: |
||||||||
| Accounts payable and accrued expenses |
$ | 23,149 | $ | 31,788 | ||||
| Current portion of long-term debt |
4,788 | 4,788 | ||||||
| Deferred revenue |
4,285 | 4,857 | ||||||
| Total current liabilities |
32,222 | 41,433 | ||||||
| Deferred rent |
11,670 | 10,642 | ||||||
| Long-term debt, less current portion |
237,970 | 238,257 | ||||||
| Deferred tax liabilities |
31,019 | 29,982 | ||||||
| Other noncurrent liabilities |
1,321 | 1,396 | ||||||
| Total liabilities (a) |
314,202 | 321,710 | ||||||
| Commitments and contingencies (Note 12) |
||||||||
| Equity: |
||||||||
| Fogo de Chão, Inc. shareholders’ equity: |
||||||||
| Common stock, $0.01 par value, 1,200,000 shares authorized, 897,184 and 896,089 shares issued and outstanding as of March 29, 2015 and December 28, 2014, respectively |
9 | 9 | ||||||
| Additional paid-in capital |
176,637 | 176,206 | ||||||
| Retained earnings |
12,251 | 7,586 | ||||||
| Accumulated other comprehensive loss |
(45,175 | ) | (29,720 | ) | ||||
| Total Fogo de Chão, Inc. shareholders’ equity |
143,722 | 154,081 | ||||||
| Noncontrolling interests |
2,174 | 1,378 | ||||||
| Total equity |
145,896 | 155,459 | ||||||
| Total liabilities and equity |
$ | 460,098 | $ | 477,169 | ||||
| (a) | Consolidated assets as of March 29, 2015 and December 28, 2014 include total assets of $2,314 and $1,455, respectively, attributable to a consolidated joint venture that can only be used to settle the obligations of the joint venture. Consolidated liabilities as of March 29, 2015 included total liabilities of $63 attributable to the consolidated joint venture. There were no liabilities of the joint venture as of December 28, 2014. (see Note 6). |
The accompanying notes are an integral part of these condensed consolidated financial statements.
F-2
Table of Contents
Fogo de Chão, Inc.
UNAUDITED CONDENSED CONSOLIDATED STATEMENTS OF OPERATIONS
AND COMPREHENSIVE INCOME (LOSS)
(in thousands, except share and per share amounts)
| Thirteen Week Periods Ended | ||||||||
| March 29, 2015 |
March 30, 2014 |
|||||||
| Revenue |
$ | 64,959 | $ | 61,317 | ||||
| Restaurant operating costs: |
||||||||
| Food and beverage costs |
19,164 | 18,547 | ||||||
| Compensation and benefit costs |
14,100 | 13,891 | ||||||
| Occupancy and other operating expenses (excluding depreciation and amortization) |
11,174 | 10,820 | ||||||
| Total restaurant operating costs |
44,438 | 43,258 | ||||||
| Marketing and advertising costs |
1,402 | 1,442 | ||||||
| General and administrative costs |
5,708 | 4,668 | ||||||
| Pre-opening costs |
1,003 | 788 | ||||||
| Depreciation and amortization |
3,004 | 2,737 | ||||||
| Other operating (income) expense, net |
(113 | ) | (69 | ) | ||||
| Total costs and expenses |
55,442 | 52,824 | ||||||
| Income from operations |
9,517 | 8,493 | ||||||
| Other income (expense): |
||||||||
| Interest expense, net |
(3,757 | ) | (4,762 | ) | ||||
| Other income (expense), net |
(2 | ) | (4 | ) | ||||
| Total other income (expense), net |
(3,759 | ) | (4,766 | ) | ||||
| Income before income taxes |
5,758 | 3,727 | ||||||
| Income tax expense |
1,252 | 965 | ||||||
| Net income |
4,506 | 2,762 | ||||||
| Less: Loss attributable to noncontrolling interest |
(159 | ) | — | |||||
| Net income attributable to Fogo de Chão, Inc. |
$ | 4,665 | $ | 2,762 | ||||
| Net income |
$ | 4,506 | $ | 2,762 | ||||
| Other comprehensive income (loss): |
||||||||
| Currency translation adjustment |
(15,330 | ) | 3,095 | |||||
| Total other comprehensive income (loss) |
$ | (15,330 | ) | $ | 3,095 | |||
| Comprehensive income (loss) |
(10,824 | ) | 5,857 | |||||
| Less: Comprehensive loss attributable to noncontrolling interest |
(34 | ) | — | |||||
| Comprehensive income (loss) attributable to Fogo de Chão, Inc. |
$ | (10,790 | ) | $ | 5,857 | |||
| Earnings per common share attributable to Fogo de Chão, Inc.: |
||||||||
| Basic |
$ | 5.20 | $ | 3.10 | ||||
| Diluted |
$ | 5.14 | $ | 3.06 | ||||
| Weighted average common shares outstanding: |
||||||||
| Basic |
896,679 | 890,439 | ||||||
| Diluted |
907,074 | 902,505 | ||||||
The accompanying notes are an integral part of these condensed consolidated financial statements.
F-3
Table of Contents
Fogo de Chão, Inc.
UNAUDITED CONDENSED CONSOLIDATED STATEMENT OF SHAREHOLDERS’ EQUITY
(in thousands, except share amounts)
| Common Stock | Additional Paid-In Capital |
Retained Earnings |
Accumulated Other Comprehensive Loss |
Fogo de Chão, Inc. Shareholders’ Equity |
Noncontrolling Interests |
Total Equity |
||||||||||||||||||||||||||
| Shares | Amount | |||||||||||||||||||||||||||||||
| December 28, 2014 |
896,089 | $ | 9 | $ | 176,206 | $ | 7,586 | $ | (29,720 | ) | $ | 154,081 | $ | 1,378 | $ | 155,459 | ||||||||||||||||
| Net income (loss) |
— | — | — | 4,665 | — | 4,665 | (159 | ) | 4,506 | |||||||||||||||||||||||
| Issuance of common stock |
1,095 | — | 301 | — | — | 301 | — | 301 | ||||||||||||||||||||||||
| Share-based compensation |
— | — | 130 | — | — | 130 | — | 130 | ||||||||||||||||||||||||
| Currency translation adjustment, net of tax benefit of $0 |
— | — | — | — | (15,455 | ) | (15,455 | ) | 125 | (15,330 | ) | |||||||||||||||||||||
| Contribution from noncontrolling interests |
— | — | — | — | — | — | 830 | 830 | ||||||||||||||||||||||||
| March 29, 2015 |
897,184 | $ | 9 | $ | 176,637 | $ | 12,251 | $ | (45,175 | ) | $ | 143,722 | $ | 2,174 | $ | 145,896 | ||||||||||||||||
The accompanying notes are an integral part of these condensed consolidated financial statements.
F-4
Table of Contents
Fogo de Chão, Inc.
UNAUDITED CONDENSED CONSOLIDATED STATEMENTS OF CASH FLOWS
(in thousands)
| Thirteen Week Periods Ended | ||||||||
| March 29, 2015 |
March 30, 2014 |
|||||||
| Cash flows from operating activities: |
||||||||
| Net income |
$ | 4,506 | $ | 2,762 | ||||
| Adjustments to reconcile net income to net cash flows provided by (used in) operating activities: |
||||||||
| Depreciation and amortization of property and equipment |
2,935 | 2,665 | ||||||
| Amortization of definite-lived intangibles |
69 | 72 | ||||||
| Amortization of favorable/unfavorable leases |
(45 | ) | (46 | ) | ||||
| Amortization of debt issuance costs |
84 | 88 | ||||||
| Amortization original issue discount |
283 | 382 | ||||||
| Deferred income taxes |
812 | 430 | ||||||
| Share-based compensation expense |
130 | 189 | ||||||
| Changes in operating assets and liabilities: |
||||||||
| Accounts and other receivable |
1,825 | 3,648 | ||||||
| Prepaid expenses and other assets |
(748 | ) | 407 | |||||
| Inventories |
363 | 255 | ||||||
| Accounts payable and accrued expenses |
(8,537 | ) | (13,851 | ) | ||||
| Accrued interest |
(111 | ) | — | |||||
| Deferred revenue |
(531 | ) | (561 | ) | ||||
| Deferred rent and tenant allowance |
952 | 95 | ||||||
| Net cash flows provided by (used in) operating activities |
1,987 | (3,465 | ) | |||||
| Cash flows from investing activities: |
||||||||
| Capital expenditures |
(3,264 | ) | (5,982 | ) | ||||
| Net cash flows used in investing activities |
(3,264 | ) | (5,982 | ) | ||||
| Cash flows from financing activities: |
||||||||
| Repayment on term loans, credit facility |
(570 | ) | (519 | ) | ||||
| Borrowings on revolver |
— | 7,000 | ||||||
| Deferred IPO costs |
(650 | ) | — | |||||
| Proceeds from the issuance of common stock |
301 | — | ||||||
| Contribution from noncontrolling interest |
830 | — | ||||||
| Net cash flows (used in) provided by financing activities |
(89 | ) | 6,481 | |||||
| Effect of foreign exchange rates on cash and cash equivalents |
(717 | ) | 203 | |||||
| Net decrease in cash and cash equivalents |
(2,083 | ) | (2,763 | ) | ||||
| Cash and cash equivalents at beginning of period |
19,387 | 16,010 | ||||||
| Cash and cash equivalents at end of period |
$ | 17,304 | $ | 13,247 | ||||
| Supplemental disclosure of cash flow information: |
||||||||
| Cash paid during the period: |
||||||||
| Interest |
$ | 3,555 | $ | 4,491 | ||||
| Income taxes, net of refunds |
$ | 589 | $ | 628 | ||||
| Non-cash activities: |
||||||||
| Capital expenditures included in accounts payable and accrued expenses |
$ | 903 | $ | 1,551 | ||||
| Deferred initial public offering costs included in accounts payable and accrued expenses |
$ | 773 | $ | — | ||||
The accompanying notes are an integral part of these condensed consolidated financial statements.
F-5
Table of Contents
Fogo de Chão, Inc.
Notes to Unaudited Condensed Consolidated Financial Statements
(in thousands, except share and per share amounts)
1. Description of Business
Fogo de Chão, Inc. and subsidiaries (the “Company”) operates upscale Brazilian churrascaria steakhouses under the brand of Fogo de Chão. As of March 29, 2015, the Company operated, through its subsidiaries, 26 restaurants in the United States and 9 restaurants located in Brazil.
Fogo de Chão, Inc. is a holding company with no assets or operations of its own. The Company owns 100% of Brasa (Purchaser) Inc. (“Brasa Purchaser”), which owns 100% of Brasa (Holdings) Inc. (“Brasa Holdings”). Brasa Holdings owns 100% of Fogo de Chão (Holdings) Inc. (“Fogo Holdings”), which owns the Company’s domestic and foreign operating subsidiaries.
2. Basis of Presentation
Interim Financial Statements
Certain information and footnote disclosures normally included in audited consolidated financial statements presented in accordance generally accepted accounting principles in the United States of America (“GAAP”) have been condensed or omitted pursuant to rules and regulations of the Securities and Exchange Commission (the “SEC”). Due to the seasonality of the Company’s business, results for any interim financial period are not necessarily indicative of the results that may be achieved for a full fiscal year. In addition, quarterly results of operations may be impacted by the timing and amount of sales and costs associated with the opening of new restaurants. These interim unaudited consolidated financial statements should be read in conjunction with the Company’s annual financial statements for the fiscal year ended December 28, 2014. The unaudited interim financial statements have been prepared on the same basis as the audited annual financial statements, and, in the opinion of management, reflect all adjustments, consisting only of normal recurring adjustments, considered necessary for a fair statement of the results for the interim periods presented.
Principles of Consolidation
The accompanying consolidated financial statements include the assets, liabilities and results of operations of the Company and its subsidiaries, as well as consolidated joint ventures for which the Company has determined that it is the primary beneficiary. All intercompany balances and transactions have been eliminated in the consolidated financial statements.
Accounting Year
The Company uses a 52/53 week fiscal year convention whereby its fiscal year ends each year on the Sunday that is closest to December 31 of that year. Each fiscal year generally is comprised of four 13-week fiscal quarters, although in the years with 53 weeks the fourth quarter represents a 14-week period. The fiscal quarters ended March 29, 2015 and March 30, 2014, each included 13 weeks of operations and are referred to herein as the first quarter of Fiscal 2015 and the first quarter of Fiscal 2014, respectively. Fiscal year 2015 will include 53 weeks of operations. Fiscal year 2014 included 52 weeks of operations.
3. Summary of Significant Accounting Policies
Use of Estimates
The preparation of financial statements in conformity with GAAP requires management to make estimates and assumptions, such as the valuation of long-lived, definite and indefinite-lived assets, estimated useful lives of assets, the reasonably assured lease terms of operating leases, valuation of the workers’ compensation and Company sponsored employee health insurance program liabilities, the fair value of share-based compensation, and deferred tax valuation allowances, that affect the reported amounts of assets and liabilities and disclosure of contingent assets and liabilities at the date of the financial statements and the reported amounts of revenue and expenses during the reporting period. Actual results could differ from those estimates.
F-6
Table of Contents
Fogo de Chão, Inc.
Notes to Unaudited Condensed Consolidated Financial Statements (Continued)
(in thousands, except share and per share amounts)
Capitalized Interest
Direct and certain related indirect costs of construction, including interest, are capitalized in conjunction with construction and development projects. These costs are included in property and equipment and are amortized over the life of the related building and leasehold interest. The Company capitalized interest of $31 and $82 during the first quarter of Fiscal 2015 and the first quarter of Fiscal 2014, respectively.
Deferred Initial Public Offering Costs
Deferred initial public offering costs, which primarily consist of direct, incremental legal, accounting and other professional fees relating to the initial public offering (“IPO”), are included in other assets (noncurrent) in the consolidated balance sheet. These deferred costs will be offset against the IPO proceeds upon the consummation of the offering. In the event the offering is terminated, deferred offering costs will be expensed. As of March 29, 2015 and December 28, 2014, the Company deferred $1,707 and $1,041of IPO related costs, respectively.
Fair Value
As of March 29, 2015 and December 28, 2014, the fair value of cash and cash equivalents, accounts receivable, accounts payable, accrued expenses, and other current liabilities approximated their carrying value due to their short-term nature. The carrying amounts of the long-term debt approximate fair value as interest rates vary with the market interest rates and negotiated terms and conditions are consistent with current market rates.
Revenue
Revenue from restaurant sales is recognized when food and beverage products are sold and is presented net of employee meals, and complimentary meals. Proceeds from the sale of gift cards that do not have expiration dates are recorded as deferred revenue at the time of the sale and recognized as revenue when the gift card is redeemed by the holder. The portion of gift cards sold which are never redeemed is commonly referred to as gift card breakage. The Company recognizes gift card “breakage” revenue for gift cards when the likelihood of redemption becomes remote and the Company determines there is no legal obligation to remit the value of the unredeemed gift cards to governmental agencies. The Company estimates the gift card breakage rate based upon the pattern of historical redemptions. Prior to the third quarter of Fiscal 2014, the Company did not recognize any breakage revenue because it did not have sufficient historical data to allow management to reasonably estimate a pattern of historical redemptions. During the third quarter of Fiscal 2014, the Company concluded it had accumulated sufficient historical data from a large pool of homogeneous transactions to allow management to reasonably and objectively determine an estimated pattern of historical gift card redemptions. Accordingly, the Company accounted for this change prospectively as a change in estimate and recorded an adjustment during the third quarter of Fiscal 2014 to recognize previously unrecognized breakage revenue in the amount of $684 on gift cards whose likelihood of redemption was determined to be remote. During the fourth quarter of Fiscal 2014 the Company recognized an additional $195 in gift card breakage revenue. During the first quarter of Fiscal 2015 the Company recognized $14 in gift card breakage revenue.
Operations in the United States accounted for 84% and 80% of total consolidated revenue during the first quarters of Fiscal 2015 and Fiscal 2014, respectively. The remaining revenue was attributable to operations in Brazil.
Insurance Reserves
Beginning in Fiscal 2013, the Company is self-insured for certain losses related to workers’ compensation claims and Company-sponsored employee health insurance programs. The Company estimates the accrued liabilities for all self-insurance programs at the end of each reporting period. Accrued liabilities include the estimated incurred but unreported costs to settle unpaid claims. To limit exposure to losses, the Company maintains stop-loss coverage through third-party insurers. The deductibles range from approximately $200 to $250 per claim. The accrued liability attributable to all self-insurance programs was $1,319 and $1,230 as of March 29, 2015 and December 28, 2014, respectively, and is included in accounts payable and accrued expenses in the consolidated balance sheets. The estimated liability is not discounted and is based on a number of assumptions and factors, including historical trends and actuarial assumptions.
F-7
Table of Contents
Fogo de Chão, Inc.
Notes to Unaudited Condensed Consolidated Financial Statements (Continued)
(in thousands, except share and per share amounts)
Variable Interest Entities (“VIEs”)
The Company consolidates VIEs in which the Company is deemed to have a controlling interest as a result of the Company having both the power to direct the activities that significantly impact the entity’s economic performance and the right to receive the benefits that could potentially be significant to the VIE. If the Company has a controlling interest in a VIE, the assets, liabilities, and results of the operations of the variable interest entity are included in the consolidated financial statements.
Segment Reporting
Fogo de Chão, Inc. owns and operates full-service, Brazilian steakhouses in the United States and Brazil using a single restaurant concept and brand. Each restaurant under the Company’s single global brand operates with similar types of products and menu, providing a continuous service style, similar contracts, customers and employees, irrespective of location. ASC 280, “Segment Reporting” requires use of the “management approach” model for segment reporting. The management approach model is based on the way a company’s management organizes segments within the company for making operating decisions and assessing performance. The Company’s segments consist of two operating segments: United States and Brazil. The Company’s joint venture in Mexico is included in the United States for segment reporting purposes as the operations of the joint venture are monitored by the United States segment management.
Concentration of Credit Risk
The Company relies on three food distributors for the majority of its beef and grocery purchases for its operations in the United States and Brazil and, effective Fiscal 2015, relies on one distributor for substantially all of its beef purchases for its operations in the United States. However, the products purchased through the distributors are widely available at similar prices from multiple distributors. The Company does not anticipate any risk to the business in the event that one or all of these distributors is no longer available to provide their goods or services. However, a change in suppliers could potentially result in increased costs.
Recently Adopted Accounting Standards
In April 2014, the FASB issued ASU No. 2014-08, “Presentation of Financial Statements (Topic 205) and Property, Plant, and Equipment (Topic 360): Reporting Discontinued Operations and Disclosures of Disposals of Components of an Entity.” ASU No. 2014-08 improves the definition of discontinued operations by limiting discontinued operations reporting to disposals of components of an entity that represent strategic shifts that have (or will have) a major effect on an entity’s operations and financial results. Prior to ASU No. 2014-08, many disposals, some of which may have been routine in nature and not a change in an entity’s strategy, were reported in discontinued operations. Additionally, the amendments in this ASU require expanded disclosures for discontinued operations. The amendments in this ASU also require an entity to disclose the pretax profit or loss of an individually significant component of an entity that does not qualify for discontinued operations reporting. The ASU is effective for annual financial statements with years that begin on or after December 15, 2014. The Company adopted this guidance effective December 29, 2014, which was the first day of the Company’s 2015 fiscal year. The adoption of this guidance did not have an impact on the Company’s consolidated financial statements.
Recently Issued Accounting Standards
Recent accounting pronouncements not included below are not expected to have a material impact on the Company’s consolidated financial position or results of operations.
In May 2014, the FASB issued ASU No. 2014-09, “Revenue from Contracts with Customers.” The core principle of the standard is that an entity recognizes revenue to depict the transfer of promised goods or services to customers in an amount that reflects the consideration to which the entity expects to be entitled in exchange for those goods or services. The ASU will replace most existing revenue recognition guidance in GAAP. New qualitative and quantitative disclosure requirements aim to enable financial statement users to understand the nature, amount, timing, and
F-8
Table of Contents
Fogo de Chão, Inc.
Notes to Unaudited Condensed Consolidated Financial Statements (Continued)
(in thousands, except share and per share amounts)
uncertainty of revenue and cash flows arising from contracts with customers. The new standard is effective for annual periods beginning after December 15, 2016, including interim periods within that reporting period. The Company will be required to adopt this new standard in the first quarter of Fiscal 2017. Early adoption is not permitted. The ASU permits the use of either the retrospective or cumulative effect transition method. The Company has not yet selected a transition method or determined the effect, if any, that this ASU will have on its consolidated financial statements and related disclosures.
In August 2014, the FASB issued ASU No. 2014-15, “Presentation of Financial Statements—Going Concern (Subtopic 205-40): Disclosure of Uncertainties about an Entity’s Ability to Continue as a Going Concern.” ASU 2014-15 will require management to evaluate whether there are conditions or events that raise substantial doubt about the entity’s ability to continue as a going concern for one year from the date the financial statements are issued. The new standard is effective for the annual period ending after December 15, 2016, and for annual periods and interim periods thereafter. The Company will be required to adopt this new standard Fiscal 2016. The Company does not expect the adoption of this ASU to have a material impact on its consolidated financial statements.
In February 2015, the FASB issued ASU No. 2015-2, “Consolidation (Topic 820): Amendments to the Consolidation Analysis.” ASU 2015-2 provides a revised consolidation model for all reporting entities to use in evaluating whether they should consolidate certain legal entities. All legal entities will be subject to reevaluation under this revised consolidation model. The revised consolidation model, among other things, (i) modifies the evaluation of whether limited partnerships and similar legal entities are VIEs or voting interest entities, (ii) eliminates the presumption that a general partner should consolidate a limited partnership, and (iii) modifies the consolidation analysis of reporting entities that are involved with VIEs through fee arrangements and related party relationships. ASU 2015-2 is effective for fiscal years, and for interim periods within those fiscal years, beginning after December 15, 2015. The Company will be required to adopt this new standard Fiscal 2016. The Company is currently in the process of evaluating what impact, if any, the adoption of this ASU will have on its consolidated financial statements.
In April 2015, the FASB issued ASU 2015-03, “Simplifying the Presentation of Debt Issuance Costs,” which changes the presentation of debt issuance costs in financial statements. ASU 2015-03 requires an entity to present such costs in the balance sheet as a direct deduction from the related debt liability rather than as an asset. Amortization of the costs will continue to be reported as interest expense. It is effective for fiscal years, and interim reporting periods within those fiscal years, beginning after December 15, 2015. The Company will be required to adopt this new standard in the first quarter of Fiscal 2016. The new guidance will be applied retrospectively to each prior period presented. The Company is currently in the process of evaluating the impact of adoption of this ASU on its consolidated balance sheets.
4. Property and Equipment, Net
Property and equipment, net consists of the following:
| March 29, 2015 |
December 28, 2014 |
|||||||
| Land |
$ | 5,340 | $ | 5,340 | ||||
| Buildings |
4,810 | 4,810 | ||||||
| Leasehold improvements |
108,006 | 106,486 | ||||||
| Furniture, fixtures and equipment |
14,651 | 14,529 | ||||||
| Automobiles |
206 | 255 | ||||||
| Construction in progress |
2,020 | 3,254 | ||||||
| Joint Venture (Mexico) |
1,840 | 986 | ||||||
| 136,873 | 135,660 | |||||||
| Less: Accumulated depreciation and amortization |
(24,606 | ) | (22,454 | ) | ||||
| Property and equipment, net |
$ | 112,267 | $ | 113,206 | ||||
F-9
Table of Contents
Fogo de Chão, Inc.
Notes to Unaudited Condensed Consolidated Financial Statements (Continued)
(in thousands, except share and per share amounts)
Property and equipment attributable to the Company’s operations in the United States accounted for 89% of total property and equipment, net (excluding land) at March 29, 2015 and at December 28, 2014. Property and equipment attributable to the Company’s operations in Brazil accounted for 9% and 10% of total property and equipment, net (excluding land) at March 29, 2015 and December 28, 2014, respectively. Land is solely attributable to the Company’s operations in the United States.
5. Accounts Payable and Accrued Expenses
Accounts payable and accrued expenses consist of the following:
| March 29, 2015 |
December 28, 2014 |
|||||||
| Accounts payable |
$ | 7,443 | $ | 10,590 | ||||
| Deferred rent (current) |
226 | 309 | ||||||
| Payroll and payroll related |
5,422 | 9,975 | ||||||
| Interest payable |
3,476 | 3,587 | ||||||
| Sales and beverage taxes payable |
1,581 | 1,971 | ||||||
| Insurance |
1,319 | 1,285 | ||||||
| Income and other taxes payable |
825 | 1,018 | ||||||
| Other accrued expenses |
2,857 | 3,053 | ||||||
| Total |
$ | 23,149 | $ | 31,788 | ||||
6. Joint Ventures
Mexico
On July 1, 2014, the Company entered into a joint venture agreement with S.A. de C.V. , a non-related party, to form JV Churrascaria Mexico, S. de R.L. de C.V. (the “Minajaro JV), (the “Parties”), for the purposes of jointly developing, constructing and operating Brazilian style steakhouses under the “Fogo de Chão” name in certain locations in Mexico. Pursuant to the joint venture agreement, the Company owns 51% of the ownership interests in the joint venture and is entitled to receive 50% of the profits of the joint venture after the Parties recoup their initial contributions. The Company is also entitled to a license fee equal to a percentage of the annual gross revenue of each restaurant developed, constructed or operated by the Minajaro JV.
The Company determined that it is the primary beneficiary of the joint venture since the Company will have the power to direct activities that significantly impact the entity on a day-to-day basis. These activities include, but are not limited to having an affirmative vote over key operating decisions of the joint venture. Upon formation of the joint venture, the Company has the right to receive benefits of the variable interest entity (“VIE”) that could potentially be significant to the VIE, and the Losses/Benefits Criterion, as defined in the joint venture agreement, is satisfied.
The Company’s consolidated financial statements do not include any amounts of revenue or income from operations of its Mexico joint venture, as the construction of restaurants included in the joint venture are currently in process. All losses from the Minajaro JV have been allocated to the Company’s joint venture partner in accordance with the terms of the joint venture agreement. The assets of the consolidated joint venture are restricted for use only by the joint venture and are not available for the Company’s general operations. As of March 29, 2015, all net assets of the Minajaro JV have been contributed and are owned by the Company’s joint venture partner and, as a result, have been allocated to the noncontrolling interest in the Minajaro JV.
F-10
Table of Contents
Fogo de Chão, Inc.
Notes to Unaudited Condensed Consolidated Financial Statements (Continued)
(in thousands, except share and per share amounts)
The following table presents the consolidated assets and liabilities of the Minajaro JV included within the Company’s consolidated balance sheets as of March 29, 2015 and December 28, 2014, respectively:
| March 29, 2015 |
December 28, 2014 |
|||||||
| Prepaid expenses and other current assets |
$ | 161 | $ | 171 | ||||
| Property and equipment, net |
1,840 | 986 | ||||||
| Other assets |
313 | 298 | ||||||
| Total assets |
$ | 2,314 | $ | 1,455 | ||||
| Accounts payable |
$ | 140 | $ | 77 | ||||
| Total liabilities |
140 | 77 | ||||||
| Noncontrolling interest |
2,174 | 1,378 | ||||||
| Total owners’ equity |
2,174 | 1,378 | ||||||
| Total liabilities and owners’ equity |
$ | 2,314 | $ | 1,455 | ||||
Accounts payable as of March 29, 2015 and as of December 28, 2014, respectively, includes $77 due to the Company and is eliminated in consolidation.
Middle East
During the first quarter of Fiscal 2015, a wholly-owned subsidiary of the Company entered into a shareholders agreement with FDC Global Holdings B.V., a non-related party owned by the Enany Group, to form FD Restaurants Ltd., a Cayman Islands exempted company (the “Middle East Venture”) for the purposes of jointly developing, constructing and operating Brazilian style steakhouses under the “Fogo de Chão” name in certain locations in the United Arab Emirates, Qatar, Kuwait, Oman, Bahrain, the Kingdom of Saudi Arabia and Lebanon. Pursuant to the agreement, the Company will own 51% of the ownership interests in the Middle East Venture and will be entitled to receive 50% of the profits of the Middle East Venture after the parties recoup their initial contributions. The Company will be entitled to a license fee equal to a percentage of the annual gross revenue of each restaurant developed, constructed or operated by the Middle East Venture. The Company accounts for its investment in the Middle East Venture under the equity method as it has determined that it does not have a controlling interest in the Middle East Venture since the Company will not have the power to direct activities that significantly impact the Middle East Venture on a day-to-day basis, but does have the ability to exercise significant influence. The Company’s consolidated financial statements do not include any amounts of license fee revenue attributable to the Middle East Venture, as the construction of restaurants included in the joint venture are currently in process. As of March 29, 2015, the Company has no basis in the Middle East Venture as it has not contributed any capital to the entity.
7. Long-Term Debt
Long-term debt consists of the following:
| March 29, 2015 |
December 28, 2014 |
|||||||
| Term Loan A |
$ | 222,864 | $ | 223,434 | ||||
| Term Loan B |
25,000 | 25,000 | ||||||
| 247,864 | 248,434 | |||||||
| Debt discount |
(5,106 | ) | (5,389 | ) | ||||
| Line of credit |
— | — | ||||||
| 242,758 | 243,045 | |||||||
| Less: Current portion of long-term debt |
(4,788 | ) | (4,788 | ) | ||||
| Long-term debt, less current portion |
$ | 237,970 | $ | 238,257 | ||||
F-11
Table of Contents
Fogo de Chão, Inc.
Notes to Unaudited Condensed Consolidated Financial Statements (Continued)
(in thousands, except share and per share amounts)
The Company’s credit facility consists of two term loans (Term Loan A and Term Loan B). Term Loan A principal is due in quarterly installments and bears interest quarterly, at 3-month LIBOR plus a spread of 4.00% with a LIBOR floor value of 1.00%. The maturity date of Term Loan A is July 20, 2019. Term Loan B matures on January 20, 2020 and bears interest at LIBOR plus a spread of 9.50% with a LIBOR floor value of 1.50%.
The revolving line of credit bears interest at a rate of LIBOR plus a spread of 4.00% and has a maturity date of July 20, 2017. Additionally, the Company pays a commitment fee on the unused portion of the revolving line of credit at a rate of 0.50%. Because the Company is not required to make principal payments on any outstanding balance on the revolving line of credit until July 20, 2017, any outstanding balance is reported as non-current in the Company’s consolidated balance sheet as a component of long-term debt.
The Company is required to maintain certain financial covenants as defined in the credit facility agreement. Under the terms of the agreement, various remedies exist for the lender should the terms of the covenants not be met, including changes in interest rates and other fees or charges. The Company was in compliance with these covenants at March 29, 2015 and December 28, 2014.
Under the terms the credit facility agreement, the Company is required to make mandatory prepayments in the event of Excess Cash Flows as defined in the agreement. The Company reclassified $1,938 at December 28, 2014 of long-term debt to current as a result of this provision. The Company is required to make this mandatory prepayment within five business days of filing its debt compliance certificate which is due within 120 days from the end of the Company’s fiscal year end.
The Company’s wholly-owned subsidiary Brasa Holdings is the sole issuer of all of the outstanding debts and revolving line of credit. The credit facility is secured by substantially all assets of Brasa Holdings and its subsidiaries.
As of March 29, 2015, the Company had four letters of credit outstanding for a total of $1,731 and $23,269 of available borrowing capacity under the revolving line of credit.
Debt Issuance Costs
In connection with the issuance of the outstanding long-term debt, the Company incurred debt issuance costs, which are being amortized to interest expense using the effective interest rate method over the term of each related facility. Remaining unamortized debt issuance costs were $905 and $989 at March 29, 2015 and December 28, 2014, respectively. These balances are included in other assets (noncurrent) in the consolidated balance sheets.
Indebtedness Repayment Schedule
At March 29, 2015, the indebtedness (excluding discounts) on outstanding long-term debt is payable as follows:
| 2015 (remaining) |
$ | 4,218 | ||
| 2016 |
2,280 | |||
| 2017 |
2,280 | |||
| 2018 |
2,280 | |||
| 2019 |
211,806 | |||
| 2020 |
25,000 | |||
| Total |
$ | 247,864 |
8. Share-Based Compensation
The Company grants share-based awards pursuant to its 2012 Omnibus Equity Incentive Plan (the “2012 Plan”). As of March 29, 2015, 1,313 shares remained available for future issuance under the 2012 Plan.
F-12
Table of Contents
Fogo de Chão, Inc.
Notes to Unaudited Condensed Consolidated Financial Statements (Continued)
(in thousands, except share and per share amounts)
Stock Options
During the first quarter of Fiscal 2015, the Company granted stock options for the purchase of 91 shares of common stock with an exercise price of $274.54. The fair value of each option on the date of grant was $83.66. These options were fully vested and exercisable immediately upon grant to the individual. As there is no other time, performance or market conditions related to these stock options, the Company recognized the full $8 of compensation expense associated with these awards during the first quarter of Fiscal 2015.
The fair value of the stock option grant was estimated on the date of grant using the Black-Scholes option-pricing model. The following table sets forth the assumptions that the Company used to determine the fair value of the stock options granted, presented on a weighted-average basis:
| Expected term (in years) |
5.5 | |||
| Risk-free interest rate |
1.47 | % | ||
| Volatility |
30 | % | ||
| Dividend yield |
0 | % |
The Company historically has been a private company and lacks company-specific historical and implied volatility information. Therefore, it estimates its expected stock volatility based on the historical volatility of a publicly traded group of peer companies and expects to continue to do so until such time as it has adequate historical data regarding the volatility of its own traded stock price. The expected term of the options represents the estimated period of time until exercise and is based on historical experience of similar options, giving consideration to the contractual terms, vesting schedules and expectations of future employee behavior. The risk-free interest rate is determined by reference to the U.S. Treasury yield curve in effect at the time of grant of the award for time periods approximately equal to the expected term of the award. Expected dividend yield is based on the fact that the Company has never paid cash dividends and does not expect to pay any cash dividends in the foreseeable future.
The Company typically grants stock options to employees in two tranches, each with separate exercise prices. The exercise price for the first tranche is based on the fair value of common stock on the date of grant, and the exercise price of the second tranche is typically 200% of fair value of common stock on the date of grant. These options typically vest upon both (i) the completion of a four or five year vesting period and (ii) the satisfaction of a Liquidity Event, as that term is defined in the stock option award agreement. Under the terms of the option award agreement, a Liquidity Event is defined as the earlier to occur of (i) a change in control transaction or (ii) an initial public offering.
No stock options vested, were forfeited or were exercised during the first quarter of Fiscal 2015.
As of March 29, 2015, options for the purchase of 87,500 shares of common stock that have performance based vesting conditions related to a Liquidity Event were outstanding. Total unrecognized compensation expense associated with these awards as of March 29, 2015 was $7,236. As the completion of a Liquidity Event cannot be considered probable until it occurs, no expense associated with these awards will be recorded until the Liquidity Event occurs.
Restricted Stock
The 2012 Plan provides for the award of restricted common stock. The Company has granted restricted common stock with time-based vesting conditions. Unvested shares of restricted common stock may not be sold or transferred by the holder. These restrictions lapse according to the time-based vesting conditions of each award which is typically between two and four years.
During first quarter of Fiscal 2015, the Company granted 91 shares of restricted stock. There were no forfeitures or vesting of restricted common stock during the first quarter of Fiscal 2015.
F-13
Table of Contents
Fogo de Chão, Inc.
Notes to Unaudited Condensed Consolidated Financial Statements (Continued)
(in thousands, except share and per share amounts)
Share-Based Compensation Expense
The Company recorded share-based compensation expense related to stock options and restricted stock in the following expense categories in its statements of operations and comprehensive income (loss):
| Thirteen Week Periods Ended | ||||||||
| March 29, 2015 |
March 30, 2014 |
|||||||
| Restaurant operating expenses |
$ | 56 | $ | 94 | ||||
| General and administrative |
74 | 95 | ||||||
| Total |
$ | 130 | $ | 189 | ||||
9. Net Income Per Share
Basic net income per share is calculated by dividing net income attributable to Fogo de Chão, Inc. by the weighted-average number of shares of common stock outstanding during each period. Diluted net income per share is calculated by dividing net income attributable to Fogo de Chão, Inc. by the diluted weighted-average shares of common stock outstanding during each period. Potentially dilutive securities include shares of common stock underlying stock options and restricted stock. The following table sets forth the computations of basic and dilutive net income per share:
| Thirteen Week Periods Ended | ||||||||
| March 29, 2015 |
March 30, 2014 |
|||||||
| Net income attributable to Fogo de Chão, Inc. common shareholders |
$ | 4,665 | $ | 2,762 | ||||
| Basic weighted average shares outstanding |
896,679 | 890,439 | ||||||
| Effect of dilutive securities: |
||||||||
| Unvested restricted stock |
10,213 | 11,965 | ||||||
| Stock options |
182 | 101 | ||||||
| Diluted weighted average number of shares outstanding |
907,074 | 902,505 | ||||||
| Basic earnings per share |
$ | 5.20 | $ | 3.10 | ||||
| Diluted earnings per share |
$ | 5.14 | $ | 3.06 | ||||
The Company excluded 87,500 and 82,700 stock options from the computation of diluted earnings per share for the first quarter of Fiscal 2015 and the first quarter of Fiscal 2014, respectively. These options have performance-based vesting conditions related to a Liquidity Event, as that term is defined in the stock option award agreement. Because these stock options do not vest unless the performance-based vesting condition is met, they would only be included in the computation of diluted earnings per share if the performance-based vesting condition had been satisfied or would have been satisfied as of the reporting date. Because the performance-based vesting condition had not been satisfied and would not have been satisfied as of March 29, 2015 or as of March 30, 2014, respectively, they have been excluded from the calculation of diluted earnings per share.
All other potentially dilutive securities have been included in the calculation of diluted earnings per share.
F-14
Table of Contents
Fogo de Chão, Inc.
Notes to Unaudited Condensed Consolidated Financial Statements (Continued)
(in thousands, except share and per share amounts)
10. Interest Expense, net
The components of interest expense, net are as follows:
| Thirteen Week Periods Ended | ||||||||
| March 29, 2015 |
March 30, 2014 |
|||||||
| Interest expense |
$ | 3,959 | $ | 5,004 | ||||
| Capitalized interest |
(31 | ) | (82 | ) | ||||
| Interest income |
(171 | ) | (160 | ) | ||||
| Interest expense, net |
$ | 3,757 | $ | 4,762 | ||||
11. Income Taxes
The Company recognized income tax expense of $1,252 for the first quarter of Fiscal 2015, compared to income tax expense of $965 for the first quarter of Fiscal 2014.
The Company’s effective tax rates were 21.7% and 25.9% for the thirteen week periods ended March 29, 2015 and March 30, 2014, respectively. The decrease in the effective tax rate was primarily due to the release of the valuation allowance of $709 and a $308 discrete tax benefit recognized in the first quarter of Fiscal 2015 related to a true-up of the deferred tax asset on Fiscal 2014 alternative minimum tax credits.
12. Commitments and Contingencies
Lease Commitments
The Company leases its corporate office and various of its restaurant locations under non-cancelable operating leases. These leases have initial lease terms of between ten and twenty years and generally carry renewal options that can extend the term of the leases for an additional five to ten years.
Future minimum lease payments for non-cancelable leases (excluding contingent rental payments) are as follows:
| 2015 (remaining) |
$ | 10,906 | ||
| 2016 |
15,562 | |||
| 2017 |
14,919 | |||
| 2018 |
12,710 | |||
| 2019 |
11,408 | |||
| 2020 |
11,416 | |||
| Thereafter |
64,881 | |||
| Total |
$ | 141,802 |
Litigation
The Company is engaged in ordinary and routine litigation incidental to its business. Management does not anticipate that any amounts that the Company may be required to pay by reason of such litigation will have a materially adverse effect on its financial position or the results of its operations.
13. Segment Reporting
The Company owns and operates full-service, Brazilian steakhouses in the United States and Brazil under the brand name Fogo de Chão. Each restaurant operates with similar types of products and menus, providing a continuous
F-15
Table of Contents
Fogo de Chão, Inc.
Notes to Unaudited Condensed Consolidated Financial Statements (Continued)
(in thousands, except share and per share amounts)
service style, irrespective of location. Sales from external customers are derived principally from food and beverage sales, and the Company does not rely on any major customers as a source of sales. The Company’s joint venture in Mexico is included in the United States for segment reporting purposes as the operations of the joint venture are monitored by the United States segment management.
The following table presents the financial information of the Company’s operating segments for the first quarter of Fiscal 2015 and the first quarter of Fiscal 2014, respectively.
| Thirteen Week Periods Ended | ||||||||
| March 29, 2015 |
March 30, 2014 |
|||||||
| Revenue |
||||||||
| United States |
$ | 54,716 | $ | 49,324 | ||||
| Brazil |
10,243 | 11,993 | ||||||
| Total revenue |
$ | 64,959 | $ | 61,317 | ||||
| Restaurant contribution |
||||||||
| United States |
$ | 17,633 | $ | 15,021 | ||||
| Brazil |
2,888 | 3,038 | ||||||
| Total segment restaurant contribution |
$ | 20,521 | $ | 18,059 | ||||
| Capital expenditures |
||||||||
| United States(a) |
$ | 2,535 | $ | 6,969 | ||||
| Brazil |
1,526 | 515 | ||||||
| Total capital expenditures(b) |
$ | 4,061 | $ | 7,484 | ||||
| (a) | For the first quarter of Fiscal 2015, amount includes $903 attributable to the joint venture in Mexico. For all periods presented, amount excludes capital expenditures attributable to the Company’s corporate office in the United States. |
| (b) | Total capital expenditures includes non-cash capital expenditures included within accounts payable and accrued expenses as of the end of the period. |
The Company’s chief operating decision maker (“CODM”) evaluates segment performance using restaurant contribution, which is not a measure defined by GAAP. Restaurant contribution is a key metric used to evaluate the profitability of incremental sales at the restaurants, to evaluate restaurant performance across periods and to evaluate restaurant financial performance compared with competitors. Restaurant contribution is defined as revenue less restaurant operating costs (which includes food and beverage costs, compensation and benefits costs and occupancy and certain other operating costs but excludes depreciation and amortization expense). Depreciation and amortization expense is excluded because it is not an ongoing controllable cash expense.
The following table sets forth the reconciliation of total segment restaurant contribution to income from operations for the first quarter of Fiscal 2015 and for the first quarter of Fiscal 2014, respectively.
| Thirteen Week Periods Ended | ||||||||
| March 29, 2015 |
March 30, 2014 |
|||||||
| Total segment restaurant contribution |
$ | 20,521 | $ | 18,059 | ||||
| Marketing and advertising costs |
1,402 | 1,442 | ||||||
| General and administrative costs |
5,708 | 4,668 | ||||||
| Pre-opening costs |
1,003 | 788 | ||||||
| Depreciation and amortization |
3,004 | 2,737 | ||||||
| Other operating (income) expense, net |
(113 | ) | (69 | ) | ||||
| Total other operating costs and expenses |
11,004 | 9,566 | ||||||
| Income from operations |
$ | 9,517 | $ | 8,493 | ||||
F-16
Table of Contents
Fogo de Chão, Inc.
Notes to Unaudited Condensed Consolidated Financial Statements (Continued)
(in thousands, except share and per share amounts)
The table below sets forth the property and equipment attributable to each segment as of March 29, 2015 and December 28, 2014, respectively.
| March 29, 2015 |
December 28, 2014 |
|||||||
| Property and equipment, net |
||||||||
| United States(a) |
$ | 101,691 | $ | 101,626 | ||||
| Brazil |
9,768 | 10,832 | ||||||
| Total segment property and equipment, net |
111,459 | 112,458 | ||||||
| Corporate office(b) |
808 | 748 | ||||||
| Total property and equipment, net |
$ | 112,267 | $ | 113,206 | ||||
| (a) | Property and equipment, net at March 29, 2015 and December 28, 2014 includes $1,840 and $986, respectively, attributable to the joint venture in Mexico. |
| (b) | Property and equipment, net attributable to the Company’s corporate office in the United States. |
The table below sets forth total assets as of March 29, 2015 and December 28, 2014, respectively.
| March 29, 2015 |
December 28, 2014 |
|||||||
| Total assets |
||||||||
| United States(a) |
$ | 379,537 | $ | 380,566 | ||||
| Brazil |
80,561 | 96,603 | ||||||
| Total assets |
$ | 460,098 | $ | 477,169 | ||||
| (a) | Total assets at March 29, 2015 and December 28, 2014, includes total assets of $2,314 and $1,455, respectively, attributable to the joint venture in Mexico that may only be used to settle the obligations of the joint venture. For all periods presented, includes assets attributable to the Company’s corporate office in the United States and assets that are not directly attributable to restaurant operations. |
14. Condensed Financial Information for Parent Company
Fogo de Chão, Inc. has no material assets or standalone operations other than its ownership in Brasa Holdings and its subsidiaries.
There are restrictions on Fogo de Chão, Inc.’s ability to obtain funds from any of its subsidiaries through dividends, loans or advances. Accordingly, this condensed financial information has been presented on a “Parent-only” basis. Under a Parent-only presentation, the Fogo de Chão, Inc.’s investments in its consolidated subsidiaries are presented under the equity method of accounting.
F-17
Table of Contents
Fogo de Chão, Inc.
Notes to Unaudited Condensed Consolidated Financial Statements (Continued)
(in thousands, except share and per share amounts)
The following tables present the financial position of Fogo de Chão, Inc. as of March 29, 2015 and December 28, 2014, and the results of its operations for the first quarter of Fiscal 2015 and for the first quarter of Fiscal 2014.
| March 29, 2015 |
December 28, 2014 |
|||||||
| Assets: |
||||||||
| Investments in Brasa (Holdings) Inc. and its subsidiaries |
$ | 143,722 | $ | 154,081 | ||||
| Total assets |
$ | 143,722 | $ | 154,081 | ||||
| Shareholders’ Equity: |
||||||||
| Common stock, $0.01 par value, 1,200,000 shares authorized, 897,184 shares issued and outstanding as of March 29, 2015, and 896,089 shares issued and outstanding as of December 28, 2014 |
$ | 9 | $ | 9 | ||||
| Additional paid-in capital |
176,637 | 176,206 | ||||||
| Retained earnings |
12,251 | 7,586 | ||||||
| Accumulated other comprehensive loss |
(45,175 | ) | (29,720 | ) | ||||
| Total shareholders’ equity |
$ | 143,722 | $ | 154,081 | ||||
| Thirteen Week Periods Ended | ||||||||
| March 29, 2015 |
March 30, 2014 |
|||||||
| Equity in net income of Brasa (Holdings) Inc. and its subsidiaries |
$ | 4,665 | $ | 2,762 | ||||
| Net income attributable to Fogo de Chão, Inc. |
4,665 | 2,762 | ||||||
| Other comprehensive income (loss) |
(15,455 | ) | 3,095 | |||||
| Comprehensive income (loss) |
$ | (10,790 | ) | $ | 5,857 | |||
| Basic earnings per share |
$ | 5.20 | $ | 3.10 | ||||
| Diluted earnings per share |
$ | 5.14 | $ | 3.06 | ||||
| Basic weighted average shares outstanding |
896,679 | 890,439 | ||||||
| Diluted weighted average shares outstanding |
907,074 | 902,505 | ||||||
15. Related-Party Transactions
The Company and its wholly-owned subsidiaries entered into an agreement with an affiliated entity of its private equity fund owners, (“Sponsor”), to provide management, consulting and financial and other advisory services to the Company. The agreement requires the Company to pay Sponsor a non-refundable periodic retainer fee in an amount per year of the greater of $750 or 1.50% of Consolidated EBITDA, as defined in the agreement, for the immediately preceding fiscal year. Under this agreement, the Company recorded $341 of expense attributable to the periodic retainer fees during the first quarter of Fiscal 2015 and $188 during the first quarter of Fiscal 2014, respectively. These amounts are included in general and administrative costs in the consolidated statements of operations and comprehensive income (loss). The Company had an outstanding payable due Sponsor of $153 for retainer fees at March 29, 2015. The Company had an outstanding payable due Sponsor of $8 for reimbursement of expenses at December 28, 2014.
In February 2015, the Company entered into three Director Securities Purchase Agreements pursuant to which the Company issued and sold to three directors each 365 shares of common stock, at a purchase price of $274.54 per share.
16. Subsequent Events
For its condensed consolidated financial statements as of and for the 13-week period ended March 29, 2015, the Company has evaluated subsequent events through May 27, 2015, the date these financial statements were issued.
F-18
Table of Contents
Report of Independent Registered Public Accounting Firm
To the Shareholders of
Fogo de Chão, Inc. and Subsidiaries (Successor):
In our opinion, the accompanying consolidated balance sheets as of December 28, 2014 and December 29, 2013, and the related consolidated statements of operations and comprehensive income (loss), shareholders’ equity, and cash flows for the years ended December 28, 2014 and December 29, 2013 and for the period from May 24, 2012 (inception) to December 30, 2012, present fairly, in all material respects, the financial position of Fogo de Chão, Inc. and subsidiaries at December 28, 2014 and December 29, 2013, and the results of their operations and their cash flows for the years ended December 28, 2014 and December 29, 2013 and for the period from May 24, 2012 (inception) to December 30, 2012 in conformity with accounting principles generally accepted in the United States of America. These financial statements are the responsibility of the Company’s management. Our responsibility is to express an opinion on these financial statements based on our audits. We conducted our audits of these statements in accordance with the standards of the Public Company Accounting Oversight Board (United States). Those standards require that we plan and perform the audit to obtain reasonable assurance about whether the financial statements are free of material misstatement. An audit includes examining, on a test basis, evidence supporting the amounts and disclosures in the financial statements, assessing the accounting principles used and significant estimates made by management, and evaluating the overall financial statement presentation. We believe that our audits provide a reasonable basis for our opinion.
/s/ PricewaterhouseCoopers LLP
Dallas, Texas
April 7, 2015
F-19
Table of Contents
Report of Independent Registered Public Accounting Firm
To the Member of Fogo de Chão
Churrascaria (Holdings) LLC and Subsidiaries (Predecessor):
In our opinion, the accompanying consolidated statements of operations and comprehensive loss, member’s equity, and cash flows for the period from January 2, 2012 to July 20, 2012, present fairly, in all material respects, the results of operations and cash flows of Fogo de Chão Churrascaria (Holdings) LLC and Subsidiaries (Predecessor) for the period from January 2, 2012 to July 20, 2012 in conformity with accounting principles generally accepted in the United States of America. These financial statements are the responsibility of the Company’s management. Our responsibility is to express an opinion on these financial statements based on our audit. We conducted our audit of these statements in accordance with the standards of the Public Company Accounting Oversight Board (United States). Those standards require that we plan and perform the audit to obtain reasonable assurance about whether the financial statements are free of material misstatement. An audit includes examining, on a test basis, evidence supporting the amounts and disclosures in the financial statements, assessing the accounting principles used and significant estimates made by management, and evaluating the overall financial statement presentation. We believe that our audit provides a reasonable basis for our opinion.
/s/ PricewaterhouseCoopers LLP
Dallas, Texas
April 29, 2013, except for the effects of the restatement discussed in Note 2 to the consolidated financial statements, as to which the date is December 19, 2014
F-20
Table of Contents
Fogo de Chão, Inc. (Successor)
(in thousands, except share and par value amounts)
| December 28, 2014 |
December 29, 2013 |
|||||||
| Assets |
||||||||
| Current assets: |
||||||||
| Cash and cash equivalents |
$ | 19,387 | $ | 16,010 | ||||
| Accounts receivable |
10,096 | 11,105 | ||||||
| Inventories |
5,456 | 6,421 | ||||||
| Deferred tax assets |
986 | 1,058 | ||||||
| Prepaid expenses and other current assets |
3,144 | 3,591 | ||||||
| Total current assets |
39,069 | 38,185 | ||||||
| Property and equipment, net |
113,206 | 107,998 | ||||||
| Prepaid rent |
656 | 620 | ||||||
| Goodwill |
220,316 | 227,673 | ||||||
| Intangible assets, net |
100,480 | 104,327 | ||||||
| Other assets |
3,442 | 3,096 | ||||||
| Total assets (a) |
$ | 477,169 | $ | 481,899 | ||||
| Liabilities and Equity |
||||||||
| Current liabilities: |
||||||||
| Accounts payable and accrued expenses |
$ | 31,788 | $ | 38,591 | ||||
| Current portion of long-term debt |
4,788 | 2,077 | ||||||
| Deferred revenue |
4,857 | 5,084 | ||||||
| Total current liabilities |
41,433 | 45,752 | ||||||
| Deferred rent |
10,642 | 8,412 | ||||||
| Long-term debt, less current portion |
238,257 | 250,206 | ||||||
| Deferred tax liabilities |
29,982 | 25,508 | ||||||
| Other noncurrent liabilities |
1,396 | 1,699 | ||||||
| Total liabilities (a) |
321,710 | 331,577 | ||||||
| Commitments and contingencies (Note 11) |
||||||||
| Equity: |
||||||||
| Fogo de Chão, Inc. shareholders’ equity: |
||||||||
| Common stock, $0.01 par value, 1,200,000 shares authorized, 896,089 and 890,439 shares issued and outstanding as of December 28, 2014 and December 29, 2013, respectively |
9 | 9 | ||||||
| Additional paid-in capital |
176,206 | 175,441 | ||||||
| Accumulated earnings (deficit) |
7,586 | (9,969 | ) | |||||
| Accumulated other comprehensive loss |
(29,720 | ) | (15,159 | ) | ||||
| Total Fogo de Chão, Inc. shareholders’ equity |
154,081 | 150,322 | ||||||
| Noncontrolling interests |
1,378 | — | ||||||
| Total equity |
155,459 | 150,322 | ||||||
| Total liabilities and equity |
$ | 477,169 | $ | 481,899 | ||||
| (a) | Consolidated assets as of December 28, 2014 include total assets of $1,455 attributable to a consolidated joint venture that can only be used to settle the obligations of the joint venture. There were no liabilities of the joint venture as of December 28, 2014 (see Note 1). |
The accompanying notes are an integral part of these consolidated financial statements.
F-21
Table of Contents
Fogo de Chão, Inc. (Successor) and Fogo de Chão Churrascaria (Holdings) LLC (Predecessor)
CONSOLIDATED STATEMENTS OF OPERATIONS AND COMPREHENSIVE INCOME (LOSS)
(in thousands, except share and per share amounts)
| Successor | Predecessor | |||||||||||||||
| Fiscal Year Ended |
Period from May 24, 2012 (Inception) to December 30, 2012 |
Period from January 2, 2012 to July 20, 2012 |
||||||||||||||
|
|
December 28, 2014 |
December 29, 2013 |
||||||||||||||
| Revenue |
$ | 262,280 | $ | 219,239 | $ | 93,844 | $ | 108,516 | ||||||||
| Restaurant operating costs: |
||||||||||||||||
| Food and beverage costs |
78,330 | 67,002 | 29,381 | 34,512 | ||||||||||||
| Compensation and benefit costs |
54,673 | 46,860 | 21,125 | 22,348 | ||||||||||||
| Occupancy and other operating expenses (excluding depreciation and amortization) |
44,156 | 36,703 | 15,478 | 18,061 | ||||||||||||
| Total restaurant operating costs |
177,159 | 150,565 | 65,984 | 74,921 | ||||||||||||
| Marketing and advertising costs |
5,585 | 6,188 | 2,342 | 2,488 | ||||||||||||
| General and administrative costs |
21,419 | 18,239 | 8,143 | 10,229 | ||||||||||||
| Pre-opening costs |
1,951 | 4,764 | 1,119 | 1,359 | ||||||||||||
| Acquisition costs |
— | — | 11,988 | 6,963 | ||||||||||||
| Loss on modification/extinguishment of debt |
3,090 | 6,875 | — | 7,762 | ||||||||||||
| Depreciation and amortization |
11,638 | 8,989 | 3,736 | 5,114 | ||||||||||||
| Other operating (income) expense, net |
46 | (371 | ) | (169 | ) | (157 | ) | |||||||||
| Total costs and expenses |
220,888 | 195,249 | 93,143 | 108,679 | ||||||||||||
| Income (loss) from operations |
41,392 | 23,990 | 701 | (163 | ) | |||||||||||
| Other income (expense): |
||||||||||||||||
| Interest expense, net |
(17,121 | ) | (22,354 | ) | (10,908 | ) | (7,359 | ) | ||||||||
| Other income (expense), net |
(7 | ) | (101 | ) | (20 | ) | (68 | ) | ||||||||
| Total other income (expense), net |
(17,128 | ) | (22,455 | ) | (10,928 | ) | (7,427 | ) | ||||||||
| Income (loss) before income taxes |
24,264 | 1,535 | (10,227 | ) | (7,590 | ) | ||||||||||
| Income tax expense (benefit) |
6,991 | 2,472 | (1,195 | ) | 1,294 | |||||||||||
| Net income (loss) |
17,273 | (937 | ) | (9,032 | ) | (8,884 | ) | |||||||||
| Less: Loss attributable to noncontrolling interest |
(282 | ) | — | — | — | |||||||||||
| Net income (loss) attributable to Fogo de Chão, Inc. |
$ | 17,555 | $ | (937 | ) | $ | (9,032 | ) | $ | (8,884 | ) | |||||
| Net income (loss) |
$ | 17,273 | $ | (937 | ) | $ | (9,032 | ) | $ | (8,884 | ) | |||||
| Other comprehensive income (loss): |
||||||||||||||||
| Translation effect on unremitted earnings |
393 | 8 | 168 | — | ||||||||||||
| Currency translation adjustment |
(15,075 | ) | (14,396 | ) | (939 | ) | (4,064 | ) | ||||||||
| Total other comprehensive loss |
$ | (14,682 | ) | $ | (14,388 | ) | $ | (771 | ) | $ | (4,064 | ) | ||||
| Comprehensive income (loss) |
2,591 | (15,325 | ) | (9,803 | ) | (12,948 | ) | |||||||||
| Less: Comprehensive loss attributable to noncontrolling interest |
(403 | ) | — | — | — | |||||||||||
| Comprehensive income (loss) attributable to |
$ | 2,994 | $ | (15,325 | ) | $ | (9,803 | ) | $ | (12,948 | ) | |||||
| Earnings (loss) per common share attributable to Fogo de Chão, Inc.: |
||||||||||||||||
| Basic |
$ | 19.69 | $ | (1.06 | ) | $ | (10.21 | ) | ||||||||
| Diluted |
$ | 19.42 | $ | (1.06 | ) | $ | (10.21 | ) | ||||||||
| Weighted average common shares outstanding: |
||||||||||||||||
| Basic |
891,523 | 885,940 | 884,850 | |||||||||||||
| Diluted |
904,067 | 885,940 | 884,850 | |||||||||||||
The accompanying notes are an integral part of these consolidated financial statements.
F-22
Table of Contents
Fogo de Chão, Inc. (Successor) and Fogo de Chão Churrascaria (Holdings) LLC (Predecessor)
CONSOLIDATED STATEMENTS OF SHAREHOLDERS’ EQUITY (SUCCESSOR)
CONSOLIDATED STATEMENT OF MEMBER’S EQUITY (PREDECESSOR)
(in thousands, except share amounts)
| Predecessor Company | ||||||||||||||||||||||||||||||||
| Member’s Equity |
Accumulated Deficit |
Accumulated Other Comprehensive Loss |
Total Member’s Equity |
|||||||||||||||||||||||||||||
| January 2, 2012 |
$ | 94,997 | $ | 7,752 | $ | (11,450 | ) | $ | 91,299 | |||||||||||||||||||||||
| Net loss |
— | (8,884 | ) | — | (8,884 | ) | ||||||||||||||||||||||||||
| Currency translation adjustment |
— | — | (4,064 | ) | (4,064 | ) | ||||||||||||||||||||||||||
| Contribution of capital |
— | 732 | 732 | |||||||||||||||||||||||||||||
| July 20, 2012 |
$ | 94,997 | $ | (400 | ) | $ | (15,514 | ) | $ | 79,083 | ||||||||||||||||||||||
| Successor Company | ||||||||||||||||||||||||||||||||
| Common Stock | Additional Paid-In Capital |
Accumulated (Deficit) Earnings |
Accumulated Other Comprehensive Loss |
Fogo de Chão, Inc. |
Noncontrolling Interests |
Total Equity |
||||||||||||||||||||||||||
| Shares | Amount | |||||||||||||||||||||||||||||||
| May 24, 2012 (Inception) |
— | $ | — | $ | — | $ | — | $ | — | $ | — | $ | — | $ | — | |||||||||||||||||
| Contribution |
884,850 | 9 | 172,041 | — | — | 172,050 | — | 172,050 | ||||||||||||||||||||||||
| Non-cash consideration, 2012 Acquisition |
— | — | 1,395 | — | — | 1,395 | — | 1,395 | ||||||||||||||||||||||||
| Net loss |
— | — | — | (9,032 | ) | — | (9,032 | ) | — | (9,032 | ) | |||||||||||||||||||||
| Share-based compensation |
— | — | 641 | — | — | 641 | — | 641 | ||||||||||||||||||||||||
| Currency translation adjustment on unremitted earnings |
— | — | — | — | 168 | 168 | — | 168 | ||||||||||||||||||||||||
| Currency translation adjustment, net of tax benefit of $575 |
— | — | — | — | (939 | ) | (939 | ) | — | (939 | ) | |||||||||||||||||||||
| December 30, 2012 |
884,850 | $ | 9 | $ | 174,077 | $ | (9,032 | ) | $ | (771 | ) | $ | 164,283 | $ | — | $ | 164,283 | |||||||||||||||
| Net loss |
— | — | — | (937 | ) | — | (937 | ) | — | (937 | ) | |||||||||||||||||||||
| Restricted shares vested |
5,589 | — | — | — | — | — | — | — | ||||||||||||||||||||||||
| Share-based compensation |
— | — | 1,364 | — | — | 1,364 | — | 1,364 | ||||||||||||||||||||||||
| Currency translation adjustment on unremitted earnings |
— | — | — | — | 8 | 8 | — | 8 | ||||||||||||||||||||||||
| Currency translation adjustment, net of tax benefit of |
— | — | — | — | (14,396 | ) | (14,396 | ) | — | (14,396 | ) | |||||||||||||||||||||
| December 29, 2013 |
890,439 | $ | 9 | $ | 175,441 | $ | (9,969 | ) | $ | (15,159 | ) | $ | 150,322 | $ | — | $ | 150,322 | |||||||||||||||
| Net income (loss) |
— | — | — | 17,555 | — | 17,555 | (282 | ) | 17,273 | |||||||||||||||||||||||
| Restricted shares vested |
5,650 | — | — | — | — | — | — | — | ||||||||||||||||||||||||
| Share-based compensation |
— | — | 765 | — | — | 765 | — | 765 | ||||||||||||||||||||||||
| Currency translation adjustment on unremitted earnings |
— | — | — | — | 393 | 393 | — | 393 | ||||||||||||||||||||||||
| Currency translation adjustment, net of tax benefit of |
— | — | — | — | (14,954 | ) | (14,954 | ) | (121 | ) | (15,075 | ) | ||||||||||||||||||||
| Contribution from noncontrolling interests |
— | — | — | — | — | — | 1,781 | 1,781 | ||||||||||||||||||||||||
| December 28, 2014 |
896,089 | $ | 9 | $ | 176,206 | $ | 7,586 | $ | (29,720 | ) | $ | 154,081 | $ | 1,378 | $ | 155,459 | ||||||||||||||||
The accompanying notes are an integral part of these consolidated financial statements.
F-23
Table of Contents
Fogo de Chão, Inc. (Successor) and Fogo de Chão Churrascaria (Holdings) LLC (Predecessor)
CONSOLIDATED STATEMENTS OF CASH FLOWS
(in thousands)
| Successor | Predecessor | |||||||||||||||
| Fiscal Year Ended | Period from May 24, 2012 (Inception) to December 30, 2012 |
Period from January 2, 2012 to July 20 2012 |
||||||||||||||
| December 28, 2014 | December 29, 2013 | |||||||||||||||
| Cash flows from operating activities: |
||||||||||||||||
| Net income (loss) |
$ | 17,273 | $ | (937 | ) | $ | (9,032 | ) | $ | (8,884 | ) | |||||
| Adjustments to reconcile net income (loss) to net cash flows provided by (used in) operating activities: |
||||||||||||||||
| Depreciation and amortization of property and equipment |
11,349 | 8,693 | 3,611 | 4,790 | ||||||||||||
| Amortization of definite-lived intangibles |
289 | 296 | 125 | 324 | ||||||||||||
| Amortization of favorable/unfavorable leases |
(153 | ) | (180 | ) | (74 | ) | — | |||||||||
| Amortization of debt issuance costs |
341 | 1,101 | 184 | 813 | ||||||||||||
| Amortization of original issue discount |
1,232 | 1,342 | 1,053 | 221 | ||||||||||||
| Loss on debt modification/extinguishment |
3,090 | 6,875 | — | 7,762 | ||||||||||||
| Deferred income tax |
4,364 | 185 | (2,215 | ) | — | |||||||||||
| Share-based compensation expense |
765 | 1,364 | 641 | 4,070 | ||||||||||||
| Settlement of SARs awards |
— | — | — | (8,722 | ) | |||||||||||
| Loss on disposal of property and equipment |
44 | — | — | — | ||||||||||||
| Change in operating assets and liabilities: |
||||||||||||||||
| Accounts and other receivable |
175 | (1,275 | ) | (5,659 | ) | 3,805 | ||||||||||
| Prepaid expenses and other assets |
247 | (548 | ) | 1,483 | (2,231 | ) | ||||||||||
| Inventories |
575 | (728 | ) | (489 | ) | 130 | ||||||||||
| Accounts payable and accrued expenses |
(6,487 | ) | 4,675 | 5,503 | 5,222 | |||||||||||
| Accrued interest |
(861 | ) | 4,332 | 116 | — | |||||||||||
| Deferred revenue |
(187 | ) | 614 | 885 | (416 | ) | ||||||||||
| Deferred rent and tenant allowance |
1,997 | 6,531 | 1,956 | 791 | ||||||||||||
| Net cash flows provided by (used in) operating activities |
34,053 | 32,340 | (1,912 | ) | 7,675 | |||||||||||
| Cash flows from investing activities: |
||||||||||||||||
| Acquisition of Predecessor, net of cash acquired |
— | — | (387,099 | ) | — | |||||||||||
| Payment of escrow funds from 2012 Acquisition |
— | — | (1,400 | ) | — | |||||||||||
| Receipt of escrow funds from 2012 Acquisition |
— | 1,400 | — | — | ||||||||||||
| Capital expenditures |
(17,448 | ) | (30,944 | ) | (7,883 | ) | (8,908 | ) | ||||||||
| Net cash flows used in investing activities |
(17,448 | ) | (29,544 | ) | (396,382 | ) | (8,908 | ) | ||||||||
| Cash flows from financing activities: |
||||||||||||||||
| Capital contributions |
— | — | 172,050 | 732 | ||||||||||||
| Proceeds from term loan, net of discount |
224,574 | 116,205 | 235,933 | — | ||||||||||||
| Payment of debt issuance costs |
(784 | ) | (113 | ) | (2,315 | ) | — | |||||||||
| Repayment on term loans, credit facility |
(226,752 | ) | (119,455 | ) | (456 | ) | (4,875 | ) | ||||||||
| Proceeds from Successor to payoff credit facility |
— | — | — | 187,688 | ||||||||||||
| Payoff credit facility |
— | — | — | (187,688 | ) | |||||||||||
| Repayment on revolver |
(17,500 | ) | (2,716 | ) | — | — | ||||||||||
| Borrowings on revolver |
7,000 | 10,500 | 2,716 | — | ||||||||||||
| Payment of deferred initial public offering costs |
(284 | ) | — | — | — | |||||||||||
| Contribution from noncontrolling interest |
1,781 | — | — | — | ||||||||||||
| Net cash flows provided by (used in) financing activities |
(11,965 | ) | 4,421 | 407,928 | (4,143 | ) | ||||||||||
| Effect of foreign exchange rates on cash and cash equivalents |
(1,263 | ) | (789 | ) | (52 | ) | (308 | ) | ||||||||
| Net increase (decrease) in cash and cash equivalents |
3,377 | 6,428 | 9,582 | (5,684 | ) | |||||||||||
| Cash and cash equivalents at beginning of period |
16,010 | 9,582 | — | 13,344 | ||||||||||||
| Cash and cash equivalents at end of period |
$ | 19,387 | $ | 16,010 | $ | 9,582 | $ | 7,660 | ||||||||
| Supplemental disclosure of cash flow information: |
||||||||||||||||
| Cash paid during the year: |
||||||||||||||||
| Interest |
$ | 16,665 | $ | 16,672 | $ | 9,760 | $ | 6,773 | ||||||||
| Income taxes, net of refunds |
$ | 2,423 | $ | 1,947 | $ | 432 | $ | 2,015 | ||||||||
| Non-cash activities: |
||||||||||||||||
| Capital expenditures included in accounts payable and accrued expenses |
$ | 956 | $ | 7,981 | $ | — | $ | — | ||||||||
| Deferred initial public offering costs included in accounts payable and accrued expenses |
$ | 757 | $ | — | $ | — | $ | — | ||||||||
| Acquisition of Predecessor, non-cash consideration |
$ | — | $ | — | $ | 1,395 | $ | — | ||||||||
The accompanying notes are an integral part of these consolidated financial statements.
F-24
Table of Contents
Fogo de Chão, Inc.
Notes to Consolidated Financial Statements
(in thousands, except share and per share amounts)
1. Description of Business
Fogo de Chão, Inc. and subsidiaries (“Successor” and the “Company”) operates upscale Brazilian churrascaria steakhouses under the brand of Fogo de Chão. The Company was incorporated under the name Brasa (Parent) Inc. (“Brasa Parent”) on May 24, 2012 (Inception) in connection with the acquisition on July 21, 2012 of Fogo de Chão Churrascaria (Holdings) LLC, a Delaware limited liability company, and its parent company, FC Holdings, Inc., a Cayman Islands exempt company (“Predecessor”), by a collaborative group consisting of funds affiliated with Thomas H. Lee Partners, L.P. (“THL”) and other minority investors, which, together with THL, are referred to as the “THL Funds,” (the “2012 Acquisition”). On December 17, 2014, the Company changed its name from Brasa (Parent) Inc. to Fogo de Chão, Inc. As of December 28, 2014, the Company operated, through its subsidiaries, 25 restaurants in the United States and 9 restaurants located in Brazil.
Fogo de Chão, Inc. is a holding company with no assets or operations of its own. The Company owns 100% of Brasa (Purchaser) Inc. (“Brasa Purchaser”), which owns 100% of Brasa (Holdings) Inc. (“Brasa Holdings”). Brasa Holdings owns 100% of Fogo de Chão (Holdings) Inc. (“Fogo Holdings”), which owns the Company’s domestic and foreign operating subsidiaries.
The Company, Brasa Purchaser, Brasa Holdings, Brasa Merger Sub Inc. and Fogo Holdings were formed during 2012 for the purpose of effecting the 2012 Acquisition, which was consummated on July 21, 2012. Immediately prior to the 2012 Acquisition, (i) FC Holdings Inc. contributed all of its ownership interests in the Predecessor to Fogo Holdings, (ii) the Predecessor was merged with Fogo Holdings, which was the surviving corporation, and (iii) FC Holdings Inc. was domesticated into Brasa Holdings by continuation out of the Cayman Islands into the state of Delaware. Promptly thereafter, Brasa Parent acquired Brasa Holdings through a reverse subsidiary merger of its subsidiary, Brasa Merger Sub Inc., with Brasa Holdings, which was the surviving corporation. The 2012 Acquisition was financed by loans to Brasa Holdings and equity contributions by the THL Funds.
2012 Acquisition
On July 21, 2012, the Company acquired, through its wholly-owned subsidiary, Brasa Holdings, the Predecessor from FC Holdings Inc. for an aggregate consideration of $388,494, including non-cash consideration of $1,395 related to the exchange of share-based awards (Note 8). This transaction was financed by third-party loans to Brasa Holdings and equity contributions by the THL Funds. The 2012 Acquisition was accounted for as a business combination under the acquisition method of accounting. Accordingly, the assets acquired and liabilities assumed were recorded at fair value with the remaining purchase price recorded as goodwill.
The Company estimated the fair value of the assets acquired and liabilities assumed as part of the business combination, including working capital, property and equipment, primarily related to restaurant operations, and intangible assets. Intangible assets acquired in the 2012 Acquisition include $107,300 attributable to the Fogo de Chão trade name and $1,500 for various non-compete arrangements. The trade name was determined to have an indefinite life and is not being amortized. The non-compete arrangements are being amortized over 5 years, the life of the non-compete agreements.
The fair value of the trade name was estimated using an income approach, specifically known as the relief from royalty method. The relief from royalty method calculates the approximate royalty saved that is attributable to the sale of products and services using the trade names. The forecasted revenue expected to be generated under the trade name were based on the projected revenue of the Successor.
The fair value of the non-compete agreements was determined using a variation of the income approach known as the with-and-without method. The income approach estimates value based on the net economic benefit (i.e., net operating income or cash flows) to be received over the life of the asset, discounted to present value. The measurement is based on the value indicated by current market expectations about those future amounts. Weighted average amortization period for the non-compete agreements is 5 years.
F-25
Table of Contents
Fogo de Chão, Inc.
Notes to Consolidated Financial Statements (Continued)
(in thousands, except share and per share amounts)
In connection with the 2012 Acquisition, the Company recognized at fair value both favorable lease assets and unfavorable lease liabilities, representing the difference between the market rates in effect for acquired leases compared to the various lease payments on individual operating leases. These assets and liabilities are amortized to rent expense on a straight-line basis over each respective operating lease term. The weighted average amortization period for the favorable lease assets is 5.2 years, and for the unfavorable lease liabilities is 7.9 years.
The following summarizes the fair value of the assets acquired and liabilities assumed, net of cash acquired, at July 21, 2012:
| Assets |
||||
| Accounts receivable |
$ | 5,129 | ||
| Prepaid expenses and inventory |
9,665 | |||
| Other assets |
2,294 | |||
| Deferred tax assets |
724 | |||
| Property and equipment |
75,329 | |||
| Favorable lease assets |
738 | |||
| Intangible assets |
108,800 | |||
| Goodwill |
236,019 | |||
| Total assets acquired |
438,698 | |||
| Liabilities |
||||
| Accounts payable |
6,599 | |||
| Accrued expenses |
9,603 | |||
| Deferred tax liabilities |
27,947 | |||
| Unfavorable lease liabilities |
2,128 | |||
| Deferred revenue |
3,568 | |||
| Other liabilities |
359 | |||
| Net assets acquired |
$ | 388,494 |
The excess of purchase price over the fair value amounts assigned to the assets acquired and liabilities assumed represents the goodwill amount resulting from the acquisition. The goodwill attributable to the acquisition has been recorded as a noncurrent asset and is not amortized, but is subject to review on at least an annual basis for impairment. The factors that contributed to the recognition of goodwill included the future expected cash flows and the acquisition of a talented workforce trained in providing customers with a churrascaria experience. The Company identified two reporting units for the allocation of goodwill: Brazil and the United States. The acquisition date goodwill assigned to the Company’s Brazil and United States reporting units was $62,663 and $173,356, respectively.
Subsequent to the 2012 Acquisition, the Company adjusted the purchase price allocation and was refunded $1,400 in escrow within twelve months of the acquisition date and in accordance with the purchase agreement. The amount received from escrow is excluded from consideration transferred in the table above. The adjustment did not have any impact in the statement of operations.
In connection with the 2012 Acquisition, the Successor incurred $11,988 of acquisition-related costs. These expenses are included in acquisition costs in the Company’s consolidated statement of operations and comprehensive loss for the period from May 24, 2012 to December 30, 2012 (successor period).
The Predecessor incurred $6,963 of costs related to the acquisition. These costs are included in acquisition costs in the Predecessor’s financial statements for the period from January 2, 2012 to July 20, 2012 (predecessor period).
F-26
Table of Contents
Fogo de Chão, Inc.
Notes to Consolidated Financial Statements (Continued)
(in thousands, except share and per share amounts)
Pro Forma Presentation (unaudited)
The following pro forma financial information summarizes the combined results of operations for the Company as though the 2012 Acquisition occurred on January 2, 2012.
| Fiscal Year Ended December 30, 2012 |
||||
| Revenue |
$ | 202,360 | ||
| Net loss |
$ | (19,968 | ) | |
The pro forma financial information for the fiscal year ended December 30, 2012 gives effect to the 2012 Acquisition as if it had occurred on January 2, 2012. Pro forma net loss includes nonrecurring charges related to the loss on the extinguishment of debt, acquisition-related costs and the settlement of certain share-based awards in connection with the 2012 Acquisition of $7,762, $18,951 and $3,863, respectively, which are not expected to have a continuing impact on the Company’s financial results. The pro forma financial information is presented for informational purposes only and may not be indicative of results that would have been achieved if the 2012 Acquisition had taken place on January 2, 2012.
Joint-Venture
On July 1, 2014, the Company entered into a joint venture agreement with S.A. de C.V. , a non-related party, to form JV Churrascaria Mexico, S. de R.L. de C.V. (the “Minajaro JV), (the “Parties”), for the purposes of jointly developing, constructing and operating Brazilian style steakhouses under the “Fogo de Chão” name in certain locations in Mexico. Pursuant to the joint venture agreement, the Company owns 51% of the ownership interests in the joint venture and is entitled to receive 50% of the profits of the joint venture after the Parties recoup their initial contributions. The Company is also entitled to a license fee equal to a percentage of the annual gross revenue of each restaurant developed, constructed or operated by the Minajaro JV.
The Company determined that it is the primary beneficiary of the joint venture since the Company will have the power to direct activities that significantly impact the entity on a day-to-day basis. These activities include, but are not limited to having an affirmative vote over key operating decisions of the joint venture. Upon formation of the joint venture, the Company has the right to receive benefits of the variable interest entity (“VIE”) that could potentially be significant to the VIE, and the Losses/Benefits Criterion, as defined in the joint venture agreement, is satisfied.
For the period ended December 28, 2014, the Company’s consolidated financial statements do not include any amounts of revenue or income from operations of its Mexico joint venture, as the construction of restaurants included in the joint venture are currently in process. All losses from the Minajaro JV have been allocated to the Company’s joint venture partner in accordance with the terms of the joint venture agreement. The assets of the consolidated joint venture are restricted for use only by the joint venture and are not available for the Company’s general operations. As of December 28, 2014, all net assets of the Minajaro JV have been contributed and are owned by the Company’s joint venture partner and, as a result, have been allocated to the noncontrolling interest in the Minajaro JV.
F-27
Table of Contents
Fogo de Chão, Inc.
Notes to Consolidated Financial Statements (Continued)
(in thousands, except share and per share amounts)
The following table presents the consolidated assets and liabilities of the Minajaro JV included within the Company’s consolidated balance sheet as of December 28, 2014:
| December 28, 2014 |
||||
| Prepaid expenses and other current assets |
$ | 171 | ||
| Property and equipment, net |
986 | |||
| Other assets |
298 | |||
| Total assets |
$ | 1,455 | ||
| Accounts payable |
$ | 77 | ||
| Total liabilities |
77 | |||
| Noncontrolling interest |
1,378 | |||
| Total owners’ equity |
1,378 | |||
| Total liabilities and owners’ equity |
$ | 1,455 | ||
Accounts payable of $77 is due to the Company and is eliminated in consolidation.
2. Summary of Significant Accounting Policies
Basis of Presentation
The consolidated financial statements subsequent to the 2012 Acquisition represent the financial information of Fogo de Chão, Inc. and its subsidiaries, as well as consolidated joint ventures for which the Company has determined that it is the primary beneficiary, and are labelled as Successor. The consolidated financial statements for all periods prior to, and including, July 20, 2012, represents the financial information of Fogo de Chão Churrascaria (Holdings) LLC and its subsidiaries and are labelled as Predecessor. Due to the change in the basis of accounting resulting from the 2012 Acquisition, the Predecessor’s consolidated financial statements and the Successor’s consolidated financial statements are not necessarily comparable. All financial statements and related information within these financial statements relates to the Successor Company unless otherwise indicated.
The financial statements have been prepared in conformity with generally accepted accounting principles in the United States of America (“GAAP”).
Principles of Consolidation
The accompanying consolidated financial statements include the assets, liabilities and results of operations of the Company and its subsidiaries, as well as consolidated joint ventures for which the Company has determined that it is the primary beneficiary. All intercompany balances and transactions have been eliminated in the consolidated financial statements.
Variable Interest Entities (“VIEs”)
The Company consolidates VIEs in which the Company is deemed to have a controlling interest as a result of the Company having both the power to direct the activities that significantly impact the entity’s economic performance and the right to receive the benefits that could potentially be significant to the VIE. If the Company has a controlling interest in a VIE, the assets, liabilities, and results of the operations of the variable interest entity are included in the consolidated financial statements.
F-28
Table of Contents
Fogo de Chão, Inc.
Notes to Consolidated Financial Statements (Continued)
(in thousands, except share and per share amounts)
Accounting Year
The Company uses a 52/53 week fiscal year convention whereby its fiscal year ends each year on the Sunday that is closest to December 31 of that year. Each fiscal year generally is comprised of four 13-week fiscal quarters, although in the years with 53 weeks the fourth quarter represents a 14-week period. Fiscal years 2014 and 2013 each included 52 weeks of operations. The period from May 24, 2012 through December 30, 2012 (successor period) included 31 weeks of operations, including 23 operating weeks subsequent to the 2012 Acquisition. The period from January 2, 2012 through July 20, 2012 (predecessor period) included 29 weeks of operations. Acquisition related transactions, including acquisition costs incurred by the Successor Company, are recorded in the successor period. Fiscal year 2015 will include 53 weeks of operations.
Use of Estimates
The preparation of financial statements in conformity with GAAP requires management to make estimates and assumptions, such as the valuation of long-lived, definite and indefinite-lived assets, estimated useful lives of assets, the reasonably assured lease terms of operating leases, valuation of the workers’ compensation and Company sponsored employee health insurance program liabilities, the fair value of share-based compensation, and deferred tax valuation allowances, that affect the reported amounts of assets and liabilities and disclosure of contingent assets and liabilities at the date of the financial statements and the reported amounts of revenue and expenses during the reporting period. Actual results could differ from those estimates.
Cash and Cash Equivalents
The Company considers all highly liquid investment instruments purchased with an original maturity of three months or less to be cash equivalents. Cash consists of deposits held at major banks that at times exceed federally insured limits or in international jurisdictions where either insurance is not provided or in amounts that exceed amounts guaranteed by the local government or other governmental agencies, and cash on hand in restaurant locations. The Company also maintains certificates of deposit denominated in Brazilian reais, which throughout their terms can be put to the issuer within three months or less from the date of issuance, and with no early withdrawal penalty charges, are considered cash equivalents. The Company has not incurred losses related to any deposits in excess of the FDIC insurance amount and believes no significant concentration of credit risk exists with respect to cash investments. Financial instruments, which potentially subject the Company to concentrations of credit risk, consist of cash and cash equivalents. Management periodically evaluates the credit worthiness of financial institutions, and maintains cash and cash equivalent accounts only with major financial institutions thereby minimizing exposure for deposits in excess of federally insured amounts. Management believes that credit risk associated with cash and cash equivalents is remote.
Accounts Receivable
Accounts receivable consist of balances receivable from credit card companies in the normal course of business and generally are liquidated within 30 days or less. As such, no allowance for doubtful accounts is considered to be necessary.
Inventories
Inventories consists of food and beverages and are recorded at the lower of cost or market. Cost is determined by the first-in first-out method. Any unusable or spoiled inventory is written off when identified.
F-29
Table of Contents
Fogo de Chão, Inc.
Notes to Consolidated Financial Statements (Continued)
(in thousands, except share and per share amounts)
Prepaid Rent
Non-current prepaid rent consists of amounts paid in advance relating to restaurant leases executed in Brazil during 2007 and 2010 that expire in 2017 and 2020, respectively, and amounts attributable to the restaurant lease in Mexico, which was entered into in 2014 and expires in 2019. The current portion of prepaid rent is included in prepaid expenses and other current assets in the consolidated balance sheets.
Property and Equipment, Net
Property and equipment is stated at cost to acquire less accumulated depreciation. Depreciation is calculated using the straight-line method over the estimated useful lives of the related assets. Leasehold improvements are amortized using the straight-line method over the shorter of the lease term or the estimated useful life of the asset.
Estimated useful lives are generally as follows:
| Buildings |
40 years | |||
| Leasehold improvements |
5 – 25 years | |||
| Furniture, fixtures and equipment |
3 – 15 years | |||
| Automobiles |
5 years |
Expenditures for maintenance, repairs and betterments that do not enhance the value or increase the estimated useful life of the assets are expensed as incurred and included in restaurant operating costs. Expenditures for betterments and major renewals that significantly enhance the value and increase the estimated useful life of the assets are capitalized. The cost of assets sold or retired and the related amounts of accumulated depreciation are eliminated from the accounts in the year of disposal and the resulting gains or losses are included in operations.
Capitalized Interest
Direct and certain related indirect costs of construction, including interest, are capitalized in conjunction with construction and development projects. These costs are included in property and equipment and are amortized over the life of the related building and leasehold interest. The Company capitalized interest of $158, $585, $106 and $200 during the fiscal years ended December 28, 2014 and December 29, 2013, during the period from May 24, 2012 to December 30, 2012 (successor period), and during the period from January 2, 2012 to July 20, 2012 (predecessor period), respectively.
Deferred Initial Public Offering Costs
Deferred initial public offering costs, which primarily consist of direct, incremental legal, accounting and other professional fees relating to the initial public offering (“IPO”), are included in other assets (noncurrent) in the consolidated balance sheet. These deferred costs will be offset against the IPO proceeds upon the consummation of the offering. In the event the offering is terminated, deferred offering costs will be expensed. As of December 28, 2014, the Company deferred $1,041of IPO related costs.
Debt Issuance Costs
Debt issuance costs are amortized to interest expense over the term of the debt using the effective interest method for term debt and the straight-line method for revolving debt over the terms of the related instruments. Unamortized debt issuance costs are included in other assets (noncurrent) in the consolidated balance sheets.
F-30
Table of Contents
Fogo de Chão, Inc.
Notes to Consolidated Financial Statements (Continued)
(in thousands, except share and per share amounts)
Impairment of Long-Lived Assets
The Company reviews property and equipment and definite-lived intangible assets for impairment when events or circumstances indicate these assets may not be recoverable. Factors considered include, significant underperformance relative to expected historical or projected future operating results, significant changes in the manner of use of the acquired assets or the strategy for the overall business and significant negative industry or economic trends. The recoverability is assessed by comparing the carrying value of the asset to the undiscounted cash flows expected to be generated by the asset. If impairment exists, the amount of impairment is measured as the excess of the carrying amount over the estimated fair value, as determined by each location’s projected future discounted cash flows. This assessment process requires the use of estimates and assumptions regarding future cash flows and estimated useful lives, which are subject to a significant degree of judgment. If these assumptions change in the future, the Company may be required to record impairment charges for these assets. The Company did not record any impairment related to long-lived assets in any of the periods presented.
Goodwill
Goodwill represents the excess of the purchase price of the acquired business over the fair value of the assets acquired and liabilities assumed resulting from the acquisition. Goodwill is not amortized. Goodwill is tested annually for impairment during the fourth quarter, or more frequently should an event occur or circumstances indicate that the carrying amount may be impaired. Such events or circumstances may be a significant change in business climate, economic and industry trends, legal factors, negative operating performance indicators, significant competition, changes in strategy or disposition of a reporting unit or a portion thereof. The Company has identified two reporting units, Brazil and the United States, based on the geography of the Company’s operations to which goodwill is attributable.
The impairment evaluation for goodwill is conducted annually using a two-step process. In the first step, the fair value of each reporting unit is compared with the carrying amount of the reporting unit, including goodwill. The estimated fair value of the reporting unit is determined on the basis of discounted future cash flows. If the estimated fair value of the reporting unit is less than the carrying amount of the reporting unit, then a second step must be completed in order to determine the amount of the goodwill impairment that should be recorded. In the second step, the implied fair value of the reporting unit’s goodwill is determined by allocating the reporting unit’s fair value to all of its assets and liabilities other than goodwill in a manner similar to a purchase price allocation. The resulting implied fair value of the goodwill that results from the application of this second step is then compared to the carrying amount of the goodwill and an impairment charge is recorded for any excess or carrying value over fair value. No impairment to goodwill was recorded during any of the periods presented.
Intangible Assets
Indefinite-lived intangible assets are not amortized, but are tested for impairment annually during the fourth quarter, or more frequently if circumstances indicate potential impairment, through a comparison of fair value to its carrying amount. The estimated fair value is determined on the basis of discounted future cash flows. If the estimated fair value is less than the carrying amount of the indefinite-lived intangible asset, then an impairment charge is recorded to reduce the asset to its estimated fair value. The indefinite-lived intangible assets relate to the assigned value of the Fogo de Chão trade name.
Definite-lived intangible assets consist of non-compete agreements. The non-compete agreements are amortized over 5 years, which is the term of the agreements, and are measured for impairment when events or circumstances indicate the carrying value may be impaired in the same manner as long-lived assets.
The Company did not record any impairment related to intangible assets in any of the periods presented.
F-31
Table of Contents
Fogo de Chão, Inc.
Notes to Consolidated Financial Statements (Continued)
(in thousands, except share and per share amounts)
Fair Value
Fair value is defined as the price that would be received to sell an asset or price paid to transfer a liability in an orderly transaction between market participants at the measurement date. Authoritative guidance for fair value measurements establishes a hierarchy that prioritizes the inputs to valuation models based upon the degree to which they are observable. The three levels of the fair value measurement hierarchy are as follows:
Level 1: Inputs represent quoted prices in active markets for identical assets or liabilities at the measurement date.
Level 2: Inputs (other than quoted prices included in Level 1) that are either directly or indirectly observable for the asset or liability through correlation with market data at the measurement date for the duration of the instrument’s anticipated life.
Level 3: Inputs are unobservable and therefore reflect management’s best estimate of the assumptions that market participants would use in pricing the asset or liability.
The Company estimates the fair value of its assets and liabilities, which qualify as financial instruments, and includes this additional information in the notes to the financial statements when the fair value is different from the carrying value of these instruments. The estimated fair value of cash and cash equivalents, accounts receivable, prepaid expenses, accounts payable, accrued expenses and deferred revenue approximate their carrying amounts due to the relatively short maturity of these instruments. The outstanding debt at December 30, 2012 was borrowed in conjunction with the 2012 Acquisition. The outstanding debt at December 29, 2013 was borrowed in conjunction with the August 23, 2013 refinancing (see Note 7). The outstanding debt at December 28, 2014 was borrowed in conjunction with the April 9, 2014 refinancing (see Note 7). Because the interest rates are based upon variable interest rates, the fair values of the long-term debt at December 28, 2014 and December 29, 2013 approximate their carrying values and are categorized as Level 2 in the fair value hierarchy.
Revenue
Revenue from restaurant sales is recognized when food and beverage products are sold and is presented net of employee meals, and complimentary meals. Proceeds from the sale of gift cards that do not have expiration dates are recorded as deferred revenue at the time of the sale and recognized as revenue when the gift card is redeemed by the holder. The portion of gift cards sold which are never redeemed is commonly referred to as gift card breakage. The Company recognizes gift card “breakage” revenue for gift cards when the likelihood of redemption becomes remote and the Company determines there is no legal obligation to remit the value of the unredeemed gift cards to governmental agencies. The Company estimates the gift card breakage rate based upon the pattern of historical redemptions. Prior to the third quarter of Fiscal 2014, the Company did not recognize any breakage revenue because it did not have sufficient historical data to allow management to reasonably estimate a pattern of historical redemptions. During the third quarter of Fiscal 2014, the Company concluded it had accumulated sufficient historical data from a large pool of homogeneous transactions to allow management to reasonably and objectively determine an estimated pattern of historical gift card redemptions. Accordingly, the Company accounted for this change prospectively as a change in estimate and recorded an adjustment during the third quarter of Fiscal 2014 to recognize previously unrecognized breakage revenue in the amount of $684 on gift cards whose likelihood of redemption was determined to be remote. During the fourth quarter of Fiscal 2014 the Company recognized an additional $195 in gift card breakage revenue.
Operations in the United States accounted for 76%, 74%, 71% and 73% of total consolidated revenue for the fiscal years ended December 28, 2014 and December 29, 2013, for the period from May 24, 2012 to December 30, 2012 (successor period) and for the period from January 2, 2012 to July 20, 2012 (predecessor period), respectively. The remaining revenue was attributable to the operations in Brazil.
F-32
Table of Contents
Fogo de Chão, Inc.
Notes to Consolidated Financial Statements (Continued)
(in thousands, except share and per share amounts)
Sales Taxes
Revenue is presented net of sales taxes. The sales tax payable obligation is included in accrued expenses until the taxes are remitted to the appropriate taxing authorities.
Operating Leases and Deferred Rent
The Company operates the majority of its restaurants in leased premises. The Company records the minimum base rents including option periods which are reasonably assured of renewal. For purposes of calculating straight-line rents, the lease term commences on the date the Company obtains control of the property, which is normally when the property is ready for normal tenant improvements (build-out period). The difference between rent expense and rent paid is recorded as a deferred rent liability. Allowances for tenant improvements are included in the deferred rent liability and recognized over the life of the lease by reducing rent expense.
Contingent rent expense is recognized, and subsequently accrued, when it becomes probable that the Company will achieve restaurant sales above a specified target amount, evaluated on a per lease basis.
Advertising Costs
Advertising costs are expensed as incurred. Advertising costs were approximately $5,824, $6,371, $2,332 and $2,402 for the fiscal year ended December 28, 2014, the fiscal year ended December 29, 2013, the period from May 24, 2012 to December 30, 2012 (successor period), and for the period from January 2, 2012 to July 20, 2012 (predecessor period), respectively.
Pre-Opening Costs
Pre-opening costs incurred with the opening of new restaurants are expensed as incurred. These costs include wages, benefits, travel and lodging for the training and opening management teams, and food, beverage and other restaurant operating expenses incurred prior to a restaurant opening for business including lease costs. In addition, pre-opening costs include marketing costs incurred prior to opening as well as meal expenses for entertaining guests as part of the restaurant opening.
Insurance Reserves
Beginning in Fiscal 2013, the Company is self-insured for certain losses related to workers’ compensation claims and Company-sponsored employee health insurance programs. The Company estimates the accrued liabilities for all self-insurance programs at the end of each reporting period. Accrued liabilities include the estimated incurred but unreported costs to settle unpaid claims. To limit exposure to losses, the Company maintains stop-loss coverage through third-party insurers. The deductibles range from approximately $200 to $250 per claim. The accrued liability attributable to all self-insurance programs was $1,230 and $955 as of December 28, 2014 and December 29, 2013, respectively, and is included in accounts payable and accrued expenses in the consolidated balance sheets. The estimated liability is not discounted and is based on a number of assumptions and factors, including historical trends and actuarial assumptions.
Income Taxes (Predecessor)
For the period from January 2, 2012 to July 20, 2012, the Predecessor operated as a Limited Liability Company (LLC). As a LLC, the Predecessor did not pay federal corporate income taxes on its taxable income in the U.S. Instead, the members were liable for individual federal and state income tax on their share of the Predecessor’s taxable income. Income taxes relate to the Predecessor’s foreign subsidiary in Brazil, margin tax and state tax in certain U.S. jurisdictions. The Predecessor calculated the provision for income taxes for the foreign subsidiary under the presumed profits method. Under the presumed profits method, the tax authority applies a percentage of the Predecessor’s revenue
F-33
Table of Contents
Fogo de Chão, Inc.
Notes to Consolidated Financial Statements (Continued)
(in thousands, except share and per share amounts)
as the profit margin, and taxes the profits at the current federal rate in Brazil. Given the structure of the Predecessor as a pass-through entity in the United States and the nature of the operations of the Predecessor in Brazil, there were no significant deferred tax assets or liabilities.
Income Taxes (Successor)
Immediately prior to the 2012 Acquisition, (i) FC Holdings Inc. contributed all of its ownership interests in Fogo de Chão Churrascaria (Holdings) LLC to Fogo Holdings, (ii) Fogo de Chão Churrascaria (Holdings) LLC was merged with Fogo Holdings, which was the surviving corporation, and (iii) FC Holdings Inc. was domesticated into Brasa Holdings by continuation out of the Cayman Islands into the state of Delaware. Through these contributions and mergers, the Predecessor entity was effectively converted from a limited liability company to a C-corporation (“Fogo de Chão (Holdings) Inc.”), which was purchased by the Successor. Effective May 24, 2012, the Successor Company accounts for income taxes in accordance with ASC Topic 740, “Accounting for Income Taxes.” This statement requires an asset and liability approach for financial accounting and reporting of income taxes. Under ASC Topic 740, income taxes are accounted for based upon the future tax consequences attributable to differences between the financial statement carrying amounts of existing assets and liabilities and their respective tax basis and operating loss and tax credit carry-forwards. The Company estimates its annual effective tax rate at each interim period based on the facts and circumstances available at that time while the actual effective tax rate is calculated at year-end. The Company is subject to income taxes in both the U.S. and Brazil.
In evaluating its ability to recover its deferred tax assets, the Company considers all available positive and negative evidence, including scheduled reversals of deferred tax liabilities, projected future taxable income, tax planning strategies and recent financial operations. In projecting future taxable income, the Company begins with historical results adjusted for the results of discontinued operations and changes in accounting policies and incorporates assumptions including the amount of future state, federal and foreign pretax operating income, the reversal of temporary differences, and the implementation of feasible and prudent tax planning strategies. These assumptions require significant judgment about the forecasts of future taxable income and are consistent with the plans and estimates the Company uses to manage its underlying businesses. In evaluating the objective evidence that historical results provide, the Company considers three years of cumulative operating income (loss).
At December 28, 2014 and December 29, 2013, the Company had a valuation allowance of $2,837 and $4,030, respectively, against its deferred tax assets. Losses in the U.S. in recent periods represented sufficient negative evidence to require a full valuation allowance against certain deferred tax assets. The Company intends to maintain a valuation allowance against the deferred tax assets related to these operating losses, until sufficient positive evidence exists to support the realization of such assets.
The Company recognizes tax liabilities in accordance with ASC 740, and adjusts those liabilities when judgments change as a result of evaluation of new information not previously available. Significant judgment is required in assessing, among other things, the timing and amounts of deductible and taxable items. Due to the complexity of some of these uncertainties, the ultimate resolution may result in payment that is materially different from the Company’s current estimate of the tax liabilities. These differences are reflected as increases or decreases to income tax expense in the period in which they are determined.
Income taxes relate to the Company’s domestic federal income tax, tax in the Company’s foreign subsidiary in Brazil, margin tax and state tax in certain U.S. jurisdictions. The provision for income taxes for the foreign subsidiary is calculated under the presumed profits method. Under the presumed profits method, the tax authority applies a percentage of the foreign subsidiary’s revenue as the profit margin, and taxes the profits at the current federal rate in Brazil.
Given the structure of the Successor as a C-corporation subsequent to the 2012 Acquisition, there were deferred tax assets and liabilities recorded by the Successor as part of the business combination and subsequently thereafter.
F-34
Table of Contents
Fogo de Chão, Inc.
Notes to Consolidated Financial Statements (Continued)
(in thousands, except share and per share amounts)
The Company applies the authoritative guidance related to uncertainty in income taxes. The Company has concluded that there were no uncertain tax positions identified during its analysis. The Company recognizes interest and penalties, if any, in the period in which they occur in income tax expense. There was no interest expense or penalties incurred, or recorded during the fiscal years ended December 28, 2014 or December 29, 2013, or during the period from May 24, 2012 to December 30, 2012 (successor period).
Share-Based Compensation
The Company measures share-based awards granted to employees and directors based on the fair value on the date of grant. Stock options granted to employees and directors are measured at fair value on the date of the grant using the Black-Scholes option-pricing model. The fair value of the awards is recognized as an expense, net of estimated forfeitures, over the requisite service period, which is generally the vesting period of the respective award. For awards with both service and performance conditions, the expense is recognized using the graded vesting method. For awards with only service conditions, the expense is recognized using the straight-line method.
For liability-classified awards, compensation expense is recognized over the period during which services are rendered by the employee until completed. At the end of each financial reporting period prior to completion of the service, the fair value of these awards is re-measured using the then-current fair value of the Company’s common stock and updated assumption inputs in the Black-Scholes option-pricing model. The Company did not have any liability-classified awards outstanding as of December 28, 2014 or December 29, 2013.
The Company classifies share-based compensation expense in its consolidated statement of operations and comprehensive income (loss) in the same manner in which the award recipient’s payroll costs are classified or in which the award recipient’s service payments are classified.
The Company recognizes compensation expense for only the portion of awards that are expected to vest. In developing a forfeiture rate estimate, the Company has considered its historical experience to estimate pre-vesting forfeitures for service-based awards. The impact of a forfeiture rate adjustment will be recognized in full in the period of adjustment, and if the actual forfeiture rate is materially different from the Company’s estimate, the Company may be required to record adjustments to share-based compensation expense in future periods.
Net Income (Loss) Per Share
Basic net income (loss) per share is calculated by dividing net income (loss) attributable to Fogo de Chão, Inc. by the weighted-average number of shares of common stock outstanding during each period. Diluted net income (loss) per share is calculated using net income (loss) attributable to Fogo de Chão, Inc. divided by diluted weighted-average shares of common stock outstanding during each period. Potentially dilutive securities include shares of common stock underlying stock options and restricted stock. Diluted net income (loss) per share considers the impact of potentially dilutive securities, except in periods in which there is a loss, because the inclusion of the potential common shares would have an anti-dilutive effect.
Foreign Currency Translation
The Company considers the Brazilian real the functional currency of its Brazilian subsidiary because it conducts substantially all of its business in that currency. The Mexican peso is the functional currency of the Company’s joint venture in Mexico because substantially all of the business of the joint venture is conducted in that currency. The assets and liabilities of the Brazilian subsidiary and of the joint venture in Mexico are translated into U.S. dollars, which is the Company’s reporting currency, at exchange rates existing at the balance sheet dates. Revenue and expenses are translated at average exchange rates and shareholders’ equity balances are translated at historical exchange rates. Adjustments resulting from translating foreign functional currency financial statements into U.S. dollars are included in the foreign currency translation adjustment, a component of accumulated other comprehensive income (loss). The functional currency of the Company’s other subsidiaries is the U.S. dollar.
F-35
Table of Contents
Fogo de Chão, Inc.
Notes to Consolidated Financial Statements (Continued)
(in thousands, except share and per share amounts)
Comprehensive Income (Loss)
Comprehensive income (loss) includes all changes in equity during a period except those resulting from investments by and distributions to shareholders. Accumulated comprehensive income (loss) consists of the Company’s net income (loss) and foreign currency translation adjustments from operations in Brazil, net of related income tax effects. Accumulated comprehensive loss attributable to the Company’s joint venture in Mexico consists of the net loss of the joint venture and adjustments resulting from translating the foreign functional currency financial statements of the joint venture into U.S. dollars.
Business Combinations
The Company records acquisitions using the purchase method of accounting in accordance with ASC 805 “Business Combinations” and, accordingly, includes the results of operations in the Company’s consolidated results as of the date of each acquisition. The Company allocates the purchase price of its acquisitions to the tangible assets acquired, liabilities assumed, and intangible assets acquired based on their estimated fair values. The excess purchase price over those fair values is recorded as goodwill.
Segment Reporting
Fogo de Chão, Inc. owns and operates full-service, Brazilian steakhouses in the United States and Brazil using a single restaurant concept and brand. Each restaurant under the Company’s single global brand operates with similar types of products and menu, providing a continuous service style, similar contracts, customers and employees, irrespective of location. ASC 280, “Segment Reporting” requires use of the “management approach” model for segment reporting. The management approach model is based on the way a company’s management organizes segments within the company for making operating decisions and assessing performance. The Company’s segments consist of two operating segments: United States and Brazil. The Company’s joint venture in Mexico is included in the United States for segment reporting purposes as the operations of the joint venture are monitored by the United States segment management.
Restatement of Previously Issued Financial Statements
The consolidated financial statements for the predecessor period were previously restated to correct errors related to the accounting for the settlement of the Predecessor’s SAR Plan and the treatment of certain transaction expenses related to the 2012 Acquisition.
Recently Issued Accounting Standards
Recent accounting pronouncements not included below are not expected to have a material impact on the Company’s consolidated financial position or results of operations.
In April 2014, the FASB issued ASU No. 2014-08 “Presentation of Financial Statements (Topic 205) and Property, Plant, and Equipment (Topic 360): Reporting Discontinued Operations and Disclosures of Disposals of Components of an Entity.” ASU No. 2014-08 improves the definition of discontinued operations by limiting discontinued operations reporting to disposals of components of an entity that represent strategic shifts that have (or will have) a major effect on an entity’s operations and financial results. Under current GAAP, many disposals, some of which may be routine in nature and not a change in an entity’s strategy, are reported in discontinued operations. Additionally, the amendments in this ASU require expanded disclosures for discontinued operations. The amendments in this ASU also require an entity to disclose the pretax profit or loss of an individually significant component of an entity that does not qualify for discontinued operations reporting. The ASU is effective for annual financial statements with years that begin on or after December 15, 2014. The Company will adopt this guidance fiscal year 2015. The adoption of this guidance is not expected to have an impact on the Company’s consolidated financial statements.
F-36
Table of Contents
Fogo de Chão, Inc.
Notes to Consolidated Financial Statements (Continued)
(in thousands, except share and per share amounts)
In May 2014, the FASB issued ASU No. 2014-09, “Revenue from Contracts with Customers.” The core principle of the standard is that an entity recognizes revenue to depict the transfer of promised goods or services to customers in an amount that reflects the consideration to which the entity expects to be entitled in exchange for those goods or services. The ASU will replace most existing revenue recognition guidance in GAAP. New qualitative and quantitative disclosure requirements aim to enable financial statement users to understand the nature, amount, timing, and uncertainty of revenue and cash flows arising from contracts with customers. The new standard is effective for annual periods beginning after December 15, 2016. Early adoption is not permitted. The ASU permits the use of either the retrospective or cumulative effect transition method. The Company has not yet selected a transition method or determined the effect, if any, that this ASU will have on the consolidated financial statements and related disclosures.
In August, 2014, the FASB issued ASU No. 2014-15, “Presentation of Financial Statements—Going Concern (Subtopic 205-40): Disclosure of Uncertainties about an Entity’s Ability to Continue as a Going Concern.” ASU 2014-15 will require management to evaluate whether there are conditions or events that raise substantial doubt about the entity’s ability to continue as a going concern for one year from the date the financial statements are issued. It is effective prospectively for fiscal years, and interim periods within those years, ending after December 15, 2016. The Company will adopt ASU No. 2014-15 beginning in fiscal year 2016.
3. Property and Equipment, Net
Property and equipment, net consists of the following:
| December 28, 2014 |
December 29, 2013 |
|||||||
| Land |
$ | 5,340 | $ | 5,340 | ||||
| Buildings |
4,810 | 4,810 | ||||||
| Leasehold improvements |
106,486 | 93,868 | ||||||
| Furniture, fixtures and equipment |
14,529 | 12,325 | ||||||
| Automobiles |
255 | 124 | ||||||
| Construction in progress |
3,254 | 3,369 | ||||||
| Joint Venture (Mexico) |
986 | — | ||||||
| 135,660 | 119,836 | |||||||
| Less: Accumulated depreciation and amortization |
(22,454 | ) | (11,838 | ) | ||||
| Property and equipment, net |
$ | 113,206 | $ | 107,998 | ||||
Depreciation and amortization expense was $11,349, $8,693, $3,611 and $4,790 for the fiscal years ended December 28, 2014 and December 29, 2013, the period from May 24, 2012 to December 30, 2012 (successor period), and for the period from January 2, 2012 to July 20, 2012 (predecessor period), respectively.
Property and equipment attributable to the Company’s operations in the United States accounted for 89% and 87% of total property and equipment, net (excluding land) at December 28, 2014 and December 29, 2013, respectively. Property and equipment attributable to the Company’s operations in Brazil accounted for 10% and 13% of total property and equipment, net (excluding land) at December 28, 2014 and December 29, 2013, respectively. Land is solely attributable to the Company’s operations in the United States.
F-37
Table of Contents
Fogo de Chão, Inc.
Notes to Consolidated Financial Statements (Continued)
(in thousands, except share and per share amounts)
4. Goodwill and Intangible Assets
Goodwill is attributable to the 2012 Acquisition (see Note 1). The following is a reconciliation of the beginning and ending balances of goodwill:
| December 30, 2012 |
Additions | December 29, 2013 |
Additions | December 28, 2014 |
||||||||||||||||
| Goodwill |
||||||||||||||||||||
| United States |
$ | 173,356 | $ | — | $ | 173,356 | $ | — | $ | 173,356 | ||||||||||
| Brazil |
62,663 | — | 62,663 | — | 62,663 | |||||||||||||||
| Foreign exchange impact |
(819 | ) | (7,527 | ) | (8,346 | ) | (7,357 | ) | (15,703 | ) | ||||||||||
| Goodwill, total |
$ | 235,200 | $ | (7,527 | ) | $ | 227,673 | $ | (7,357 | ) | $ | 220,316 | ||||||||
The Company regularly evaluates whether events and circumstances have occurred that may indicate a potential change in recoverability of goodwill. The Company performs its annual goodwill impairment review during its fiscal fourth quarter. The Company’s last annual review indicated that there was no impairment of goodwill, and that the reporting units had estimated fair values that were in excess of their carrying values, including goodwill.
Intangible assets are attributable to the 2012 Acquisition (see Note 1) and include the following:
| December 28, 2014 | December 29, 2013 | |||||||||||||||
| Gross Amount |
Accumulated Amortization |
Gross Amount |
Accumulated Amortization |
|||||||||||||
| Non-compete agreements (definite-lived): |
||||||||||||||||
| United States |
$ | 1,100 | $ | (532 | ) | $ | 1,100 | $ | (312 | ) | ||||||
| Brazil |
400 | (193 | ) | 400 | (113 | ) | ||||||||||
| Foreign exchange impact |
(100 | ) | 48 | (54 | ) | 15 | ||||||||||
| Non-compete agreements, net |
1,400 | (677 | ) | 1,446 | (410 | ) | ||||||||||
| Trade name (indefinite-lived): |
||||||||||||||||
| United States |
77,200 | 77,200 | ||||||||||||||
| Brazil |
30,100 | 30,100 | ||||||||||||||
| Foreign exchange impact |
( 7,543 | ) | (4,009 | ) | ||||||||||||
| Trade name |
99,757 | — | 103,291 | — | ||||||||||||
| Total |
$ | 101,157 | $ | (677 | ) | $ | 104,737 | $ | (410 | ) | ||||||
Amortization expense for definite-lived intangibles was $289, $296, $125 and $324 for the fiscal years ended December 28, 2014 and December 29, 2013, the period from May 24, 2012 to December 30, 2012 (successor period), and the period from January 2, 2012 to July 20, 2012 (predecessor period), respectively.
The remaining amortization of definite-lived intangibles is as follows:
| 2015 |
$ | 280 | ||
| 2016 |
280 | |||
| 2017 |
163 | |||
| Total |
$ | 723 |
Goodwill and intangible assets of the Company’s Brazilian reporting unit are denominated in the Brazilian real. These assets are translated into U.S. dollars at the rate of exchange as of the applicable balance sheet date. As a result, the U.S. dollar value of goodwill and intangibles is impacted by the fluctuation in the exchange rate.
F-38
Table of Contents
Fogo de Chão, Inc.
Notes to Consolidated Financial Statements (Continued)
(in thousands, except share and per share amounts)
5. Deferred Rent
Deferred rent consists of the following:
| December 28, 2014 |
December 29, 2013 |
|||||||
| Tenant allowance |
$ | 6,772 | $ | 5,836 | ||||
| Deferred rent |
4,179 | 3,118 | ||||||
| 10,951 | 8,954 | |||||||
| Less: Current portion |
(309 | ) | (542 | ) | ||||
| Total, less current portion |
$ | 10,642 | $ | 8,412 | ||||
Many of the Company’s operating leases contain rent escalations at various periods during the applicable lease term. The Company recognizes rental expense for minimum lease payments for these leases on a straight-line basis over the base term of the lease.
Any allowances from the landlord used for tenant improvements are reflected as property and equipment with a corresponding credit to a liability account. Amounts recorded to normal tenant improvements are depreciated over the lesser of the asset’s useful life or the lease term. The corresponding liability is amortized over the initial lease term.
In connection with the 2012 Acquisition discussed in Note 1, the Company recognized at fair value both favorable lease assets and unfavorable lease liabilities, representing the difference between the market rates in effect for acquired leases compared to the various lease payments on individual operating leases. Favorable lease assets and unfavorable lease liabilities are amortized to rent expense on a straight-line basis over each respective operating lease term. The amortization of favorable lease assets increases rent expense, while the amortization of unfavorable lease liabilities decreases rent expense.
Favorable lease assets and unfavorable lease liabilities:
| December 28, 2014 |
December 29, 2013 |
|||||||
| Favorable lease assets |
$ | 738 | $ | 738 | ||||
| Less: Accumulated amortization |
(304 | ) | (169 | ) | ||||
| Foreign exchange impact |
(85 | ) | (45 | ) | ||||
| Favorable lease assets, net |
$ | 349 | $ | 524 | ||||
| Unfavorable lease liabilities |
$ | 2,128 | $ | 2,128 | ||||
| Less: Accumulated amortization |
(732 | ) | (429 | ) | ||||
| Unfavorable lease liabilities, net |
$ | 1,396 | $ | 1,699 | ||||
Favorable lease assets are included in other assets (noncurrent) in the consolidated balance sheets. Unfavorable lease liabilities are included in other noncurrent liabilities in the consolidated balance sheets.
F-39
Table of Contents
Fogo de Chão, Inc.
Notes to Consolidated Financial Statements (Continued)
(in thousands, except share and per share amounts)
6. Accounts Payable and Accrued Expenses
Accounts payable and accrued expenses consist of the following:
| December 28, 2014 |
December 29, 2013 |
|||||||
| Accounts payable |
$ | 10,590 | $ | 17,730 | ||||
| Deferred rent (current) |
309 | 542 | ||||||
| Payroll and payroll related |
9,975 | 9,772 | ||||||
| Interest payable |
3,587 | 4,448 | ||||||
| Sales and beverage taxes payable |
1,971 | 1,941 | ||||||
| Insurance |
1,285 | 976 | ||||||
| Income and other taxes payable |
1,018 | 980 | ||||||
| Other accrued expenses |
3,053 | 2,202 | ||||||
| Total |
$ | 31,788 | $ | 38,591 | ||||
7. Long-Term Debt
Long-term debt consists of the following:
| December 28, 2014 |
December 29, 2013 |
|||||||
| Credit facility |
$ | 248,434 | $ | 250,612 | ||||
| Debt discount |
(5,389 | ) | (8,829 | ) | ||||
| Line of credit |
— | 10,500 | ||||||
| 243,045 | 252,283 | |||||||
| Less: Current portion of long-term debt |
(4,788 | ) | (2,077 | ) | ||||
| Long-term debt, less current portion |
$ | 238,257 | $ | 250,206 | ||||
Because the Company is not required to make principal payments on any outstanding balance on the revolving line of credit until July 20, 2017, any outstanding balance is reported as non-current in the Company’s consolidated balance sheet as a component of long-term debt.
Predecessor
On August 6, 2011 the Predecessor entered into a 6 year $205,000 credit facility with a 1.00% original issue discount (the “2011 Credit Facility”). The 2011 Credit Facility consisted of a $195,000 term loan and a $10,000 revolving line of credit. The term loan was due in variable quarterly installments with interest due quarterly calculated at 3-month LIBOR plus a spread of 4.75% with a LIBOR floor value of 1.50%. Additionally, the Predecessor paid a commitment fee on the unused portion of the revolving line of credit at a rate of 0.50%. Letters of credit could be issued against the available balance on the line of credit at a rate of 5.00%.
The Predecessor was required to maintain certain financial covenants based on the trailing 4 quarters of earnings before interest, taxes, depreciation, amortization, and non-cash stock compensation (“EBITDA”), as defined in the agreement. The Predecessor could not drop below a ratio of EBITDA to interest expense of 2.5 times or a maximum of rent adjusted total debt to EBITDAR (EBITDA plus rent expense) of 5.5 to 1.0. During the period from January 2, 2012 to July 20, 2012, the Predecessor was in compliance with these covenants. Under the terms of the 2011 Credit Facility, various remedies existed for the lender should the terms of the covenants not be met. The 2011 Credit Facility was secured by the operating entities of the Predecessor and as such was collateralized by those assets of the entities.
F-40
Table of Contents
Fogo de Chão, Inc.
Notes to Consolidated Financial Statements (Continued)
(in thousands, except share and per share amounts)
The 2011 Credit Facility was paid off in full on July 20, 2012 in connection with the 2012 Acquisition, resulting in a loss on extinguishment of $7,762.
Successor
On July 21, 2012, the Company entered into a syndicated loan agreement with various financial institutions (the “2012 Credit Facility”). The 2012 Credit Facility includes a 7 year $182,500 1st Lien Term Loan (“Term Loan A”), a $70,000 2nd Lien Term Loan (“Term Loan B”) and a revolving line of credit of $25,000.
Term Loan A principal is due in variable quarterly installments starting in the fourth quarter of 2012 and bears interest, which is due quarterly, at 3-month LIBOR plus a spread of 6.25% with a LIBOR floor value of 1.25%. Term Loan A has a maturity date of July 20, 2019. The revolving line of credit has an interest rate of LIBOR plus a spread of 6.25% and has a maturity date of July 20, 2017. Additionally, the Company pays a commitment fee on the unused portion of the revolving line of credit at a rate of 0.50%. Term Loan B is due in full on its maturity date of January 20, 2020, and it bears interest at LIBOR plus a spread of 9.50% with a LIBOR floor value of 1.50%.
Beginning with the quarter ending December 30, 2012, the Successor is required to maintain certain financial covenants including a Total Rent Adjusted Leverage Ratio and a Consolidated Interest Coverage Ratio.
Total Rent Adjusted Leverage Ratio means as of the end of any fiscal quarter of the Company for the Test Period ending on such date, the ratio of (a) the sum of (i) Consolidated Total Debt, as defined in the loan agreement, as of the last day of such Test Period and (ii) an amount equal to the product of eight (8) multiplied by Consolidated Rental Expense, as defined in the loan agreement, for such Test Period to (b) Consolidated EBITDAR, as defined in the loan agreement, for such Test Period, in each cash for the Company and its Restricted Subsidiaries, as defined in the loan agreement.
Consolidated Interest Coverage Ratio means, as of the end of any fiscal quarter of the Company for the Test Period ending on such date, the ratio of (a) Consolidated EBITDA, as defined in the loan agreement, for such Test Period to (b) Consolidated Interest Expense, as defined in the loan agreement, for such Test Period, in each case for the Company and its Restricted Subsidiaries, as defined in the loan agreement.
The Company was in compliance with these covenants at December 28, 2014 and December 29, 2013. Under the terms of the agreement, various remedies exist for the lender should the terms of the covenants not be met, including changes in interest rates and other fees or charges.
On August 23, 2013, the Company entered into an amendment to the 2012 Credit Facility (the “First Amended 2012 Credit Facility”). In connection with this amendment, the Company refinanced $181,131 of its existing Term Loan A, which resulted in a modification of the existing Term Loan A. The Company recorded a loss on modification of the Term Loan A of $6,875. The modified Term Loan A bears interest, which is payable quarterly, at 3-month LIBOR plus a spread of 4.75% with a LIBOR floor value of 1.00%. The maturity date of the modified Term Loan A remains July 20, 2019. The revolving line of credit was also amended and, as a result, now bears interest at a rate of LIBOR plus a spread of 4.75% and continues to have a maturity date of July 20, 2017. Additionally, the Company borrowed an additional $25,000 under its amended Term Loan A and paid down its Term Loan B in the amount of $25,000. The resulting outstanding principal under Term Loan B is $45,000, which matures on January 20, 2020 and continues to bear interest at LIBOR plus a spread of 9.50% with a LIBOR floor value of 1.50%.
On April 9, 2014, the Company entered into a second amendment to the 2012 Credit Facility (the “Second Amended 2012 Credit Facility”). In connection with this amendment the Company refinanced $204,574 of its existing Term Loan A, which resulted in a modification of the existing Term Loan A. The Company recorded a loss on modification of the Term Loan A of $3,090. The new Term Loan A bears interest quarterly, at 3-month LIBOR plus a spread of 4.00% with a LIBOR floor value of 1.00%. The maturity date of the new Term Loan A remains July 20, 2019. The revolving line of credit was also amended and, as a result, now bears interest at a rate of LIBOR plus a
F-41
Table of Contents
Fogo de Chão, Inc.
Notes to Consolidated Financial Statements (Continued)
(in thousands, except share and per share amounts)
spread of 4.00% and continues to have a maturity date of July 20, 2017. Additionally, the Company borrowed an additional $20,000 under its amended Term Loan A and paid down its Term Loan B in the amount of $20,000. The resulting outstanding principal under Term Loan B is $25,000, which matures on January 20, 2020 and continues to bear interest at LIBOR plus a spread of 9.50% with a LIBOR floor value of 1.50%.
Each of the term loans have a prepayment premium of 1% of the aggregate principal amount should the Company prepay, refinance, substitute or replace any of the term loans in connection with a repricing transaction prior to October 9, 2014.
Under the terms of the Second Amended 2012 Credit Facility, the Company is required to make mandatory prepayments in the event of Excess Cash Flows as defined in the agreement. During the fiscal year ended December 28, 2014, the Company reclassified $1,938 of long-term debt to current as a result of this provision.
The Company’s wholly-owned subsidiary Brasa Holdings is the sole issuer of all of the outstanding debts and revolving line of credits. The 2012 Credit Facility is secured by substantially all assets of Brasa Holdings and its subsidiaries.
At December 28, 2014, the indebtedness (excluding discounts) on outstanding long-term debt payable during the next five fiscal years and thereafter as follows:
| 2015 |
$ | 4,788 | ||
| 2016 |
2,280 | |||
| 2017 |
2,280 | |||
| 2018 |
2,280 | |||
| 2019 |
211,806 | |||
| Thereafter |
25,000 | |||
| Total |
$ | 248,434 |
As of December 28, 2014, the Company had four letters of credit outstanding for a total of $1,221 and $23,779 of available borrowing capacity under the revolving line of credit.
Debt Issuance Costs
Debt issuance costs incurred for the fiscal years ended December 28, 2014 and December 29, 2013, for the period from May 24, 2012 to December 30, 2012 (successor period), and for the period from January 2, 2012 to July 20, 2012 (predecessor period) were $784, $1,931, $2,315 and $0, respectively.
Amortization of debt issuance costs was $341, $1,101, $184 and $813 for the fiscal years ended December 28, 2014 and December 29, 2013, the period from May 24, 2012 to December 30, 2012 (successor period), and for the period from January 2, 2012 to July 20, 2012 (predecessor period), respectively.
The unamortized debt issuance costs of $98 and the original issue discount of $2,208 for the First Amended 2012 Credit Facility were expensed on the modification of that credit facility on April 9, 2014.
The unamortized debt issuance costs of $366 and the original issue discount of $6,509 for the 2012 Credit Facility were expensed on the modification of that credit facility on August 23, 2013.
The unamortized debt issuance costs of $6,124 and the original issue discount of $1,638 for the 2011 Credit Facility were expensed on the extinguishment of that credit facility on July 20, 2012.
Remaining unamortized debt issuance costs were $989 and $1,428 at December 28, 2014 and December 29, 2013, respectively. These balances are included in other assets (noncurrent) in the consolidated balance sheets.
F-42
Table of Contents
Fogo de Chão, Inc.
Notes to Consolidated Financial Statements (Continued)
(in thousands, except share and per share amounts)
8. Share-Based Compensation
2006 Long-term Incentive Plan (Predecessor):
In 2006, the Company established the 2006 Long-Term Incentive Plan (the “2006 Plan”). The 2006 Plan provided for the Company to sell or issue restricted common stock or to grant stock options, stock appreciation rights (“SARs”) or other share-based awards to employees, members of the board of directors and consultants of the Company. The 2006 Plan was administered by the board of directors, or at the discretion of the board of directors, by a committee of the board.
Under the 2006 Plan, a maximum of 1,500,000 shares of common stock were reserved for issuance of stock-based awards. Prior to the 2012 Acquisition, the Predecessor granted SARs to certain employees under the 2006 Plan.
In connection with the 2012 Acquisition, all of the then-outstanding SAR awards were settled. The Predecessor had the following SAR awards outstanding immediately prior to the 2012 Acquisition:
| Awards Outstanding |
Weighted Average Exercise Price |
|||||||
| Class A SARs |
771,642 | $ | 3.26 | |||||
| Class C SARs |
255,000 | $ | 9.50 | |||||
Cash Settlement of Class A SARs:
Upon the closing of the 2012 Acquisition, 417,297 partially vested Class A SARs, with a weighted average exercise price of $3.06, were cash settled for an aggregate of $7,266. The cash settlement of these awards was considered to be attributable to both pre- and post-combination services, and compensation expense related to the settlement was allocated by the Company based on the proportion of the completed service period of each award at the time of settlement. As of January 1, 2012, Predecessor had recognized $3,486 of share-based compensation expense related to these awards. Accordingly, $2,140 was recognized by the Predecessor related to pre-combination services and $1,640 was recognized by Successor related to post-combination services related to the settlement of these awards. The Successor Company recognized the entire $1,640 of expense on July 21, 2012 as no future service period remained for these awards.
Cash Settlement of Class C SARs
Upon the closing of the 2012 Acquisition, 75,000 partially vested Class C SARs, with an exercise price of $9.50, were cash settled for an aggregate amount of $823. These awards contained change-in-control provisions whereby, upon the occurrence of a change-in-control transaction, the awards become fully vested and exercisable. As a result, the cash settlement of these awards was considered to be attributable to pre-combination services, and compensation expense related to the settlement of the awards was recognized in the Predecessor period. As of January 1, 2012, Predecessor had recognized $52 of share-based compensation expense related to these awards. Accordingly, the remaining $771 was recognized on July 20, 2012 by the Predecessor.
Exchange of Class A and Class C SARs for Restricted Shares
The remaining 354,345 Class A SARs and 180,000 Class C SARs were determined to have a fair value of $7,991, net of their respective exercise prices, on the date of the 2012 Acquisition. Upon the closing of the 2012 Acquisition, the holders of these awards were paid $4,890, net of applicable taxes due of $3,101, which were paid to the relevant tax authorities on behalf of the holders. The remaining net proceeds were used to purchase 25,149 shares of restricted stock with an aggregate fair value of $4,890. The exchange of these awards was considered to be attributable to both pre- and
F-43
Table of Contents
Fogo de Chão, Inc.
Notes to Consolidated Financial Statements (Continued)
(in thousands, except share and per share amounts)
post-combination services, and compensation expense related to the exchange was allocated by the Company based on the proportion of the completed service period of each award at the time of the exchange. As of January 1, 2012, Predecessor had recognized $1,114 of share-based compensation expense related to these awards. Accordingly, $1,159 was recognized by Predecessor related to the settlement of these awards, including the portion of taxes paid to relevant tax authorities on behalf of the holders, representing payment for pre-combination services on July 20, 2012. In addition, the Successor recorded expense of $2,223 immediately in the Successor period, related to taxes paid on the SAR holders’ behalf that were attributed to post-combination services, for which no future service period is required. The remaining fair value of $3,495 attributed to these awards is being recognized prospectively by Successor over their respective graded vesting terms of between four and five years. During the period from May 24, 2012 through December 30, 2012 (successor period), the Company recognized $641 related to these awards.
The aggregate amount of the settlement of SARs attributable to pre-combination services was $8,722 and was recorded as part of consideration transferred in connection with the 2012 Acquisition. The portion of the SARs settlement related to pre-combination services included $1,395 of non-cash consideration related to the exchange of SARs for restricted stock.
The Company will receive no future tax benefit related to the post-combination compensation charges noted above.
There were no SARs outstanding as of December 28, 2014 or December 29, 2013.
2012 Omnibus Equity Incentive Plan (Successor)
In connection with the 2012 Acquisition, the Company established the 2012 Omnibus Equity Incentive Plan (the “2012 Plan”). The 2012 Plan provides for the Company to sell or issue restricted common stock or to grant stock options, stock appreciation rights or other share-based awards to employees, members of the board of directors and consultants of the Company. The 2012 Plan is administered by the board of directors, or at the discretion of the board of directors, by a committee of the board. The exercise prices, vesting and other restrictions are determined at the discretion of the board of directors, or their committee, if so delegated, except that the exercise price per share of stock options may not be less than 100% of the fair market value of the share of common stock on the date of grant and the term of the stock option may not be greater than ten years (the maximum allowed contractual life).
Under the 2012 Plan, a maximum of 90,000 shares of common stock are reserved for issuance of stock-based awards, and a maximum of 25,149 shares of restricted stock only to be issued in connection with the 2012 Acquisition. The Company issued the maximum allowed number of shares of restricted stock to employees of the Company in connection with the settlement of SARs in connection with the 2012 Acquisition.
As of December 28, 2014, 1,495 shares remained available for future issuance under the 2012 Plan.
Stock Options
The Company typically grants stock options to employees in two tranches, each with separate exercise prices. The exercise price for the first tranche is based on the fair value of common stock on the date of grant, and the exercise price of the second tranche is typically 200% of fair value of common stock on the date of grant. These options typically vest upon both (i) the completion of a four or five year vesting period and (ii) the satisfaction of a Liquidity Event, as that term is defined in the stock option award agreement. Under the terms of the option award agreement, a Liquidity Event is defined as the earlier to occur of (i) a change in control transaction or (ii) an initial public offering.
The fair value of each stock option grant is estimated on the date of grant using the Black-Scholes option-pricing model.
The Company historically has been a private company and lacks company-specific historical and implied volatility information. Therefore, it estimates its expected stock volatility based on the historical volatility of a publicly traded group of peer companies and expects to continue to do so until such time as it has adequate historical data regarding the volatility of its own traded stock price.
F-44
Table of Contents
Fogo de Chão, Inc.
Notes to Consolidated Financial Statements (Continued)
(in thousands, except share and per share amounts)
The expected term of the options represents the estimated period of time until exercise and is based on historical experience of similar options, giving consideration to the contractual terms, vesting schedules and expectations of future employee behavior.
The risk-free interest rate is determined by reference to the U.S. Treasury yield curve in effect at the time of grant of the award for time periods approximately equal to the expected term of the award.
Expected dividend yield is based on the fact that the Company has never paid cash dividends and does not expect to pay any cash dividends in the foreseeable future.
The following table sets forth the assumptions that the Company used to determine the fair value of the stock options granted, presented on a weighted-average basis:
| Period from May 24, 2012 (Inception) through December 30, 2012 (successor period) |
Fiscal Year Ended December 29, 2013 |
Fiscal Year Ended December 28, 2014 |
||||||||||
| Expected term (in years) |
6.40 | 6.34 | 6.10 | |||||||||
| Risk-free interest rate |
0.85 | % | 1.77 | % | 1.76 | % | ||||||
| Volatility |
50 | % | 47 | % | 42 | % | ||||||
| Dividend yield |
0 | % | 0 | % | 0 | % | ||||||
The following table summarizes the Company’s stock option activity from May 24, 2012 through December 28, 2014:
| Shares | Weighted Average Exercise Price |
Weighted Average Remaining Contractual Term (in years) |
Aggregate Intrinsic Value |
|||||||||||||
| Outstanding at May 24, 2012 (Successor) |
— | |||||||||||||||
| Granted |
67,500 | $ | 252.77 | |||||||||||||
| Exercised |
— | — | ||||||||||||||
| Forfeited |
— | — | ||||||||||||||
| Outstanding at December 30, 2012 |
67,500 | $ | 252.77 | 9.6 | — | |||||||||||
| Granted |
11,110 | $ | 262.35 | |||||||||||||
| Exercised |
— | — | ||||||||||||||
| Forfeited |
(300 | ) | $ | 291.66 | ||||||||||||
| Outstanding at December 29, 2013 |
78,310 | $ | 253.98 | 8.7 | $ | 855 | ||||||||||
| Granted |
9,891 | $ | 308.06 | |||||||||||||
| Exercised |
— | — | ||||||||||||||
| Forfeited |
— | — | ||||||||||||||
| Outstanding at December 28, 2014 |
88,201 | $ | 260.05 | 8.0 | $ | 4,549 | ||||||||||
| Vested at December 28, 2014 |
701 | $ | 214.15 | |||||||||||||
| Unvested at December 28, 2014 |
87,500 | $ | 260.41 | |||||||||||||
| Exercisable at December 28, 2014 |
701 | $ | 214.15 | 9.0 | $ | 42 | ||||||||||
F-45
Table of Contents
Fogo de Chão, Inc.
Notes to Consolidated Financial Statements (Continued)
(in thousands, except share and per share amounts)
The aggregate intrinsic value of stock options in the table above is calculated as the difference between the exercise price of the stock options and fair value of the Company’s common stock for those stock options that had exercise prices lower than the fair value of the Company’s common stock.
During the fiscal year ended December 29, 2013, the Company granted options for the purchase of 10,500 shares of common stock at a weighted average exercise price of $265.68. These options have performance-based vesting conditions relating to a Liquidity Event. As the completion of a Liquidity Event cannot be considered probable until it occurs, no expense associated with these awards will be recorded until the Liquidity Event occurs.
During November 2013, the Company granted stock options for the purchase of 610 shares under the 2012 Plan with an exercise price of $205.14. The fair value of each option on the date of grant was $79.59. These options were fully vested and exercisable immediately upon grant to the individuals. As there is no other time, performance or market conditions related to these stock options, the Company recognized the full $58 of compensation expense associated with these awards during the fiscal year ended December 29, 2013.
During the fiscal year ended December 28, 2014, the Company granted options for the purchase of 9,800 shares of common stock at a weighted average exercise price of $308.37. These options have performance-based vesting conditions relating to a Liquidity Event. As the completion of a Liquidity Event cannot be considered probable until it occurs, no expense associated with these awards will be recorded until the Liquidity Event occurs.
In December 2014, the Company granted stock options for the purchase of 91 shares under the 2012 Plan with an exercise price of $274.54. The fair value of each option on the date of grant was $85.46. These options were fully vested and exercisable immediately upon grant to the individual. As there is no other time, performance or market conditions related to these stock options, the Company recognized the full $8 of compensation expense associated with these awards during the fiscal year ended December 28, 2014.
The weighted average grant date fair value of stock options granted during the period from May 24, 2012 to December 30, 2012 (successor period), and during the fiscal years ended December 29, 2013 and December 28, 2014 was $81.27, $85.11 and $89.32, respectively.
No stock options have been exercised during the period from May 24, 2012 to December 30, 2012 (successor period) or during the fiscal years ended December 29, 2013 and December 28, 2014.
As of December 28, 2014, options for the purchase of 87,500 shares of common stock, respectively, that have performance-based vesting conditions related to a Liquidity Event were outstanding. The unrecognized compensation expense associated with these awards as of December 28, 2014 was $7,236. As the completion of a Liquidity Event cannot be considered probable until it occurs, no expense associated with these awards will be recorded until the Liquidity Event occurs.
Restricted Stock
The 2012 Plan provides for the award of restricted common stock. The Company has granted restricted common stock with time-based vesting conditions. Unvested shares of restricted common stock may not be sold or transferred by the holder. These restrictions lapse according to the time-based vesting conditions of each award, which is typically between two and four years.
F-46
Table of Contents
Fogo de Chão, Inc.
Notes to Consolidated Financial Statements (Continued)
(in thousands, except share and per share amounts)
The following table summarizes the Company’s restricted stock activity from May 24, 2012 through December 28, 2014:
| Shares | Weighted Average Grant Date Fair Value |
|||||||
| Outstanding at May 24, 2012 (Successor) |
— | |||||||
| Issued |
25,149 | $ | 194.44 | |||||
| Vested |
— | — | ||||||
| Forfeited |
(1,346 | ) | $ | 194.44 | ||||
| Outstanding at December 30, 2012 |
23,803 | $ | 194.44 | |||||
| Issued |
122 | $ | 205.00 | |||||
| Vested |
(5,589 | ) | $ | 194.44 | ||||
| Forfeited |
(274 | ) | $ | 194.44 | ||||
| Outstanding at December 29, 2013 |
18,062 | $ | 194.51 | |||||
| Issued |
182 | $ | 274.54 | |||||
| Vested |
(5,650 | ) | $ | 194.55 | ||||
| Forfeited |
(202 | ) | $ | 194.44 | ||||
| Outstanding at December 28, 2014 |
12,392 | $ | 195.67 | |||||
The fair value of restricted stock that vested during the fiscal years ended December 28, 2014 and December 29, 2013 totaled $1,087 and $1,099, respectively.
As of December 28, 2014, the Company had an aggregate of $665 of unrecognized share-based compensation cost related to outstanding restricted common stock, which is expected to be recognized over a weighted average period of 2.1 years.
Share-based Compensation:
The Company recorded share-based compensation expense related to stock options, restricted stock and SARs in the following expense categories in its statements of operations and comprehensive income (loss):
| Fiscal Year Ended | Period from May 24, 2012 (Inception) through December 30, 2012 (successor period) |
Period
from January 2, 2012 through July 20, 2012 (predecessor period) |
||||||||||||||
| December 28, 2014 | December 29, 2013 | |||||||||||||||
| Restaurant operating expenses |
$ | 368 | $ | 672 | $ | 2,113 | $ | 664 | ||||||||
| General and administrative |
397 | 692 | 2,391 | 3,406 | ||||||||||||
| Total |
$ | 765 | $ | 1,364 | $ | 4,504 | $ | 4,070 | ||||||||
Included in the table above is $3,863 of compensation expense recognized during the period from May 24, 2012 through December 30, 2012 (successor period) related to the settlement of SAR awards in connection with the 2012 Acquisition attributable to post-combination services.
F-47
Table of Contents
Fogo de Chão, Inc.
Notes to Consolidated Financial Statements (Continued)
(in thousands, except share and per share amounts)
9. Net Income (Loss) Per Share
The following table sets forth the computations of basic and diluted net income (loss) per share:
| Fiscal Year Ended | Period from May 24, 2012 (Inception) to December 30, 2012 (successor period) |
|||||||||||
| December 28, 2014 | December 29, 2013 | |||||||||||
| Net income (loss) attributable to Fogo de Chão, Inc. common shareholders |
$ | 17,555 | $ | (937 | ) | $ | (9,032 | ) | ||||
| Basic weighted average shares outstanding |
891,523 | 885,940 | 884,850 | |||||||||
| Effect of dilutive securities: |
||||||||||||
| Unvested restricted stock |
12,427 | — | — | |||||||||
| Stock options |
117 | — | — | |||||||||
| Diluted weighted average number of shares outstanding |
904,067 | 885,940 | 884,850 | |||||||||
| Basic earnings (loss) per share |
$ | 19.69 | $ | (1.06 | ) | $ | (10.21 | ) | ||||
| Diluted earnings (loss) per share |
$ | 19.42 | $ | (1.06 | ) | $ | (10.21 | ) | ||||
No net loss per share calculation is presented for the Predecessor as the Predecessor was a limited liability company with no units outstanding.
The Company excluded 87,500, 77,700 and 67,500 stock options from the computation of diluted earnings (loss) per share for the fiscal years ended December 28, 2014 and December 29, 2013 and for the period from May 24, 2012 to December 30, 2012 (successor period), respectively. These options have performance-based vesting conditions related to a Liquidity Event, as that term is defined in the stock option award agreement. Because these stock options do not vest unless the performance-based vesting condition is met, they would only be included in the computation of diluted earnings (loss) per share if the performance-based vesting condition had been satisfied or would have been satisfied as of the reporting date. Because the performance-based vesting condition had not been satisfied and would not have been satisfied as of December 28, 2014, as of December 29, 2013 or as of December 30, 2012, respectively, they have been excluded from the calculation of diluted earnings (loss) per share.
The weighted average securities outstanding not included in the computation of earnings (loss) per share because their effect would have been antidilutive were as follows:
| Fiscal Year Ended | Period from May 24, 2012 (Inception) to December 30, 2012 (successor period) |
|||||||||||
| December 28, 2014 | December 29, 2013 | |||||||||||
| Unvested restricted stock |
16 | 22,457 | 23,952 | |||||||||
| Stock options |
— | 89 | — | |||||||||
| Total |
16 | 22,546 | 23,952 | |||||||||
F-48
Table of Contents
Fogo de Chão, Inc.
Notes to Consolidated Financial Statements (Continued)
(in thousands, except share and per share amounts)
10. Income Taxes
The following table summarizes the income (loss) from continuing operations, before income taxes, net equity in earnings of affiliates for the fiscal years ended December 28, 2014 and December 29, 2013, the period from May 24, 2012 to December 30, 2012 (successor period), and the period from January 2, 2012 to July 20, 2012 (predecessor period):
| Successor | Predecessor | |||||||||||||||
| Fiscal Year Ended | Period from May 24, 2012 (Inception) to December 30, 2012 |
Period from January 2, 2012 to July 20, 2012 |
||||||||||||||
| December 28, 2014 | December 29, 2013 | |||||||||||||||
| United States |
$ | 8,692 | $ | (10,679 | ) | $ | (17,055 | ) | $ | (14,608 | ) | |||||
| Foreign |
15,572 | 12,214 | 6,828 | 7,018 | ||||||||||||
| $ | 24,264 | $ | 1,535 | $ | (10,227 | ) | $ | (7,590 | ) | |||||||
Income Tax Provision
The income tax expense (benefit) from continuing operations, for the fiscal years ended December 28, 2014 and December 29, 2013, the period from May 24, 2012 to December 30, 2012 (successor period), and the period from January 2, 2012 to July 20, 2012 (predecessor period) consists of the following:
| Successor | Predecessor | |||||||||||||||
| Fiscal Year Ended |
Period from |
Period from 2012 to |
||||||||||||||
| December 28, 2014 | December 29, 2013 | |||||||||||||||
| Current tax expense |
||||||||||||||||
| U.S. Federal |
$ | — | $ | — | $ | — | $ | — | ||||||||
| State and local |
239 | 152 | 83 | 195 | ||||||||||||
| Foreign |
2,388 | 2,135 | 937 | 1,099 | ||||||||||||
| Total current tax expense |
$ | 2,627 | $ | 2,287 | $ | 1,020 | $ | 1,294 | ||||||||
| Deferred tax expense (benefit) |
||||||||||||||||
| U.S. Federal |
$ | 4,117 | $ | 157 | $ | (1,981 | ) | $ | — | |||||||
| State and local |
247 | 28 | (234 | ) | — | |||||||||||
| Foreign |
— | — | — | — | ||||||||||||
| Total deferred tax expense (benefit) |
$ | 4,364 | $ | 185 | $ | (2,215 | ) | $ | — | |||||||
| Income tax expense (benefit) |
$ | 6,991 | $ | 2,472 | $ | (1,195 | ) | $ | 1,294 | |||||||
F-49
Table of Contents
Fogo de Chão, Inc.
Notes to Consolidated Financial Statements (Continued)
(in thousands, except share and per share amounts)
Effective and Statutory Rate Reconciliation
The following table summarizes a reconciliation of income tax expense (benefit) for continuing operations, calculated at the U.S. statutory federal income tax rate of 35%, to total income tax expense (benefit) for the fiscal years ended December 28, 2014 and December 29, 2013, and for the period from May 24, 2012 to December 30, 2012 (successor period):
| Fiscal Year Ended | Period from |
|||||||||||
| December 28, 2014 | December 29, 2013 | |||||||||||
| Income tax expense (benefit) at federal statutory rate |
$ | 8,549 | $ | 537 | $ | (3,579 | ) | |||||
| Increases/(Decreases) due to: |
||||||||||||
| Differences due to non-deductible expenses |
481 | 1,150 | 2,808 | |||||||||
| State taxes, net of federal benefit |
472 | 656 | (159 | ) | ||||||||
| Credits generated |
(2,146 | ) | (1,965 | ) | (771 | ) | ||||||
| Unremitted earnings |
5,063 | 3,331 | 2,028 | |||||||||
| Foreign tax rate differential |
(3,138 | ) | (2,187 | ) | (1,522 | ) | ||||||
| Change in estimate, primarily related to transaction costs |
— | (1,508 | ) | — | ||||||||
| Change in valuation allowance |
(1,715 | ) | 2,458 | — | ||||||||
| Out-of-period adjustment |
(575 | ) | — | — | ||||||||
| Total income tax expense (benefit), net |
$ | 6,991 | $ | 2,472 | $ | (1,195 | ) | |||||
Out-of-period errors
During the fourth quarter of 2014, the Company identified errors of $575 in consolidated income tax expense for the year ended December 29, 2013, and $575 in consolidated comprehensive loss for the period May 24, 2012 to December 30, 2012. The errors related to accounting entries made in connection with deferred tax assets recorded on cumulative translation adjustments in 2012, and the subsequent recording of a valuation allowance on such adjustments in 2013. The Company corrected these errors in the fourth quarter of 2014, which had an effect of reducing income tax expense by $575, and reducing other comprehensive income for the year ended December 28, 2014. The Company does not believe these adjustments are material to the consolidated financial statements for the year ended December 28, 2014 or to the consolidated financial statements of any prior period.
The significant components of the difference between the statutory tax rate and the annual effective tax rate are attributable to the change in valuation allowances, change in prior year estimates related to the deductible amount of costs incurred in connection with the 2012 Acquisition discussed in Note 1, FICA tip credits, state taxes, non-deductible expenses, unremitted foreign earnings and statutory tax rate differential between foreign jurisdictions and the U.S. The component of income taxes from other than continuing operations consisted of $393 and $8 in tax benefits attributable to currency translation adjustments on unremitted earnings for the fiscal years ended December 28, 2014 and December 29, 2013, respectively.
Deferred Income Taxes
Deferred income taxes reflect the net tax effects of (a) temporary differences between the carrying amounts of assets and liabilities for financial reporting purposes and the amounts used for income tax purposes and (b) operating loss and tax credit carryforwards. These items are stated at the enacted tax rates that are expected to be in effect when taxes are actually paid or recovered.
F-50
Table of Contents
Fogo de Chão, Inc.
Notes to Consolidated Financial Statements (Continued)
(in thousands, except share and per share amounts)
Significant components of deferred tax assets and liabilities as of December 28, 2014 and December 29, 2013 are as follows:
| December 28, 2014 | December 29, 2013 | |||||||
| Deferred tax assets |
||||||||
| Deferred revenue |
$ | 479 | $ | 838 | ||||
| Transaction expenses |
3,075 | 2,690 | ||||||
| Deferred rent liability |
1,463 | 1,091 | ||||||
| Net operating loss carryforward |
11,013 | 19,845 | ||||||
| Federal benefit of state deferred taxes |
1,574 | 1,082 | ||||||
| FICA tip credit |
5,612 | 3,466 | ||||||
| Tenant allowance |
2,370 | 2,043 | ||||||
| Cumulative translation adjustment |
3,203 | 2,375 | ||||||
| Accrued expenses |
503 | 334 | ||||||
| Leaseholds |
414 | 493 | ||||||
| Other |
123 | 276 | ||||||
| Valuation allowance |
(2,837 | ) | (4,030 | ) | ||||
| Total deferred tax assets |
26,992 | 30,503 | ||||||
| Deferred tax liabilities |
||||||||
| Tax depreciation in excess of book depreciation |
(7,908 | ) | (12,165 | ) | ||||
| State deferred before unremitted earnings |
(3,225 | ) | (3,263 | ) | ||||
| Goodwill and intangible assets |
(25,949 | ) | (21,939 | ) | ||||
| Debt costs |
(1,381 | ) | (1,308 | ) | ||||
| Unremitted foreign earnings—state deferred |
(1,273 | ) | (796 | ) | ||||
| Unremitted foreign earnings |
(16,252 | ) | (15,482 | ) | ||||
| Total deferred tax liabilities |
(55,988 | ) | (54,953 | ) | ||||
| Net deferred tax liabilities |
$ | (28,996 | ) | $ | (24,450 | ) | ||
Revision to the Prior Year Financial Statements
In the table above, the Company has revised amounts previously presented as of December 29, 2013 for the deferred tax asset related to the cumulative translation adjustment and the associated valuation allowance against deferred tax assets. The amount previously presented as a deferred tax asset for cumulative translation adjustment was reduced by $5,065, and the associated valuation allowance was also reduced by $5,065. The Company has determined this adjustment is quantitatively and qualitatively immaterial.
The Company has net deductible goodwill for income tax purposes of $90,697 at December 28, 2014.
The Company has gross U.S. federal net operating loss carryforwards in the amount of $31,467 at December 28, 2014 and $56,700 at December 29, 2013. These carryforwards will begin to expire in 2032. The Company has state net operating loss carryforwards in various states in amounts ranging from $946 to $3,556 that expire over the next 20 years. The Company also has federal general business tax credit carryforwards of approximately $5,612 which begin to expire in 2032. Immediately before expiration, unused credits may be converted to NOL deductions and carried forward an additional 20 years.
On July 21, 2012, the Company purchased 100% of the interest in the Predecessor from FC Holdings Inc. This event constitutes a change in ownership for purposes of Section 382 of the IRC. As a result, the amount of pre-change net operating losses (“NOLs”) and other tax attributes that are available to offset future taxable income are subject to an annual limitation. The annual limitation is based on the value of the corporation as of the effective date of the acquisition. As of December 29, 2013, approximately $9,547 of total federal NOLs were subject to annual Section 382 limitations. As of December 28, 2014, the cumulative limitation since the 2012 Acquisition equals total NOLs subject to Section 382 of the IRC. As a result, for the fiscal year ending December 28, 2014, the Company will be able to use all NOLs subject to Section 382. Subsequent ownership changes may result in further limitation on the Company’s ability to utilize existing NOLs and other tax attributes.
F-51
Table of Contents
Fogo de Chão, Inc.
Notes to Consolidated Financial Statements (Continued)
(in thousands, except share and per share amounts)
The Company considers undistributed earnings of its Brazilian subsidiary to not be indefinitely reinvested outside of the United States and, accordingly, U.S. deferred taxes have been recorded with respect to such earnings in accordance with the relevant accounting guidance for income taxes.
ASC 740 requires that the Company reduce its deferred income tax assets by a valuation allowance if, based on the weight of the available evidence, it is more likely than not that all or a portion of a deferred tax asset will not be realized. The ultimate realization of deferred tax assets is dependent upon the generation of future taxable income during the periods in which those temporary differences are deductible. The Company has determined that it is more likely than not that it will not be able to realize the benefit of deferred tax assets that exceed deferred tax liabilities and will reverse during the reversal period of the deferred tax assets, including the carryforward period of net operating losses. Additionally, there are certain deferred tax liabilities that have an indefinite reversal period, primarily related to trademarks, which cannot be used to support the reversal of deferred tax assets. The Company recorded a valuation allowance of $2,837 as of December 28, 2014 and $4,030 as of December 29, 2013 against its net deferred tax assets that are in excess of the deferred tax liabilities (excluding “naked credits”). Naked credits refer to deferred tax liabilities associated with the tax amortization of goodwill and indefinite lived intangible assets that are not amortized for financial reporting purposes.
Changes in the valuation allowance for deferred tax assets were as follows:
| Fiscal Year Ended | ||||||||
| December 28, 2014 | December 29, 2013 | |||||||
| Valuation allowance as of the beginning of the year |
$ | 4,030 | $ | — | ||||
| Charge as (benefit) expense to income tax provision(a) |
(2,290 | ) | 2,458 | |||||
| Changes to other comprehensive income |
1,097 | 1,572 | ||||||
| Valuation allowance as of end of year |
$ | 2,837 | $ | 4,030 | ||||
| (a) | For the fiscal year ended December 29, 2013, amount includes $743 of currency translation adjustment that was reclassified from other comprehensive income. |
The Company is subject to income taxes in the U.S federal jurisdiction and various states and foreign jurisdictions. Tax regulations within each jurisdiction are subject to the interpretation of the related tax laws and regulations and require significant judgment to apply. The Company has considered whether there are any uncertain tax positions, and has determined that there are no such uncertain tax positions.
The Company is potentially subject to income tax audits in numerous jurisdictions in the U.S and internationally until the applicable statute of limitations expires. The following is a summary of tax years potentially subject to examination in the significant tax and business jurisdictions in which the company operates:
| Jurisdiction | Tax Years Subject to Examination |
|||
| Brazil |
2008 – 2013 | |||
| United Sates (Federal, state, local) |
2012 – 2013 | |||
The Predecessor is also subject to examination by the U.S. federal government on its tax year ended July 20, 2012. Predecessor has undergone audits for years August 6, 2011 and December 31, 2011 and these have been completed with no adjustments.
11. Commitments and Contingencies
Lease Commitments
The Company leases its corporate office and various of its restaurant locations under non-cancelable operating leases. These leases have initial lease terms of between ten and twenty years and generally carry renewal options that can extend the term of the leases for an additional five to ten years.
F-52
Table of Contents
Fogo de Chão, Inc.
Notes to Consolidated Financial Statements (Continued)
(in thousands, except share and per share amounts)
Certain lease arrangements have contingent rental payments based on net sales thresholds per the lease agreement. Accrued liability for contingent rent was $148 and $123 as of December 28, 2014 and December 29, 2013, respectively. These balances are included in accounts payable and accrued expenses in the consolidated balance sheets.
Future minimum lease payments for non-cancelable leases (excluding contingent rental payments) are as follows:
| 2015 |
$ | 15,530 | ||
| 2016 |
15,901 | |||
| 2017 |
14,669 | |||
| 2018 |
12,359 | |||
| 2019 |
11,035 | |||
| Thereafter |
72,580 | |||
| Total |
$ | 142,074 |
Rent expense, attributable to non-cancelable operating leases for the Company’s corporate office and restaurant locations, for the fiscal years ended December 28, 2014 and December 29, 2013, the period from May 24, 2012 to December 30, 2012 (successor period), and for the period from January 2, 2012 to July 20, 2012 (predecessor period) was $16,875, $15,533, $5,696 and $7,165, respectively.
In connection with the 2012 Acquisition discussed in Note 1, the Company recognized at fair value both favorable lease assets and unfavorable lease liabilities, representing the difference between the market rates in effect for acquired leases compared to the various lease payments on individual operating leases. Favorable lease assets and liabilities are amortized to rent expense on a straight-line basis over each respective operating lease term. The amortization of favorable lease assets increases rent expense, while the amortization of unfavorable lease liabilities decreases rent expense. The net decrease in rent expense, resulting from the amortization of these favorable lease assets and unfavorable lease liabilities, was $153, $179 and $73 for the fiscal years ended December 28, 2014 and December 29, 2013 and the period from May 24, 2012 to December 30, 2012, respectively. Amortization of these lease assets and lease liabilities is expected to result in a net decrease in rent expense of approximately $177 for each of the fiscal years 2015 and 2016; $158 for fiscal year 2017; $140 for fiscal year 2018; and, $97 for fiscal year 2019.
Litigation
The Company is engaged in ordinary and routine litigation incidental to its business. Management does not anticipate that any amounts that the Company may be required to pay by reason of such litigation will have a materially adverse effect on its financial position or the results of its operations.
12. Concentration of Credit Risk
The Company relies on three food distributors for the majority of its beef and grocery purchases. However, the products purchased through the distributors are widely available at similar prices from multiple distributors. The Company does not anticipate any risk to the business in the event that one or both of these distributors is no longer available to provide their goods or services. However, a change in suppliers could potentially result in increased costs.
13. Segment Reporting
The Company owns and operates full-service, Brazilian steakhouses in the United States and Brazil under the brand name Fogo de Chão. Each restaurant operates with similar types of products and menus, providing a continuous service style, irrespective of location. Sales from external customers are derived principally from food and beverage sales, and the Company does not rely on any major customers as a source of sales. The Company’s joint venture in Mexico is included in the United States for segment reporting purposes as the operations of the joint venture are monitored by the United States segment management. The significant accounting policies of the segments are the same as those described in Note 2 – “Summary of Significant Accounting Policies.”
F-53
Table of Contents
Fogo de Chão, Inc.
Notes to Consolidated Financial Statements (Continued)
(in thousands, except share and per share amounts)
The following table presents the financial information of the Company’s operating segments for the fiscal years ended December 28, 2014 and December 29, 2013, and for the periods from May 24, 2012 to December 30, 2012 (successor period) and from January 2, 2012 to July 20, 2012 (predecessor period).
| Successor | Predecessor | |||||||||||||||||||
| Fiscal Year Ended | Period
from December 30, 2012 |
Period from January 2, 2012 to July 20, 2012 |
||||||||||||||||||
| December 28, 2014 |
December 29, 2013 |
|||||||||||||||||||
| Revenue |
||||||||||||||||||||
| United States |
$ | 200,010 | $ | 162,442 | $ | 66,853 | $ | 79,327 | ||||||||||||
| Brazil |
62,270 | 56,797 | 26,991 | 29,189 | ||||||||||||||||
| Total revenue |
$ | 262,280 | $ | 219,239 | $ | 93,844 | $ | 108,516 | ||||||||||||
| Restaurant contribution |
||||||||||||||||||||
| United States |
$ | 63,003 | $ | 49,331 | $ | 17,517 | $ |
22,984 |
| |||||||||||
| Brazil |
22,118 | 19,343 | 10,343 | 10,611 | ||||||||||||||||
| Total segment restaurant contribution |
$ | 85,121 | $ | 68,674 | $ | 27,860 | $ | 33,595 | ||||||||||||
| Capital expenditures |
||||||||||||||||||||
| United States(a) |
$ | 16,779 | $ | 34,277 | $ | 6,180 | $ | 6,841 | ||||||||||||
| Brazil |
1,175 | 4,365 | 1,639 | 1,899 | ||||||||||||||||
| Total capital expenditures(b) |
$ | 17,954 | $ | 38,642 | $ | 7,819 | $ | 8,740 | ||||||||||||
| (a) | For the fiscal year ended December 28, 2014, amount includes $1,065 attributable to the joint venture in Mexico. For all periods presented, amount excludes capital expenditures attributable to the Company’s corporate office in the United States. |
| (b) | Total capital expenditures includes non-cash capital expenditures included within accounts payable and accrued expenses as of the end of the period. |
The Company’s chief operating decision maker (“CODM”) evaluates segment performance using restaurant contribution, which is not a measure defined by GAAP. Restaurant contribution is a key metric used to evaluate the profitability of incremental sales at the restaurants, to evaluate restaurant performance across periods and to evaluate restaurant financial performance compared with competitors. Restaurant contribution is defined as revenue less restaurant operating costs (which includes food and beverage costs, compensation and benefits costs and occupancy and certain other operating costs but excludes depreciation and amortization expense). Depreciation and amortization expense is excluded because it is not an ongoing controllable cash expense.
F-54
Table of Contents
Fogo de Chão, Inc.
Notes to Consolidated Financial Statements (Continued)
(in thousands, except share and per share amounts)
The following table sets forth the reconciliation of total segment restaurant contribution to income (loss) from operations for the fiscal years ended December 28, 2014 and December 29, 2013, and for the periods from May 24, 2012 to December 30, 2012 (successor period) and from January 2, 2012 to July 20, 2012 (predecessor period).
| Successor | Predecessor | |||||||||||||||||||
| Fiscal Year Ended | Period from May 24, 2012 (Inception) to December 30, 2012 |
Period from January 2, 2012 to July 20, 2012 |
||||||||||||||||||
| December 28, 2014 |
December 29, 2013 |
|||||||||||||||||||
| Total segment restaurant contribution |
$ | 85,121 | $ | 68,674 | $ | 27,860 | $ | 33,595 | ||||||||||||
| Marketing and advertising costs |
5,585 | 6,188 | 2,342 | 2,488 | ||||||||||||||||
| General and administrative costs |
21,419 | 18,239 | 8,143 | 10,229 | ||||||||||||||||
| Pre-opening costs |
1,951 | 4,764 | 1,119 | 1,359 | ||||||||||||||||
| Acquisition costs |
— | — | 11,988 | 6,963 | ||||||||||||||||
| Loss on modification/extinguishment of debt |
3,090 | 6,875 | — | 7,762 | ||||||||||||||||
| Depreciation and amortization |
11,638 | 8,989 | 3,736 | 5,114 | ||||||||||||||||
| Other operating (income) expense, net |
46 | (371 | ) | (169 | ) | (157 | ) | |||||||||||||
| Total other operating costs and expenses |
43,729 | 44,684 | 27,159 | 33,758 | ||||||||||||||||
| Income (loss) from operations |
$ | 41,392 | $ | 23,990 | $ | 701 | $ | (163 | ) | |||||||||||
The table below sets forth the property and equipment attributable to each segment as of December 28, 2014 and December 29, 2013.
| December 28, 2014 |
December 29, 2013 |
|||||||
| Property and equipment, net |
||||||||
| United States(a) |
$ | 101,626 | $ | 93,806 | ||||
| Brazil |
10,832 | 13,722 | ||||||
| Total segment property and equipment, net |
112,458 | 107,528 | ||||||
| Corporate office(b) |
748 | 470 | ||||||
| Total property and equipment, net |
$ | 113,206 | $ | 107,998 | ||||
| (a) | Property and equipment, net at December 28, 2014, includes $986 attributable to the joint venture in Mexico. |
| (b) | Property and equipment, net attributable to the Company’s corporate office in the United States. |
The table below sets forth total assets as of December 28, 2014 and December 29, 2013.
| December 28, 2014 |
December 29, 2013 |
|||||||
| Total assets |
||||||||
| United States(a) |
$ | 380,566 | $ | 369,481 | ||||
| Brazil |
96,603 | 112,418 | ||||||
| Total assets |
$ | 477,169 | $ | 481,899 | ||||
| (a) | As of December 28, 2014, includes total assets of $1,455 attributable to the joint venture in Mexico that may only be used to settle the obligations of the joint venture. For all periods presented, includes assets attributable to the Company’s corporate office in the United States and assets that are not directly attributable to restaurant operations. |
F-55
Table of Contents
Fogo de Chão, Inc.
Notes to Consolidated Financial Statements (Continued)
(in thousands, except share and per share amounts)
14. Condensed Financial Information for Parent Company
Fogo de Chão, Inc. has no material assets or standalone operations other than its ownership in Brasa Holdings and its subsidiaries.
There are restrictions on Fogo de Chão, Inc.’s ability to obtain funds from any of its subsidiaries through dividends, loans or advances. Accordingly, this condensed financial information has been presented on a “Parent-only” basis. Under a Parent-only presentation, the Fogo de Chão, Inc.’s investments in its consolidated subsidiaries are presented under the equity method of accounting.
The following tables present the financial position of the Fogo de Chão, Inc. as of December 28, 2014 and December 29, 2013, and the results of its operations for the fiscal years ended December 28, 2014 and December 29, 2013, and for the period from May 24, 2012 to December 30, 2012.
| December 28, 2014 |
December 29, 2013 |
|||||||
| Assets: |
||||||||
| Investments in Brasa (Holdings) Inc. and its subsidiaries |
$ | 154,081 | $ | 150,322 | ||||
| Total assets |
$ | 154,081 | $ | 150,322 | ||||
| Shareholders’ Equity: |
||||||||
| Common stock, $0.01 par value, 1,200,000 shares authorized, 896,089 shares issued and outstanding as of December 28, 2014, and 890,439 shares issued and outstanding as of December 29, 2013 |
$ | 9 | $ | 9 | ||||
| Additional paid-in capital |
176,206 | 175,441 | ||||||
| Accumulated earnings (deficit) |
7,586 | (9,969 | ) | |||||
| Accumulated other comprehensive loss |
(29,720 | ) | (15,159 | ) | ||||
| Total shareholders’ equity |
$ | 154,081 | $ | 150,322 | ||||
|
Fiscal Year Ended |
Period from May 24, 2012 (Inception) to December 30, |
|||||||||||
| December 28, 2014 |
December 29, 2013 |
|||||||||||
| Equity in net income (loss) of Brasa (Holdings) Inc. and its subsidiaries |
$ | 17,555 | $ | (937 | ) | $ | (9,032 | ) | ||||
| Net income (loss) attributable to Fogo de Chão, Inc. |
17,555 | (937 | ) | (9,032 | ) | |||||||
| Other comprehensive loss |
(14,561 | ) | (14,388 | ) | (771 | ) | ||||||
| Comprehensive income (loss) |
$ | 2,994 | $ | (15,325 | ) | $ | (9,803 | ) | ||||
| Basic earnings (loss) per share |
$ | 19.69 | $ | (1.06 | ) | $ | (10.21 | ) | ||||
| Diluted earnings (loss) per share |
$ | 19.42 | $ | (1.06 | ) | $ | (10.21 | ) | ||||
| Basic weighted average shares outstanding |
891,523 | 885,940 | 884,850 | |||||||||
| Diluted weighted average shares outstanding |
904,067 | 885,940 | 884,850 | |||||||||
There were no cash flows at the parent company other than the July 2012 contribution from THL Funds of $172,050, which were immediately invested in Brasa Holdings and its subsidiaries in connection with the 2012 Acquisition.
F-56
Table of Contents
Fogo de Chão, Inc.
Notes to Consolidated Financial Statements (Continued)
(in thousands, except share and per share amounts)
15. Related-Party Transactions
The Company and its wholly-owned subsidiaries entered into an agreement with an affiliated entity of its private equity fund owners, (“Sponsor”), to provide management, consulting and financial and other advisory services to the Company. The agreement requires the Company to pay Sponsor $5,000 in consideration for providing financial advisory services in connection with the 2012 Acquisition and a non-refundable periodic retainer fee in an amount per year of the greater of $750 or 1.50% of Consolidated EBITDA, as defined in the agreement, for the immediately preceding fiscal year. Under this agreement, the Company recorded $5,000 of expense in the period from May 24, 2012 to December 30, 2012 (successor period) for financial advisory services provided in connection with the 2012 Acquisition. This amount is included in acquisition costs in the consolidated statement of operations and comprehensive loss. Additionally, the Company recorded $781, $796 and $338 of expense attributable to the periodic retainer fees during the fiscal years ended December 28, 2014 and December 29, 2013 and for the period from May 24, 2012 to December 30, 2012 (successor period), respectively. These amounts are included in general and administrative costs in the consolidated statements of operations and comprehensive income (loss). The Company also recorded $76 and $989 of expense during the fiscal years ended December 28, 2014 and December 29, 2013, respectively, for additional expenses. These amounts are included in general and administrative costs in the consolidated statements of operations and comprehensive income (loss). The Company had an outstanding payable due Sponsor of $8 and $141 for reimbursement of expenses at December 28, 2014 and December 29, 2013, respectively.
16. Subsequent Events
For its consolidated financial statements as of and for the fiscal year ended December 28, 2014, the Company has evaluated subsequent events through April 7, 2015, the date these financial statements were issued.
Formation of Venture for Development in the Middle East
During the first quarter of 2015, a wholly-owned subsidiary of the Company entered into a shareholders agreement with FDC Global Holdings B.V., a non-related party owned by the Enany Group, to form FD Restaurants Ltd., a Cayman Islands exempted company (the “Middle East Venture”) for the purposes of jointly developing, constructing and operating Brazilian style steakhouses under the “Fogo de Chão” name in certain locations in the United Arab Emirates, Qatar, Kuwait, Oman, Bahrain, the Kingdom of Saudi Arabia and Lebanon. Pursuant to the agreement, the Company will own 51% of the ownership interests in the Middle East Venture and will be entitled to receive 50% of the profits of the Middle East Venture after the parties recoup their initial contributions. The Company will be entitled to a license fee equal to a percentage of the annual gross revenue of each restaurant developed, constructed or operated by the Middle East Venture.
F-57
Table of Contents
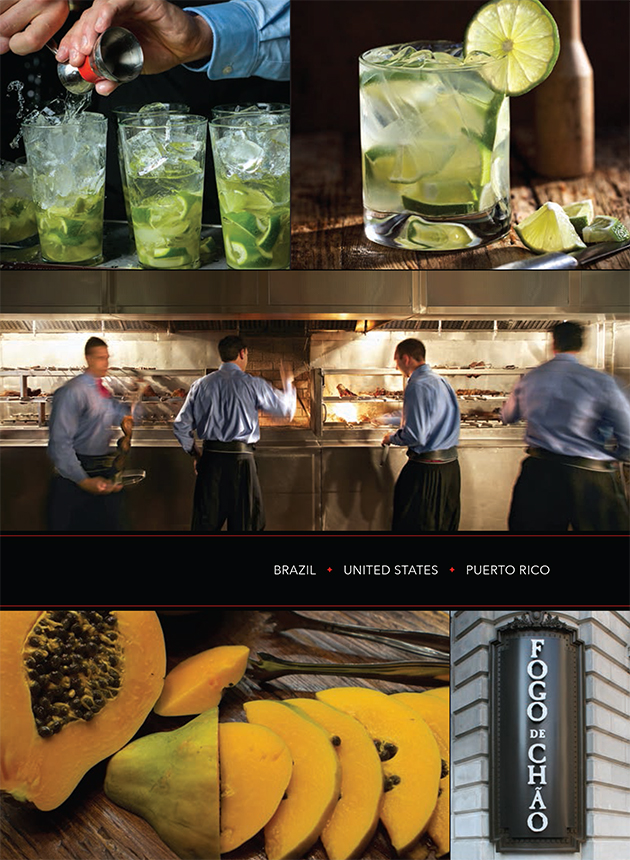
BRAZIL UNITED STATES PUERTO RICO
Table of Contents

Table of Contents
We are the keepers of the gaucho tradition.
Table of Contents
4,411,764 Shares
Fogo de Chão, Inc.
Common Stock PRELIMINARY PROSPECTUS Jefferies J.P. Morgan Credit Suisse Deutsche Bank Securities Piper Jaffray Wells Fargo Securities Macquarie Capital Until , 2015 (the 25th day after the date of this prospectus), all dealers that effect transactions in these securities, whether or not participating in this offering, may be required to deliver a prospectus. This is in addition to the dealers’ obligation to deliver a prospectus when acting as underwriters and with respect to their unsold allotments or subscriptions.
, 2015
Table of Contents
PART II
INFORMATION NOT REQUIRED IN PROSPECTUS
| Item 13. | Other Expenses of Issuance and Distribution. |
The following table sets forth the estimated costs and expenses (other than underwriting discounts and commissions, the SEC registration fee, the FINRA filing fee and the NASDAQ listing fee) payable by us in connection with the sale of our common stock being registered hereby.
| Amount to be Paid | ||||
| SEC registration fee |
$ | 10,612 | ||
| FINRA filing fee |
14,199 | |||
| NASDAQ listing fee |
125,000 | |||
| Printing and engraving expenses |
450,000 | |||
| Legal fees and expenses |
1,100,000 | |||
| Blue sky fees and expenses |
15,000 | |||
| Accounting fees and expenses |
795,000 | |||
| Transfer agent and registrar fees and expenses |
3,500 | |||
| Miscellaneous expenses |
286,689 | |||
|
|
|
|||
| Total |
$ | 2,800,000 | ||
|
|
|
|||
| Item 14. | Indemnification of Directors and Officers. |
Section 102 of the Delaware General Corporation Law (the “DGCL”) permits a corporation to provide in its certificate of incorporation that a director of the corporation shall not be personally liable to the corporation or its stockholders for monetary damages for breach of fiduciary duty as a director, except for liability (i) for any breach of the director’s duty of loyalty to the corporation or its stockholders, (ii) for acts or omissions not in good faith or which involve intentional misconduct or a knowing violation of law, (iii) for unlawful payments of dividends or unlawful stock repurchases, redemptions or other distributions pursuant to Section 174 of the DGCL, or (iv) for any transaction from which the director derived an improper personal benefit. Section 174 of the DGCL provides, among other things, that a director who willfully and negligently approves of an unlawful payment of dividends or an unlawful stock purchase or redemption may be held liable for such actions. A director who was either absent when the unlawful actions were approved or dissented at the time, may avoid liability by causing his or her dissent to such actions to be entered in the books containing the minutes of the meetings of the board of directors at the time the action occurred or immediately after the absent director receives notice of the unlawful acts. Our amended and restated certificate of incorporation includes a provision that eliminates the personal liability of directors for monetary damages for actions taken as a director to the fullest extent authorized by the DGCL.
Section 145 of the DGCL provides that a corporation may indemnify directors and officers as well as other employees and individuals against expenses (including attorneys’ fees), judgments, fines and amounts paid in settlement actually and reasonably incurred by such person in connection with any threatened, pending or completed actions, suits or proceedings in which such person is made a party by reason of such person being or having been a director, officer, employee or agent to the Registrant. The DGCL provides that Section 145 is not exclusive of other rights to which those seeking indemnification may be entitled under any bylaw, agreement, vote of stockholders or disinterested directors or otherwise.
Our existing certificate of incorporation generally provides that we will indemnify our directors and officers to the fullest extent permitted by law. Our existing certificate of incorporation also provides that the indemnification and advancement of expenses provided by, or granted pursuant to the existing certificate of incorporation are not exclusive of any other rights to which those seeking indemnification or advancement of expenses may be entitled under any bylaw, agreement, vote of stockholders or otherwise. Section 145(f) of the DGCL further provides that a right to indemnification or to advancement of expenses arising under a provision of the certificate of incorporation shall not be eliminated or impaired by an amendment to such provision after the occurrence of the act or omission which is the subject of the civil, criminal, administrative or investigation action, suit or proceeding for which indemnification or advancement of expenses is sought.
II-1
Table of Contents
We currently have indemnification agreements in place with our directors. In connection with this offering, we intend to enter into separate indemnification agreements with each of our directors and executive officers, which is in addition to and may be broader than the indemnification provided for in our charter documents. These agreements, among other things, provide for indemnification of our directors and executive officers for expenses, judgments, fines and settlement amounts incurred by this person in any action or proceeding arising out of this person’s services as a director or executive officer or at our request. We believe that these provisions and agreements are necessary to attract and retain qualified persons as directors and executive officers. There is no pending litigation or proceeding involving a director or executive officer of the registrant for which indemnification is sought.
Insofar as indemnification for liabilities arising under the Securities Act of 1933 may be permitted to directors, officers or persons controlling us pursuant to the foregoing provisions, we have been informed that in the opinion of the Securities and Exchange Commission such indemnification is against public policy as expressed in the Act and is therefore unenforceable.
We also will maintain officers’ and directors’ liability insurance which insures against liabilities that officers and directors of the registrant may, in such capacities, incur. Section 145(g) of the DGCL provides that a corporation shall have power to purchase and maintain insurance on behalf of any person who is or was a director or officer of the corporation, or is or was serving at the request of the corporation as a director or officer of another entity, against any liability asserted against such person and incurred by such person in any such capacity, or arising out of such person’s status as such, whether or not the corporation would have the power to indemnify such person against such liability under that section.
The underwriting agreement we will enter into in connection with the offering of common stock described in this registration statement provides for indemnification by the underwriters of the registrant and its executive officers and directors, by the registrant of the underwriters, for certain liabilities, including liabilities arising under the Securities Act.
| Item 15. | Recent Sales of Unregistered Securities. |
During the three-year period preceding the date of filing of this registration statement, we have issued securities in the transactions described below without registration under the Securities Act.
No underwriters were involved in the sales and the certificates representing the securities sold and issued contain legends restricting the transfer of the securities without registration under the Securities Act or an applicable exemption from registration.
| • | On May 24, 2012, Fogo de Chão, Inc. (Successor) was incorporated under the name Brasa (Parent Inc.) in connection with the acquisition on July 20, 2012 of Fogo de Chão Churrascaria (Holdings) LLC, and its parent company, FC Holdings Inc. by a collaborate group consisting of funds affiliated with Thomas H. Lee Partners, L.P. (“THL”) and other minority investors, which, together with THL are referred to as the THL Funds. The acquisition was financed by loans and by equity contributions by the THL Funds and certain members of management. In connection with the acquisition, on July 21, 2012, we issued 22,527,247 shares (884,850 shares before giving effect to the consummation of the stock split to be effected upon the closing of this offering pursuant to which each share held by the holder of common stock will be reclassified into 25.4588 shares) of our common stock to the THL Funds and certain members of management for aggregate consideration of $172.1 million. The issuances of these securities were deemed to be exempt from registration under the Securities Act in reliance upon Section 4(a)(2) of the Securities Act, and Regulation D or Regulation S promulgated thereunder, as transactions by an issuer not involving any public offering. |
| • | Our 2012 Omnibus Equity Incentive Plan was adopted on July 20, 2012. Awards granted under the 2012 Omnibus Equity Incentive Plan may consist of ISOs, nonqualified stock options, SARs, restricted stock and other stock based awards. As of May 1, 2015, there were 2,197,382 stock options (86,312 shares before giving effect to the consummation of the stock split to be effected upon the closing of this offering), all of which were nonqualified stock options, and 603,934 shares (23,722 shares before giving effect to the consummation of the stock split to be effected upon the closing of this offering) of restricted stock outstanding under the 2012 Omnibus Equity Incentive Plan. |
II-2
Table of Contents
| • | In July 2013, we awarded under our 2012 Omnibus Equity Incentive Plan to an employee (i) options to purchase 188,395 shares (7,400 shares before giving effect to the consummation of the stock split to be effected upon the closing of this offering) of our common stock at an exercise price of $8.06 per share ($205.14 before giving effect to the consummation of the stock split to be effected upon the closing of this offering) and (ii) options to purchase 78,922 shares (3,100 shares before giving effect to the consummation of the stock split to be effected upon the closing of this offering) of our common stock at an exercise price of $16.11 per share ($410.18 before giving effect to the consummation of the stock split to be effected upon the closing of this offering). |
| • | In November 2013, we awarded under our 2012 Omnibus Equity Incentive Plan to certain directors and consultants (i) options to purchase 15,528 shares of our common stock at an exercise price of $8.06 per share and (ii) 3,106 shares of restricted stock to a director ((i) 610 shares at an exercise price of $205.14 and (ii) 122 shares, respectively, before giving effect to the consummation of the stock split to be effected upon the closing of this offering). |
| • | In February 2014, we awarded under our 2012 Omnibus Equity Incentive Plan to an employee (i) options to purchase 89,105 shares of our common stock at an exercise price of $8.31 per share and (ii) options to purchase 38,188 shares of our common stock at an exercise price of $16.62 per share ((i) 3,500 shares at an exercise price of $211.51 and (ii) 1,500 shares at an exercise price of $423.02, respectively, before giving effect to the consummation of the stock split to be effected upon the closing of this offering). |
| • | In November 2014, we awarded under our 2012 Omnibus Equity Incentive Plan (i) options to certain employees and consultants to purchase 91,651 shares of our common stock at an exercise price of $10.78 per share and 30,550 shares of our common stock at an exercise price of $21.57 per share, and (ii) 2,316 shares of restricted stock to a director pursuant to a previously authorized annual award ((i) 3,600 shares at an exercise price of $274.54 and 1,200 shares at an exercise price of $549.08 and (ii) 91 shares, respectively, before giving effect to the consummation of the stock split to be effected upon the closing of this offering). |
| • | In December 2014, we awarded under our 2012 Omnibus Equity Incentive Plan to a director (i) options to purchase 2,316 shares of our common stock at an exercise price of $10.78 per share and (ii) 2,316 shares of restricted stock ((i) 91 shares at an exercise price of $274.54 and (ii) 91 shares, respectively, before giving effect to the consummation of the stock split to be effected upon the closing of this offering). |
| • | In January 2015, we awarded under our 2012 Omnibus Equity Incentive Plan to a director (i) options to purchase 2,316 shares of our common stock at an exercise price of $10.78 per share and (ii) 2,316 shares of restricted stock ((i) 91 shares at an exercise price of $274.54 and (ii) 91 shares, respectively, before giving effect to the consummation of the stock split to be effected upon the closing of this offering). |
| • | In February 2015, we entered into three Director Securities Purchase Agreements pursuant to which we issued and sold to three directors, each an accredited investor, 27,876 shares (1,095 shares before giving effect to the consummation of the stock split to be effected upon the closing of this offering pursuant to which each share held by the holder of common stock will be reclassified into 25.4588 shares) of common stock, at a purchase price of $10.78 per share ($274.54 before giving effect to the stock split to be effected upon the closing of this offering), for cash consideration of $0.3 million. |
Each of the foregoing issuance of securities will be exempt from registration under the Securities Act in reliance on Section 4(2) thereof or Regulation D promulgated thereunder relating to sales not involving a public offering and pursuant to Rule 701 promulgated under the Securities Act, as offers and sales of securities under certain compensatory benefit plans or written agreements relating to compensation as provided under such Rule 701, or Regulation S promulgated under the Securities Act, with respect to the securities offered and sold outside the United States to investors who were neither citizens nor residents of the United States.
II-3
Table of Contents
| Item 16. | Exhibits and Financial Statement Schedules. |
(a) Exhibits
| Exhibit |
Description of Document | |
| 1.1 | Form of Underwriting Agreement | |
| 3.1 | Form of Amended and Restated Certificate of Incorporation of Fogo de Chão, Inc. | |
| 3.2 | Form of Amended and Restated Bylaws of Fogo de Chão, Inc. | |
| 4.1 | Form of Amended and Restated Registration Rights Agreement among Fogo de Chão, Inc., the THL Investors, the Management Stockholders and the Other Investors named therein | |
| 5.1 | Opinion of Davis Polk & Wardwell LLP | |
| 10.1# | Brasa (Parent) Inc. 2012 Omnibus Equity Incentive Plan** | |
| 10.2# | Fogo de Chão, Inc. 2015 Omnibus Incentive Plan | |
| 10.3# | Form of Nonqualified Stock Option Award Agreement under the Brasa (Parent) Inc. 2012 Omnibus Equity Incentive Plan** | |
| 10.4# | Form of Notice of Restricted Stock Issuance under the Brasa (Parent) Inc. 2012 Omnibus Equity Incentive Plan** | |
| 10.5# | Form of Restricted Stock Agreement under the Brasa (Parent) Inc. 2012 Omnibus Equity Incentive Plan** | |
| 10.6# | Amended and Restated Employment Agreement with Lawrence J. Johnson dated as of July 20, 2012*** | |
| 10.7 | First Lien Credit Agreement dated as of July 20, 2012 among Brasa (Holdings) Inc., Brasa (Purchaser) Inc., JPMorgan Chase Bank, N.A., the other lenders party thereto and Jefferies Finance LLC and Golub Capital LLC** | |
| 10.8 | First Amendment to the First Lien Credit Agreement dated as of August 23, 2013** | |
| 10.9 | Second Amendment to the First Lien Credit Agreement dated as of April 9, 2014** | |
| 10.10 | Second Lien Credit Agreement dated as of July 20, 2012 among Brasa (Holdings) Inc., Brasa (Purchaser) Inc., Wilmington Trust, National Association, the other lenders party thereto and JPMorgan Chase Bank N.A. and Jefferies Finance LLC** | |
| 10.11 | First Amendment to the Second Lien Credit Agreement dated as of April 9, 2014** | |
| 10.12 | Form of Indemnification Agreement between Fogo de Chão, Inc. and its directors and certain officers | |
| 10.13# | Employment Agreement with Selma Oliveira dated as of July 11, 2014** | |
| 10.14# | Form of Notice of Nonqualified Stock Option Award under the Fogo de Chão, Inc. 2015 Omnibus Incentive Plan | |
| 10.15# | Fogo de Chão, Inc. Management Incentive Plan | |
| 10.16 | Director Securities Purchase Agreement by and between Fogo de Chão, Inc. and Gerald W. Deitchle dated February 6, 2015 | |
| 10.17 | Director Securities Purchase Agreement by and between Fogo de Chão, Inc. and Neil Moses dated February 6, 2015 | |
| 10.18 | Director Securities Purchase Agreement by and between Fogo de Chão, Inc. and Douglas R. Pendergast dated February 6, 2015 | |
| 21.1 | Subsidiaries of Fogo de Chão, Inc. | |
| 23.1 | Consent of PricewaterhouseCoopers LLP, Independent Registered Public Accounting Firm | |
| 23.2 | Consent of PricewaterhouseCoopers LLP, Independent Registered Public Accounting Firm | |
| 23.3 | Consent of Davis Polk & Wardwell LLP (included in Exhibit 5.1) | |
| 23.4 | Consent of Buxton Co.** | |
| 24.1 | Powers of Attorney (included in the signature page to the registration statement)** | |
| # | Indicates management contract or compensatory plan |
| ** | Filed as part of this Registration Statement on Form S-1 (Registration no. 333-203527) on April 20, 2015 |
| *** | Filed as part of this Registration Statement on Form S-1 (Registration No. 333-203527) on May 27, 2015 |
(b) Financial Statement Schedules
All schedules have been omitted because they are not applicable, not required or the required information is included in the Financial Statements or the notes thereto.
II-4
Table of Contents
| Item 17. | Undertakings. |
We hereby undertake to provide to the underwriters at the closing specified in the underwriting agreement, certificates in such denominations and registered in such names as required by the underwriters to permit prompt delivery to each purchaser.
Insofar as indemnification for liabilities arising under the Securities Act may be permitted to our directors, officers and controlling persons pursuant to the provisions referenced in Item 14 of this registration statement, or otherwise, we have been advised that in the opinion of the SEC such indemnification is against public policy as expressed in the Securities Act and is, therefore, unenforceable. In the event that a claim for indemnification against such liabilities (other than the payment by us of expenses incurred or paid by a director, officer, or controlling person of us in the successful defense of any action, suit, or proceeding) is asserted by such director, officer, or controlling person in connection with the securities being registered, we will, unless in the opinion of counsel the matter has been settled by controlling precedent, submit to a court of appropriate jurisdiction the question whether such indemnification by it is against public policy as expressed in the Securities Act and will be governed by the final adjudication of such issue.
We hereby undertake that:
(i) for purposes of determining any liability under the Securities Act, the information omitted from the form of prospectus filed as part of this registration statement in reliance upon Rule 430A and contained in a form of prospectus filed by the registrant pursuant to Rule 424(b)(1) or (4) or 497(h) under the Securities Act shall be deemed to be part of this registration statement as of the time it was declared effective.
(ii) for purposes of determining any liability under the Securities Act, each post-effective amendment that contains a form of prospectus shall be deemed to be a new registration statement relating to the securities offered therein, and the offering of such securities at that time shall be deemed to be the initial bona fide offering thereof.
II-5
Table of Contents
SIGNATURES
Pursuant to the requirements of the Securities Act of 1933, the Registrant has duly caused this registration statement to be signed on its behalf by the undersigned, thereunto duly authorized, in Dallas, Texas, on the 8th day of June, 2015.
| Fogo de Chão, Inc. | ||
| By: | /s/ Lawrence J. Johnson | |
| Name: Lawrence J. Johnson | ||
| Title: Chief Executive Officer | ||
Pursuant to the requirements of the Securities Act of 1933, this registration statement has been signed by the following persons in the capacities and on the dates indicated:
| Signature | Title | Date | ||
| /s/ Lawrence J. Johnson Lawrence J. Johnson |
Director and Chief Executive Officer |
June 8, 2015 | ||
| /s/ Anthony D. Laday Anthony D. Laday |
Chief Financial Officer |
June 8, 2015 | ||
| * Michael A. Prentiss |
Chief Accounting Officer |
June 8, 2015 | ||
| * George Barry McGowan |
President |
June 8, 2015 | ||
| * Todd M. Abbrecht |
Director |
June 8, 2015 | ||
| * Gerald W. Deitchle |
Director |
June 8, 2015 | ||
| * Douglas A. Haber |
Director |
June 8, 2015 | ||
| * Neil Moses |
Director |
June 8, 2015 | ||
| * Douglas R. Pendergast |
Director |
June 8, 2015 | ||
| * Jeff T. Swenson |
Director |
June 8, 2015 | ||
| *By: |
/s/ Anthony D. Laday | |
| Anthony D. Laday, Attorney-in-Fact |
II-6
Table of Contents
| Exhibit |
Description of Document | |
| 1.1 | Form of Underwriting Agreement | |
| 3.1 | Form of Amended and Restated Certificate of Incorporation of Fogo de Chão, Inc. | |
| 3.2 | Form of Amended and Restated Bylaws of Fogo de Chão, Inc. | |
| 4.1 | Form of Amended and Restated Registration Rights Agreement among Fogo de Chão, Inc., the THL Investors, the Management Stockholders and the Other Investors named therein | |
| 5.1 | Opinion of Davis Polk & Wardwell LLP | |
| 10.1# | Brasa (Parent) Inc. 2012 Omnibus Equity Incentive Plan** | |
| 10.2# | Fogo de Chão, Inc. 2015 Omnibus Incentive Plan | |
| 10.3# | Form of Nonqualified Stock Option Award Agreement under the Brasa (Parent) Inc. 2012 Omnibus Equity Incentive Plan** | |
| 10.4# | Form of Notice of Restricted Stock Issuance under the Brasa (Parent) Inc. 2012 Omnibus Equity Incentive Plan** | |
| 10.5# | Form of Restricted Stock Agreement under the Brasa (Parent) Inc. 2012 Omnibus Equity Incentive Plan** | |
| 10.6# | Amended and Restated Employment Agreement with Lawrence J. Johnson dated as of July 20, 2012*** | |
| 10.7 | First Lien Credit Agreement dated as of July 20, 2012 among Brasa (Holdings) Inc., Brasa (Purchaser) Inc., JPMorgan Chase Bank, N.A., the other lenders party thereto and Jefferies Finance LLC and Golub Capital LLC** | |
| 10.8 | First Amendment to the First Lien Credit Agreement dated as of August 23, 2013** | |
| 10.9 | Second Amendment to the First Lien Credit Agreement dated as of April 9, 2014** | |
| 10.10 | Second Lien Credit Agreement dated as of July 20, 2012 among Brasa (Holdings) Inc., Brasa (Purchaser) Inc., Wilmington Trust, National Association, the other lenders party thereto and JPMorgan Chase Bank N.A. and Jefferies Finance LLC** | |
| 10.11 | First Amendment to the Second Lien Credit Agreement dated as of April 9, 2014** | |
| 10.12 | Form of Indemnification Agreement between Fogo de Chão, Inc. and its directors and certain officers | |
| 10.13# | Employment Agreement with Selma Oliveira dated as of July 11, 2014** | |
| 10.14# | Form of Notice of Nonqualified Stock Option Award under the Fogo de Chão, Inc. 2015 Omnibus Incentive Plan | |
| 10.15# | Fogo de Chão, Inc. Management Incentive Plan | |
| 10.16 | Director Securities Purchase Agreement by and between Fogo de Chão, Inc. and Gerald W. Deitchle dated February 6, 2015 | |
| 10.17 | Director Securities Purchase Agreement by and between Fogo de Chão, Inc. and Neil Moses dated February 6, 2015 | |
| 10.18 | Director Securities Purchase Agreement by and between Fogo de Chão, Inc. and Douglas R. Pendergast dated February 6, 2015 | |
| 21.1 | Subsidiaries of Fogo de Chão, Inc. | |
| 23.1 | Consent of PricewaterhouseCoopers LLP, Independent Registered Public Accounting Firm | |
| 23.2 | Consent of PricewaterhouseCoopers LLP, Independent Registered Public Accounting Firm | |
| 23.3 | Consent of Davis Polk & Wardwell LLP (included in Exhibit 5.1) | |
| 23.4 | Consent of Buxton Co.** | |
| 24.1 | Powers of Attorney (included in the signature page to the registration statement)** | |
| # | Indicates management contract or compensatory plan |
| ** | Filed as part of this Registration Statement on Form S-1 (Registration no. 333-203527) on April 20, 2015 |
| *** | Filed as part of this Registration Statement on Form S-1 (Registration No. 333-203527) on May 27, 2015 |
II-7