Attached files
| file | filename |
|---|---|
| EX-23.2 - EX-23.2 - SunGard | d924335dex232.htm |
| EX-21.1 - EX-21.1 - SunGard | d924335dex211.htm |
| EX-24.1 - EX-24.1 - SunGard | d924335dex241.htm |
Table of Contents
As filed with the Securities and Exchange Commission on June 3, 2015
Registration No. 333-
UNITED STATES
SECURITIES AND EXCHANGE COMMISSION
Washington, D.C. 20549
FORM S-1
REGISTRATION STATEMENT
UNDER
THE SECURITIES ACT OF 1933
SunGard
(Exact name of registrant as specified in its charter)
| Delaware | 7372 | 20-3059890 | ||
| (State or other jurisdiction of incorporation or organization) |
(Primary Standard Industrial Classification Code Number) |
(I.R.S. Employer Identification Number) |
680 East Swedesford Road
Wayne, Pennsylvania 19087
(484) 582-5400
(Address, including zip code, and telephone number, including area code, of registrant’s principal executive offices)
Victoria E. Silbey, Esq.
Senior Vice President—Legal and Chief Legal Officer
SunGard
680 East Swedesford Road
Wayne, Pennsylvania 19087
(484) 582-5400
(Name, address, including zip code, and telephone number, including area code, of agent for service)
With copies to:
| Richard A. Fenyes, Esq. Simpson Thacher & Bartlett LLP 425 Lexington Avenue New York, New York 10017-3954 (212) 455-2000 |
Thomas Holden, Esq. Patrick O’Brien, Esq. Ropes & Gray LLP 3 Embarcadero Center San Francisco, California 94111-4006 (415) 315-6300 |
Approximate date of commencement of proposed sale to the public: As soon as practicable after this Registration Statement is declared effective.
If any of the securities being registered on this Form are to be offered on a delayed or continuous basis pursuant to Rule 415 under the Securities Act of 1933, check the following box. ¨
If this Form is filed to register additional securities for an offering pursuant to Rule 462(b) under the Securities Act, please check the following box and list the Securities Act registration statement number of the earlier effective registration statement for the same offering. ¨
If this Form is a post-effective amendment filed pursuant to Rule 462(c) under the Securities Act, check the following box and list the Securities Act registration statement number of the earlier effective registration statement for the same offering. ¨
If this Form is a post-effective amendment filed pursuant to Rule 462(d) under the Securities Act, check the following box and list the Securities Act registration statement number of the earlier effective registration statement for the same offering. ¨
Indicate by check mark whether the registrant is a large accelerated filer, an accelerated filer, a non-accelerated filer, or a smaller reporting company. See the definitions of “large accelerated filer,” “accelerated filer” and “smaller reporting company” in Rule 12b-2 of the Exchange Act.
| Large accelerated filer | ¨ | Accelerated filer | ¨ | |||
| Non-accelerated filer | x (Do not check if a smaller reporting company) | Smaller reporting company | ¨ | |||
CALCULATION OF REGISTRATION FEE
|
| ||||
| Title of Each Class of Securities to be Registered |
Proposed Maximum Aggregate Offering Price(1)(2) |
Amount of Registration Fee | ||
| Common Stock, par value $0.01 per share |
$100,000,000 | $11,620 | ||
|
| ||||
|
| ||||
| (1) | Estimated solely for the purpose of computing the amount of the registration fee pursuant to Rule 457(o) under the Securities Act of 1933, as amended (the “Securities Act”). |
| (2) | Includes additional shares that the Underwriters have the option to purchase to cover over-allotments, if any. See “Underwriting (Conflicts of Interest).” |
The registrant hereby amends this Registration Statement on such date or dates as may be necessary to delay its effective date until the registrant shall file a further amendment which specifically states that this Registration Statement shall thereafter become effective in accordance with Section 8(a) of the Securities Act of 1933, as amended, or until the Registration Statement shall become effective on such date as the Securities and Exchange Commission, acting pursuant to said Section 8(a), may determine.
Table of Contents
The information in this preliminary prospectus is not complete and may be changed. These securities may not be sold until the registration statement filed with the Securities and Exchange Commission is effective. This preliminary prospectus is not an offer to sell nor does it seek an offer to buy these securities in any jurisdiction where the offer or sale is not permitted.
Subject to Completion, Dated June 3, 2015
Shares

Common Stock
This is an initial public offering of shares of common stock of SunGard. We are offering shares of our common stock.
Prior to this offering, there has been no public market for our common stock. We currently estimate that the initial public offering price per share will be between $ and $ . We intend to apply to list our common stock on under the symbol “ .” After the completion of this offering, affiliates of Bain Capital Partners, The Blackstone Group, Goldman, Sachs & Co., KKR & Co. L.P., Providence Equity Partners, Silver Lake Partners and TPG Capital (collectively, the “Sponsors”) will continue to own a majority of the voting power of all outstanding shares of our common stock. As a result, we will be a “controlled company” within the meaning of the corporate governance standards of . See “Principal Stockholders.”
Investing in our common stock involves risk. See “Risk Factors” on page 14 to read about factors you should consider before buying shares of our common stock.
Neither the Securities and Exchange Commission nor any other regulatory body has approved or disapproved of these securities or passed upon the accuracy or adequacy of this prospectus. Any representation to the contrary is a criminal offense.
| Per Share |
Total | |||||||
| Initial public offering price |
$ | $ | ||||||
| Underwriting discounts and commissions(1) |
$ | $ | ||||||
| Proceeds, before expenses, to us |
$ | $ | ||||||
| (1) | See “Underwriting (Conflicts of Interest).” |
To the extent that the underwriters sell more than shares of common stock, the underwriters have the option to purchase up to an additional shares from us at the initial price to the public, less the underwriting discounts and commissions, within 30 days of the date of this prospectus.
The underwriters expect to deliver the shares against payment in New York, New York on , 2015.
Joint Book-Running Managers
| J.P. Morgan | Goldman, Sachs & Co. | Barclays | Deutsche Bank Securities | Credit Suisse |
| BofA Merrill Lynch |
| Citigroup |
| Morgan Stanley |
| RBC Capital Markets |
| UBS Investment Bank |
| Wells Fargo Securities |
Prospectus dated , 2015.
Table of Contents
Prospectus
| Page | ||||
| ii | ||||
| ii | ||||
| iii | ||||
| 1 | ||||
| 14 | ||||
| 33 | ||||
| 35 | ||||
| 36 | ||||
| 37 | ||||
| 39 | ||||
| 40 | ||||
| 42 | ||||
| Management’s Discussion and Analysis of Financial Condition and Results of Operations |
46 | |||
| 87 | ||||
| 98 | ||||
| 133 | ||||
| 138 | ||||
| 141 | ||||
| 146 | ||||
| 154 | ||||
| Certain United States Federal Income and Estate Tax Consequences to Non-U.S. Holders |
157 | |||
| 160 | ||||
| 167 | ||||
| 167 | ||||
| 167 | ||||
| F-1 | ||||
Through and including , 2015 (the 25th day after the date of this prospectus), all dealers effecting transactions in these securities, whether or not participating in this offering, may be required to deliver a prospectus. This is in addition to a dealer’s obligation to deliver a prospectus when acting as an underwriter and with respect to an unsold allotment or subscription.
We have not authorized anyone to provide any information or to make any representations other than those contained in this prospectus or in any free writing prospectuses we have prepared. We take no responsibility for, and can provide no assurance as to the reliability of, any other information that others may give you. This prospectus is an offer to sell only the shares offered hereby, but only under circumstances and in jurisdictions where it is lawful to do so. The information contained in this prospectus is current only as of its date.
Unless otherwise indicated or the context otherwise requires, financial data in this prospectus reflects the consolidated business and operations of SunGard and its consolidated subsidiaries.
The consolidated financial statements of SunGard included in this prospectus are presented in U.S. Dollars rounded to the nearest million, with amounts in this prospectus rounded to the nearest million, except for per share amounts. Therefore, discrepancies in the tables between totals and the sums of the amounts listed may occur due to such rounding. The accounting policies set out in the audited consolidated financial statements contained elsewhere in this prospectus have been consistently applied to all periods presented.
i
Table of Contents
This prospectus includes industry and trade association data, forecasts and information that we have prepared based, in part, upon data, forecasts and information obtained from independent trade associations, industry publications and surveys and other information available to us. Some data is also based on our good faith estimates, which are derived from management’s knowledge of the industry and independent sources.
This prospectus contains “non-GAAP measures” that are financial measures that either exclude or include amounts that are not excluded or included in the most directly comparable measures calculated and presented in accordance with generally accepted accounting principles in the United States (“GAAP”). Specifically, we make use of the non-GAAP financial measures “Adjusted EBITDA” and “Constant-Currency Basis.”
Adjusted EBITDA
Our primary non-GAAP measure is Adjusted EBITDA, whose corresponding GAAP measure is net income (loss). We define Adjusted EBITDA as net income (loss) less income (loss) from discontinued operations, income taxes, loss on extinguishment of debt, interest expense and amortization of deferred financing fees, depreciation (including the amortization of capitalized software), amortization of acquisition-related intangible assets, trade name and goodwill impairment charges, severance and facility closure charges, stock compensation expense, management fees from our Sponsors, and certain other costs.
We believe Adjusted EBITDA is an effective tool to measure our operating performance since it excludes non-cash items and certain variable charges. We use Adjusted EBITDA extensively to measure the financial performance of SunGard, and also to report our results to our board of directors. We use a similar measure, as defined in our senior secured credit agreement, for purposes of computing our debt covenants.
While Adjusted EBITDA and similar measures are frequently used as measures of operations and the ability to meet debt service requirements, these terms are not necessarily comparable to other similarly titled captions of other companies due to the potential inconsistencies in the method of calculation. Adjusted EBITDA does not reflect the impact of earnings or charges resulting from matters that we may consider not to be indicative of our ongoing operations. In particular, the definition of Adjusted EBITDA adds back certain noncash, extraordinary or unusual charges that are deducted in calculating net income (loss). However, these are expenses that may recur, vary greatly and are difficult to predict. Further, our debt instruments require that Adjusted EBITDA be calculated for the most recent four fiscal quarters. As a result, the measure as calculated under our debt instruments can be disproportionately affected by a particularly strong or weak quarter. Further, Adjusted EBITDA may not be comparable to the measure for any subsequent four-quarter period or any complete fiscal year. Adjusted EBITDA should not be considered as an alternative to cash flows from operating activities, as a measure of liquidity or as an alternative to operating income or net income as indicators of operating performance.
Constant-Currency Basis
We supplement Adjusted EBITDA with comparable measures on a constant-currency basis, a non-GAAP measure, which exclude the impacts from changes in currency translation. We believe providing explanations of the year to year variances in our results on a constant-currency basis is meaningful for assessing how our underlying businesses have performed due to the fact that we have international operations that are material to our overall operations. As a result, total revenue and expenses are affected by changes in the U.S. Dollar against international currencies. To present our constant currency (year-over-year) changes, current period results for entities reporting in currencies other than U.S. Dollars are converted to U.S. Dollars at the average exchange rate used in the prior-year period rather than the actual exchange rates in effect during the current-year period.
ii
Table of Contents
We own or have the right to use the trademarks, service marks and trade names that we use in connection with the operation of our business, including the SunGard® name and logo and other names and marks that identify our products and services. Other trademarks, service marks and trade names used in this prospectus are, to our knowledge, the property of their respective owners. Solely for convenience, the trademarks, service marks and trade names referred to in this prospectus are listed without the ® and ™ symbols, but such omissions are not intended to indicate, in any way, that we will not assert, to the fullest extent under applicable law, our rights to these trademarks, service marks and trade names.
iii
Table of Contents
This summary highlights certain significant aspects of our business and this offering. This is a summary of information contained elsewhere in this prospectus, is not complete and does not contain all of the information that you should consider before making your investment decision. You should carefully read the entire prospectus, including the information presented under the sections entitled “Risk Factors” and “Special Note Regarding Forward-Looking Statements” and the consolidated financial statements and the notes thereto, before making an investment decision. This summary contains forward-looking statements that involve risks and uncertainties. Our actual results may differ significantly from future results contemplated in the forward-looking statements as a result of certain factors such as those set forth in the sections entitled “Risk Factors” and “Special Note Regarding Forward-Looking Statements.”
Unless the context indicates otherwise, all references herein to “SunGard,” the “Company,” “we,” “us” and “our” refers to SunGard and its consolidated subsidiaries, including SunGard Data Systems Inc. (“SDS”). The historical financial statements and financial data included in this prospectus are those of SunGard and its consolidated subsidiaries.
Our Company
SunGard is a leading provider of mission-critical software to financial institutions globally. Our solutions automate a wide range of complex business processes across the financial services industry, including those associated with trading, securities operations, administering investment portfolios, accounting for investment assets, and managing risk and compliance requirements. We are the largest provider of industry-specific software by revenue across the segments that we serve, and are differentiated by the breadth of our offerings, leading edge technology, operating scale, deep domain expertise, and global reach. In 2014, we generated $2.8 billion in revenue, 70% of which was recurring, along with attractive operating margins and strong cash flows.
We serve a large, global customer base across multiple vertically-focused groups in the financial services industry. We have more than 15,000 customers in more than 100 countries, encompassing some of the largest financial institutions in the world, including:
| • | nearly 90% of the world’s 50 largest banks; |
| • | more than 80% of the world’s 50 largest asset managers; |
| • | the world’s 10 largest private equity firms; and |
| • | more than 80% of the world’s 50 largest insurance companies. |
Our solutions are designed to address the needs of a broad range of end users, including asset managers, CFOs and treasurers, traders on the sell-side and buy-side, securities operations managers, fund administrators, risk and compliance officers, plan administrators, and registered investment advisors.
Financial institutions are undergoing rapid and substantial change as they seek to deliver satisfactory shareholder returns in an environment of intensifying regulatory complexity, increasing capital requirements, heightened demand for transparency, and continued competitive pressure. This change places significant and growing demands on our customers’ operations. In response, we believe our customers are increasingly relying on third-party information technology (“IT”) providers to help them address these challenges and are also consolidating their spending with trusted partners who have the scale, reach, expertise and innovative technology to handle their specialized business processes. We believe we are well positioned to meet these market needs through our distinctive combination of capabilities, assets, and market position.
Throughout our long history we have established ourselves as a domain expert and a trusted partner to our customers, many of whom we have served for well over a decade. This experience has enabled us to accumulate
1
Table of Contents
the significant knowledge and capabilities required to address their greatest needs. As a result, our customers use our software to power many of their most mission-critical business processes.
SunGard provides a robust solutions set across a large portion of the global financial services market, spanning buy-side to sell-side firms to corporates and energy companies. Our principal solutions are organized in the following vertically-focused groups:
| • | Asset Management |
| • | Corporate Liquidity and Energy |
| • | Global Trading |
| • | Insurance |
| • | Post-Trade Processing |
| • | Risk and Compliance |
| • | Securities Finance and Processing |
| • | Wealth and Retirement Administration |
Our solutions are grounded in a core set of competencies that are shared across the vertically-focused markets we serve, enabling us to leverage our cumulative knowledge and capabilities across the broader financial services industry. These competencies include record-keeping and investment accounting functions, risk measurement and management, trade enablement, regulatory reporting and compliance, and securities, futures, and transactions processing.
These competencies are the foundation of our software, which we surround with services, expanding our addressable market and creating new growth opportunities. Our services include software as a service (“SaaS”) offerings as well as hosting and application management services delivered from our private cloud. We also provide professional services that help our customers to install, optimize, and integrate our software. More recently, we have expanded our offerings to encompass business process as a service (“BPaaS”), which includes utility offerings, where we have the ability to manage and operate customer processes centered around our software.
In addition to our principal solutions, we also serve the Public Sector and Education (“PS&E”) market, where we provide domain specific, mission-critical enterprise resource planning (“ERP”) and administrative software primarily to domestic local and state governments and K-12 learning institutions. PS&E represented 8% of our revenue in 2014.
Our business model is characterized by predictable and recurring revenue. Our recurring revenue, which comprised 70% of our 2014 revenue and had a 95% retention rate, is derived from our deeply embedded solutions and long-running contracts for software maintenance, rentals, SaaS, cloud and BPaaS offerings. This recurring revenue visibility allows us to proactively manage spending and generate attractive operating profit margins and high cash flow conversion.
In 2014, we generated $2.8 billion in revenues. We classify our revenue into three categories: Software, SaaS and cloud, and Services, which contributed 40%, 38%, and 22% of 2014 revenues, respectively. Our revenues are highly diversified, with 64% of 2014 revenues generated from activity in North America and the remaining 36% generated outside of North America. Our largest customer accounted for approximately 3% of our 2014 revenues. Furthermore, in 2014, $330 million of our revenues came from China, India, Southeast Asia, Middle East, Africa, Latin America and Eastern Europe, which are growing significantly faster than the established markets and are referred to herein as “emerging markets.”
2
Table of Contents
Our Transformation
In 2011, we embarked on a major transformation program to create a more integrated enterprise, focused primarily on the financial services industry. Led by a new executive leadership team, we exited non-core business lines representing more than $2 billion in revenues including the sale of Higher Education in January 2012 ($492 million in 2011 revenue), the split-off of Availability Services in March 2014 ($1.4 billion in 2013 revenue) (the “AS Split-Off”) and other smaller divestitures. In addition, within our Financial Systems segment, we exited slower growing or low margin business lines representing $203 million in revenues since 2010. We then instituted an enterprise-wide operating model supported by functional leaders from across the industry. We believe these changes allow us to take better advantage of SunGard’s scale, breadth and decades-long, trusted customer relationships across the financial services industry.
We also embarked on an internally-funded organic growth strategy, which involved reallocating investments to our most critical products, creating the integrated solutions that our customers require, and developing new solutions that address their most pressing needs. Further, in an effort to help our customers streamline their businesses, we invested in additional SaaS and cloud delivery models and selectively built BPaaS offerings that surround our software. These capabilities enable us to take on IT and operations functions previously performed by our customers, which we believe increase our revenue opportunity and drive more value for our customers.
In addition, we enhanced our go-to-market capabilities, allowing us to engage with higher level business leaders in our customers’ organizations. We also added sales resources to enhance our sales capacity, effectiveness and global reach. Finally, we added functional leadership from across the technology industry to bring best-in-class processes to SunGard.
We believe our results validate our strategy and the success of our transformation. Our year-over-year revenue growth rate has improved significantly since 2012 and has accelerated over time as our investments in product development, sales and local delivery capacity have taken hold. Our revenue has now grown in five of the last six quarters and our most recent quarters have been our strongest. At constant currency, our growth rate has been 4% in third quarter 2014, 5% in fourth quarter 2014, and 6% in first quarter 2015. The third quarter 2014 year-over-year comparison excludes the one-time benefit from the sale of a customer bankruptcy claim in third quarter 2013.
Industry Overview and Market Opportunity
According to IDC, IT spending in the financial services segments that we serve totaled nearly $190 billion in 2014. Within this market, spending with external vendors was $87 billion in 2014 and is growing faster than internal spending. In particular, spending on third-party software is the fastest growing portion, projected to grow at a 7% annual rate from $35 billion in 2014 to $45 billion by 2018. We believe this shift in spending represents a growing opportunity for market leaders that can comprehensively address the continually expanding needs of their customers.
Within this context, there are a number of interrelated macroeconomic trends shaping the industry. Specifically:
Increasing Regulatory and Compliance Burden. The financial services industry continues to be impacted by complex, changing and often inconsistent regulations from numerous regulatory bodies. To manage this complex and fractious environment, firms are increasingly turning to solution providers that have the scale and domain expertise to efficiently address these new regulatory rules, which would be very difficult and costly for a firm to otherwise address on its own.
The Proliferation of Electronic Financial Markets. The infrastructure of the financial markets is becoming increasingly automated. Many products that were once traded over-the-counter, such as interest rate
3
Table of Contents
swaps and credit default swaps, are moving to electronic processing or trading venues. Increased regulation and the need for transparency and efficiency, faster clearing and settlement, and better risk management are driving a movement in the industry towards greater automation of these processes. Technology providers that can facilitate this trend will be well positioned to benefit.
Increasing Importance of Buy-Side in Financial Markets. Asset managers, hedge funds, and private equity firms have assumed a more prominent role in the global financial markets, including more actively engaging in traditional sell-side activities such as trading and market making. As a result, there has been a rise in spending on technology solutions across this market vertical.
Emerging Markets Growth. Emerging markets continue to exhibit strong growth as regional firms develop and expand, while multi-national firms are concurrently looking to move into these markets in pursuit of new growth. Local firms, unburdened by legacy offerings and with a wide range of needs, are frequently looking to technology providers that have global reach, a comprehensive set of solutions, and a full set of software and service capabilities that will help them expand on an accelerated basis. Moreover, multi-nationals often seek global partners that can help them operate locally while managing globally.
Streamlining and Focusing the Enterprise. We believe a key focus of many financial institutions is to reduce internal spending on proprietary technology in order to focus on areas that can provide competitive differentiation. As part of this effort, we expect firms to continue to embrace less resource-intensive delivery models (including SaaS, cloud, and BPaaS) and seek to standardize around market leading solutions, in recognition of a regulatory environment that increasingly values conformity.
Consolidating Vendor Relationships. We believe financial institutions are consolidating their supplier relationships with a smaller number of trusted partners that can provide holistic, global solutions. Software providers are no longer expected to provide just individual point solutions, but rather integrated solutions that have broad capabilities, a comprehensive set of delivery models, and global reach and scale. In addition, we believe large, stable enterprises will be better suited to address the extensive procurement processes and rigorous screening criteria that financial institutions place on third-party vendors in today’s more tightly regulated world.
Our Competitive Strengths
We have established our leading market position through a number of key competitive strengths:
Market and Technological Leadership. We are the largest provider of industry-specific software by revenue across the segments that we serve, which include the vast majority of the world’s leading financial institutions. Our solutions address some of the most complex and challenging processes in the industry. Because of the depth of our customer relationships, our recognized technological leadership, and our established incumbency, we believe that we are well positioned in the industry.
Industry Focus and Deep Domain Expertise. The financial services industry is a complex, dynamic, and highly regulated market. Our focus on the financial services industry and our decades of experience have enabled us to accumulate the knowledge and breadth of capabilities needed to serve this demanding market.
Deeply Embedded and Mission-Critical Platforms. Many of SunGard’s solutions perform mission-critical activities that are central to our customers’ core operational workflows. As a result, we experienced high retention rates of 95% for our recurring revenues in 2014.
Comprehensive Solution Portfolio. We believe customers are consolidating their vendor relationships and are seeking trusted partners who can deliver integrated solutions that comprehensively address their needs across
4
Table of Contents
the front-, mid- and back-office. With our broad set of market-leading solutions, SunGard is well suited to provide a significant portion of our customers’ technology requirements. Additionally, we are able to surround our solutions with value-added services, including global delivery centers, professional implementation and optimization services, as well as BPaaS offerings.
Global Scale and Reach. SunGard has the global scale and reach to sell, deploy, deliver and support its software across the world. We serve customers in more than 100 countries, supported by 13,000 employees operating out of offices in every major geographic region, including approximately 500 global quota carrying salespeople and more than 4,700 development staff. Of the $2.8 billion in revenue that we generated in 2014, approximately 36% was generated outside of North America, including the faster-growing emerging markets.
Our Growth Strategy
As the leading provider of industry-specific software across the segments of the financial services industry that we serve, we believe we are well positioned to capitalize on the major market trends. The key elements of our growth strategy include:
Leverage and Enhance our Software. Over the past three years, we have invested $1.3 billion in global development across our Company to enhance and differentiate our proprietary software. We are investing in areas where we see increased customer demand and are continuing to develop innovative software and integrated solutions for both new and existing customers.
Increase Penetration as Customers Consolidate Spending. We believe the breadth of our products and services is unmatched across the markets we serve, and together with our existing customer footprint, positions us well as financial institutions seek to consolidate their vendor relationships.
Expand Breadth of Services Offerings. By surrounding our software with services, we believe we provide more value to our customers, deepen our customer relationships, expand our addressable market, and accelerate growth. The underlying market trends support this shift, with customers increasingly demanding higher levels of service in implementing, optimizing, maintaining, and operating our solutions. For example, we recently announced an industry utility for post-trade derivatives.
Enhance Salesforce Effectiveness. We believe our award winning salesforce is a particularly valuable asset in driving the growth of our company. We have instituted a selective and deliberate strategy to increase our sales capacity around the globe and expect our growth to continue as this strategy takes hold.
Focus on Emerging Markets. Emerging markets continue to grow strongly and SunGard’s global sales and operational footprint, extensive solution portfolio, and strong market position enables us to target this growth. We intend to further expand into new geographies and allocate sales and delivery resources to key geographic markets such as emerging Asia, Latin America, Middle East, and Africa.
Risks Related to Our Business and this Offering
Investing in our common stock involves substantial risk, and our ability to successfully operate our business is subject to numerous risks, including those that are generally associated with operating in the software and technology services industry. Any of the factors set forth under “Risk Factors” may limit our ability to successfully execute our business strategy. You should carefully consider all of the information set forth in this prospectus and, in particular, should evaluate the specific factors set forth under “Risk Factors” in deciding whether to invest in our common stock.
5
Table of Contents
Corporate Information
We are a holding company and conduct our operations through our direct and indirect subsidiaries, primarily SDS and its subsidiaries. SDS was incorporated in 1982. We were incorporated in June 2005 in connection with the acquisition of SDS, which we refer to as the “Acquisition” or the “LBO,” by a consortium of private equity investment funds associated with Bain Capital Partners, The Blackstone Group, Goldman, Sachs & Co., Kohlberg Kravis Roberts & Co., Providence Equity Partners, Silver Lake and TPG, which we refer to collectively as the “Sponsors.”
After giving effect to this offering, our Sponsors will beneficially own approximately % of our issued and outstanding common stock (assuming no exercise of the underwriters’ option to purchase additional shares) or % of our issued and outstanding common stock (assuming full exercise of the underwriters’ option to purchase additional shares).
Our principal executive offices are located at 680 East Swedesford Road, Wayne, Pennsylvania 19087, and our telephone number is (484) 582-5400. We maintain a website at www.sungard.com. The information contained on our website or that can be accessed through our website neither constitutes part of this prospectus nor is incorporated by reference herein.
6
Table of Contents
Corporate Structure
The following diagram illustrates our corporate structure following the consummation of this offering after giving effect to the Recapitalization, the consummation of this offering and the repayment with proceeds of this offering of indebtedness of SDS, assuming no exercise by the underwriters of their option to purchase additional shares.
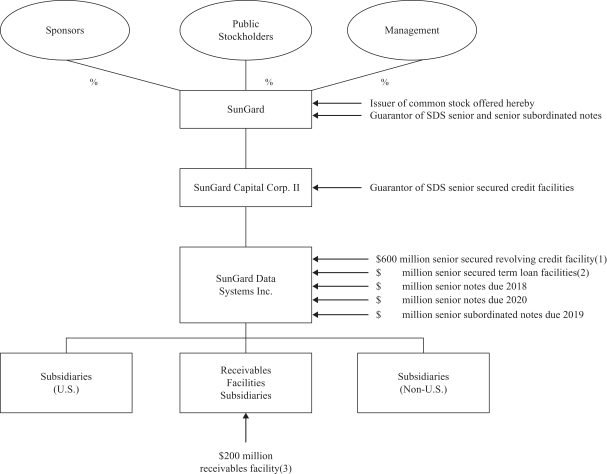
| (1) | Our senior secured revolving credit facility provides for up to $600 million in borrowings and matures on March 8, 2018. At March 31, 2015, no borrowings were outstanding and we had $593 million of availability under the revolving facility after giving effect to certain outstanding letters of credit. See “Description of Indebtedness—Senior Secured Credit Facilities.” |
| (2) | As of March 31, 2015, we had $400 million of tranche C term loans and $1,918 million of tranche E term loans outstanding. See “Description of Indebtedness—Senior Secured Credit Facilities.” |
| (3) | As of March 31, 2015, our Receivables Facility has a facility limit of $200 million consisting of a term loan commitment of $140 million and a revolving commitment of $60 million. See “Description of Indebtedness—Receivables Facility.” |
7
Table of Contents
The Offering
| Common stock offered |
shares. |
| Underwriters’ option to purchase additional shares of common stock |
shares. |
| Common stock to be outstanding immediately after this offering |
shares (or shares if the underwriters exercise in full their option to purchase additional shares). |
| Use of proceeds |
We estimate that the net proceeds to us from this offering, after deducting underwriting discounts and commissions payable by us, will be approximately $ million (or approximately $ million, if the underwriters exercise in full their option to purchase additional shares), based on the assumed initial public offering price of $ per share, which is the mid-point of the range set forth on the cover page of this prospectus. For sensitivity analysis as to the offering price and other information, see “Use of Proceeds.” |
| We intend to use the net proceeds from this offering to repay $ million in aggregate principal amount of our indebtedness. See “Use of Proceeds.” |
| Risk factors |
See “Risk Factors” beginning on page 14 and other information included in this prospectus for a discussion of factors you should carefully consider before deciding to invest in our common stock. |
| Dividend policy |
After completion of this offering, we do not intend to pay cash dividends on our common stock. We may, in the future, decide to pay dividends on our common stock, subject to the discretion of our board of directors and other factors. In the event we decide to pay dividends in the future, our ability to pay dividends will be limited by covenants in our senior secured credit facilities and the indentures governing our senior notes. See “Dividend Policy” and “Description of Indebtedness.” |
| ticker symbol |
“ ” |
| Conflicts of interest |
Affiliates of Goldman, Sachs & Co., an underwriter in this offering, will beneficially own in excess of 10% of our issued and outstanding common stock. Therefore, Goldman, Sachs & Co. is deemed to have a “conflict of interest” under Rule 5121(f)(5)(B) of the Financial Industry Regulatory Authority, Inc. (“FINRA”). Accordingly, this offering will be conducted in accordance with Rule 5121, which requires, among other things, that a “qualified independent underwriter” participate in the preparation of, and exercise the usual standards of “due diligence” with respect to, the registration statement and this prospectus. J.P. Morgan Securities LLC has agreed to act as a qualified independent underwriter for this offering. See “Underwriting (Conflicts of Interest)—Conflicts of Interest.” |
8
Table of Contents
Unless we indicate otherwise or the context otherwise requires, all information in this prospectus:
| • | assumes consummation of the Recapitalization (see “Recapitalization”); |
| • | gives effect to the -for-one stock split of our common stock which will occur prior to this offering; |
| • | assumes an initial public offering price of $ per share, the mid-point of the initial public offering range indicated on the cover of this prospectus; and |
| • | assumes no exercise of the underwriters’ option to purchase additional shares of our common stock. |
The number of shares of our common stock to be outstanding after this offering is based on the number of shares of our common stock outstanding as of , 2015, and excludes:
| • | shares of common stock issuable upon exercise of stock options outstanding as of , 2015 at a weighted average exercise price of $ per share under our equity incentive plans; and |
| • | shares of common stock reserved as of , 2015 for future issuance under our equity incentive plans. |
9
Table of Contents
Summary Historical Consolidated Financial Data
The table below presents our summary historical consolidated financial data as of the dates and for the periods indicated. We have derived the summary historical consolidated financial data as of December 31, 2013 and 2014 and for each of the years ended December 31, 2012, 2013 and 2014 from our audited consolidated financial statements included elsewhere in this prospectus. We have derived the summary historical consolidated financial data as of December 31, 2012 from our audited historical financial statements which are not included in this prospectus. We have derived the summary historical consolidated financial data as of March 31, 2014 from our unaudited consolidated financial statements which are not included in this prospectus, and we have derived the summary historical consolidated financial data as of March 31, 2015 and for each of the three months ended March 31, 2014 and March 31, 2015 from our unaudited consolidated financial statements included elsewhere in this prospectus, which have been prepared on the same basis as our audited consolidated financial statements.
Our historical results are not necessarily indicative of future operating results. Because the data in this table is only a summary and does not provide all of the data contained in our consolidated financial statements, the information should be read in conjunction with “Selected Historical Consolidated Financial Data,” “Management’s Discussion and Analysis of Financial Condition and Results of Operations” and our consolidated financial statements and the related notes thereto included elsewhere in this prospectus.
| Year ended December 31, | Three months ended March 31, |
|||||||||||||||||||
| 2012 | 2013 | 2014 | 2014 | 2015 | ||||||||||||||||
| (dollars in millions, except per share amounts) | (unaudited) | |||||||||||||||||||
| Consolidated statements of income (loss): |
||||||||||||||||||||
| Revenue |
$ | 2,808 | $ | 2,761 | $ | 2,809 | $ | 653 | $ | 671 | ||||||||||
| Costs and expenses: |
||||||||||||||||||||
| Cost of sales and direct operating |
1,082 | 1,045 | 1,098 | 269 | 268 | |||||||||||||||
| Sales, marketing and administration |
643 | 634 | 667 | 168 | 152 | |||||||||||||||
| Product development and maintenance |
422 | 392 | 376 | 99 | 86 | |||||||||||||||
| Depreciation |
96 | 104 | 107 | 24 | 29 | |||||||||||||||
| Amortization of acquisition-related intangible assets |
217 | 182 | 136 | 43 | 21 | |||||||||||||||
| Trade name impairment charges |
— | — | 339 | 339 | — | |||||||||||||||
|
|
|
|
|
|
|
|
|
|
|
|||||||||||
| 2,460 | 2,357 | 2,723 | 942 | 556 | ||||||||||||||||
|
|
|
|
|
|
|
|
|
|
|
|||||||||||
| Operating income (loss) |
348 | 404 | 86 | (289 | ) | 115 | ||||||||||||||
| Other income (expense): |
||||||||||||||||||||
| Interest income |
1 | 1 | 1 | — | — | |||||||||||||||
| Interest expense and amortization of deferred financing fees |
(360 | ) | (326 | ) | (291 | ) | (74 | ) | (71 | ) | ||||||||||
| Loss on extinguishment of debt |
(82 | ) | (6 | ) | (61 | ) | (61 | ) | — | |||||||||||
| Other income (expense) |
1 | (2 | ) | — | — | — | ||||||||||||||
|
|
|
|
|
|
|
|
|
|
|
|||||||||||
| Other income (expense) |
(440 | ) | (333 | ) | (351 | ) | (135 | ) | (71 | ) | ||||||||||
|
|
|
|
|
|
|
|
|
|
|
|||||||||||
| Income (loss) from continuing operations before income taxes |
(92 | ) | 71 | (265 | ) | (424 | ) | 44 | ||||||||||||
| Benefit from (provision for) income taxes |
49 | (26 | ) | 57 | 101 | (18 | ) | |||||||||||||
|
|
|
|
|
|
|
|
|
|
|
|||||||||||
| Income (loss) from continuing operations |
(43 | ) | 45 | (208 | ) | (323 | ) | 26 | ||||||||||||
| Income (loss) from discontinued operations, net of tax(1) |
(23 | ) | 17 | (14 | ) | (17 | ) | 2 | ||||||||||||
|
|
|
|
|
|
|
|
|
|
|
|||||||||||
| Net income (loss) |
(66 | ) | 62 | (222 | ) | (340 | ) | 28 | ||||||||||||
| Income attributable to non-controlling interests |
(251 | ) | (169 | ) | (174 | ) | (50 | ) | (43 | ) | ||||||||||
|
|
|
|
|
|
|
|
|
|
|
|||||||||||
| Net loss attributable to SunGard |
$ | (317 | ) | $ | (107 | ) | $ | (396 | ) | $ | (390 | ) | $ | (15 | ) | |||||
|
|
|
|
|
|
|
|
|
|
|
|||||||||||
10
Table of Contents
| Year ended December 31, | Three months ended March 31, |
|||||||||||||||||||
| 2012 | 2013 | 2014 | 2014 | 2015 | ||||||||||||||||
| (dollars in millions, except per share amounts) | (unaudited) | |||||||||||||||||||
| Pro forma income (loss) per share—continuing operations(2): |
||||||||||||||||||||
| Basic |
||||||||||||||||||||
| Fully diluted |
||||||||||||||||||||
| Pro forma weighted average number of shares—continuing operations(2): |
||||||||||||||||||||
| Basic |
||||||||||||||||||||
| Fully diluted |
||||||||||||||||||||
| Consolidated statements of cash flows data: |
||||||||||||||||||||
| Net cash provided by (used in): |
||||||||||||||||||||
| Operating activities: |
||||||||||||||||||||
| Continuing operations |
$ | 287 | $ | 421 | $ | 332 | $ | 86 | $ | 154 | ||||||||||
| Discontinued operations |
(43 | ) | 324 | 33 | 36 | — | ||||||||||||||
|
|
|
|
|
|
|
|
|
|
|
|||||||||||
| Total |
244 | 745 | 365 | 122 | 154 | |||||||||||||||
|
|
|
|
|
|
|
|
|
|
|
|||||||||||
| Investing activities: |
||||||||||||||||||||
| Continuing operations |
(136 | ) | (112 | ) | (147 | ) | (28 | ) | (32 | ) | ||||||||||
| Discontinued operations |
1,597 | (146 | ) | 7 | 5 | 1 | ||||||||||||||
|
|
|
|
|
|
|
|
|
|
|
|||||||||||
| Total |
1,461 | (258 | ) | (140 | ) | (23 | ) | (31 | ) | |||||||||||
|
|
|
|
|
|
|
|
|
|
|
|||||||||||
| Financing activities: |
||||||||||||||||||||
| Continuing operations |
(2,036 | ) | (324 | ) | (1,355 | ) | (1,338 | ) | (4 | ) | ||||||||||
| Discontinued operations |
(3 | ) | (2 | ) | 887 | 887 | — | |||||||||||||
|
|
|
|
|
|
|
|
|
|
|
|||||||||||
| Total |
(2,039 | ) | (326 | ) | (468 | ) | (451 | ) | (4 | ) | ||||||||||
|
|
|
|
|
|
|
|
|
|
|
|||||||||||
| Consolidated balance sheet data (at period end): |
||||||||||||||||||||
| Cash and cash equivalents(3) |
$ | 535 | $ | 675 | $ | 447 | $ | 355 | $ | 555 | ||||||||||
| Total assets |
10,018 | 9,778 | 6,511 | 6,452 | 6,389 | |||||||||||||||
| Total debt(4) |
6,658 | 6,384 | 4,669 | 4,671 | 4,670 | |||||||||||||||
| Total liabilities |
9,328 | 8,979 | 6,322 | 6,302 | 6,236 | |||||||||||||||
| Total equity |
614 | 695 | 92 | 70 | 57 | |||||||||||||||
| Other financial data (continuing operations): |
||||||||||||||||||||
| Capital expenditures(5) |
$ | 97 | $ | 111 | $ | 143 | $ | 28 | $ | 28 | ||||||||||
| Cash interest expense(6) |
323 | 288 | 272 | 67 | 67 | |||||||||||||||
| Adjusted EBITDA(7) |
749 | 766 | 765 | 145 | 175 | |||||||||||||||
| (1) | In January 2012, we sold our Higher Education business (“HE”) and in July 2012 we sold one FS subsidiary. We recorded a $571 million gain on the sales. As a result of the HE sale, in 2012, we paid approximately $400 million in income tax payments. In January 2014, we sold two small businesses within our FS segment for €27 million paid at closing, €9 million to be paid within three years (“deferred purchase price”) and €2 million to be paid upon the successful assignment of certain customer contracts. The deferred purchase price is unconditional and is secured by a bank guarantee. During the first quarter of 2015, we successfully assigned certain of these customer contracts and recognized a $2 million gain in discontinued operations. On March 31, 2014, we completed the AS Split-Off. These businesses are included in our financial results as discontinued operations for all periods presented. |
| (2) | Reflects the Recapitalization and the -for-one stock split. |
| (3) | Cash and cash equivalents excludes cash related to discontinued operations of $11 million and $31 million at December 31, 2012, and 2013, respectively. |
11
Table of Contents
| (4) | Reflects the total debt of the Company, which has decreased over time due to repayments from the net proceeds of businesses we sold and from the split-off of the AS business, as well as repayments from excess cash flows and available cash. Total debt excludes debt related to discontinued operations of $4 million and $8 million at December 31, 2012, and 2013, respectively. |
| (5) | Capital expenditures represent cash paid for property, equipment and software, as well as the capitalization of internal costs related to software development initiatives. |
| (6) | Cash interest expense is net of cash interest income and does not include any amortization of capitalized debt issuance cost, accretion of bond discounts, accretion of discounted liabilities, or loss on sale of receivables. |
| (7) | Our primary non-GAAP measure is Adjusted EBITDA, whose corresponding GAAP measure is net income (loss). We define Adjusted EBITDA as net income (loss) less income (loss) from discontinued operations, income taxes, loss on extinguishment of debt, interest expense and amortization of deferred financing fees, depreciation (including the amortization of capitalized software), amortization of acquisition-related intangible assets, trade name and goodwill impairment charges, severance and facility closure charges, stock compensation expense, management fees from our Sponsors, and certain other costs. |
We believe Adjusted EBITDA is an effective tool to measure our operating performance since it excludes non-cash items and certain variable charges. We use Adjusted EBITDA extensively to measure the financial performance of SunGard and its reportable segments, and also to report our results to our board of directors. We use a similar measure, as defined in our senior secured credit agreement, for purposes of computing our debt covenants.
While Adjusted EBITDA and similar measures are frequently used as measures of operations and the ability to meet debt service requirements, these terms are not necessarily comparable to other similarly titled captions of other companies due to the potential inconsistencies in the method of calculation. Adjusted EBITDA does not reflect the impact of earnings or charges resulting from matters that we may consider not to be indicative of our ongoing operations. In particular, our definition of Adjusted EBITDA adds back certain noncash, extraordinary or unusual charges that are deducted in calculating net income (loss). However, these are expenses that may recur, vary greatly and are difficult to predict. Adjusted EBITDA should not be considered as an alternative to cash flows from operating activities, as a measure of liquidity or as an alternative to operating income or net income as indicators of operating performance.
12
Table of Contents
The following table presents a reconciliation of Adjusted EBITDA, a non-GAAP measure, to net income (loss), which is the nearest comparable GAAP measure.
| Year ended December 31, |
Three months ended March 31, |
|||||||||||||||||||
| 2012 | 2013 | 2014 | 2014 | 2015 | ||||||||||||||||
| (dollars in millions) | (unaudited) | |||||||||||||||||||
| Net income (loss) |
$ | (66 | ) | $ | 62 | $ | (222 | ) | $ | (340 | ) | $ | 28 | |||||||
| Income (loss) from discontinued operations, net of tax |
(23 | ) | 17 | (14 | ) | (17 | ) | 2 | ||||||||||||
| Benefit from (provision for) income taxes |
49 | (26 | ) | 57 | 101 | (18 | ) | |||||||||||||
| Loss on extinguishment of debt(a) |
(82 | ) | (6 | ) | (61 | ) | (61 | ) | — | |||||||||||
| Interest expense and amortization of deferred financing fees |
(360 | ) | (326 | ) | (291 | ) | (74 | ) | (71 | ) | ||||||||||
| Other income (expense), net |
2 | (1 | ) | 1 | — | — | ||||||||||||||
|
|
|
|
|
|
|
|
|
|
|
|||||||||||
| Operating income (loss) |
348 | 404 | 86 | (289 | ) | 115 | ||||||||||||||
| Depreciation |
96 | 104 | 107 | 24 | 29 | |||||||||||||||
| Amortization of acquisition-related intangible assets |
217 | 182 | 136 | 43 | 21 | |||||||||||||||
| Trade name impairment charge |
— | — | 339 | 339 | — | |||||||||||||||
| Restructuring charges(b) |
42 | 17 | 27 | 5 | 2 | |||||||||||||||
| Stock compensation expense |
31 | 39 | 42 | 9 | 10 | |||||||||||||||
| Management fees |
9 | 8 | 9 | 2 | 2 | |||||||||||||||
| Other costs (included in operating income)(c) |
6 | 12 | 19 | 12 | (4 | ) | ||||||||||||||
|
|
|
|
|
|
|
|
|
|
|
|||||||||||
| Adjusted EBITDA |
$ | 749 | $ | 766 | $ | 765 | $ | 145 | $ | 175 | ||||||||||
|
|
|
|
|
|
|
|
|
|
|
|||||||||||
| (a) | Loss on extinguishment of debt includes in 2012 the write-off of deferred financing fees associated with the January 2012 repayment of $1.22 billion of our U.S. Dollar-denominated term loans, the April 2012 retirement of $500 million, 10.625% senior notes due 2015, the December 2012 retirement of $1 billion, 10.25% senior subordinated notes due 2015 and the December 2012 repayment of $217 million of U.S. Dollar-denominated term loans. Loss on extinguishment of debt for 2014 primarily includes (i) a $36 million loss associated with the exchange of SpinCo Notes for SunGard Notes and (ii) the write-off of deferred financing fees associated with (a) the repayment of $1.005 billion of term loans and the retirement of $389 million of senior notes due 2018, both resulting from the AS Split-Off (see Note 1 and Note 5 of Notes to Consolidated Financial Statements), (b) the $250 million reduction of the revolving credit facility and (c) the repayment of $60 million of the accounts receivable facility term loans. |
| (b) | Restructuring charges includes severance and related payroll taxes and reserves to consolidate certain facilities. |
| (c) | Other costs include strategic initiative expenses, certain expenses associated with acquisitions made by the Company, and foreign currency gains and losses. |
13
Table of Contents
An investment in our common stock involves risk. You should carefully consider the following risks as well as the other information included in this prospectus, including “Selected Historical Consolidated Financial Data,” “Management’s Discussion and Analysis of Financial Condition and Results of Operations,” “Special Note Regarding Forward-Looking Statements” and our financial statements and related notes, before investing in our common stock. Any of the following risks could materially and adversely affect our business, financial condition or results of operations. However, the selected risks described below are not the only risks facing us. Additional risks and uncertainties not currently known to us or those we currently view to be immaterial may also materially and adversely affect our business, financial condition or results of operations. In such a case, the trading price of our common stock could decline and you may lose all or part of your investment in our Company.
Risks Related to Our Business
Our business depends largely on the economy and financial markets, and a slowdown or downturn in the economy or financial markets could adversely affect our business and results of operations.
When there is a slowdown or downturn in the economy, a drop in stock market levels or trading volumes, or an event that disrupts the financial markets, our business and financial results may suffer for a number of reasons. Customers may react to worsening conditions by reducing their capital expenditures in general or by specifically reducing their IT spending. In addition, customers may curtail or discontinue trading operations, delay or cancel IT projects, or seek to lower their costs by renegotiating vendor contracts. For example, during and following the financial crisis in 2008 and 2009, a number of our large customers declared bankruptcy, were acquired and/or significantly reduced their IT budgets. As a result, our business and results of operations were adversely affected. Moreover, competitors may respond to market conditions by lowering prices and attempting to lure away our customers to lower cost solutions. If any of these circumstances remain in effect for an extended period of time, there could be a material adverse effect on our financial results. Because our financial performance tends to lag behind fluctuations in the economy, our recovery from any particular downturn in the economy may not occur until after economic conditions have generally improved.
Our business depends to a significant degree on the financial services industry, and a weakening of, or further consolidation in, or new regulations affecting, the financial services industry could adversely affect our business and results of operations.
Because our customer base is concentrated in the financial services industry, our business is largely dependent on the health of that industry. When there is a general downturn in the financial services industry, or if our customers in that industry experience financial or business problems, including bankruptcies, our business and financial results may suffer. If financial services firms continue to consolidate, there could be a material adverse effect on our business and financial results. When a customer merges with a firm using its own internally-developed solution or another vendor’s solution, it could decide to consolidate on a non-SunGard system, which could have an adverse effect on our financial results.
To the extent newly adopted regulations, such as Dodd-Frank and Basel III, negatively impact the business, operations or financial condition of our customers, our business and financial results could be adversely affected. For example, new regulations governing our customers could result in significant expenditures that could cause them to reduce their IT spending, renegotiate vendor contracts or cease or curtail certain operations. Furthermore, we could be required to invest a significant amount of time and resources to comply with additional regulations or to modify the manner in which we provide products and services to our customers; and such regulations could limit how much we can charge for our services. We may not be able to update our existing products and services, or develop new ones at all or in a timely manner, to satisfy our customers’ needs. Any of these events, if realized, could have a material adverse effect on our business and financial results.
14
Table of Contents
Catastrophic events may disrupt or otherwise adversely affect the markets in which we operate, our business and our profitability.
Our business may be adversely affected by a war, terrorist attack, natural disaster or other catastrophe. A catastrophic event could have a direct negative impact on us or an indirect impact on us by, for example, affecting our customers, the financial markets or the overall economy. The potential for a direct impact is due primarily to our significant investment in our infrastructure. Although we maintain redundant facilities and have contingency plans in place to protect against both man-made and natural threats, it is impossible to fully anticipate and protect against all potential catastrophes. Despite our preparations, a security or data breach, cyber-attack, criminal act, military action, power or communication failure, flood, severe storm or the like could lead to service interruptions and data losses for customers, disruptions to our operations, or damage to our important facilities. If any of these events happen, we may be exposed to unexpected liability, our customers may leave, our reputation may be tarnished, and there could be a material adverse effect on our business and financial results.
Data security, confidentiality and integrity are critically important to our business, and actual or attempted breaches of security, unauthorized disclosure of information, denial of service attacks or the perception that personal and/or other sensitive or confidential information in our possession is not secure could result in a material loss of business, substantive legal liability or significant harm to our business.
Data protection and security has become a significant issue in the United States and in many other countries where we offer our solutions or may offer them in the future. Security breaches, computer malware and computer hacking attacks have become more prevalent in our industry and may occur in the future on our systems or those of our information technology vendors. We receive, collect, process, use, store and transmit customer data (some of which is critical to their business operations) and other proprietary information of, or on behalf of, our customers, employees, suppliers and other third parties, including personally identifiable and other sensitive and confidential information. For example, our capital markets systems maintain account and trading information for our customers and their clients, and our wealth management and insurance systems maintain investor account information for retirement plans, insurance policies and mutual funds. This data is often accessed by us and our clients through transmissions over public and private networks, including the Internet. The secure transmission of such information over the Internet and other mechanisms is essential to maintain confidence in our IT systems. We have implemented security measures, technical controls and contractual precautions designed to protect the security, integrity and confidentiality of the information and data that we receive, collect, process, use, store or transmit. However, there is no guarantee that, despite our efforts, inadvertent or unauthorized use or disclosure will not occur or that third parties will not gain unauthorized access to this information. Controls on access to our systems and databases may be compromised as a result of external criminal activity, human or systems failures, or fraud or malice on the part of employees or third parties.
We and our vendors may be unable to anticipate techniques used to obtain unauthorized access or sabotage systems or to implement adequate preventative or mitigation measures because these techniques change frequently, generally are not identified until they are launched against a target, and may originate from less regulated and remote areas around the world or be sponsored by governments for the purpose of attacking U.S. economic interests. While we maintain insurance that covers certain data breaches, we may be uninsured for certain other risks or may not maintain sufficient insurance coverage to compensate for all potential liability. While we select our third-party service providers with care, diligence their policies and practices regarding data protection, and obligate them to implement and maintain security measures to protect our customer, employee and other third-party data, we cannot assure you that any of our third-party service providers with access to our or our clients’ and/or employees’ personally identifiable and other sensitive or confidential information will maintain appropriate policies and practices regarding data protection in compliance with all applicable laws or that they will not experience data security breaches and cyber-attacks or attempts thereof, which could have a corresponding effect on our business.
While we have not been the victim of any data privacy or security-related incidents that have had a material impact on our operations or financial condition, we have experienced such incidents as denial of service attempts,
15
Table of Contents
malware infections, phishing attempts, and other attempts at compromising our information technology that are typical for a company of our size that operates in the global financial marketplace. However, a security breach of or cyber-attack on our systems or our vendors’ systems, with or without resultant data loss, could result in unauthorized disclosure, misuse, or loss of personally identifiable or other confidential or private information which could result in costly legal claims and litigation, indemnity obligations, regulatory fines and penalties, and other liabilities. Additionally, a security breach or attempt thereof could result in the loss of clients or the inability to attract new clients, additional costs associated with repairing any system damage, incentives offered to clients or other business partners to maintain business relationships after a breach, and implementation of measures to prevent future breaches. Finally, data protection concerns, whether valid or not valid, may inhibit market adoption of our solutions, particularly in foreign countries.
If we fail to comply with current or future laws or regulations governing the collection, disclosure, use and confidentiality of personally identifiable information, our reputation and business could be adversely affected.
The protection of personally identifiable information that is collected, stored, maintained, received or transmitted electronically is a major issue in our industry. Many federal, state and foreign government bodies and agencies have adopted or are considering adopting laws and regulations regarding the collection, use, disclosure, control, security and deletion of personally identifiable information. In the United States, these include, without limitation, laws and regulations promulgated by states, as well as rules and regulations promulgated under the authority of the Federal Trade Commission and federal financial regulatory bodies. Internationally, most of the jurisdictions in which we operate have established their own data protection legal frameworks, many of which impose greater obligations on us and our customers. Many of these obligations are updated frequently and require ongoing monitoring. In addition to government regulation, data protection advocacy and industry groups may propose new and different self-regulatory standards that either legally or contractually apply to us.
While we strive to comply with all applicable data protection laws and regulations, as well as our own posted policies and industry best practices, the regulatory framework for data protection issues worldwide is currently evolving, is not uniform and is likely to remain uncertain for the foreseeable future. We may incur significant costs in monitoring and complying with the multitude of evolving laws and regulations relating to data protection, and we cannot provide assurances with regard to how governmental regulation and other legal obligations related to data protection will be interpreted, enforced or applied to our operations. Any failure or perceived failure by us to comply with applicable laws, regulations and standards may result in threatened or actual proceedings, actions and public statements against us by government entities, private parties, consumer advocacy groups or others, which could have a material adverse effect on our business. Complying with these numerous and complex regulations is expensive and difficult, and failure to comply could result in regulatory scrutiny, fines and civil liability. Additionally, concerns about our practices with regard to the collection, use, disclosure or security of sensitive data, even if unfounded, could damage our reputation and harm our business.
Our business and operating results could be adversely affected if we experience business interruptions, errors or failure in connection with our or third-party information technology and communication systems and other software and hardware products used in connection with our business, or more generally, if the third-party vendors we rely upon are unwilling or unable to provide the services we need to effectively operate our business.
Our ability to provide timely and accurate client solutions and services depends on the efficient and uninterrupted operation of our information technology and communications systems and other software and hardware used in connection with our business, whether owned by us or our vendors. Despite any precautions we may take, our systems, software and hardware and those of our vendors could be exposed to damage or interruption from circumstances beyond our or their control, such as fire, natural disasters, systems failures, power outages, data protection breaches and other cyber-attacks, terrorism, energy loss, telecommunications failure, and computer viruses. An operational error, delay, failure or outage in our information technology and communication systems, software and hardware or those or our vendors could result in loss of clients, damage to client relationships, reduced revenue and profits, refunds of client charges and damage to our reputation, and may
16
Table of Contents
result in additional expense to repair or replace damaged equipment and remedy data loss or corruption resulting from the interruption. Although we have taken steps to prevent system failures and have back-up systems and procedures to prevent or reduce disruptions, such steps may not prevent an interruption of services and our disaster recovery planning may not be sufficient to account for all contingencies. Additionally, our insurance may not adequately compensate us for all losses or failures that may occur. The occurrence of any one of the above events could have a material adverse effect on our business, financial condition, results of operation and reputation.
In addition, we generally depend on a number of third parties, both in the United States and internationally, to supply elements of our systems, computers, research and market data, connectivity, communication network infrastructure, other equipment and related support and maintenance. We cannot be certain that any of these vendors will be able to continue providing these services to effectively meet our evolving needs. If our vendors fail to meet their obligations, provide poor or untimely service, or we are unable to make alternative arrangements for the provision of these services, we may in turn fail to provide our services or to meet our obligations to our customers, and our business, financial condition and our operating results could be materially harmed.
Our results may fluctuate from period to period because of the lengthy and unpredictable sales cycle for our software, changes in our mix of licenses and services, activity by competitors, and customer budgeting or operations requirements or renewal cycles.
Our operating results may fluctuate from period to period and be difficult to predict in a particular period due to the timing and magnitude of software license sales and other factors. We offer a number of our software solutions on a license basis, which means that the customer has the right to run the software on its own computers. The customer usually makes a significant up-front payment to license software, which we generally recognize as revenue when the license contract is signed and the software is delivered. The size of the up-front payment often depends on a number of factors that are different for each customer, such as the number of customer locations, users or accounts. As a result, the sales cycle for a software license may be lengthy and take unexpected turns. Further, our customers’ business models are shifting away from paying upfront license fees to paying periodic rental fees for services. Thus, it is difficult to predict when software sales will occur or how much revenue they will generate. Since there are few incremental costs associated with software sales, our operating results may fluctuate from quarter to quarter and year to year due to the timing and magnitude of software sales. In addition, as more of our revenue shifts to SaaS, cloud, BPaaS and services, the need to keep pace with rapid technology changes becomes more acute. Our results may also vary as a result of pricing pressures, increased cost of equipment, the evolving and unpredictable markets in which our products and services are sold, changes in accounting principles, and competitors’ new products or services.
In addition, there are a number of other factors that could cause our sales and results of operation to fluctuate from period to period, including:
| • | customers periodically renew or upgrade their installed base of our products, which trigger buying cycles for current or new versions of our products and our revenue generally fluctuates with these refresh cycles as a result; |
| • | our ability to attract new and retain existing customers, particularly large customers; |
| • | the budgeting cycles and purchasing practices of customers, particularly large customers; |
| • | changes in customer, distributor or reseller requirements or market needs; |
| • | deferral of orders from customers in anticipation of new solutions or offerings announced by us or our competitors or otherwise anticipated by the market; |
| • | our ability to successfully expand our business domestically and internationally; and |
| • | insolvency or credit difficulties confronting our customers, which could adversely affect their ability to purchase or pay for our solutions. |
17
Table of Contents
Rapid changes in technology and our customers’ businesses could adversely affect our business and financial results.
Our business may suffer if we do not successfully adapt our products and services to changes in technology and changes in our customers’ businesses. These changes can occur rapidly and at unpredictable intervals and we may not be able to respond adequately. If we do not successfully update and integrate our products and services, including our SaaS and cloud offerings, to adapt to these changes, or if we do not successfully develop new products and services needed by our customers to keep pace with these changes, then our business and financial results may suffer. Our ability to keep up with technology and business changes is subject to a number of risks and we may find it difficult or costly to, among other things:
| • | update our products and services and to develop new products fast enough to meet our customers’ needs; |
| • | make some features of our products and services work effectively and securely over the Internet; |
| • | integrate more of our solutions; |
| • | update our products and services to keep pace with business, regulatory and other developments in the financial services industry, where many of our customers operate; and |
| • | update our services to keep pace with advancements in hardware, software and telecommunications technology. |
Some technological changes may render some of our products and services less valuable or eventually obsolete. In addition, because of ongoing, rapid technological changes, the useful lives of some technology assets have become shorter and customers are therefore replacing these assets more often. As a result, our customers are increasingly expressing a preference for contracts with shorter terms, which could make our revenue less predictable in the future. Furthermore, we may be required to make significant upfront investments in developing new technology without any assurance that we will be able to generate sufficient revenue from the developed products and technology to offset the expense. In addition, rapid changes in our upfront license sales model could result in a prolonged downward trend in our high margin software license revenue. We may lose the ability to recognize certain license sales upfront, which could have an adverse effect on our financial results.
Our securities brokerage operations are highly regulated and subject to risks that are not encountered in our other businesses.
One of our subsidiaries is an SEC registered broker-dealer in the U.S. and another is authorized by the Financial Conduct Authority to conduct certain regulated business in the U.K. Domestic and foreign regulatory and self-regulatory organizations, such as the SEC, the Financial Industry Regulatory Authority, and the U.K. Financial Conduct Authority can, among other things, fine, censure, issue cease-and-desist orders against, and suspend or expel a broker-dealer or its officers or employees for failure to comply with the many laws and regulations that govern brokerage activities. Such sanctions may arise out of currently-conducted activities or those conducted in prior periods. Our ability to comply with these laws and regulations is largely dependent on our establishment, maintenance, and enforcement of an effective brokerage compliance program. Failure to establish, maintain, and enforce the required brokerage compliance procedures, even if unintentional, could subject us to significant losses, lead to disciplinary or other actions, and tarnish our reputation. Regulations affecting the brokerage industry may change, which could adversely affect our financial results.
We are exposed to certain risks relating to the execution services provided by our brokerage operations to our customers and counterparties, which include other broker-dealers, active traders, hedge funds, asset managers, and other institutional and non-institutional clients. These risks include, but are not limited to, customers or counterparties failing to pay for or deliver securities, trading errors, the inability or failure to settle trades, and trade execution system failures. In our other businesses, we generally can disclaim liability for trading
18
Table of Contents
losses that may be caused by our software, but in our brokerage operations, we may not be able to limit our liability for trading losses or failed trades even when we are not at fault. As a result, we may suffer losses that are disproportionately large compared to the relatively modest profit contributions of our brokerage operations.
If we fail to comply with government regulations in connection with our business or by providing technology services to certain financial institutions, our business and results of operations may be adversely affected.
Increasingly, regulators are scrutinizing more closely banking organizations’ relationships with third-party service providers, including providers of data processing services. We may be affected indirectly by the scrutiny that such regulators exercise over the relationships that banking organizations have with third-party service providers, such as us. Because we act as a third-party service provider to financial institutions and provide mission-critical applications for many financial institutions that are regulated by one or more member agencies of the Federal Financial Institutions Examination Council (“FFIEC”), we are subject to examination by the member agencies of the FFIEC. More specifically, we are a Multi-Regional Data Processing Servicer of the FFIEC because we provide mission critical applications for financial institutions from several data centers located in different geographic regions. As a result, the FFIEC conducts periodic reviews of certain of our operations in order to identify existing or potential risks associated with our operations that could adversely affect the financial institutions to whom we provide services, evaluate our risk management systems and controls, and determine our compliance with applicable laws that affect the services we provide to financial institutions. In addition to examining areas such as our management of technology, data integrity, information confidentiality and service availability, the reviews also assess our financial stability. Our high levels of debt increase the risk of an FFIEC agency review determining that our financial stability has been weakened. A sufficiently unfavorable review from the FFIEC could result in our financial institution customers not being allowed to use our technology services, or electing not to renew their contracts with us based on such unfavorable review.
If we fail to comply with any regulations applicable to our business, we may be exposed to unexpected liability and/or governmental proceedings, our customers may leave, our reputation may be tarnished, and there could be a material adverse effect on our business and financial results. In addition, the future enactment of more restrictive laws or rules on the federal or state level, or, with respect to our international operations, in foreign jurisdictions on the national, provincial, state or other level, could require us to make additional compliance investments, which would have an adverse impact on business and financial results.
If we are unable to retain or attract customers, our business and financial results will be adversely affected.
If we are unable to keep existing customers satisfied, sell additional products and services to existing customers or attract new customers, including large enterprise customers, then our business and financial results may suffer. A variety of factors could affect our ability to successfully retain and attract customers in general, including the level of demand for our products and services, the level of customer spending for information technology, the level of competition from customers that develop their own solutions internally and from other vendors, the quality of our customer service, our ability to update our products and develop new products and services needed by customers, and our ability to integrate and manage acquired businesses. Sales to large enterprise customers involve additional challenges that may not be present, or are present to a lesser extent, with sales to smaller customers. These challenges include preexisting relationships with larger, entrenched solution providers who have relationships with key decision makers, demand for lower prices or extended warranties, more stringent requirements in our support service contracts, increased penalties for failures to meet support requirements and longer sales cycles with multiple approval requirements. Additionally, for other potential clients of our products and services, switching from one vendor (or from an internally-developed system) to a new vendor is a significant undertaking. Many potential clients perceive potential disadvantages such as business disruption and conversion risk. While we may offer enhanced functionality and competitive solutions or services, if we are unable to overcome potential clients’ reluctance to change vendors our results may be impacted.
A substantial portion of our revenue is derived from the sale of our products and services under fixed-term contracts. We do not have a unilateral right to extend these contracts when they expire. In addition, our
19
Table of Contents
customers periodically refresh their installed base of products and services, replacing older versions of products that reach the end of their useful life and are no longer supported under our service contracts with the latest products. These refresh cycles trigger buying cycles for new versions of our products, which are supported under our service contracts and typically offer greater capacity and additional features. A refresh cycle also creates an opportunity for our competitors to try to displace our existing products and services for our customers, who may be more inclined to consider other vendor products and services when they otherwise have to replace our existing products and services that have reached the end of their useful life. The extent to which customers decide to refresh by purchasing our new products and services, as opposed to purchasing products and services from our current or future competitors, may have a material adverse effect on our business and financial results. Revenue from our broker-dealer businesses is not subject to minimum or ongoing contractual commitments on the part of brokerage customers. If customers cancel or refuse to renew their contracts, or if customers reduce the usage levels or asset values under their contracts, there could be a material adverse effect on our business and financial results.
We operate in an intensely competitive business environment and if we are unable to successfully compete our results of operations and financial condition may be adversely affected.
The markets for our services and products continue to evolve and are intensely competitive. We compete with numerous companies that provide similar services and products. In certain markets that we serve, some of our competitors may offer a wider range of products or services, have broader name recognition, and have larger customer bases than we do. Additionally, certain of our products and services compete with our existing and potential clients’ in-house capacity to develop key applications. Although we believe that our products and services have established certain competitive advantages, our competitors may be able to respond more quickly to new or evolving opportunities, technologies and client requirements, and may be able to undertake more extensive marketing activities, offer more attractive terms to clients and implement more aggressive pricing policies. We also expect that the markets in which we compete will continue to attract new competitors and technologies, including foreign providers of similar services and products to ours. There can be no assurances that we will be able to compete successfully with current or future competitors. If we fail to compete effectively, our business, results of operation and financial condition could be adversely affected.
If we fail to retain key employees, our business may be harmed.
Our success depends on the skill, experience and dedication of our employees. If we are unable to retain and attract sufficiently experienced and capable personnel, especially in product development, sales and management, our business and financial results may suffer. For example, if we are unable to retain and attract a sufficient number of skilled technical personnel, our ability to develop high quality products and provide high quality customer service may be impaired. Experienced and capable personnel in the technology industry remain in high demand, and there is continual competition for their talents. When talented employees leave, we may have difficulty replacing them, and our business may suffer. There can be no assurance that we will be able to successfully retain and attract the personnel that we need.
We are subject to the risks of doing business internationally.
A portion of our revenue is generated outside the United States, primarily from customers located in Europe. Over the past few years we have expanded our operations in certain emerging markets in Asia, Africa, Europe, the Middle East and South America. Because we sell our services outside the United States, our business is subject to risks associated with doing business internationally. Accordingly, our business and financial results could be adversely affected due to a variety of factors, including:
| • | changes in a specific country or region’s political and cultural climate or economic condition, including change in governmental regime; |
| • | unexpected or unfavorable changes in foreign laws, regulatory requirements and related interpretations; |
| • | difficulty of effective enforcement of contractual provisions in local jurisdictions; |
20
Table of Contents
| • | inadequate intellectual property protection in foreign countries; |
| • | trade-protection measures, import or export licensing requirements such as Export Administration Regulations promulgated by the U.S. Department of Commerce and fines, penalties or suspension or revocation of export privileges; |
| • | trade sanctions imposed by the United States or other governments with jurisdictional authority over our business operations; |
| • | the effects of applicable and potentially adverse foreign tax law changes; |
| • | significant adverse changes in foreign currency exchange rates; |
| • | longer accounts receivable cycles; |
| • | managing a geographically dispersed workforce; |
| • | difficulties associated with repatriating cash in a tax-efficient manner; and |
| • | compliance with the United States Foreign Corrupt Practices Act, or FCPA, and the Office of Foreign Assets Control regulations, particularly in emerging markets. |
In foreign countries, particularly in those with developing economies, certain business practices may exist that are prohibited by laws and regulations applicable to us, such as the U.S. Foreign Corrupt Practices Act, the U.K. Bribery Act and other anti-corruption laws. Although our policies and procedures require compliance with these laws and are designed to facilitate compliance with these laws, our employees, contractors and agents may take actions in violation of applicable laws or our policies. Any such violation, even if prohibited by our policies, could have a material adverse effect on our business and reputation.
Our acquisitions may not be successful and we may not be able to successfully integrate and manage acquired businesses.
Generally, we seek to acquire businesses that broaden our existing product lines and service offerings and expand our geographic reach. There can be no assurance that our acquisitions will be successful or that we will be able to identify suitable acquisition candidates and successfully complete acquisitions. In addition, we may finance any future acquisition with debt, which would increase our overall levels of indebtedness and related interest costs. If we are unable to successfully integrate and manage acquired businesses, then our business and financial results may suffer. It is possible that the businesses we have acquired and businesses that we acquire in the future may perform worse than expected, be subject to an adverse litigation outcome or prove to be more difficult to integrate and manage than expected. If that happens, there may be a material adverse effect on our business and financial results for a number of reasons, including:
| • | we may have to devote unanticipated financial and management resources to the acquired businesses; |
| • | we may not be able to realize expected operating efficiencies or product integration benefits from our acquisitions; |
| • | we may have to write-off goodwill or other intangible assets; and |
| • | we may incur unforeseen obligations or liabilities (including assumed liabilities not fully indemnified by the seller) in connection with acquisitions. |
We could lose revenue due to “fiscal funding” or “termination for convenience” clauses in certain customer contracts, especially in our PS and K-12 businesses.
Certain of our customer contracts, particularly those with governments and school districts, may be partly or completely terminated by the customer due to budget cuts or sometimes for any reason at all. These types of clauses are often called “fiscal funding” or “termination for convenience” clauses. If a customer exercises one of these clauses, the customer would be obligated to pay for the services we performed up to the date of exercise, but would not have to pay for any further services. In addition, governments and school districts may require contract terms that differ from our standard terms. While we have not been materially affected by exercises of
21
Table of Contents
these clauses or other unusual terms in the past, we may be in the future. If customers that collectively represent a substantial portion of our revenue were to invoke the fiscal funding or termination for convenience clauses of their contracts, our future business and results of operations could be adversely affected.
Protection of our intellectual property may be difficult and costly, and if we are unable to protect our proprietary technologies, we could lose one of our competitive advantages and our business could be adversely affected.
Our company’s success depends in part on our ability to protect our proprietary products and services and corresponding intellectual property rights. If we are unable to do so, our business and financial results may suffer. To protect our intellectual property rights, we rely upon a combination of United States and worldwide federal, state and common law intellectual property laws, invention assignment agreements and confidentiality restrictions in contracts with employees, customers, vendors and others, and software security measures. However, effective intellectual property protection is expensive to obtain, develop and maintain, both in terms of initial and ongoing registration or prosecution requirements and the expenses and the costs of defending our rights. We may not be able to successfully secure the intellectual property rights that we apply for worldwide, and our existing intellectual property rights and related registrations may be challenged in the future and could be opposed, invalidated, canceled or narrowed by a third party.
Despite our efforts to protect our intellectual property rights, unauthorized persons may infringe upon or misappropriate such rights or be able to copy, reverse engineer or otherwise use some of our technology. Additionally, our existing confidentiality and/or invention assignment agreements with employees, contractors and others who participate in intellectual property development activities for us could be breached, or we may not have sufficient and adequate agreements with such individuals, in either case potentially resulting in the unauthorized use or disclosure of our trade secrets and other intellectual property rights. Individuals not subject to invention assignment agreements may make adverse ownership claims to our current and future intellectual property. It also is possible that others will develop and market similar or better technology to compete with us, without infringing on our intellectual property rights. Existing United States intellectual property laws may afford only limited protection, and the laws of some foreign countries may not protect our intellectual property rights to the same extent as the laws of the United States. We may need to expend additional resources to defend our intellectual property in foreign countries that do not have effective intellectual property protection and mechanisms for its enforcement. For the foregoing reasons, we may have difficulty protecting our intellectual property rights against third-party infringement, misappropriation, or unauthorized use or disclosures. In the case of any infringement, misappropriation, use, or disclosure, there could be a material adverse effect on the value of our intellectual property rights and on our business and financial results. In addition, litigation may be necessary to protect our intellectual property rights. This type of litigation is often costly and time-consuming, with no assurance of success, and may have an adverse effect on our business and financial condition. Finally, the inability to defend our intellectual property rights in foreign countries could impair our brand or adversely affect the growth of our business internationally.
We may be sued for violating the intellectual property rights of others.
The software industry is characterized by the existence of a large number of trade secrets, copyrights and the growing number of issued patents, as well as frequent litigation based on allegations of infringement or other violations of intellectual property rights. Some of our competitors or other third parties may have been more aggressive than us in applying for or obtaining patent rights for innovative proprietary technologies both in the United States and internationally. We cannot assure you that we are not infringing or violating, and have not infringed or violated, any third-party intellectual property rights, or that we will not be accused of doing so in the future.
As a result of the foregoing, there can be no assurance that in the future third parties will not assert infringement claims against us and preclude us from using a technology in our products or require us to enter into
22
Table of Contents
royalty and licensing arrangements on terms that are not favorable to us, or force us to engage in costly infringement litigation. We could be required to incur significant legal fees and other expenses defending such claims regardless of the merits of the claim, to pay substantial monetary damages in the event the claim is determined to be meritorious, to develop comparable non-infringing intellectual property (which may not be possible), to obtain a license on unfavorable or non-commercially reasonable terms or to cease providing the products or solutions that contain the infringing intellectual property. We do not maintain insurance to cover us in the event of such potential liability as it is generally unavailable at a commercially attractive cost. Additionally, our licenses and service agreements with our customers generally provide that we will defend and indemnify them for claims against them relating to our alleged infringement of the intellectual property rights of third parties with respect to our products or services. We may have to defend or indemnify our customers to the extent they are subject to these types of claims. Any of these claims, even if not meritorious, may be difficult and costly to defend, cause product release delays, and may lead to unfavorable judgments or settlements, which could have a material adverse effect on our reputation, business and financial results. They may also divert our attention from operating our company and result in a temporary or permanent inability to use the intellectual property subject to such claims. For these reasons, we may find it difficult or costly to add or retain important features in our products and services.
While we do not believe any of our known current legal proceedings or claims related to the infringement of patent or other intellectual property rights will, individually or in the aggregate, materially adversely affect our financial condition and operating results, the results of such legal proceedings cannot be predicted with certainty. Should we fail to prevail in any of the matters related to infringement of patent or other intellectual property rights of others or should one or more of these matters be resolved against us in the same reporting period, it could have a material adverse effect on our business and financial results.
Some of our products contain “open source” software, and any failure to comply with the terms of one or more of these open source licenses could negatively affect our business.
We use a limited amount of software licensed by its authors or other third parties under so-called “open source” licenses and may continue to use such software in the future. Some of these licenses contain requirements that we make available source code for modifications or derivative works we create based upon the open source software, and that we license such modifications or derivative works under the terms of a particular open source license or other license granting third parties certain rights of further use. By the terms of certain open source licenses, we could be required to release the source code of our proprietary software if we combine our proprietary software with open source software in a certain manner. Additionally, the terms of many open source licenses have not been interpreted by United States or other courts, and there is a risk that these licenses could be construed in a manner that could impose unanticipated conditions or restrictions on our ability to commercialize our products. In addition to risks related to license requirements, usage of open source software can lead to greater risks than use of third-party commercial software, as open source licensors generally do not provide warranties or controls on origin of the software. We have established processes to help alleviate these risks, including a review process for screening requests from our development organizations for the use of open source, but we cannot be sure that all open source is submitted for approval prior to use in our products. In addition, many of the risks associated with usage of open source cannot be eliminated, and could, if not properly addressed, negatively affect our business.
Defects, design errors or security flaws in our products could harm our reputation and expose us to potential liability.
Most of our products are very complex software systems that are regularly updated. No matter how careful the design and development, complex software often contains errors and defects when first introduced and when major new updates or enhancements are released. If errors or defects are discovered in our current or future products, we may not be able to correct them in a timely manner, if at all. In our development of updates and enhancements to our products, we may make a major design error that makes the product operate incorrectly or
23
Table of Contents
less efficiently. The failure of our products to properly perform could result in us and our clients being subjected to losses or liability, including censures, fines, or other sanctions by applicable regulatory authorities, and we could be liable to parties who are financially harmed by those errors. In addition, such errors could cause us to lose revenues, lose clients or damage our reputation.
We may need to expend significant capital resources in order to eliminate or work around errors, defects, design errors or security problems. Any one of these problems in our products may result in the loss of or a delay in market acceptance of our products, the diversion of development resources, a lower rate of license renewals or upgrades and damage to our reputation, and in turn may increase service and warranty costs.
A material weakness in our internal controls could have a material adverse effect on us.
Effective internal controls are necessary for us to provide reasonable assurance with respect to our financial reports and to effectively prevent fraud. If we cannot provide reasonable assurance with respect to our financial reports and effectively prevent fraud, our reputation and operating results could be harmed. Internal control over financial reporting may not prevent or detect misstatements because of its inherent limitations, including the possibility of human error, the circumvention or overriding of controls, or fraud. Therefore, even effective internal controls can provide only reasonable assurance with respect to the preparation and fair presentation of financial statements. In addition, projections of any evaluation of effectiveness of internal control over financial reporting to future periods are subject to the risk that the control may become inadequate because of changes in conditions, or that the degree of compliance with the policies or procedures may deteriorate.
A material weakness is a deficiency, or combination of deficiencies, in internal control over financial reporting, such that there is a reasonable possibility that a material misstatement of the Company’s annual or interim financial statements will not be prevented or detected on a timely basis. A material weakness in our internal control over financial reporting could adversely impact our ability to provide timely and accurate financial information. If we are unable to report financial information timely and accurately or to maintain effective disclosure controls and procedures, we could be subject to, among other things, regulatory or enforcement actions by the SEC, any one of which could adversely affect our business prospects.
Unanticipated changes in our income tax provision or the enactment of new tax legislation, issuance of regulations or relevant judicial decisions, as well as unclaimed property audits by governmental authorities, could affect our operating results, profitability or cash flow.
We are subject to income taxes in the United States and many foreign jurisdictions. Significant judgment is required in determining our worldwide provision for income taxes. We regularly are under examination by tax authorities. Although we believe our income tax provision is reasonable, the final determination of our tax liability could be materially different from our historical income tax provisions, which could have a material effect on our financial position, results of operations or cash flows. In addition, tax-law amendments in the United States and other jurisdictions could significantly impact how United States multinational corporations are taxed. Although we cannot predict whether or in what form such legislation will pass, if enacted it could have a material adverse effect on our business and financial results. Furthermore, we are subject to unclaimed property (escheat) laws, which require us to turn over to certain governmental authorities the property held by us that has been unclaimed for a specified period of time. We are subject to audit by individual U.S. states with regard to our escheatment practices.
Risks Related to the AS Split-Off
There could be significant liability for us if all or part of the AS Split-Off were determined to be taxable for U.S. federal or state income tax purposes.
At the time of the AS Split-Off, we received opinions from outside tax counsel to the effect, while the matter was not free from doubt, that the AS Split-Off should qualify for tax-free treatment as transactions described in Section 355 and related provisions of the Internal Revenue Code (the “Code”) as well as relevant
24
Table of Contents
state income tax authority. Further, with respect to this offering, we expect to receive an opinion from outside tax counsel that this offering and the associated recapitalization should not cause the prior AS Split-Off to fail to qualify for tax-free treatment as transactions described in Section 355 and related provisions of the Code. However, we did not receive a private letter ruling from the Internal Revenue Service (the “Service”) with respect to the AS Split-Off or this offering. Further, there is a risk that the Service, a state taxing authority or a court could conclude that the separation of the Availability Services business from us, through internal spin-offs, certain related transactions and the exchange of a portion of shares of SunGard Capital Corp. II Preferred Stock for all of the shares of Sungard Availability Services Capital, Inc. (“SpinCo”) may not qualify as tax-free transactions. An opinion of tax counsel is not binding on the Service, state taxing authorities or any court and as a result there can be no assurance that a tax authority will not challenge the tax-free treatment of all or part of the AS Split-Off or that, if litigated, a court would not agree with the Service or a state taxing authority. Further, these tax opinions, including the opinion we expect to receive from outside tax counsel regarding this offering and the associated recapitalization, rely on certain facts, assumptions, representations, warranties and covenants from us, SpinCo and from some of our stockholders regarding the past and future conduct of the companies’ respective businesses, share ownership and other matters. If any of the facts, assumptions, representations, warranties and covenants on which the opinions rely is inaccurate or incomplete or not satisfied, the opinions may no longer be valid. Moreover, the Service or a state taxing authority could determine on audit that the AS Split-Off is taxable if it determines that any of these facts, assumptions, representations, warranties or covenants are not correct or have been violated or if it disagrees with one or more conclusions in the opinions or for other reasons.
In addition, actions taken following the AS Split-Off, including certain 50 percent or greater changes by vote or value of our stock ownership or that of SpinCo, may cause the AS Split-Off to be taxable to us. If the AS Split-Off is determined to be taxable, we and possibly our stockholders who participated in the AS Split-Off (the “Legacy Stockholders”) could incur significant income tax liabilities. These tax liabilities could have a material adverse effect on our business, financial condition, results of operations, and cash flows.
Actions taken by SpinCo or its stockholders could cause the AS Split-Off to fail to qualify as a tax-free transaction, and SpinCo may be unable to fully indemnify us for the resulting significant tax liabilities.
Pursuant to the Tax Sharing and Disaffiliation Agreement that we entered into with SpinCo (“Tax Sharing Agreement”), SpinCo is required to indemnify us for certain taxes relating to the AS Split-Off that result from (i) any breach of the representations or the covenants made by SpinCo regarding the preservation of the intended tax-free treatment of the AS Split-Off, (ii) any action or omission that is inconsistent with the representations, statements, warranties and covenants provided to tax counsel in connection with their delivery of opinions to us with respect to the AS Split-Off, and (iii) any other action or omission that was likely to give rise to such taxes when taken, in each case, by SpinCo or any of its subsidiaries. Conversely, if any such taxes are the result of such a breach or certain other actions or omissions by the Company, we would be wholly responsible for such taxes. In addition, if any part of the AS Split-Off fails to qualify for the intended tax-free treatment for reasons other than those for which we or SpinCo would be wholly responsible pursuant to the provisions described above, SpinCo will be obligated to indemnify us for 23% of the liability for taxes imposed in respect of the AS Separation and we would bear the remainder of such taxes. If SpinCo is required to indemnify us for any of the foregoing reasons, SpinCo’s indemnification liabilities could potentially exceed its net asset value and SpinCo may be unable to fully reimburse or indemnify us for our significant tax liabilities arising from the AS Split-Off as provided by the Tax Sharing Agreement.
We might not be able to engage in certain strategic transactions because we have agreed to certain restrictions to comply with U.S. federal income tax requirements for a tax-free split-off.
To preserve the intended tax-free treatment of the AS Split-Off, we must comply with restrictions under current U.S. federal income tax laws for split-offs such as (i) refraining from engaging in certain transactions that would result in a 50 percent or greater change by vote or by value in our stock ownership, (ii) continuing to own
25
Table of Contents
and manage our historic businesses and (iii) limiting sales or redemptions of our common stock. If these restrictions and certain others are not followed, the AS Split-Off could be taxable to us and possibly our Legacy Stockholders. These tax liabilities could have a material adverse effect on our business, financial condition, results of operations and cash flows.
In the Tax Sharing Agreement, we (i) represented that we had no plan or intention to take or fail to take any action that would be inconsistent with the representations, statements, warranties and covenants provided to tax counsel in connection with their delivery of opinions to us with respect to the AS Split-Off and related transactions and (ii) covenanted that during the two-year period following the AS Split-Off, which expires on April 1, 2016, we will not, except in certain specified transactions, (a) sell, issue or redeem our equity securities (or those of certain of our subsidiaries) or (b) liquidate, merge or consolidate with another person or sell or dispose of a substantial portion of our assets (or those of certain of our subsidiaries). During this two-year period, we may take certain actions prohibited by these covenants if we provide SpinCo with a ruling from the Service or a favorable opinion of tax counsel or of a nationally recognized accounting firm, reasonably satisfactory to SpinCo, to the effect that these actions should not affect the tax-free nature of the AS Split-Off. Given that this offering is within two years of the AS Split-Off, we expect to receive an opinion from outside tax counsel to the effect that this offering should not adversely affect the tax-free treatment of the AS Split-Off. As mentioned above, we did not receive a private letter ruling from the Service and an opinion of tax counsel is not binding on the Service, state taxing authorities or any court, and as a result there can be no assurance that a tax authority will not challenge the tax-free treatment of the AS Split-Off as a result of this offering.
These restrictions could limit our strategic and operational flexibility, including our ability to make acquisitions using equity securities, finance our operations by issuing equity securities, repurchase our equity securities, raise money by selling assets or enter into business combination transactions.
Risks Related to Our Indebtedness
Our substantial leverage could adversely affect our ability to raise additional capital to fund our operations, limit our ability to react to changes in the economy or our industry, expose us to interest rate risk to the extent of our variable rate debt and prevent us from meeting our debt obligations.
As a result of being acquired on August 11, 2005 by our Sponsors and our subsequent refinancings and issuances, we are highly leveraged and our debt service requirements are significant. As of , 2015, on an adjusted basis after giving effect to this offering and the proceeds receive therefrom, we would have had total outstanding debt of $ million.
Our high degree of debt-related leverage could have important consequences, including:
| • | making it more difficult for us to make payments on our debt obligations; |
| • | increasing our vulnerability to general economic and industry conditions; |
| • | requiring a substantial portion of cash flow from operations to be dedicated to the payment of principal and interest on our indebtedness, therefore reducing our ability to use our cash flow to fund our operations, capital expenditures and future business opportunities; |
| • | exposing us to the risk of increased interest rates as certain of our borrowings, including borrowings under our senior secured credit facilities, are at variable rates of interest; |
| • | restricting us from making acquisitions or causing us to make non-strategic divestitures; |
| • | limiting our ability to obtain additional financing for working capital, capital expenditures, product development, debt service requirements, acquisitions and general corporate or other purposes; and |
| • | limiting our ability to adjust to changing market conditions and placing us at a competitive disadvantage compared to our competitors who are less highly leveraged. |
26
Table of Contents
We and our subsidiaries may be able to incur substantial additional indebtedness in the future, subject to the restrictions contained in our senior secured credit agreement and the indentures relating to our senior notes due 2018 and 2020 and senior subordinated notes due 2019. If new indebtedness is added to our current debt levels, the related risks that we now face could intensify.
Our debt agreements contain restrictions that limit our flexibility in operating our business.
Our senior secured credit agreement and the indentures governing our senior notes due 2018 and 2020 and senior subordinated notes due 2019 contain various covenants that limit our ability to engage in specified types of transactions. These covenants limit our ability to, among other things:
| • | incur additional indebtedness or issue certain preferred shares; |
| • | pay dividends on, repurchase or make distributions in respect of our capital stock or make other restricted payments; |
| • | make certain investments; |
| • | sell certain assets; |
| • | create liens; |
| • | consolidate, merge, sell or otherwise dispose of all or substantially all of our assets; and |
| • | enter into certain transactions with our affiliates. |
In addition, under the senior secured credit agreement, under certain circumstances, we are required to satisfy and maintain a specified financial ratio and other financial condition tests. Our ability to meet the financial ratio and tests can be affected by events beyond our control, and we may not be able to meet the ratio and tests. A breach of any of these covenants could result in a default under the senior secured credit agreement. Upon an event of default under the senior secured credit agreement, the lenders could elect to declare all amounts outstanding to be immediately due and payable and terminate all commitments to extend further credit, which would trigger a cross-default under our indentures. See “Description of Indebtedness.”
If we were unable to repay those amounts, the lenders under the senior secured credit agreement could proceed against the collateral granted to them to secure that indebtedness. We have pledged a significant portion of our assets as collateral under the senior secured credit agreement. If the lenders under the senior secured credit agreement accelerate the repayment of borrowings, we may not have sufficient assets to repay the senior secured credit facilities and our unsecured indebtedness.
Risks Related to this Offering and Ownership of Our Common Stock
Affiliates of our Sponsors will own the majority of the equity interests in us and may have conflicts of interest with us or the holders of our common stock.
Investment funds affiliated with our Sponsors currently control our company interests and a majority of the seats on our board of directors. As a result, our Sponsors have the ability to prevent any transaction that requires the approval of the board of directors regardless of whether our management believe that any such transaction is in our best interests. For example, our Sponsors could collectively cause us to make acquisitions that increase the amount of our indebtedness or to sell assets, or block us from being sold or could cause us to issue additional capital stock or declare dividends. So long as investment funds affiliated with our Sponsors continue to own a significant amount of our equity interests or otherwise control a majority of our board of directors, the Sponsors will continue to be able to effectively control our decisions. In addition, the Sponsors have no obligation to provide us with any additional debt or equity financing.
The Sponsors are in the business of making investments in companies and may from time to time acquire and hold interests in businesses that compete directly or indirectly with us or that supply us with goods and
27
Table of Contents
services. The Sponsors may also pursue acquisition opportunities that may be complementary to our business and, as a result, those acquisition opportunities may not be available to us. See “Description of Capital Stock—Conflicts of Interest.” Holders of our common stock should consider that the interests of the Sponsors may differ from their interests in material respects.
We will be a “controlled company” within the meaning of the rules and the rules of the SEC. As a result, we will qualify for, and intend to rely on, exemptions from certain corporate governance requirements that provide protection to stockholders of other companies.
After completion of this offering, affiliates of the Sponsors will continue to control a majority of the voting power of our outstanding common stock. As a result, we will be a “controlled company” within the meaning of the corporate governance standards of the . Under these rules, a company of which more than 50% of the voting power is held by an individual, group or another company is a “controlled company” and may elect not to comply with certain corporate governance requirements, including:
| • | the requirement that a majority of the board of directors consist of “independent directors” as defined under the rules of the ; |
| • | the requirement that we have a compensation committee that is composed entirely of independent directors with a written charter addressing the committee’s purpose and responsibilities; |
| • | the requirement that we have a nominating and corporate governance committee that is composed entirely of independent directors with a written charter addressing the committee’s purpose and responsibilities; and |
| • | the requirement for an annual performance evaluation of the nominating/corporate governance and compensation committees. |
Following this offering, we intend to utilize these exemptions. As a result, we will not have a majority of independent directors, our nominating/corporate governance committee and compensation committee will not consist entirely of independent directors and such committees will not be subject to annual performance evaluations. Accordingly, you will not have the same protections afforded to stockholders of companies that are subject to all of the corporate governance requirements of the .
In addition, on June 20, 2012, the SEC adopted Rule 10C-1 under the Exchange Act (“Rule 10C-1”) to implement provisions of the Dodd-Frank Act pertaining to compensation committee independence and the role and disclosure of compensation consultants and other advisers to the compensation committee. The has since adopted amendments to its existing listing standards to comply with provisions of Rule 10C-1, and on January 11, 2013, the SEC approved such amendments. The amended listing standards require, among others, that:
| • | compensation committees be composed of fully independent directors, as determined pursuant to new and existing independence requirements; |
| • | compensation committees be explicitly charged with hiring and overseeing compensation consultants, legal counsel and other committee advisers; and |
| • | compensation committees be required to consider, when engaging compensation consultants, legal counsel or other advisers, certain independence factors, including factors that examine the relationship between the consultant or adviser’s employer and us. |
As a “controlled company,” we will not be subject to these compensation committee independence requirements.
28
Table of Contents
An active public market for our common stock may not develop following this offering, which could limit your ability to sell your shares of our common stock at an attractive price, or at all.
Prior to this offering, there has been no public market for our common stock. We cannot predict the extent to which investor interest in our Company will lead to the development of an active trading market in our common stock or how liquid that market might become. An active public market for our common stock may not develop or be sustained after the offering. We have applied to have our common stock listed on the , but we cannot assure you that our application will be accepted. If an active public market does not develop or is not sustained, it may be difficult for you to sell your shares of common stock at a price that is attractive to you, or at all.
You will incur immediate and substantial dilution in the net tangible book value of the shares you purchase in this offering.
Prior stockholders have paid substantially less per share for our common stock than the price in this offering. The initial public offering price of our common stock is substantially higher than the net tangible book deficit per share of outstanding common stock prior to completion of the offering. Based on our net tangible book deficit as of March 31, 2015 and upon the issuance and sale of shares of common stock by us at an initial public offering price of $ per share, if you purchase our common stock in this offering, you will pay more for your shares than the amounts paid by our existing stockholders for their shares and you will suffer immediate dilution of approximately $ per share in net tangible book value. Dilution is the amount by which the offering price paid by purchasers of our common stock in this offering will exceed the pro forma net tangible book value per share of our common stock upon completion of this offering. If the underwriters exercise their option to purchase additional shares, or if outstanding options to purchase our common stock are exercised, you will experience additional dilution. You may experience additional dilution upon future equity issuances or the exercise of stock options to purchase common stock granted to our employees, executive officers and directors under our 2015 Incentive Plan or other omnibus incentive plans. See “Dilution.”
Our stock price may be volatile or may decline regardless of our operating performance, and you may not be able to resell your shares at or above the initial public offering price.
After this offering, the market price for our common stock is likely to be volatile, in part because our shares have not been traded publicly and because there will be limited public float. In addition, the market price of our common stock may fluctuate significantly, and you may not be able to resell your shares at or above the initial public offering price, in response to a number of factors, such as those listed in “—Risks Related to Our Business,” and the following, most of which we cannot control:
| • | quarterly variations in our operating results compared to market expectations; |
| • | changes in preferences of our customers; |
| • | announcements of new products or significant price reductions by us or our competitors; |
| • | size of the public float; |
| • | stock price performance of our competitors; |
| • | publication of research reports about our industry; |
| • | changes in market valuations of our competitors; |
| • | fluctuations in stock market prices and volumes; |
| • | default on our indebtedness; |
| • | actions by competitors; |
| • | changes in senior management or key personnel; |
29
Table of Contents
| • | changes in financial estimates by securities analysts; |
| • | negative earnings or other announcements by us or our competitors; |
| • | downgrades in our credit ratings or the credit ratings of our competitors; |
| • | issuances of capital stock; and |
| • | global economic, legal and regulatory factors unrelated to our performance. |
The initial public offering price of our common stock will be determined by negotiations between us, our sponsors and the underwriters based upon a number of factors and may not be indicative of prices that will prevail following the consummation of this offering. Volatility in the market price of our common stock may prevent investors from being able to sell their common stock at or above the initial public offering price. As a result, you may suffer a loss on your investment.
In addition, stock markets have experienced extreme price and volume fluctuations that have affected and continue to affect the market prices of equity securities of many companies. In the past, stockholders have instituted securities class action litigation following periods of market volatility. If we were involved in securities litigation, we could incur substantial costs and our resources and the attention of management could be diverted from our business.
If securities or industry analysts do not publish research or publish inaccurate or unfavorable research about our business, our stock price and trading volume could decline.
The trading market for our common stock will depend in part on the research and reports that securities or industry analysts publish about us or our business. We do not currently have and may never obtain research coverage by securities and industry analysts on our common stock. If no securities or industry analysts commence coverage of our common stock, the trading price for our stock would be negatively impacted. If we obtain securities or industry analyst coverage on our common stock and if one or more of the analysts who covers either our debt or our equity downgrades our debt or equity or publishes inaccurate or unfavorable research about our business, our stock price would likely decline. If one or more of these analysts ceases coverage of us or fails to publish reports on us regularly, demand for our stock could decrease, which could cause our stock price and trading volume to decline.
Future sales of our common stock, or the perception in the public markets that these sales may occur, may depress our stock price.
Sales of substantial amounts of our common stock in the public market after this offering, or the perception that these sales could occur, could adversely affect the price of our common stock and could impair our ability to raise capital through the sale of additional shares.
In connection with this offering, we, our directors and executive officers and certain of our significant stockholders have agreed with the underwriters, other than shares being sold in this offering and subject to certain exceptions, not to dispose of or hedge any of the shares of common stock or securities convertible into or exchangeable for, or that represent the right to receive, shares of common stock during the period from the date of this prospectus continuing through the date 180 days after the date of this prospectus, except with the prior written consent of representatives of the underwriters, subject to certain exceptions and extensions. See “Underwriting (Conflicts of Interest).” Upon completion of this offering, we will have shares of common stock outstanding (or shares if the underwriters exercise in full their option to purchase additional shares). Of the outstanding shares, the shares sold in this offering (or shares if the underwriters exercise in full their option to purchase additional shares) will be freely tradable without restriction or further registration under the Securities Act of 1933, as amended (the “Securities Act”), except for any shares of our common stock that may be held or acquired by us, our directors, executive officers and other affiliates, including our sponsors,
30
Table of Contents
as that term is defined in the Securities Act, which will be restricted securities under the Securities Act. Restricted securities may not be sold in the public market unless the sale is registered under the Securities Act or an exemption from registration is available. Of the remaining outstanding shares, representing % of our total outstanding shares of common stock following this offering, will be deemed restricted securities. A substantial portion of these shares will be subject to the lock-up period. Restricted securities may be sold in the public market only if they are registered under the Securities Act or they qualify for an exemption from registration, such as the exemptions available under Rule 144 or 701 under the Securities Act, which rules are summarized in “Shares Eligible for Future Sale.”
In addition, shares of common stock will be eligible for sale upon exercise of vested options and upon distribution of vested restricted stock units and share appreciation rights. As soon as practicable following this offering, we intend to file one or more registration statements on Form S-8 under the Securities Act to register all shares of common stock subject to outstanding stock options, restricted stock units and share appreciation rights and the shares of common stock subject to issuance under the 2015 Omnibus Incentive Plan to be adopted in connection with this offering. Any such Form S-8 registration statements will automatically become effective upon filing. We expect that the initial registration statement on Form S-8 will cover shares of common stock. Once these shares are registered, they can be sold in the public market upon issuance, subject to restrictions under the securities laws applicable to resales by affiliates and the lockup agreement described above.
Upon the expiration of the lock-up agreements described above, shares held by our affiliates would be subject to volume, manner of sale and other limitations under Rule 144. In addition, pursuant to our Registration Rights Agreement entered into in connection with the Acquisition, we granted the Sponsors the right, subject to certain conditions, to require us to register the sale of their shares of our common stock under the Securities Act and we granted the Sponsors and certain members of management piggyback registration rights providing them the right to have us include the shares of our common stock they own in any registration by the Company. By exercising their registration rights and selling a large number of shares, the selling stockholders could cause the prevailing market price of our common stock to decline. Following completion of this offering, the shares covered by registration rights would represent approximately % of our outstanding common stock (or %, if the underwriters exercise in full their option to purchase additional shares). Registration of any of these outstanding shares of common stock would result in such shares becoming freely tradable without compliance with Rule 144 upon effectiveness of the registration statement. See “Shares Eligible for Future Sale.”
As restrictions on resale end or if these stockholders exercise their registration rights, the market price of our shares of common stock could drop significantly if the holders of these shares sell them or are perceived by the market as intending to sell them. These factors could also make it more difficult for us to raise additional funds through future offerings of our shares of common stock or other securities.
In the future, we may also issue our securities if we need to raise capital in connection with a capital expenditure or acquisition. The amount of shares of our common stock issued in connection with a capital expenditure or acquisition could constitute a material portion of our then-outstanding shares of common stock. Any perceived excess in the supply of our shares in the market could negatively impact our share price and any issuance of additional securities in connection with investments or acquisitions may result in additional dilution to you.
Anti-takeover provisions in our organizational documents might discourage, delay or prevent acquisition attempts for us that you might consider favorable.
Certain provisions of our Third Amended and Restated Certificate of Incorporation, or our Certificate of Incorporation, and Second Amended and Restated Bylaws, or our Bylaws, may have an anti-takeover effect and may delay, defer or prevent a merger, acquisition, tender offer, takeover attempt or other change of control transaction that a stockholder might consider in its best interest, including those attempts that might result in a premium over the market price for the shares held by our stockholders.
31
Table of Contents
These provisions provide for, among other things:
| • | a classified board of directors with staggered three-year terms; |
| • | the ability of our board of directors to issue one or more series of preferred stock; |
| • | advance notice for nominations of directors by stockholders and for stockholders to include matters to be considered at our annual meetings; |
| • | certain limitations on convening special stockholder meetings; |
| • | the removal of directors only for cause and only upon the affirmative vote of the holders of at least 66 2⁄3% in voting power of all the then-outstanding shares of stock of the Company entitled to vote thereon, voting together as a single class, if the Sponsors and their affiliates beneficially own, in the aggregate, less than % in voting power of the stock of the Company entitled to vote generally in the election of directors; and |
| • | that certain provisions may be amended only by the affirmative vote of at least 66 2⁄3% in voting power of all the then-outstanding shares of stock of the Company entitled to vote thereon, voting together as a single class, if the Sponsors and their affiliates beneficially own, in the aggregate, less than % in voting power of the stock of the Company entitled to vote generally in the election of directors. |
These anti-takeover provisions could make it more difficult for a third party to acquire us, even if the third party’s offer may be considered beneficial by many of our stockholders. As a result, our stockholders may be limited in their ability to obtain a premium for their shares. See “Description of Capital Stock.”
We do not expect to pay any cash dividends for the foreseeable future.
The continued operation and expansion of our business along with the service of our debt will require substantial funding. Accordingly, we do not anticipate that we will pay any cash dividends on shares of our common stock for the foreseeable future. Any determination to pay dividends in the future will be at the discretion of our board of directors and will depend upon results of operations, financial condition, contractual restrictions, restrictions imposed by applicable law and other factors our board of directors deems relevant. Additionally, our operating subsidiaries are currently restricted from paying cash dividends to SunGard by the agreements governing our indebtedness, and we expect these restrictions to continue in the future. Accordingly, if you purchase shares in this offering, realization of a gain on your investment will depend on the appreciation of the price of our common stock, which may never occur. Investors seeking cash dividends in the foreseeable future should not purchase our common stock.
32
Table of Contents
SPECIAL NOTE REGARDING FORWARD-LOOKING STATEMENTS
This prospectus, including the exhibits hereto, contains “forward-looking statements.” Any statements made in this prospectus that are not statements of historical fact, including statements about our beliefs and expectations, are forward-looking statements. Forward-looking statements include information concerning possible or assumed future results of operations, including descriptions of our business plans and strategies. These statements often include words such as “believes,” “expects,” “may,” “will,” “should,” “seeks,” “approximately,” “intends,” “plans,” “estimates” or “anticipates,” or similar expressions which concern our strategy, plans or intentions. All statements we make relating to estimated and projected earnings, margins, costs, expenditures, cash flows, growth rates and financial results are forward-looking statements. All of these forward-looking statements are subject to risks and uncertainties that may change at any time, and, therefore, our actual results may differ materially from those we expected. We derive most of our forward-looking statements from our operating budgets and forecasts, which are based upon many detailed assumptions. While we believe that our assumptions are reasonable, we caution that it is very difficult to predict the impact of known factors, and, of course, it is impossible for us to anticipate all factors that could affect our actual results.
Factors that could materially affect our financial results or such forward-looking statements include, among others, the risks, uncertainties and factors set forth above under “Risk Factors,” and the following factors:
| • | global economic and market conditions; |
| • | the condition of the financial services industry, including the effect of any further consolidation among financial services firms; |
| • | our high degree of debt-related leverage; |
| • | the effect of war, terrorism, natural disasters or other catastrophic events; |
| • | the effect of data privacy or security-related incidents with respect to information in our or our third-party vendors’ possession; |
| • | the impact of our failure to comply with current or future laws or regulations governing the collection, disclosure, use and confidentiality of personally identifiable information; |
| • | risks relating to our dependence on third-party vendors; |
| • | risks relating to our compliance with government regulations in connection with our business or by providing technology services to certain financial institutions; |
| • | the effect of disruptions to our systems and infrastructure; |
| • | the timing and magnitude of software sales; |
| • | the timing and scope of technological advances; |
| • | the market and credit risks associated with broker/dealer operations; |
| • | our inability to successfully compete in an intensely competitive environment; |
| • | the ability to retain and attract customers and key personnel; |
| • | risks relating to the foreign countries where we transact business; |
| • | the integration and performance of acquired businesses; |
| • | the ability to obtain patent protection and avoid patent-related liabilities in the context of a rapidly developing legal framework for software and business-method patents; |
| • | a material weakness in our internal controls; |
| • | unanticipated changes in our income tax provision or the enactment of new tax legislation, issuance of regulations or relevant judicial decisions; and |
33
Table of Contents
| • | the AS Split-Off failing to qualify as a tax free transaction. |
There may be other factors, many of which are beyond our control, that may cause our actual results to differ materially from the forward-looking statements, including factors disclosed under the sections entitled “Risk Factors” and “Management’s Discussion and Analysis of Financial Condition and Results of Operations” in this prospectus. You should evaluate all forward-looking statements made in this prospectus in the context of these risks and uncertainties.
The forward-looking statements contained in this prospectus speak only as of the date of this prospectus. We undertake no obligation to publicly release the result of any revisions to these forward-looking statements, to reflect events or circumstances after the date of this prospectus or to reflect the occurrence of unanticipated events.
34
Table of Contents
We estimate that we will receive net proceeds of approximately $ million from the sale of shares of our common stock in this offering, assuming an initial public offering price of $ per share, the mid-point of the estimated price range set forth on the cover page of this prospectus, and after deducting the underwriting discounts and commissions and estimated offering expenses payable by us. If the underwriters exercise in full their option to purchase additional shares, the net proceeds to us will be approximately $ million.
We expect to use approximately $ million of the net proceeds from this offering to repay approximately $ of SDS’s outstanding indebtedness.
An increase or decrease of 1,000,000 shares from the expected number of shares to be sold by us in this offering, assuming no change in the assumed initial offering price per share, the mid-point of the range on the cover of this prospectus, would increase or decrease our net proceeds from this offering by $ million. A $1.00 increase or decrease in the assumed initial offering price of $ per share, based on the mid-point of the estimated price range set forth on the cover page of this prospectus, would increase or decrease the net proceeds to us from this offering by $ million, assuming the number of shares offered by us, as set forth on the cover page of this prospectus, remains the same and after deducting the underwriting discounts and commissions and estimated offering expenses payable by us.
35
Table of Contents
We do not intend to pay cash dividends on our common stock in the foreseeable future. Any decision to pay dividends in the future will be at the discretion of our board of directors and will depend on our financial condition, capital requirements, restrictions contained in current or future financing instruments and other factors that our board of directors deems relevant. Additionally our ability to pay dividends is limited by restrictions on the ability of our operating subsidiaries to make distributions, including restrictions under the terms of the agreements governing our debt and by our Principal Investor Agreement. See “Management’s Discussion and Analysis of Financial Condition and Results of Operations—Liquidity and Capital Resources—Debt” and “Description of Indebtedness” for a description of the restrictions on our ability to pay dividends. For the years ended December 31, 2012, December 31, 2013 and December 31, 2014, we paid dividends of $724 million, $3 million and $2 million, respectively.
36
Table of Contents
If you invest in our common stock in this offering, your ownership interest in us will be diluted to the extent of the difference between the initial public offering price per share of our common stock and the adjusted net tangible book value per share of our common stock after this offering. Dilution results from the fact that the per share offering price of the common stock is substantially in excess of the book value per share attributable to the shares of common stock held by existing stockholders.
Our net tangible book deficit as of March 31, 2015 was approximately $ million, or $( ) per share of our common stock. We calculate net tangible book value per share by taking the amount of our total tangible assets, reduced by the amount of our total liabilities, and then dividing that amount by the total number of shares of common stock outstanding.
After giving effect to our sale of the shares in this offering at an initial public offering price of $ per share, the mid-point of the estimated price range set forth on the cover page of this prospectus and after deducting estimated underwriting discounts and commissions, our adjusted net tangible book deficit on March 31, 2015 would have been $( ) million, or $( ) per share of our common stock. This amount represents an immediate increase in net tangible book value (or a decrease in net tangible book deficit) of per share to existing stockholders and an immediate and substantial dilution in net tangible book value of $ per share to new investors purchasing shares in this offering at the initial public offering price.
The following table illustrates this dilution on a per share basis:
| Assumed initial public offering price per share |
$ | |||||||
| Net tangible book value (deficit) per share as of March 31, 2015 |
$ | ( | ) | |||||
|
|
|
|||||||
| Increase in tangible book value per share attributable to new investors |
$ | |||||||
| Adjusted net tangible book value (deficit) per share after this offering |
$ | ( | ) | |||||
|
|
|
|||||||
| Dilution per share to new investors |
$ | ( | ) | |||||
|
|
|
Dilution is determined by subtracting adjusted net tangible book value per share of common stock after the offering from the initial public offering price per share of common stock.
If the underwriters exercise in full their option to purchase additional shares, the adjusted net tangible book deficit per share after giving effect to the offering would be $( ) per share. This represents an increase in adjusted net tangible book value (or a decrease in net tangible book value deficit) of $ per share to the existing stockholders and dilution in adjusted net tangible book value of $ per share to new investors.
Assuming the number of shares offered by us, as set forth on the cover page of this prospectus, remains the same, after deducting estimated underwriting discounts and commissions and offering expenses payable by us, a $1.00 increase or decrease in the assumed initial offering price of $ per share, the mid-point of the range set forth on the cover page of this prospectus, would increase or decrease the net tangible book value attributable to new investors purchasing shares in this offering by $ per share and the dilution to new investors by $ per share and increase or decrease the adjusted net tangible book value per share after the offering by $ per share.
The following table summarizes, as of March 31, 2015, the differences between the number of shares purchased from us, the total consideration paid to us, and the average price per share paid by existing stockholders and by new investors. As the table shows, new investors purchasing shares in this offering will pay an average price per share substantially higher than our existing stockholders paid. The table below assumes an initial public offering price of $ per share, the mid-point of the range set forth on the cover of this
37
Table of Contents
prospectus, for shares purchased in this offering and excludes underwriting discounts and commissions and estimated offering expenses payable by us:
| Shares Purchased | Total Consideration | |||||||||||||||||
| Number | % | Amount | % | Avg/Share | ||||||||||||||
| Existing stockholders |
% | $ | % | $ | ||||||||||||||
| New investors |
% | % | $ | |||||||||||||||
|
|
|
|
||||||||||||||||
| % | $ | % | ||||||||||||||||
|
|
|
|
||||||||||||||||
If the underwriters were to fully exercise the underwriters’ option to purchase additional shares of our common stock, the percentage of shares of our common stock held by existing stockholders who are directors, officers or affiliated persons would be % and the percentage of shares of our common stock held by new investors would be %.
The foregoing tables and calculations are based on the number of shares of our common stock outstanding as of March 31, 2015 and excludes:
| • | shares of common stock issuable upon exercise of stock options outstanding as of March 31, 2015 at a weighted average exercise price of $ per share under our equity incentive plans; and |
| • | additional shares of common stock reserved for future issuance under the 2015 Incentive Plan. |
To the extent any of these outstanding options are exercised, there will be further dilution to new investors. To the extent all of such outstanding options had been exercised as of March 31, 2015, the as adjusted net tangible book deficit per share after this offering would be $( ), and total dilution per share to new investors would be $ .
38
Table of Contents
At or prior to the consummation of this offering, we expect to undertake the following Transactions to simplify our capital structure.
As of March 31, 2015, SunGard had outstanding 286.4 million shares of common stock, which is divided into nine classes: Classes A-1 through A-8 common stock (which we refer to collectively as the “Class A common stock”) and Class L common stock. As of March 31, 2015, SunGard Capital Corp. II, a direct subsidiary of SunGard, had outstanding 100 shares of common stock, all of which are held by SunGard, and 7.6 million shares of non-voting preferred stock, which are held by the current holders of Class A common stock and Class L common stock. Prior to the consummation of this offering, SunGard will fully and unconditionally guarantee the dividend and liquidation payment obligations of SunGard Capital Corp. II’s preferred stock. Thereafter, and at or prior to the consummation of this offering, the Second Amended and Restated Certificate of Incorporation of SunGard will be amended so as to recapitalize the Class A common stock and the Class L common stock into a new, single class of common stock, which is the same class of common stock that is being offered hereby. Pursuant to such amendment, the existing shares of Class A common stock will be cancelled, and the Class L common stock will be converted into a number of shares of new common stock having an aggregate fair market value equal to the converted shares. In addition, holders of SunGard Capital Corp. II preferred stock will transfer all of their shares of SunGard Capital Corp. II preferred stock to SunGard in exchange for shares of new common stock having an aggregate fair market value equal to the exchanged shares. We refer to these transactions, collectively, as the “Recapitalization.”
After the Recapitalization and at or prior to the consummation of this offering, we will cause SunGard Holding Corp. to merge with and into SunGard Capital Corp. II with SunGard Capital Corp. II surviving the merger.
39
Table of Contents
The following table sets forth our cash and cash equivalents and capitalization as of March 31, 2015:
| • | on an actual basis; and |
| • | on an as adjusted basis to give effect to (1) the Recapitalization; (2) the sale by us of approximately shares of our common stock in this offering, after deducting estimated underwriting discounts and commissions and offering expenses payable by us; (3) the payment of estimated fees and expenses (other than underwriting discounts and commissions) in connection with this offering at an assumed initial public offering price of $ per share, the mid-point of the price range set forth on the cover page of this prospectus and (4) the application of the estimated net proceeds from the offering, as described in “Use of Proceeds,” at an assumed initial public offering price of $ per share, the mid-point of the estimated price range set forth on the cover page of this prospectus. |
You should read this table in conjunction with the information contained in “Use of Proceeds,” “Selected Historical Consolidated Financial Data,” “Management’s Discussion and Analysis of Financial Condition and Results of Operations” and “Description of Indebtedness,” as well as the consolidated financial statements and the notes thereto included elsewhere in this prospectus.
| As of March 31, 2015 | ||||||||
| Actual | As adjusted(1) | |||||||
| (dollars in millions, except par value) | ||||||||
| Cash and cash equivalents |
$ | 555 | $ | |||||
|
|
|
|
|
|||||
| Debt: |
||||||||
| Senior Secured Credit Facilities |
||||||||
| Secured Revolving Credit Facility |
— | |||||||
| Tranche C due February 28, 2017 |
400 | |||||||
| Tranche E due March 8, 2020 |
1,918 | |||||||
| 7.375% Senior Notes due 2018 |
511 | |||||||
| 7.625% Senior Notes due 2020 |
700 | |||||||
| 6.625% Senior Subordinated Notes due 2019 |
1,000 | |||||||
| Secured Accounts Receivable Facility |
140 | |||||||
| Other |
1 | |||||||
| Debt (continuing operations) |
||||||||
| Other (discontinued operations) |
||||||||
|
|
|
|
|
|||||
| Total debt |
$ | 4,670 | $ | |||||
| Temporary Equity(2): |
$ | 96 | $ | |||||
| Stockholders’ equity: |
||||||||
| Pro forma common stock, $0.01 par value ( million shares authorized, million issued and million outstanding, actual, respectively; shares authorized |
— | |||||||
| Class L common stock, convertible par value, $.001 per share, cumulative 13.5% per annum compounded quarterly, aggregate liquidation on preference of $8,337 million, 50,000,000 shares authorized, 29,062,421 shares issued |
||||||||
| Class A common stock, par value $.001 per share; 550,000,000 shares authorized, 261,565,118 shares issued |
||||||||
| Additional paid-in capital |
$ | 2,681 | $ | |||||
| Treasury stock, 418,438 shares of Class L common stock actual; and 3,769,251 shares of Class A common stock actual; shares of common stock as adjusted |
(36 | ) | ||||||
| Accumulated deficit |
(3,917 | ) | ||||||
| Accumulated other comprehensive loss |
(203 | ) | ||||||
| Total stockholders’ equity |
(1,475 | ) | ||||||
| Non-controlling interests(3) |
(1,532 | ) | ||||||
|
|
|
|
|
|||||
| Total equity |
57 | |||||||
|
|
|
|
|
|||||
| Total capitalization |
$ | 4,823 | $ | |||||
|
|
|
|
|
|||||
40
Table of Contents
| (1) | To the extent we change the number of shares of common stock sold by us in this offering from the shares we expect to sell or we change the initial public offering price from the assumed initial offering price of $ per share, the mid-point of the estimated price range set forth on the cover page of this prospectus, or any combination of these events occurs, the net proceeds to us from this offering and each of the total stockholders’ equity and total capitalization may increase of decrease. A $1.00 increase or decrease in the assumed initial public offering price per share of the common stock, assuming no change in the number of shares of common stock to be sold, would increase or decrease the net proceeds that we receive in this offering and each of total stockholders’ equity and total capitalization by approximately $ . An increase or decrease of 1,000,000 shares in the expected number of shares to be sold in the offering, assuming no change in the assumed initial offering price per share, would increase or decrease our net proceeds from this offering and our total stockholders’ equity and total capitalization by approximately $ . |
| (2) | Consists of certain existing equity interests subject to a put option excercisable upon termination of employment due to death or disability. The put option will expire upon an initial public offering. |
| (3) | Non-controlling interest, both temporary and permanent, represent the combined ownership interests of the preferred stockholders of SunGard Capital Corp. II. |
41
Table of Contents
SELECTED HISTORICAL CONSOLIDATED FINANCIAL DATA
Set forth below is our selected historical consolidated financial data as of the dates and for the periods indicated.
The table below presents our summary historical consolidated financial data as of the dates and for the periods indicated. We have derived the summary historical consolidated financial data as of December 31, 2013 and 2014 and for each of the years ended December 31, 2012, 2013 and 2014 from our audited consolidated financial statements included elsewhere in this prospectus. We have derived the summary historical consolidated financial data as of December 31, 2010, 2011 and 2012 and for each of the years ended December 31, 2010 and 2011 from our audited historical financial statements which are not included in this prospectus. We have derived the summary historical consolidated financial data as of March 31, 2014 from our unaudited consolidated financial statements which are not included in this prospectus, and we have derived the summary historical consolidated financial data as of March 31, 2015 and for each of the three months ended March 31, 2014 and March 31, 2015 from our unaudited consolidated financial statements included elsewhere in this prospectus, which have been prepared on the same basis as our audited consolidated financial statements.
Our historical results are not necessarily indicative of future operating results. The following table should be read in conjunction with “Management’s Discussion and Analysis of Financial Condition and Results of Operations” and our consolidated financial statements and the related notes thereto included elsewhere in this prospectus.
| Year ended December 31, | Three months ended March 31, |
|||||||||||||||||||||||||||
| 2010 | 2011 | 2012 | 2013 | 2014 | 2014 | 2015 | ||||||||||||||||||||||
| (dollars in millions, except per share amounts) | (unaudited) | |||||||||||||||||||||||||||
| Consolidated statements of comprehensive income (loss): |
||||||||||||||||||||||||||||
| Revenue |
$ | 2,909 | $ | 2,921 | $ | 2,808 | $ | 2,761 | $ | 2,809 | $ | 653 | $ | 671 | ||||||||||||||
|
|
|
|
|
|
|
|
|
|
|
|
|
|
|
|||||||||||||||
| Operating income (loss) |
59 | 242 | 348 | 404 | 86 | (289 | ) | 115 | ||||||||||||||||||||
| Other income (expense): |
||||||||||||||||||||||||||||
| Interest income |
2 | 3 | 1 | 1 | 1 | — | — | |||||||||||||||||||||
| Interest expense and amortization of deferred financing fees |
(569 | ) | (463 | ) | (360 | ) | (326 | ) | (291 | ) | (74 | ) | (71 | ) | ||||||||||||||
| Loss on extinguishment of debt |
(58 | ) | (3 | ) | (82 | ) | (6 | ) | (61 | ) | (61 | ) | — | |||||||||||||||
| Other income (expense) |
7 | — | 1 | (2 | ) | — | — | — | ||||||||||||||||||||
|
|
|
|
|
|
|
|
|
|
|
|
|
|
|
|||||||||||||||
| Other income (expense) |
(618 | ) | (463 | ) | (440 | ) | (333 | ) | (351 | ) | (135 | ) | (71 | ) | ||||||||||||||
|
|
|
|
|
|
|
|
|
|
|
|
|
|
|
|||||||||||||||
| Income (loss) from continuing operations before income taxes |
(559 | ) | (221 | ) | (92 | ) | 71 | (265 | ) | (424 | ) | 44 | ||||||||||||||||
|
|
|
|
|
|
|
|
|
|
|
|
|
|
|
|||||||||||||||
| Benefit from (provision for) income taxes |
96 | 143 | 49 | (26 | ) | 57 | 101 | (18 | ) | |||||||||||||||||||
|
|
|
|
|
|
|
|
|
|
|
|
|
|
|
|||||||||||||||
| Income (loss) from continuing operations |
(463 | ) | (78 | ) | (43 | ) | 45 | (208 | ) | (323 | ) | 26 | ||||||||||||||||
| Income (loss) from discontinued operations, net of tax(1) |
(107 | ) | (73 | ) | (23 | ) | 17 | (14 | ) | (17 | ) | 2 | ||||||||||||||||
|
|
|
|
|
|
|
|
|
|
|
|
|
|
|
|||||||||||||||
| Net income (loss) |
(570 | ) | (151 | ) | (66 | ) | 62 | (222 | ) | (340 | ) | 28 | ||||||||||||||||
| Income attributable to non-controlling interests |
(191 | ) | (225 | ) | (251 | ) | (169 | ) | (174 | ) | (50 | ) | (43 | ) | ||||||||||||||
|
|
|
|
|
|
|
|
|
|
|
|
|
|
|
|||||||||||||||
| Net loss attributable to SunGard |
$ | (761 | ) | $ | (376 | ) | $ | (317 | ) | $ | (107 | ) | $ | (396 | ) | $ | (390 | ) | $ | (15 | ) | |||||||
|
|
|
|
|
|
|
|
|
|
|
|
|
|
|
|||||||||||||||
| Basic earnings (loss) per share: |
||||||||||||||||||||||||||||
| Historical: |
||||||||||||||||||||||||||||
| Net income (loss) per share: |
||||||||||||||||||||||||||||
| Class L stockholders |
$ | 20.61 | $ | 23.52 | $ | 26.86 | $ | 30.68 | $ | 35.03 | $ | 8.14 | $ | 9.29 | ||||||||||||||
| Class A stockholders—continuing operations |
(4.84 | ) | (3.79 | ) | (4.12 | ) | (3.89 | ) | (5.37 | ) | (2.34 | ) | (1.10 | ) | ||||||||||||||
| Class A stockholders—total |
(5.26 | ) | (4.07 | ) | (4.22 | ) | (3.83 | ) | (5.42 | ) | (2.40 | ) | (1.09 | ) | ||||||||||||||
| Pro forma(2): |
||||||||||||||||||||||||||||
| Net income (loss) per share—continuing operations |
||||||||||||||||||||||||||||
| Weighted average number of shares |
||||||||||||||||||||||||||||
42
Table of Contents
| Year ended December 31, | Three months ended March 31, |
|||||||||||||||||||||||||||
| 2010 | 2011 | 2012 | 2013 | 2014 | 2014 | 2015 | ||||||||||||||||||||||
| (dollars in millions, except per share amounts) | (unaudited) | |||||||||||||||||||||||||||
| Diluted earnings (loss) per share: |
||||||||||||||||||||||||||||
| Historical: |
||||||||||||||||||||||||||||
| Net income (loss) per share: |
||||||||||||||||||||||||||||
| Class L stockholders |
$ | 20.61 | $ | 23.52 | $ | 26.86 | $ | 30.68 | $ | 35.03 | $ | 8.14 | $ | 9.29 | ||||||||||||||
| Class A stockholders—continuing operations |
(4.84 | ) | (3.79 | ) | (4.12 | ) | (3.90 | ) | (5.37 | ) | (2.34 | ) | (1.10 | ) | ||||||||||||||
| Class A stockholders—total |
(5.26 | ) | (4.07 | ) | (4.22 | ) | (3.84 | ) | (5.42 | ) | (2.40 | ) | (1.09 | ) | ||||||||||||||
| Pro forma(2): |
||||||||||||||||||||||||||||
| Net income (loss) per share—continuing operations |
||||||||||||||||||||||||||||
| Weighted average number of shares |
||||||||||||||||||||||||||||
| Consolidated statements of cash flows data: |
||||||||||||||||||||||||||||
| Net cash provided by (used in): |
||||||||||||||||||||||||||||
| Operating activities: |
||||||||||||||||||||||||||||
| Continuing operations |
$ | np | $ | 164 | $ | 287 | $ | 421 | $ | 332 | $ | 86 | $ | 154 | ||||||||||||||
| Discontinued operations |
np | 514 | (43 | ) | 324 | 33 | 36 | — | ||||||||||||||||||||
|
|
|
|
|
|
|
|
|
|
|
|
|
|
|
|||||||||||||||
| Total |
721 | 678 | 244 | 745 | 365 | 122 | 154 | |||||||||||||||||||||
|
|
|
|
|
|
|
|
|
|
|
|
|
|
|
|||||||||||||||
| Investing activities: |
||||||||||||||||||||||||||||
| Continuing operations |
np | (137 | ) | (136 | ) | (112 | ) | (147 | ) | (28 | ) | (32 | ) | |||||||||||||||
| Discontinued operations |
np | (189 | ) | 1,597 | (146 | ) | 7 | 5 | 1 | |||||||||||||||||||
|
|
|
|
|
|
|
|
|
|
|
|
|
|
|
|||||||||||||||
| Total |
(260 | ) | (326 | ) | 1,461 | (258 | ) | (140 | ) | (23 | ) | (31 | ) | |||||||||||||||
|
|
|
|
|
|
|
|
|
|
|
|
|
|
|
|||||||||||||||
| Financing activities: |
||||||||||||||||||||||||||||
| Continuing operations |
np | (255 | ) | (2,036 | ) | (324 | ) | (1,355 | ) | (1,338 | ) | (4 | ) | |||||||||||||||
| Discontinued operations |
np | 2 | (3 | ) | (2 | ) | 887 | 887 | — | |||||||||||||||||||
|
|
|
|
|
|
|
|
|
|
|
|
|
|
|
|||||||||||||||
| Total |
(344 | ) | (253 | ) | (2,039 | ) | (326 | ) | (468 | ) | (451 | ) | (4 | ) | ||||||||||||||
|
|
|
|
|
|
|
|
|
|
|
|
|
|
|
|||||||||||||||
| Consolidated balance sheet data (at period end): |
||||||||||||||||||||||||||||
| Cash and cash equivalents(3) |
$ | 616 | $ | 832 | $ | 535 | $ | 675 | $ | 447 | $ | 355 | $ | 555 | ||||||||||||||
| Total assets |
12,968 | 12,550 | 10,018 | 9,778 | 6,511 | 6,452 | 6,389 | |||||||||||||||||||||
| Total debt(4) |
8,050 | 7,823 | 6,658 | 6,384 | 4,669 | 4,671 | 4,670 | |||||||||||||||||||||
| Total liabilities |
11,364 | 11,094 | 9,328 | 8,979 | 6,322 | 6,302 | 6,236 | |||||||||||||||||||||
| Total equity |
1,452 | 1,375 | 614 | 695 | 92 | 70 | 57 | |||||||||||||||||||||
| Other financial data (continuing operations): |
||||||||||||||||||||||||||||
| Capital expenditures(5) |
$ | np | $ | 97 | $ | 97 | $ | 111 | $ | 143 | $ | 28 | $ | 28 | ||||||||||||||
| Cash interest expense(6) |
524 | 420 | 323 | 288 | 272 | 67 | 67 | |||||||||||||||||||||
| Adjusted EBITDA(7) |
703 | 707 | 749 | 766 | 765 | 145 | 175 | |||||||||||||||||||||
| “np” | = not presented |
| (1) | In January 2012, we sold our Higher Education business and in July 2012 we sold one FS subsidiary. We recorded a $571 million gain on the sales. As a result of the HE sale, in 2012, we paid approximately $400 million in income tax payments. In January 2014, we sold two small businesses within our FS segment for €27 million paid at closing, €9 million to be paid within three years (“deferred purchase price”) and €2 million to be paid upon the successful assignment of certain customer contracts. During the first quarter of 2015, we successfully assigned certain of these customer contracts and recognized a $2 million gain in discontinued operations. The deferred purchase price is unconditional and is secured by a bank guarantee. On March 31, 2014, we completed the AS Split-Off. These businesses are included in our financial results as discontinued operations for all periods presented. |
| (2) | Reflects the Recapitalization and the -for-one stock split. |
| (3) | Cash and cash equivalents excludes cash related to discontinued operations of $162 million, $41 million, $11 million and $31 million at December 31, 2010, 2011, 2012, and 2013, respectively. |
43
Table of Contents
| (4) | Reflects the total debt of the Company, which has decreased over time due to repayments from the net proceeds of businesses we sold and from the split-off of the AS business, as well as repayments from excess cash flows and available cash. Total debt excludes debt related to discontinued operations of $5 million, $6 million, $4 million and $8 million at December 31, 2010, 2011, 2012, and 2013, respectively. |
| (5) | Capital expenditures represent cash paid for property, equipment and software, as well as the capitalization of internal costs related to software development initiatives. |
| (6) | Cash interest expense is net of cash interest income and does not include any amortization of capitalized debt issuance cost, accretion of bond discounts, accretion of discounted liabilities, or loss on sale of receivables. |
| (7) | Our primary non-GAAP measure is Adjusted EBITDA, whose corresponding GAAP measure is net income (loss). We define Adjusted EBITDA as net income (loss) less income (loss) from discontinued operations, income taxes, loss on extinguishment of debt, interest expense and amortization of deferred financing fees, depreciation (including the amortization of capitalized software), amortization of acquisition-related intangible assets, trade name and goodwill impairment charges, severance and facility closure charges, stock compensation expense, management fees from our Sponsors, and certain other costs. |
We believe Adjusted EBITDA is an effective tool to measure our operating performance since it excludes non-cash items and certain variable charges. We use Adjusted EBITDA extensively to measure the financial performance of SunGard and also to report our results to our board of directors. We use a similar measure, as defined in our senior secured credit agreement, for purposes of computing our debt covenants.
While Adjusted EBITDA and similar measures are frequently used as measures of operations and the ability to meet debt service requirements, these terms are not necessarily comparable to other similarly titled captions of other companies due to the potential inconsistencies in the method of calculation. Adjusted EBITDA does not reflect the impact of earnings or charges resulting from matters that we may consider not to be indicative of our ongoing operations. In particular, our definition of Adjusted EBITDA adds back certain noncash, extraordinary or unusual charges that are deducted in calculating net income (loss). However, these are expenses that may recur, vary greatly and are difficult to predict. Adjusted EBITDA should not be considered as an alternative to cash flows from operating activities, as a measure of liquidity or as an alternative to operating income or net income as indicators of operating performance.
44
Table of Contents
The following table presents a reconciliation of Adjusted EBITDA, a non-GAAP measure, to net income (loss), which is the nearest comparable GAAP measure.
| Year ended December 31, | Three months ended March 31, |
|||||||||||||||||||||||||||
| 2010 | 2011 | 2012 | 2013 | 2014 | 2014 | 2015 | ||||||||||||||||||||||
| (dollars in millions) | (unaudited) | |||||||||||||||||||||||||||
| Net income (loss) |
$ | (570 | ) | $ | (151 | ) | $ | (66 | ) | $ | 62 | $ | (222 | ) | $ | (340 | ) | $ | 28 | |||||||||
| Income (loss) from discontinued operations, net of tax |
(107 | ) | (73 | ) | (23 | ) | 17 | (14 | ) | (17 | ) | 2 | ||||||||||||||||
| Benefit from (provision for) income taxes |
96 | 143 | 49 | (26 | ) | 57 | 101 | (18 | ) | |||||||||||||||||||
| Loss on extinguishment of debt(a) |
(58 | ) | (3 | ) | (82 | ) | (6 | ) | (61 | ) | (61 | ) | — | |||||||||||||||
| Interest expense and amortization of deferred financing fees |
(569 | ) | (463 | ) | (360 | ) | (326 | ) | (291 | ) | (74 | ) | (71 | ) | ||||||||||||||
| Other income (expense), net |
9 | 3 | 2 | (1 | ) | 1 | — | — | ||||||||||||||||||||
|
|
|
|
|
|
|
|
|
|
|
|
|
|
|
|||||||||||||||
| Operating income (loss) |
59 | 242 | 348 | 404 | 86 | (289 | ) | 115 | ||||||||||||||||||||
| Depreciation |
87 | 91 | 96 | 104 | 107 | 24 | 29 | |||||||||||||||||||||
| Amortization of acquisition-related intangible assets |
274 | 260 | 217 | 182 | 136 | 43 | 21 | |||||||||||||||||||||
| Trade name impairment charge |
— | — | — | — | 339 | 339 | — | |||||||||||||||||||||
| Goodwill impairment charges |
205 | 12 | — | — | — | — | — | |||||||||||||||||||||
| Restructuring charges(b) |
15 | 48 | 42 | 17 | 27 | 5 | 2 | |||||||||||||||||||||
| Stock compensation expense |
23 | 27 | 31 | 39 | 42 | 9 | 10 | |||||||||||||||||||||
| Management fees |
9 | 7 | 9 | 8 | 9 | 2 | 2 | |||||||||||||||||||||
| Other costs (included in operating income)(c) |
31 | 20 | 6 | 12 | 19 | 12 | (4 | ) | ||||||||||||||||||||
|
|
|
|
|
|
|
|
|
|
|
|
|
|
|
|||||||||||||||
| Adjusted EBITDA |
$ | 703 | $ | 707 | $ | 749 | $ | 766 | $ | 765 | $ | 145 | $ | 175 | ||||||||||||||
|
|
|
|
|
|
|
|
|
|
|
|
|
|
|
|||||||||||||||
| (a) | Loss on extinguishment of debt includes in 2010 the loss on extinguishment of $1.6 billion of senior notes due in 2013 and the write-off of deferred financing fees related to the refinancing of a portion of our U.S. Dollar-denominated term loans and retirement of $100 million of pound Sterling-denominated term loans. Loss on extinguishment of debt includes in 2012 the write-off of deferred financing fees associated with the January 2012 repayment of $1.22 billion of our U.S. Dollar-denominated term loans, the April 2012 retirement of $500 million, 10.625% senior notes due 2015, the December 2012 retirement of $1 billion, 10.25% senior subordinated notes due 2015 and the December 2012 repayment of $217 million of U.S. Dollar-denominated term loans. Loss on extinguishment of debt for 2014 primarily includes (i) a $36 million loss associated with the exchange of SpinCo Notes for SunGard Notes and (ii) the write-off of deferred financing fees associated with (a) the repayment of $1.005 billion of term loans and the retirement of $389 million of senior notes due 2018, both resulting from the AS Split-Off (see Note 1 and Note 5 of Notes to Consolidated Financial Statements), (b) the $250 million reduction of the revolving credit facility and (c) the repayment of $60 million of the accounts receivable facility term loans. |
| (b) | Restructuring charges include severance and related payroll taxes and reserves to consolidate certain facilities. |
| (c) | Other costs include strategic initiative expenses, certain expenses associated with acquisitions made by the Company, and foreign currency gains and losses. |
45
Table of Contents
MANAGEMENT’S DISCUSSION AND ANALYSIS OF FINANCIAL CONDITION AND
RESULTS OF OPERATIONS
The following discussion contains management’s discussion and analysis of our financial condition and results of operations and should be read together with “Summary Historical Consolidated Financial Data,” “Selected Historical Consolidated Financial Data” and our consolidated financial statements and related notes thereto included elsewhere in this prospectus. This discussion contains forward-looking statements and involves numerous risks and uncertainties, including but not limited to those described in the “Risk Factors” section of this prospectus. Actual results may differ materially from those contained in any forward-looking statements. You should read “Special Note Regarding Forward-Looking Statements” and “Risk Factors.”
Overview
SunGard is a leading provider of mission-critical software to financial institutions globally. Our solutions automate a wide range of complex business processes across the financial services industry, including those associated with trading, securities operations, administering investment portfolios, accounting for investment assets, and managing risk and compliance requirements. We are the largest provider of industry-specific software by revenue to the segments that we serve, and are differentiated by the breadth of our offerings, leading edge technology, operating scale, deep domain expertise, and global reach. In 2014, we generated $2.8 billion in revenue, 70% of which was recurring, along with attractive operating margins and strong cash flows.
In 2011, we embarked on a major transformation program to create a more integrated enterprise, focused primarily on the financial services industry. Led by a new executive leadership team, this effort focused on two core activities: (i) aligning the organization around a new, integrated operating model and (ii) shifting investment priorities to better drive organic growth and serve the evolving needs of our customers.
We also exited non-core business lines representing more than $2 billion of revenues, including the sale of Higher Education in January 2012 ($492 million in 2011 revenue), the split-off of Availability Services in March 2014 ($1.4 billion in 2013 revenue) and other smaller divestitures. In addition, within our Financial Systems segment, we have exited slower growing or low margin business lines representing $203 million in revenue since 2010, which negatively impacted revenue growth in 2012 and 2013. We are now a focused company providing vertical-specific software for the financial services industry.
Our Business Model
Our business model is founded on software, which is surrounded by services, resulting in strong recurring revenue streams with attractive profit margins and strong cash flows. At the heart of our business model is our proprietary software that is licensed or rented to customers for periods typically ranging from three to seven years and also offered as a service, which we refer to as our SaaS offering. Our license offerings have traditionally been run on our customers’ premises but are increasingly delivered from our private cloud. In addition, we provide professional services and business processing as a service, or BPaaS (collectively, “Services”).
Because we sell our software maintenance, rentals, SaaS, cloud and BPaaS offerings under long-term contracts and recognize the revenue ratably over the term of the contracts, we have good visibility into future revenue, which helps us to manage spending proactively. We refer to this contractually committed revenue as “recurring revenue.” Our revenue streams are highly recurring as a result of our deeply embedded solutions and long-running contracts typically ranging from three to seven years for software maintenance, rentals, SaaS, cloud and BPaaS offerings. In 2014, these offerings comprised 70% of our revenue, with a revenue retention rate of 95%. Our retention rate is defined as the percentage of the prior year’s recurring revenue which is retained in the current year.
The remaining 30% of our 2014 total revenue was comprised of software license fees and professional services revenue. Software license fees have generated revenue of $237 million, $240 million and $244 million for the fiscal years ended December 31, 2012, 2013 and 2014, respectively. Professional services has generated
46
Table of Contents
revenue of $520 million, $503 million and $528 million for the three fiscal years ended December 31, 2012, 2013 and 2014 respectively. We expect this professional services revenue to grow as we bring more software to market.
We classify our revenue into three categories: Software revenue, SaaS and cloud revenue and Services revenue, as described below.
Software Revenue
Our Software revenue represented 40% of our 2014 total revenue and is comprised of traditional software license fees, maintenance and support fees, and fees from the resale of third-party software licenses. These software license fees include term licenses, perpetual licenses and, for customers who would prefer a periodic fee instead of a larger up-front payment, rental fees. Maintenance and support fees provide customers with periodic technology updates and interactive support related to our software.
Within Software, perpetual and term licenses revenue is generally recognized at the time of sale. The majority of our software license revenue results from the sale of term licenses, which generally have terms of three to seven years. The scheduled renewals of these term licenses provide good visibility to our future revenue pipeline. However, the timing of these license sales can significantly impact our revenue and profitability in any given quarter.
SaaS and Cloud Revenue
Our SaaS and cloud offerings comprised 38% of our total revenue in 2014. SaaS and cloud offerings are delivered from SunGard’s private cloud to provide customers with a secure and reliable environment operated by qualified SunGard personnel. These offerings allow customers to take advantage of SunGard’s deep domain expertise while avoiding the upfront cost of licensing and IT infrastructure. SaaS and cloud revenue also includes revenue from our proprietary trading algorithms and trade execution network.
Our cloud offerings have been a source of consistent growth in recent years as an increasing number of customers have opted to deploy their licensed SunGard applications in our private cloud. In these instances, we charge separately for hosting these licensed SunGard applications in our private cloud. We classify that hosting revenue in our SaaS and cloud revenue category, while the corresponding software license, maintenance and rental revenue is classified in our Software revenue category.
Our SaaS offerings include fully integrated software, hosting and application management services, which are also delivered from SunGard’s private cloud. All revenue related to our SaaS offerings is classified in our SaaS and cloud revenue category, noting the fully integrated service that we provide.
These SaaS and cloud offerings are generally sold on multi-year contracts. As such, they form a strong recurring revenue stream for our company and have historically generated high customer renewal rates. Consistent with industry trends, we expect SaaS and cloud revenue to become a greater portion of our overall revenue going forward.
Services Revenue
Professional services and BPaaS revenue represented approximately 22% of our 2014 total revenue. Professional services offerings help customers to install, optimize and integrate SunGard’s software into their computing environment. We expect this revenue stream to grow as we bring more software to market.
As is typical in our industry, our profit margins on professional services revenue are lower than on our revenue from software offerings. We are currently investing to expand our global professional services delivery capacity in order to further improve our customers’ adoption of our core technologies.
47
Table of Contents
Our BPaaS offerings typically provide back-office processing services to our customers where the process is built on a SunGard application. The combination of our industry and application knowledge, coupled with our customers’ desire to focus on their core competencies, is resulting in continued growth in these BPaaS offerings. Recently, we have expanded our BPaaS services to include utility offerings covering derivatives processing and U.S. transfer agency services. These utilities are based on SunGard’s proprietary software and allow us to service multiple customers from a single delivery center. We expect revenue to grow from these offerings, but, margins are expected to be lower than from our software revenue over the next few years as we invest to grow these utilities.
Profit and Cash Flow
SunGard’s business model generates attractive operating profits and strong cash flow, driven by:
| • | our competitively-differentiated and deeply embedded software offerings; |
| • | our ability to leverage our scale in sales, development, service delivery and back office administration; |
| • | our global reach, which allows us to sell, implement and support consistent offerings to the established and emerging markets of the world; and |
| • | our use of low cost locations in development, delivery and administration. |
Over the past few years, we have shifted from a distributed model to an integrated cross-company model in order to improve operating margins even as we invest to grow our business.
Geographic Operations
SunGard manages operations in four major geographies around the world, generating $2.8 billion in revenue for the year ended December 31, 2014, as described below.
| Region |
Percent of Total Revenue |
|||
| North America |
64 | % | ||
| Europe |
22 | % | ||
| Asia Pacific |
10 | % | ||
| Middle East, Africa, Central and South America |
4 | % | ||
Within these geographies, there are both established markets and emerging markets. The established markets, comprised of the United States, Western Europe, Japan and Australia, generated 88% of our total revenue in 2014. These large, mature markets include some of our largest customers and the most extensive use of our technologies. The emerging markets, comprised of China, India, Southeast Asia, the Middle East, Africa, Latin America and Eastern Europe, comprised 12% of our total revenue in 2014. These markets are less mature, but are much faster growing than the established markets. Our customers in these regions have purchased our offerings as they compete on both a local and increasingly global basis.
Similar to our revenue, our resources and facilities are also geographically dispersed. This provides better local customer support and also results in natural currency hedges such that currency movements that may impact revenue growth have less of an impact on profit growth.
Our Segments
We operate our company in two reporting segments, Financial Systems and Public Sector & Education.
Financial Systems
Our Financial Systems (“FS”) segment offers software and services that automate a wide range of complex business processes across the financial services industry, including those associated with trading, securities
48
Table of Contents
operations, administering investment portfolios, accounting for investment assets, and managing risk and compliance requirements. We meet the needs of a broad range of end users, including asset managers, CFOs and treasurers, traders on the sell-side and buy-side, securities operations managers, fund administrators, risk and compliance officers, plan administrators, and registered investment advisors.
Public Sector & Education
In addition to our primary FS segment, our Public Sector and Education (“PS&E”) segment offerings are designed to meet the specialized needs of local and state governments, public safety and justice agencies, and K-12 educational institutions. These customers rely on us to provide innovative and mission-critical software to address their most important enterprise resource planning (“ERP”) and administrative processes. These ERP offerings support a range of specialized functions such as accounting, human resources, emergency dispatch operations, the operation of courts and jails, and K-12 student information systems.
Results of Operations
We evaluate our performance using both U.S. GAAP (accounting principles generally accepted in the United States) and non-GAAP measures. Our primary non-GAAP measure is Adjusted EBITDA. For a definition of Adjusted EBITDA and a reconciliation to net income, please refer to “Non-GAAP Financial Measures” included elsewhere in this document.
We are also supplementing certain GAAP measures with comparable measures on a constant-currency basis, a non-GAAP measure, which exclude the impacts from changes in currency translation. We believe providing explanations of the year-to-year variances in our results on a constant-currency basis is meaningful for assessing how our underlying businesses have performed due to the fact that we have international operations that are material to our overall operations. As a result of our international operations, total revenues and expenses are affected by changes in the U.S. Dollar against international currencies. To present our constant currency year-over-year changes, current period results for entities reporting in currencies other than U.S. Dollars are converted to U.S. Dollars at the average exchange rate used in the prior-year period rather than the actual exchange rates in effect during the current-year period. In each of the tables below, we present the percent change based on actual, unrounded results in reported currency and in constant currency.
49
Table of Contents
Three Months Ended March 31, 2015 Compared to Three Months Ended March 31, 2014
Consolidated Results of Operations (Unaudited)
| Three Months Ended March 31, | Year-over-Year Change | |||||||||||||||||||||||
| % of Revenue | As Reported |
At Constant Currency |
||||||||||||||||||||||
| (dollars in millions) | 2014 | 2015 | 2014 | 2015 | ||||||||||||||||||||
| Revenue |
$ | 653 | $ | 671 | 100 | % | 100 | % | 3 | % | 6 | % | ||||||||||||
| Costs and expenses: |
||||||||||||||||||||||||
| Cost of sales and direct operating |
269 | 268 | 41 | % | 40 | % | 0 | % | 3 | % | ||||||||||||||
| Sales, marketing and administration |
168 | 152 | 26 | % | 23 | % | (10 | )% | (6 | )% | ||||||||||||||
| Product development and maintenance . |
99 | 86 | 15 | % | 13 | % | (12 | )% | (7 | )% | ||||||||||||||
| Depreciation |
24 | 29 | 4 | % | 4 | % | 17 | % | 21 | % | ||||||||||||||
| Amortization of acquisition-related intangible assets |
43 | 21 | 7 | % | 3 | % | (51 | )% | (49 | )% | ||||||||||||||
| Trade name impairment |
339 | — | 52 | % | 0 | % | nm | nm | ||||||||||||||||
|
|
|
|
|
|
|
|
|
|
|
|
|
|||||||||||||
| Total costs and expenses |
942 | 556 | 144 | % | 83 | % | (41 | )% | (39 | )% | ||||||||||||||
|
|
|
|
|
|
|
|
|
|
|
|
|
|||||||||||||
| Operating income (loss) |
(289 | ) | 115 | (44 | )% | 17 | % | 140 | % | 139 | % | |||||||||||||
|
|
|
|
|
|
|
|
|
|
|
|
|
|||||||||||||
| Operating margin |
(44 | )% | 17 | % | 61.3 | % | 60.5 | % | ||||||||||||||||
| Other income (expense): |
||||||||||||||||||||||||
| Interest expense and amortization of deferred financing fees |
(74 | ) | (71 | ) | (11 | )% | (10 | )% | 5 | % | 5 | % | ||||||||||||
| Loss on extinguishment of debt |
(61 | ) | — | (9 | )% | 0 | % | nm | nm | |||||||||||||||
|
|
|
|
|
|
|
|
|
|
|
|
|
|||||||||||||
| Other income (expense) |
(135 | ) | (71 | ) | (21 | )% | (10 | )% | 48 | % | 49 | % | ||||||||||||
|
|
|
|
|
|
|
|
|
|
|
|
|
|||||||||||||
| Income (loss) from continuing operations before income taxes |
(424 | ) | 44 | (65 | )% | 7 | % | nm | nm | |||||||||||||||
| Benefit from (provision for) income taxes |
101 | (18 | ) | 15 | % | (3 | )% | nm | nm | |||||||||||||||
|
|
|
|
|
|
|
|
|
|
|
|
|
|||||||||||||
| Income (loss) from continuing operations |
(323 | ) | 26 | (50 | )% | 4 | % | nm | nm | |||||||||||||||
| Income (loss) from discontinued operations, net of tax |
(17 | ) | 2 | (3 | )% | 0 | % | nm | nm | |||||||||||||||
|
|
|
|
|
|
|
|
|
|
|
|
|
|||||||||||||
| Net income (loss) |
(340 | ) | 28 | (52 | )% | 4 | % | nm | nm | |||||||||||||||
| Income attributable to non-controlling interests |
(50 | ) | (43 | ) | (8 | )% | (6 | )% | nm | nm | ||||||||||||||
|
|
|
|
|
|
|
|
|
|
|
|
|
|||||||||||||
| Net loss attributable to SunGard |
$ | (390 | ) | $ | (15 | ) | nm | nm | nm | nm | ||||||||||||||
|
|
|
|
|
|
|
|
|
|
|
|
|
|||||||||||||
| Other Financial Information |
||||||||||||||||||||||||
| Adjusted EBITDA(1) |
$ | 145 | $ | 175 | 22 | % | 26 | % | 21 | % | 20 | % | ||||||||||||
|
|
|
|
|
|
|
|
|
|
|
|
|
|||||||||||||
Note: Columns may not total due to rounding.
“nm” = not meaningful
| (1) | Adjusted EBITDA is a non-GAAP financial measure we use to evaluate our performance and our reportable segments. Please refer to “Non-GAAP Financial Measures” for more information and a reconciliation to Net Income. |
Revenue
For the first quarter of 2015, consolidated revenue grew 6% year-over-year on a constant currency basis to $671 million. Our revenue growth was largely due to market reception of our new technology, continued growth in the emerging markets, and growth in Services revenue. For each of the quarters ended March 31, 2015 and 2014, the mix of our revenue was similar, with Software representing 38% of total revenue, SaaS and cloud revenue representing 41% of total revenue, and Services revenue representing 21% of total revenue. Key drivers in our revenue categories are as follows:
| • | Software revenue grew 5% at constant currency in the current-year quarter from strong license sales of our latest technology to both new and existing customers. Software license revenue increased 32% on a constant-currency basis from the prior-year quarter. |
50
Table of Contents
| • | SaaS and cloud revenue also grew 5% at constant currency in the current-year quarter primarily driven by increased volumes in our SaaS offerings and greater adoption of our cloud offerings, delivered from our private cloud. |
| • | Services revenue increased approximately 9% at constant currency in the current-year quarter primarily due to growth in professional services as customers increased their spending to implement our solutions and integrate them into their operating environments. |
Cost of Sales and Direct Operating
Cost of sales and direct operating expense was 40% and 41% of total revenue in the quarters ended March 31, 2015 and 2014, respectively. Cost of sales and direct operating expense increased $9 million, or 3%, at constant currency primarily due to an increase in expenses associated with customer trading activity in our broker/dealer business and a $3 million increase in employment-related costs partly due to the increase in professional services revenue, partially offset by $5 million of currency transaction gains.
Sales, Marketing and Administration
Sales, marketing and administration expense was 23% and 26% of total revenue in the quarters ended March 31, 2015 and 2014, respectively. Sales, marketing and administration expense decreased $10 million, or 6%, at constant currency primarily due to approximately $10 million of one-time, strategic initiative expenses related to the AS Split-Off in the first quarter of 2014 and a $1 million decrease in severance and facilities restructuring expenses, partially offset by a $5 million increase in medical expenses.
Product Development and Maintenance
Product development and maintenance expense was 13% and 15% of total revenue in the quarters ended March 31, 2015 and 2014, respectively. Product development and maintenance expense decreased $7 million, or 7%, at constant currency primarily due to a $4 million decrease in employment-related expenses and a $2 million increase in capitalized software related to our technology investments.
Depreciation
Depreciation expense was 4% of total revenue in each of the quarters ended March 31, 2015 and 2014. Depreciation expense increased 21% at constant currency in the current-year quarter primarily due to increased capitalization of software assets in the past year.
Amortization of Acquisition-Related Intangible Assets
Amortization of acquisition-related intangible assets was 3% and 7% of total revenue in the quarters ended March 31, 2015 and 2014, respectively. Amortization of acquisition-related intangible assets decreased 49% at constant currency primarily due to the continued runoff of certain acquisition-related intangible assets primarily stemming from the LBO transaction in 2005.
Trade Name Impairment
As a result of the AS Split-Off, we recognized a $339 million impairment of the carrying value of the SunGard trade name as of March 31, 2014. For further information, refer to “Goodwill and Trade Name Impairment Tests” included in “Use of Estimates and Critical Accounting Policies” elsewhere in this prospectus. There was no trade name impairment in the quarter ended March 31, 2015.
51
Table of Contents
Operating Income
Operating income increased $115 million in the quarter ended March 31, 2015 from an operating loss of $289 million in the prior-year quarter. Operating income was impacted by the items discussed above. Our operating margin increased by 60.5% primarily due to the 51.9% margin impact of the trade name impairment charge, the 3.4% margin impact of the decrease in amortization of acquisition-related intangible assets, and the 1.5% margin impact of the decrease in strategic initiative expenses.
Adjusted EBITDA
Adjusted EBITDA for the quarter ended March 31, 2015 was $175 million, an increase of 20% from the prior-year quarter on a constant-currency basis. Our Adjusted EBITDA margin increased 3.1% on a constant-currency basis, driven primarily by the strength of our Software and SaaS sales, improved professional services profitability, decreases in employee-related product development spending, and lower bad debt expense from the sale of a customer bankruptcy claim, partially offset by increased medical expenses.
Interest expense and amortization of deferred financing fees
Interest expense was $71 million and $74 million in the quarters ended March 31, 2015 and 2014, respectively. The decrease was primarily due to the write-off of deferred financing costs during the prior-year quarter resulting from the repayment and retirement of debt resulting from the AS Split-Off, and from non-capitalizable fees paid in connection with the February 2014 amendment of the Credit Agreement.
Loss on extinguishment of debt
Loss on extinguishment of debt was $61 million for the quarter ended March 31, 2014. The loss on extinguishment of debt in the prior-year quarter includes (i) a $36 million loss associated with the exchange of approximately $425 million of senior notes issued by Sungard Availability Services, Inc. (“SpinCo”) (“SpinCo Notes”) for approximately $389 million of senior notes due 2018 issued by SunGard (“SunGard Notes”) in connection with the AS Split-Off and (ii) the write-off of $25 million of deferred financing fees resulting from the early repayment of debt during the first quarter (see Note 1 of Notes to Condensed Consolidated Financial Statements).
Benefit from (provision for) income taxes
The effective income tax rates for each of the quarters ended March 31, 2015 and 2014 was 41% and 24%, respectively. The Company’s effective tax rate reflects changes in the mix of income or losses in jurisdictions with a wide range of tax rates, permanent differences between GAAP and local tax laws, the impact of valuation allowances, unrecognized tax benefits and the timing of recording discrete items. The tax rate for the quarter ended March 31, 2015 reflects an increase in the expected full year effective tax rate due primarily to a change in the mix of income by country and the inability to utilize net operating losses generated in certain countries. Further changes in the mix of income, losses in particular jurisdictions or the total amount of income for 2015 may significantly impact the estimated effective income tax rate for the year.
The tax rate for the quarter ended March 31, 2014 includes a benefit of $138 million recorded as a discrete item related to the impairment of the trade name, an expense of $46 million recorded as a discrete item due to changes in certain state deferred tax rates, primarily driven by the change in the legal entity ownership of the trade name caused by the AS Split-Off, and an expense of $9 million recorded as a discrete item to increase the valuation allowance on state net operating losses driven by the change in management’s judgment of their realizability due to the AS Split-Off.
52
Table of Contents
Income (loss) from discontinued operations, net of tax
Loss from discontinued operations, net of tax, was $(17) million in the quarter ended March 31, 2014. On March 31, 2014, we completed the AS Split-Off. Income (loss) from discontinued operations reflects the results of our AS business and two smaller FS subsidiaries that were sold in January 2014. Included in loss from discontinued operations in the quarter ended March 31, 2014 is a gain on the sale of two FS businesses of approximately $23 million. Also included in loss from discontinued operations in the quarter ended March 31, 2014 is sponsor management fee expense of approximately $15 million payable under the Management Agreement for services related to the issuance of the $1.025 billion AS term loan and $425 million of SpinCo Notes in connection with the AS Split-Off.
Income attributable to the non-controlling interest
Accrued dividends on SCCII’s cumulative preferred stock were $43 million and $50 million in the quarters ended March 31, 2015 and 2014, respectively. The decrease in accrued dividends is due to the decrease in outstanding preferred shares resulting from the share exchange as part of the AS Split-Off, partially offset by compounding of the cumulative, undeclared dividend.
Segment Results of Operations
Our business is organized into two segments, FS and PS&E. Corporate spending, which includes the costs of various support functions such as corporate finance, human resources, and legal, are not allocated to our reporting segments. As reflected below, we measure our financial performance using Adjusted EBITDA, which is a non-GAAP financial measure. We believe Adjusted EBITDA is an effective tool to measure our operating performance since it excludes non-cash items and certain variable charges. We use Adjusted EBITDA extensively to measure our financial performance, and also to report our results to our board of directors. Please refer to “Non-GAAP Financial Measures” for more information and a reconciliation to the nearest comparable GAAP financial measure.
Financials Systems Segment
| Year–over- Year Change |
||||||||||||||||
| Three Months Ended March 31, | Reported | Constant Currency |
||||||||||||||
| 2014 | 2015 | |||||||||||||||
| (dollars in millions) | ||||||||||||||||
| Software |
$ | 217 | $ | 218 | 1 | % | 5 | % | ||||||||
| SaaS and cloud |
259 | 268 | 4 | % | 5 | % | ||||||||||
| Services |
124 | 131 | 5 | % | 10 | % | ||||||||||
|
|
|
|
|
|||||||||||||
| FS Revenue |
$ | 600 | $ | 617 | 3 | % | 6 | % | ||||||||
|
|
|
|
|
|||||||||||||
| FS Adjusted EBITDA |
$ | 139 | $ | 174 | 25 | % | 25 | % | ||||||||
| FS Adjusted EBITDA margin |
23.2 | % | 28.1 | % | 4.9 | % | 4.0 | % | ||||||||
Revenue
In the first quarter of 2015, FS revenue grew 6% at constant currency driven by growth in Software, SaaS and cloud, and Services revenue. These results reflect the customer reception of our new technology offerings, continued growth in the emerging markets, and growth in the array of services that surround and support our software. In the first quarter of 2015 and 2014, Software revenue was 35% and 36%, respectively, SaaS and cloud revenue was 44% and 43%, respectively, and Services revenue was 21% of FS revenue.
FS Software revenue increased 5% at constant currency in the first quarter of 2015 from the prior-year period. Software revenue grew as a result of strong license sales of our latest technology to both new and existing
53
Table of Contents
customers. Reported software license fee revenue was $42 million, a $9 million, or 27% increase, from the prior-year period. Software license revenue increased 36% on a constant-currency basis.
FS SaaS and cloud revenue increased approximately 5% at constant currency in the first quarter of 2015 from the prior-year period. This growth was driven by increased volumes in our SaaS offerings and greater adoption of our cloud offerings, delivered from our private cloud.
FS Services revenue increased approximately 10% at constant currency in the first quarter of 2015 from the prior-year period primarily due to growth in professional services tied to our new technology offerings and increasing global reach, as customers increased their spending to implement our solutions and integrate them into their operating environments.
Revenue from emerging markets, comprised of China, India, Southeast Asia, the Middle East, Africa, Latin America and Eastern Europe, increased 20% in the first quarter of 2015 over the prior-year period, driven by strong sales of our technology. Revenue in established markets, comprised of the US, Western Europe, Japan and Australia, increased approximately 5% in the first quarter of 2015 over the prior-year period.
Adjusted EBITDA
FS Adjusted EBITDA was $174 million in the first quarter of 2015, an increase of 25% from the prior-year period. On a constant currency basis, FS adjusted EBITDA also increased 25% in the quarter. The FS Adjusted EBITDA margin was 28.1% and 23.2% for the first quarter of 2015 and 2014, respectively.
The FS Adjusted EBITDA margin increase was driven by the strength of our software and SaaS sales, improved professional services profitability, a $5 million decrease in employment-related, product development spending, and lower bad debt expense from the sale of a customer bankruptcy claim.
Public Sector & Education Segment
|
|
Year-over- Year Change |
|||||||||||||||
| Three Months Ended March 31, | Reported | Constant Currency |
||||||||||||||
| 2014 | 2015 | |||||||||||||||
| (dollars in millions) | ||||||||||||||||
| Software |
$ | 34 | $ | 34 | (1 | )% | (1 | )% | ||||||||
| SaaS and cloud |
9 | 9 | 4 | % | 4 | % | ||||||||||
| Services |
10 | 11 | 4 | % | 4 | % | ||||||||||
|
|
|
|
|
|||||||||||||
| PS&E Revenue |
$ | 53 | $ | 54 | 1 | % | 1 | % | ||||||||
|
|
|
|
|
|||||||||||||
| PS&E Adjusted EBITDA |
$ | 16 | $ | 16 | (1 | )% | (1 | )% | ||||||||
| PS&E Adjusted EBITDA margin |
30.1 | % | 29.5 | % | (0.6 | )% | (0.6 | )% | ||||||||
Revenue
In the first quarter of 2015, total PS&E revenue grew 1% principally driven by growth in professional services and accompanied by increases in PS&E SaaS and cloud revenues. During the first quarters of 2015 and 2014, PS&E Software revenue comprised 62% and 64%, respectively, PS&E SaaS and cloud revenue was approximately 18% and 17%, respectively, and PS&E Services revenue was approximately 20% and 19%, respectively, of total PS&E revenue.
PS&E Software revenue decreased 1% primarily due to a decrease of approximately $0.5 million of software license fees, partially offset by annual software maintenance increases. PS&E SaaS and cloud revenue increased 4% primarily due to add-on cloud services to the existing customer base. PS&E Services revenue
54
Table of Contents
increased 4% due to continuing to deliver the contracted backlog resulting from new software license sales and product upgrades from 2013 and 2014 which generate related implementation and integration services. There is no business processing services revenue in this segment.
Adjusted EBITDA
In the first quarter of 2015, PS&E Adjusted EBITDA of $16 million was flat to the prior-year quarter. The PS&E Adjusted EBITDA margin declined by 0.6% during current-year quarter to 29.5% driven by higher professional services revenue and higher costs associated with the delivery of our professional services.
Corporate
Corporate spending, as measured on an adjusted EBITDA basis, increased by approximately $5 million to $15 million during the first quarter of 2015 mainly due to higher employee costs resulting from increased medical expenses.
Year Ended December 31, 2014 Compared to Year Ended December 31, 2013
Consolidated Results of Operations
| Year Ended December 31, | Year–over-Year Change | |||||||||||||||||||||||
| % of Revenue | As | At Constant | ||||||||||||||||||||||
| (dollars in millions) | 2013 | 2014 | 2013 | 2014 | Reported | Currency | ||||||||||||||||||
| Revenue |
$ | 2,761 | $ | 2,809 | 100 | % | 100 | % | 2 | % | 2 | % | ||||||||||||
| Costs and expenses: |
||||||||||||||||||||||||
| Cost of sales and direct operating |
1,045 | 1,098 | 38 | % | 39 | % | 5 | % | 5 | % | ||||||||||||||
| Sales, marketing and administration |
634 | 667 | 23 | % | 24 | % | 5 | % | 5 | % | ||||||||||||||
| Product development and maintenance |
392 | 376 | 14 | % | 13 | % | (4 | )% | (4 | )% | ||||||||||||||
| Depreciation |
104 | 107 | 4 | % | 4 | % | 3 | % | 3 | % | ||||||||||||||
| Amortization of acquisition-related intangible assets |
182 | 136 | 7 | % | 5 | % | (25 | )% | (25 | )% | ||||||||||||||
| Trade name impairment |
— | 339 | 0 | % | 12 | % | nm | nm | ||||||||||||||||
|
|
|
|
|
|
|
|
|
|
|
|
|
|||||||||||||
| Total costs and expenses |
2,357 | 2,723 | 85 | % | 97 | % | 16 | % | 16 | % | ||||||||||||||
|
|
|
|
|
|
|
|
|
|
|
|
|
|||||||||||||
| Operating income |
404 | 86 | 15 | % | 3 | % | (79 | )% | (78 | )% | ||||||||||||||
|
|
|
|
|
|
|
|
|
|
|
|
|
|||||||||||||
| Operating income margin |
15 | % | 3 | % | (11.6 | )% | (11.5 | )% | ||||||||||||||||
| Other income (expense): |
||||||||||||||||||||||||
| Interest income |
1 | 1 | 0 | % | 0 | % | 0 | % | 0 | % | ||||||||||||||
| Interest expense and amortization of deferred financing fees |
(326 | ) | (291 | ) | (12 | )% | (10 | )% | 11 | % | 11 | % | ||||||||||||
| Loss on extinguishment of debt |
(6 | ) | (61 | ) | (0 | )% | (2 | )% | nm | nm | ||||||||||||||
| Other income (expense) |
(2 | ) | — | (0 | )% | 0 | % | nm | nm | |||||||||||||||
|
|
|
|
|
|
|
|
|
|
|
|
|
|||||||||||||
| Other income (expense) |
(333 | ) | (351 | ) | (12 | )% | (12 | )% | (5 | )% | (6 | )% | ||||||||||||
|
|
|
|
|
|
|
|
|
|
|
|
|
|||||||||||||
| Income (loss) from continuing operations before income taxes |
71 | (265 | ) | 3 | % | (9 | )% | nm | nm | |||||||||||||||
| Benefit from (provision for) income taxes |
(26 | ) | 57 | (1 | )% | 2 | % | nm | nm | |||||||||||||||
|
|
|
|
|
|
|
|
|
|
|
|
|
|||||||||||||
| Income (loss) from continuing operations |
45 | (208 | ) | 2 | % | (7 | )% | nm | nm | |||||||||||||||
| Income (loss) from discontinued operations, net of tax |
17 | (14 | ) | 1 | % | (1 | )% | nm | nm | |||||||||||||||
|
|
|
|
|
|
|
|
|
|
|
|
|
|||||||||||||
| Net income (loss) |
62 | (222 | ) | 2 | % | (8 | )% | nm | nm | |||||||||||||||
| Income attributable to non-controlling interests |
(169 | ) | (174 | ) | (6 | )% | (6 | )% | nm | nm | ||||||||||||||
|
|
|
|
|
|
|
|
|
|
|
|
|
|||||||||||||
| Net loss attributable to SunGard |
$ | (107 | ) | $ | (396 | ) | nm | nm | nm | nm | ||||||||||||||
|
|
|
|
|
|
|
|
|
|
|
|
|
|||||||||||||
| Other Financial Information |
||||||||||||||||||||||||
| Adjusted EBITDA |
$ | 766 | $ | 765 | 27.7 | % | 27.2 | % | 0 | % | 0 | % | ||||||||||||
|
|
|
|
|
|
|
|
|
|
|
|
|
|||||||||||||
Note: Columns may not total due to rounding
“nm” = not meaningful
55
Table of Contents
Revenue
For the year ended December 31, 2014, total revenue grew 2% on a constant currency basis to $2.8 billion. Our revenue growth was largely due to sales of our new technology, continued growth in the emerging markets, and growth in our Services revenue. In 2014 and 2013, Software revenue was approximately 40% and 41%, respectively, of total revenue, SaaS and cloud revenue was approximately 38% of total revenue in both years, and Services revenue was approximately 22% and 21%, respectively, of total revenue. Key drivers in our revenue categories are as follows:
| • | Software revenue was flat on a year-over-year basis driven by a 3% growth at constant currency of our software license revenue from strong customer acceptance of our latest technology, largely offset by reductions in certain legacy products, particularly in the established markets. Software revenue growth in emerging markets accelerated in the second half of 2014, driven by stronger maintenance revenue growth and the addition of a number of new customers. |
| • | SaaS and cloud revenue grew 2% at constant currency year-over-year primarily driven by increased volumes in our SaaS offerings and greater adoption of our cloud offerings, delivered from our private cloud. The 2014 SaaS and cloud revenue year-over-year growth rate was negatively impacted by approximately 1% due to the sale of a $12 million customer bankruptcy claim in the third quarter of 2013. |
| • | Services revenue increased approximately 4% at constant currency year-over-year primarily due to growth in professional services as customers increased spending to implement our software and integrate it into their operating environments. |
Cost of Sales and Direct Operating
Cost of sales and direct operating expense was 39% and 38% of total revenue in 2014 and 2013, respectively. Cost of sales and direct operating expense increased $53 million, or 5%, at constant currency primarily due to the investments in increased delivery capacity to support our SaaS and cloud offerings and skilled resources to support our professional services growth.
Sales, Marketing and Administration
Sales, marketing and administration expense was 24% and 23% of total revenue in 2014 and 2013, respectively. Sales, marketing and administration expense increased $32 million, or 5%, at constant currency primarily due to a $12 million increase in spending primarily related to one-time expenses associated with the AS Split-Off, as well as from continued investments in sales resources.
Product Development and Maintenance
Product development and maintenance expense was 13% and 14% of total revenue in 2014 and 2013, respectively. Product development and maintenance expense decreased $15 million, or 4%, at constant currency primarily due to an $18 million increase in capitalized software related to our new technology investments.
Depreciation
Depreciation expense was 4% of total revenue in both 2014 and 2013. Depreciation expense increased 3% at constant currency primarily due to increased capitalization of software assets in the past year.
Amortization of Acquisition-Related Intangible Assets
Amortization of acquisition-related intangible assets was 5% and 7% of total revenue in 2014 and 2013, respectively. Amortization of acquisition-related intangible assets decreased 25% at constant currency due to the continued runoff of certain acquisition-related intangible assets primarily stemming from the LBO transaction in 2005.
56
Table of Contents
Trade Name Impairment
As a result of the AS Split-Off, we recognized a $339 million impairment of the carrying value of the SunGard trade name as of March 31, 2014. There was no trade name impairment during 2013. For further information, refer to “Goodwill and Trade Name Impairment Tests” included in “Use of Estimates and Critical Accounting Policies” elsewhere in this prospectus.
Operating Income
Operating income decreased 78% at constant currency to $87 million in 2014. Operating income was impacted by the items discussed above. Our operating margin decreased by 11.5% primarily due to a 12.0% margin reduction resulting from the $339 million trade name impairment charge, and a 0.4% margin reduction resulting from the $12 million increase in one-time expenses related to the AS Split-Off, partially offset by a 1.6% margin increase due to the runoff of certain acquisition-related intangible assets.
Adjusted EBITDA
Adjusted EBITDA for 2014 was $765 million, down $1 million from 2013. Our Adjusted EBITDA margin decreased 0.5% to 27.2% year-over-year. On a constant-currency basis, our Adjusted EBITDA margin decreased 0.4%, driven primarily by continued investments in sales resources, increased delivery capacity to support our SaaS and cloud offerings and skilled resources to support our professional services growth. Also impacting the year–to-year decline in Adjusted EBITDA margin for 2014 was the one-time gain associated with the sale of a customer bankruptcy claim in 2013.
Interest expense and amortization of deferred financing fees
Our interest expense was $291 million and $326 million for 2014 and 2013, respectively. The $35 million decrease in interest expense was due primarily to (i) approximately $10 million of non-capitalizable debt issuance expenses incurred in 2013 associated with the March 2013 refinancing of our senior secured credit facility, and (ii) lower interest expense in 2014 resulting from the repayment of debt in 2013 and the first quarter of 2014 prior to the Split-Off of Availability Services. Interest expense associated with the debt that was repaid or retired on March 31, 2014 in connection with the AS Split-Off is included in “Income (loss) from discontinued operations, net of tax” in the accompanying consolidated financial statements for all periods presented.
Loss on extinguishment of debt
Loss on extinguishment of debt was $61 million and $6 million for 2014 and 2013, respectively. The loss on extinguishment of debt in 2014 includes (i) a $36 million loss associated with the exchange of approximately $425 million of senior notes issued by Sungard Availability Services, Inc. (“SpinCo”) (“SpinCo Notes”) for approximately $389 million of senior notes due 2018 issued by SunGard Data Systems, Inc. (“SunGard Notes”) in connection with the AS Split-Off and (ii) the write-off of $25 million of deferred financing fees resulting from the repayment or retirement of debt during the first quarter. See Notes 1 and 5 to our consolidated financial statements included elsewhere in this prospectus. Loss on extinguishment of debt in 2013 primarily includes the write-off of deferred financing fees associated with the March 2013 refinancing of $2.2 billion of term loans.
Benefit from (provision for) income taxes
The effective income tax rates for 2014 and 2013 were a benefit of 22% and a provision of 36%, respectively. Our effective tax rate fluctuates from period to period due to changes in the mix of income or losses in jurisdictions with a wide range of tax rates, permanent differences between U.S. GAAP and local tax laws, certain one-time items including tax rate changes, and adjustments related to the repatriation of earnings from foreign subsidiaries, net of a U.S. foreign tax credit. For 2014, the benefit for income taxes includes a benefit of $138 million related to the impairment of the SunGard trade name, an expense of $48 million due to changes in certain state deferred tax
57
Table of Contents
rates, which are primarily driven by the change in the legal entity ownership of the SunGard trade name caused by the AS Split-Off, and an expense of $7 million to increase the valuation allowance on state net operating losses driven primarily by the change in management’s judgment of their realizability due to the AS Split-Off. Also in the fourth quarter of 2014, after weighing the positive and negative evidence required, we recorded a valuation allowance of $3 million against certain losses generated in France. These losses were larger than anticipated and exceeded the scheduled reversal of deferred tax liabilities. The tax benefit of the French losses totals $24 million at December 31, 2014 and have an indefinite carryforward period. In evaluating the realizability of our deferred tax assets, we considered the scheduled reversal of deferred tax liabilities (including the impact of available carryback and carryforward periods), projected future taxable income, and for losses that do not have an indefinite carryforward period, tax planning strategies. The amount of the deferred tax asset considered realizable, however, could be reduced in the near term if estimates of future taxable income during the carryforward period are reduced or as the reversal of certain deferred tax liabilities continues.
Income (loss) from discontinued operations, net of tax
Income (loss) from discontinued operations, net of tax, was a loss of $(17) million in 2014 and was income of $17 million in 2013. On March 31, 2014, we completed the AS Split-Off. Income (loss) from discontinued operations reflects the results of our AS business and two smaller FS subsidiaries that were sold in January 2014. Included in loss from discontinued operations in 2014 is a gain on the sale of two FS businesses of approximately $22 million. Also included in loss from discontinued operations in 2014 is sponsor management fee expense of approximately $15 million payable under the Management Agreement for services related to the issuance of the $1.025 billion AS term loan and $425 million of SpinCo Notes in connection with the AS Split-Off.
Income attributable to the non-controlling interest
Accrued dividends on SCCII’s cumulative preferred stock totaled $174 million and $169 million for 2014 and 2013, respectively. The increase in accrued dividends is due to compounding of the cumulative, undeclared dividend, partially offset by the decrease in outstanding preferred shares resulting from the share exchange as part of the AS Split-Off. The preferred stock will be exchanged for shares of SunGard common stock as a result of this offering. See “Recapitalization.”
Segment Results of Operations
Financials Systems Segment
| Year-over-Year Change | ||||||||||||||||
| Year ended December 31, | Reported | Constant Currency |
||||||||||||||
| 2013 | 2014 | |||||||||||||||
| (dollars in millions) | ||||||||||||||||
| Software |
$ | 987 | $ | 988 | 0 | % | 0 | % | ||||||||
| SaaS and cloud |
1,021 | 1,040 | 2 | % | 2 | % | ||||||||||
| Services |
543 | 564 | 4 | % | 4 | % | ||||||||||
|
|
|
|
|
|||||||||||||
| FS Revenue |
$ | 2,551 | $ | 2,592 | 2 | % | 2 | % | ||||||||
|
|
|
|
|
|||||||||||||
| FS Adjusted EBITDA |
$ | 746 | $ | 742 | (1 | )% | 0 | % | ||||||||
| FS Adjusted EBITDA margin |
29.2 | % | 28.6 | % | (0.6 | )% | (0.5 | )% | ||||||||
Revenue
In 2014, FS total revenue grew 2% at constant currency year-over-year driven by SaaS and cloud, and professional services. These results reflect the positive reception of our new technology offerings, particularly within our asset management, wealth management and treasury solutions, continued growth in the emerging markets, and growth in a broad array of services that surround and support our software. In 2014 and 2013, FS Software revenue was 38% and 39%, respectively, of FS total revenue, SaaS and cloud revenue was 40% of FS total revenue in each year and FS Services revenue was 22% and 21%, respectively, of FS total revenue.
58
Table of Contents
FS Software revenue was relatively unchanged on a constant currency basis in 2014. FS Software revenue grew as a result of our new technology offerings which resulted in revenue growth in both new and existing customers, offset by reductions in certain legacy products.
FS SaaS and cloud revenue increased 2% at constant currency in 2014 from 2013. This growth was driven by increased volumes from our existing customers and increased adoption of our SaaS and cloud offerings by new customers delivered from our private cloud. The 2014 year-to-year growth was negatively impacted by approximately 1% due to the sale of a $12 million customer bankruptcy claim in the third quarter of 2013.
FS Services revenue increased approximately 4% at constant currency in 2014 from 2013 primarily due to broad-based growth in professional services tied to our new technology offerings and increasing global reach, as customers increased their spending to implement our software and integrate it into their operating environments.
FS total revenue from emerging markets, comprised of China, India, Southeast Asia, the Middle East, Africa, Latin America and Eastern Europe, increased 8% at constant currency in 2014 driven by strong sales of our technology. FS revenue in established markets, comprised of the United States, Western Europe, Japan and Australia, increased approximately 1% at constant currency in 2014 over 2013.
Adjusted EBITDA
The FS Adjusted EBITDA margin of 28.6% in 2014 decreased by 0.5% at constant currency from 2013 driven by continued investments in sales resources, increased delivery capacity to support our SaaS and cloud offerings and skilled resources to support our professional services growth. Also impacting the year-to-year margin decline was the one-time gain associated with the sale of a customer bankruptcy claim in 2013 as discussed above.
Public Sector & Education Segment
| Year-over-Year Change | ||||||||||||||||
| Year Ended December 31, | Reported | Constant Currency |
||||||||||||||
| 2013 | 2014 | |||||||||||||||
| (dollars in millions) | ||||||||||||||||
| Software |
$ | 137 | $ | 138 | 1 | % | 1 | % | ||||||||
| SaaS and cloud |
36 | 37 | 6 | % | 6 | % | ||||||||||
| Services |
37 | 42 | 12 | % | 12 | % | ||||||||||
|
|
|
|
|
|||||||||||||
| PS&E Revenue |
$ | 210 | $ | 217 | 4 | % | 4 | % | ||||||||
|
|
|
|
|
|||||||||||||
| PS&E Adjusted EBITDA |
$ | 66 | $ | 68 | 2 | % | 2 | % | ||||||||
| PS&E Adjusted EBITDA margin |
31.6 | % | 31.1 | % | (0.5 | )% | (0.5 | )% | ||||||||
Revenue
In 2014, PS&E total revenue grew 4% year-over-year principally driven by growth in Services revenue and accompanied by more modest increases in Software, and SaaS and cloud revenues. In 2014 and 2013, Software revenue represented 64% and 65%, respectively, of total PS&E revenue, SaaS and cloud revenue was 17% of total PS&E revenue in each year, and Services revenue was 19% and 18%, respectively, of total PS&E revenue.
PS&E Software revenue increased 1% primarily due to annual price increases in our software maintenance arrangements, sales to new customers and add-on sales to existing customers. PS&E SaaS and cloud revenue increased 6% year-over-year primarily due to the full year impact from new sales in 2013, add-on cloud services to existing customers and annual price increases. PS&E Services revenue increased 12% year-over-year due to new software license sales and product upgrades which generated related implementation and integration services.
59
Table of Contents
Adjusted EBITDA
PS&E Adjusted EBITDA was $68 million, an increase of 2% from 2013. On a constant currency basis, PS&E Adjusted EBITDA also increased 2% in 2014. The PS&E Adjusted EBITDA margin was 31.1% and 31.6% for 2014 and 2013, respectively. The 0.5% margin decrease was driven by investments in services and development resources to accelerate customer delivery and drive future revenue growth, partially offset by increased capitalization of software development costs.
Corporate
Corporate spending, as measured on an adjusted EBITDA basis, decreased by approximately $1 million year-over-year to $45 million in 2014 mainly due to lower employee costs and reduced external services expenses. Corporate spending includes expenses for supporting functions such as corporate finance, human resources, and legal that are shared across our reporting segments.
Year Ended December 31, 2013 Compared to Year Ended December 31, 2012
Consolidated Results of Operations
| Year Ended December 31, | Year-over-Year Change | |||||||||||||||||||||||
| % of Revenue | ||||||||||||||||||||||||
| (dollars in millions) | 2012 | 2013 | 2012 | 2013 | As Reported | At Constant Currency |
||||||||||||||||||
| Revenue |
$ | 2,808 | $ | 2,761 | 100 | % | 100 | % | (2 | )% | (2 | )% | ||||||||||||
| Costs and expenses: |
||||||||||||||||||||||||
| Cost of sales and direct operating |
1,082 | 1,045 | 39 | % | 38 | % | (3 | )% | (3 | )% | ||||||||||||||
| Sales, marketing and administration |
643 | 634 | 23 | % | 23 | % | (1 | )% | (1 | )% | ||||||||||||||
| Product development and maintenance |
422 | 392 | 15 | % | 14 | % | (7 | )% | (7 | )% | ||||||||||||||
| Depreciation |
96 | 104 | 3 | % | 4 | % | 9 | % | 9 | % | ||||||||||||||
| Amortization of acquisition-related intangible assets |
217 | 182 | 8 | % | 7 | % | (17 | )% | (17 | )% | ||||||||||||||
| Trade name impairment |
— | — | 0 | % | 0 | % | 0 | % | 0 | % | ||||||||||||||
|
|
|
|
|
|
|
|
|
|
|
|
|
|||||||||||||
| Total costs and expenses |
2,460 | 2,357 | 88 | % | 85 | % | (4 | )% | (4 | )% | ||||||||||||||
|
|
|
|
|
|
|
|
|
|
|
|
|
|||||||||||||
| Operating income |
348 | 404 | 12 | % | 15 | % | 16 | % | 12 | % | ||||||||||||||
|
|
|
|
|
|
|
|
|
|
|
|
|
|||||||||||||
| Operating income margin |
12 | % | 15 | % | 2.3pts | 1.7pts | ||||||||||||||||||
| Other income (expense): |
||||||||||||||||||||||||
| Interest income |
1 | 1 | 0 | % | 0 | % | 0 | % | 0 | % | ||||||||||||||
| Interest expense and amortization of deferred financing fees |
(360 | ) | (326 | ) | (13 | )% | (12 | )% | 9 | % | 9 | % | ||||||||||||
| Loss on extinguishment of debt |
(82 | ) | (6 | ) | (3 | )% | (0 | )% | 93 | % | 93 | % | ||||||||||||
| Other income (expense) |
1 | (2 | ) | 0 | % | (0 | )% | (293 | )% | (281 | )% | |||||||||||||
|
|
|
|
|
|
|
|
|
|
|
|
|
|||||||||||||
| Other income (expense) |
(440 | ) | (333 | ) | (16 | )% | (12 | )% | 24 | % | 24 | % | ||||||||||||
|
|
|
|
|
|
|
|
|
|
|
|
|
|||||||||||||
| Income (loss) from continuing operations before income taxes |
(92 | ) | 71 | (3 | )% | 3 | % | 177 | % | 161 | % | |||||||||||||
| Benefit from (provision for) income taxes |
49 | (26 | ) | 2 | % | (1 | )% | (153 | )% | (153 | )% | |||||||||||||
|
|
|
|
|
|
|
|
|
|
|
|
|
|||||||||||||
| Income (loss) from continuing operations |
(43 | ) | 45 | (2 | )% | 2 | % | 204 | % | 169 | % | |||||||||||||
| Income (loss) from discontinued operations, net of tax |
(23 | ) | 17 | (1 | )% | 1 | % | 173 | % | 175 | % | |||||||||||||
|
|
|
|
|
|
|
|
|
|
|
|
|
|||||||||||||
| Net income (loss) |
(66 | ) | 62 | (2 | )% | 2 | % | 194 | % | 171 | % | |||||||||||||
| Income attributable to non-controlling interests |
(251 | ) | (169 | ) | (9 | )% | (6 | )% | nm | nm | ||||||||||||||
|
|
|
|
|
|
|
|
|
|
|
|
|
|||||||||||||
| Net loss attributable to SunGard |
$ | (317 | ) | $ | (107 | ) | nm | nm | nm | nm | ||||||||||||||
|
|
|
|
|
|
|
|
|
|
|
|
|
|||||||||||||
| Other Financial Information |
||||||||||||||||||||||||
| Adjusted EBITDA |
$ | 749 | $ | 766 | 26.7 | % | 27.7 | % | 2 | % | 0 | % | ||||||||||||
|
|
|
|
|
|
|
|
|
|
|
|
|
|||||||||||||
Note: Columns may not total due to rounding.
“nm” = not meaningful
60
Table of Contents
Revenue
For the year ended December 31, 2013, total revenue of $2.8 billion declined 2% on a constant currency basis from 2012. The revenue decline was largely due to customer attrition, including customer bankruptcies and mergers. In addition, SunGard exited certain lower-margin and legacy product lines as we refocused our product portfolio. Finally, a portion of the revenue reduction was due to lower professional services revenue, following completion of certain large projects in 2012. These decreases were partially offset by the impact of a one-time benefit associated with the sale of a $12 million customer bankruptcy claim in 2013.
In 2013 and 2012, Software revenue was 41% and 40%, respectively, of total revenue, SaaS and cloud revenue was 38% and 39%, respectively, of total revenue and Services revenue was 21% of total revenue in each year. Key drivers in our revenue categories are as follows:
| • | In 2013, our Software revenue increased over 2012 due to new license sales of certain products, particularly in the emerging markets. In addition, Software revenue benefitted from an acquisition in the fourth quarter of 2012. These increases in Software revenue were offset by reductions in certain legacy products. |
| • | SaaS and cloud revenue decreased approximately 3% at constant currency in 2013 from the prior year due primarily to customer attrition, some of which was the result of customer bankruptcies and mergers. The decreases in SaaS and cloud revenue were partially offset by the one-time benefit associated with the sale of a $12 million customer bankruptcy claim in 2013. |
| • | Services revenue decreased approximately 4% at constant currency in 2013 from the prior year due primarily to a reduction in professional services reflecting the completion of certain large projects in 2012, partially offset by the recognition of significant customer milestones in the fourth quarter of 2013. |
Cost of Sales and Direct Operating
Cost of sales and direct operating expense was 38% and 39% of total revenue in 2013 and 2012, respectively. Cost of sales and direct operating expense decreased $32 million in 2013, or 3%, at constant currency over 2012 primarily due to a decrease in lower margin services revenue and reductions in spending related to our cross-company cost savings initiatives.
Sales, Marketing and Administration
Sales, marketing and administration expense was 23% of total revenue in each of 2013 and 2012. Sales, marketing and administration expense decreased $5 million in 2013, or 1%, at constant currency over 2012 primarily due to a decrease in severance and facility closure costs and lower administrative spending, partially offset by continued investments in sales resources.
Product Development and Maintenance
Product development and maintenance expense was 14% and 15% of total revenue in 2013 and 2012, respectively. Product development and maintenance expense decreased $28 million in 2013, or 7%, at constant currency over 2012 primarily due to a shift in spending from certain slower growing products to new technologies, which resulted in an increase in capitalized software development.
Depreciation
Depreciation expense was 4% and 3% of total revenue in 2013 and 2012, respectively. Depreciation expense increased 9% at constant currency year-over-year primarily due to increased capitalization of software assets in the past year.
61
Table of Contents
Amortization of Acquisition-Related Intangible Assets
Amortization of acquisition-related intangible assets was 7% and 8% of total revenue in 2013 and 2012, respectively. Amortization of acquisition-related intangible assets decreased 17% at constant currency year-over-year due to the continued runoff of certain acquisition-related intangible assets primarily stemming from the LBO transaction in 2005.
Operating Income
Operating income increased 12% at constant currency year-over-year to $404 million in 2013. Operating income was impacted by the items discussed above. Our operating income margin increased by 1.7% year-over-year primarily due to the 1.3% margin improvement in 2013 from the decrease in amortization of acquisition-related intangible assets, a 0.9% margin increase in 2013 from the $25 million decrease in severance and facility closure costs, and a 1.1% margin increase in 2013 due to a shift in spending from certain slower growing products to new technologies, which resulted in an increase in capitalized software development, partially offset by a 0.6% margin decrease in 2013 from the combined $16 million increase in depreciation due to increases in capitalized software and stock compensation expense.
Adjusted EBITDA
Adjusted EBITDA for 2013 of $766 million was flat on a constant currency basis to 2012. Our Adjusted EBITDA margin increased by 0.5% at constant currency to 27.7% in 2013 from the prior year driven primarily by improvements in our administrative and development spending related to initiatives to exit certain slower growing products and shift our investments to new technologies. This shift also led to an increase in capitalized software, further reducing in period development spending.
Interest expense and amortization of deferred financing fees
During 2012 and 2013, we refinanced approximately $3.2 billion of debt, taking advantage of the attractive debt markets, and repaid certain higher-cost senior notes. As a result, interest expense decreased to $326 million in 2013 from $360 million in 2012.
Loss on extinguishment of debt
The refinancing and repayments of debt described above resulted in a loss on extinguishment of debt of $6 million in 2013 and $82 million in 2012. The loss on extinguishment of debt in 2013 includes the loss related to the March 2013 refinancing of $2.2 billion of term loans. The loss on extinguishment of debt in 2012 is driven by the early extinguishment of our senior notes due 2015, our senior subordinated notes due 2015 and the partial repayment of term loans in January and December 2012.
Benefit from (provision for) income taxes
The effective income tax rates for 2013 and 2012 were a provision of 36% and a benefit of 53%, respectively. Our effective tax rate fluctuates from period to period due to changes in the mix of income or losses in jurisdictions with a wide range of tax rates, permanent differences between U.S. GAAP and local tax laws, certain one-time items including tax rate changes, and adjustments related to the repatriation of earnings of foreign subsidiaries, net of a U.S. foreign tax credit.
Income (loss) from discontinued operations, net of tax
Income (loss) from discontinued operations, net of tax, was $17 million in 2013 and $(23) million in 2012. On March 31, 2014, we completed the AS Split-Off. During 2012, we sold our Higher Education business (“HE”) and an FS subsidiary. Also during 2012, we recorded a combined gain on the sales of two businesses of $571 million and a goodwill impairment charge of $385 million. See Note 3 to our consolidated financial statements included elsewhere in this prospectus.
62
Table of Contents
Income attributable to the non-controlling interest
Income (loss) attributable to the non-controlling interest represents accrued dividends on SCCII’s cumulative preferred stock. The amount of accrued dividends was $169 million and $251 million in 2013 and 2012, respectively. The decrease in accrued dividends is due to the declaration and payment of a $718 dividend in December 2012, partially offset by compounding.
Segment Results of Operations
Financials Systems Segment
| Year-over-Year Change | ||||||||||||||||
| Year Ended December 31, | Reported | Constant Currency |
||||||||||||||
| (dollars in millions) | 2012 | 2013 | ||||||||||||||
| Software |
$ | 982 | $ | 987 | 1 | % | 0 | % | ||||||||
| SaaS and cloud |
1,051 | 1,021 | (3 | )% | (3 | )% | ||||||||||
| Services |
571 | 543 | (5 | )% | (5 | )% | ||||||||||
|
|
|
|
|
|||||||||||||
| FS Revenue |
$ | 2,604 | $ | 2,551 | (2 | )% | (2 | )% | ||||||||
|
|
|
|
|
|||||||||||||
| FS Adjusted EBITDA |
$ | 727 | $ | 746 | 3 | % | 1 | % | ||||||||
| FS Adjusted EBITDA margin |
27.9 | % | 29.2 | % | 1.3 | % | 0.8 | % | ||||||||
Revenue
In 2013, FS total revenue declined 2% from 2012 due to customer attrition, including customer bankruptcies and mergers. In addition, we exited certain lower-margin or legacy product lines as we refocused our product portfolio. Finally, a portion of the revenue reduction was due to lower professional services revenue, following completion of certain large projects in 2012. These decreases were partially offset by the impact of a one-time benefit associated with the sale of a $12 million customer bankruptcy claim in 2013. In 2013 and 2012, FS Software revenue was approximately 39% and 38%, respectively, of FS total revenue, FS SaaS and cloud revenue was approximately 40% of FS total revenue in each year and FS Services revenue was approximately 21% and 22%, respectively, of FS total revenue.
FS Software revenue was relatively unchanged in 2013. In 2013, our software license revenue increased due to new license sales of certain products, particularly in the emerging markets. In addition, during 2013, FS Software revenue benefitted from an acquisition in the fourth quarter of 2012. These increases in FS Software revenue were offset by reductions in certain legacy products.
FS SaaS and cloud revenue decreased approximately 3% in 2013 from the prior year primarily due to customer attrition, some of which was the result of customer bankruptcies and mergers. The decreases in FS SaaS and cloud revenue were partially offset by the sale of a $12 million customer bankruptcy claim in 2013.
FS Services revenue decreased approximately 5% in 2013 from the prior year due primarily to a reduction in professional services reflecting the completion of certain large customer projects in 2012, partially offset by achieving significant customer milestones in the fourth quarter of 2013.
Revenue from emerging markets, comprised of China, India, Southeast Asia, the Middle East, Africa, Latin America and Eastern Europe, increased 8% in 2013 over 2012, driven by strong sales of our technology. Revenue in established markets, comprised of the US, Western Europe, Japan and Australia, decreased approximately 3% in 2013 over 2012.
63
Table of Contents
Adjusted EBITDA
FS Adjusted EBITDA of $746 million in 2013 increased by 1% at constant currency from the prior year. FS Adjusted EBITDA margin increased by 0.8% at constant currency to 29.2% in 2013 from the prior year. The margin expansion in 2013 was primarily due to the impact of various cost saving and productivity initiatives implemented during 2012 and 2013, and from improvements in our development initiatives by exiting certain slower growing products or markets and shifting our investments to address the faster growing products. This also resulted in increased capitalized software, further reducing in-period development expense.
Public Sector and Education Segment
| Year-over-Year Change | ||||||||||||||||
| Year Ended December 31, | Reported | Constant Currency |
||||||||||||||
| (dollars in millions) | 2012 | 2013 | ||||||||||||||
| Software |
$ | 135 | $ | 137 | 1 | % | 1 | % | ||||||||
| SaaS and cloud |
33 | 36 | 7 | % | 7 | % | ||||||||||
| Services |
36 | 37 | 4 | % | 4 | % | ||||||||||
|
|
|
|
|
|||||||||||||
| PS&E Revenue |
$ | 204 | $ | 210 | 3 | % | 3 | % | ||||||||
|
|
|
|
|
|||||||||||||
| PS&E Adjusted EBITDA |
$ | 66 | $ | 66 | 0 | % | 0 | % | ||||||||
| PS&E Adjusted EBITDA margin |
32.5 | % | 31.6 | % | (0.9 | )% | (0.9 | )% | ||||||||
Revenue
PS&E revenue grew 3% in 2013 from 2012 reflecting an increase in sales of our Public Sector solutions. In 2013 and 2012, PS&E Software revenue was approximately 65% and 66%, respectively, of total PS&E revenue, PS&E SaaS and cloud revenue was approximately 17% and 16%, respectively, of total PS&E revenue and PS&E Services revenue was approximately 18% of total PS&E revenue in each year.
Demand for our solutions drove a 1% increase in Software revenue, a 7% increase in PS&E SaaS and cloud revenue and a 4% increase in PS&E Services revenue in 2013.
Adjusted EBITDA
PS&E Adjusted EBITDA was $66 million in 2013, unchanged from the prior year. PS&E Adjusted EBITDA margin declined 0.9% from 2012 to 31.6% in 2013. The 0.9% margin reduction was driven by an increase in incentive compensation payments due to higher sales, and an increase in professional service personnel to reduce our backlog and accelerate customer start dates.
Corporate
Corporate spending, as measured on an adjusted EBITDA basis, increased by approximately $2 million to $46 million during 2013 primarily due to higher employee costs.
Non-GAAP Financial Measures
We evaluate our performance using both GAAP and non-GAAP financial measures. Non-GAAP measures are not based on any comprehensive set of accounting rules or principles and should not be considered a substitute for, or superior to, financial measures calculated in accordance with GAAP. In addition, SunGard’s non-GAAP measures may be different from non-GAAP measures used by other companies.
64
Table of Contents
Our primary non-GAAP measure is Adjusted EBITDA, whose corresponding GAAP measure is net income (loss). We define Adjusted EBITDA as net income (loss) less income (loss) from discontinued operations, income taxes, loss on extinguishment of debt, interest expense and amortization of deferred financing fees, depreciation (including the amortization of capitalized software), amortization of acquisition-related intangible assets, trade name and goodwill impairment charges, severance and facility closure charges, stock compensation expense, management fees from our Sponsors, and certain other non-recurring expenses.
We believe Adjusted EBITDA is an effective tool to measure our operating performance since it excludes non-cash items and certain variable charges that do not relate to business performance. We use Adjusted EBITDA extensively to measure our financial performance, and also to report our results to our board of directors. We use a similar measure, which we refer to as Covenant Compliance Adjusted EBITDA, for purposes of computing our debt covenants. See “—Liquidity and Capital Resources—Covenant Compliance.”
While Adjusted EBITDA and similar measures are frequently used as measures of operations and the ability to meet debt service requirements, these terms are not necessarily comparable to other similarly titled captions of other companies due to the potential inconsistencies in the method of calculation. Adjusted EBITDA does not reflect the impact of earnings or charges resulting from matters that we may consider not to be indicative of our ongoing operations. In particular, our definition of Adjusted EBITDA adds back certain noncash, extraordinary or unusual charges that are deducted in calculating net income (loss). However, these are expenses that may recur, vary greatly and are difficult to predict. Further, our debt instruments require that Adjusted EBITDA be calculated for the most recent four fiscal quarters. As a result, the measure as calculated under our debt instruments can be disproportionately affected by a particularly strong or weak quarter. Adjusted EBITDA may not be comparable to the measure for any subsequent four-quarter period or any complete fiscal year. Adjusted EBITDA should not be considered as an alternative to cash flows from operating activities, as a measure of liquidity or as an alternative to operating income or net income as indicators of operating performance.
The following table presents a reconciliation of Adjusted EBITDA, a non-GAAP measure, to net income (loss), which is the nearest comparable GAAP measure.
| Year Ended December 31, | Three Months Ended March 31, |
|||||||||||||||||||
| (dollars in millions) | 2012 | 2013 | 2014 | 2014 | 2015 | |||||||||||||||
| Net income (loss) |
$ | (66 | ) | $ | 62 | $ | (222 | ) | $ | (340 | ) | $ | 28 | |||||||
| Income (loss) from discontinued operations |
(23 | ) | 17 | (14 | ) | (17 | ) | 2 | ||||||||||||
| Benefit from (provision for ) income taxes |
49 | (26 | ) | 57 | 101 | (18 | ) | |||||||||||||
| Loss on extinguishment of debt(a) |
(82 | ) | (6 | ) | (61 | ) | (61 | ) | — | |||||||||||
| Interest expense and amortization of deferred financing fees |
(360 | ) | (326 | ) | (291 | ) | (74 | ) | (71 | ) | ||||||||||
| Other Income |
2 | (1 | ) | 1 | — | — | ||||||||||||||
|
|
|
|
|
|
|
|
|
|
|
|||||||||||
| Operating income (loss) |
348 | 404 | 86 | (289 | ) | 115 | ||||||||||||||
| Depreciation(b) |
96 | 104 | 107 | 24 | 29 | |||||||||||||||
| Amortization of acquisition-related intangible assets |
217 | 182 | 136 | 43 | 21 | |||||||||||||||
| Trade name impairment charge |
— | — | 339 | 339 | — | |||||||||||||||
| Restructuring charges(c) |
42 | 17 | 27 | 5 | 2 | |||||||||||||||
| Stock compensation expense |
31 | 39 | 42 | 9 | 10 | |||||||||||||||
| Management fees |
9 | 8 | 9 | 2 | 2 | |||||||||||||||
| Other costs (included in operating income)(d) |
6 | 12 | 19 | 12 | (4 | ) | ||||||||||||||
|
|
|
|
|
|
|
|
|
|
|
|||||||||||
| Adjusted EBITDA |
$ | 749 | $ | 766 | $ | 765 | $ | 145 | $ | 175 | ||||||||||
|
|
|
|
|
|
|
|
|
|
|
|||||||||||
| (a) | Loss on extinguishment of debt includes in 2012 the write-off of deferred financing fees associated with the January 2012 repayment of $1.22 billion of our U.S. Dollar-denominated term loans, the April 2012 |
65
Table of Contents
| retirement of $500 million, 10.625% senior notes due 2015, the December 2012 retirement of $1 billion, 10.25% senior subordinated notes due 2015 and the December 2012 repayment of $217 million of U.S. Dollar-denominated term loans. Loss on extinguishment of debt for 2014 primarily includes (i) a $36 million loss associated with the exchange of SpinCo Notes for SunGard Notes and (ii) the write-off of deferred financing fees associated with (a) the repayment of $1.005 billion of term loans and the retirement of $389 million of senior notes due 2018, both resulting from the AS Split-Off (see Note 1 and Note 5 of Notes to Consolidated Financial Statements), (b) the $250 million reduction of the revolving credit facility and (c) the repayment of $60 million of the accounts receivable facility term loans. |
| (b) | Includes amortization of capitalized software. |
| (c) | Restructuring charges includes severance and related payroll taxes and reserves to consolidate certain facilities. |
| (d) | Other costs include strategic initiative expenses, certain expenses associated with acquisitions made by the Company, and foreign currency gains and losses. |
Our business is organized into two segments, FS and PS&E. Corporate spending is held above the segments as noted in the table below. Corporate spending includes support functions such as corporate finance, human resources, and legal. The following table details Adjusted EBITDA for each of our two reportable segments and corporate spending to reconcile to total SunGard Adjusted EBITDA, as reconciled above.
| Adjusted EBITDA | ||||||||||||||||||||
| Year Ended December 31, | Three Months Ended March 31, | |||||||||||||||||||
| (dollars in millions) | 2012 | 2013 | 2014 | 2014 | 2015 | |||||||||||||||
| FS |
$ | 727 | $ | 746 | $ | 742 | $ | 139 | $ | 174 | ||||||||||
| PS&E |
66 | 66 | 68 | 16 | 16 | |||||||||||||||
| Corporate |
(44 | ) | (46 | ) | (45 | ) | (10 | ) | (15 | ) | ||||||||||
|
|
|
|
|
|
|
|
|
|
|
|||||||||||
| Total |
$ | 749 | $ | 766 | $ | 765 | $ | 145 | $ | 175 | ||||||||||
|
|
|
|
|
|
|
|
|
|
|
|||||||||||
66
Table of Contents
Quarterly Financial Data
The following tables set forth our unaudited consolidated statement of operations for each of the nine quarters in the period ended March 31, 2015. The unaudited quarterly statement of operations set forth below have been prepared on the same basis as our audited consolidated financial statements. Our historical results are not necessarily indicative of future operating results. Because the data in these tables are only a summary and do not provide all of the data contained in our consolidated financial statements, the information should be read in conjunction with the “Selected Historical Consolidated Financial Data,” “Management’s Discussion and Analysis of Financial condition and Results of Operations,” and our consolidated financial statements and related notes thereto included elsewhere in this prospectus.
| Three Months Ended | ||||||||||||||||||||||||||||||||||||
| (dollars in millions, except per share data) | Mar. 31, 2013 |
June 30, 2013 |
Sep. 30 2013 |
Dec. 31 2013 |
Mar. 31 2014 |
June 30, 2014 |
Sep. 30 2014 |
Dec. 31 2014 |
Mar. 31, 2015 |
|||||||||||||||||||||||||||
| Revenue |
$ | 639 | $ | 672 | $ | 678 | $ | 772 | $ | 653 | $ | 673 | $ | 691 | $ | 792 | $ | 671 | ||||||||||||||||||
| Cost of sales and direct operating(1) |
267 | 258 | 251 | 269 | 269 | 273 | 280 | 276 | 268 | |||||||||||||||||||||||||||
| Sales, marketing and administration |
152 | 156 | 155 | 171 | 168 | 158 | 168 | 173 | 152 | |||||||||||||||||||||||||||
| Product development and maintenance |
105 | 95 | 98 | 94 | 99 | 97 | 90 | 90 | 86 | |||||||||||||||||||||||||||
| Depreciation |
24 | 25 | 24 | 31 | 24 | 27 | 28 | 28 | 29 | |||||||||||||||||||||||||||
| Amortization of acquisition-related intangible assets |
48 | 47 | 43 | 44 | 43 | 41 | 30 | 22 | 21 | |||||||||||||||||||||||||||
| Trade name impairment charge |
— | — | — | — | 339 | — | — | — | — | |||||||||||||||||||||||||||
|
|
|
|
|
|
|
|
|
|
|
|
|
|
|
|
|
|
|
|||||||||||||||||||
| Total costs and expenses |
596 | 581 | 571 | 609 | 942 | 596 | 596 | 589 | 556 | |||||||||||||||||||||||||||
|
|
|
|
|
|
|
|
|
|
|
|
|
|
|
|
|
|
|
|||||||||||||||||||
| Operating income (loss) |
43 | 91 | 107 | 163 | (289 | ) | 77 | 95 | 203 | 115 | ||||||||||||||||||||||||||
| Income (loss) before income taxes |
(52 | ) | 10 | (2) | 29 | (2)(3) | 84 | (424 | )(4) | 5 | 22 | (5) | 132 | 44 | ||||||||||||||||||||||
| Income (loss) from continuing operations |
(35 | ) | 5 | (2) | 22 | (2)(3) | 53 | (323 | )(4) | 3 | 11 | (5) | 101 | 26 | ||||||||||||||||||||||
| Income (loss) from discontinued operations |
(12 | ) | 10 | 1 | 18 | (17 | ) | — | 3 | 2 | ||||||||||||||||||||||||||
| Net income (loss) |
(47 | ) | 15 | (2) | 23 | (2)(3) | 71 | (340 | )(4) | 3 | 11 | (5) | 104 | 28 | ||||||||||||||||||||||
| Income attributable to non-controlling interest |
(25 | ) | (47 | ) | (49 | ) | (48 | ) | (50 | ) | (40 | ) | (42 | ) | (42 | ) | (43 | ) | ||||||||||||||||||
| Net income (loss) attributable to SunGard |
(72 | ) | (32 | )(2) | (26 | )(2)(3) | 23 | (390 | )(4) | (37 | ) | (31 | )(5) | 62 | (15 | ) | ||||||||||||||||||||
| Basic earnings (loss) per share: |
||||||||||||||||||||||||||||||||||||
| Net income (loss) per share—Basic: |
||||||||||||||||||||||||||||||||||||
| Class L stockholders |
$ | 7.13 | $ | 7.70 | $ | 7.79 | $ | 8.05 | $ | 8.14 | $ | 8.80 | $ | 8.90 | $ | 9.20 | $ | 9.29 | ||||||||||||||||||
| Class A stockholders—continuing operations |
(1.02 | ) | (1.02 | ) | (0.97 | ) | (0.88 | ) | (2.34 | ) | (1.12 | ) | (1.11 | ) | (0.80 | ) | (1.10 | ) | ||||||||||||||||||
| Class A stockholders—total |
(1.07 | ) | (0.98 | ) | (0.97 | ) | (0.81 | ) | (2.40 | ) | (1.12 | ) | (1.11 | ) | (0.79 | ) | (1.09 | ) | ||||||||||||||||||
| Diluted earnings (loss) per share: |
||||||||||||||||||||||||||||||||||||
| Net income (loss) per share—Diluted: |
||||||||||||||||||||||||||||||||||||
| Class L stockholders |
$ | 7.13 | $ | 7.70 | $ | 7.79 | $ | 8.05 | $ | 8.14 | $ | 8.80 | $ | 8.90 | $ | 9.20 | $ | 9.29 | ||||||||||||||||||
| Class A stockholders—continuing operations |
(1.02 | ) | (1.02 | ) | (0.97 | ) | (0.88 | ) | (2.34 | ) | (1.12 | ) | (1.11 | ) | (0.80 | ) | (1.10 | ) | ||||||||||||||||||
| Class A stockholders—total |
(1.07 | ) | (0.99 | ) | (0.97 | ) | (0.81 | ) | (2.40 | ) | (1.12 | ) | (1.11 | ) | (0.79 | ) | (1.09 | ) | ||||||||||||||||||
| Other financial data: |
||||||||||||||||||||||||||||||||||||
| Adjusted EBITDA |
$ | 129 | $ | 181 | $ | 195 | $ | 261 | $ | 145 | $ | 160 | $ | 188 | $ | 272 | $ | 175 | ||||||||||||||||||
67
Table of Contents
The following table presents a reconciliation of income (loss) from continuing operations to Adjusted EBITDA for each of the periods indicated:
| Three Months Ended | ||||||||||||||||||||||||||||||||||||
| (dollars in millions) | Mar. 31, 2013 |
June 30, 2013(2) |
Sep. 30 2013(3) |
Dec. 31 2013(2) |
Mar. 31 2014(4) |
June 30, 2014 |
Sep. 30 2014(5) |
Dec. 31 2014 |
Mar. 31, 2015 |
|||||||||||||||||||||||||||
| Net income (loss) |
$ | (47 | ) | $ | 15 | $ | 23 | $ | 71 | $ | (340 | ) | $ | 3 | $ | 11 | $ | 104 | $ | 28 | ||||||||||||||||
| Income (loss) from discontinued operations, net of tax |
(12 | ) | 10 | 1 | 18 | (17 | ) | — | — | 3 | 2 | |||||||||||||||||||||||||
| Provision for (benefit from) income taxes |
17 | (5 | ) | (7 | ) | (31 | ) | 101 | (2 | ) | (11 | ) | (31 | ) | (18 | ) | ||||||||||||||||||||
| Loss on extinguishment of debt |
(5 | ) | — | (1 | ) | — | (61 | ) | — | — | — | — | ||||||||||||||||||||||||
| Interest expense and amortization of deferred financing fees |
(90 | ) | (79 | ) | (78 | ) | (79 | ) | (74 | ) | (73 | ) | (73 | ) | (71 | ) | (71 | ) | ||||||||||||||||||
| Other income (expense), net |
— | (2 | ) | 1 | — | — | 1 | — | — | — | ||||||||||||||||||||||||||
|
|
|
|
|
|
|
|
|
|
|
|
|
|
|
|
|
|
|
|||||||||||||||||||
| Operating income (loss) |
43 | 91 | 107 | 164 | (289 | ) | 77 | 95 | 203 | 115 | ||||||||||||||||||||||||||
| Depreciation |
24 | 25 | 24 | 31 | 24 | 27 | 28 | 28 | 29 | |||||||||||||||||||||||||||
| Amortization of acquisition-related intangible assets |
48 | 47 | 43 | 44 | 43 | 41 | 30 | 22 | 21 | |||||||||||||||||||||||||||
| Trade name impairment charge |
— | — | — | — | 339 | — | — | — | — | |||||||||||||||||||||||||||
| Restructuring charges(6) |
1 | 2 | 6 | 8 | 5 | 2 | 17 | 3 | 2 | |||||||||||||||||||||||||||
| Stock compensation expense |
9 | 11 | 10 | 9 | 9 | 11 | 13 | 9 | 10 | |||||||||||||||||||||||||||
| Management fees |
1 | 2 | 2 | 3 | 2 | 1 | 3 | 3 | 2 | |||||||||||||||||||||||||||
| Other costs (included in operating income)(7) |
3 | 3 | 3 | 3 | 12 | — | 2 | 4 | (4 | ) | ||||||||||||||||||||||||||
|
|
|
|
|
|
|
|
|
|
|
|
|
|
|
|
|
|
|
|||||||||||||||||||
| Adjusted EBITDA |
$ | 129 | $ | 181 | $ | 195 | $ | 261 | $ | 145 | $ | 159 | $ | 188 | $ | 272 | $ | 175 | ||||||||||||||||||
|
|
|
|
|
|
|
|
|
|
|
|
|
|
|
|
|
|
|
|||||||||||||||||||
| (1) | Cost of sales and direct operating expenses represents the cost of providing our software and services offerings to customers and excludes depreciation, amortization and the cost of maintenance. |
| (2) | During the second quarter of 2013, we completed a review of our accounting practices related to vacation pay obligations. In countries where the vacation policy stipulated that vacation days earned in the current-year must be used in that same year, we adjusted our quarterly estimate of accrued vacation costs to better match expense recognition with amounts payable to employees when leaving the Company. The impact of the change in estimate was an aggregate decrease to costs and expenses of $10 million in the quarter ended June 30, 2013. The impact of this change was negligible for the full year since the balance would have naturally reversed, with a substantial majority of that reversal occurring during the fourth quarter. |
| (3) | SunGard received approximately $12 million in proceeds related to a bankruptcy claim assigned and sold to a third party in the third quarter of 2013. The claim related to an FS customer that filed for Chapter 11 bankruptcy in January 2013. The amount of the claim represented previously reserved revenue, which now has been recognized, and a termination charge related to the customer contract. |
| (4) | Includes a $339 million impairment charge of the trade name asset (see Note 1 of Notes to Consolidated Financial Statements) and a $61 million loss on extinguishment of debt (see Note 5 of Notes to Consolidated Financial Statements). |
| (5) | During the three months ended September 30, 2014, the Company recorded a $17 million severance charge related to a workforce reduction plan to reduce headcount by approximately 3% of the total workforce. |
| (6) | Restructuring charges includes severance and related payroll taxes and reserves to consolidate certain facilities. |
| (7) | Other costs include strategic initiative expenses, certain expenses associated with acquisitions made by the Company, and gain/loss on foreign exchange. |
68
Table of Contents
Liquidity and Capital Resources
Our liquidity, a non-GAAP measure, was as follows for the periods indicated:
| (dollars in millions) | (Pre AS Split-Off) December 31, 2013 |
(Post AS Split-Off) March 31, 2014 |
December 31, 2014 |
March 31, 2015 |
||||||||||||
| Cash and cash equivalents |
$ | 706 | $ | 355 | $ | 447 | $ | 555 | ||||||||
| Capacity: Revolving Credit Facility |
831 | 591 | 592 | 593 | ||||||||||||
| Capacity: Receivables Facility |
46 | 15 | 39 | 43 | ||||||||||||
|
|
|
|
|
|
|
|
|
|||||||||
| Total Liquidity |
$ | 1,583 | $ | 961 | $ | 1,078 | $ | 1,191 | ||||||||
|
|
|
|
|
|
|
|
|
|||||||||
Total liquidity represents the amount of cash and readily available sources of cash. We use total liquidity to ensure we have an adequate amount of funds to meet our obligations.
Our cash and cash equivalents totaled $555 million at March 31, 2015. Approximately $261 million was held by our wholly-owned non-U.S. subsidiaries that is available to fund operations and strategic investment opportunities abroad. Also, approximately $39 million is related to our broker/dealer operations, some of which is not readily available for general corporate use. The remaining cash and cash equivalents of $255 million was held by our wholly-owned U.S. subsidiaries and is available for general corporate use.
Our cash and cash equivalents totaled $447 million at December 31, 2014. Approximately $196 million was held by our wholly-owned non-U.S. subsidiaries that is available to fund operations and strategic investment opportunities abroad. Also, approximately $43 million is related to our broker/dealer operations, some of which is not readily available for general corporate use. The remaining cash and cash equivalents of $208 million was held by our wholly-owned U.S. subsidiaries and is available for general corporate use.
We believe our cash flows in the United States continue to be sufficient to fund our current domestic operations and obligations, including financing activities such as debt service. In addition, we have several options available to improve liquidity in the short term in the United States, including repatriation of funds from foreign subsidiaries, borrowing funds under our revolving credit facilities, and calling intercompany loans that are in place with certain foreign subsidiaries. To the extent we elect to repatriate the earnings of our foreign subsidiaries, significant additional cash taxes could be payable. See Note 13 to our consolidated financial statements included elsewhere in this prospectus.
Three Months Ended March 31, 2015 Compared to Three Months Ended March 31, 2014
Cash Flow from Operations
Cash flow from continuing operations was $154 million for the three months ended March 31, 2015, an increase of $68 million from the prior-year period. The increase in 2015 cash flow from continuing operations was primarily due to improved operating performance during the first quarter of 2015, non-recurring transaction costs incurred during the first quarter of 2014 related to the AS Split-Off , and higher working capital contributions during the first quarter of 2015 mainly due to a reduction of accounts receivable tied to improved collections, and higher annual incentive payments paid in the first quarter of 2014 related to 2013 financial performance.
Cash Flow from Investing Activities
Net cash used by continuing operations in investing activities was $32 million in the three months ended March 31, 2015, comprised mainly of $28 million of cash paid for property and equipment and capitalized software development and $4 million paid for an acquisition of a business included in our FS segment. This
69
Table of Contents
compares to $28 million in the three months ended March 31, 2014, comprised mainly of cash paid for property and equipment and capitalized software development costs. Capitalized software development costs, which reflect investments in our software solutions, increased $2 million in the first quarter of 2015 to $15 million from the prior-year period.
Cash Flow from Financing Activities
Net cash used by continuing operations in financing activities was $4 million for the three months ended March 31, 2015, primarily related to payments of employee taxes from the net distribution of share-based awards to employees. Net cash used by continuing operations in financing activities was $1,338 million for the three months ended March 31, 2014, primarily related to repayment of $1,005 million of term loans as part of the AS Split-Off, repayment of our $250 million senior secured notes due 2014 and $60 million of our receivables facility term loan, and repayment of $7 million of our tranche A term loan.
Year Ended December 31, 2014 Compared to Year Ended December 31, 2013
Cash Flow from Operations
Cash flow from continuing operations was $332 million in 2014, a decrease of $90 million versus 2013. In late 2012, we instituted a series of working capital initiatives largely focused on improving accounts receivable collections. These initiatives, which generated a significant benefit to our 2013 working capital, did not provide the same level of benefit during 2014. In addition, 2014 working capital was negatively impacted by higher annual incentive payments in 2014 related to 2013 financial performance, as well as from transaction costs incurred in 2014 associated with the AS Split-Off. These items were partially offset by lower interest payments in 2014 resulting from the repayment of debt in 2013 and the first quarter of 2014 prior to the Split-Off of Availability Services.
Cash Flow from Investing Activities
Net cash used by continuing operations in investing activities is primarily comprised of cash paid for property and equipment and capitalized software development, as well as cash paid to acquire businesses. In 2014, cash paid by continuing operations for investing activities increased by $35 million to $147 million primarily due to a $21 million increase in capitalized software development costs related to our product investments, as well as investments to increase hosting and cloud capacity on a global basis. We have been shifting our investment strategy to new product development initiatives to address the faster growing products, services and geographic markets. The remainder of the increase was primarily due to $7 million of purchased software and a $4 million increase related to the purchase of computer and telecommunications equipment.
Cash Flow from Financing Activities
In 2014, net cash from continuing operations used in financing activities was $1.355 billion, which included the repayment of $1.005 billion of term loans as part of the AS Split-Off, $250 million senior secured notes, $60 million of our receivables facility term loan and $7 million of our tranche A term loan that matured in February 2014. In 2013, net cash from continuing operations used in financing activities was $325 million, which included refinancing $2.2 billion of term loans, additional repayments of $224 million of term loans and repayment of $50 million of our receivables facility revolver.
Year Ended December 31, 2013 Compared to Year Ended December 31, 2012
Cash Flow from Operations
Cash flow from continuing operations in 2013 was $422 million, an increase of $135 million versus 2012. The improvement in cash flow from operations in 2013 was primarily due to lower interest expense resulting
70
Table of Contents
from the repayment of $1.2 billion of debt using the proceeds from the sale of HE in January 2012, and the repayment of $500 million of 10.625% senior unsecured notes in April 2012. Additionally, 2013 cash flow from operations benefited from improved operating results and from working capital initiatives largely focused on improving accounts receivable collections. These benefits were partially offset by a one-time benefit in 2012 from exiting certain lower margin services in our Broker/Dealer business which required significant cash reserves.
Cash Flow from Investing Activities
In 2013, cash paid by continuing operations for investing activities decreased by $24 million from 2012 to $112 million primarily due to a $38 million decrease in cash paid for businesses acquired and a $5 million decrease in capital expenditures related to the purchase of computer and telecommunications equipment, partially offset by a $19 million increase in capitalized software development costs. We have been very selective in our acquisition strategy, spending $2 million in 2013 for one acquisition and $40 million in 2012 for two acquisitions.
Cash Flow from Financing Activities
In 2013, net cash from continuing operations used in financing activities was $325 million, which included refinancing $2.2 billion of term loans, additional repayments of $224 million of term loans and repayment of $50 million of our receivables facility revolver. In 2012, net cash from continuing operations used in financing activities was $2.04 billion, which included the repayment of $1.22 billion of term loans resulting from the sale of HE, $1.02 billion to repurchase and redeem $1 billion of senior subordinated notes due 2015, a $724 million preferred stock dividend, $527 million to redeem the 10.625% senior notes due 2015 and $217 million of optional prepayments of term loans. These financing outflows were partially offset by the issuance of $1 billion of senior subordinated notes due 2019 and a $720 million term loan to fund the dividend.
71
Table of Contents
Debt
As a result of our acquisition on August 11, 2005 by funds associated with our Sponsor and certain co-investors, we are highly leveraged. Total debt outstanding as of December 31, 2013, March 31, 2014 (post AS Split-Off), December 31, 2014 and March 31, 2015 consists of the following:
| (dollars in millions) | (pre AS Split-Off) December 31, 2013 |
(post AS Split-Off) March 31, 2014 |
December 31, 2014 |
March 31, 2015 |
||||||||||||
| Senior Secured Credit Facilities: |
||||||||||||||||
| Secured revolving credit facility due March 8, 2018 |
$ | — | $ | — | $ | — | $ | — | ||||||||
| Tranche A due February 28, 2014, effective interest rate of 1.92% |
7 | — | — | — | ||||||||||||
| Tranche C due February 28, 2017, effective interest rates of 4.41%, 4.44%, 4.44% and 4.44% |
427 | 400 | 400 | 400 | ||||||||||||
| Tranche D due January 31, 2020, effective interest rate of 4.50% |
713 | — | — | — | ||||||||||||
| Tranche E due March 8, 2020, effective interest rates of 4.10%, 4.31%, 4.31% and 4.31% |
2,183 | 1,918 | 1,918 | 1,918 | ||||||||||||
|
|
|
|
|
|
|
|
|
|||||||||
| Total Senior Secured Credit Facilities |
3,330 | 2,318 | 2,318 | 2,318 | ||||||||||||
| Senior Secured Notes due 2014 at 4.875% |
250 | — | — | |||||||||||||
| Senior Notes due 2018 at 7.375% |
900 | 511 | 511 | 511 | ||||||||||||
| Senior Notes due 2020 at 7.625% |
700 | 700 | 700 | 700 | ||||||||||||
| Senior Subordinated Notes due 2019 at 6.625% |
1,000 | 1,000 | 1,000 | 1,000 | ||||||||||||
| Secured accounts receivable facility, at 3.67%, 3.66%, 3.16% and 3.18% |
200 | 140 | 140 | 140 | ||||||||||||
| Other, primarily foreign bank debt and capital lease obligations |
4 | 2 | — | 1 | ||||||||||||
|
|
|
|
|
|
|
|
|
|||||||||
| Debt—continuing operations |
6,384 | 4,671 | 4,669 | — | ||||||||||||
| Debt—discontinued operations |
8 | — | — | — | ||||||||||||
|
|
|
|
|
|
|
|
|
|||||||||
| Total debt |
$ | 6,392 | $ | 4,671 | $ | 4,669 | $ | 4,670 | ||||||||
|
|
|
|
|
|
|
|
|
|||||||||
| Leverage Metric per Credit Agreement |
4.56 | x | 5.42 | x | 5.41 | x | 5.04 | x | ||||||||
| Weighted Average Interest Rate |
5.42 | % | 5.63 | % | 5.61 | % | 5.62 | % | ||||||||
| Percent Fixed Rate (swap adjusted) |
54 | % | 67 | % | 67 | % | 67 | % | ||||||||
| Percent Bonds of Total Debt |
45 | % | 47 | % | 47 | % | 47 | % | ||||||||
At March 31, 2015, contingent purchase price obligations that depend upon the operating performance of certain acquired businesses were a potential of $6 million, of which approximately $0.3 million is accrued. We also have outstanding letters of credit and bid bonds that total approximately $17 million.
We expect our available cash balances and cash flows from operations, combined with availability under the revolving credit facility and receivables facility, to provide sufficient liquidity to fund our current obligations, projected working capital requirements and capital spending for a period that includes at least the next 12 months.
Our ability to make dividend payments to our equity holders is governed by the covenants in our debt documents. Without obtaining an amendment to those documents, our covenants currently limit such a dividend to a total of $200 million.
72
Table of Contents
At December 31, 2013, March 31, 2014 (post AS Split-Off), December 31, 2014 and March 31, 2015, the contractual future maturities of debt of continuing operations were as follows:
| (dollars in millions) | (pre AS Split-Off) December 31, 2013 |
(post AS Split-Off) March 31, 2014 |
December 31, 2014 |
March 31, 2015 |
||||||||||||
| 2014 |
$ | 290 | $ | — | $ | — | $ | — | ||||||||
| 2015 |
29 | 2 | — | 1 | ||||||||||||
| 2016 |
29 | — | — | — | ||||||||||||
| 2017 |
656 | 540 | 400 | 400 | ||||||||||||
| 2018 |
929 | 511 | 511 | 511 | ||||||||||||
| 2019 |
1,029 | 1,000 | 1,140 | 1,140 | ||||||||||||
| Thereafter |
3,422 | 2,618 | 2,618 | 2,618 | ||||||||||||
|
|
|
|
|
|
|
|
|
|||||||||
| Total |
$ | 6,384 | $ | 4,671 | $ | 4,669 | $ | 4,670 | ||||||||
|
|
|
|
|
|
|
|
|
|||||||||
See Notes 1 and 5 to our consolidated financial statements included elsewhere in this prospectus.
In 2012, 2013 and 2014, we restructured our debt in light of the attractive credit markets. Specifically, we have extended our maturities, lowered our interest rates, removed the financial maintenance covenants with respect to our term loan facility and used interest rate swaps to manage the amount of floating rate debt in order to reduce our exposure to variable rate interest payments.
Senior Secured Credit Facilities
We had $592 million of available borrowing capacity and $8 million of outstanding letters of credit under our $600 million revolving credit facility as of December 31, 2014. In addition, we had $4 million of letters of credit outstanding at December 31, 2014 that did not impact availability under the revolving credit facility.
On February 7, 2014, we amended and restated our Amended and Restated Credit Agreement dated as of August 11, 2005, as amended and restated from time to time (“Credit Agreement”) to, among other things, (a) amend certain covenants and other provisions of the Credit Agreement in order to permit the AS Split-Off, including (i) the ability to effect the split-off without requiring an initial public offering, (ii) permitting AS to incur up to $1.5 billion of indebtedness in connection with the split-off, and (iii) requiring SunGard’s total secured leverage ratio (less cash and Cash Equivalents in excess of $50 million), after giving pro forma effect to the split-off, to increase no more than 0.60x of Covenant Compliance Adjusted EBITDA at the time of the AS Split-Off; and (b) amend certain covenants and other provisions in order to, among other things (i) modify the financial maintenance covenant included therein, and (ii) permit us and our affiliates to repurchase term loans under the Credit Agreement subject to certain restrictions.
On February 28, 2014, we repaid the remaining $7 million tranche A term loan under the Credit Agreement. On March 31, 2014 in connection with the AS Split-Off, we used the $1,005 million net cash proceeds we received from SpinCo from the issuance of a SpinCo term loan facility to repay approximately $27 million of our tranche C term loan, $713 million of our tranche D term loan and $265 million of our tranche E term loan, in each case, under the Credit Agreement.
The tranche E term loan and the revolving credit commitments under the Credit Agreement are subject to certain springing maturities such that (a) the tranche E term loan will mature on March 8, 2020 unless (i) all but $250,000,000 in aggregate principal amount of the 2018 Notes are not repaid in full or extended, renewed or refinanced on or prior to August 16, 2018, which refinancing will not mature or require any scheduled amortization or payments of principal prior to the date that is 91 days after March 8, 2020, in which case the tranche E term loan will mature on August 16, 2018 or (ii) all but $250,000,000 in aggregate principal amount of the Senior Subordinated Notes are not repaid in full or extended, renewed or refinanced on or prior to August 2,
73
Table of Contents
2019, which refinancing will not mature or require any scheduled amortization or payments of principal prior to the date that is 91 days after March 8, 2020, in which case the tranche E term loan will mature on August 2, 2019 and (b) the revolving credit commitments will mature on March 8, 2018, unless all but $250,000,000 in aggregate principal amount of the tranche C term loans under the Credit Agreement are not repaid in full or extended, renewed or refinanced on or prior to November 29, 2016, which refinancing will not mature or require any scheduled amortization or payments of principal prior to the date that is 91 days after March 8, 2018, in which case the revolving credit commitments will mature on November 29, 2016.
Secured Accounts Receivable Facility
We also maintain a secured accounts receivables facility, which consists of an outstanding term loan of $140 million and a revolving credit commitment of $60 million as of December 31, 2014. At December 31, 2014, $364 million of accounts receivable secured the borrowings under the receivables facility, and no amount was drawn on the revolving commitment. During January 2014, we removed AS sellers in the accounts receivable facility and, as a result, we repaid $60 million of the term loan component which permanently reduced the facility limit. The impact of removing AS sellers and the resulting $60 million repayment of the term loan had the effect of reducing the amount available for borrowing to an aggregate of $200 million, which is comprised of a $140 million term loan and a $60 million revolving credit commitment.
The receivables facility contains certain covenants. We are required to satisfy and maintain specified facility performance ratios, financial ratios and other financial condition tests.
On May 14, 2014, we amended and restated our secured accounts receivable facility in order to, among other things, (i) extend the maturity date from December 19, 2017 to May 14, 2019 and (ii) reduce the applicable margin on the advances under the facility from 3.50% for LIBOR advances and 2.50% for base rate advances to 3.00% and 2.00%, respectively.
Interest Rate Swaps
We use interest rate swap agreements to manage the amount of our floating rate debt in order to reduce our exposure to variable rate interest payments associated with the senior secured credit facilities. We pay a stream of fixed interest payments for the term of the swaps, and in turn, receive variable interest payments based on one-month LIBOR or three-month LIBOR (0.17% and 0.26%, respectively, at December 31, 2014). The net receipt or payment from the interest rate swap agreements is included in interest expense. As of December 31, 2014, including the impact of our outstanding interest rate swaps, the composition of our debt was 67% fixed and 33% floating. A summary of our interest rate swaps at December 31, 2014 follows (dollars in millions):
| Inception |
Maturity | Notional Amount (dollars in millions) |
Interest rate paid |
Interest rate received (LIBOR) |
||||||||||
| August-September 2012 |
February 2017 | $ | 400 | 0.69 | % | 1-Month | ||||||||
| June 2013 |
June 2019 | 100 | 1.86 | % | 3-Month | |||||||||
| September 2013 |
June 2019 | 100 | 2.26 | % | 3-Month | |||||||||
| February-March 2014 |
March 2020 | 300 | 2.27 | % | 3-Month | |||||||||
|
|
|
|||||||||||||
| $ | 900 | 1.52 | % | |||||||||||
|
|
|
|||||||||||||
74
Table of Contents
Contractual Obligations
At December 31, 2014, our contractual obligations follow:
| (dollars in millions) | Total | 2015 | 2016 | 2017 | 2018-2019 | Thereafter | ||||||||||||||||||
| Short-term and long-term debt(1) |
$ | 4,669 | $ | — | $ | — | $ | 400 | $ | 1,651 | $ | 2,618 | ||||||||||||
| Interest payments(1)(2) |
1,323 | 269 | 271 | 257 | 451 | 75 | ||||||||||||||||||
| Operating leases |
231 | 62 | 56 | 45 | 47 | 21 | ||||||||||||||||||
| Purchase obligations(3) |
123 | 94 | 19 | 6 | 4 | — | ||||||||||||||||||
|
|
|
|
|
|
|
|
|
|
|
|
|
|||||||||||||
| Total |
$ | 6,346 | $ | 425 | $ | 346 | $ | 708 | $ | 2,153 | $ | 2,714 | ||||||||||||
|
|
|
|
|
|
|
|
|
|
|
|
|
|||||||||||||
| (1) | We intend to use the net proceeds from this offering to reduce debt. We estimate that this will reduce our annual interest expense by approximately $ million. |
| (2) | Interest payments consist of interest on both fixed-rate and variable-rate debt. Variable-rate debt consists primarily of the tranche E term loan facility ($1,418 million at 4.00%), and the secured accounts receivable facility ($140 million at 3.16%), each as of December 31, 2014. See Note 5 to our consolidated financial statements included elsewhere in this prospectus. |
| (3) | Purchase obligations include our estimate of the minimum outstanding obligations under noncancelable commitments to purchase goods or services. |
Gross reserves for uncertain tax positions approximated $104 million as of December 31, 2014. We believe it is more-likely-than-not that the uncertain tax positions for which a benefit has been recognized are sustainable, based solely on their technical merits and consideration of the relevant taxing authority’s widely understood administrative practices and precedents. However, we have only recorded the portion of these tax benefits that are greater than fifty percent likely to be realized upon settlement with the taxing authority. To the extent that the relevant taxing authority disagrees with our positions it may result in a future cash outlay, which is not included in the contractual obligations table above. See Note 13 to our consolidated financial statements included elsewhere in this prospectus.
At December 31, 2014, contingent purchase price obligations that depend upon the operating performance of certain acquired businesses were $6 million, of which approximately $0.5 million is included in other long-term liabilities. We also have outstanding letters of credit and bid bonds that total approximately $19 million.
We expect our available cash balances and cash flows from operations, combined with availability under the revolving credit facility and receivables facility, to provide sufficient liquidity to fund our current obligations, projected working capital requirements and capital spending for a period that includes at least the next 12 months.
Depending on market conditions, SunGard, its Sponsors and their affiliates may from time to time repurchase debt securities issued by SunGard, in privately negotiated or open market transactions, by tender offer or otherwise.
Covenant Compliance
As of March 31, 2015, we were in compliance with all financial and nonfinancial covenants. In connection with the March 2013 senior secured credit agreement amendment, as further amended in February 2014, we removed the financial maintenance covenants for the term loan facility and modified the financial maintenance covenants for the senior secured revolving credit facility. As amended, the financial maintenance covenant is applicable at quarter end only if there is an amount outstanding under the revolving credit facility (minus the lesser of (i) the amount of outstanding letters of credit issued under the Credit Agreement and (ii) $25 million) that is greater than or equal to 25% of the total revolving commitments available under the credit facility (see footnote 1 below for further details). If applicable, starting with the quarter ended March 31, 2015, the financial maintenance covenant allows a maximum total leverage ratio to Covenant Compliance Adjusted EBITDA of 6.00x at the end of such quarter through December 31, 2015 and 5.75x thereafter.
75
Table of Contents
The Credit Agreement and the indentures governing our senior notes due 2018 and 2020 and our senior subordinated notes due 2019 contain various covenants that limit our ability to engage in specified types of transactions. These covenants limit our ability to, among other things:
| • | incur additional indebtedness or issue certain preferred shares; |
| • | pay dividends on, repurchase or make distributions in respect of our capital stock or make other restricted payments; |
| • | make certain investments; |
| • | sell certain assets; |
| • | create liens; |
| • | consolidate, merge, sell or otherwise dispose of all or substantially all of our assets; and |
| • | enter into certain transactions with our affiliates. |
If the financial maintenance covenant in the revolving credit facility were to apply and we failed to satisfy such covenant, then a default solely of the revolving credit facility would occur. If the revolving credit lenders fail to waive such default, then the revolving credit lenders could elect (upon a determination by a majority of the revolving credit lenders) to terminate their commitments and declare all amounts borrowed under the revolving credit facility due and payable. If this happens, all amounts borrowed under the senior secured term loan facilities would be due and payable as well. This acceleration would also result in a default under the indentures.
Under the indentures governing SunGard’s senior notes due 2018 and 2020 and senior subordinated notes due 2019 and SunGard’s senior secured credit agreement, our ability to incur additional indebtedness, make investments and pay dividends remains tied to a leverage or fixed charge ratio based on SDS’s Covenant Compliance Adjusted EBITDA. Covenant Compliance Adjusted EBITDA, in our credit facilities, is defined as EBITDA, which we define as earnings before interest, taxes, depreciation and amortization, further adjusted to exclude certain adjustments permitted in calculating covenant compliance under the indentures and senior secured credit facilities. Credit Agreement Adjusted EBITDA is a non-GAAP measure used to determine our compliance with certain covenants contained in the indentures governing the senior notes due 2018 and 2020 and senior subordinated notes due 2019 and in our senior secured credit agreement. We believe that the inclusion of supplementary adjustments to EBITDA applied in presenting Covenant Compliance Adjusted EBITDA are appropriate to provide additional information to investors to demonstrate compliance with the financing covenants.
Covenant Compliance Adjusted EBITDA does not represent net income (loss) or cash flow from operations as those terms are defined by GAAP and does not necessarily indicate whether cash flows will be sufficient to fund cash needs. While Covenant Compliance Adjusted EBITDA and similar measures are frequently used as measures of operations and the ability to meet debt service requirements, these terms are not necessarily comparable to other similarly titled captions of other companies due to the potential inconsistencies in the method of calculation. Covenant Compliance Adjusted EBITDA does not reflect the impact of earnings or charges resulting from matters that we may consider not to be indicative of our ongoing operations. In particular, the definition of Covenant Compliance Adjusted EBITDA in the indentures allows us to add back certain noncash, extraordinary or unusual charges that are deducted in calculating net income (loss). However, these are expenses that may recur, vary greatly and are difficult to predict. Further, our debt instruments require that Covenant Compliance Adjusted EBITDA be calculated for the most recent four fiscal quarters. As a result, the measure can be disproportionately affected by a particularly strong or weak quarter. Further, it may not be comparable to the measure for any subsequent four-quarter period or any complete fiscal year. Covenant Compliance Adjusted EBITDA is similar, but not identical, to Adjusted EBITDA used to measure our performance. Adjusted EBITDA should not be considered as an alternative to cash flows from operating activities, as a measure of liquidity or as an alternative to operating income or net income as indicators of operating performance. See Note 11 to our unaudited condensed consolidated financial statements found elsewhere in this prospectus and Note 15 to our consolidated financial statements found elsewhere in this prospectus.
76
Table of Contents
SunGard Data Systems Inc. Adjusted EBITDA Reconciliation
The following is a reconciliation for SunGard Data Systems Inc. of income (loss) from continuing operations, which is a GAAP measure of our operating results, to Covenant Compliance Adjusted EBITDA as defined in our debt agreements. This is similar, but not identical, to Adjusted EBITDA used for segment reporting as disclosed earlier. The terms and related calculations are defined in the credit agreement. The outstanding debt relates to SunGard Data Systems Inc., a wholly owned, indirect subsidiary of SunGard. The amounts in the table below relate to SunGard Data Systems Inc. and may be different than comparable amounts for SunGard due to certain expenses that are borne directly by SunGard.
| Year Ended December 31, |
Three Months Ended March 31, |
Last Twelve Months Ended March 31, |
||||||||||||||||||||||
| (dollars in millions) | 2012 | 2013 | 2014 | 2014 | 2015 | 2015 | ||||||||||||||||||
| Income (loss) from continuing operations |
$ | (43 | ) | $ | 46 | $ | (207 | ) | $ | (323 | ) | $ | 26 | $ | 142 | |||||||||
| Interest expense, net |
359 | 325 | 290 | 74 | 71 | 287 | ||||||||||||||||||
| Provision for (benefit from) income taxes |
(49 | ) | 26 | (57 | ) | (101 | ) | 18 | 62 | |||||||||||||||
| Depreciation |
96 | 104 | 107 | 24 | 29 | 112 | ||||||||||||||||||
| Amortization of acquisition-related intangible assets |
217 | 182 | 136 | 43 | 21 | 114 | ||||||||||||||||||
|
|
|
|
|
|
|
|
|
|
|
|
|
|||||||||||||
| EBITDA |
580 | 683 | 269 | (283 | ) | 165 | 717 | |||||||||||||||||
| Trade name impairment charge |
— | — | 339 | 339 | — | — | ||||||||||||||||||
| Purchase accounting adjustments(a) |
7 | 6 | 1 | — | — | 1 | ||||||||||||||||||
| Stock compensation expense |
31 | 39 | 42 | 9 | 10 | 43 | ||||||||||||||||||
| Restructuring charges(b) |
42 | 17 | 27 | 5 | 2 | 24 | ||||||||||||||||||
| Management fees |
9 | 8 | 9 | 2 | 2 | 9 | ||||||||||||||||||
| Acquired EBITDA, net of disposed EBITDA(c) |
3 | — | — | — | — | — | ||||||||||||||||||
| Other costs(d) |
(3 | ) | 3 | 16 | 11 | — | 5 | |||||||||||||||||
| Loss on extinguishment of debt(e) |
82 | 6 | 61 | 61 | — | — | ||||||||||||||||||
|
|
|
|
|
|
|
|
|
|
|
|
|
|||||||||||||
| Covenant Compliance Adjusted EBITDA—senior secured credit facilities, senior notes due 2018 and 2020 and senior subordinated notes due 2019 |
$ | 751 | $ | 762 | $ | 764 | $ | 144 | $ | 179 | $ | 799 | ||||||||||||
|
|
|
|
|
|
|
|
|
|
|
|
|
|||||||||||||
| (a) | Purchase accounting adjustments include the adjustment of deferred revenue and lease reserves to fair value at the dates of the LBO and subsequent acquisitions made by SunGard and certain acquisition-related compensation expense. |
| (b) | Restructuring charges include severance and related payroll taxes, and reserves to consolidate or exit certain facilities. |
| (c) | Acquired EBITDA net of disposed EBITDA reflects the EBITDA impact of businesses that were acquired or disposed of during the period as if the acquisition or disposition occurred at the beginning of the period. |
| (d) | Other costs includes strategic initiative expenses, certain other expenses associated with acquisitions made by the Company, franchise and similar taxes reported in operating expenses and loss on the sale of assets, partially offset by certain charges relating to the receivables facility. |
| (e) | Loss on extinguishment of debt for the three months ended March 31, 2014 primarily includes (i) a $36 million loss associated with the exchange of SpinCo Notes for SunGard Notes and (ii) the write-off of deferred financing fees associated with (a) the repayment of $1.005 billion of term loans and the retirement of $389 million of senior notes due 2018, both resulting from the AS Split-Off, (b) the $250 million reduction of the revolving credit facility and (c) the repayment of $60 million of the accounts receivable facility term loans. |
77
Table of Contents
Loss on extinguishment of debt includes in 2012 the write-off of deferred financing fees associated with the January 2012 repayment of $1.22 billion of our US dollar-denominated term loans, the April 2012 retirement of $500 million, 10.625% senior notes due 2015, the December 2012 retirement of $1 billion, 10.25% senior subordinated notes due 2015 and the December 2012 repayment of $217 million of U.S. Dollar-denominated term loans. Loss on extinguishment of debt for 2014 primarily includes (i) a $36 million loss associated with the exchange of SpinCo Notes for SunGard Notes and (ii) the write-off of deferred financing fees associated with (a) the repayment of $1.005 billion of term loans and the retirement of $389 million of senior notes due 2018, both resulting from the AS Split-Off (see Note 1 and Note 5 to our consolidated financial statements included elsewhere in this prospectus), (b) the $250 million reduction of the revolving credit facility and (c) the repayment of $60 million of the accounts receivable facility term loans.
Covenant Ratios
The covenant requirements and actual ratios for the twelve months ended March 31, 2015 are as follows:
| Covenant Requirements |
Actual Ratios |
|||||||
| Senior secured credit facilities(1) |
||||||||
| Maximum total debt to Covenant Compliance Adjusted EBITDA |
6.00x | 5.04x | ||||||
| Senior notes due 2018 and 2020 and senior subordinated notes due 2015(2) |
||||||||
| Minimum Covenant Compliance Adjusted EBITDA to fixed charges ratio required to incur additional debt pursuant to ratio provisions |
2.00x | 3.02x | ||||||
| (1) | If on the last day of any four consecutive fiscal quarters ending on or before December 31, 2015, but after December 31, 2014, our total revolving credit exposure minus the lesser of (x) the amount of outstanding letters of credit under the senior secured revolving credit facility and (y) $25 million, is equal to or greater than an amount equal to 25% of our aggregate revolving credit commitments, then on such day, we would be required to maintain a maximum consolidated total debt to Covenant Compliance Adjusted EBITDA ratio of 6.00x which steps down to 5.75x after December 31, 2015. Consolidated total debt is defined in the senior secured credit facilities as total debt less (i) certain indebtedness and (ii) cash and cash equivalents on our balance sheet in excess of $50 million. Failure to satisfy this ratio requirement would constitute a default solely under the senior secured revolving credit facility. If our revolving credit facility lenders failed to waive any such default and subsequently accelerated our obligations or terminated their commitments under the senior secured revolving credit facility, our repayment obligations under the senior secured term loan facilities would be accelerated as well, which would also constitute a default under our indentures. |
| (2) | SDS’ ability to incur additional debt and make certain restricted payments under our indentures, subject to specified exceptions, is tied to a ratio of Covenant Compliance Adjusted EBITDA to fixed charges of at least 2.0x, except that we may incur certain debt and make certain restricted payments and certain permitted investments without regard to the ratio, such as the ability to incur up to an aggregate principal amount of $5.75 billion under credit facilities (inclusive of amounts outstanding under the senior credit facilities from time to time; as of March 31, 2015, we had $2.32 billion outstanding under the term loan facilities and available commitments of $593 million under the revolving credit facility), to acquire persons engaged in a similar business that become restricted subsidiaries and to make other investments equal to 6% of our consolidated assets. Fixed charges is defined in the indentures governing the Senior Notes due 2018 and 2020 and the Senior Subordinated Notes due 2019 as consolidated interest expense less interest income, adjusted for acquisitions, and further adjusted for non-cash interest and the elimination of interest expense and fees associated with the receivables facility. |
78
Table of Contents
Use of Estimates and Critical Accounting Policies
The preparation of financial statements in conformity with accounting principles generally accepted in the United States of America (“GAAP”) requires us to make many estimates and judgments that affect the reported amounts of assets, liabilities, revenue and expenses. Those estimates and judgments are based on historical experience, future expectations and other factors and assumptions we believe to be reasonable under the circumstances. We review our estimates and judgments on an ongoing basis and revise them when necessary. Actual results may differ from the original or revised estimates. A summary of our significant accounting policies is contained in Note 1 of Notes to Consolidated Financial Statements. A description of the most critical policies and those areas where estimates have a relatively greater effect in the financial statements follows. Management has discussed the critical accounting policies described below with our audit committee.
Revenue Recognition
The following criteria must be met in determining whether revenue may be recorded: (1) persuasive evidence of a contract exists; (2) software has been delivered and/or services have been provided; (3) the price is fixed or determinable; and (4) collection is reasonably assured.
Revenue is recorded as the software is delivered and/or services are provided based on the relative fair value of each element. Unbilled receivables are created when services are performed or software is delivered and revenue is recognized in advance of billings. Deferred revenue is created when billing occurs in advance of performing services or when all revenue recognition criteria have not been met.
We generate revenue from the following sources: (1) Software revenue, (2) SaaS and cloud revenue, and (3) Services revenue.
Software Revenue: Our Software revenue is comprised of traditional software license fees, maintenance and support fees, and fees from the resale of third-party software licenses. These software license fees include term licenses, perpetual licenses and rental fees. Term licenses generally have three to seven year terms and are generally billed upfront. For software licenses, revenue is recognized at the time the software is delivered assuming all revenue recognition criteria are met. Software rentals are generally offered under either annual or multi-year terms and are billed either monthly or annually in advance. Software rentals combine the license and maintenance services into a bundled element, and the fee is recognized ratably over the corresponding services period when the customer has the right to use the software product and receive maintenance and support services. Maintenance and support are generally offered under annual or multi-year terms and are billed either monthly or annually in advance. Our maintenance and support provides customers with periodic technology updates and interactive support related to our software. Maintenance and support revenue is recognized ratably over the stated term.
SaaS and Cloud Revenue: Our SaaS and cloud offerings are delivered from our private cloud and are generally offered with three to seven year terms. These offerings are billed monthly and allow customers to take advantage of SunGard’s deep domain expertise while avoiding the upfront cost of licensing and IT infrastructure. SaaS and cloud revenue also includes revenue from our proprietary trading algorithms and trade execution network. Our SaaS and cloud revenue includes monthly fees, which may include a fixed minimum fee and/or variable fees based on a measure of volume or activity, such as the number of accounts, trades or transactions, users or the number of hours of service.
Services Revenue: Our services offerings help customers to install, optimize and integrate SunGard’s software into their computing environment. For fixed-fee professional services contracts, revenue is recorded based upon proportional performance, measured by the actual number of hours incurred divided by the total estimated number of hours for the project. Changes in the estimated costs or hours to complete the contract, and losses, if any, are reflected in the period during which the change or loss becomes known. The Company also
79
Table of Contents
provides professional services on a time and materials basis, recognized monthly based upon hours incurred to date. In all cases, contract milestones, project risk profile and refund provisions are taken into consideration. Services also includes SunGard’s BPaaS offerings which provide back-office processing services to our customers where the process is closely related to a SunGard application.
Revenue Recognition for Software Related Multiple-Element Arrangements
We often enter into software license contracts that permit the customer to use a SunGard software product at the customer’s designated site or at the site of their choosing which can include third-party cloud environments as well as our private cloud. Careful review is required to determine if the software products being run in these cloud environments are considered software or non-software elements. If the customer has the contractual right to take immediate possession of the software without significant penalty the element would be categorized as software and can be bifurcated from the ongoing services.
Generally, these contracts are multiple-element arrangements since they usually include software products, professional services and ongoing software maintenance and support services. If the customer has the contractual right to take immediate possession of the software without significant penalty, software license fees are recognized upon the signing of the contract and delivery of the software if the license fee and fees for other elements within the arrangement are fixed or determinable, collection is probable, and there is sufficient vendor specific evidence of the fair value of each undelivered element.
With respect to software-related multiple element arrangements, sufficient evidence of fair value is defined as vendor specific objective evidence (“VSOE”). VSOE of the fair value for each element within an arrangement is based on either historical stand-alone sales of the element to third parties or stated renewal rates within the contract. If there is no VSOE of the fair value of the delivered element (which is usually the software since the license is rarely if ever sold separately), but there is VSOE of the fair value of each of the undelivered elements (typically maintenance and professional services), then the residual method is used to determine the portion of the arrangement fee allocated to the delivered element. The revenue for each of the undelivered elements is set at the fair value of those elements using VSOE of the price paid when each of the undelivered elements is sold separately. The revenue remaining after allocation to the undelivered elements (i.e., the residual) is allocated to the delivered element.
When there are significant program modifications or customization, installation, systems integration or related services, the professional services and license revenue are combined in accordance with contract accounting guidance and recorded based upon proportional performance, measured in the manner described above. License revenue is recorded as each installment becomes due if customer payments are extended beyond normal billing terms, or at acceptance when there is significant acceptance, technology or service risk. Revenue also is recorded over the longest service period in those instances where the software is bundled together with post-delivery services and there is not sufficient evidence of the fair value of each undelivered service element.
Our maintenance and support offerings entitle the customers to receive product upgrades and enhancements on a “when and if available” basis along with technical support, and revenue is recognized ratably over the term of the maintenance and support arrangement. VSOE supporting the fair value of maintenance and support is based on the stated (optional) renewal rates contained in the initial arrangement. VSOE for the maintenance element is dependent upon the software product and the annual maintenance fee is typically 18% to 20% of the software license fee. VSOE supporting the fair value of professional services is based on the standard daily rates charged when those services are sold separately, represented by a substantial portion of transactions falling within a reasonably tight pricing range.
In some software-related multiple-element arrangements, the maintenance or professional services rates are discounted. In these cases, a portion of the software license fee is deferred and recognized as the maintenance or professional services are performed based on VSOE of the services.
80
Table of Contents
Revenue Recognition for Non-Software Multiple-Element Arrangements
We also enter into arrangements with customers that purchase non-software related services. Each element within a non-software multiple-element arrangement is accounted for as a separate unit of accounting provided the delivered services have value to the customer on a standalone basis, and, for an arrangement that includes a general right of return relative to the delivered services, delivery or performance of the undelivered service is considered probable and is substantially controlled by the Company. Where the criteria for a separate unit of accounting are not met, the deliverable is combined with the undelivered element(s) and treated as a single unit of accounting for the purposes of allocation of the arrangement consideration and revenue recognition.
For non-software multiple-element arrangements, the Company allocates revenue to each element based on a selling price hierarchy at the arrangement inception. The selling price for each element is based upon the following selling price hierarchy: VSOE, then third-party evidence (“TPE”), then best estimated selling price (“BESP”). The total arrangement consideration is allocated to each separate unit of accounting for each of the non-software deliverables using the relative selling prices of each unit based on this hierarchy. The Company limits the amount of revenue recognized for delivered elements to an amount that is not contingent upon future delivery of additional products or services or meeting of any specified performance conditions.
To determine the selling price in non-software multiple-element arrangements, the Company establishes VSOE of the selling price using the price charged for a deliverable when sold separately. Where VSOE does not exist, TPE is established by evaluating similar competitor products or services in standalone arrangements with similarly situated customers. If the Company is unable to determine the selling price because VSOE or TPE doesn’t exist, it determines BESP for the purposes of allocating the arrangement consideration. BESP can be determined by considering pricing practices, margin objectives, contractually stated prices, competitive/market conditions and geographies.
In some circumstances, software and non-software deliverables are sold together. In these instances, software elements, which meet separation criteria, can be scoped out from the non-software elements and recognized in accordance with the relevant software guidance.
Goodwill and Trade Name Impairment Tests
Goodwill
We test goodwill for impairment annually, at the reporting unit level, and whenever events or circumstances make it likely that an impairment may have occurred, such as a significant adverse change in the business climate or a decision to sell all or a portion of a reporting unit. We perform our annual goodwill impairment test as of July 1 for each of our reporting units and monitor for interim triggering events on an ongoing basis.
Goodwill is reviewed for impairment utilizing a qualitative assessment or a two-step quantitative process. If we choose to perform a qualitative assessment and determine the fair value more likely than not exceeds the carrying value, no further evaluation is necessary. As allowed, in the 2014 annual assessment, we chose to assess the qualitative factors of our reporting units noting that each had a fair value of goodwill in excess of 20% of its respective carrying value as of the most recent step one quantitative test, which was either as of July 1, 2012 or July 1, 2013.
Examples of qualitative factors that management assessed include the Company’s financial performance, market and competitive factors in the software and services industry, the amount of excess fair value over the carrying value of each reporting unit evident in prior years and other events specific to our reporting units.
We considered factors that would impact the reporting unit fair values as estimated by the market and income approaches used in the last step one test. We reviewed current projections of cash flows and compared these current projections to the projections included in the most recent step one test, and considered the fact that
81
Table of Contents
no new significant competitors entered the marketplace in the industry and that consumer demand for the industry’s products remains relatively constant, if not growing slightly. Also, economic factors over the past year (or two years in the case of units that were last tested quantitatively as of July 1, 2012) did not significantly affect the discount rates used for the valuation of these reporting units. We concluded that events occurring since the last step one test did not have a significant impact on the fair value of each of these reporting units. Therefore, we determined that it was not necessary to perform a quantitative (step one) goodwill impairment test for these reporting units as the fair value of each reporting unit appeared to exceed its respective carrying value.
If a quantitative test is elected or required, in step one of the two-step process, we estimate the fair values of each reporting unit by a combination of (i) estimation of the discounted cash flows of each of the reporting units based on projected earnings in the future (the income approach) and (ii) a comparative analysis of revenue and EBITDA multiples of public companies in similar markets (the market approach). We then compare the estimated fair value to the carrying value. If there is a deficiency (the estimated fair value of a reporting unit is less than the carrying value), a step-two test is required. In step two, the amount of any goodwill impairment is measured by comparing the implied fair value of the reporting unit’s goodwill to the carrying value of goodwill, with any resulting impairment reflected in operations. The implied fair value is determined in the same manner as the amount of goodwill recognized in a business combination.
Estimating the fair value of a reporting unit requires various assumptions including projections of future cash flows, perpetual growth rates and discount rates that reflect the risks associated with achieving those cash flows. The assumptions about future cash flows and growth rates are based on management’s assessment of a number of factors including the reporting unit’s recent performance against budget, performance of the market that the reporting unit serves, as well as industry and general economic data from third-party sources. Discount rate assumptions are based on an assessment of the risk inherent in those future cash flows. Changes to the underlying businesses could affect the future cash flows, which in turn could affect the fair value of the reporting unit. There were no goodwill impairment charges in continuing operations in 2012, 2013 or 2014.
Trade Name
The trade name intangible asset represents the fair value of the SunGard trade name and is an indefinite-lived asset not subject to amortization. We performed an interim impairment test as of March 31, 2014 as a result of the AS Split-Off. The annual impairment test of the SunGard trade name was performed in the third quarter of 2014.
Interim Impairment Test
The AS Split-Off triggered an interim impairment test of the carrying value of the SunGard trade name as of March 31, 2014 due to changes in how the trade name is being used following the AS Split-Off. We utilized an income approach known as the relief-from-royalty method to determine the fair value of the SunGard trade name. Under this method, a royalty rate was applied to SunGard’s projected revenues to determine the annual cash savings attributable to ownership of the trade name. This amount was then tax-effected and discounted to present value to ultimately arrive at the estimated fair value of the trade name.
We developed certain assumptions and estimates related to the calculation of fair value of our trade name. The fair value assumptions and estimates primarily included projections of future revenues, a royalty rate, a tax rate, and a discount rate. The loss of projected AS revenues due to the AS Split-Off had a significant negative impact on the results of the trade name valuation. Based on the results of the impairment test, the fair value of the trade name was determined to be lower than its carrying value and resulted in a $339 million impairment of the trade name as of March 31, 2014.
In connection with the AS Split-Off, SunGard and AS agreed to a two-year royalty-free period for AS’ limited use of a derivative of the trade name, after which it will pay a pre-determined royalty rate based on its
82
Table of Contents
annual revenue for a specified number of years. As of March 31, 2014, we transferred an $8 million “right-to-use” asset representing the value of AS’ limited right to use the “SUNGARD AVAILABILITY SERVICES” trade name during the royalty-free period.
Annual Impairment Test
As of July 1, 2014, we completed our annual impairment test and determined that the fair value of the trade name exceeded its carrying value, resulting in no further impairment of the trade name since the interim test performed as of March 31, 2014. From a sensitivity standpoint, a 50 basis point decrease in the assumed royalty rate would have resulted in an impairment of the trade name asset of approximately $123 million. A 50 basis point increase in the discount rate would result in an impairment of the trade name asset of approximately $24 million (100 basis point increase would result in an impairment of approximately $59 million). Furthermore, to the extent that additional businesses are sold, split-off or otherwise divested in the future, or revenues related to continuing operations decline, the revenue supporting the trade name will decline, which may result in further impairment charges.
See Note 1 to our consolidated financial statements included elsewhere in this prospectus.
Accounting for Income Taxes
The Company is subject to income taxes in the United States and numerous foreign jurisdictions. Significant judgments are required in determining the consolidated provision for income taxes. Income taxes are accounted for under the asset and liability method. Deferred income tax assets and liabilities are calculated based on the future tax consequences attributable to differences between the financial statement carrying amounts of existing assets and liabilities and their respective tax bases using the enacted income tax rates expected to be in effect during the years in which the temporary differences are expected to reverse.
Valuation allowances are recorded to reduce deferred tax assets when it is more likely than not that a tax benefit will not be realized. Significant judgment is required in determining whether a valuation allowance should be recorded against deferred tax assets. In assessing the need for a valuation allowance, we consider all available evidence for each jurisdiction including past operating results, estimates of future taxable income and the feasibility of ongoing tax planning strategies. In the event that we change our determination as to the amount of deferred tax assets that can be realized, we will adjust our valuation allowance with a corresponding impact to income tax expense in the period in which such determination is made.
During the ordinary course of business, there are many transactions and calculations for which the ultimate tax determination is uncertain. As a result, we recognize tax liabilities based on estimates of whether additional taxes and interest might be due. These tax liabilities are recognized when, despite our belief that our tax return positions are supportable, we believe that certain positions may not be fully sustained upon review by tax authorities. We believe that our accruals for tax liabilities are adequate for all years open to examination by taxing authorities based on our assessment of many factors, including past experience and interpretations of the tax law. This assessment relies on estimates and assumptions and may involve a series of complex judgments about future events. To the extent that new information becomes available which causes us to change our judgment regarding the adequacy of existing tax liabilities, such changes to tax liabilities will impact income tax expense in the period in which such determination is made. Judgment is required in assessing and estimating these amounts and differences between the actual outcome of these future tax consequences and our estimates could have a material effect on our consolidated financial results.
The consolidated provision for income taxes will change period-to-period based on nonrecurring events, such as impairments of goodwill and certain intangible assets, the settlement of income tax examinations and changes in tax laws, as well as recurring factors including the geographic mix of income before taxes, the repatriation of earnings from foreign subsidiaries, state and local taxes and the effects of tax planning.
83
Table of Contents
Share-based Awards
We periodically grant share-based equity awards to management and certain key employees to incentivize growth in the Company. The primary type of share-based award is the restricted stock unit (“RSU”). Additionally, we have also granted, on a limited basis, equity-settled stock appreciation rights (“SARS”) and stock options to employees.
Valuation Methodology
A fundamental component in determining the grant-date fair value for all share-based awards is establishing the value of the Company’s stock unit (the “Unit”), which is comprised of 1.3 shares of Class A common stock of SunGard, 0.1444 shares of Class L common stock of SunGard and 0.03807 (0.05 prior to the AS Split-Off) shares of preferred stock of SunGard Capital Corp. II, (the Units, Class A, Class L and preferred stock are collectively referred to as the “Securities”).
Our Securities are not currently publicly traded, and as such, the board of directors periodically reviews and approves the valuation of the Securities. The process for approving the valuation of our Securities includes a thorough review by the Compensation Committee, which then recommends the valuations for approval to the board of directors. Both the Compensation Committee and the board of directors consider a number of factors when recommending and approving valuations, including, but not limited to:
| • | detailed financial information regarding the business, which is regularly provided to and reviewed by the board of directors and the Compensation Committee, including actual results and financial projections used for purposes of the valuation; |
| • | the most recent valuation, obtained from an independent, third-party valuation firm; and |
| • | current economic conditions and market volatility as of the date of approval. |
We have engaged a third-party valuation firm to perform an independent valuation of our Securities on a periodic basis in accordance with the guidance outlined in the Valuation of Privately-Held-Company Equity Securities Issued as Compensation, a practice aid published by the American Institute of Certified Public Accountants. Unit valuations have been determined by computing a weighted-average value of two different valuation approaches, the income approach and the market approach. The income approach quantifies the future cash flow projections that management expects to achieve, which are then discounted to their net present values at an appropriate rate. The market approach is based on the valuations of comparable publicly-traded companies. To derive the value of the different share classes, the probability weighted expected return method is used to allocate the Unit value to the different share classes. These valuations have not incorporated a lack of marketability or minority interest discount into the valuation.
These valuation processes are highly complex and subjective. The factors considered in determining the fair value of the Securities include, but are not limited to:
| • | our historical financial results and estimated trends and projections for our future operating and financial performance; |
| • | the market performance of comparable publicly-traded companies; |
| • | overall economic and industry conditions and outlook; and |
| • | the likelihood of achieving a liquidity event, such as a sale of our Company or an initial public offering, given prevailing market conditions. |
These valuations and estimates will not be necessary after the completion of this offering. Once we are public, we will rely on the public market price to determine the value of our common stock and any related share-based compensation expense.
84
Table of Contents
The historical valuation of our Securities since 2012 is included in the table below. The valuation dates represent the dates our board of directors approved the valuations as discussed above.
| Valuation Date |
Unit Price | Preferred Stock | Class L Common Stock |
Class A Common Stock |
||||||||||||
| February 14, 2012 |
$ | 19.12 | $ | 201.52 | $ | 62.29 | $ | 0.04 | ||||||||
| May 9, 2012 |
$ | 21.43 | $ | 203.34 | $ | 77.07 | $ | 0.10 | ||||||||
| September 12, 2012 |
$ | 19.94 | $ | 210.50 | $ | 65.03 | $ | 0.02 | ||||||||
| November 15, 2012 |
$ | 20.67 | $ | 217.72 | $ | 67.49 | $ | 0.02 | ||||||||
| December 21, 2012(1) |
$ | 16.61 | $ | 147.55 | $ | 63.72 | $ | 0.02 | ||||||||
| April 30, 2013 |
$ | 17.80 | $ | 154.82 | $ | 69.40 | $ | 0.02 | ||||||||
| July 31, 2013 |
$ | 17.30 | $ | 159.21 | $ | 64.48 | $ | 0.02 | ||||||||
| December 12, 2013 |
$ | 17.44 | $ | 163.51 | $ | 64.10 | $ | 0.00 | ||||||||
| February 20, 2014 |
$ | 19.24 | $ | 169.34 | $ | 74.51 | $ | 0.01 | ||||||||
| March 31, 2014(2) |
$ | 18.14 | $ | 175.75 | $ | 79.20 | $ | 0.00 | ||||||||
| July 16, 2014 |
$ | 17.78 | $ | 185.11 | $ | 74.20 | $ | 0.01 | ||||||||
| November 12, 2014 |
$ | 16.94 | $ | 190.09 | $ | 67.09 | $ | 0.01 | ||||||||
| February 19, 2015 |
$ | 20.65 | $ | 199.20 | $ | 90.35 | $ | 0.01 | ||||||||
| (1) | On December 19, 2012, SunGard Capital Corp. II declared a $72.80 per share preferred stock dividend that was paid on December 21, 2012, which reduced the value of a Unit by approximately $3.64. |
| (2) | On March 31, 2014, the AS Split-Off reduced the value of a Unit by $2.10. |
See Note 11 to our consolidated financial statements included elsewhere in this prospectus for further information regarding the actual assumptions used in valuing our equity awards.
Quantitative and Qualitative Disclosures About Market Risk
We do not use derivative financial instruments for trading or speculative purposes. We have invested our available cash in short-term, highly liquid financial instruments, with a substantial portion having initial maturities of three months or less. When necessary, we have borrowed to fund acquisitions.
Interest Rate Risk
At March 31, 2015, we had total debt of $4.67 billion, including $2.46 billion of variable rate debt. We have entered into interest rate swap agreements which fix the interest rates for $900 million of our variable rate debt. Swap agreements expiring in February 2017 with a notional value of $400 million effectively fix our interest rates at 0.69%. Swap agreements expiring in June 2019 with a notional value of $200 million effectively fix our interest rates at 2.06%. Swap agreements expiring in March 2020 with a notional value of $300 million effectively fix our interest rates at 2.27%. Our remaining variable rate debt of $1.56 billion is subject to changes in underlying interest rates, and, accordingly, our interest payments will fluctuate. During the period when all of our interest rate swap agreements are effective, a 1% change in interest rates would result in a change in interest of approximately $16 million per year. Upon the expiration of the $400 million interest rate swap agreements in February 2017, a 1% change in interest rates would result in an incremental change in interest of approximately $4 million, or a total of $20 million. Upon the expiration of the $200 million interest rate swap agreements in June 2019, a 1% change in interest rates would result in an incremental change in interest of approximately $2 million, or a total of $22 million. Upon the expiration of the $300 million interest rate swap agreements in March 2020, a 1% change in interest rates would result in an incremental change in interest of approximately $3 million, or a total of $25 million. See Note 6 to our consolidated financial statements included elsewhere in this prospectus.
85
Table of Contents
Foreign Currency Exchange Rate Risk
During 2014, approximately 39% of our revenue was from customers outside the United States with approximately 64% of this revenue coming from customers located in the United Kingdom, Continental Europe and Canada. Only a portion of the revenue from customers outside the United States is denominated in other currencies, the majority being pound Sterling and Euros. Revenue and expenses of our foreign operations are generally denominated in their respective local currencies. We continue to monitor our exposure to currency exchange rates and we enter into currency hedging transactions from time to time to mitigate certain currency exposures.
86
Table of Contents
Our Company
SunGard is a leading provider of mission-critical software to financial institutions globally. Our solutions automate a wide range of complex business processes across the financial services industry, including those associated with trading, securities operations, administering investment portfolios, accounting for investment assets, and managing risk and compliance requirements. We are the largest provider of industry-specific software by revenue across the segments that we serve, and are differentiated by the breadth of our offerings, leading edge technology, operating scale, deep domain expertise, and global reach. In 2014, we generated $2.8 billion in revenue, 70% of which was recurring, along with attractive operating margins and strong cash flows.
We address a large and growing market opportunity. According to IDC, IT spending in the financial services segments that we serve totaled nearly $190 billion in 2014. Within this market, spending with external vendors was $87 billion in 2014 and is growing faster than internal spending. In particular, spending on third-party software is the fastest growing portion, projected to grow at a 7% annual rate from $35 billion in 2014 to $45 billion by 2018.
We serve a large, global customer base across multiple vertically-focused groups in the financial services industry. We have more than 15,000 customers in more than 100 countries, encompassing some of the largest financial institutions in the world, including:
| • | nearly 90% of the world’s 50 largest banks; |
| • | more than 80% of the world’s 50 largest asset managers; |
| • | the world’s 10 largest private equity firms; and |
| • | more than 80% of the world’s 50 largest insurance companies |
Our solutions are designed to address the needs of a broad range of end users, including asset managers, CFOs and treasurers, traders on the sell-side and buy-side, securities operations managers, fund administrators, risk and compliance officers, plan administrators, and registered investment advisors.
Financial institutions are undergoing rapid and substantial change as they seek to deliver satisfactory shareholder returns in an environment of intensifying regulatory complexity, increasing capital requirements, heightened demand for transparency, and continued competitive pressure. This change places significant and growing demands on our customers’ operations. In response, we believe our customers are increasingly relying on third-party IT providers to help them address these challenges and are also consolidating their spending with trusted partners who have the scale, reach, expertise and innovative technology to handle their specialized business processes. We believe we are well positioned to meet these market needs through our distinctive combination of capabilities, assets, and market position.
Throughout our long history we have established ourselves as a domain expert and a trusted partner to our customers, many of whom we have served for well over a decade. This experience has enabled us to accumulate the significant knowledge and capabilities required to address their greatest needs. As a result, our customers use our software to power many of their most mission-critical business processes. For example, our customers currently rely on us to:
| • | provide trading connectivity via our U.S. transaction network handling trades of more than 35 billion shares per month with a value of more than $1.5 trillion per month; |
| • | provide access to more than 150 global exchanges and trading venues; |
| • | process more than 75% of all global listed futures by value; |
| • | process more than 325 million securities finance accounting transactions per year; and |
| • | provide the underlying fund accounting for more than $28 trillion in assets. |
87
Table of Contents
We cover a comprehensive range of industry verticals that encompass the majority of the financial services industry. Our principal solutions are organized in the following vertically-focused groups:
| • | Asset Management |
| • | Corporate Liquidity and Energy |
| • | Global Trading |
| • | Insurance |
| • | Post-Trade Processing |
| • | Risk and Compliance |
| • | Securities Finance and Processing |
| • | Wealth and Retirement Administration |
The verticals we serve share a core set of activities that frequently require software with common capabilities. Because of our cross-vertical breadth, we have acquired a cumulative set of capabilities and assets that enables us to efficiently create and deliver robust solutions to our clients. For instance, our positions, risk, and operations technology was originally developed for sell-side trading software, but is now also being deployed to meet the needs of alternative asset managers. Similarly, risk capabilities that were developed for firms in the capital markets area are now being leveraged in the asset management vertical.
We have continually augmented and expanded our offerings by developing services that complement our software, expanding our addressable market and creating new growth opportunities. Our services include software as a service (“SaaS”) offerings as well as hosting and application management services delivered from our private cloud. We also provide professional services that help our customers to install, optimize, and integrate our software into their business environment. More recently, we have expanded our offerings to encompass business process as a service (“BPaaS”), which includes utility offerings, where we have the ability to manage and operate customer processes centered around our software.
In addition to our Financial Systems segment, our Public Sector and Education (“PS&E”) segment provides domain specific, mission-critical enterprise resource planning (“ERP”) and administrative software primarily to domestic local and state governments and K-12 learning institutions. PS&E represented 8% of our revenue in 2014.
Our Business Model
SunGard’s business model is founded on software, which is surrounded by services, and generates highly recurring revenue streams with attractive profit margins. We license our software in a number of models, such as:
| • | Traditional Software License and Maintenance offerings – including perpetual and term license models coupled with a recurring maintenance contract. |
| • | Monthly Rental offerings – providing our software on a monthly subscription basis, typically through a long term recurring contract, which provides both license and maintenance terms. |
| • | Software-as-a-Service offerings – our SaaS offerings bundle our license, maintenance and cloud delivery capabilities into a single long term contract, which is typically priced as a service with revenue recognized as services are provided over the contract life. |
We deploy our software either on the customer’s premise or delivered from SunGard’s private cloud. Our private cloud provides customers with a secure and reliable environment, which is designed to meet the special regulatory and performance needs of our financial services customers. It is often enhanced by our application management services, leveraging our expertise to ensure optimal performance.
88
Table of Contents
We surround our software with Professional and BPaaS capabilities to extend our value proposition and expand our addressable market. Our professional services resources are specifically skilled in the implementation and optimization of our software. Our BPaaS offerings provide processing services to our customers based on SunGard software. The combination of our industry and application knowledge, coupled with our customers’ desire to focus on their core competencies, is resulting in continued growth in these offerings, including our recently announced utility offerings.
Our business model is characterized by predictable and recurring revenue, as:
| • | our deeply embedded solutions and long-running contracts for software maintenance, rentals, SaaS, cloud, and BPaaS offerings comprised 70% of our overall revenue stream in 2014; and |
| • | our revenue retention rates were 95% for our recurring revenue in 2014. |
This recurring revenue visibility allows us to proactively manage spending and generate attractive operating profit margins and high cash flow conversion. Our spending efficiency stems from:
| • | our ability to leverage our scale in service delivery, sales, development, and back office administration; |
| • | our global reach which allows us to efficiently sell, implement and support consistent offerings to the established and emerging markets of the world; and |
| • | our use of low cost locations in development, delivery and administration. |
In addition, the ongoing shift of our management system from a distributed model to an integrated, enterprise-wide operating model has enabled us to improve profitability, even as we invest to grow the business.
Our Transformation
In 2011, we embarked on a major transformation program to create a more integrated enterprise, focused primarily on the financial services industry. Led by a new executive leadership team, this effort focused on two core activities: (i) aligning the organization around a new, integrated operating model and (ii) shifting investment priorities to better drive organic growth and serve the evolving needs of our customers.
We also exited non-core business lines representing more than $2 billion of revenues, including the sale of Higher Education in January 2012 ($492 million in 2011 revenue) and the split-off of Availability Services in March 2014 ($1.4 billion in 2013 revenue) and other smaller divestitures. In addition, within our Financial Systems segment, we exited slower growing or low margin business lines representing $203 million in revenues since 2010. We then instituted an enterprise-wide operating model supported by functional leaders from across the industry. We are now a focused company providing vertical-specific software for the financial services industry. In 2014, our Financial Systems segment contributed 92% of revenues as compared to 57% in 2011.
We now operate in a more integrated fashion, respond to market opportunities more quickly, and have centralized many business activities to exploit the full size of our enterprise. We believe these changes allow us to take better advantage of SunGard’s scale, breadth and decades-long, trusted customer relationships across the financial services industry.
Over the same period, the financial services industry has changed significantly. In response to the new regulatory and financial realities, our customers have shifted their IT spending priorities and have been forced to become more streamlined. Consequently, many firms are choosing to focus on their core competencies and are turning to third-party solutions rather than building in-house applications.
In response, SunGard’s business strategy has evolved to meet the new reality. We embarked on an internally-funded organic growth strategy, which involved reallocating investments to our most critical products, creating the integrated solutions that our customers require, and developing new solutions that address their most pressing needs. Further, in an effort to help our customers streamline their businesses, we invested in additional
89
Table of Contents
SaaS and cloud delivery models and selectively built BPaaS offerings that surround our software. These capabilities enable us to take on IT and operations functions previously performed by our customers, which we believe increase our revenue opportunity and drive more value for our customers.
In addition, we enhanced our go-to-market capabilities, allowing us to engage with higher level business leaders in our customers’ organizations. We also added sales resources to enhance our sales capacity, effectiveness and global reach. Finally, we added functional leadership from across the technology industry to bring best-in-class processes to SunGard.
We believe our results validate our strategy and the success of our transformation. Our year-over-year revenue growth rate has improved significantly since 2012 and has accelerated over time as our investments in product development, sales and local delivery capacity have taken hold. Our revenue has now grown in five of the last six quarters and our most recent quarters have been our strongest. At constant currency, our growth rate has been 4% in third quarter 2014, 5% in fourth quarter 2014, and 6% in first quarter 2015. The third quarter 2014 year-over-year comparison excludes the one-time benefit from the sale of a customer bankruptcy claim in third quarter 2013.
Industry Overview and Market Opportunity
The financial services industry is a large and growing market. Taken as a whole, the industry operates at an extraordinary scale, with more than $64 trillion in assets under management, more than 6.1 billion in U.S. average daily volume in shares traded, and approximately $690 trillion in notional OTC assets outstanding. As the industry expands across geographies and asset classes, the scale and complexity of its activities will only continue to grow.
Technology lies at the center of this industry. Automated systems, networks, data and analytics are fundamental to the execution of financial institutions’ business processes, and are increasingly critical due to the market complexity and the regulatory environment.
According to IDC, IT spending in the financial services segments that we serve totaled nearly $190 billion in 2014. Within this market, spending with external vendors was $87 billion in 2014 and is growing faster than internal spending. In particular, spending on third-party software is the fastest growing portion, projected to grow at a 7% annual rate from $35 billion in 2014 to $45 billion by 2018. We believe this shift in spending represents a growing opportunity for market leaders that can comprehensively address the continually expanding needs of their customers.
Within this context, there are a number of interrelated macroeconomic trends shaping the industry. We believe these trends will create further demand for our solutions and enhance our competitive differentiation, given our unique combination of market leading software, deep domain expertise, and comprehensive service offerings. Specifically:
Increasing Regulatory and Compliance Burden. The financial services industry continues to be impacted by complex, changing and often inconsistent regulations from numerous regulatory bodies. New regulations (e.g. Dodd-Frank, Basel Accord, EMIR, Form PF, etc.) are demanding even higher capital requirements, greater transparency and risk management, and increased disclosure, reporting and compliance. The impact is far ranging, not only affecting large banks but also regional banks, asset managers, insurance companies, hedge funds, and private equity firms. To manage this complex and fractious environment, firms are increasingly turning to solution providers that have the scale and domain expertise to efficiently address these new regulatory rules, which would be very difficult and costly for a firm to otherwise address on its own.
The Proliferation of Electronic Financial Markets. The infrastructure of the financial markets is becoming increasingly automated. Many products that were once traded over-the-counter, such as interest rate swaps and credit default swaps, are now moving to electronic processing or trading venues. Increased regulation,
90
Table of Contents
the need for better transparency, faster clearing and settlement, and better risk management are all demanding improved processes and greater automation. These same forces are also resulting in increased demand for integration across systems, functions, and the front-, middle-, and back-office. As the industry becomes increasingly automated, we believe that technology providers will be well positioned to benefit.
Increasing Importance of Buy-Side in Financial Markets. The demanding regulatory and compliance environment for sell-side financial institutions has helped drive asset managers, hedge funds, and private equity firms to assume a more prominent role in the global financial markets, including more actively engaging in traditional sell-side activities such as trading and market making. As a result of this, there has been a rise in spending on technology solutions across this vertical. We believe that this will greatly benefit technology providers with the industry expertise and comprehensive offerings needed to successfully operate in this new environment.
Emerging Markets Growth. Emerging markets continue to exhibit strong growth as regional firms develop and expand, while multi-national firms are concurrently looking to move into these markets in pursuit of new growth. This trend is driving spending on financial technology in these markets. Local firms, unburdened by legacy offerings and with a wide range of needs, are frequently looking to technology providers that have global reach, a comprehensive set of solutions, and a full set of software and service capabilities that will help them expand on an accelerated basis. Moreover, multi-nationals often seek global partners that can help them operate locally while managing globally.
Streamlining and Focusing the Enterprise. In today’s environment, financial institutions must reevaluate their operating models as they seek to address the growing body of regulatory requirements, while simultaneously better managing their expenses. We believe a key focus is to reduce internal spending in order to focus on areas that can provide competitive differentiation. Where firms once deployed many in-house solutions across all aspects of the enterprise, they are now increasingly looking to externally sourced software to reduce costs, streamline their enterprise, and improve speed-to-market. As part of this effort, we expect firms to continue to embrace less resource-intensive delivery models (including SaaS, cloud, and BPaaS) and seek to standardize around market leading solutions, in recognition of a regulatory environment that increasingly values conformity.
Consolidating Vendor Relationships. We believe financial institutions are consolidating their supplier relationships with a smaller number of trusted partners that can provide holistic, global solutions. Software providers are no longer expected to provide just individual point solutions, but rather integrated solutions that have broad capabilities, a comprehensive set of delivery models, and global reach and scale. In addition, we believe large, stable enterprises will be better suited to address the extensive procurement processes and rigorous screening criteria that financial institutions place on third-party vendors in today’s more tightly regulated world.
Our Solutions
SunGard provides a robust solutions set across a large portion of the global financial services market, spanning buy-side to sell-side firms to corporates and energy companies. The breadth and depth of our offerings support our customers’ mission-critical processes around the world.
The foundation of our capabilities is our proprietary, leading edge software which we continually enhance as technology and our customers’ requirements change. Our solutions are grounded in a core set of competencies that are shared across the verticals we serve, enabling us to leverage our cumulative knowledge and capabilities across the broader financial services industry. These competencies include:
| • | Record-Keeping and Investment Accounting Functions. At the heart of many of our solutions is the requirement to value and account for investment assets. Many of our solutions such as InvestOne and Investran perform investment accounting activities calculating asset prices and portfolio values that form the books and records for institutions including asset managers, third-party administrators, private |
91
Table of Contents
| equity firms, hedge funds, global banks, and trusts. The output from our solutions are often fundamental input into other systems such as risk and compliance, analytics, performance management, and accounting/general ledger applications. |
| • | Risk Measurement and Management. In today’s business environment, effective risk management is now a primary focus at many financial institutions. Our solutions enable customers to better manage risk along a variety of dimensions (e.g., investment risk, trading risk, banking risk, portfolio risk) and meet the changing regulatory demands across their global organizations. SunGard solutions like Adaptiv (in banking) or Prophet (in insurance) perform these mission-critical tasks. |
| • | Trade Enablement. SunGard’s comprehensive trade and connectivity solutions cover virtually every stage of the trading life cycle, including order management, electronic execution and order routing, connectivity to global trading venues, and pre- and post-trade risk and compliance. For example, SunGard’s Front Arena solution integrates all of this functionality onto a single, multi-asset class trading platform that continually evaluates the impact of trades on the risk and performance of an existing portfolio. Our robust and reliable global trading network addresses challenges with trade flow management, access to new markets, efficiency of data flows, and the sale of new products. These solutions are widely used by companies across the buy-side and sell-side, including asset managers, broker-dealers, banks, energy companies, and insurers. |
| • | Regulatory Reporting and Compliance. We provide solutions which enable our customers to effectively meet the demands of the ever-changing global regulatory environment. We help ensure our customers’ compliance practices are current and increase their regulatory transparency, even while improving their operational efficiency. For example, SunGard’s Ambit Capital Management solution provides banks with an out-of-the-box compliance and reporting solution, helping them manage a wide range of tasks including stress testing, regulatory credit risk management, limit-setting and developing risk mitigation strategies. |
| • | Securities, Futures, and Transactions Processing. With capital markets becoming more multi-faceted, financial institutions increasingly need to be able to process any asset in any currency, while simultaneously managing growing volumes against on-going cost pressures. SunGard’s suite of global post-trade processing solutions helps financial services firms in the securities and derivatives markets efficiently manage their middle- and back-office processes and workflow. Our solutions help firms around the world increase performance and quality, while reducing operational complexity, risk and cost. |
We go to market with our solutions in our Financial Systems segment through a series of vertically-focused groups. These groups are organized around common customers and a core set of related products and solutions. Our groups are as follows:
| • | Asset Management. These solutions help institutional investors, hedge funds, private equity firms, fund administrators and securities transfer agents improve both investment decision-making and operational efficiency, while managing risk and increasing transparency. Our solutions support every stage of the investment process, from research and portfolio management, to valuation, risk management, compliance, investment accounting, recordkeeping, transfer agency and customer reporting. For example, our InvestOne investment accounting and reporting system is used by institutions managing more than $28 trillion in investment assets. In addition, SunGard’s Investran software is one of the leading private equity solutions in the marketplace. It is used by our customers to manage the entire private equity investment life cycle including investment accounting, relationship management, investment tracking and performance, and reporting. |
| • | Corporate Liquidity and Energy. We provide software that helps chief financial officers, treasurers, energy companies and hedge funds track and manage their risk, liquidity, and inventory. Our solutions span treasury, global cash management, receivables, payments, energy trading and operations. SunGard’s AvantGard suite of solutions improves monitoring, analysis, and collections of trade |
92
Table of Contents
| receivables, provides for sophisticated treasury and cash management and enables coordinated execution of payment processing with SWIFT connectivity. More than 2,250 organizations and more than 50,000 professionals in 40 countries rely on AvantGard. In addition, SunGard’s Aligne for energy trading, risk and operations is relied on by more than 75 energy companies. |
| • | Global Trading. These solutions include trading software, network and data services, order and position management, trade execution and related products and services across a variety of asset classes to brokerage/trading operations, asset managers, trusts and banks, corporations, custodians, and central banks. SunGard’s suite of multi-asset trading solutions and global trading network link more than 2,100 buy-side firms and more than 500 sell-side firms to 150 trading venues worldwide. |
| • | Insurance. Our insurance offerings provide solutions for a variety of insurance lines, including life and health, annuities and pensions, property and casualty and reinsurance. Our software and services help support front office and back office functions including actuarial risk calculations, policy administration, and financial and investment accounting and reporting. For example, our Prophet solution for insurance risk management is relied on by insurers and financial institutions globally and in 2014 more than 9,000 users across more than 730 locations in more than 65 countries relied on it daily. |
| • | Post-Trade Processing. We provide back-office software and services for post-trade derivatives and post-trade securities processing. SunGard’s Stream GMI is the leading global back-office processing system for listed and cleared OTC derivatives, providing clearing and accounting for global top-tier futures commission merchants (“FCMs”), investment banks, regional brokers and proprietary traders. Stream GMI links to more than 150 cleared derivatives markets in more than 35 countries. |
| • | Risk and Compliance. Our software helps monitor and manage multiple risk types, including banking book risk, trading book risk, commodities risk, compliance, and tax reporting. The breadth of our risk and compliance offerings can be demonstrated by our Adaptiv and Protegent solutions. SunGard’s Adaptiv handles trading book risk that covers credit limits, credit risk and market risk in a single solution to enable banks to manage counterparty and asset class exposure in a real-time consolidated view. Our Protegent solution enables customers to perform trade surveillance, insider trading detection, stock market manipulation analysis, and personal trading monitoring, and institutional trade review. |
| • | Securities Finance and Processing. We provide the leading books and records software solutions for the securities finance industry globally, complemented by subscription-based community services solutions, data and analytics offerings, and collateral management services. In addition, we also provide a cloud-based order-to-settlement securities processing solution. In North America, for example, SunGard’s Loanet is a market leading securities finance product offering trading, position management, operations, accounting, settlement, transaction analytics, regulatory compliance and trade automation services. SunGard’s XSP offering provides a complete end-to-end solution suite that automates the corporate actions process, from cleansing and standardizing data and providing firms a global, “golden copy” data set to be used by downstream systems. |
| • | Wealth and Retirement Administration. We provide software that enables banks, trust companies, brokerage firms, benefit administrators and independent investment advisors acquire, service, and grow their client relationships. We provide solutions for client acquisition, transaction management, trust accounting, and recordkeeping that can be deployed as stand-alone products or as part of an integrated wealth management platform. SunGard’s scale in the retirement industry is demonstrated by the 250,000 retirement plans we process and more than $2.6 trillion in assets and more than 44 million participants that are administered on our retirement systems. |
In addition to our primary Financial Systems segment, our Public Sector and Education segment serves customers that rely on us to provide innovative and mission-critical software and technology to address their most important enterprise resource planning (“ERP”) and administrative processes. In PS&E, our offerings are designed to meet the specialized needs of local and state governments, public safety and justice agencies, and K-
93
Table of Contents
12 educational institutions. These ERP offerings support a range of specialized functions such as accounting, human resources, emergency dispatch operations, the operation of courts and jails, and K-12 student information systems.
Our Competitive Strengths
We have established our leading market position through a number of key competitive strengths:
Market and Technological Leadership. We are the largest provider of industry-specific software by revenue across the segments that we serve, which include the vast majority of the world’s leading financial institutions. Our solutions address some of the most complex and challenging processes in the industry. Because of the depth of our customer relationships, our recognized technological leadership, and our established incumbency we believe that we are well positioned in the industry.
Our innovative and market-leading technology is the foundation of our attractive market position. We continue to enhance our technology, increasing our investments in the areas of greatest importance to our customers, such as advanced user interfaces, business intelligence, risk analytics, cloud deployment, and design of integrated, holistic solutions. As a result, we have become the solutions provider of choice across many of our served verticals, including:
| • | post-trade derivatives processing, where all of the top-15 FCMs utilize one or more of our solutions; |
| • | private equity, where the world’s 10 largest private equity firms use one or more of our solutions; and |
| • | securities finance, where more than 100 firms rely on our Loanet solution and related services. Accordingly, we believe that our solution handles the majority of all securities finance contract volumes in North America |
Industry Focus and Deep Domain Expertise. The financial services industry is a complex, dynamic, and highly regulated market. Our customers are sophisticated buyers with demanding and continually changing requirements. They are seeking providers that know and understand their environment. Our focus on the financial services industry and our decades of experience have enabled us to accumulate the knowledge and breadth of capabilities needed to serve this demanding market. Customers turn to us as a reliable partner with the deep domain expertise and solutions needed to address their varied business challenges, from replacing an existing application, meeting the requirements of a new regulatory change, to developing a new method for managing risk.
Deeply Embedded and Mission-Critical Platforms. Many of SunGard’s solutions perform mission-critical activities that are central to our customers’ core operational workflows. Our solutions are often specifically tailored to our customers’ environment and particular needs, resulting in a deep level of integration. We believe this not only enhances the capabilities and performance for the customer, but makes it difficult to replicate our solutions without significant time and cost. As a result, we experienced high retention rates of 95% for our recurring revenues in 2014.
Comprehensive Solution Portfolio. We believe customers are consolidating their vendor relationships, and are seeking trusted partners who can deliver integrated solutions that comprehensively address their needs across the front-, mid- and back-office. With our broad set of market-leading solutions, SunGard is well suited to provide a significant portion of our customers’ technology requirements.
Additionally, we are able to surround our solutions with value-added services, including global delivery centers, professional implementation and optimization services, as well as BPaaS offerings. Finally, our recently announced utility underscores the financial institutions’ need for structural cost reduction. Given we are the market leader in many segments and often provide the industry standard technology, we are viewed by customers as the natural provider for these market platforms.
94
Table of Contents
Global Scale and Reach. SunGard has the global scale and reach to sell, deploy, deliver and support its software across the world. We serve customers in more than 100 countries, supported by 13,000 employees operating out of offices in every major geographic region, including approximately 500 global quota carrying salespeople and more than 4,700 development staff. Of the $2.8 billion in revenue that we generated in 2014, approximately 36% was generated outside of North America, including the faster-growing emerging markets.
Our Growth Strategy
As the leading provider of industry-specific software across the segments of the financial services industry that we serve, we believe we are well positioned to capitalize on the major market trends. The key elements of our growth strategy include:
Leverage and Enhance our Software. Over the past three years, we have invested $1.3 billion in global development across our Company to enhance and differentiate our proprietary software. We are investing in areas where we see increased customer demand and are continuing to develop innovative software and integrated solutions. We expect this to increase our sales to new and existing customers and to improve our already-strong customer retention.
Increase Penetration as Customers Consolidate Spending. We believe the breadth of our products and services positions us well as financial institutions seek to consolidate their vendor relationships. Our existing customer footprint along with specific initiatives such as our major account program will help us sell our range of solutions and services offerings that we believe is unmatched by any other provider across the markets that we serve.
Expand Breadth of Services Offerings. By surrounding our software with services, we believe we provide more value to our customers, deepen our customer relationships, expand our addressable market, and accelerate growth. The underlying market trends support this shift, with customers increasingly demanding higher levels of service in implementing, optimizing, maintaining, and operating our solutions. We maintain well established, recurring, and growing SaaS and cloud offerings. We plan to continue to expand these capabilities and selectively add BPaaS solutions, linked to our software, across the vertically-focused groups we serve. For example, we recently announced an industry utility for post-trade derivatives to help firms respond to cost pressures through sustainable efficiency improvements and operational standardization.
Enhance Salesforce Effectiveness. We believe our award winning salesforce is a particularly valuable asset in driving the growth of our company. We have instituted a selective and deliberate strategy to increase our sales capacity around the globe and expect our growth to continue as this strategy takes hold. In addition, we are investing to integrate our salesforce, implementing best practices across the enterprise, deploying more sales training, and establishing leading sales operations systems and processes.
Focus on Emerging Markets. Emerging markets continue to grow strongly and SunGard’s global sales and operational footprint, extensive solution portfolio, and strong market position enables us to target this growth. Our emerging markets revenue has grown significantly faster than our established markets revenue and in 2014 represented $330 million of our total revenue. We intend to further expand into new geographies and allocate sales and delivery resources to key geographic markets such as emerging Asia, Latin America, Middle East, and Africa.
Product Development and Maintenance
Our global technology staff continually develops new products and enhances existing products to address the changing needs of our customers. We employ more than 4,700 development staff in a network of global development sites. Our ability to attract, motivate and retain these development resources is a key differentiator
95
Table of Contents
for us and ultimately a source of our organic growth. We direct our development resources to develop the technologies that we believe are most important to our customers, including such things as:
| • | advanced user interfaces, increasingly based on HTML5 technology for browsers, tablets and mobile devices; |
| • | business intelligence and data analytics, leveraging the large volume of data available to us and providing our customers with the tools to improve their business, speed decision making and gain competitive advantage; |
| • | advanced proprietary risk and compliance engines; and |
| • | integration of cloud-based architectures into our products. |
We are increasing our investment in these technologies in response to customer demand, and these investments further drive growth both domestically and internationally. Over the past three years, we have invested $1.3 billion in global development across our Company.
Sales and Marketing
We operate a global sales and distribution network, largely through a direct sales approach. Our sales team is comprised of direct quota-carrying sales professionals who are teamed with pre- and post-sales support to help ensure that our customers receive the best possible solutions for their business needs. Each member of our sales organization goes through intensive training on SunGard’s products and services, which is designed to make them highly effective in diagnosing our customers’ needs and prescribing the appropriate SunGard solutions. We track the progress of our sales efforts on a frequent and consistent basis using a variety of key metrics, allowing us to adjust our approach as the need arises.
Our solutions are generally sold on a global basis, with certain products adapted to specific geographic markets. The majority of our revenue is sourced from North America and Western Europe. Contributions from the emerging markets have been strong and grown consistently for the last several years, which we believe is due to our world-class solutions and continued investment in the reach of our global sales team. Our emerging markets include China, India, Southeast Asia, Middle East, Africa, Latin America and Eastern Europe.
Brand and Intellectual Property
To protect our proprietary services and software, we rely upon a combination of copyright, patent, trademark and trade secret law, confidentiality restrictions in contracts with employees, customers and others, software security measures, and registered copyrights and patents. We also have established policies requiring our personnel and representatives to maintain the confidentiality of our proprietary property. We have a number of patents and patent applications pending as well as a few registrations of our copyrights. We plan to continue to apply for software and business method patents on a case-by-case basis and will monitor ongoing developments in the evolving software and business method patent field. See “Risk Factors—Risks Related to Our Business—If we are unable to protect our proprietary technologies and defend infringement claims, we could lose one of our competitive advantages and our business could be adversely affected.”
We own registered trademarks for the SunGard name and own or have applied for trademark registrations for many of our services and software products. Following the AS Split-Off, AS has the right to use the Sungard Availability Services name, which does not include the right to use the SunGard name or its derivatives.
Competition
The markets for our services and products continue to evolve and are intensely competitive. We compete with numerous companies that provide similar services and products, including point solutions to address specific customers’ needs. Nonetheless, because of the breadth and highly technical nature of our solutions, most
96
Table of Contents
of the areas in which we compete have a relatively small number of significant competitors. While many of these companies can compete in a particular vertically-focused market, we believe that none of them has the ability to compete against the entire spectrum of SunGard’s solutions. In addition, few companies have the global reach that SunGard provides. As our customers seek to consolidate their vendor relationships, we believe that the comprehensiveness of our offerings and our global reach increasingly differentiate us from the providers of point solutions that we may compete with.
We also face competition from the internal IT resources of our customers and prospects. However, increased regulation is driving customers to use industry proven solutions such as those offered by SunGard. We believe that we compete effectively through our innovative solutions, dedicated resources, quality of service and breadth of offerings. In addition, we believe that our leadership, reputation and experience are important competitive advantages.
Employees
As of December 31, 2014, we had approximately 13,000 employees. Our success depends partly on our continuing ability to retain and attract skilled technical, sales and management personnel. While skilled personnel are in high demand and competition exists for their talents, we have been able to retain and attract highly qualified personnel. See “Risk Factors—Risks Related to Our Business—If we are unable to retain or attract customers, our business and financial results will be adversely affected.”
Properties
We lease, and in some cases own, space in many locations worldwide, primarily for data centers, sales offices, customer support offices and administrative offices. We also own some of our computer and office facilities. Our principal facilities are located in Voorhees, New Jersey; Hopkins, Minnesota; Salem, New Hampshire; Ridgefield, New Jersey; and Wayne, Pennsylvania. We believe that our leased and owned facilities are adequate for our present operations.
Legal Proceedings
We are party to certain legal actions arising from the ordinary course of business activities. While the ultimate results of claims and litigation cannot be predicted with certainty, management expects that the ultimate resolution of all current pending or threatened claims and litigation will not have a material effect on our consolidated results of operations, financial position or liquidity.
97
Table of Contents
Below is a list of our directors and executive officers and their respective ages and positions and a brief account of the business experience of each of them.
| Name |
Age | Position | ||||
| Executive Officers |
||||||
| Christopher P. Breakiron |
49 | Vice President and Chief Accounting Officer | ||||
| Marianne C. Brown |
56 | Chief Operating Officer, Financial Systems | ||||
| Patricia K. Cassidy |
49 | Senior Vice President—Human Resources and Chief Human Resources Officer | ||||
| Vincent R. Coppola |
58 | Senior Vice President, Global Business Services and Technology | ||||
| Russell P. Fradin |
59 | President, Chief Executive Officer and Director | ||||
| Kevin J. McCurry |
48 | Senior Vice President—Corporate Development and Strategy | ||||
| Charles J. Neral |
56 | Senior Vice President—Finance and Chief Financial Officer | ||||
| Victoria E. Silbey |
51 | Senior Vice President—Legal and Chief Legal Officer | ||||
| Brian A. Traquair |
58 | Executive Vice President, Financial Systems | ||||
| Directors |
||||||
| Glenn H. Hutchins |
59 | Chairman of the Board of Directors | ||||
| David L. Johnson |
61 | Director | ||||
| Ian K. Loring |
49 | Director | ||||
| John W. Marren |
52 | Director | ||||
| Sanjeev K. Mehra |
56 | Director | ||||
| R. Davis Noell |
36 | Director | ||||
| John I. Park |
32 | Director | ||||
Christopher P. Breakiron has been Vice President and Chief Accounting Officer since February 2014. From 2008 to 2013, Mr. Breakiron was Senior Vice President and Chief Accounting Officer of Lender Processing Services, Inc., a leading provider of mortgage processing services, settlement services, mortgage performance analytics and outsourcing services for financial institutions, mortgage companies and real estate professionals. From 2006 to 2008, Mr. Breakiron served as Senior Vice President of Financial Planning and Analysis for Fidelity National Information Services, a global provider of technology solutions, processing services and information-based services to the financial services industry. Before that, Mr. Breakiron worked as Senior Vice President and Controller of International Card Services for Certegy, Inc., a global payment services provider.
Marianne C. Brown has been Chief Operating Officer, Financial Systems since February 2014. Prior to joining SunGard, she was president and CEO of Omgeo LLC, a global financial services technology company, from 2006 to February 2014, and before that, from 2005 to 2006, she was the CEO of the Securities Industry Automation Corporation (SIAC), a subsidiary of the NYSE Euronext Group. From 1978 to 2005, Ms. Brown held positions of increasing responsibility in various areas at Automatic Data Processing, Inc. (ADP), a provider of benefits and payroll processing services, culminating in her role as general manager of ADP’s Brokerage Processing Services business, which was subsequently spun off to become Broadridge Financial Solutions. Ms. Brown currently serves on the board of directors of Northrop Grumman Corporation.
Patricia K. Cassidy became Senior Vice President and Chief Human Resources Officer in February 2015 and was Division Vice President, North America Financial Systems from 2007 to 2015 and the global head of Human Resources for the Capital Markets organization from 2011 to 2015. From 2005 to 2007, Ms. Cassidy held various human resources positions with us. Prior to joining SunGard, from 1995 to 2005, Ms. Cassidy held human resources roles of increasing responsibility for DecisionOne Corporation (previously Bell Atlantic Business System Services), including vice president of Human Resources from 2003 to 2005.
98
Table of Contents
Vincent R. Coppola has been Senior Vice President, Global Business Services and Technology since 2011 and Senior Vice President—Operations, Financial Systems from August to December 2011. Prior to joining SunGard, Mr. Coppola held senior positions at Hewitt Associates, a global provider of human resources consulting and outsourcing solutions, including as Global Chief Operating Officer, Consulting during 2010, and as Senior Vice President—Global Business Services & Technology from 2008 to 2010. From 1983 to 2007, he held various senior positions with Automatic Data Processing, Inc., a provider of benefits and payroll processing services.
Russell P. Fradin has been Chief Executive Officer, President and a director since 2011. From 2010 to 2011, Mr. Fradin was Chairman and Chief Executive Officer of Aon Hewitt, a global provider of human resources consulting and outsourcing solutions and a business unit of Aon Corporation, and from 2006 to 2010, Mr. Fradin was chief executive officer of Hewitt Associates and oversaw its successful merger with Aon Corporation in September 2010. Prior to his time with Hewitt, Mr. Fradin was President and Chief Executive Officer from 2004 to 2006 of The BISYS Group, Inc., a provider of outsourcing solutions for the financial services sector, and from 1997 to 2004 he held various senior executive positions with Automatic Data Processing, Inc., a provider of benefits and payroll processing services. Mr. Fradin currently serves on the board of directors of Best Buy Co., Inc. and previously served from 2007 until July 2011 on the board of directors of Gartner Inc., a technology research firm.
Kevin J. McCurry has been Senior Vice President—Corporate Development and Strategy since January 2014. Prior to joining SunGard, from 2012 to January 2014, he was Senior Vice President, Corporate Development at Bertelsmann, a global media company. From 2005 to 2012, Mr. McCurry held various executive strategy roles of increasing responsibility, including head of strategy for the Scientific Business unit and Chief Strategy Officer for the Healthcare & Science business, at Thomson Reuters Corporation, a global business and professional information company.
Charles J. Neral has been Senior Vice President—Finance and Chief Financial Officer since 2012. Prior to joining SunGard, from 2009 to 2012, Mr. Neral served as Senior Vice President & Chief Financial Officer at SafeNet, Inc., a cyber-security company. From 1981 to 2009 he served in a variety of roles at International Business Machines Corporation, including financial roles in IBM’s Sales, Server and Global Services organizations, and in executive roles in Asia Pacific and at IBM headquarters. From 2004 to 2009, Mr. Neral served as the Vice President, Finance for IBM’s worldwide software business.
Victoria E. Silbey has been Senior Vice President—Legal since 2006, Chief Legal Officer since 2011, General Counsel from 2006 to 2011 and Vice President—Legal and General Counsel from 2005 to 2006. From 1997 to 2005, Ms. Silbey held various legal positions with us, including Vice President—Legal and Assistant General Counsel from 2004 to 2005. From 1991 to 1997, she was a lawyer with Morgan, Lewis & Bockius LLP. Ms. Silbey is a director and officer of most of our domestic and foreign subsidiaries.
Brian A. Traquair has been Executive Vice President, Financial Systems since January 2014, President, Capital Markets Group from 2012 to January 2014, President, Capital Markets and Investment Banking from 2007 to 2011 and President, Securities Finance from 2001 to 2007. Mr. Traquair was in a management position at Loanet Holdings, Inc., a company we acquired in 2001.
Glenn H. Hutchins has been Chairman of the Boards of Directors since 2005. Mr. Hutchins is a co-founder of Silver Lake, a technology investment firm that was established in 1999, was Co-Chief Executive Officer until 2011 and was Managing Director from 1999 to 2012. Mr. Hutchins is also a director of the Federal Reserve Bank of New York, Vice Chairman of the Brookings Institution and a Director of the Harvard Management Company, which is responsible for the University’s endowment. Previously, Mr. Hutchins served as a Special Advisor to the White House on economic and health-care policy from 1993 to 1994 and as Senior Advisor on the Administration transition from 1992 to 1993. Mr. Hutchins serves on the board of directors of AT&T Inc. and Nasdaq OMX Group, Inc.
99
Table of Contents
David L. Johnson has been a director since May 22, 2014. Mr. Johnson is a Senior Managing Director in the Private Equity Group of The Blackstone Group, which he joined in 2013. Before joining Blackstone, Mr. Johnson was Senior Vice President of Strategy at Dell Corporation from 2009 to 2013, where he was responsible for corporate strategy, corporate development and acquisition integration. From 1981 to 2009, Mr. Johnson held a number of positions, including Vice President of Corporate Development, at International Business Machines Corporation. Mr. Johnson currently serves on the board of directors of Accuvant, Inc. and Pactera Technology International Ltd.
Ian K. Loring has been a director since July 2014. Mr. Loring joined Bain Capital Partners LLC in 1996. He was promoted to Managing Director in 2000. Prior to joining Bain Capital Partners, Mr. Loring was a Vice President at Berkshire Partners LLC, where he worked in the specialty manufacturing, technology, and retail industries. Previously, Mr. Loring worked in the Corporate Finance department at Drexel Burnham Lambert Incorporated. Mr. Loring currently serves on the boards of directors of BMC Software, Inc., iHeartMedia, Inc, The Weather Channel, NXP Semiconductors N.V., Denon & Marantz and Viewpoint. Mr. Loring previously served as a member of the boards of directors of Warner Music Group Corp. and SMTC Corporation.
John W. Marren has been a director since 2005. Mr. Marren joined TPG Capital, L.P., a private equity firm, in 2000 as a partner and co-leads the firm’s technology team. From 1996 to 2000, he was a Managing Director at Morgan Stanley Dean Witter. From 1992 to 1996, he was a Managing Director and Senior Semiconductor Research Analyst at Alex Brown & Sons., Inc. Mr. Marren currently serves on the boards of directors of Avaya Inc. and Freescale Semiconductor Inc. and previously served on the boards of directors of Alltel Corporation, Conexant Systems Inc., MEMC Electronic Materials, Inc. and ON Semiconductor Corporation.
Sanjeev K. Mehra has been a director since 2005. Mr. Mehra serves as vice chairman of the global private equity business and has been a partner of Goldman, Sachs & Co. since 1998 and a Managing Director of Goldman, Sachs & Co.’s Principal Investment Area of its Merchant Banking Division since 1996. He currently serves on the boards of directors of ARAMARK Corporation, Interline Brands Inc., Max India Limited, Neovia Logistics Holding, Ltd., Sigma Electric and TVS Logistics Services Limited, and previously served on the board of directors of Burger King Holdings, Inc., First Aviation Services, Inc., Hawker Beechcraft, Inc, and KAR Auction Services, Inc.
R. Davis Noell has been a director since 2012. Mr. Noell is a Managing Director of Providence Equity L.L.C., an affiliate of the Providence Equity Funds. Prior to joining Providence in 2003, Mr. Noell was an analyst in Deutsche Bank’s media investment banking group. Mr. Noell currently serves on the boards of directors of Altegrity Inc., The Chernin Group, LLC, and World Triathlon Corporation, and previously served on the board of directors of eTelecare Global Solutions, Inc., GLM LLC and Stream Global Services, Inc.
John I. Park has been a director since March 31, 2014. Mr. Park joined KKR & Co. L.P. in 2013 and is a member of the Technology Industry team. Prior to joining KKR, Mr. Park was with Apax Partners, a private equity investment group, from 2006 to 2013, where he focused on investments in technology, and before then he was a member of the mergers & acquisitions practice at Morgan Stanley from 2004 to 2006. Mr. Park currently serves on the board of directors of GoDaddy Inc.
There are no family relationships among any of the Company’s directors and executive officers.
100
Table of Contents
Composition of the Board of Directors
Our business and affairs are managed under the direction of our board of directors. Following the completion of this offering, we expect our board of directors to initially consist of directors, of whom will be independent. As of the completion of this offering, our Certificate of Incorporation and Bylaws will provide for a classified board of directors consisting of three classes of directors, each serving staggered three-year terms, as follows:
| • | Our Class I directors will be , and their terms will expire at the annual meeting of stockholders to be held in . |
| • | Our Class II directors will be , and their terms will expire at the annual meeting of stockholders to be held in . |
| • | Our Class III directors will be , and , and their terms will expire at the annual meeting of stockholders to be held in . |
Upon expiration of the term of a class of directors, directors for that class will be elected for three-year terms at the annual meeting of stockholders in the year in which that term expires. Each director’s term continues until the election and qualification of his or her successor or his or her earlier death, resignation or removal. Any increase or decrease in the number of directors will be distributed among the three classes so that, as nearly as possible, each class will consist of one-third of the directors. This classification of our board of directors may have the effect of delaying or preventing changes in control of our Company.
In addition, we intend to amend our Stockholders Agreement with affiliates of our Sponsors in connection with this offering. The Stockholders Agreement will grant affiliates of our Sponsors the right to designate nominees to our board of directors subject to the maintenance of certain ownership requirements in us. See “Certain Relationships and Related Party Transactions—Other Shareholder Agreements” for additional information.
Background and Experience of Directors
When considering whether directors and nominees have the experience, qualifications, attributes or skills, taken as a whole, to enable our board of directors to satisfy its oversight responsibilities effectively in light of our business and structure, the board of directors focused primarily on each person’s background and experience as reflected in the information discussed in each of the directors’ individual biographies set forth above. We believe that our directors provide an appropriate mix of experience and skills relevant to the size and nature of our business. In particular, the members of our board of directors considered the following important characteristics, among others:
| • | Mr. Hutchins, Chairman of the board of directors and a representative appointed by Silver Lake, which he co-founded, has deep experience in leadership positions, having previously served as a Special Advisor to the White House on economic health-care policy. He also currently serves as a director of the Federal Reserve Bank of New York, AT&T and Nasdaq OMX. |
| • | Mr. Fradin, our Chief Executive Officer and President, has significant experience in senior executive positions, having previously served as Chairman and Chief Executive Officer Aon Hewitt and as President and Chief Executive Officer of BISYS Group, Inc. He currently serves on the board of directors of Best Buy Co., Inc. |
| • | Mr. Johnson is a representative appointed by The Blackstone Group, and has significant financial, investment and operational experience from his involvement in Blackstone’s investment in numerous portfolio companies. He previously served as Senior Vice President of Strategy at Dell Corporation and currently serves on the board of directors of Accuvant, Inc. and Pactera Technology International Ltd. |
| • | Mr. Loring is a representative appointed by Bain Capital Partners, and has extensive business and leadership experience from his involvement in Bain Capital’s investment in numerous portfolio |
101
Table of Contents
| companies. He previously served as Vice President of Berkshire Partners and currently serves on the boards of directors of BMC Software, iHeartMedia, Inc, The Weather Channel, NXP Semiconductors N.V., Denon & Marantz and Viewpoint. |
| • | Mr. Marren is a representative appointed by TPG Capital, and has deep experience in the technology industry from his involvement in TPG’s investment in numerous portfolio companies. He previously served as a Managing Director at Morgan Stanley and currently serves on the boards of directors of Avaya Inc. and Freescale Semiconductor Inc. |
| • | Mr. Mehra is a representative appointed by Goldman, Sachs & Co., and has extensive knowledge in various industries from his involvement in Goldman’s investment in numerous portfolio companies. He currently serves on the boards of directors of Aramark, Interline Brands Inc., Max India Limited, Neovia Logistics Holding, Ltd., Sigma Electric and TVS Logistics Services Limited. |
| • | Mr. Noell is a representative appointed by Providence Equity Partners, and has significant business experience from his involvement in Providence’s investment in numerous portfolio companies. He currently serves on the Boards of Directors of Altegrity Inc., The Chernin Group, LLC and World Triathlon Corporation |
| • | Mr. Park is a representative appointed by KKR & Co. L.P., and has a wide range of experience in the technology industry from his involvement in KKR’s investment in numerous portfolio companies. He serves on the board of directors of GoDaddy Inc. |
Role of Board in Risk Oversight
The board of directors has extensive involvement in the oversight of risk management related to us and our business and accomplishes this oversight through the regular reporting by the Audit Committee. The Audit Committee represents the board by periodically reviewing our accounting, reporting and financial practices, including the integrity of our financial statements, the oversight of administrative and financial controls and our compliance with legal and regulatory requirements. Through its regular meetings with management, including the finance, legal, compliance, enterprise risk management, information security and internal audit functions, the Audit Committee reviews and discusses all significant areas of our business and summarizes for the board of directors all areas of risk and the appropriate mitigating factors. In addition, our Board receives periodic detailed operating performance reviews from management.
Controlled Company Exception
After the completion of this offering, affiliates of the Sponsors will continue to beneficially own more than 50% of our common stock and voting power. As a result, (i) we expect that under the terms of the Stockholders Agreement, as amended, affiliates of the Sponsors will have agreed to vote for one another’s respective board nominees (see “Certain Relationships and Related Party Transactions—Other Shareholder Agreements”) and (ii) we will be a “controlled company” within the meaning of the corporate governance standards of . Under the corporate governance standards, a company of which more than 50% of the voting power is held by an individual, group or another company is a “controlled company” and may elect not to comply with certain corporate governance standards, including (1) the requirement that a majority of the board of directors consist of independent directors, (2) the requirement that we have a compensation committee that is composed entirely of independent directors with a written charter addressing the committee’s purpose and responsibilities, (3) the requirement that we have a nominating and corporate governance committee that is composed entirely of independent directors with a written charter addressing the committee’s purpose and responsibilities, and (4) the requirement for an annual performance evaluation of the nominating and corporate governance and compensation committees. Following this offering, we intend to utilize these exemptions. As a result, following this offering, we will not have a majority of independent directors on our board of directors (although we expect our board of directors to determine that Messrs. qualify as independent directors under the corporate governance standards of ); and we will not have a nominating and corporate governance committee or a compensation committee that is composed entirely of independent directors. Also, such committees will not be
102
Table of Contents
subject to annual performance evaluations. Accordingly, you will not have the same protections afforded to stockholders of companies that are subject to all of the corporate governance requirements of . In the event that we cease to be a “controlled company,” we will be required to comply with these provisions within the transition periods specified in the corporate governance rules of .
Board Committees
After the completion of this offering, the standing committees of our board of directors will consist of an Audit Committee, a Compensation Committee and a Nominating and Corporate Governance Committee.
Our Chief Executive Officer and other executive officers will regularly report to the non-executive directors and the Audit, the Compensation and the Nomination and Corporate Governance Committees to ensure effective and efficient oversight of our activities and to assist in proper risk management and the ongoing evaluation of management controls. The vice president of internal audit will report functionally and administratively to our Chief Financial Officer and directly to the Audit Committee. We believe that the leadership structure of our board of directors provides appropriate risk oversight of our activities given the controlling interests held by the Sponsors.
Audit Committee
Upon the completion of this offering, our Audit Committee will consist of . We expect our board of directors to determine that all of the members of our Audit Committee will qualify as independent directors under the corporate governance standards of and the independence requirements of Rule 10A-3 of the Securities Exchange Act of 1934, as amended (the “Exchange Act”). Our board of directors has determined that qualifies as an “audit committee financial expert” as such term is defined in Item 407(d)(5) of Regulation S-K.
The purpose of the Audit Committee will be to prepare the audit committee report required by the SEC to be included in our proxy statement and to assist our board of directors in overseeing and monitoring among other things, (1) the quality and integrity of our financial statements and our financial reporting and disclosure practices, (2) our compliance with applicable legal and regulatory requirements, (3) our independent registered public accounting firm’s qualifications and independence and (4) the performance of our internal audit function.
We are amending the charter for the Audit Committee to comply with the rules and regulations governing a public company. Upon completion of this offering, the amended Audit Committee charter will be available on our website.
Compensation Committee
Upon the completion of this offering, our Compensation Committee will consist of .
The purpose of the Compensation Committee is to assist our board of directors in discharging its responsibilities relating to (1) setting our compensation program and compensation of our executive officers and directors, (2) monitoring our incentive and equity-based compensation plans and (3) preparing the compensation committee report required to be included in our proxy statement under the rules and regulations of the SEC.
We are amending the charter for the Compensation Committee to comply with the rules and regulations governing a public company. Upon completion of this offering, the amended Compensation Committee charter will be available on our website.
Nominating and Corporate Governance Committee
Upon the completion of this offering, our Nominating and Corporate Governance Committee will consist of . The purpose of our Nominating and Corporate Governance Committee will be to assist our board of
103
Table of Contents
directors in discharging its responsibilities relating to (1) identifying individuals qualified to become new Board members, consistent with criteria approved by the board of directors, subject to the Stockholders Agreement, as amended, with the Sponsors; (2) reviewing the qualifications of incumbent directors to determine whether to recommend them for reelection and selecting, or recommending that the Board select, the director nominees for the next annual meeting of stockholders; (3) identifying Board members qualified to fill vacancies on any Board committee and recommending that the Board appoint the identified member or members to the applicable committee, subject to the Stockholders Agreement, as amended, with the Sponsors; (4) reviewing and recommending to the board of directors corporate governance guidelines applicable to us; (5) overseeing the evaluation of the board of directors and management; and (6) handling such other matters that are specifically delegated to the committee by the board of directors from time to time.
Our board of directors will adopt a written charter for the Nominating and Corporate Governance Committee, which will be available on our website upon completion of this offering.
Compensation Committee Interlocks and Insider Participation
None of the members of the Compensation Committee are current or former officers or employees of our Company. We are parties to certain transactions with the Sponsors described in “Certain Relationships and Related Transactions” section of this prospectus.
Global Business Conduct and Compliance Program
We are amending our Global Business Conduct and Compliance Program that applies to all of our officers and employees, including our principal executive officer, principal financial officer and principal accounting officer to comply with the rules and regulations governing a public company. Upon completion of this offering, our Global Business Conduct and Compliance Program will be available on our website. Our Global Business Conduct and Compliance Program will be a “code of ethics”, as defined in Item 406(b) of Regulation S-K. Please note that our website address is provided as an inactive textual reference only. We will make any legally required disclosures regarding amendments to, or waivers of, provisions of our code of ethics on our website.
104
Table of Contents
Compensation Discussion and Analysis
Executive Summary
The information contained in this “Compensation Discussion and Analysis” describes the material elements of compensation paid or awarded to our principal executive officer, principal financial officer and the other three most highly compensated executive officers (collectively, our “named executives”) for the twelve months ended December 31, 2014.
For 2014 our named executives are:
| • | Mr. Russell P. Fradin—President and Chief Executive Officer |
| • | Mr. Charles J. Neral—Senior Vice President—Finance and Chief Financial Officer |
| • | Ms. Marianne C. Brown—Chief Operating Officer, Financial Systems |
| • | Mr. Kevin J. McCurry—Senior Vice President—Corporate Development and Strategy |
| • | Mr. Brian A. Traquair—Executive Vice President, Financial Systems |
The specific amounts and material terms of compensation paid, payable or awarded for 2014 to the named executives are disclosed under “—Summary Compensation Table” and the subsequent tables and narrative.
The overall focus of our compensation philosophy is to pay for performance. We believe our programs are effectively designed, align well with the interests of our stockholders and are instrumental to achieving our business strategy.
Highlighted below are some of the key aspects and decisions with respect to our executive compensation programs for fiscal 2014, as approved by the Compensation Committee:
| • | Our executive compensation is tightly linked to our performance. |
| • | The Compensation Committee approved executive incentive compensation (“EIC”) plans by which the named executives were eligible to earn cash incentive compensation based upon achievement of specific financial objectives for 2014 that were designed to challenge the named executives to perform highly. In 2014, EIC plans for the named executives included Adjusted EBITDA, revenue and sales targets, as well as individual objectives, in order to bring focus to both growth and planning for the future. |
| • | Individual EIC bonus payments were capped at 2.0 times the named executive’s target EIC bonus. |
| • | To further align the equity incentives of our named executives with the interests of our stockholders, the Compensation Committee approved annual grants of restricted stock unit awards with a performance measure based on growth in the Company’s stock price over a three-year period. |
| • | We evaluated the risks associated with our compensation programs. As described below under the “Risk Considerations in Our Compensation Programs,” we concluded that our compensation policies and practices for 2014 did not create risks that were reasonably likely to have a material adverse effect on the Company. |
Administration of Our Compensation Program
Our executive compensation program is overseen and administered by the Compensation Committee. For the purposes of compensation decisions made for the twelve months ended December 31, 2014, the Compensation Committee operated under a written charter adopted by the Boards of Directors of SunGard, SunGard Capital Corp. II and SunGard Data Systems Inc. (the “Boards”), and had responsibility for discharging
105
Table of Contents
the responsibilities of the Boards relating to the compensation of the Company’s executive officers and related duties. Following this offering, our Compensation Committee will operate under an amended charter adopted by the Board. Management, including our CEO, evaluates a number of factors in developing cash and equity compensation recommendations to the Compensation Committee for its consideration and approval. Following this review and in consultation with management, our CEO makes compensation recommendations for our executive officers, including himself, to the Compensation Committee based on his evaluation of each officer’s performance, expectations for the coming year and market compensation data. The Compensation Committee reviews these proposals and makes recommendations to the board of directors with respect to equity grants for certain of our executive officers. The Compensation Committee makes all other final compensation decisions for our executive officers by exercising its discretion in accepting, modifying or rejecting any management recommendations, including any recommendations from our CEO.
Objectives of Our Compensation Program
Our executive compensation program is intended to meet three principal objectives:
| • | to provide competitive compensation packages to attract and retain superior executive talent; |
| • | to reward successful performance by the executive and the Company by linking a significant portion of compensation to future financial and business results; and |
| • | to further align the interests of executive officers, including our named executives, with those of our ultimate stockholders by providing long-term equity compensation and meaningful equity ownership. |
To meet these objectives, our compensation program balances short-term and long-term performance goals and mixes fixed and at-risk compensation that is directly related to stockholder value and overall performance.
Our compensation program for senior executives, including our named executives, is designed to reward the named executives based on Company and individual performance. The compensation program is intended to reinforce the importance of performance and accountability at various operational levels, and therefore a significant portion of total compensation is in the form of both cash and stock-based compensation incentives that reward performance as measured against established goals, i.e., “pay for performance.” Each element of our compensation program is reviewed individually and considered collectively with the other elements of our compensation program. When making compensation decisions for our named executives, we consider each individual’s contributions to our overall results, our operating and financial performance compared with the targeted goals, and our size and complexity compared with companies in our compensation peer group, described below.
Elements of Our Executive Compensation Program
In 2014, the principal elements of compensation for our named executives were:
| • | annual cash compensation consisting of base salary and performance-based EIC bonuses; |
| • | long-term equity incentive compensation; |
| • | benefits and perquisites; and |
| • | severance compensation and change of control protection. |
Annual Cash Compensation
Management, including our CEO, develops recommendations for annual executive cash compensation plans after considering compensation survey data for a broad set of organizations of comparable business, size and complexity and publicly available compensation data for a group of companies we consider to be our peer group. We believe that the compensation practices of these companies provide us with appropriate benchmarks because
106
Table of Contents
they also provide technology products and services to a variety of customers and compete with us for executives and other employees.
The survey data used for 2014 compensation purposes came from two sources: Radford Global Technology Survey, which focuses on technology companies, and Towers Watson Survey Report on Top Management Compensation, which focuses on a broader array of organizations, including professional services, high-tech and manufacturing companies. For purposes of establishing compensation recommendations, we used both of these surveys to reflect our size, industry and appropriateness of the position matched.
The companies we consider within our peer group are financial services and software companies of similar industry and revenue size as the Company, and some are competitors of the Company for business and for talent. No changes were made to the peer group list from 2013. Peer group compensation data is limited to publicly available information and therefore generally does not provide precise comparisons by position as offered by the more comprehensive survey data from the surveys used in our broader analysis as described above. As a result, the peer group data provides limited guidance and is not dispositive for setting executive officers’ compensation.
The following companies comprised our peer group in 2014:
| Automatic Data Processing, Inc. | DST Systems, Inc. | Symantec Corporation | ||
| Amdocs Limited | Fidelity National Information Services, Inc. | The Western Union Company | ||
| Broadridge Financial Solutions, Inc. | First Data Corporation | Thomson Reuters Corporation | ||
| CA, Inc. | Fiserv, Inc. | VMWare, Inc. | ||
| CACI International Inc. | Intuit Inc. | |||
| Cognizant Technology Solutions Corporation |
Iron Mountain Incorporated |
The Compensation Committee’s objective in looking at market and peer compensation data is to assure relevance to market practices and support our objective of providing competitive compensation packages to attract and retain superior executive talent. The Compensation Committee does not target specific market percentiles of peer pay as an overall objective, but considers this information along with internal equity and other factors when making executive pay decisions.
Our annual cash compensation packages for our named executives include base salary and a target EIC bonus. The compensation of Ms. Brown and Mr. McCurry was based on the terms of the employment agreements entered into with each of them in connection with their commencement of employment in early 2014, as further described below.
Base Salary
Base salaries provide fixed compensation that is not subject to performance risk and are determined for each named executive based on his or her position while also considering other factors, such as individual and Company performance. We review the base salaries for each named executive annually as well as at the time of any promotion or significant change in job responsibilities. Salary for each named executive for calendar year 2014 is reported in the “Summary Compensation Table” below. In 2014, Mr. Fradin did not receive a base salary increase after the Compensation Committee reviewed his existing salary and determined that it was appropriate. Messrs. Neral and Traquair received base salary increases of 15% and 13%, respectively, to reflect increased responsibilities. The initial base salaries for Ms. Brown and Mr. McCurry were determined at the time of their hire in early 2014 in accordance with current compensation practices after consideration by the Compensation Committee of the base salaries of our other executive officers and the market and peer compensation data described above.
107
Table of Contents
Performance-Based Incentive Compensation
The annual EIC bonus for executive officers is designed to reward our executives for the achievement of annual financial goals related to the business for which they have responsibility. A minimum incentive may be earned at threshold EIC goals, and no payment is awarded if the threshold goal is not achieved. Target EIC goals are set at levels that reflect budgeted performance. Consistent with our focus on pay for performance, additional amounts can be earned when actual performance exceeds target performance. The Company may revise or cancel an executive’s EIC bonus at any time as a result of a significant change in circumstances or the occurrence of an unusual event that was not anticipated when the EIC plan was approved. As applicable, targets are adjusted to take into account acquisitions and/or dispositions which were not included in the budgeted EIC targets and other one-time adjustments as approved by the Compensation Committee. Individual EIC payments are capped at 200% of the named executive’s target EIC bonus. Target EIC bonuses for Ms. Brown and Mr. McCurry were determined at the time of their hire in early 2014, after consideration by the Compensation Committee of market data described above, the base salaries of other executive officers and the prior compensation of each individual.
The financial measures used for the 2014 EIC bonuses for the named executives were:
| • | Adjusted EBITDA, which represents operating income excluding depreciation, amortization of acquisition-related intangible assets, trade name and goodwill impairment charges, severance and facility closure charges, stock compensation, management fees and certain other costs. Please refer to “Management’s Discussion and Analysis of Financial Condition and Results of Operations –Non-GAAP Financial Measures” included elsewhere in this prospectus for a reconciliation of Adjusted EBITDA to net income (loss); |
| • | revenue; and |
| • | sales, which represents license, SaaS, cloud and professional services sales, whether new or recurring. |
These metrics were selected as the most appropriate financial measures upon which to base the 2014 EIC bonuses for the named executives because they provide a balance of incentives to drive the long-term growth of the Company and are important metrics that management and the Compensation Committee use to evaluate the performance of the Company or a particular business. The targets are intended to be achievable, but challenging. Adjusted EBITDA, revenue and sales goals were weighted equally in 2014 for all of the named executives except Mr. McCurry. Revenue and sales over performance could only be earned by the named executives if threshold performance on Adjusted EBITDA was achieved.
108
Table of Contents
The following table provides the percentage of each component of the EIC bonuses.
| Name and Goals* |
Performance Goal as % Total Target Bonus |
|||
| Russell P. Fradin and Charles J. Neral |
||||
| SunGard Adjusted EBITDA |
25 | % | ||
| SunGard Revenue |
25 | % | ||
| Financial Systems Segment Sales |
25 | % | ||
|
|
|
|||
| Financial Objectives |
75 | % | ||
| Individual Objectives |
25 | % | ||
| Marianne C. Brown and Brian A. Traquair |
||||
| Financial Systems Segment Adjusted EBITDA |
25 | % | ||
| Financial Systems Segment Revenue |
25 | % | ||
| Financial Systems Segment Sales |
25 | % | ||
|
|
|
|||
| Financial Objectives |
75 | % | ||
| Individual Objectives |
25 | % | ||
| Kevin J. McCurry |
||||
| SunGard Adjusted EBITDA |
25 | % | ||
| SunGard Revenue |
20 | % | ||
| Financial Systems Segment Sales |
20 | % | ||
|
|
|
|||
| Financial Objectives |
65 | % | ||
| Individual Objectives |
35 | % | ||
| * | SunGard goals exclude first quarter 2014 results of Availability Services prior to the AS Split-Off. |
For the corporate named executives, Messrs. Fradin, Neral and McCurry, the 2014 EIC components allowed for potential payouts of between 0% and 200% of target amounts if we achieved or exceeded the following financial objectives during 2014: (i) SunGard Adjusted EBITDA of $783 million, (ii) revenue of $2,836 million, and (iii) applicable Financial Systems sales targets.
For the operating named executives, Ms. Brown and Mr. Traquair, the 2014 EIC components allowed for potential payouts of between 0% and 200% of target amounts if we achieved or exceeded the following financial objectives during 2014: (i) Financial Systems Adjusted EBITDA of $784 million, (ii) Financial Systems revenue of $2,621 million, (iii) applicable Financial Systems sales targets.
For each of our named executives, 2014 actual performance was reviewed against both the financial measures and individual objectives. For each applicable financial objective, minimum performance resulted in a 50% payout, target performance resulted in a 100% payout and maximum performance resulted in a 200% payout. Individual objectives, which are comprised of quantitative and qualitative goals in the areas of future planning and management development, are weighted as set forth above. In 2014, Adjusted EBITDA and revenue results fell short of target, while sales exceeded target, resulting in bonus achievement of less than 100% of target for each of the named executives after taking into account individual objectives. The following table provides the EIC bonuses each named executive earned based on actual 2014 results of performance of both financial and individual objectives.
109
Table of Contents
| 2014 Performance Goals | Target 2014 EIC Bonus Payment |
Actual 2014 EIC Bonus Payment (% of Target Bonus) |
||||||||||||||||||
| (in millions) | ||||||||||||||||||||
| Name and Goals |
Minimum | Target | Maximum | |||||||||||||||||
| Russell P. Fradin |
$ | 1,800,000 | $ |
1,624,087 (90.2% |
) | |||||||||||||||
| SunGard Adjusted EBITDA |
$ | 744 | $ | 783 | $ | 862 | ||||||||||||||
| SunGard Revenue |
$ | 2,765 | $ | 2,836 | $ | 2,992 | ||||||||||||||
| Charles J. Neral |
$ | 575,000 | $
|
515,931 (89.7% |
) | |||||||||||||||
| SunGard Adjusted EBITDA |
$ | 744 | $ | 783 | $ | 862 | ||||||||||||||
| SunGard Revenue |
$ | 2,765 | $ | 2,836 | $ | 2,992 | ||||||||||||||
| Marianne C. Brown |
$ | 950,000 | $
|
883,364 (93.0% |
) | |||||||||||||||
| FS Segment Adjusted EBITDA |
$ | 744 | $ | 784 | $ | 862 | ||||||||||||||
| FS Segment Revenue |
$ | 2,555 | $ | 2,621 | $ | 2,778 | ||||||||||||||
| Kevin J. McCurry |
$ | 350,000 | $
|
324,106 (92.6% |
) | |||||||||||||||
| SunGard Adjusted EBITDA |
$ | 744 | $ | 783 | $ | 862 | ||||||||||||||
| SunGard Revenue |
$ | 2,765 | $ | 2,836 | $ | 2,992 | ||||||||||||||
| Brian A. Traquair (1) |
$ | 649,921 | $
|
555,590 (85.5% |
) | |||||||||||||||
| FS Segment Adjusted EBITDA |
$ | 744 | $ | 784 | $ | 862 | ||||||||||||||
| FS Segment Revenue |
$ | 2,555 | $ | 2,621 | $ | 2,778 | ||||||||||||||
| (1) | Mr. Traquair is paid in Canadian Dollars (CAD). The bonus amounts reflected in the table have been converted, as applicable, to U.S. dollars (USD) at the currency exchange rate (used for purposes of the Company’s 2014 operating budget) of CAD 1 = USD 0.9686. |
Long-Term Equity Compensation
We intend for our equity program to be the primary vehicle for offering long-term incentives and rewarding our executive officers, managers and key employees because of the direct relationship between the value of these equity awards and the value of our stock. By compensating our named executives with equity incentive awards, our named executives hold a stake in the Company’s financial future. The gains realized in the long term depend on our named executives’ ability to drive the financial performance of the Company. Equity awards are also a necessary vehicle for attracting and retaining executive talent in our competitive talent market.
Our 2005 Management Incentive Plan, as amended, provides for the grant of various forms of equity awards. We seek to provide equity grants that are competitive with companies in our peer group and other technology companies with which we compete for executive talent. When making annual equity awards to named executives, we consider past-year results, the role, responsibility and performance of the individual named executive, a competitive market assessment, prior equity awards, and the level of vested and unvested equity awards then held by each named executive. When making annual equity awards to Ms. Brown and Mr. McCurry, following the commencement of their employment in 2014, we considered the size and amount of equity awards granted to our other executive officers. Awards granted in 2014 were for “Units” in SunGard Capital Corp. II and SunGard Capital Corp. (collectively, the “Parent Companies”). Each “Unit” consists of 1.3 shares of Class A common stock and 0.1444 shares of Class L common stock of SunGard and 0.03807 shares of preferred stock of SCCII. The shares comprising a Unit are in the same proportion as the shares issued to all stockholders of the Parent Companies. Following this offering, “Units” under the Plan will consist of shares of our common stock.
110
Table of Contents
To align the equity incentives of our executives with the interests of our stockholders, our equity program for the named executives is comprised of annual grants of restricted stock units (“RSUs”) and one-time grants of appreciation units (“AUs”).
| • | As part of the annual broad-based equity grant program, each of the named executives was granted the following awards in June 2014: (1) time-based RSUs that vest over three years with one-third vesting on each of the first three anniversaries of date of grant and (ii) performance-based RSUs that vest upon specified growth in the stock price over three years and can vest up to 200% for overachievement of target, with achievement and vesting determined on June 1, 2017. The Compensation Committee approved the 2014 annual grants with the performance measure based on increases in the Company’s stock price rather than Adjusted EBITDA as in previous years. |
| • | In addition, in 2013, we introduced a long-term equity incentive plan in the form of grants of AUs, which are similar to stock appreciation rights, to a limited number of senior executives with the performance objective of increasing the Company’s stock price over a four-year period. In 2013, Messrs. Fradin, Neral and Traquair were granted performance-based AUs. Ms. Brown and Mr. McCurry were granted performance-based AUs in February 2014 when they joined the Company. The performance-based AUs vest, in the case of Mr. Fradin, or are earned, in the case of the other named executives, if the average value of a Unit increases above $14.89, in the case of Mr. Fradin, or $15.96, in the case of the other named executives, on any semi-annual measurement date occurring during the performance period ending June 1, 2017, and fully vest, in the case of Mr. Fradin, or are fully earned, in the case of the other named executives, if the average value of a Unit on any measurement date equals or exceeds $23.24. The average value of a Unit is determined by the Board, based on the financial results for the two quarters immediately preceding the measurement date. With respect to Mr. Fradin’s performance-based AUs, 38.93% of the award was earned and vested based on achievement of performance metrics through December 31, 2014. With respect to performance-based AUs granted to Ms. Brown and Messrs. Neral, Traquair and McCurry, 29.98% of the award was earned based on achievement of performance metrics through December 31, 2014. In 2013, Mr. Fradin was also granted time-based AUs that vest in annual installments and will fully vest on June 1, 2016. For Mr. Fradin, vested AUs become payable on the first to occur of June 1, 2017, termination of employment other than for cause, or a change of control. For the other named executives, earned AUs become vested and payable, subject to continued employment, on the first to occur of June 1, 2017, a termination of employment due to death or disability, or a change of control. See “—Potential Payments Upon Termination or Change of Control”. |
Pursuant to their respective employment agreements, in February 2014, Ms. Brown and Mr. McCurry received the following initial RSU grants in addition to the AUs and RSUs described above:
| • | Time-based RSUs vesting over four years. |
| • | Performance-based RSUs tied to Adjusted EBITDA results for the period ending December 31, 2014. To the extent the performance objective was achieved, 25% of Ms. Brown’s earned RSUs vested on December 31, 2014 with the remaining balance vesting 25% on each of the second, third and fourth anniversaries of the date of grant, and 50% of Mr. McCurry’s earned RSUs vested on December 31, 2014 with the remaining balance vesting 25% on each of the third and fourth anniversaries of the date of grant. |
Based upon actual year-end 2014 Adjusted EBITA and Adjusted EBITDA results, which fell short of target, (i) 11% of the 2014 target for each performance-based RSU award granted in 2010 and 2012 and (ii) 37% of each performance-based RSU award with a 12-month performance period ending December 31, 2014 was earned, with 25% vesting at the end of the performance period and the remaining balance vesting 25% on each of the second, third and fourth grant date anniversaries (except as described above for Mr. McCurry). With respect to performance, the earned amount was determined to the extent the actual performance exceeded 95% of target, at which level 0% is earned, to 100% of target, where 100% of the grant is earned—with linear interpolation between these achievement points. “Adjusted EBITA” is defined as operating income before amortization of
111
Table of Contents
acquisition-related intangible assets, stock compensation expense and certain other items, and is a performance target used in certain awards granted prior to fiscal year 2013.
After the LBO and through March 2007, we granted time-based and performance-based stock options representing the right to receive Units to our officers and employees on a broad basis. Between April 2007 and June 2013, we made similar grants to employees in a limited number of international (i.e., non-US) locations. Between September 2007 and September 2010, we made grants of time-based and performance-based stock options on a broad basis, for the right to receive shares of our Class A common stock only. Only Mr. Traquair holds outstanding stock option awards, and all such awards previously vested.
Benefits and Perquisites
We offer a variety of health and welfare programs to all eligible employees, including the named executives. The named executives are eligible generally for the same benefit programs on the same basis as the rest of the Company’s employees in the particular country in which the named executive resides, including medical and dental care coverage, life insurance coverage, short-and long-term disability and a 401(k) or other savings plan or defined contribution pension plan.
Employment Agreements, Severance Compensation & Change of Control Protection
Employment Agreement with Russell P. Fradin
In 2011, we entered into an employment agreement with Mr. Fradin, pursuant to which he was appointed President and Chief Executive Officer of SunGard and a member of the Board. The terms provide for the following:
| • | A term through May 31, 2016, with one-year renewals automatically effective 30 days before expiration, unless terminated on 30 days’ advance notice. |
| • | An annual base salary of $900,000, subject to review periodically for appropriate increases by the Compensation Committee pursuant to the Company’s normal performance review policies for senior level executives, and a target annual bonus of 200% of his annual base salary. |
| • | A one-time cash bonus equal to $1,000,000 payable within five days following the effective date of his employment agreement. |
| • | The grant of restricted stock units and stock options; however, the equity grants described in Mr. Fradin’s employment agreement were not made and instead he received grants of AUs as described above. |
| • | Employee benefits consistent with those made available to the Company’s senior level executives, and relocation benefits consistent with the Company’s relocation policy. |
| • | A requirement that Mr. Fradin make an aggregate $5,000,000 equity investment in the Company at fair market value, which was made in 2011. |
| • | Certain restrictive covenants (noncompetition, confidentiality and nonsolicitation) that continue for two years following the termination date. |
| • | Mr. Fradin will be subject to any Company recoupment/clawback policy applicable to senior executives of the Company. If no such policy exists and the Company is required to restate its financials, then the Board may seek to recover or require reimbursement of any related annual bonus paid to Mr. Fradin for the applicable period. If Mr. Fradin violates the restrictive covenants set forth in his employment agreement within the two years following termination of employment, then the Board may recover severance benefits paid to Mr. Fradin. |
| • | The right to receive certain severance payments and benefits upon certain terminations of employment. See “—Potential Payments Upon Termination or Change of Control”. |
112
Table of Contents
| • | If an excise tax under sections 280G and 4999 of the Code will be triggered by any payments upon a change in control prior to an initial public offering, the Company will in good faith seek to obtain stockholder approval of such payments so that they are exempt from the excise tax under sections 280G and 4999 of the Internal Revenue Code. After an initial public offering, the Company will either (i) pay Mr. Fradin any amounts subject to sections 280G and 4999 of the Internal Revenue Code (and Mr. Fradin will be responsible for the excise tax) or (ii) reduce such payments so that no amounts are subject to sections 280G and 4999 of the Internal Revenue Code, whichever results in a greater after-tax amount to Mr. Fradin. |
Other Executive Employment Agreements
The Company entered into employment agreements with Messrs. Neral and McCurry and Ms. Brown when each joined the Company. The agreements were designed to retain the executives and provide continuity of management in the event of an actual or threatened change of control. Mr. Traquair and the Company have not have entered into an employment agreement.
Compensation for Ms. Brown and Mr. McCurry was based on the terms of the employment agreements each entered into in connection with the commencement of employment on February 24, 2014 and January 20, 2014, respectively. In addition to the components of compensation discussed above, Ms. Brown and Mr. McCurry received equity awards, further discussed above and below under “Grants of Plan-Based Awards in Fiscal Year 2014.”
The agreements for Messrs. Neral and McCurry and Ms. Brown include the following terms:
| • | An initial term followed by one-year automatic renewals unless terminated with advance notice. |
| • | Base salary subject to review periodically for appropriate increases by the CEO or the Compensation Committee pursuant to the Company’s normal performance review policies for senior level executives. |
| • | For Mr. Neral, a target annual bonus of 100% of his annual base salary, for Mr. McCurry, a $350,000 target annual bonus and for Ms. Brown, a 2014 target bonus of $950,000 with future annual bonuses based on the achievement of Company financial goals and individual objectives established each year. |
| • | The opportunity to participate in all short-term and long-term incentive programs established by the Company for senior level executives, including an annual cash bonus, and the opportunity to receive equity grants commensurate with the named executive’s position. |
| • | Employee benefits consistent with those made available to the Company’s senior level executives. |
| • | With respect to Mr. Neral, a car allowance of $1,030 per month and relocation expenses up to a $100,000, including a tax gross-up of any taxes paid by Mr. Neral in respect of reimbursed relocation expenses. |
| • | The right to receive certain severance payments and benefits upon certain terminations of employment. See “Potential Payments Upon Termination or Change of Control” below. |
| • | Certain restrictive covenants (noncompetition, confidentiality and nonsolicitation) that continue for applicable post-termination periods. |
Under the terms of our employment agreements and equity awards, the named executives are entitled to various payments and benefits upon the occurrence of specified events including termination of employment (without cause and in some instances for good reason) and upon a change of control of the Company. In the case of the employment agreements with Messrs. Neral and McCurry and Ms. Brown, the terms of these arrangements were set through the course of arms-length negotiations with each. As part of these negotiations, the Compensation Committee considered peer group compensation data and the compensation of our current executives and determined that the terms should be consistent with the compensation packages provided to executives in comparable positions. The termination of employment provisions of the employment agreements
113
Table of Contents
were entered into in order to address competitive concerns when the named executives were recruited. At the time of entering into these arrangements, the aggregate potential obligations of the Company were considered in the context of the desirability of hiring the individual and the expected compensation upon joining us. Mr. Traquair does not have an employment agreement but is entitled to certain statutory protections under Canadian law.
These arrangements and potential post-employment termination compensation payments, as well as an estimate of the compensation that would have been payable had they been triggered as of fiscal year end, are described in more detail in the section entitled “Potential Payments Upon Termination or Change of Control” below.
Stock Ownership
We do not have a formal policy requiring stock ownership by management. See “Principal Stockholders.”
Risk Considerations in Our Compensation Programs
In 2014, we conducted a risk assessment to evaluate risks associated with the Company’s compensation policies and practices and concluded that the Company’s compensation programs and policies, considered as a whole, including applicable risk-mitigation features, were not reasonably likely to have a material adverse effect on the Company. Following are some of the features of our program designed to help us appropriately manage business risk:
| • | Our compensation programs utilize different types of compensation, providing a balance of short-term and long-term incentives with fixed and variable components. |
| • | Our established performance goals are reasonable given past performance and market conditions. These performance measures balance annual and long-term components with an emphasis on Adjusted EBITDA. |
| • | There are caps of no more than 200% on payments from the EIC bonus plan which, in conjunction with threshold performance hurdles, ensure that incentive compensation does not overly emphasize taking undue risks. |
| • | Our equity compensation program provides a mix of performance- and time-based equity awards with multiple-year vesting. |
Accounting and Tax Implications
The accounting and tax treatment of particular forms of compensation do not materially affect the Compensation Committee’s compensation decisions. However, we evaluate the effect of such accounting and tax treatment on an ongoing basis and will make appropriate modifications to compensation policies where appropriate.
In general, Section 162(m) of the Code denies a publicly held corporation a deduction for federal income tax purposes for compensation in excess of $1 million per year per person to its principal executive officer, and the three other officers (other than the principal executive officer and principal financial officer) whose compensation is disclosed in its prospectus or proxy statement as a result of their total compensation, subject to certain exceptions. Following this offering, we expect to be able to claim the benefit of a special exemption rule that applies to compensation paid (or compensation in respect of equity awards such as stock options or restricted stock granted) during a specified transition period under Section 162(m). This transition period may extend until the first annual stockholders meeting that occurs after the close of the third calendar year following the calendar year in which this offering occurs, unless the transition period is terminated earlier under the Section 162(m) post-offering transition rules. At such time as we are subject to the deduction limitations of Section 162(m), we expect that the Compensation Committee will take the deductibility limitations of Section 162(m) into account in
114
Table of Contents
its compensation decisions; however, the Compensation Committee may, in its judgment, authorize compensation payments that are not exempt under Section 162(m) when it believes that such payments are appropriate to attract or retain talent.
Compensation Actions Taken in Fiscal 2015
On February 19, 2015, we granted performance-based RSUs to Mr. McCurry, Mr. Neral and Ms. Brown to retain and incentivize them. Mr. McCurry, Mr. Neral and Ms. Brown were granted 7,630 RSUs, 16,170 RSUs and 19,070 RSUs, respectively. The RSUs vest upon specified growth in the stock price over three years and can vest up to 200% for overachievement, with achievement and vesting determined on February 19, 2018, generally subject to continued employment through the vesting date.
Summary Compensation Table
The following table contains certain information about compensation earned in 2014, 2013 and 2012 by the named executives.
| Name and Principal Position |
Year | Salary ($) |
Bonus ($) |
Stock Awards(1) ($) |
Option Awards(2) ($) |
Non- Equity Incentive Plan Compen- sation(3) ($) |
All Other Compen -sation(4) ($) |
Total ($) |
||||||||||||||||||||||||
| Russell P. Fradin |
2014 | 900,000 | — | 4,272,312 | — | 1,624,087 | 51,224 | 6,847,623 | ||||||||||||||||||||||||
| President, Chief |
2013 | 900,000 | — | 1,157,000 | 9,583,500 | 1,699,577 | 59,980 | 13,400,057 | ||||||||||||||||||||||||
| Executive Officer and Director |
2012 | 900,000 | — | — | — | 1,800,000 | 1,167,142 | 3,867,142 | ||||||||||||||||||||||||
| Charles J. Neral(5) |
2014 | 575,000 | 125,000 | 705,379 | — | 515,931 | 46,440 | 1,967,750 | ||||||||||||||||||||||||
| Senior Vice President— |
2013 | 500,000 | — | 500,002 | 1,631,097 | 509,672 | 161,033 | 3,301,804 | ||||||||||||||||||||||||
| Finance and Chief Financial Officer |
2012 | 250,000 | 100,000 | 5,500,196 | — | 250,000 | 983,941 | 7,084,137 | ||||||||||||||||||||||||
| Marianne C. Brown(6) |
2014 | 596,795 | — | 2,178,801 | 2,030,487 | 883,364 | 13,991 | 5,703,438 | ||||||||||||||||||||||||
| Chief Operating Officer, Financial Systems |
||||||||||||||||||||||||||||||||
| Kevin J. McCurry(7) |
2014 | 382,051 | — | 876,272 | 406,100 | 324,106 | 15,106 | 2,003,635 | ||||||||||||||||||||||||
| Senior Vice President— Corporate Development & Strategy |
||||||||||||||||||||||||||||||||
| Brian A. Traquair(8) |
2014 | 649,921 | — | 658,308 | — | 555,590 | 36,006 | 1,899,825 | ||||||||||||||||||||||||
| Executive Vice President, |
2013 | 595,372 | — | 650,056 | 1,631,097 | 520,372 | 35,179 | 3,432,077 | ||||||||||||||||||||||||
| Financial Systems |
2012 | 600,080 | — | 1,077,496 | — | 582,598 | 590,202 | 2,850,376 | ||||||||||||||||||||||||
| (1) | Amounts shown reflect the grant date fair value per Unit of RSUs as computed in accordance with FASB ASC Topic 718 multiplied by the number of RSUs granted. For a discussion of the assumptions made in such valuation, see Note 11 to the Consolidated Financial Statements. For more details on grants awarded in 2014, see the “2014 Grants of Plan-Based Awards” table below. The stock price performance conditions applicable to the market-based RSUs reported above are a market condition as defined under FASB ASC Topic 718, and not a performance condition as defined under FASB ASC Topic 718. Accordingly, there are no maximum grant date fair values that differ from the fair values presented in this column with respect to the market-based RSUs. |
| (2) | Amounts shown are the aggregate grant date fair values of time-based and performance-based AUs granted and reflect the fair value as computed in accordance with FASB ASC Topic 718. For a discussion of the assumptions made in such valuation, see Note 11 to the Consolidated Financial Statements. The stock price performance conditions applicable to the performance-based AUs are a market condition as defined under FASB ASC Topic 718, and not a performance condition as defined under FASB ASC Topic 718. Accordingly, there are no maximum grant date fair values that differ from the fair values presented in this column. |
| (3) | Amounts shown in this column reflect the cash EIC awards payable upon the achievement of specified performance goals under the EIC plans, which are discussed in further detail above in the “Compensation Discussion and Analysis—Performance-Based Incentive Compensation.” |
115
Table of Contents
| (4) | The table below identifies the amounts shown for 2014 in the “All Other Compensation” column. All of the amounts reflect the actual cost to the company of providing the payment or benefit described below. |
| Name |
Company Contributions to Savings Plan ($) |
Health and Welfare Benefits ($) |
Auto Benefits |
Other* ($) |
||||||||||||||||
| Lease/ Allowance |
Tax Gross-Up |
|||||||||||||||||||
| Russell P. Fradin |
10,400 | 9,966 | 14,887 | 15,648 | 323 | |||||||||||||||
| Charles J. Neral |
10,400 | 5,052 | 17,598 | 12,479 | 911 | |||||||||||||||
| Marianne C. Brown |
— | 13,991 | — | — | — | |||||||||||||||
| Kevin J. McCurry |
— | 15,106 | — | — | — | |||||||||||||||
| Brian A. Traquair |
15,497 | 9,757 | 10,461 | — | 291 | |||||||||||||||
| * | For Messrs. Fradin and Neral, represents auto maintenance expenses. For Mr. Traquair, represents reimbursed health club fees, a benefit available to all Canadian employees. |
The majority of All Other Compensation for Messrs. Fradin and Neral in 2012 relates to dividend-equivalent payments under applicable equity awards, and for Mr. Neral in 2013 relates to relocation expenses and tax gross-up. A complete summary of All Other Compensation for 2012 and 2013 can be found in the Company’s Annual Report on Form 10-K for 2012 and 2013, respectively.
| (5) | In 2014, in connection with the successful completion of the AS Split-Off, Mr. Neral received a one-time discretionary bonus of $125,000. Mr. Neral joined SunGard as of July 2, 2012, and his 2012 annual rate of salary and his EIC bonus were pro-rated for the period of time he was employed by the Company in 2012. In accordance with Mr. Neral’s employment agreement, in 2012, he received a $100,000 sign-on bonus. |
| (6) | Ms. Brown joined SunGard as of February 24, 2014 and therefore was not a named executive in 2013 or 2012. Ms. Brown’s 2014 annual rate of salary was $700,000, which was pro-rated for the period of time she was employed by the Company in 2014. |
| (7) | Mr. McCurry joined SunGard as of January 20, 2014 and therefore was not a named executive in 2013 or 2012. Mr. McCurry’s 2014 annual rate of salary was $400,000, which was pro-rated for the period of time he was employed by the Company in 2014. |
| (8) | Mr. Traquair’s compensation was paid in Canadian Dollars (CAD). All amounts have been converted into U.S. dollars (USD) at the currency exchange rates used for purposes of the Company’s annual operating budget and establishing compensation for the applicable year as follows: 0.9686 in 2014, 1.004 in 2013 and 1.01194 in 2012. |
Grants of Plan-Based Awards in Fiscal Year 2014
Our SunGard 2005 Management Incentive Plan, as amended and restated (the “Plan”), authorizes the issuance of equity subject to awards made under the Plan for up to 70 million shares of Class A common stock and 7 million shares of Class L common stock of SunGard and 2.5 million shares of preferred stock of SCCII. Under the Plan, 2014 awards of time-based and performance-based RSUs and AUs were granted for Units, as described in the “Compensation Discussion and Analysis—Long-Term Equity Compensation,” to the extent applicable.
As part of the annual grant program, each of the named executives was granted the following awards in June 2014: (1) time-based RSUs that vest over three years with one-third vesting on each of the first three anniversaries of date of grant and (ii) performance-based RSUs that vest upon specified growth in the stock price over three years and can vest up to 200% for overachievement of target, with earned amounts vesting on June 1, 2017. Initial RSU and AU awards granted to Ms. Brown and Mr. McCurry in connection with their employment are described above in the “Compensation Discussion and Analysis—Long-Term Equity Compensation.”
116
Table of Contents
The following table contains information concerning grants of plan-based awards to the named executives during 2014.
| Name |
Grant Type |
Grant Date |
Estimated Possible Payouts under Non-Equity Incentive Plan Awards(1) ($) |
Estimated Future Payouts Under Equity Incentive Plan Awards(2) |
All
Other Stock Awards: Number of Shares of Stock or Units(3) (#) |
All Other Option Awards: Number of Securities Underlying Options (#) |
Exercise or Base Price of Option Awards ($/Sh) |
Grant Date Fair Value of Stock and Option Awards(4) ($) |
||||||||||||||||||||||||||||||||||||||||
| Threshold ($) |
Target ($) |
Maximum ($) |
Threshold (#) |
Target (#) |
Maximum (#) |
|||||||||||||||||||||||||||||||||||||||||||
| Russell P. Fradin |
EIC | N/A | $ | 900,000 | $ | 1,800,000 | $ | 3,600,000 | — | — | — | — | — | — | — | |||||||||||||||||||||||||||||||||
| RSUs | 06/01/14 | 1 | 202,912 | 405,824 | 50,728 | — | — | 4,272,312 | ||||||||||||||||||||||||||||||||||||||||
| Charles J. Neral |
EIC | N/A | $ | 287,500 | $ | 575,000 | $ | 1,150,000 | — | — | — | — | — | — | — | |||||||||||||||||||||||||||||||||
| RSUs | 06/01/14 | 1 | 27,711 | 55,422 | 13,649 | — | — | 705,379 | ||||||||||||||||||||||||||||||||||||||||
| Marianne C. Brown |
EIC | N/A | $ | 475,000 | $ | 950,000 | $ | 1,900,000 | — | — | — | — | — | — | — | |||||||||||||||||||||||||||||||||
| RSUs | 02/24/14 | 1 | 36,240 | 36,240 | 36,240 | — | — | 1,250,023 | ||||||||||||||||||||||||||||||||||||||||
| 06/01/14 | 1 | 44,112 | 88,224 | 11,028 | — | — | 928,778 | |||||||||||||||||||||||||||||||||||||||||
| AUs | 02/24/14 | 1 | 340,115 | 340,115 | — | — | — | 2,030,487 | ||||||||||||||||||||||||||||||||||||||||
| Kevin J. McCurry |
EIC | N/A | $ | 175,000 | $ | 350,000 | $ | 700,000 | — | — | — | — | — | — | — | |||||||||||||||||||||||||||||||||
| RSUs | 02/20/14 | 1 | 14,497 | 14,497 | 14,497 | — | — | 500,048 | ||||||||||||||||||||||||||||||||||||||||
| 06/01/14 | 1 | 14,780 | 29,560 | 7,280 | — | — | 376,225 | |||||||||||||||||||||||||||||||||||||||||
| AUs | 02/24/14 | 1 | 68,023 | 68,023 | — | — | — | 406,100 | ||||||||||||||||||||||||||||||||||||||||
| Brian A. Traquair(5) |
EIC | N/A | $ | 324,961 | $ | 649,921 | $ | 1,299,842 | — | — | — | — | — | — | — | |||||||||||||||||||||||||||||||||
| RSUs | 06/01/14 | 1 | 25,862 | 51,724 | 12,738 | — | — | 658,308 | ||||||||||||||||||||||||||||||||||||||||
| (1) | Amounts reflect a range of cash EIC bonuses payable to the named executives, which are described in further detail above in the Compensation Discussion and Analysis. Actual amounts earned with respect to 2014 are reported in the “Non-Equity Incentive Plan Compensation” column of the Summary Compensation Table above. |
| (2) | Represents performance-based RSUs and, for Ms. Brown and Mr. McCurry, also represents performance-based AUs. June 2014 performance-based RSUs can vest up to 200% for overachievement of target. |
| (3) | Represents time-based RSUs. |
| (4) | Represents the aggregate grant date fair value as computed in accordance with FASB ASC Topic 718. For a discussion of the assumptions made in such valuation, see Note 11 to the Consolidated Financial Statements. |
| (5) | Mr. Traquair is paid in Canadian Dollars (CAD). The bonus amounts reflected in the table have been converted, as applicable, to U.S. dollars (USD) at the currency exchange rate (used for purposes of the Company’s 2014 operating budget) of CAD 1 = USD 0.9686. |
117
Table of Contents
Outstanding Equity Awards at 2014 Fiscal Year-End
The following table contains certain information with respect to options, AUs and RSUs held as of December 31, 2014 by the named executives.
| Option Awards | Stock Awards | |||||||||||||||||||||||||||||||||||||||
| Name |
Grant Date |
Number of Securities Underlying Unexercised Options (#) Exercisable |
Number of Securities Underlying Unexercised Options (#) Unexercisable |
Equity Incentive Plan Awards: Number of Securities Underlying Unexercised Unearned Options(1) (#) |
Option Exercise Price ($) |
Option Expiration Date |
Number of Shares or Units of Stock That Have Not Vested (#) |
Market Value of Shares or Units of Stock That Have Not Vested(2) ($) |
Equity Incentive Plan Awards: Number of Unearned Shares, Units or Other Rights That Have Not Vested(1) (#) |
Equity Incentive Plan Awards: Market or Payout Value of Unearned Shares, Units or Other Rights That Have Not Vested(2) ($) |
||||||||||||||||||||||||||||||
| Russell P. Fradin |
6/17/2013 | 27,192 | (3) | 460,636 | — | — | ||||||||||||||||||||||||||||||||||
| 6/17/2013 | 10,053 | (4) | 170,297 | — | — | |||||||||||||||||||||||||||||||||||
| 6/17/2013 | 456,009 | (5) | — | 715,347 | 14.89 | 6/1/2017 | ||||||||||||||||||||||||||||||||||
| 6/17/2013 | 401,608 | (6) | 267,739 | — | 14.89 | 6/1/2017 | ||||||||||||||||||||||||||||||||||
| 6/1/2014 | 50,728 | (7) | 859,332 | — | — | |||||||||||||||||||||||||||||||||||
| 6/1/2014 | — | — | 202,912 | (9) | 3,437,329 | |||||||||||||||||||||||||||||||||||
| Charles J. Neral |
9/12/2012 | 31,891 | (8) | 540,235 | — | — | ||||||||||||||||||||||||||||||||||
| 9/12/2012 | — | — | 20,981 | (10) | 355,422 | |||||||||||||||||||||||||||||||||||
| 6/1/2013 | 11,750 | (3) | 199,051 | — | — | |||||||||||||||||||||||||||||||||||
| 6/1/2013 | 4,344 | (4) | 73,593 | — | — | |||||||||||||||||||||||||||||||||||
| 6/17/2013 | — | — | 340,115 | (11) | 15.96 | 6/1/2017 | ||||||||||||||||||||||||||||||||||
| 6/1/2014 | 13,649 | (7) | 231,214 | — | — | |||||||||||||||||||||||||||||||||||
| 6/1/2014 | — | — | 27,711 | (9) | 469,424 | |||||||||||||||||||||||||||||||||||
| Marianne C. Brown |
2/24/2014 | 36,240 | (3) | 613,898 | — | — | ||||||||||||||||||||||||||||||||||
| 2/24/2014 | 10,048 | (4) | 170,217 | — | — | |||||||||||||||||||||||||||||||||||
| 2/24/2014 | — | — | 340,115 | (11) | 15.96 | 6/1/2017 | ||||||||||||||||||||||||||||||||||
| 6/1/2014 | 11,028 | (7) | 186,814 | — | — | |||||||||||||||||||||||||||||||||||
| 6/1/2014 | — | — | 44,112 | (9) | 747,257 | |||||||||||||||||||||||||||||||||||
| Kevin J. McCurry |
2/20/2014 | 14,497 | (3) | 245,578 | — | — | ||||||||||||||||||||||||||||||||||
| 2/20/2014 | 2,680 | (4) | 45,391 | — | — | |||||||||||||||||||||||||||||||||||
| 2/24/2014 | — | — | 68,023 | (11) | 15.96 | 6/1/2017 | ||||||||||||||||||||||||||||||||||
| 6/1/2014 | 7,280 | (7) | 123,323 | — | — | |||||||||||||||||||||||||||||||||||
| 6/1/2014 | — | — | 14,780 | (9) | 250,373 | |||||||||||||||||||||||||||||||||||
| Brian A. Traquair |
8/11/2005 | 24,469 | (12) | — | — | 4.03 | 2/25/2014 | |||||||||||||||||||||||||||||||||
| 8/12/2005 | 34,855 | (13) | — | — | 12.87 | 8/12/2015 | ||||||||||||||||||||||||||||||||||
| 8/12/2005 | 41,380 | (14) | — | — | 12.87 | 8/11/2015 | ||||||||||||||||||||||||||||||||||
| 9/21/2007 | 17,617 | (16) | — | — | 2.22 | 9/21/2017 | ||||||||||||||||||||||||||||||||||
| 9/21/2007 | 31,423 | (15) | — | — | 2.22 | 9/21/2017 | ||||||||||||||||||||||||||||||||||
| 9/3/2009 | 12,929 | (17) | — | — | 0.44 | 9/3/2019 | ||||||||||||||||||||||||||||||||||
| 9/3/2009 | 18,402 | (15) | — | — | 0.44 | 9/3/2019 | ||||||||||||||||||||||||||||||||||
| 6/1/2011 | 937 | (18) | 15,874 | — | — | |||||||||||||||||||||||||||||||||||
| 9/14/2011 | 669 | (18) | 11,339 | — | — | |||||||||||||||||||||||||||||||||||
| 9/12/2012 | 2,015 | (19) | 34,130 | — | — | |||||||||||||||||||||||||||||||||||
| 9/12/2012 | 3,526 | (20) | 59,727 | — | — | |||||||||||||||||||||||||||||||||||
| 11/15/2012 | 10,490 | (21) | 177,697 | — | — | |||||||||||||||||||||||||||||||||||
| 11/15/2012 | 10,490 | (22) | 177,697 | — | — | |||||||||||||||||||||||||||||||||||
| 6/1/2013 | 5,648 | (4) | 95,681 | — | — | |||||||||||||||||||||||||||||||||||
| 6/1/2013 | 15,278 | (3) | 258,807 | — | — | |||||||||||||||||||||||||||||||||||
| 6/17/2013 | — | — | 340,115 | (11) | 15.96 | 6/1/2017 | ||||||||||||||||||||||||||||||||||
| 6/1/2014 | 12,738 | (7) | 215,782 | |||||||||||||||||||||||||||||||||||||
| 6/1/2014 | — | — | 25,862 | (9) | 438,102 | |||||||||||||||||||||||||||||||||||
118
Table of Contents
| (1) | Represents the quantity of unvested performance-based equity awards that can be earned upon the achievement of anticipated performance goals in future years. |
| (2) | Based upon a fair market value of $16.94 per Unit as of December 31, 2014. |
| (3) | Represents the unvested portion of time-based RSUs which vest over four years with 25% vesting on each of the first four anniversaries of the date of grant. |
| (4) | Represents the unvested portion of performance-based RSUs earned for the 12-month period of January 1, 2014 through December 31, 2014. For Mr. McCurry, 50% of the amount earned vested on December 31, 2014 and the remaining 50% of the earned balance will vest in two equal installments on each of the third and fourth anniversaries of the date of grant. For all other named executive officers, 25% of the amount earned vested on December 31, 2014 and the remaining 75% of the earned balance will vest in equal installments on each of the second, third and fourth anniversaries of the date of grant. |
| (5) | Represents the vested portion of performance-based AUs which vest as the Unit stock price appreciates above $14.89. |
| (6) | Represents the vested portion of time-based AUs which vest over 3 years, with 40% vesting on the grant date and 20% vesting on each of June 1, 2014, June 1, 2015 and June 1, 2016. |
| (7) | Represents the unvested portion of time-based RSUs which vest over three years with 1/3 vesting on each of the first three anniversaries of the date of grant. |
| (8) | Represents the unvested portion of time-based RSUs which vest over four years with 28% vesting on July 2, 2013 (hire date anniversary) and 72% of the remaining balance vesting in equal monthly installments thereafter for 36 months. |
| (9) | Represents performance-based RSUs that can be earned based on the target stock price of $27.50 and, if earned, will vest on the third anniversary of the grant date. There is an opportunity to vest between 0% and 200% of the amount granted. |
| (10) | Represents performance-based RSUs that can vest upon the achievement of SunGard’s EBITA target for calendar year 2015. |
| (11) | Represents the unvested portion of performance-based AUs which are earned if the average value of the Units increases above $15.96 on any semi-annual measurement date occurring during the performance period ending June 1, 2017, and fully earned if the average value of the Units on any measurement date equals or exceeds $23.24. |
| (12) | To the extent that outstanding options were not exercised before the LBO in 2005, such options converted into fully vested options to purchase Units. |
| (13) | Represents performance-based options which (i) vested upon the attainment of certain annual earnings goals for the Company during the six-year period beginning January 1, 2005 for calendar years 2005-2009 and (ii) were earned and vested for calendar year 2010 pursuant to the awards amended in 2009. |
| (14) | Represents fully vested time-based options, which vest over 5 years. |
| (15) | Represents fully vested time-based Class A options which vested over five years. The current value of Class A common stock is $0.01 per share. |
| (16) | Represents performance-based Class A options which (i) vested upon the attainment of certain annual earnings goals for the Company during the five-year period beginning January 1, 2007 for calendar years 2007-2009, (ii) were earned and vested for calendar year 2010 pursuant to the 2009 amended awards, and (iii) were earned and vested for calendar year 2011. The current value of Class A common stock is $0.01 per share. |
| (17) | Represents performance-based Class A options which were earned and vested for calendar years 2009, 2010, 2011, 2012 and 2013. These performance-based Class A options were earned upon the attainment of certain annual earnings goals for the Company over a five-year period. The current value of Class A common stock is $0.01 per share. |
| (18) | Represents the unvested portion of time-based RSUs which vest over four years with 28% vesting on June 1, 2012, and 72% of the remaining balance vesting in equal monthly installments thereafter for 36 months. These performance-based RSUs were earned upon the attainment of certain earnings goals for the Company. |
| (19) | Represents the unvested portion of performance-based RSUs earned for calendar year 2012 which vested 28% on December 31, 2012, and 72% of the remaining balance vesting in equal monthly installments thereafter for 36 months. |
| (20) | Represents the unvested portion of time-based RSUs which vest over four years with 28% vesting one year from the date of grant, and 72% of the remaining balance vesting in equal monthly installments thereafter for 36 months. |
| (21) | Represents the unvested portion of performance-based RSUs earned for calendar year 2013 which vests over four years with 25% vesting on each of the following dates: December 31, 2013, November 14, 2014, November 15, 2015 and June 1, 2016. These performance-based RSUs were earned upon the attainment of certain earnings goals for the Company. |
| (22) | Represents the unvested portion of time-based RSUs which vest over four years with 25% vesting on each of the first three grant date anniversaries and the remaining 25% vesting on June 1, 2016. |
Option Exercises and Stock Vested
The following table contains certain information with respect to stock option exercises and the vesting of RSUs during 2014 for each of the named executives.
| Option Awards | Stock Awards | |||||||||||||||
| Name |
Number of Shares Acquired on Exercise (#) |
Value Realized on Exercise(1) ($) |
Number of Shares Acquired on Vesting(2) (#) |
Value Realized on Vesting(3) ($) |
||||||||||||
| Russell P. Fradin |
— | — | 126,576 | $ | 2,291,586 | |||||||||||
| Charles J. Neral |
— | — | 27,806 | 484,987 | ||||||||||||
| Marianne C. Brown |
— | — | 3,350 | 56,741 | ||||||||||||
| Kevin J. McCurry |
— | — | 2,680 | 45,399 | ||||||||||||
| Brian A. Traquair |
16,465 | 213,063 | 29,295 | 508,235 | ||||||||||||
119
Table of Contents
| (1) | Calculated by multiplying the number of Units acquired on exercise times the difference between the fair market value on the exercise date and exercise price of the option. |
| (2) | Represents RSUs that vested during 2014. RSUs are not distributed until the first to occur of a change of control, separation from service without cause or a date specified in the RSU agreement ranging from three to five years after date of grant. |
| (3) | Calculated by multiplying the number of vested RSUs by the fair market value on the vesting date. |
Pension Benefits
None of the named executives receive benefits under any defined benefit or actuarial pension plan.
Nonqualified Deferred Contribution and Other Nonqualified Deferred Compensation Plans
Although none of the named executives participate in any formal cash-based nonqualified defined contribution or other nonqualified defined compensation plan, they are party to deferral arrangements related to the delayed distribution of shares, and in some cases, dividend equivalents, following the vesting of certain time-based RSUs and AUs. Shares underlying the vested RSUs and AUs set forth in the table below are not distributed until the first to occur of a change of control, separation from service other than for cause, or a specified date.
| Name |
Plan or Award |
Executive Contributions in Last FY(1) $ |
Registrant Contributions in Last FY $ |
Aggregate Earnings in Last FY(2) $ |
Aggregate Withdrawals/ Distributions in Last FY(3) $ |
Aggregate Balance at Last FYE(4) $ |
||||||||||||||||
| Russell P. Fradin(5) |
Vested & Undelivered AU Awards | 1,607,485 | — | (66,402 | ) | — | 1,758,847 | |||||||||||||||
| Vested & Undelivered RSU Awards | 221,153 | — | 593,370 | 4,885,854 | 210,311 | |||||||||||||||||
|
|
|
|
|
|
|
|
|
|||||||||||||||
| 1,828,638 | 526,968 | 4,885,854 | 1,969,158 | |||||||||||||||||||
| Charles J. Neral |
Vested & Undelivered RSU Awards | 484,987 | — | 93,145 | — | 2,036,320 | ||||||||||||||||
| Marianne C. Brown |
Vested & Undelivered RSU Awards | 56,741 | — | — | — | 56,741 | ||||||||||||||||
| Kevin J. McCurry |
Vested & Undelivered RSU Awards | 45,399 | — | — | — | 45,399 | ||||||||||||||||
| Brian A. Traquair |
Vested & Undelivered RSU Awards | 484,347 | — | 77,832 | 228,594 | 1,367,937 | ||||||||||||||||
| (1) | Represents the value of undelivered RSU and AU awards that vested during the year, as well as any related dividend equivalents, as of the date of vesting. The grant date fair value of these awards were previously included in the Stock Award or Option Award column, as applicable, of the Summary Compensation Table in the appropriate year of grant. |
| (2) | Represents the change in value of vested and undelivered RSU and AU awards during 2014, or until the date of share delivery, if a delivery occurred in 2014. The amounts reported are not considered compensation reportable in the Summary Compensation Table. |
| (3) | Represents the value of RSU and AU awards delivered in 2014, as well as any related dividend equivalents. |
| (4) | Represents the cumulative value of vested and undelivered RSU and AU awards, as well as any related dividend equivalents, as of December 31, 2014. The grant date fair value of these awards were previously included in the Stock Award or Option Award column, as applicable, of the Summary Compensation Table in the appropriate year of grant. |
| (5) | Mr. Fradin is the only named executive with AU awards that have vested. |
Employment and Change of Control Agreements
As discussed above, we entered into an employment agreement with each of the named executives except for Mr. Traquair. The terms of these agreements are described above under “—Employment Agreements, Severance Compensation & Change of Control Protection.”
Potential Payments Upon Termination or Change of Control
Pursuant to the terms of the executive employment agreements and equity award agreements, set forth below is a description of the potential payments the named executives would receive in connection with a change of control and/or upon termination of their employment with amounts calculated assuming a change of control occurred and/or their employment terminated on December 31, 2014. Mr. Traquair does not have an employment agreement; therefore, the amount of compensation Mr. Traquair would receive upon termination or change of control, if any, is based upon our compensation plans and Canadian law.
120
Table of Contents
The terms cause, good reason and change of control are defined in the applicable executive employment agreements or award agreements, as applicable, which have been included as exhibits to this Form S-1.
Russell P. Fradin
Upon termination without cause or resignation for good reason:
| • | a lump sum cash payment equal to two times the sum of his base salary and target incentive bonus; |
| • | his pro rata incentive bonus based upon the incentive bonus he would have earned for the year in which his termination occurred multiplied by the number of days during which he was employed during such year divided by 365; |
| • | a lump sum cash payment equal to the Company’s cost for medical, dental and vision coverage for Mr. Fradin and, if applicable, his spouse and dependents for the 18 month period following termination, as increased by a tax gross-up for taxes imposed on such payments; |
| • | payment of accrued but unpaid base salary, unreimbursed business expenses, unused vacation time and all other payments, benefits or fringe benefits in accordance with the applicable plan or program (the “Earned Amounts”); |
| • | a payment of his earned but unpaid incentive bonus for the year preceding the date of such termination; |
| • | upon termination without cause, all earned but unvested performance-based RSUs granted in 2013 become fully vested; |
| • | no performance-based RSUs granted in 2014 vest if the termination date occurs before the end of the performance period on June 1, 2017, and all unvested performance-based RSUs are forfeited; |
| • | all time-based RSUs immediately stop vesting and all unvested time-based RSUs are forfeited; and |
| • | all unvested time-based appreciation units (“AUs”) become immediately vested and will be paid, and if employment terminates prior to the end of the performance period on June 1, 2017, his vested performance-based AUs are paid and any unvested performance-based AUs are forfeited. |
Upon a change of control:
| • | all earned but unvested performance-based RSUs granted in 2013 will fully vest; and |
| • | all performance-based and time-based AUs will become fully vested if a change of control occurs on or before the end of the performance period on June 1, 2017 and if Mr. Fradin continues employment through the date of the change of control. |
Upon certain terminations in connection with a change of control:
| • | the payments and benefits described above under “termination without cause or for good reason”; |
| • | for performance-based RSUs granted in 2014, if the change of control occurs on or before the end of the performance period on June 1, 2017 and employment is subsequently terminated without cause, attainment of performance goals and vesting will be determined based upon the share price on the change of control date; and |
| • | all unvested time-based RSUs granted in 2013 and 2014 will vest if employment is terminated without cause within six months and 12 months, respectively, following a change of control. |
Upon retirement or other voluntary termination:
| • | any Earned Amounts; |
| • | all RSUs immediately stop vesting, and no additional performance-based RSUs will be earned after the termination date; and all unvested RSUs are forfeited; and |
121
Table of Contents
| • | all vested time-based and performance-based AUs will be paid, and any unvested time-based and/or performance-based AUs are forfeited. |
Upon termination due to disability or death:
| • | payment of his pro rata incentive bonus and any Earned Amounts; |
| • | a payment of his earned but unpaid incentive bonus for the year preceding the date of such termination; |
| • | in the event of his death, Mr. Fradin’s beneficiary will receive payments under a life insurance policy funded by the Company; |
| • | performance-based RSUs granted in 2013 that are earned but unvested vest and unearned performance-based RSUs are forfeited; |
| • | time-based RSUs granted in 2013 and 2014 will immediately stop vesting and unvested awards will be forfeited if employment terminates due to disability; |
| • | time-based RSUs granted in 2013 vest as to (i) 75% if his death occurs before June 1, 2015, and (ii) 100% if his death occurs on or after June 1, 2015; |
| • | time-based and performance-based RSUs granted in 2014 will vest as to (i) 66.67% if his death occurs prior to the first anniversary of the grant date on June 1, 2015, and (ii) 100% if his death occurs between the first anniversary of the grant date, June 1, 2015 and the third anniversary of the grant date, June 1, 2017. With respect to performance-based RSUs granted in 2014, if Mr. Fradin’s death occurs before a change of control, the vested amount will be based on the target percentage and not actual performance. All unvested time-based RSUs are forfeited; |
| • | no performance-based RSUs granted in 2014 vest if employment terminates due to disability before the end of the performance period on June 1, 2017 and unvested performance-based RSUs are forfeited; and |
| • | all time-based AUs fully vest, and all unvested performance-based AUs are forfeited. |
Charles J. Neral
Upon termination without cause or resignation for good reason:
| • | a lump sum cash payment equal to the sum of his base salary and target incentive bonus; |
| • | a pro rata target incentive bonus for the year of termination (but if Mr. Neral is employed as of December 31 of the year of termination, he receives his actual earned incentive bonus for the year of termination); |
| • | any earned but unpaid base salary, fringe benefits, vacation and sick leave, unreimbursed business expenses, incentive compensation and other benefits in accordance with the terms of any applicable plans or programs (the “Accrued Amounts”) |
| • | a lump sum cash payment in an amount equal to the Company’s cost of continued medical, dental and vision coverage for Mr. Neral and, if applicable, his spouse and dependents for the one-year period following the termination date, as increased by a tax gross-up for taxes imposed on such payment; |
| • | upon termination without cause, performance-based RSUs granted in 2012 will vest on a pro rata basis based on actual performance through the termination date; |
| • | upon termination without cause, all earned but unvested performance-based RSUs granted in 2013 will become fully vested; |
| • | no performance-based RSU awards granted in 2014 will vest if the termination date occurs before the end of the performance period on June 1, 2017. All unvested performance-based RSUs will be forfeited; |
122
Table of Contents
| • | all time-based RSUs will immediately stop vesting and unvested time-based RSUs will be forfeited; and |
| • | all unpaid performance-based AUs will be forfeited. |
Upon change of control:
| • | all earned but unvested performance-based RSUs granted in 2013 fully vest; and |
| • | all performance-based AUs will become fully vested if a change of control occurs before June 1, 2017 and if Mr. Neral continues employment through the date of the change of control. |
Upon certain terminations in connection with a change of control:
| • | an amount equal to two times the sum of his base salary and target incentive bonus if his employment is terminated without cause or he resigns for good reason during the 90 days before the execution of a binding agreement with respect to a transaction, that if completed, would constitute a change in control (a “Potential Change of Control”), or following a change of control, and the other benefits described above under “termination without cause or for good reason”; |
| • | all unvested time-based RSUs granted in 2012 vest if his employment is terminated without cause or for good reason within eighteen months following a change of control or on the date of the change of control if terminated within six months prior to a change of control and his termination was in contemplation of such change of control (an “In Contemplation Termination”); |
| • | all unvested time-based RSUs granted in 2013 and 2014 vest if employment is terminated without cause within six months and twelve months, respectively, following a change of control; |
| • | all performance-based RSUs granted in 2012 will vest if employment is terminated without cause or he resigns for good reason within eighteen months following a change of control or on the date of the change of control if employment is terminated by an In Contemplation Termination; and |
| • | for performance-based RSUs granted in 2014, if the change of control occurs on or before the end of the performance period on June 1, 2017 and employment is subsequently terminated without cause, attainment of performance goals and vesting will be determined based upon the share price on the change of control date. |
Upon retirement or other voluntary termination:
| • | payment of any Accrued Amounts, including any incentive compensation for which the performance period has been completed; and |
| • | all RSUs will immediately stop vesting, and no additional performance-based RSUs will be earned after the termination date; and all unvested RSUs are forfeited; and |
| • | all unpaid performance-based AUs will be forfeited. |
Upon termination due to disability or death:
| • | payment of any Accrued Amounts; |
| • | a pro rata target incentive bonus for the year of termination, (except if termination of employment occurred on December 31, Mr. Neral would receive his actual earned incentive bonus for the year of termination); |
| • | in the event of death, Mr. Neral’s beneficiary will receive payments under an insurance policy funded by the Company; |
| • | performance-based RSUs granted in 2012 vest on a pro rata basis; |
123
Table of Contents
| • | all earned but unvested performance-based RSUs granted in 2013 vest and all unvested performance-based RSUs are forfeited; |
| • | time-based RSUs granted in 2012 immediately stop vesting and all unvested RSUs are forfeited; |
| • | time-based RSUs granted in 2013 and 2014 will immediately stop vesting and unvested awards will be forfeited if employment terminates due to disability; |
| • | time-based RSUs granted in 2013 vest as to (i) 75% if his death occurs before the second anniversary of the grant date on June 1, 2015, and (ii) 100% if his death occurs on or after the second anniversary of the grant date on June 1, 2015; |
| • | time-based and performance-based RSU awards granted in 2014 will vest as to (i) 66.67% if death occurs prior to the first anniversary of the grant date on June 1, 2015, and (ii) 100% if death occurs between the first anniversary of the grant date, June 1, 2015 and the third anniversary of the grant date, June 1, 2017; for performance-based RSUs granted in 2014, if Mr. Neral’s death occurs before a change of control, the vested amount will be based on the target percentage and not on actual performance; |
| • | no performance-based RSUs granted in 2014 vest if employment terminates due to disability before the end of the performance period on June 1, 2017 and unvested performance-based RSUs are forfeited; and |
| • | all performance-based AUs for which the stock price thresholds have been met will vest and all vested performance-based AUs will be paid; all unvested performance-based AUs will be forfeited. |
Marianne C. Brown
Upon termination without cause or resignation for good reason:
| • | a lump sum cash payment equal to the sum of her base salary and average incentive bonus for the prior three completed years, or years actually completed if less than three years, or, if no years have been completed, the target incentive bonus of $950,000; |
| • | a pro rata incentive bonus based on the average incentive bonus for the prior three completed years, or years actually completed if less than three years, or, if no years have been completed, the target incentive bonus of $950,000 (but if Ms. Brown is terminated on December 31, she receives her actual earned incentive bonus for the year of termination); |
| • | payment of any Accrued Amounts; |
| • | a lump sum cash payment in an amount equal to the Company’s cost of continued medical, dental and vision coverage for Ms. Brown and, if applicable, her spouse and dependents for the one-year period following the termination date, as increased by a tax gross-up payment for taxes imposed on such payment; |
| • | all performance-based RSUs granted in 2014 fully vest; |
| • | all time-based RSUs granted in 2014 fully vest; and |
| • | all unpaid performance-based AUs are forfeited. |
Upon change of control:
| • | any earned but unvested performance-based RSUs granted in February 2014 fully vest; and |
| • | all performance-based AUs will become fully vested if a change of control occurs before the end of the performance period on June 1, 2017 and if Ms. Brown continues in employment through the date of the change of control. |
124
Table of Contents
Upon certain terminations in connection with a change of control:
| • | the payments and benefits described above under “termination without cause or for good reason”; |
| • | for performance-based RSUs granted in June 2014, if the change of control occurs on or before the end of the performance period on June 1, 2017 and employment is subsequently terminated without cause or for good reason, attainment of performance goals and vesting will be determined based upon the share price on the change of control date; and |
| • | time-based RSUs granted in February and June 2014, to the extent unvested, fully vest upon a termination without cause or a resignation for good reason. |
Upon retirement or other voluntary termination:
| • | payment of any Accrued Amounts; |
| • | all RSUs immediately stop vesting, and no additional performance-based RSUs will be earned after the termination date; and all unvested RSUs are forfeited; and |
| • | all unpaid performance-based AUs are forfeited. |
Upon termination due to disability or death:
| • | payment of any Accrued Amounts; |
| • | in the event of death, Ms. Brown’s beneficiary will receive payments under an insurance policy funded by the Company; |
| • | any earned but unvested performance-based RSUs granted February 2014 fully vest; |
| • | time-based RSUs granted in 2014 will immediately stop vesting and unvested awards will be forfeited if employment terminates due to disability; |
| • | time-based RSUs granted in February 2014 vest as to (i) 50% if death occurs prior to the first anniversary of the grant date on February 24, 2015, (ii) 75% if death occurs between the first anniversary of the grant date, February 24, 2015 and the second anniversary of the grant date, February 24, 2016, and (iii) 100% if death occurs on or after the second anniversary of the grant date, February 24, 2016; |
| • | time-based and performance-based RSU awards granted in June 2014 vest as to (i) 66.67% if death occurs prior to the first anniversary of the grant date on June 1, 2015, and (ii) 100% if death occurs on or after the first anniversary of the grant date, June 1, 2015 and before the third anniversary of the grant date, June 1, 2017. With respect to performance-based RSUs granted in June 2014, if Ms. Brown’s death occurs before a change of control, the vested amount will be based on the target percentage and not on actual performance; |
| • | no performance-based RSUs granted in June 2014 vest if employment terminates due to disability before the end of the performance period on June 1, 2017 and unvested performance-based RSUs are forfeited; and |
| • | all performance-based AUs for which the stock price thresholds have been met vest and all vested performance-based AUs will be paid; all unvested performance-based AUs will be forfeited. |
Kevin J. McCurry
Upon termination without cause or resignation for good reason:
| • | a lump sum cash payment equal to the sum of his base salary and target incentive bonus; |
| • | payment of any Accrued Amounts; |
125
Table of Contents
| • | a lump sum cash payment in an amount equal to six months of the Company’s cost of continued medical, dental and vision coverage for Mr. McCurry and, if applicable, his spouse and dependents, as increased by a tax gross-up for taxes imposed on such payment; |
| • | all earned performance-based RSUs granted February 2014 stop vesting on the termination date; |
| • | no performance-based RSU awards granted in June 2014 vest if the termination date occurs before the end of the performance period on June 1, 2017. All unvested RSUs will be forfeited; |
| • | all time-based RSUs immediately stop vesting and unvested time-based RSUs are forfeited; and |
| • | all unpaid performance-based AUs are forfeited. |
Upon change of control:
| • | all earned but unvested performance-based RSUs granted in February 2014 fully vest; and |
| • | all performance-based AUs will fully vest if a change of control occurs before the end of the performance period on June 1, 2017 if Mr. McCurry continues employment through the date of the change of control. |
Upon certain terminations in connection with a change of control:
| • | the payments and benefits described above under “termination without cause or for good reason”; |
| • | for performance-based RSUs granted in June 2014, if the change of control occurs on or before the end of the performance period on June 1, 2017 and employment is subsequently terminated without cause, the attainment of performance goals and vesting will be determined based upon the share price on the change of control date; and |
| • | time-based RSUs granted in February 2014 and June 2014 will fully vest if employment is terminated without cause within six months and twelve months, respectively, following a change of control. |
Upon retirement or other voluntary termination:
| • | payment of any Accrued Amounts; and |
| • | all RSUs immediately stop vesting, and no additional performance-based RSUs will be earned after the termination date; and all unvested RSUs are forfeited; |
| • | all unpaid performance-based AUs are forfeited. |
Upon termination due to disability or death:
| • | payment of any Accrued Amounts; |
| • | in the event of death, Mr. McCurry’s beneficiary will receive payments under an insurance policy funded by the Company; |
| • | all earned but unvested performance-based RSUs granted February 2014 fully vest; |
| • | time-based RSUs granted in 2014 will immediately stop vesting and unvested awards will be forfeited if employment terminates due to disability; |
| • | if employment terminates due to death, time-based RSUs granted February 2014 vest as to (i) 50% if the death occurs before the first anniversary of the grant date on February 20, 2015, (ii) 75% if death occurs between the first anniversary of the grant date, February 20, 2015 and the second anniversary of the grant date, February 20, 2016, and (iii) 100% if death occurs after the second anniversary of the grant date on February 20, 2016; |
| • | performance and time-based RSUs granted in June 2014 vest as to (i) 66.67% if death occurs prior to the first anniversary of the grant date on June 1, 2015, and (ii) 100% if death occurs on or after the first anniversary of the grant date, June 1, 2015 and before the third anniversary of the grant date, June 1, |
126
Table of Contents
| 2017. With respect to performance-based RSUs granted in June 2014, if Mr. McCurry’s death occurs before a change of control, the vested amount will be based on the target percentage and not on actual performance; |
| • | no performance-based RSUs granted in June 2014 vest if employment terminates due to disability before the end of the performance period on June 1, 2017 and unvested performance-based RSUs are forfeited; and |
| • | all performance-based AUs for which the stock price thresholds have been met vest and all vested performance-based AUs will be paid; all unvested performance-based AUs will be forfeited. |
Brian A. Traquair
Note, that Mr. Traquair does not have an employment agreement with us and the amount of compensation he would receive upon certain terminations of employment or a change of control, if any, are based upon our compensation plans and Canadian law.
Upon termination without cause:
| • | in accordance with Canadian law, Mr. Traquair is entitled to notice, or pay in lieu of notice, based on his 20 year tenure with the Company and other factors. Subject to his obligation to mitigate his damages, his pay in lieu of notice would be approximately 20 months of total compensation based on his annual base salary and target incentive bonus; |
| • | in accordance with Canadian law, a lump sum cash payment equal to 20 months of the Company’s cost of Mr. Traquair’s medical, dental, long term disability and life insurance coverage, as well as 20 months of contributions made by the Company to a retirement savings program for Mr. Traquair’s benefit; |
| • | all earned but unvested performance-based RSUs granted in 2012 and 2013 fully vest; |
| • | no performance-based RSUs granted in 2014 vest if the termination date occurs before the end of the performance period on June 1, 2017. All unvested RSUs are forfeited; |
| • | all time-based RSU awards immediately stop vesting and all unvested time-based RSUs are forfeited; and |
| • | all unpaid performance-based AUs are forfeited. |
Upon a change of control:
| • | all earned but unvested performance-based RSUs granted in 2012 and 2013 fully vest; and |
| • | all performance-based AUs fully vest if a change of control occurs before the end of the performance period on June 1, 2017 and if Mr. Traquair continues in employment through the date of the change of control. |
Upon certain terminations in connection with a change of control:
| • | in accordance with Canadian law, if a change of control occurs and employment is terminated without cause, Mr. Traquair is entitled to notice, or pay in lieu of notice, based on his 20 year tenure with the Company and other factors. Subject to his obligation to mitigate his damages, his pay in lieu of notice would be approximately 20 months of total compensation based on his annual base salary and target incentive bonus; |
| • | in accordance with Canadian law, if a change of control occurs and employment is terminated without cause, Mr. Traquair is entitled to a lump sum cash payment equal to 20 months of the Company’s cost of Mr. Traquair’s medical, dental, long term disability and life insurance coverage, as well as 20 months of contributions made by the Company to a retirement savings program for Mr. Traquair’s benefit; |
127
Table of Contents
| • | for performance-based RSUs granted in 2014, if a change of control occurs on or before the end of the performance period on June 1, 2017 and employment is subsequently terminated without cause, attainment of performance goals and vesting will be determined based upon the share price on the change of control date; and |
| • | all unvested time-based RSUs granted in 2011-2013 and 2014 fully vest if employment is terminated without cause within six months and twelve months, respectively, following a change of control. |
Upon retirement or other voluntary termination:
| • | a lump sum cash payment of any Accrued Amounts; |
| • | all RSUs immediately stop vesting, and no additional performance-based RSUs will be earned after the termination date; and all unvested RSUs are forfeited; and |
| • | all unpaid performance-based AUs are forfeited. |
Upon termination due to disability or death:
| • | upon termination due to disability under Canadian law, Mr. Traquair is entitled to eight weeks of base salary, as well as a 20 week severance payment, for a total of 28 weeks of base salary; |
| • | upon termination due to disability under Canadian law, a lump sum cash payment equal to eight weeks of the Company’s cost of Mr. Traquair’s continued medical, dental, long term disability and life insurance coverage, as well as eight weeks of contributions made by the Company to a retirement savings program for Mr. Traquair’s benefit; |
| • | payment of any Accrued Amounts; |
| • | in the event of death, Mr. Traquair’s beneficiary will receive payment under an insurance policy funded by the Company; |
| • | upon disability or death, any earned but unvested performance-based RSUs granted in 2012 and 2013 fully vest; |
| • | upon termination due to death, time-based RSU awards granted in November 2012 fully vest, time-based RSUs granted in 2013 vest as to (i) 75% if his death occurs before the second anniversary of the grant date on June 1, 2015 and (ii) 100% if his death occurs on or after the second anniversary of the grant date on June 1, 2015; time-based RSUs granted in 2011 immediately stop vesting and unvested RSUs are forfeited; |
| • | performance and time-based RSUs granted in 2014 vest as to (i) 66.67% if death occurs prior to the first anniversary of the grant date on June 1, 2015, and (ii) 100% if death occurs on or after the first anniversary of the grant date on June 1, 2015 and before the third anniversary of the grant date, June 1, 2017. With respect to performance-based RSUs granted in 2014, if Mr. Traquair’s death occurs before a change of control, the vested amount will be based on the target percentage and not on actual performance. All unvested RSUs are forfeited; |
| • | no performance-based RSU awards granted in 2014 vest if employment terminates due to disability before the end of the performance period on June 1, 2017 and unvested performance-based RSUs are forfeited; |
| • | upon termination due to disability all time-based RSUs immediately stop vesting and unvested time-based RSUs are forfeited; and |
| • | all performance-based AUs for which the stock price thresholds have been met vest and all vested performance-based AUs will be paid; all unvested performance-based AUs will be forfeited. |
In order to receive any of the above described severance benefits, the named executive, other than Mr. Traquair, is generally required to execute a release of all claims against the Company. In order to exercise
128
Table of Contents
stock options or receive distribution of shares underlying RSUs, the named executive must execute a certificate of compliance with respect to the restrictive covenants contained in his or her employment agreement, if applicable, and all other agreements with the Company.
The tables below reflect the amount of compensation payable to each of the named executives in the event of termination of such executive’s employment and/or a change of control. The amounts shown assume that such termination and/or change of control was effective as of December 31, 2014, and thus includes amounts earned through such time and are estimates of the amounts that would be paid to each named executive upon his or her termination of employment and/or change of control. The actual amounts to be paid, if any, can only be determined at the time of such named executive’s separation from the Company or the occurrence of a change of control, as applicable.
Russell P. Fradin—Potential Termination Payments and Benefits
| Executive Benefits and Payment Upon Termination |
Change in Control without a Termination of Employment |
Termination Without Cause or Resignation For Good Reason Without Change of Control |
Retirement or Other Voluntary Termination |
Termination Without Cause or Resignation For Good Reason With Change of Control |
Termination Due to Disability |
Termination Due to Death |
||||||||||||||||||
| Compensation: |
||||||||||||||||||||||||
| Base Salary & Target Bonus(1) |
— | $ | 5,400,000 | — | $ | 5,400,000 | — | — | ||||||||||||||||
| Bonus in Year of Termination(2) |
— | $ | 1,624,087 | $ | 1,624,087 | $ | 1,624,087 | $ | 1,624,087 | $ | 1,624,087 | |||||||||||||
| Time-Based Equity Awards(3) |
$ | 549,093 | $ | 549,093 | — | $ | 1,869,061 | — | $ | 880,008 | ||||||||||||||
| Performance-Based Equity Awards(4) |
$ | 1,637,370 | $ | 170,298 | — | $ | 5,074,700 | $ | 170,298 | $ | 2,461,965 | |||||||||||||
| Benefits & Perquisites: |
||||||||||||||||||||||||
| Health Benefits(5) |
— | $ | 23,713 | — | $ | 23,713 | — | — | ||||||||||||||||
| Life Insurance Proceeds |
— | — | — | — | — | $ | 1,000,000 | |||||||||||||||||
| Excise Tax & Gross-Up |
— | — | — | (6) | — | — | ||||||||||||||||||
|
|
|
|
|
|
|
|
|
|
|
|
|
|||||||||||||
| Total: |
$ | 2,186,463 | $ | 7,767,191 | $ | 1,624,087 | $ | 13,991,561 | $ | 1,794,385 | $ | 5,966,060 | ||||||||||||
| (1) | Consists of two times the sum of (a) 2014 base salary of $900,000 and (b) 2014 target incentive bonus of $1,800,000. |
| (2) | Because Mr. Fradin’s termination is deemed to have occurred on December 31, he is entitled to receive his actual, earned incentive bonus for 2014. |
| (3) | Represents the value of the applicable accelerated portion of time-based equity based upon a fair market price of $16.94 per Unit as of December 31, 2014. |
| (4) | Represents the value of the applicable accelerated portion of performance-based equity based upon a fair market price of $16.94 per Unit as of December 31, 2014. |
| (5) | Represents the cost of premiums under COBRA for medical, dental and vision coverage less employee co-pay for such coverage for 18 months, as increased by a tax gross-up payment equal to the estimated taxes that would be imposed on such payments. |
| (6) | The Company and Mr. Fradin have agreed to cooperate to obtain shareholder approval of any change of control payments that would otherwise be subject to excise tax under section 4999 of the Internal Revenue Code, so the estimates assume that no excise will apply. |
129
Table of Contents
Charles J. Neral—Potential Termination Payments and Benefits
| Executive Benefits and Payment Upon Termination |
Change in Control without a Termination of Employment |
Termination Without Cause or Resignation For Good Reason Without Change of Control |
Termination Due to Retirement or Other Voluntary Termination |
Termination Without Cause or Resignation For Good Reason With Change of Control |
Termination Due to Disability |
Termination Due to Death |
||||||||||||||||||
| Compensation: |
||||||||||||||||||||||||
| Base Salary & Target Bonus(1) |
— | $ | 1,150,000 | — | $ | 2,300,000 | — | — | ||||||||||||||||
| Bonus in Year of Termination(2) |
— | $ | 515,931 | $ | 515,931 | $ | 515,931 | $ | 515,931 | $ | 515,931 | |||||||||||||
| Time-Based Equity Awards(3) |
— | — | $ | 970,501 | — | $ | 286,847 | |||||||||||||||||
| Performance-Based Equity |
$ | 307,972 | $ | 73,600 | — | $ | 1,488,240 | $ | 73,600 | $ | 386,565 | |||||||||||||
| Benefits & Perquisites: |
||||||||||||||||||||||||
| Health Benefits(5) |
— | $ | 7,992 | — | $ | 7,992 | — | — | ||||||||||||||||
| Life Insurance Proceeds |
— | — | — | — | — | $ | 1,000,000 | |||||||||||||||||
|
|
|
|
|
|
|
|
|
|
|
|
|
|||||||||||||
| Total: |
$ | 307,972 | $ | 1,747,523 | $ | 515,931 | $ | 5,282,664 | $ | 589,531 | $ | 2,189,343 | ||||||||||||
| (1) | With regard to (i) a termination without cause or for good reason, consists of the sum of (a) 2014 base salary of $575,000 and (b) 2014 target incentive bonus of $575,000, and (ii) a termination without cause or for good reason in connection with a change of control or a Potential Change of Control, consists of two times the sum of (a) 2014 base salary of $575,000 and (b) 2014 target incentive bonus of $575,000. |
| (2) | Because Mr. Neral’s termination is deemed to have occurred on December 31, he is entitled to receive his actual, earned incentive bonus for 2014. |
| (3) | Represents the value of the applicable accelerated portion of time-based equity based upon a fair market price of $16.94 per Unit as of December 31, 2014. |
| (4) | Represents the value of the applicable accelerated portion of performance-based equity based upon a fair market price of $16.94 per Unit as of December 31, 2014. |
| (5) | Consists of the sum of the Company’s cost for Mr. Neral’s medical, dental and vision coverage for one year. The health benefits have been increased by a tax gross-up equal to the estimated income and FICA tax that would be imposed on such payments. |
Marianne C. Brown—Potential Termination Payments and Benefits
| Executive Benefits and Payment Upon Termination |
Change in Control without a Termination of Employment |
Termination Without Cause or Resignation For Good Reason Without Change of Control |
Termination Due to Retirement or Other Voluntary Termination |
Termination Without Cause or Resignation For Good Reason With Change of Control |
Termination Due to Disability |
Termination Due to Death |
||||||||||||||||||
| Compensation: |
||||||||||||||||||||||||
| Base Salary & Target Bonus(1) |
$ | 1,650,000 | — | $ | 1,650,000 | — | — | |||||||||||||||||
| Bonus in Year of Termination(2) |
$ | 883,364 | $ | 883,364 | $ | 883,364 | $ | 883,364 | $ | 883,364 | ||||||||||||||
| Time-Based Equity Awards(3) |
$ | 800,712 | — | $ | 800,712 | — | $ | 431,498 | ||||||||||||||||
| Performance-Based Equity |
$ | 404,593 | $ | 1,304,415 | — | $ | 1,151,850 | $ | 170,221 | $ | 668,417 | |||||||||||||
| Benefits & Perquisites: |
||||||||||||||||||||||||
| Health and Welfare Benefits(5) |
$ | 19,407 | — | $ | 19,407 | — | — | |||||||||||||||||
| Life Insurance Proceeds |
— | — | — | — | $ | 1,000,000 | ||||||||||||||||||
|
|
|
|
|
|
|
|
|
|
|
|
|
|||||||||||||
| Total: |
$ | 404,593 | $ | 4,657,898 | $ | 883,364 | $ | 4,505,333 | $ | 1,053,585 | $ | 2,983,279 | ||||||||||||
| (1) | Consists of the sum of (a) 2014 base salary of $700,000, and (b) 2014 target incentive bonus of $950,000. |
| (2) | Because Ms. Brown’s termination is deemed to have occurred on December 31, she is entitled to receive her actual, earned incentive bonus for 2014. |
| (3) | Represents the value of the applicable accelerated portion of time-based equity based upon a fair market price of $16.94 per Unit as of December 31, 2014. |
| (4) | Represents the value of the accelerated portion of performance-based equity based upon a fair market price of $16.94 per Unit as of December 31, 2014. |
| (5) | Consists of the sum of the Company’s cost for Ms. Brown’s medical, dental and vision coverage for one year. The health benefits have been increased by a tax gross-up equal to the estimated income and FICA tax that would be imposed on such payments. |
130
Table of Contents
Kevin J. McCurry—Potential Termination Payments and Benefits
| Executive Benefits and Payment Upon Termination |
Change in Control without a Termination of Employment |
Termination Without Cause or Resignation For Good Reason Without Change of Control |
Termination Due to Retirement or Other Voluntary Termination |
Termination Without Cause or Resignation For Good Reason With Change of Control |
Termination Due to Disability |
Termination Due to Death |
||||||||||||||||||
| Compensation: |
||||||||||||||||||||||||
| Base Salary & Target Bonus(1) |
$ | 750,000 | — | $ | 750,000 | — | — | |||||||||||||||||
| Bonus in Year of Termination(2) |
$ | 324,106 | $ | 324,106 | $ | 324,106 | $ | 324,106 | $ | 324,106 | ||||||||||||||
| Time-Based Equity Awards(3) |
— | — | $ | 368,901 | — | $ | 205,009 | |||||||||||||||||
| Performance-Based Equity |
$ | 92,274 | — | — | $ | 297,248 | — | $ | 166,924 | |||||||||||||||
| Benefits & Perquisites: |
||||||||||||||||||||||||
| Health and Welfare Benefits(5) |
$ | 10,797 | — | $ | 10,797 | — | — | |||||||||||||||||
| Life Insurance Proceeds |
— | — | — | — | $ | 800,000 | ||||||||||||||||||
|
|
|
|
|
|
|
|
|
|
|
|
|
|||||||||||||
| Total: |
$ | 92,274 | $ | 1,084,903 | $ | 324,106 | $ | 1,751,052 | $ | 324,106 | $ | 1,496,039 | ||||||||||||
| (1) | Consists of the sum of (a) 2014 base salary of $400,000, and (b) 2014 target incentive bonus of $350,000. |
| (2) | Because Mr. McCurry’s termination is deemed to have occurred on December 31, he is entitled to receive his actual earned bonus for 2014. |
| (3) | Represents the value of the applicable accelerated portion of time-based equity based upon a fair market price of $16.94 per Unit as of December 31, 2014. |
| (4) | Represents the value of the applicable accelerated portion of performance-based equity based upon a fair market price of $16.94 per Unit as of December 31, 2014. |
| (5) | Consists of the sum of the Company’s cost for Mr. McCurry’s medical, dental and vision coverage for six months. The health benefits have been increased by a tax gross-up equal to the estimated income and FICA tax that would be imposed on such payments. |
Brian A. Traquair—Potential Termination Payments and Benefits
| Executive Benefits and Payment Upon Termination |
Change in Control without a Termination of Employment |
Termination Without Cause Without Change of Control |
Termination Resignation |
Termination Without Cause With Change of Control |
Termination Due to Disability |
Termination Due to Death |
||||||||||||||||||
| Compensation |
||||||||||||||||||||||||
| Base Salary & Target Bonus(1) |
$ | 1,929,655 | — | $ | 1,929,655 | $ | 311,714 | (6) | — | |||||||||||||||
| Bonus in Year of Termination(2) |
$ | 494,874 | $ | 494,874 | $ | 494,874 | $ | 494,874 | $ | 494,874 | ||||||||||||||
| Time-Based Equity Awards(3) |
— | — | $ | 739,225 | — | $ | 316,399 | |||||||||||||||||
| Performance-Based Equity Awards(4) |
$ | 541,879 | $ | 307,507 | — | $ | 979,981 | $ | 307,507 | $ | 599,590 | |||||||||||||
| Benefits & Perquisites: |
||||||||||||||||||||||||
| Health and Welfare Benefits |
$ | 36,938 | (5) | — | $ | 36,938 | (5) | $ | 3,694 | (7) | — | |||||||||||||
| Life Insurance Proceeds |
— | — | — | — | $ | 1,000,000 | ||||||||||||||||||
| Total: |
$ | 541,879 | $ | 2,768,974 | $ | 494,874 | $ | 4,180,673 | $ | 1,117,789 | $ | 2,410,863 | ||||||||||||
| (1) | Consists of 20 months of the sum of (a) 2014 base salary of $578,897 and (b) 2014 target incentive bonus of $578,897. Mr. Traquair’s payments would be in Canadian Dollars. The amounts reported in the table for salary, bonus, health & welfare and disability have been converted from Canadian Dollars into U.S. dollars at the December 31, 2014 currency exchange rate of 0.86274. |
| (2) | Because Mr. Traquair’s termination is deemed to have occurred on December 31, he is entitled to receive his actual, earned incentive bonus for 2014. |
| (3) | Represents the value of the applicable accelerated portion of time-based equity based upon a fair market price of $16.94 per Unit as of December 31, 2014. |
| (4) | Represents the value of the applicable accelerated portion of performance-based equity based upon a fair market price of $16.94 per Unit as of December 31, 2014. |
| (5) | Consists of 20 months of the sum of the Company’s cost for Mr. Traquair’s (i) medical, dental, long term disability, basic life & accidental death coverages, and (ii) pension contributions. |
| (6) | Represents 28 weeks of 2014 base salary. |
| (7) | Consists of 2 months of the sum of the Company’s cost for Mr. Traquair’s (i) medical, dental, long term disability, basic life & accidental death coverages, and (ii) pension contributions. |
131
Table of Contents
2015 Incentive Plan
In connection with this offering, we will adopt a new omnibus incentive plan pursuant to which a total of shares of our common stock will be reserved for issuance. Following this offering, we expect to grant equity awards to our named executive officers under the new equity incentive plan from time to time, but we have not determined at the current time the schedule or amount of such grants.
Director Compensation
We do not currently pay our directors who are either employed by us or by our Sponsors any compensation for their services as directors. All of our directors are reimbursed for out-of-pocket expenses they incur in connection with their services as directors. Following the completion of this offering, we intend to adopt a formal non-employee director compensation policy.
132
Table of Contents
The following table and accompanying footnotes set forth certain information regarding the beneficial ownership of our common stock as of May 15, 2015, by (1) each individual or entity known by us to be the beneficial owner of more than 5% of our outstanding common stock, (2) each member of our board of directors, (3) each of our named executive officers and (4) all of the members of our board of directors and our executive officers as a group. We had shares of our common stock outstanding as of , 2015, which were owned by holders of record.
A person is a “beneficial owner” of a security if that person has or shares “voting power,” which includes the power to vote or to direct the voting of the security, or “investment power,” which includes the power to dispose of or to direct the disposition of the security or has the right to acquire such powers within 60 days.
To our knowledge, unless otherwise noted in the footnotes to the following table, and subject to applicable community property laws, the persons named in the table have sole voting and investment power with respect to their beneficially owned common stock.
Securities subject to option grants that have vested or will vest within 60 days are deemed outstanding for calculating the percentage ownership of the person holding the options, but are not deemed outstanding for calculating the percentage ownership of any other person. Percentage computations are based on shares of our common stock beneficially outstanding as of , 2015 and outstanding following this offering (or shares if the underwriters exercise in full their option to purchase additional shares).
Except as otherwise indicated in the footnotes below, the address of each beneficial owner is c/o SunGard, 680 East Swedesford Road, Wayne, Pennsylvania 19087.
| Common Stock Beneficially Owned After this Offering | ||||||||||||||
| Name of Beneficial Owner |
Common Stock Beneficially Owned Prior to this Offering(1) |
Assuming the Underwriters’ Option is not Exercised |
Assuming the Underwriters’ Option is Exercised in Full(2) | |||||||||||
| Number | % | Number | % | Number | % | |||||||||
| Investment funds affiliated with Bain Capital Partners(3) |
13.51 | % | ||||||||||||
| Investment funds affiliated with The Blackstone Group(4) |
13.51 | % | ||||||||||||
| Investment funds affiliated with Goldman, Sachs & Co.(5) |
11.01 | % | ||||||||||||
| Investment funds affiliated with KKR & Co. L.P.(6) |
13.51 | % | ||||||||||||
| Investment funds affiliated with Providence Equity Partners(7) |
8.26 | % | ||||||||||||
| Investment funds affiliated with Silver Lake Partners(8) |
13.37 | % | ||||||||||||
| Investment funds affiliated with TPG Capital(9) |
13.51 | % | ||||||||||||
| Marianne C. Brown(10) |
* | |||||||||||||
| Russell P. Fradin(10) |
* | |||||||||||||
| Glenn H. Hutchins(8)(11) |
13.37 | % | ||||||||||||
| David L. Johnson(12) |
— | |||||||||||||
| Ian K. Loring(13) |
— | |||||||||||||
| John W. Marren(14) |
— | |||||||||||||
| Kevin J. McCurry(10) |
* | |||||||||||||
133
Table of Contents
| Common Stock Beneficially Owned After this Offering | ||||||||||||||
| Name of Beneficial Owner |
Common Stock Beneficially Owned Prior to this Offering(1) |
Assuming the Underwriters’ Option is not Exercised |
Assuming the Underwriters’ Option is Exercised in Full(2) | |||||||||||
| Number | % | Number | % | Number | % | |||||||||
| Sanjeev K. Mehra(5)(15) |
11.01 | % | ||||||||||||
| Charles J. Neral(10) |
* | |||||||||||||
| R. Davis Noell(7)(16) |
8.26 | % | ||||||||||||
| John I. Park(17) |
— | |||||||||||||
| Brian A. Traquair |
* | |||||||||||||
| Directors and current executive officers as a group (16 persons)(10)(11)(12)(13)(14)(15)(16)(17)(18) |
33.91 | % | ||||||||||||
| * | Less than 1%. |
| (1) | The underwriters have the option to purchase up to an additional shares from us at the initial public offering price, less the underwriting discounts and commissions, within 30 days of the date of this prospectus. |
| (2) | Includes shares held in the beneficial owner’s name or jointly with others, or in the name of a bank, nominee or trustee for the beneficial owner’s account. Unless otherwise indicated in the footnotes to this table and subject to community property laws where applicable, we believe that each stockholder named in this table has sole voting and investment power with respect to the shares indicated as beneficially owned. |
| (3) | Includes (i) shares of common stock held by Bain Capital Integral Investors, LLC (“Bain Integral”), whose administrative member is Bain Capital Investors, LLC (“BCI”); and (ii) shares of common stock held by BCIP TCV, LLC (“BCIP TCV” and, together with Bain Integral, the “Bain Funds”), whose administrative member is BCI. The address of each of the entities listed in this footnote is c/o Bain Capital, LLC, John Hancock Tower, 200 Clarendon Street, Boston, Massachusetts 02116. |
| (4) | Includes (i) shares of common stock held by Blackstone Capital Partners IV L.P. (“BCP IV”), whose general partner is Blackstone Management Associates IV L.L.C. (“BMA IV”); (ii) shares of common stock held by Blackstone Capital Partners IV-A L.P. (“BCP IV-A”), whose general partner is BMA IV; (iii) shares of common stock held by Blackstone Family Investment Partnership IV-A L.P. (“BFIP IV-A”), whose general partner is BCP IV Side-by-Side GP L.L.C.; (iv) shares of common stock held by Blackstone Participation Partnership IV L.P. (“BPP IV”), whose general partner is BCP IV Side-by-Side GP L.L.C.; (v) shares of common stock held by Blackstone GT Communications Partners L.P. (“BGTCP”), whose general partner is Blackstone Communications Management Associates I L.L.C. (“BCMA IV”); and (vi) shares of common stock held by Blackstone Family Communications Partnership I L.P. (“BFCP” and, collectively with BCP IV, BCP IV-A, BFIP IV-A, BPP IV and BGTCP, the “Blackstone Funds”), whose general partner is BCOM IV Side-by-side GP L.L.C. Blackstone Holdings III L.P. is the majority member of BMA IV, the general partner of BCMA IV and the sole member of each of BCP IV Side-by-Side GP L.L.C. and BCOM Side-by-Side GP L.L.C. The general partner of Blackstone Holdings III L.P. is Blackstone Holdings III GP L.P. The general partner of Blackstone Holdings III GP L.P. is Blackstone Holdings III GP Management L.L.C. The sole member of Blackstone Holdings III GP Management L.L.C. is The Blackstone Group L.P. The general partner of The Blackstone Group L.P. is Blackstone Group Management L.L.C. Blackstone Group Management L.L.C. is wholly-owned by Blackstone’s senior managing directors and controlled by its founder, Stephen A. Schwarzman. Each of such entities (other than the Blackstone Funds to the extent of their direct holdings) and Mr. Schwarzman may be deemed to beneficially own the shares beneficially owned by the Blackstone Funds directly or indirectly controlled by it or him, but each disclaims beneficial ownership of such shares. The address of each of Mr. Schwarzman and each of the other entities listed in this footnote is c/o The Blackstone Group L.P., 345 Park Avenue, New York, New York 10154. |
134
Table of Contents
| (5) | The Goldman Sachs Group, Inc., which we refer to as GS Group, Goldman, Sachs & Co., which we refer to as Goldman Sachs, and certain of their affiliates may be deemed to own beneficially and indirectly Class A shares, Class L shares and preferred shares which are owned directly or indirectly by investment partnerships of which affiliates of Goldman Sachs and GS Group are the general partner, managing limited partner or managing partner. We refer to these investment partnerships as the GS Limited Partnerships. Goldman Sachs is an affiliate of each of, and investment manager for certain of, the GS Limited Partnerships. GS Group, Goldman, Sachs and the GS Limited Partnerships share voting power and investment power with certain of their respective affiliates. The GS Limited Partnerships and their respective beneficial ownership of shares of SunGard and SCC II include: (i) shares of common stock held by GS Capital Partners 2000, L.P.; (ii) shares of common stock held by GS Capital Partners 2000 Employee Fund, L.P.; (iii) shares of common stock held by GS Capital Partners 2000 Offshore, L.P.; (iv) shares of common stock held by Goldman Sachs Direct Investment Fund 2000, L.P.; (v) shares of common stock held by GS Capital Partners 2000 GmbH & Co. Beteiligungs KG; (vi) shares of common stock held by GS Capital Partners V Fund, L.P.; (vii) shares of common stock held by GS Capital Partners V Offshore Fund, L.P.; (viii) shares of common stock held by GS Capital Partners V GmbH & Co. KG; and (ix) shares of common stock held by GS Capital Partners V Institutional, L.P. Each of Goldman Sachs and GS Group disclaims beneficial ownership of the shares owned directly and indirectly by the GS Limited Partnerships, except to the extent of their pecuniary interest therein, if any. The address for GS Group, Goldman Sachs and the GS Limited Partnerships is 200 West Street, New York, New York 10282. |
| (6) | Includes (i) shares of common stock held by KKR Millennium Fund L.P. (“KKR Millennium Fund”), whose general partner is KKR Associates Millennium L.P., whose general partner is KKR Millennium GP LLC; and (ii) shares of common stock held by KKR Partners III, L.P. (“KKR III” and, together with KKR Millennium Fund, the “KKR Funds”), whose general partner is KKR III GP LLC. As the designated members of KKR Management LLC, which indirectly controls or manages KKR Millennium GP LLC, and as the managing members of KKR III GP LLC, Messrs. Henry R. Kravis and George R. Roberts may be deemed to share beneficial ownership of the shares held or controlled by the KKR Funds. Each of KKR Associates Millennium L.P., KKR Millennium GP LLC, KKR III GP LLC and Messrs. Kravis and Roberts disclaims beneficial ownership of such shares. The address of each of the entities listed in this footnote is c/o Kohlberg Kravis Roberts & Co. L.P., 9 West 57th Street, New York, New York 10019. |
| (7) | Includes (i) shares of common stock held by Providence Equity Partners V LP (“PEP V”), whose general partner is Providence Equity GP V LP, whose general partner is Providence Equity Partners V L.L.C. (“PEP V LLC”); and (ii) shares of common stock held by Providence Equity Partners V-A LP (“PEP V-A” and, together with PEP V, the “Providence Equity Funds”), whose general partner is Providence Equity GP V LP, whose general partner is PEP V LLC. PEP V LLC may be deemed to share beneficial ownership of the shares owned by PEP V and PEP V-A. PEP V LLC disclaims this beneficial ownership. Messrs. Angelakis, Creamer, Masiello, Mathieu, Nelson, Pelson and Salem are members of PEP V LLC and may also be deemed to possess indirect beneficial ownership of the securities owned by the Providence Equity Funds, but disclaim such beneficial ownership. The address of each of the entities listed in this footnote is c/o Providence Equity Partners Inc., 50 Kennedy Plaza, 18th Floor, Providence, Rhode Island 02903. |
| (8) | Includes (i) shares of common stock held by Silver Lake Partners II, L.P. (“SLP II”), whose general partner is Silver Lake Technology Associates II, L.L.C. (“SLTA II”); and (ii) shares of common stock held by Silver Lake Technology Investors II, L.P. (“SLTI II” and, together with SLP II, the “Silver Lake Funds”), whose general partner is SLTA II. The address of each of the entities listed in this footnote is c/o Silver Lake, 2775 Sand Hill Road, Suite 100, Menlo Park, California 94025. |
| (9) | Includes (i) shares of common stock held by TPG Partners IV, L.P. (“Partners IV”), whose general partner is TPG GenPar IV, L.P. (“GenPar IV”), whose general partner is TPG GenPar IV Advisors, LLC (“Advisors IV”), whose managing member is TPG Holdings I, L.P., whose general partner is TPG Holdings I-A, LLC, whose sole member is TPG Group Holdings (SBS), L.P., whose sole general partner is TPG Group Holdings (SBS) Advisors, Inc., a Delaware corporation (“Group Advisors”); (ii) shares of |
135
Table of Contents
| common stock held by T3 Partners II, L.P. (“T3 Partners II”), whose general partner is T3 GenPar II, L.P. (“T3 GenPar II”), whose general partner is T3 Advisors II, Inc. (“T3 Advisors II”); (iii) shares of common stock held by T3 Parallel II, L.P. (“T3 Parallel II”), whose general partner is T3 GenPar II; (iv) shares of common stock held by TPG Solar III LLC (“Solar III”), whose managing member is TPG Partners III, L.P., whose general partner is TPG GenPar III, L.P., whose general partner is TPG Advisors III, Inc. (“Advisors III”); and (v) shares of common stock held by TPG Solar Co-Invest LLC (“Solar Co-Invest” and, collectively with Partners IV, T3 Partners II, T3 Parallel II and Solar III, the “TPG Funds”), whose managing member is TPG Advisors IV, Inc., a Delaware corporation (“Advisors IV”). David Bonderman and James G. Coulter are officers and sole shareholders of Group Advisors, T3 Advisors II, Advisors III and Advisors IV and may therefore be deemed to beneficially own the shares held by the TPG Funds. Messrs. Bonderman and Coulter disclaim beneficial ownership of the shares held by the TPG Funds except to the extent of their pecuniary interest therein. The address of TPG Funds and Messrs. Bonderman and Coulter is c/o TPG Global, LLC, 301 Commerce Street, Suite 3300, Fort Worth, Texas 76102. |
| (10) | Includes the following shares which the beneficial owner has the right to acquire within 60 days after March 1, 2015 by stock option exercise or RSU distribution: |
| Beneficial Owner |
Shares of Common Stock | |
| Marianne C. Brown |
||
| Russell P. Fradin |
||
| Kevin J. McCurry |
||
| Charles J. Neral |
||
| Brian A. Traquair |
||
| Directors and current executive officers as a group (16 persons) |
| (11) | Mr. Hutchins, a director of the Parent Companies and SunGard, is a co-founder of Silver Lake. Amounts disclosed for Mr. Hutchins are also included above in the amounts disclosed in the table next to “Silver Lake Funds.” Mr. Hutchins disclaims beneficial ownership of any shares owned directly or indirectly by the Silver Lake Funds, except to the extent of his pecuniary interest therein. |
| (12) | Mr. Johnson, a director of the Parent Companies and SunGard, is an employee of an affiliate of The Blackstone Group, L.P. Mr. Johnson disclaims beneficial ownership of any shares owned directly or indirectly by the Blackstone Funds, except to the extent of his pecuniary interest therein. |
| (13) | Does not include shares held by the Bain Funds. The governance, investment strategy and decision-making process with respect to investments held by the Bain Funds is directed by BCI’s Global Private Equity Board (“GPEB”), which is comprised of the following individuals: Steve Barnes, Joshua Bekenstein, John Connaughton, Stephen Pagliuca, Michel Plantevin, Dwight Poler and Jonathan Zhu. Because of the relationships described in this footnote, GPEB may be deemed to exercise voting and dispositive power with respect to the shares held by the Bain Funds. Each of the members of GPEB disclaims beneficial ownership of such shares to the extent attributed to such member solely by virtue of serving on GPEB. Mr. Loring, a director of the Parent Companies and SunGard, is a Managing Director of Bain Capital Investors, LLC and may therefore be deemed to beneficially own the amounts disclosed in the table next to “Bain Funds.” Mr. Loring expressly disclaims beneficial ownership of any such securities except to the extent of his pecuniary interest therein. |
| (14) | Mr. Marren, a director of the Parent Companies and SunGard, is a senior partner of TPG Capital, L.P., an affiliate of the TPG Funds. Mr. Marren does not have voting or investment power over, and disclaims beneficial ownership of, the shares held by the TPG Funds. |
| (15) | Mr. Mehra, a director of the Parent Companies and SunGard, is a Managing Director of Goldman Sachs. Amounts disclosed for Mr. Mehra are also included above in the amounts disclosed in the table next to “GS Limited Partnerships.” Mr. Mehra disclaims beneficial ownership of any shares owned directly or indirectly by the GS Limited Partnerships, except to the extent of his pecuniary interest therein. |
| (16) | Mr. Noell, a director of the Parent Companies and SunGard, is a Managing Director of Providence Equity L.L.C., an affiliate of the Providence Equity Funds. Amounts disclosed for Mr. Noell are also included above in the amounts disclosed in the table next to “Providence Equity Funds.” Mr. Noell disclaims |
136
Table of Contents
| beneficial ownership of any shares owned directly or indirectly by the Providence Equity Funds, except to the extent of his pecuniary interest therein. |
| (17) | Mr. Park, a director of the Parent Companies and SunGard, is an executive of Kohlberg Kravis Roberts & Co. L.P. and/or one or more of its affiliates. Mr. Park disclaims beneficial ownership of any shares owned directly or indirectly by the KKR Funds, except to the extent of his pecuniary interest therein. |
| (18) | Excluding shares beneficially owned by Messrs. Hutchins, Mehra and Noell, shares of common stock are beneficially owned by all directors and executive officers as a group. |
137
Table of Contents
CERTAIN RELATIONSHIPS AND RELATED PARTY TRANSACTIONS
Statement of Policy Regarding Transactions with Related Persons
Prior to the consummation of this offering, our board of directors will adopt a written statement of policy regarding transactions with related persons, which we refer to as our “related person policy.”
Management Agreement
In connection with the LBO, the Company and its subsidiaries entered into a management agreement (the “Management Agreement”) with affiliates of each of the Sponsors pursuant to which such entities or their affiliates will provide management consulting services, including financial, managerial and operational advice and implementation of strategies for improving the operating, marketing and financial performance of the Company and its subsidiaries. In March 2014, the Company and the Sponsors amended the Management Agreement to increase the management fee from 1% to 1.1% of quarterly “EBITDA” (as defined in the Indenture dated August 11, 2005 governing the senior notes due 2013 (but assuming the management fee had not been paid for purposes of such calculation)) for five of seven Sponsors and fixed payments of $50,000 per quarter for each of the two remaining Sponsors, Bain and KKR. The sponsors also receive reimbursement for out-of-pocket expenses incurred by them or their affiliates in connection with the provision of services pursuant to the agreement. For the years ended December 31, 2012, 2013 and 2014, the Company recorded $9 million, $8 million and $9 million, respectively, relating to management fees in continuing operations. In addition, for the years ended December 31, 2012 and 2013, SunGard recorded $23 million and $4 million, respectively, relating to management fees in discontinued operations.
The initial term of the Management Agreement is ten years, and it extends annually for one year unless the Sponsors or the Company and its subsidiaries provide notice of termination to the other. Finally, the Management Agreement provides that affiliates of the Sponsors will be entitled to receive a fee equal to 1% of the gross transaction value in connection with certain subsequent financing, acquisition, disposition and change of control transactions in excess of a threshold amount.
We expect that in connection with this offering, the Management Agreement will be amended or terminated.
Other Shareholder Agreements
Also in connection with the LBO, the Company and its subsidiaries entered into a stockholders agreement (the “Stockholders Agreement”), a participation, registration rights and coordination agreement (the “Registration Rights Agreement”) and a principal investor agreement (the “Principal Investor Agreement”) with affiliates of each of the Sponsors and certain other shareholders of the Company. These agreements provide for, among other things, restrictions on transfer of our common stock; certain “tag-along” and “drag-along” rights in transactions that would constitute a change in control of the Company; rights to cause us to register shares of our common stock held by our shareholders and, if requested, to maintain an effective shelf registration statement with respect to such shares; rights to designate members to our board of directors and rights to vote with respect to specified corporate matters. In March 2014, the Company and the Sponsors amended these agreements in connection with the AS-Split-Off. We and the Sponsors expect to amend and restate one or more of these agreements in connection with this offering. We will describe the material terms of these agreements giving effect to any such amendments in a subsequent pre-effective amendment to the registration statement of which this prospectus is a part.
Agreements Related to the AS Split-Off
On March 31, 2014, in connection with the AS Split-Off, we entered into the following agreements:
(i) a Trademark License Agreement that sets forth the terms under which SpinCo and its affiliates are permitted to use the mark “SUNGARD AVAILABILITY SERVICES.” During the first two years following the AS Split-Off, the use of the licensed mark is royalty free. In years 3 through 5, AS will pay a royalty payment of 0.30% of their worldwide revenue, subject to certain exceptions. In years 6 and 7, the royalty will be reduced to
138
Table of Contents
0.15% and 0.075%, respectively. Following year 7, AS will have a perpetual, royalty-free license to use the mark going forward assuming they maintain compliance with the Trademark License Agreement;
(ii) a Transition Services Agreement whereby we agreed to provide certain transitional and administrative support services, including employee benefits services, to AS and AS agreed to provide transitional and administrative support services to us for up to twelve months. At December 31, 2014, we recorded approximately $2 million of accounts receivable from AS under the Transition Services Agreement;
(iii) a Global Master Services Agreement (“GMSA”) replaced the existing agreements under which AS provides certain availability services, managed services, and recovery services to us. We agreed to spend a minimum of approximately $66,400,000 under the GMSA for the period from the AS Split-Off through March 31, 2016. For the nine months ended December 31, 2014, we incurred expenses of $25 million for services provided under the GMSA and at December 31, 2014, we recorded approximately $1 million of accounts receivable, $4 million of accounts payable, and a $1 million prepaid maintenance contract related to AS under the GMSA; and
(iv) a Tax Sharing and Disaffiliation Agreement whereby responsibility was allocated between us and AS for U.S. federal, state and local, and foreign income and other taxes relating to taxable periods before and after the AS Split-Off, and provided for computation and apportionment of tax liabilities and tax benefits between the parties. AS is generally responsible for all taxes attributable to the AS business for periods subsequent to the AS Split-Off and non-income related taxes attributable to the AS business for any taxable period before and after the date of the AS Split-Off. We retain responsibility for U.S. federal, state and local, and foreign income taxes for periods ending on or before the date of the AS Split-Off.
In addition, since the AS Split-Off, we have entered into agreements with AS in the ordinary course of business in which AS has purchased our treasury products and certain data center outsourcing services that resulted in revenue to us for the nine-months ended December 31, 2014 of $363,600 and $1,347,000, respectively.
Other Transactions
In March 2013, Goldman, Sachs & Co. (“GS”) received fees of $1,000,000 in connection with the March 2013 amendment to our senior secured credit agreement.
In March 2012, GS received fees of $1,446,000 in connection with amendments to our senior secured credit agreement. In November 2012, GS received fees of $984,000 in connection with the issuance of our senior subordinated notes due 2019, and in December 2012, GS received fees of $521,000 in connection with amendments to our senior secured credit agreement.
Effective February 16, 2007, we entered into a three-year participation agreement with one-year renewal terms (“participation agreement”) with Core Trust Purchasing Group, a division of HealthTrust Purchasing Corporation (“CPG”), designating CPG as our exclusive “group purchasing organization” for the purchase of certain products and services from third-party vendors. CPG secures from vendors pricing terms for goods and services that are believed to be more favorable than participants in the group purchasing organization could obtain for themselves on an individual basis. Under the participation agreement, we must purchase 80% of the requirements of our participating locations for core categories of specified products and services, from vendors participating in the group purchasing arrangement with CPG, which for 2014 was $6,844,000, or CPG may terminate the contract. In connection with purchases by its participants (including us), CPG receives a commission from the vendors in respect of such purchases. Although CPG is not affiliated with Blackstone, in consideration for Blackstone’s facilitating our participation in CPG and monitoring the services CPG provides to us, CPG remits a portion of the commissions received from vendors in respect of our purchases under the participation agreement to an affiliate of Blackstone, with whom David Johnson, a member of our Boards of Directors, is affiliated and in which he may have an indirect pecuniary interest.
139
Table of Contents
In addition, our Sponsors and/or their respective affiliates have from time to time entered into, and may continue to enter into, arrangements with us to use our products and services, or for us to use the Sponsors affiliates’ products and services, in the ordinary course of business, which often result in revenues or costs to SunGard in excess of $120,000 annually.
In May 2014, we sold 27,317 Units at a price of $18.14 per Unit to a limited liability company which is beneficially owned by Russell P. Fradin, the President and Chief Executive Officer of SunGard and a member of our board of directors, for cash consideration of $495,424, which was the fair market value of the Units on the date of purchase. Mr. Fradin’s purchase of Units represented a reinvestment of cash proceeds he received in connection with our AS Split-Off.
140
Table of Contents
Senior Secured Credit Facilities
We have a $600 million revolving credit facility, of which $593 million was available for borrowing after giving effect to $7 million of outstanding letters of credit as of March 31, 2015. In addition, there were $4 million of letters of credit outstanding at March 31, 2015 that did not impact availability under the revolving credit facility.
On March 2, 2012, we amended our Amended and Restated Credit Agreement, dated as of August 11, 2005 (as amended and restated from time to time “Credit Agreement”) to, among other things, extend the maturity date of approximately $908 million in aggregate principal amount of tranche A and incremental term loans from February 28, 2014 to February 28, 2017 (“tranche C”), extend the maturity of the $880 million revolving credit facility commitments from May 11, 2013 to November 29, 2016, and amend certain covenants and other provisions, in order to, among other things, permit the potential spin-off of AS. The revolving credit facility commitments and tranche C each have springing maturity provisions which are described in the Credit Agreement. The interest rate on tranche C is LIBOR plus 3.75%.
On December 17, 2012, SunGard amended its Credit Agreement to, among other things, allow for the issuance of a $720 million term loan (“tranche D”), permit incremental credit extensions under the restated credit agreement in an amount up to $750 million; and modify certain covenants and other provisions in order to, among other things, permit additional restricted payments to be made with the net proceeds of the tranche D term loan and available cash in an aggregate amount not to exceed $750 million. Tranche D had certain springing maturities, and the interest rate was LIBOR plus 3.5% with a 1% LIBOR floor.
On December 31, 2012, SunGard voluntarily prepaid $48 million of its tranche A term loan and the entire outstanding incremental term loan balance of $169 million.
On March 8, 2013, SunGard amended and restated its Credit Agreement to, among other things, (i) issue an additional term loan of $2,200 million (“tranche E”) maturing on March 8, 2020, the proceeds of which were used to (a) repay in full the $1,719 million tranche B term loan and (b) repay $481 million of the tranche C term loan; (ii) replace the $880 million of revolving commitments with $850 million of new revolving commitments, which will mature on March 8, 2018; and (iii) modify certain covenants and other provisions in order to, among other things (x) modify (and in the case of the term loan facility, remove) the financial maintenance covenants included therein and (y) permit the Company to direct the net cash proceeds of permitted dispositions otherwise requiring a prepayment of term loans to the prepayment of specific tranches of term loans at the Company’s sole discretion. The interest rate on tranche E is LIBOR plus 3% with a 1% LIBOR floor.
During 2013, the Company repaid $200 million of tranche A term loans, $50 million outstanding on the revolving portion of the accounts receivable facility, and made the quarterly amortization payments on tranches D and E which totaled approximately $24 million.
On February 7, 2014, SunGard amended and restated its Credit Agreement to among other things (a) amend certain covenants and other provisions of the Credit Agreement in order to permit the AS Split-Off, including (i) the ability to effect the split-off without requiring an initial public offering, (ii) permitting AS to incur up to $1.5 billion of indebtedness in connection with the split-off, and (iii) SunGard’s total secured leverage ratio (less cash and cash equivalents in excess of $50 million), after giving pro forma effect to the split-off, to increase no more than 0.60x of Adjusted EBITDA at the time of the split-off; and (b) amend certain covenants and other provisions in order to, among other things (i) modify the financial maintenance covenant included therein, and (ii) permit the Company and its affiliates to repurchase term loans.
On February 28, 2014, SunGard repaid at maturity the remaining $7 million tranche A term loan under the Senior Secured Credit Facilities.
141
Table of Contents
On March 31, 2014, SunGard used net cash proceeds from the issuance of the SpinCo Term Loan to repay term loans (see mandatory prepayments below). Also, as a result of the AS Split-Off on March 31, 2014, SunGard’s revolving credit facility decreased from $850 million to $600 million.
Interest and Fees
Borrowings under the Credit Agreement bear interest at a rate equal to an applicable margin plus, at SunGard’s option, one of the following:
| • | LIBOR based on the costs of funds for deposits in the currency of such borrowing for either 30, 60, 90 or 180 days, or |
| • | a base rate that is the higher of: |
| • | the prime rate of JPMorgan Chase Bank, N.A. and |
| • | the federal funds rate plus one-half of 1%. |
The applicable margin for borrowings under the various Credit Agreement tranches may change subject to attaining certain leverage ratios. In addition to paying interest on outstanding principal under the Credit Agreement, the Company pays a commitment fee to the lenders under the revolving credit facility in respect of the unutilized commitments. The commitment fee rate is currently 1.00% per annum and may change subject to attaining certain leverage ratios.
As of March 31, 2015, the applicable interest rates and the effective interest rates adjusted for swaps (if applicable) were as follows:
| Applicable interest rate | Effective rate adjusted for swaps |
|||||||
| Revolving credit facility |
3.68 | % | N/A | |||||
| Tranche C |
3.92 | % | 4.44 | % | ||||
| Tranche E |
4.00 | % | 4.31 | % | ||||
N/A: Not Applicable
Collateral and Guarantors
All obligations under the Credit Agreement are fully and unconditionally guaranteed by SunGard Holdco LLC and by substantially all domestic, 100% owned subsidiaries, referred to, collectively, as Guarantors. We expect that prior to the consummation of this offering, SunGard Holdo LLC will be merged into its parent company and that SunGard Capital Corp. II will become the parent guarantor of the Credit Agreement.
Mandatory Prepayments
The Credit Agreement requires SunGard to prepay outstanding term loans, subject to certain exceptions, with 50% of annual excess cash flow (subject to attaining a certain leverage ratio) and proceeds from certain asset sales, casualty and condemnation events, other borrowings and certain financings under SunGard’s secured accounts receivable facility. Any mandatory prepayment resulting from a permitted disposition or the AS Split-Off are applied pro rata to the lenders of specific tranches of term loans at the Company’s sole discretion. All other mandatory payments would be applied pro rata to the term loan lenders and to installments of the term loans in direct order of maturity. Pursuant to the terms of the Credit Agreement, SunGard made the following mandatory prepayments:
| • | In January 2012, SunGard completed the sale of HE and used net cash proceeds (as defined in the Credit Agreement) of $1.22 billion to repay, on a pro-rata basis, $396 million, $689 million and $137 million of tranche A, tranche B and the incremental term loan, respectively. As a result of the |
142
Table of Contents
| prepayment, the Company incurred a loss on the extinguishment of debt of approximately $15 million; and |
| • | On March 31, 2014, SunGard used the $1,005 million of net cash proceeds from the issuance of the SpinCo Term Loan in connection with the AS Split-Off, to repay approximately $27 million of its tranche C term loan, $713 million of its tranche D term loan and $265 million of its tranche E term loan. |
As a result of loan prepayments, SunGard is no longer required to make quarterly principal payments on the tranche C or tranche E term loans.
Restrictive Covenants and Other Matters
The Credit Agreement contains a number of covenants that restrict, subject to certain exceptions, our ability and the ability of our restricted subsidiaries to, among other things:
| • | incur additional debt or issue preferred stock; |
| • | pay dividends and distributions on or repurchase capital stock; |
| • | create liens on assets; |
| • | enter into sale and leaseback transactions; |
| • | repay subordinated indebtedness; |
| • | make investments, loans or advances; |
| • | make capital expenditures; |
| • | engage in certain transactions with affiliates; |
| • | amend certain material agreements; |
| • | change the lines of business we conduct; and |
| • | sell assets and engage in mergers or consolidations. |
In addition, under the revolving credit facility within the Credit Agreement, we may be required to satisfy the total leverage ratio covenant if there is an amount outstanding under the revolving credit facility (minus the lesser of (i) the amount of outstanding letters of credit issued under the Credit Agreement and (ii) $25 million) that is greater than or equal to 25% of the total revolving commitments available under the Credit Agreement. If applicable, the financial maintenance covenant allows a maximum total leverage ratio of 6.00x at the end of any quarter ending on or prior to December 31, 2015 and 5.75x thereafter.
Secured Accounts Receivable Facility
We also maintain a secured accounts receivables facility, which consists of an outstanding term loan of $140 million and a revolving credit commitment of $60 million as of March 31, 2015. At March 31, 2015, $374 million of accounts receivable secured the borrowings under the receivables facility, and no amount was drawn on the revolving commitment. During January 2014, we removed the AS sellers in the accounts receivable facility and, as a result, we repaid $60 million of the term loan component which permanently reduced the facility limit. The impact of removing the AS sellers and the resulting $60 million repayment of the term loan had the effect of reducing the amount available for borrowing to an aggregate of $200 million, which is comprised of a $140 million term loan and a $60 million revolving credit commitment.
The receivables facility contains certain covenants. We are required to satisfy and maintain specified facility performance ratios, financial ratios and other financial condition tests.
143
Table of Contents
On May 14, 2014, we amended and restated our secured accounts receivable facility in order to, among other things, (i) extend the maturity date from December 19, 2017 to May 14, 2019 and (ii) reduce the applicable margin on the advances under the facility from 3.50% for LIBOR advances and 2.50% for base rate advances to 3.00% and 2.00%, respectively.
Interest Rate Swaps
We use interest rate swap agreements to manage the amount of our floating rate debt in order to reduce our exposure to variable rate interest payments associated with the senior secured credit facilities. We pay a stream of fixed interest payments for the term of the swap, and in turn, receive variable interest payments based on one-month LIBOR or three-month LIBOR (0.18% and 0.27%, respectively, at March 31, 2015). The net receipt or payment from the interest rate swap agreements is included in interest expense. As of March 31, 2015, including the impact of our outstanding interest rate swaps, the composition of our debt was 67% fixed and 33% floating. A summary of our interest rate swaps at March 31, 2015 follows (dollars in millions):
| Inception |
Maturity | Notional Amount (dollars in millions) |
Interest rate paid |
Interest rate received (LIBOR) |
||||||||||
| August-September 2012 |
February 2017 | $ | 400 | 0.69 | % | 1-Month | ||||||||
| June 2013 |
June 2019 | 100 | 1.86 | % | 3-Month | |||||||||
| September 2013 |
June 2019 | 100 | 2.26 | % | 3-Month | |||||||||
| February-March 2014 |
March 2020 | 300 | 2.27 | % | 3-Month | |||||||||
|
|
|
|||||||||||||
| Total / Weighted Average Interest Rate |
$ | 900 | 1.52 | % | ||||||||||
|
|
|
|||||||||||||
Indentures
Senior Notes
In November 2010, we issued $900 million of 7.375% senior notes due 2018 (“2018 Notes”) and $700 million of 7.625% of senior notes due 2020 (“2020 Notes” and together with 2018 Notes “Senior Notes”). The proceeds, together with other cash, were used to retire the former $1.6 billion 9.125% senior notes that would have been due 2013.
As of March 31, 2015, we had outstanding $511 million of 2018 Notes and $700 million of our 2020 Notes.
The Senior Notes (i) rank equally in right of payment to all existing and future senior debt and other obligations that are not, by their terms, expressly subordinated in right of payment to the Senior Notes, (ii) are effectively subordinated in right of payment to all existing and future secured debt to the extent of the value of the assets securing such debt, and (iii) are structurally subordinated to all obligations of each subsidiary that is not a guarantor of the Senior Notes.
All obligations under the Senior Notes are fully and unconditionally guaranteed, subject to certain exceptions, by substantially all of our domestic, 100% owned subsidiaries.
Senior Subordinated Notes
On November 1, 2012, we issued $1 billion aggregate principal amount of 6.625% senior subordinated notes due 2019 (“Senior Subordinated Notes”) and used a portion of the net proceeds from this offering to repurchase approximately $490 million of our $1.0 billion 10.25% senior subordinated notes due 2015 (“existing 10.25% senior subordinated notes”). On December 3, 2012, we redeemed the remaining existing 10.25% senior subordinated notes.
As of March 31, 2015, we had outstanding $1.0 billion of Senior Subordinated Notes.
144
Table of Contents
The Senior Subordinated Notes are unsecured senior subordinated obligations that are subordinated in right of payment to the existing and future senior debt, including the senior secured credit facilities, the 2018 Notes and the 2020 Notes. The Senior Subordinated Notes (i) rank equally in right of payment to all future senior subordinated debt, (ii) are effectively subordinated in right of payment to all existing and future secured debt to the extent of the value of the assets securing such debt, (iii) are structurally subordinated to all obligations of each subsidiary that is not a guarantor of the Senior Subordinated Notes, and (iv) rank senior in right of payment to all future debt and other obligations that are, by their terms, expressly subordinated in right of payment to the Senior Subordinated Notes.
Optional Redemption
The Senior Notes and Senior Subordinated Notes are redeemable in whole or in part, at our option, at any time at varying redemption prices that generally include premiums, which are defined in the applicable indentures.
Change of Control Offer
Upon the occurrence of a change of control, we are required to make an offer to redeem all of the Senior Notes and Senior Subordinated Notes at a redemption price equal to 101% of the aggregate principal amount thereof plus accrued and unpaid interest.
Restrictive Covenants
The indentures governing the Senior Notes and Senior Subordinated Notes contain a number of covenants that restrict, subject to certain exceptions, our ability and the ability of our restricted subsidiaries to, among other things:
| • | incur additional debt or issue certain preferred shares; |
| • | pay dividends on or make other distributions in respect of our capital stock or make other restricted payments; |
| • | make certain investments; |
| • | enter into certain types of transactions with affiliates; |
| • | create liens securing certain debt without securing the Senior Notes or Senior Subordinated Notes, as applicable; |
| • | sell certain assets, consolidate, merge, sell or otherwise dispose of all or substantially all of its assets; and |
| • | designate our subsidiaries as unrestricted subsidiaries. |
145
Table of Contents
General
The following is a description of the material terms of, and is qualified in its entirety by, our Certificate of Incorporation and Bylaws, each of which will be in effect upon the consummation of the offering, copies of which are filed as exhibits to the registration statement of which this prospectus is a part.
Our purpose is to engage in any lawful act or activity for which corporations may now or hereafter be organized under the General Corporation Law of the State of Delaware, or the DGCL.
Authorized Capital
At the time of the closing of this offering, our authorized capital stock will consist of:
| • | 1,000,000,000 shares of common stock, par value $0.01 per share, of which shares are issued and outstanding as of , 2015 and; |
| • | 100,000,000 shares of preferred stock, par value $0.01 per share, of which no shares have been issued. |
As of , there were holders of record of our common stock.
Immediately following the closing of this offering, there are expected to be shares of common stock issued and outstanding and no shares of preferred stock outstanding.
Unless our board of directors determines otherwise, we will issue all shares of our capital stock in uncertificated form.
Common Stock
Voting Rights—Holders of our common stock are entitled to one vote for each share held of record on all matters to which stockholders are entitled to vote generally, including the election or removal of directors. The holders of our common stock do not have cumulative voting rights in the election of directors.
Dividends—The DGCL permits a corporation to declare and pay dividends out of “surplus” or, if there is no “surplus,” out of its net profits for the fiscal year in which the dividend is declared and/or the preceding fiscal year. “Surplus” is defined as the excess of the net assets of the corporation over the amount determined to be the capital of the corporation by the board of directors. The capital of the corporation is typically calculated to be (and cannot be less than) the aggregate par value of all issued shares of capital stock. Net assets equals the fair value of the total assets minus total liabilities. The DGCL also provides that dividends may not be paid out of net profits if, after the payment of the dividend, capital is less than the capital represented by the outstanding stock of all classes having a preference upon the distribution of assets.
Declaration and payment of any dividend will be subject to the discretion of our board of directors. The time and amount of dividends will be dependent upon our financial condition, operations, cash requirements and availability, debt repayment obligations, capital expenditure needs and restrictions in our debt instruments, industry trends, the provisions of Delaware law affecting the payment of dividends to stockholders and any other factors our board of directors may consider relevant.
Liquidation—Upon our liquidation, dissolution or winding up and after payment in full of all amounts required to be paid to creditors and to the holders of preferred stock having liquidation preferences, if any, the holders of our common stock will be entitled to receive pro rata our remaining assets available for distribution.
Rights and Preferences—Holders of our common stock do not have preemptive, subscription, redemption or conversion rights. The common stock will not be subject to further calls or assessment by us. There will be no
146
Table of Contents
redemption or sinking fund provisions applicable to the common stock. All shares of our common stock that will be outstanding at the time of the completion of the offering will be fully paid and non-assessable. The rights, powers, preferences and privileges of holders of our common stock will be subject to those of the holders of any shares of our preferred stock we may authorize and issue in the future.
Preferred Stock
Our Certificate of Incorporation authorizes our board of directors to establish one or more series of preferred stock (including convertible preferred stock). Unless required by law or by , the authorized shares of preferred stock will be available for issuance without further action by you. Our board of directors may determine, with respect to any series of preferred stock, the powers (including voting powers), preferences and relative participations, optional or other special rights, and the qualifications, limitations or restrictions thereof, of that series, including, without limitation:
| • | the designation of the series; |
| • | the number of shares of the series, which our Board may, except where otherwise provided in the preferred stock designation, increase (but not above the total number of authorized shares of the class) or decrease (but not below the number of shares then outstanding); |
| • | whether dividends, if any, will be cumulative or non-cumulative and the dividend rate of the series; |
| • | the dates at which dividends, if any, will be payable; |
| • | the redemption rights and price or prices, if any, for shares of the series; |
| • | the terms and amounts of any sinking fund provided for the purchase or redemption of shares of the series; |
| • | the amounts payable on shares of the series in the event of any voluntary or involuntary liquidation, dissolution or winding-up of the affairs of our Company; |
| • | whether the shares of the series will be convertible into shares of any other class or series, or any other security, of our Company or any other corporation, and, if so, the specification of the other class or series or other security, the conversion price or prices or rate or rates, any rate adjustments, the date or dates as of which the shares will be convertible and all other terms and conditions upon which the conversion may be made; |
| • | restrictions on the issuance of shares of the same series or of any other class or series; and |
| • | the voting rights, if any, of the holders of the series. |
We could issue a series of preferred stock that could, depending on the terms of the series, impede or discourage an acquisition attempt or other transaction that some, or a majority, of you might believe to be in your best interests or in which you might receive a premium for your common stock over the market price of the common stock. Additionally, the issuance of preferred stock may adversely affect the holders of our common stock by restricting dividends on the common stock, diluting the voting power of the common stock or subordinating the liquidation rights of the common stock. As a result of these or other factors, the issuance of preferred stock could have an adverse impact on the market price of our common stock.
Anti-Takeover Effects of Our Certificate of Incorporation and Bylaws and Certain Provisions of Delaware Law
Our Certificate of Incorporation, Bylaws and the DGCL, which are summarized in the following paragraphs, contain provisions that are intended to enhance the likelihood of continuity and stability in the composition of our board of directors. These provisions are intended to avoid costly takeover battles, reduce our vulnerability to a hostile change of control and enhance the ability of our board of directors to maximize stockholder value in
147
Table of Contents
connection with any unsolicited offer to acquire us. However, these provisions may have an anti-takeover effect and may delay, deter or prevent a merger or acquisition of our Company by means of a tender offer, a proxy contest or other takeover attempt that a stockholder might consider in its best interest, including those attempts that might result in a premium over the prevailing market price for the shares of common stock held by stockholders.
Authorized but unissued capital stock
Delaware law does not require stockholder approval for any issuance of authorized shares. However, the listing requirements of , which would apply if and so long as our common stock remains listed on , require stockholder approval of certain issuances equal to or exceeding 20% of the then outstanding voting power or then outstanding number of shares of common stock. These additional shares may be used for a variety of corporate purposes, including future public offerings, to raise additional capital or to facilitate acquisitions.
Our board of directors may generally issue preferred shares on terms calculated to discourage, delay or prevent a change of control of our Company or the removal of our management. Moreover, our authorized but unissued shares of preferred stock will be available for future issuances without stockholder approval and could be utilized for a variety of corporate purposes, including future offerings to raise additional capital, acquisitions and employee benefit plans.
One of the effects of the existence of unissued and unreserved common stock or preferred stock may be to enable our board of directors to issue shares to persons friendly to current management, which issuance could render more difficult or discourage an attempt to obtain control of our Company by means of a merger, tender offer, proxy contest or otherwise, and thereby protect the continuity of our management and possibly deprive our stockholders of opportunities to sell their shares of common stock at prices higher than prevailing market prices.
Classified board of directors
Our Certificate of Incorporation provides that our board of directors will be divided into three classes of directors, with the classes to be as nearly equal in number as possible, and with the directors serving three-year terms. As a result, approximately one-third of our board of directors are elected each year. The classification of directors will have the effect of making it more difficult for stockholders to change the composition of our board of directors. Our Certificate of Incorporation and Bylaws provide that, subject to any rights of holders of preferred stock to elect additional directors under specified circumstances, the number of directors are fixed from time to time exclusively pursuant to a resolution adopted by the board of directors.
Business combinations
We have opted out of Section 203 of the DGCL; however, our Certificate of Incorporation contains similar provisions providing that we may not engage in certain “business combinations” with any “interested stockholder” for a three-year period following the time that the stockholder became an interested stockholder, unless:
| • | prior to such time, our board of directors approved either the business combination or the transaction which resulted in the stockholder becoming an interested stockholder; |
| • | upon consummation of the transaction that resulted in the stockholder becoming an interested stockholder, the interested stockholder owned at least 85% of our voting stock outstanding at the time the transaction commenced, excluding certain shares; or |
| • | at or subsequent to that time, the business combination is approved by our board of directors and by the affirmative vote of holders of at least 66 2⁄3% of the outstanding voting stock that is not owned by the interested stockholder. |
148
Table of Contents
Generally, a “business combination” includes a merger, asset or stock sale or other transaction resulting in a financial benefit to the interested stockholder. Subject to certain exceptions, an “interested stockholder” is a person who, together with that person’s affiliates and associates, owns, or within the previous three years owned, 15% or more of our voting stock. For purposes of this section only, “voting stock” has the meaning given to it in Section 203 of the DGCL.
Under certain circumstances, this provision will make it more difficult for a person who would be an “interested stockholder” to effect various business combinations with a corporation for a three-year period. This provision may encourage companies interested in acquiring our Company to negotiate in advance with our board of directors because the stockholder approval requirement would be avoided if our board of directors approves either the business combination or the transaction which results in the stockholder becoming an interested stockholder. These provisions also may have the effect of preventing changes in our board of directors and may make it more difficult to accomplish transactions which stockholders may otherwise deem to be in their best interests.
Our Certificate of Incorporation provides that the Sponsors and their affiliates and any of their respective direct or indirect transferees and any group as to which such persons are a party do not constitute “interested stockholders” for purposes of this provision.
Removal of directors; vacancies
Under the DGCL, unless otherwise provided in our Certificate of Incorporation, directors serving on a classified board may be removed by the stockholders only for cause. Our Certificate of Incorporation provides that directors may be removed with or without cause upon the affirmative vote of a majority in voting power of all outstanding shares of stock entitled to vote thereon, voting together as a single class; provided, however, at any time when the Sponsors and their affiliates beneficially own, in the aggregate, less than % in voting power of the stock of the Company entitled to vote generally in the election of directors, directors may only be removed for cause, and only by the affirmative vote of holders of at least 66 2⁄3% in voting power of all the then-outstanding shares of stock of the Company entitled to vote thereon, voting together as a single class. In addition, our Certificate of Incorporation also provides that, subject to the rights granted to one or more series of preferred stock then outstanding or the rights granted under the stockholders agreement with affiliates of the Sponsors, any vacancies on our board of directors are filled only by the affirmative vote of a majority of the remaining directors, even if less than a quorum, by a sole remaining director or by the stockholders; provided, however, at any time when the Sponsors and their affiliates beneficially own, in the aggregate, less than % in voting power of the stock of the Company entitled to vote generally in the election of directors, any newly created directorship on the board of directors that results from an increase in the number of directors and any vacancy occurring in the board of directors may only be filled by a majority of the directors then in office, although less than a quorum, or by a sole remaining director (and not by stockholders).
No cumulative voting
Under Delaware law, the right to vote cumulatively does not exist unless the Certificate of Incorporation specifically authorizes cumulative voting. Our Certificate of Incorporation does not authorize cumulative voting. Therefore, stockholders holding a majority in voting power of the shares of our stock entitled to vote generally in the election of directors are able to elect all our directors.
Special stockholder meetings
Our Certificate of Incorporation provides that special meetings of our stockholders may be called at any time only by or at the direction of the board of directors or the chairman of the board of directors; provided, however, at any time when the Sponsors and their affiliates beneficially own, in the aggregate, at least % in voting power of the stock of the Company entitled to vote generally in the election of directors, special meetings
149
Table of Contents
of our stockholders shall also be called by the board of directors or the chairman of the board of directors at the request of the Sponsors and their affiliates. Our Bylaws prohibit the conduct of any business at a special meeting other than as specified in the notice for such meeting. These provisions may have the effect of deferring, delaying or discouraging hostile takeovers, or changes in control or management of our Company.
Requirements for advance notification of director nominations and stockholder proposals
Our Bylaws establish advance notice procedures with respect to stockholder proposals and the nomination of candidates for election as directors, other than nominations made by or at the direction of the board of directors or a committee of the board of directors. In order for any matter to be “properly brought” before a meeting, a stockholder will have to comply with advance notice requirements and provide us with certain information. Generally, to be timely, a stockholder’s notice must be received at our principal executive offices not less than 90 days nor more than 120 days prior to the first anniversary date of the immediately preceding annual meeting of stockholders. Our Bylaws also specify requirements as to the form and content of a stockholder’s notice. Our Bylaws allow the chairman of the meeting at a meeting of the stockholders to adopt rules and regulations for the conduct of meetings which may have the effect of precluding the conduct of certain business at a meeting if the rules and regulations are not followed. These provisions do not apply to the Sponsors and their affiliates so long as the stockholders agreement with affiliates of the Sponsors remains in effect. See “Certain Relationships and Related Party Transactions—Other Shareholder Agreements.” These provisions may also defer, delay or discourage a potential acquirer from conducting a solicitation of proxies to elect the acquirer’s own slate of directors or otherwise attempting to influence or obtain control of our Company.
Stockholder action by written consent
Pursuant to Section 228 of the DGCL, any action required to be taken at any annual or special meeting of the stockholders may be taken without a meeting, without prior notice and without a vote if a consent or consents in writing, setting forth the action so taken, is signed by the holders of outstanding stock having not less than the minimum number of votes that would be necessary to authorize or take such action at a meeting at which all shares of our stock entitled to vote thereon were present and voted, unless our Certificate of Incorporation provides otherwise. Our Certificate of Incorporation precludes stockholder action by written consent at any time when the Sponsors and their affiliates beneficially own, in the aggregate, less than % in voting power of the stock of the Company entitled to vote generally in the election of directors; provided, that any action required or permitted to be taken by the holders of preferred stock, voting separately as a series or separately as a class with one or more other such series, may be taken by written consent to the extent provided by the applicable certificate of designation relating to such series.
Supermajority provisions
Our Certificate of Incorporation and Bylaws provide that the board of directors is expressly authorized to make, alter, amend, change, add to, rescind or repeal, in whole or in part, our Bylaws without a stockholder vote in any matter not inconsistent with the laws of the State of Delaware or our Certificate of Incorporation. For as long as the Sponsors and their affiliates beneficially own, in the aggregate, at least % in voting power of the stock of the Company entitled to vote generally in the election of directors, any amendment, alteration, rescission or repeal of our Bylaws by our stockholders requires the affirmative vote of a majority in voting power of the outstanding shares of our stock present in person or represented by proxy and entitled to vote on such amendment, alteration, rescission or repeal. At any time when the Sponsors and their affiliates beneficially own, in the aggregate, less than % in voting power of the stock of the Company entitled to vote generally in the election of directors, any amendment, alteration, rescission or repeal of our Bylaws by our stockholders requires the affirmative vote of the holders of at least 66 2⁄3% in voting power of all the then-outstanding shares of stock of the Company entitled to vote thereon, voting together as a single class.
150
Table of Contents
The DGCL provides generally that the affirmative vote of a majority of the outstanding shares entitled to vote thereon, voting together as a single class, is required to amend a corporation’s certificate of incorporation, unless the certificate of incorporation requires a greater percentage.
Our Certificate of Incorporation provides that at any time when the Sponsors and their affiliates beneficially own, in the aggregate, less than % in voting power of the stock of the Company entitled to vote generally in the election of directors, the following provisions in our Certificate of Incorporation may be amended, altered, repealed or rescinded only by the affirmative vote of the holders of at least 66 2⁄3% in voting power of all the then-outstanding shares of stock of the Company entitled to vote thereon, voting together as a single class:
| • | the provision requiring a 66 2⁄3% supermajority vote for stockholders to amend our Bylaws; |
| • | the provisions providing for a classified board of directors (the election and term of our directors); |
| • | the provisions regarding resignation and removal of directors; |
| • | the provisions regarding competition and corporate opportunities; |
| • | the provisions regarding entering into business combinations with interested stockholders; |
| • | the provisions regarding stockholder action by written consent; |
| • | the provisions regarding calling special meetings of stockholders; |
| • | the provisions regarding filling vacancies on our board of directors and newly created directorships; |
| • | the provisions eliminating monetary damages for breaches of fiduciary duty by a director; and |
| • | the amendment provision requiring that the above provisions be amended only with a 66 2⁄3% supermajority vote. |
The combination of the classification of our board of directors, the lack of cumulative voting and the supermajority voting requirements make it more difficult for our existing stockholders to replace our board of directors as well as for another party to obtain control of us by replacing our board of directors. Because our board of directors has the power to retain and discharge our officers, these provisions could also make it more difficult for existing stockholders or another party to effect a change in management.
These provisions may have the effect of deterring hostile takeovers, delaying, or preventing changes in control of our management or our Company, such as a merger, reorganization or tender offer. These provisions are intended to enhance the likelihood of continued stability in the composition of our board of directors and its policies and to discourage certain types of transactions that may involve an actual or threatened acquisition of us. These provisions are designed to reduce our vulnerability to an unsolicited acquisition proposal. The provisions are also intended to discourage certain tactics that may be used in proxy fights. However, such provisions could have the effect of discouraging others from making tender offers for our shares and, as a consequence, they also may inhibit fluctuations in the market price of our shares that could result from actual or rumored takeover attempts. Such provisions may also have the effect of preventing changes in management.
Dissenters’ rights of appraisal and payment
Under the DGCL, with certain exceptions, our stockholders have appraisal rights in connection with a merger or consolidation of us. Pursuant to the DGCL, stockholders who properly request and perfect appraisal rights in connection with such merger or consolidation will have the right to receive payment of the fair value of their shares as determined by the Delaware Court of Chancery.
Stockholders’ derivative actions
Under the DGCL, any of our stockholders may bring an action in our name to procure a judgment in our favor, also known as a derivative action, provided that the stockholder bringing the action is a holder of our
151
Table of Contents
shares at the time of the transaction to which the action relates or such stockholder’s stock thereafter devolved by operation of law.
Exclusive Forum
Our Certificate of Incorporation provides that unless we consent to the selection of an alternative forum, the Court of Chancery of the State of Delaware shall, to the fullest extent permitted by law, be the sole and exclusive forum for any (i) derivative action or proceeding brought on behalf of our Company, (ii) action asserting a claim of breach of a fiduciary duty owed by any director or officer of our Company to the Company or the Company’s stockholders, creditors or other constituents, (iii) action asserting a claim against the Company or any director or officer of the Company arising pursuant to any provision of the DGCL or our Certificate of Incorporation or our Bylaws, or (iv) action asserting a claim against the Company or any director or officer of the Company governed by the internal affairs doctrine; provided, that, if and only if the Court of Chancery of the State of Delaware dismisses any such action for lack of subject matter jurisdiction, such action may be brought in another state court sitting in the State of Delaware. Any person or entity purchasing or otherwise acquiring any interest in shares of capital stock of our Company shall be deemed to have notice of and consented to the forum provisions in our Certificate of Incorporation. However, the enforceability of similar forum provisions in other companies’ certificates of incorporation has been challenged in legal proceedings, and it is possible that a court could find these types of provisions to be unenforceable.
Conflicts of Interest
Delaware law permits corporations to adopt provisions renouncing any interest or expectancy in certain opportunities that are presented to the corporation or its officers, directors or stockholders. Our Certificate of Incorporation, to the maximum extent permitted from time to time by Delaware law, renounces any interest or expectancy that we have in, or right to be offered an opportunity to participate in, specified business opportunities that are from time to time presented to our officers, directors or stockholders or their respective affiliates, other than those officers, directors, stockholders or affiliates who are our or our subsidiaries’ employees. Our Certificate of Incorporation provides that, to the fullest extent permitted by law, each of the Sponsors or any of their affiliates or any director who is not employed by us (including any non-employee director who serves as one of our officers in both his director and officer capacities) or his or her affiliates has no duty to refrain from (i) engaging in a corporate opportunity in the same or similar lines of business in which we or our affiliates now engage or propose to engage or (ii) otherwise competing with us or our affiliates. In addition, to the fullest extent permitted by law, in the event that the any of the Sponsors or any non-employee director acquires knowledge of a potential transaction or other business opportunity which may be a corporate opportunity for itself or himself or its or his affiliates or for us or our affiliates, such person will have no duty to communicate or offer such transaction or business opportunity to us or any of our affiliates and they may take any such opportunity for themselves or offer it to another person or entity. Our Certificate of Incorporation does not renounce our interest in any business opportunity that is expressly offered to a non-employee director solely in his or her capacity as a director or officer of the Company. To the fullest extent permitted by law, no business opportunity will be deemed to be a potential corporate opportunity for us unless we would be permitted to undertake the opportunity under our Certificate of Incorporation, we have sufficient financial resources to undertake the opportunity and the opportunity would be in line with our business.
Limitations on Liability and Indemnification of Officers and Directors
The DGCL authorizes corporations to limit or eliminate the personal liability of directors to corporations and their stockholders for monetary damages for breaches of directors’ fiduciary duties, subject to certain exceptions. Our Certificate of Incorporation includes a provision that eliminates the personal liability of directors for monetary damages for any breach of fiduciary duty as a director, except to the extent such exemption from liability or limitation thereof is not permitted under the DGCL. The effect of these provisions is to eliminate the rights of us and our stockholders, through stockholders’ derivative suits on our behalf, to recover monetary damages from a director for breach of fiduciary duty as a director, including breaches resulting from grossly
152
Table of Contents
negligent behavior. However, exculpation does not apply to any director if the director has acted in bad faith, knowingly or intentionally violated the law, authorized illegal dividends, repurchases or redemptions or derived an improper benefit from his or her actions as a director.
Our Bylaws provide that we must generally indemnify, and advance expenses to, our directors and officers to the fullest extent authorized by the DGCL. We also are expressly authorized to carry directors’ and officers’ liability insurance providing indemnification for our directors, officers and certain employees for some liabilities. We believe that these indemnification and advancement provisions and insurance are useful to attract and retain qualified directors and executive officers.
The limitation of liability, indemnification and advancement provisions in our Certificate of Incorporation and Bylaws may discourage stockholders from bringing a lawsuit against directors for breach of their fiduciary duty. These provisions also may have the effect of reducing the likelihood of derivative litigation against directors and officers, even though such an action, if successful, might otherwise benefit us and our stockholders. In addition, your investment may be adversely affected to the extent we pay the costs of settlement and damage awards against directors and officers pursuant to these indemnification provisions.
There is currently no pending material litigation or proceeding involving any of our directors, officers or employees for which indemnification is sought.
Transfer Agent and Registrar
The transfer agent and registrar for our common stock is .
Listing
We intend to apply to list our common stock on under the symbol “ .”
153
Table of Contents
SHARES ELIGIBLE FOR FUTURE SALE
General
Prior to this offering, there has not been a public market for our common stock, and we cannot predict what effect, if any, market sales of shares of common stock or the availability of shares of common stock for sale will have on the market price of our common stock prevailing from time to time. Nevertheless, sales of substantial amounts of common stock, including shares issued upon the exercise of outstanding options, in the public market, or the perception that such sales could occur, could materially and adversely affect the market price of our common stock and could impair our future ability to raise capital through the sale of our equity or equity-related securities at a time and price that we deem appropriate. See “Risk Factors—Risks Related to this Offering and Ownership of Our Common Stock—Future sales of our common stock, or the perception in the public markets that these sales may occur, may depress our stock price.”
Upon the consummation of this offering, we will have shares of common stock outstanding, or shares, if the underwriters exercise in full their option to purchase additional shares. Of these shares, only shares of common stock (or shares if the underwriters exercise in full their option to purchase additional shares) sold in this offering by us will be freely tradable without registration under the Securities Act and without restriction by persons other than our “affiliates” (as defined under Rule 144). Equity awards to acquire an aggregate of approximately shares of our common stock will be outstanding as of the closing of this offering. Of these equity awards, will have vested at or prior to the closing of this offering, will vest over the next 3 years and will vest subject to performance conditions. The shares of common stock held by the Sponsors, certain of our directors and officers and other existing stockholders after this offering will be “restricted” securities under the meaning of Rule 144 and may not be sold in the absence of registration under the Securities Act, unless an exemption from registration is available, including the exemptions pursuant to Rule 144 and Rule 701 under the Securities Act. In addition, shares of common stock will be authorized and reserved for issuance in relation to potential future awards under the 2015 Incentive Plan to be adopted in connection with this offering.
Rule 144
In general, under Rule 144, as currently in effect, a person (or persons whose shares are aggregated) who is not deemed to be or have been one of our affiliates for purposes of the Securities Act at any time during 90 days preceding a sale and who has beneficially owned the shares proposed to be sold for at least six months, including the holding period of any prior owner other than an affiliate, is entitled to sell such shares without registration, subject to compliance with the public information requirements of Rule 144. If such a person has beneficially owned the shares proposed to be sold for at least one year, including the holding period of a prior owner other than an affiliate, then such person is entitled to sell such shares without complying with any of the requirements of Rule 144.
In general, under Rule 144, as currently in effect, our affiliates or persons selling shares on behalf of our affiliates, who have met the six month holding period for beneficial ownership of “restricted shares” of our common stock, are entitled to sell within any three-month period, a number of shares that does not exceed the greater of:
| • | 1% of the number of shares of our common stock then outstanding, which will equal approximately shares immediately after this offering or ( shares if the underwriters exercise in full their option to purchase additional shares); or |
| • | the average reported weekly trading volume of our common stock on during the four calendar weeks preceding the filing of a notice on Form 144 with respect to such sale. |
Sales under Rule 144 by our affiliates or persons selling shares on behalf of our affiliates are also subject to certain manner of sale provisions and notice requirements and to the availability of current public information
154
Table of Contents
about us. The sale of these shares, or the perception that sales will be made, could adversely affect the price of our common stock after this offering because a great supply of shares would be, or would be perceived to be, available for sale in the public market.
Rule 701
In general, under Rule 701 as currently in effect, any of our employees, directors, officers, consultants or advisors who purchase shares from us in connection with a compensatory stock or option plan or other written agreement before the effective date of this offering and during a period when we were not subject to the reporting requirements of Section 13 or 15(d) of the Exchange Act are entitled to sell such shares 90 days after the effective date of this offering in reliance on Rule 144, in the case of affiliates, without having to comply with the holding period requirements of Rule 144 and, in the case of non-affiliates, without having to comply with the public information, holding period, volume limitation or notice filing requirements of Rule 144. However, substantially all Rule 701 shares are subject to lock-up agreements as described below and under “Underwriting (Conflicts of Interest)” and will become eligible for sale upon the expiration of the restrictions set forth in those agreements.
Lock-Up Agreements
In connection with this offering, we, our directors and executive officers and certain of our significant stockholders have agreed with the underwriters, subject to certain exceptions, not to sell, dispose of or hedge any of our common stock or securities convertible into or exchangeable for shares of common stock during the period ending 180 days after the date of this prospectus, except with the prior written consent of the representatives of the underwriters.
The 180-day restricted period described in the preceding paragraph will be automatically extended if:
| • | during the last 17 days of the 180-day restricted period we issue an earnings release or announce material news or a material event; or |
| • | prior to the expiration of the 180-day restricted period, we announce that we will release earnings results during the 15-day period beginning on the last day of the 180-day period, |
in which case the restrictions described in this paragraph will continue to apply until the expiration of the 18-day period beginning on (and including) the issuance of the earnings release or the announcement of the material news or material event. See “Underwriting (Conflicts of Interest).”
Registration Rights
Pursuant to our Registration Rights Agreement, we have granted the Sponsors the right to cause us, in certain instances, at our expense, to file registration statements under the Securities Act covering resales of our common stock held by them and we have granted the Sponsors and certain members of management piggyback registration rights providing them the right to have us include the shares of our common stock they own in any registration by the Company. Following completion of this offering, the shares covered by registration rights would represent approximately % of our outstanding common stock (or %, if the underwriters exercise in full their option to purchase additional shares). These shares also may be sold under Rule 144 under the Securities Act, depending on their holding period and subject to restrictions in the case of shares held by persons deemed to be our affiliates.
For a description of rights some holders of common stock have to require us to register the shares of common stock they own, see “Certain Relationships and Related Party Transactions—Other Shareholder Agreements.”
155
Table of Contents
Registration Statement on Form S-8
We intend to file a registration statement on Form S-8 under the Securities Act to register all of the shares of common stock subject to outstanding stock options, RSUs, AUs and the shares of common stock issued or reserved for issuance under our equity incentive plans. We expect to file this registration statement as promptly as possible after the completion of this offering. Shares covered by this registration statement will be eligible for sale in the public market, subject to the Rule 144 limitations applicable to affiliates, vesting restrictions and any applicable lockup agreements and market standoff agreements.
156
Table of Contents
CERTAIN UNITED STATES FEDERAL INCOME AND ESTATE TAX CONSEQUENCES TO NON-U.S. HOLDERS
The following is a summary of certain United States federal income and estate tax consequences to a non-U.S. holder (as defined below) of the purchase, ownership and disposition of our common stock issued pursuant to this offering.
A “non-U.S. holder” means a person (other than a partnership or other pass-through entity) that is not for United States federal income tax purposes any of the following:
| • | an individual citizen or resident of the United States; |
| • | a corporation (or any other entity treated as a corporation for United States federal income tax purposes) created or organized in or under the laws of the United States, any state thereof or the District of Columbia; |
| • | an estate the income of which is subject to United States federal income taxation regardless of its source; or |
| • | a trust if it (1) is subject to the primary supervision of a court within the United States and one or more United States persons have the authority to control all substantial decisions of the trust or (2) has a valid election in effect under applicable United States Treasury regulations to be treated as a United States person. |
This summary is based upon provisions of the Internal Revenue Code of 1986, as amended (the “Code”), and regulations, rulings and judicial decisions as of the date hereof. Those authorities may change or be subject to differing interpretations, and any such change or differing interpretation may be applied retroactively in a manner that could affect the accuracy of the statements and conclusions set forth in this summary. This summary does not address all aspects of United States federal income and estate taxes and does not deal with foreign, state, local or other tax considerations that may be relevant to non-U.S. holders in light of their particular circumstances. This discussion also does not address any tax consequences arising under the Medicare contribution tax on net investment income. Except where noted, this summary deals only with common stock that is held as a “capital asset” within the meaning of Section 1221 of the Code (generally, property held for investment). In addition, it does not address all United States federal income tax consequences relevant to a non-U.S. holder subject to special treatment under the United States federal income tax laws (including United States expatriates, “controlled foreign corporations,” “passive foreign investment companies,” partnerships or other pass-through entities for United States federal income tax purposes, insurance companies, tax-exempt organizations, financial institutions, brokers or dealers in securities, regulated investment companies, pension plans, or owners that hold our common stock as part of a straddle, hedge, conversion transaction, synthetic security, or other integrated investment). We cannot assure you that a change in law will not alter significantly the tax considerations that we describe in this summary.
If a partnership holds our common stock, the tax treatment of a partner in the partnership will generally depend upon the status of the partner, activities of the partnership and certain determinations made at the partner level. If you are a partner of a partnership holding our common stock, you should consult your tax advisors.
If you are considering the purchase of our common stock, you should consult your own tax advisors concerning the particular United States federal income and estate tax consequences to you of the ownership of the common stock, as well as the consequences to you arising under the laws of any other taxing jurisdiction.
Dividends
As described in the section entitled “Dividend Policy,” we do not anticipate paying cash dividends to holders of our common stock in the foreseeable future. If, however, we do make distributions of cash or property
157
Table of Contents
on our common stock, such distributions will constitute dividends for United States federal income tax purposes to the extent paid from our current or accumulated earnings and profits, as determined under United States federal income tax principles. If a distribution exceeds our current and accumulated earnings and profits, the excess will be treated as a tax-free return of the non-U.S. holder’s investment, up to such holder’s tax basis in the common stock. Any remaining excess will be treated as capital gain, subject to the tax treatment described below under the heading “Gain on Disposition of Common Stock.” Dividends paid to a non-U.S. holder of our common stock generally will be subject to withholding of United States federal income tax at a 30% rate or such lower rate as may be specified by an applicable income tax treaty. However, dividends that are effectively connected with the conduct of a trade or business by the non-U.S. holder within the United States (and, if required by an applicable income tax treaty, are attributable to a United States permanent establishment or fixed base) are not subject to the withholding tax, provided certain certification and disclosure requirements are satisfied. Instead, such dividends are subject to United States federal income tax on a net income basis in the same manner as if the non-U.S. holder were a United States person as defined under the Code. A non-U.S. holder that is a corporation may also be subject to a “branch profits tax” at a 30% rate (or such lower rate specified by an applicable income tax treaty) on such effectively connected dividends, as adjusted for certain items.
A non-U.S. holder of our common stock who wishes to claim the benefit of an applicable treaty rate and avoid backup withholding, as discussed below, for dividends will be required (a) to complete an Internal Revenue Service Form W-8BEN or W-8BEN-E (or other applicable documentation) and certify under penalty of perjury that such holder is not a United States person as defined under the Code and is eligible for treaty benefits or (b) if our common stock is held through certain foreign intermediaries, to satisfy the relevant certification requirements of applicable United States Treasury regulations. Special certification and other requirements apply to certain non-U.S. holders that are pass-through entities rather than corporations or individuals.
A non-U.S. holder of our common stock eligible for a reduced rate of United States withholding tax pursuant to an income tax treaty may obtain a refund or credit of any excess amounts withheld by timely filing an appropriate claim with the Internal Revenue Service. Non-U.S. holders are urged to consult their own tax advisors regarding their entitlement to benefits under an applicable income tax treaty.
Gain on Disposition of Common Stock
A non-U.S. holder generally will not be subject to United States federal income tax on gain recognized on a disposition of our common stock unless:
| • | the gain is effectively connected with the conduct of a trade or business by the non-U.S. holder in the United States (and, if required by an applicable income tax treaty, the gain is attributable to a United States permanent establishment or fixed base of the non-U.S. holder); |
| • | the non-U.S. holder is a nonresident alien individual who is present in the United States for 183 days or more in the taxable year of that disposition, and certain other conditions are met; or |
| • | we are or have been a “United States real property holding corporation” (“USRPHC”) for United States federal income tax purposes. |
A non-U.S. holder described in the first bullet point immediately above will be subject to tax on a net income basis in the same manner as if it were a United States person as defined under the Code. In addition, if a non-U.S. holder that is a foreign corporation falls under the first bullet point immediately above, it may be subject to an additional branch profits tax equal to 30% (or such lower rate specified by an applicable income tax treaty) of its effectively connected earnings and profits, subject to adjustments.
An individual non-U.S. holder described in the second bullet point immediately above will be subject to a flat 30% tax (or such lower rate specified by an applicable income tax treaty) on the net gain derived from the disposition, which may be offset by United States source capital losses realized in the same year (even though the individual is not considered a resident of the United States), provided the non-U.S. holder has timely filed United States federal income tax returns with respect to such losses.
158
Table of Contents
With respect to the third bullet point immediately above, we believe we are not and do not anticipate becoming a USRPHC for United States federal income tax purposes.
Federal Estate Tax
Common stock held by an individual non-U.S. holder at the time of death will be included in such holder’s gross estate for United States federal estate tax purposes, unless an applicable estate tax treaty provides otherwise.
Information Reporting and Backup Withholding
We must report annually to the Internal Revenue Service and to each non-U.S. holder the gross amount of dividends on our common stock paid to such holder and the tax withheld with respect to such dividends, regardless of whether withholding was required. Copies of the information returns reporting such dividends and withholding may also be made available to the tax authorities in the country in which the non-U.S. holder resides under the provisions of an applicable income tax treaty.
A non-U.S. holder will be subject to backup withholding with respect to dividends paid to such holder unless such holder certifies under penalty of perjury that it is a non-U.S. holder (and the payor does not have actual knowledge or reason to know that such holder is a United States person as defined under the Code), or such holder otherwise establishes an exemption.
Proceeds of a disposition of our common stock conducted through a non-United States office of a non-United States broker generally will not be subject to information reporting or backup withholding. However, information reporting and, depending on the circumstances, backup withholding will apply to the proceeds of a disposition of our common stock within the United States or conducted through certain United States-related financial intermediaries, unless the beneficial owner certifies under penalty of perjury that it is a non-U.S. holder (and the payor does not have actual knowledge or reason to know that the beneficial owner is a United States person as defined under the Code), or such owner otherwise establishes an exemption.
Backup withholding is not an additional tax. Any amounts withheld under the backup withholding rules may be allowed as a refund or a credit against a non-U.S. holder’s United States federal income tax liability provided the required information is timely furnished to the Internal Revenue Service.
Additional Withholding Requirements
Under Sections 1471 through 1474 of the Code (such Sections commonly referred to as the Foreign Account Tax Compliance Act,” or “FATCA”), a 30% United States federal withholding tax is generally imposed on to any dividends paid on our common stock and, for a disposition of our common stock occurring after December 31, 2016, the gross proceeds from such disposition, in each case paid to (i) a “foreign financial institution” (as specifically defined in the Code) which does not provide sufficient documentation, typically on IRS Form W-8BEN-E, evidencing either (x) an exemption from FATCA, or (y) its compliance (or deemed compliance) with FATCA (which may alternatively be in the form of compliance with an applicable intergovernmental agreement with the United States) in a manner which avoids withholding, or (ii) a “nonfinancial foreign entity” (as specifically defined in the Code) which does not provide sufficient documentation, typically on IRS Form W-8BEN-E, evidencing either (x) an exemption from FATCA, or (y) adequate information regarding certain substantial United States beneficial owners of such entity (if any). If a dividend payment is both subject to withholding under FATCA and subject to the withholding tax discussed above under “—Dividends,” the withholding under FATCA may be credited against, and therefore reduce, such other withholding tax. You should consult your own tax advisor regarding these requirements and whether they may be relevant to your ownership and disposition of our common stock.
159
Table of Contents
UNDERWRITING (CONFLICTS OF INTEREST)
We are offering the shares of common stock described in this prospectus through a number of underwriters. J.P. Morgan Securities LLC and Goldman, Sachs & Co. are acting as representatives of the underwriters. We have entered into an underwriting agreement with the underwriters. Subject to the terms and conditions of the underwriting agreement, we have agreed to sell to the underwriters, and each underwriter has severally agreed to purchase, at the public offering price less the underwriting discounts and commissions set forth on the cover page of this prospectus, the number of shares of common stock listed next to its name in the following table:
| Name |
Number of Shares | |
| J.P. Morgan Securities LLC |
||
| Goldman, Sachs & Co. |
||
| Barclays Capital Inc. |
||
| Deutsche Bank Securities Inc. |
||
| Credit Suisse Securities (USA) LLC |
||
| Merrill Lynch, Pierce, Fenner & Smith Incorporated |
||
| Citigroup Global Markets Inc. |
||
| Morgan Stanley & Co. LLC |
||
| RBC Capital Markets, LLC |
||
| UBS Securities LLC |
||
| Wells Fargo Securities, LLC |
||
|
| ||
| Total |
||
|
|
The underwriters are committed to purchase all the common shares offered by us if they purchase any shares. The underwriting agreement also provides that if an underwriter defaults, the purchase commitments of non-defaulting underwriters may also be increased or the offering may be terminated.
The underwriters propose to offer the common shares directly to the public at the initial public offering price set forth on the cover page of this prospectus and to certain dealers at that price less a concession not in excess of $ per share. Any such dealers may resell shares to certain other brokers or dealers at a discount of up to $ per share from the initial public offering price. After the initial public offering of the shares, the offering price and other selling terms may be changed by the underwriters. Sales of shares made outside of the United States may be made by affiliates of the underwriters. The offering of the shares by the underwriters is subject to receipt and acceptance and subject to the underwriters’ right to reject any whole or in part.
We have agreed to indemnify the several underwriters against certain liabilities, including liabilities under the Securities Act of 1933.
Option to Purchase Additional Shares
The underwriters have an option to buy up to additional shares of common stock from us to cover sales of shares by the underwriters which exceed the number of shares specified in the table above. The underwriters have 30 days from the date of this prospectus to exercise this option. If any shares are purchased with this option, the underwriters will purchase shares in approximately the same proportion as shown in the table above. If any additional shares of common stock are purchased, the underwriters will offer the additional shares on the same terms as those on which the shares are being offered.
160
Table of Contents
Underwriting Discounts and Expenses
The underwriting fee is equal to the public offering price per share of common stock less the amount paid by the underwriters to us per share of common stock. The underwriting fee is $ per share. The following table shows the per share and total underwriting discounts and commissions to be paid to the underwriters assuming both no exercise and full exercise of the underwriters’ option to purchase additional shares.
| Without option exercise |
With full option exercise |
|||||||
| Per Share |
$ | $ | ||||||
| Total |
$ | $ | ||||||
We estimate that the total expenses of this offering, including registration, filing and listing fees, printing fees and legal and accounting expenses, but excluding the underwriting discounts and commissions, will be approximately $ . We have agreed to reimburse the underwriters for certain expenses, including up to an aggregate of $ in connection with the clearance of this offering with FINRA. Such reimbursement is deemed to be underwriting compensation by FINRA.
Lock-Up
We have agreed that we will not:
| • | offer, pledge, announce the intention to sell, sell, contract to sell, sell any option or contract to purchase, purchase any option or contract to sell, grant any option, right or warrant to purchase, or otherwise dispose of, directly or indirectly, or file with the SEC a registration statement under the Securities Act relating to, any shares of our common stock or securities convertible into or exchangeable or exercisable for any shares of our common stock, or publicly disclose the intention to make any offer, sale, pledge, disposition or filing; or |
| • | enter into any swap or other arrangement that transfers all or a portion of the economic consequences associated with the ownership of any shares of our common stock or any such other securities (regardless of whether any of these transactions is to be settled by the delivery of shares of our common stock or such other securities, in cash or otherwise), |
in each case without the prior written consent of J.P. Morgan Securities LLC and Goldman, Sachs & Co. for a period of 180 days after the date of this prospectus, other than the shares of our common stock to be sold hereunder and any shares of our common stock issued upon the exercise of options granted under our equity incentive plans.
Our directors and executive officers and certain of our significant stockholders have entered into lock-up agreements with the underwriters prior to the commencement of this offering pursuant to which each of these persons or entities, with limited exceptions, for a period of 180 days after the date of this prospectus, may not, without the prior written consent of J.P. Morgan Securities LLC and Goldman, Sachs & Co.:
| • | offer, pledge, announce the intention to sell, sell, contract to sell, sell any option or contract to purchase, purchase any option or contract to sell, grant any option, right or warrant to purchase, or otherwise transfer or dispose of, directly or indirectly, any shares of our common stock or any securities convertible into or exercisable or exchangeable for any shares of our common stock (including, without limitation, our common stock or such other securities which may be deemed to be beneficially owned by such directors, executive officers and shareholders in accordance with the rules and regulations of the SEC and securities which may be issued upon exercise of a stock option or warrant); |
| • | enter into any swap or other agreement that transfers, in whole or in part, any of the economic consequences of ownership of any shares of our common stock or such other securities, regardless of |
161
Table of Contents
| whether any such transaction is to be settled by delivery of our common stock or such other securities, in cash or otherwise; or |
| • | make any demand for, or exercise any right with respect to, the registration of any shares of our common stock or any security convertible into or exercisable or exchangeable for our common stock. |
The 180-day restricted period described above will be automatically extended if: (1) during the last 17 days of the 180-day restricted period the Company issues an earnings release or announces material news or a material event; or (2) prior to the expiration of the 180-day restricted period, the Company announces that it will release earnings results during the 15-day period following the last day of the 180-day period, in which case the restrictions described in the preceding paragraph will continue to apply until the expiration of the 18-day period beginning on the issuance of the earnings release or the announcement of the material news or material event.
The restrictions described above are subject to customary exceptions.
Listing
We intend to apply to list our common stock on under the symbol “ .”
Price Stabilization and Short Positions
In connection with this offering, the underwriters may engage in stabilizing transactions, which involves making bids for, purchasing and selling shares of common stock in the open market for the purpose of preventing or retarding a decline in the market price of the common stock while this offering is in progress. These stabilizing transactions may include making short sales of the common stock, which involves the sale by the underwriters of a greater number of shares of common stock than they are required to purchase in this offering, and purchasing shares of common stock on the open market to cover positions created by short sales. Short sales may be “covered” shorts, which are short positions in an amount not greater than the underwriters’ option to purchase additional shares referred to above, or may be “naked” shorts, which are short positions in excess of that amount. The underwriters may close out any covered short position either by exercising their option to purchase additional shares, in whole or in part, or by purchasing shares in the open market. In making this determination, the underwriters will consider, among other things, the price of shares available for purchase in the open market compared to the price at which the underwriters may purchase shares through the option to purchase additional shares. A naked short position is more likely to be created if the underwriters are concerned that there may be downward pressure on the price of the common stock in the open market that could adversely affect investors who purchase in this offering. To the extent that the underwriters create a naked short position, they will purchase shares in the open market to cover the position.
The underwriters have advised us that, pursuant to Regulation M of the Securities Act of 1933, they may also engage in other activities that stabilize, maintain or otherwise affect the price of the common stock, including the imposition of penalty bids. This means that if the representatives of the underwriters purchase common stock in the open market in stabilizing transactions or to cover short sales, the representatives can require the underwriters that sold those shares as part of this offering to repay the underwriting discount received by them.
These activities may have the effect of raising or maintaining the market price of the common stock or preventing or retarding a decline in the market price of the common stock, and, as a result, the price of the common stock may be higher than the price that otherwise might exist in the open market. If the underwriters commence these activities, they may discontinue them at any time. The underwriters may carry out these transactions on the , in the over-the-counter market or otherwise.
162
Table of Contents
New Issue of Securities
Prior to this offering, there has been no public market for our common stock. The initial public offering price will be determined by negotiations between us and the representatives of the underwriters. In determining the initial public offering price, we and the representatives of the underwriters expect to consider a number of factors including:
| • | the information set forth in this prospectus and otherwise available to the representatives; |
| • | our prospects and the history and prospects for the industry in which we compete; |
| • | an assessment of our management; |
| • | our prospects for future earnings; |
| • | the general condition of the securities markets at the time of this offering; |
| • | the recent market prices of, and demand for, publicly traded common stock of generally comparable companies; and |
| • | other factors deemed relevant by the underwriters and us. |
Neither we nor the underwriters can assure investors that an active trading market will develop for our common shares, or that the shares will trade in the public market at or above the initial public offering price.
A prospectus in electronic format may be made available on the websites maintained by one or more underwriters, or selling group members, if any, participating in the offering. The underwriters may agree to allocate a number of shares to underwriters and selling group members for sale to their online brokerage account holders. Internet distributions will be allocated by the representatives to underwriters and selling group members that may make Internet distributions on the same basis as other allocations.
Other than in the United States, no action has been taken by us or the underwriters that would permit a public offering of the securities offered by this prospectus in any jurisdiction where action for that purpose is required. The securities offered by this prospectus may not be offered or sold, directly or indirectly, nor may this prospectus or any other offering material or advertisements in connection with the offer and sale of any such securities be distributed or published in any jurisdiction, except under circumstances that will result in compliance with the applicable rules and regulations of that jurisdiction. Persons into whose possession this prospectus comes are advised to inform themselves about and to observe any restrictions relating to the offering and the distribution of this prospectus. This prospectus does not constitute an offer to sell or a solicitation of an offer to buy any securities offered by this prospectus in any jurisdiction in which such an offer or a solicitation is unlawful.
Notice to Prospective Investors in the United Kingdom
This document is only being distributed to and is only directed at (i) persons who are outside the United Kingdom or (ii) to investment professionals falling within Article 19(5) of the Financial Services and Markets Act 2000 (Financial Promotion) Order 2005 (the “Order”) or (iii) high net worth entities, and other persons to whom it may lawfully be communicated, falling with Article 49(2)(a) to (d) of the Order (all such persons together being referred to as “relevant persons”). The securities are only available to, and any invitation, offer or agreement to subscribe, purchase or otherwise acquire such securities will be engaged in only with, relevant persons. Any person who is not a relevant person should not act or rely on this document or any of its contents.
Notice to Prospective Investors in the European Economic Area
In relation to each Member State of the European Economic Area which has implemented the Prospectus Directive (each, a ‘‘Relevant Member State’’), from and including the date on which the European Union Prospectus Directive (the ‘‘EU Prospectus Directive’’) was implemented in that Relevant Member State (the ‘‘Relevant Implementation Date’’) an offer of securities described in this prospectus may not be made to the public in that Relevant Member State prior to the publication of a prospectus in relation to the shares which has
163
Table of Contents
been approved by the competent authority in that Relevant Member State or, where appropriate, approved in another Relevant Member State and notified to the competent authority in that Relevant Member State, all in accordance with the EU Prospectus Directive, except that, with effect from and including the Relevant Implementation Date, an offer of securities described in this prospectus may be made to the public in that Relevant Member State at any time:
| • | to any legal entity which is a qualified investor as defined under the EU Prospectus Directive; |
| • | to fewer than 100 or, if the Relevant Member State has implemented the relevant provision of the 2010 PD Amending Directive, 150 natural or legal persons (other than qualified investors as defined in the EU Prospectus Directive); or |
| • | in any other circumstances falling within Article 3(2) of the EU Prospectus Directive, provided that no such offer of securities described in this prospectus shall result in a requirement for the publication by us of a prospectus pursuant to Article 3 of the EU Prospectus Directive. |
For the purposes of this provision, the expression an “offer of securities to the public” in relation to any securities in any Relevant Member State means the communication in any form and by any means of sufficient information on the terms of the offer and the securities to be offered so as to enable an investor to decide to purchase or subscribe for the securities, as the same may be varied in that Member State by any measure implementing the EU Prospectus Directive in that Member State. The expression “EU Prospectus Directive” means Directive 2003/71/EC (and any amendments thereto, including the 2010 PD Amending Directive, to the extent implemented in the Relevant Member State) and includes any relevant implementing measure in each Relevant Member State, and the expression “2010 PD Amending Directive” means Directive 2010/73/EU.
Notice to Prospective Investors in Hong Kong
The shares may not be offered or sold in Hong Kong by means of any document other than (i) in circumstances which do not constitute an offer to the public within the meaning of the Companies (Winding Up and Miscellaneous Provisions) Ordinance (Cap. 32 of the Laws of Hong Kong) (“Companies (Winding Up and Miscellaneous Provisions) Ordinance”) or which do not constitute an invitation to the public within the meaning of the Securities and Futures Ordinance (Cap. 571 of the Laws of Hong Kong) (“Securities and Futures Ordinance”), or (ii) to “professional investors” as defined in the Securities and Futures Ordinance and any rules made thereunder, or (iii) in other circumstances which do not result in the document being a “prospectus” as defined in the Companies (Winding Up and Miscellaneous Provisions) Ordinance, and no advertisement, invitation or document relating to the shares may be issued or may be in the possession of any person for the purpose of issue (in each case whether in Hong Kong or elsewhere), which is directed at, or the contents of which are likely to be accessed or read by, the public in Hong Kong (except if permitted to do so under the securities laws of Hong Kong) other than with respect to shares which are or are intended to be disposed of only to persons outside Hong Kong or only to “professional investors” in Hong Kong as defined in the Securities and Futures Ordinance and any rules made thereunder.
Notice to Prospective Investors in Singapore
This prospectus has not been registered as a prospectus with the Monetary Authority of Singapore. Accordingly, this prospectus and any other document or material in connection with the offer or sale, or invitation for subscription or purchase, of the shares may not be circulated or distributed, nor may the shares be offered or sold, or be made the subject of an invitation for subscription or purchase, whether directly or indirectly, to persons in Singapore other than (i) to an institutional investor (as defined under Section 4A of the Securities and Futures Act, Chapter 289 of Singapore (the “SFA”)) under Section 274 of the SFA, (ii) to a relevant person (as defined in Section 275(2) of the SFA) pursuant to Section 275(1) of the SFA, or any person pursuant to Section 275(1A) of the SFA, and in accordance with the conditions specified in Section 275 of the SFA or (iii) otherwise pursuant to, and in accordance with the conditions of, any other applicable provision of the SFA, in each case subject to conditions set forth in the SFA.
164
Table of Contents
Where the shares are subscribed or purchased under Section 275 of the SFA by a relevant person which is a corporation (which is not an accredited investor (as defined in Section 4A of the SFA)) the sole business of which is to hold investments and the entire share capital of which is owned by one or more individuals, each of whom is an accredited investor, the securities (as defined in Section 239(1) of the SFA) of that corporation shall not be transferable for 6 months after that corporation has acquired the shares under Section 275 of the SFA except: (1) to an institutional investor under Section 274 of the SFA or to a relevant person (as defined in Section 275(2) of the SFA), (2) where such transfer arises from an offer in that corporation’s securities pursuant to Section 275(1A) of the SFA, (3) where no consideration is or will be given for the transfer, (4) where the transfer is by operation of law, (5) as specified in Section 276(7) of the SFA, or (6) as specified in Regulation 32 of the Securities and Futures (Offers of Investments) (Shares and Debentures) Regulations 2005 of Singapore (“Regulation 32”)
Where the shares are subscribed or purchased under Section 275 of the SFA by a relevant person which is a trust (where the trustee is not an accredited investor (as defined in Section 4A of the SFA)) whose sole purpose is to hold investments and each beneficiary of the trust is an accredited investor, the beneficiaries’ rights and interest (howsoever described) in that trust shall not be transferable for 6 months after that trust has acquired the shares under Section 275 of the SFA except: (1) to an institutional investor under Section 274 of the SFA or to a relevant person (as defined in Section 275(2) of the SFA), (2) where such transfer arises from an offer that is made on terms that such rights or interest are acquired at a consideration of not less than S$200,000 (or its equivalent in a foreign currency) for each transaction (whether such amount is to be paid for in cash or by exchange of securities or other assets), (3) where no consideration is or will be given for the transfer, (4) where the transfer is by operation of law, (5) as specified in Section 276(7) of the SFA, or (6) as specified in Regulation 32.
Notice to Prospective Investors in Japan
The securities have not been and will not be registered under the Financial Instruments and Exchange Act of Japan (Act No. 25 of 1948, as amended), or the FIEA. The securities may not be offered or sold, directly or indirectly, in Japan or to or for the benefit of any resident of Japan (including any person resident in Japan or any corporation or other entity organized under the laws of Japan) or to others for reoffering or resale, directly or indirectly, in Japan or to or for the benefit of any resident of Japan, except pursuant to an exemption from the registration requirements of the FIEA and otherwise in compliance with any relevant laws and regulations of Japan.
Conflicts of Interest
Affiliates of Goldman, Sachs & Co., an underwriter in this offering, beneficially own in excess of 10% of our issued and outstanding common stock. Therefore, Goldman, Sachs & Co. is deemed to have a “conflict of interest” under FINRA Rule 5121(f)(5)(B). Accordingly, this offering will be conducted in accordance with Rule 5121, which requires, among other things, that a “qualified independent underwriter” participate in the preparation of, and exercise the usual standards of “due diligence” with respect to, the registration statement and this prospectus. J.P. Morgan Securities LLC has agreed to act as a qualified independent underwriter for this offering and to undertake the legal responsibilities and liabilities of an underwriter under the Securities Act, specifically including those inherent in Section 11 thereof. J.P. Morgan Securities LLC will not receive any additional fees for serving as a qualified independent underwriter in connection with this offering. We have agreed to indemnify J.P. Morgan Securities LLC against liabilities incurred in connection with acting as a qualified independent underwriter, including liabilities under the Securities Act. Goldman, Sachs & Co. will not confirm sales to any account over which it exercises discretionary authority without the specific written approval of the accountholder.
165
Table of Contents
Other Relationships
The underwriters and their respective affiliates are full service financial institutions engaged in various activities, which may include sales and trading, commercial and investment banking, advisory, investment management, investment research, principal investment, hedging, market making, brokerage and other financial and non-financial activities and services. Certain of the underwriters and their respective affiliates have provided in the past to us and our affiliates and may provide from time to time in the future a variety of these services for us and such affiliates in the ordinary course of their business, for which they have received and may continue to receive customary fees and commissions. In addition, from time to time, certain of the underwriters and their affiliates may effect transactions for their own account or the account of customers, and hold on behalf of themselves or their customers, long or short positions in our debt or equity securities or loans, and may do so in the future.
Certain of the underwriters have historically been customers of ours, and the underwriters may engage in transactions with us in the ordinary course of our business.
166
Table of Contents
The validity of the shares of common stock offered by this prospectus will be passed upon for us by Simpson Thacher & Bartlett LLP, New York, New York. An investment vehicle comprised of several partners of Simpson Thacher & Bartlett LLP, members of their families, related persons and others own interests representing less than 1% of the capital commitments of funds affiliated with three of the Sponsors, Blackstone, KKR and Silver Lake. Certain legal matters relating to this offering will be passed upon for the underwriters by Ropes & Gray LLP. Ropes & Gray LLP and certain of its attorneys have, in the aggregate, an indirect interest in less than 1% of our common stock, including through limited partnership interests in funds associated with one of the Sponsors.
The consolidated financial statements as of December 31, 2014 and 2013 and for each of the three years in the period ended December 31, 2014 and management’s assessment of the effectiveness of internal control over financial reporting (which is included in Management’s Report on Internal Control over Financial Reporting) as of December 31, 2014 included in this prospectus have been so included in reliance on the report of PricewaterhouseCoopers LLP, an independent registered public accounting firm, given on the authority of said firm as experts in auditing and accounting.
WHERE YOU CAN FIND MORE INFORMATION
We have filed with the Securities and Exchange Commission (the “SEC”) a registration statement on Form S-1 under the Securities Act with respect to the common stock offered by this prospectus. This prospectus is a part of the registration statement and does not contain all of the information set forth in the registration statement and its exhibits and schedules, portions of which have been omitted as permitted by the rules and regulations of the SEC. For further information about us and our common stock, you should refer to the registration statement and its exhibits and schedules. Statements in this prospectus about the contents of any contract, agreement or other document are not necessarily complete and in each instance that a copy of such contract, agreement or document has been filed as an exhibit to the registration statement, we refer you to the copy that we have filed as an exhibit.
Upon the effectiveness of the registration statement and as a result of our stock being traded on , we will be subject to the informational requirements of the Exchange Act and the listing requirements of . In accordance with the Exchange Act and , we will file annual, quarterly and special reports and other information with the SEC. Our filings with the SEC are available to the public on the SEC’s website at http://www.sec.gov. Those filings are also available to the public on, or accessible through, our corporate web site under the heading “Investors,” at www.sungard.com. The information we file with the SEC or contained on or accessible through our corporate web site or any other web site that we may maintain is not part of this prospectus or the registration statement of which this prospectus is a part. You may also read and copy, at SEC prescribed rates, any document we file with the SEC, including the registration statement (and its exhibits) of which this prospectus is a part, at the SEC’s Public Reference Room located at 100 F Street, N.E., Washington D.C. 20549. You can call the SEC at 1-800-SEC-0330 to obtain information on the operation of the Public Reference Room.
We intend to make available to our common stockholders annual reports containing consolidated financial statements audited by an independent registered public accounting firm.
167
Table of Contents
SUNGARD AND SUBSIDIARIES
INDEX TO CONSOLIDATED FINANCIAL STATEMENTS
| Page Number |
||||
| Audited Consolidated Financial Statements of SunGard and Subsidiaries |
||||
| Management’s Report on Internal Control over Financial Reporting |
F-2 | |||
| Report of PricewaterhouseCoopers LLP, Independent Registered Public Accounting Firm |
F-3 | |||
| F-4 | ||||
| Consolidated Statements of Income (Loss) for the years ended December 31, 2012, 2013 and 2014 |
F-5 | |||
| F-6 | ||||
| Consolidated Statements of Cash Flows for the years ended December 31, 2012, 2013 and 2014 |
F-7 | |||
| Consolidated Statement of Changes in Equity for the years ended December 31, 2012, 2013 and 2014 |
F-8 | |||
| F-10 | ||||
| Unaudited Condensed Consolidated Financial Statements of SunGard and Subsidiaries |
||||
| Condensed Consolidated Balance Sheets at December 31, 2014 and March 31, 2015 |
F-52 | |||
| F-53 | ||||
| F-54 | ||||
| Condensed Consolidated Statements of Cash Flows for the three months ended March 31, 2014 and 2015 |
F-55 | |||
| F-56 | ||||
F-1
Table of Contents
MANAGEMENT’S REPORT ON INTERNAL CONTROL OVER FINANCIAL REPORTING
Management is responsible for establishing and maintaining adequate internal control over financial reporting, as defined in Rules 13a-15(e) and 15d-15(e) under the Exchange Act. Internal control over financial reporting is a process designed to provide reasonable assurance regarding the reliability of SunGard’s financial reporting and the preparation of financial statements for external purposes in accordance with U.S. generally accepted accounting principles.
Because of its inherent limitations, internal control over financial reporting may not prevent or detect misstatements. Also, projections of any evaluation of effectiveness to future periods are subject to the risk that controls may become inadequate because of changes in conditions, or that the degree of compliance with policies and procedures may deteriorate.
Management conducted an assessment of the Companies’ internal control over financial reporting as of December 31, 2014 based on the criteria established by the Committee of Sponsoring Organizations of the Treadway Commission in Internal Control—Integrated Framework (2013). Based on the assessment, management concluded that, as of December 31, 2014, the Company’s internal control over financial reporting is effective.
The effectiveness of the Companies’ internal control over financial reporting as of December 31, 2014 has been audited by PricewaterhouseCoopers LLP, an independent registered public accounting firm, as stated in their report with respect to the Company which appears herein.
F-2
Table of Contents
Report of Independent Registered Public Accounting Firm
To the Board of Directors and Stockholders of SunGard
(formerly known as SunGard Capital Corp.):
In our opinion, the accompanying consolidated balance sheets and the related consolidated statements of income (loss), comprehensive income (loss), of changes in equity and of cash flows present fairly, in all material respects, the financial position of SunGard, formerly known as SunGard Capital Corp., and its subsidiaries at December 31, 2014 and 2013, and the results of their operations and their cash flows for each of the three years in the period ended December 31, 2014 in conformity with accounting principles generally accepted in the United States of America. Also in our opinion, the Company maintained, in all material respects, effective internal control over financial reporting as of December 31, 2014, based on criteria established in Internal Control – Integrated Framework (2013) issued by the Committee of Sponsoring Organizations of the Treadway Commission (COSO). The Company’s management is responsible for these financial statements, for maintaining effective internal control over financial reporting and for its assessment of the effectiveness of internal control over financial reporting, included in the accompanying Management’s Report on Internal Control Over Financial Reporting. Our responsibility is to express opinions on these financial statements and on the Company’s internal control over financial reporting based on our integrated audits. We conducted our audits in accordance with the standards of the Public Company Accounting Oversight Board (United States). Those standards require that we plan and perform the audits to obtain reasonable assurance about whether the financial statements are free of material misstatement and whether effective internal control over financial reporting was maintained in all material respects. Our audits of the financial statements included examining, on a test basis, evidence supporting the amounts and disclosures in the financial statements, assessing the accounting principles used and significant estimates made by management, and evaluating the overall financial statement presentation. Our audit of internal control over financial reporting included obtaining an understanding of internal control over financial reporting, assessing the risk that a material weakness exists, and testing and evaluating the design and operating effectiveness of internal control based on the assessed risk. Our audits also included performing such other procedures as we considered necessary in the circumstances. We believe that our audits provide a reasonable basis for our opinions.
A company’s internal control over financial reporting is a process designed to provide reasonable assurance regarding the reliability of financial reporting and the preparation of financial statements for external purposes in accordance with generally accepted accounting principles. A company’s internal control over financial reporting includes those policies and procedures that (i) pertain to the maintenance of records that, in reasonable detail, accurately and fairly reflect the transactions and dispositions of the assets of the company; (ii) provide reasonable assurance that transactions are recorded as necessary to permit preparation of financial statements in accordance with generally accepted accounting principles, and that receipts and expenditures of the company are being made only in accordance with authorizations of management and directors of the company; and (iii) provide reasonable assurance regarding prevention or timely detection of unauthorized acquisition, use, or disposition of the company’s assets that could have a material effect on the financial statements.
Because of its inherent limitations, internal control over financial reporting may not prevent or detect misstatements. Also, projections of any evaluation of effectiveness to future periods are subject to the risk that controls may become inadequate because of changes in conditions, or that the degree of compliance with the policies or procedures may deteriorate.
/s/PricewaterhouseCoopers LLP
Philadelphia, Pennsylvania
March 25, 2015, except with respect to our opinion on the consolidated financial statements insofar as it relates to the presentation of earnings per share discussed in Note 10 as to which the date is June 3, 2015
F-3
Table of Contents
Consolidated Balance Sheets
(In millions except share and per-share amounts)
| December 31, 2013 |
December 31, 2014 |
|||||||
| Assets |
||||||||
| Current: |
||||||||
| Cash and cash equivalents |
$ | 675 | $ | 447 | ||||
| Trade receivables, less allowance for doubtful accounts of $17 and $22 |
565 | 572 | ||||||
| Earned but unbilled receivables |
92 | 114 | ||||||
| Prepaid expenses and other current assets |
127 | 116 | ||||||
| Assets of discontinued operations |
2,516 | — | ||||||
|
|
|
|
|
|||||
| Total current assets |
3,975 | 1,249 | ||||||
| Property and equipment, less accumulated depreciation of $376 and $414 |
152 | 152 | ||||||
| Software products, less accumulated amortization of $1,644 and $1,754 |
270 | 224 | ||||||
| Customer base, less accumulated amortization of $486 and $531 |
421 | 360 | ||||||
| Other assets, less accumulated amortization of $21 and $22 |
113 | 94 | ||||||
| Trade name |
1,019 | 672 | ||||||
| Goodwill |
3,828 | 3,760 | ||||||
|
|
|
|
|
|||||
| Total Assets |
$ | 9,778 | $ | 6,511 | ||||
|
|
|
|
|
|||||
| Liabilities and Equity |
||||||||
| Current: |
||||||||
| Short-term and current portion of long-term debt |
$ | 290 | $ | — | ||||
| Accounts payable |
8 | 21 | ||||||
| Accrued compensation and benefits |
245 | 227 | ||||||
| Accrued interest expense |
40 | 30 | ||||||
| Other accrued expenses |
129 | 131 | ||||||
| Deferred revenue |
589 | 589 | ||||||
| Liabilities of discontinued operations |
799 | — | ||||||
|
|
|
|
|
|||||
| Total current liabilities |
2,100 | 998 | ||||||
| Long-term debt |
6,094 | 4,669 | ||||||
| Deferred and other income taxes |
746 | 616 | ||||||
| Other long-term liabilities |
39 | 39 | ||||||
|
|
|
|
|
|||||
| Total liabilities |
8,979 | 6,322 | ||||||
|
|
|
|
|
|||||
| Commitments and contingencies |
||||||||
| Non-controlling interest in preferred stock of a subsidiary subject to a put option |
42 | 37 | ||||||
| Class L common stock subject to a put option |
58 | 57 | ||||||
| Class A common stock subject to a put option |
4 | 3 | ||||||
| Stockholders’ equity: |
||||||||
| Class L common stock, convertible, par value $.001 per share; cumulative 13.5% per annum, compounded quarterly; aggregate liquidation preference of $7,040 million and $8,064 million; 50,000,000 shares authorized, 29,062,421 shares issued |
— | — | ||||||
| Class A common stock, par value $.001 per share; 550,000,000 shares authorized, 261,565,118 shares issued |
— | — | ||||||
| Capital in excess of par value |
2,482 | 2,674 | ||||||
| Treasury stock, 528,709 and 442,460 shares of Class L common stock; and 4,761,694 and 3,985,453 shares of Class A common stock |
(47 | ) | (38 | ) | ||||
| Accumulated deficit |
(3,497 | ) | (3,902 | ) | ||||
| Accumulated other comprehensive income (loss) |
16 | (132 | ) | |||||
|
|
|
|
|
|||||
| Total SunGard stockholders’ equity (deficit) |
(1,046 | ) | (1,398 | ) | ||||
| Non-controlling interest in preferred stock of a subsidiary |
1,741 | 1,490 | ||||||
|
|
|
|
|
|||||
| Total equity |
695 | 92 | ||||||
|
|
|
|
|
|||||
| Total Liabilities and Equity |
$ | 9,778 | $ | 6,511 | ||||
|
|
|
|
|
|||||
The accompanying notes are an integral part of these consolidated financial statements.
F-4
Table of Contents
Consolidated Statements of Income (Loss)
(In millions, except per share amounts)
| Year Ended December 31, | ||||||||||||
| 2012 | 2013 | 2014 | ||||||||||
| Revenue |
$ | 2,808 | $ | 2,761 | $ | 2,809 | ||||||
| Costs and expenses: |
||||||||||||
| Cost of sales and direct operating (excluding items described in Note 1) |
1,082 | 1,045 | 1,098 | |||||||||
| Sales, marketing and administration |
643 | 634 | 667 | |||||||||
| Product development and maintenance |
422 | 392 | 376 | |||||||||
| Depreciation |
96 | 104 | 107 | |||||||||
| Amortization of acquisition-related intangible assets |
217 | 182 | 136 | |||||||||
| Trade name impairment charge |
— | — | 339 | |||||||||
|
|
|
|
|
|
|
|||||||
| Total costs and expenses |
2,460 | 2,357 | 2,723 | |||||||||
|
|
|
|
|
|
|
|||||||
| Operating income |
348 | 404 | 86 | |||||||||
| Other income (expense): |
||||||||||||
| Interest income |
1 | 1 | 1 | |||||||||
| Interest expense and amortization of deferred financing fees |
(360 | ) | (326 | ) | (291 | ) | ||||||
| Loss on extinguishment of debt |
(82 | ) | (6 | ) | (61 | ) | ||||||
| Other income (expense) |
1 | (2 | ) | — | ||||||||
|
|
|
|
|
|
|
|||||||
| Other income (expense) |
(440 | ) | (333 | ) | (351 | ) | ||||||
|
|
|
|
|
|
|
|||||||
| Income (loss) from continuing operations before income taxes |
(92 | ) | 71 | (265 | ) | |||||||
| Benefit from (provision for) income taxes |
49 | (26 | ) | 57 | ||||||||
|
|
|
|
|
|
|
|||||||
| Income (loss) from continuing operations |
(43 | ) | 45 | (208 | ) | |||||||
| Income (loss) from discontinued operations, net of tax |
(23 | ) | 17 | (14 | ) | |||||||
|
|
|
|
|
|
|
|||||||
| Net income (loss) |
(66 | ) | 62 | (222 | ) | |||||||
| Income attributable to the non-controlling interest |
(251 | ) | (169 | ) | (174 | ) | ||||||
|
|
|
|
|
|
|
|||||||
| Net loss attributable to SunGard. |
$ | (317 | ) | $ | (107 | ) | $ | (396 | ) | |||
|
|
|
|
|
|
|
|||||||
| Basic earnings (loss) per share: |
||||||||||||
| Allocation of net income (loss) to common stockholders – Basic: |
||||||||||||
| Class L stockholders |
$ | 773 | $ | 886 | $ | 1,016 | ||||||
| Class A stockholders – continuing operations |
(1,069 | ) | (1,012 | ) | (1,400 | ) | ||||||
| Class A stockholders – total |
(1,092 | ) | (995 | ) | (1,414 | ) | ||||||
| Net income (loss) per share – Basic: |
||||||||||||
| Class L stockholders |
$ | 26.86 | $ | 30.68 | $ | 35.03 | ||||||
| Class A stockholders – continuing operations |
(4.12 | ) | (3.89 | ) | (5.37 | ) | ||||||
| Class A stockholders – total |
(4.22 | ) | (3.83 | ) | (5.42 | ) | ||||||
| Weighted average number of shares – Basic: |
||||||||||||
| Class L stockholders |
29 | 29 | 29 | |||||||||
| Class A stockholders |
259 | 260 | 261 | |||||||||
| Diluted earnings (loss) per share: |
||||||||||||
| Allocation of net income (loss) to common stockholders – Diluted: |
||||||||||||
| Class L stockholders |
$ | 783 | $ | 897 | $ | 1,033 | ||||||
| Class A stockholders – continuing operations |
(1,069 | ) | (1,025 | ) | (1,400 | ) | ||||||
| Class A stockholders – total |
(1,092 | ) | (1,008 | ) | (1,414 | ) | ||||||
| Net income (loss) per share – Diluted: |
||||||||||||
| Class L stockholders |
$ | 26.86 | $ | 30.68 | $ | 35.03 | ||||||
| Class A stockholders – continuing operations |
(4.12 | ) | (3.90 | ) | (5.37 | ) | ||||||
| Class A stockholders – total |
(4.22 | ) | (3.84 | ) | (5.42 | ) | ||||||
| Weighted average number of shares – Diluted: |
||||||||||||
| Class L stockholders |
29 | 29 | 29 | |||||||||
| Class A stockholders |
259 | 263 | 261 | |||||||||
| Unaudited pro forma basic and diluted loss per share from continuing operations (Note 10) |
— | |||||||||||
The accompanying notes are an integral part of these consolidated financial statements.
F-5
Table of Contents
Consolidated Statements of Comprehensive Income (Loss)
(In millions)
| Year Ended December 31, | ||||||||||||
| 2012 | 2013 | 2014 | ||||||||||
| Net income (loss) |
$ | (66 | ) | $ | 62 | $ | (222 | ) | ||||
| Other comprehensive income (loss): |
||||||||||||
| Foreign currency translation, net |
33 | 19 | (65 | ) | ||||||||
| Unrealized gain (loss) on derivative instruments, net of tax |
10 | 3 | (5 | ) | ||||||||
| Other, net of tax |
— | (3 | ) | (3 | ) | |||||||
|
|
|
|
|
|
|
|||||||
| Other comprehensive income (loss), net of tax |
43 | 19 | (73 | ) | ||||||||
|
|
|
|
|
|
|
|||||||
| Comprehensive income (loss) |
(23 | ) | 81 | (295 | ) | |||||||
| Comprehensive income attributable to the non-controlling interest |
(251 | ) | (169 | ) | (174 | ) | ||||||
|
|
|
|
|
|
|
|||||||
| Comprehensive loss attributable to SunGard |
$ | (274 | ) | $ | (88 | ) | $ | (469 | ) | |||
|
|
|
|
|
|
|
|||||||
The accompanying notes are an integral part of these consolidated financial statements.
F-6
Table of Contents
Consolidated Statements of Cash Flows
(In millions)
| Year Ended December 31, | ||||||||||||
| 2012 | 2013 | 2014 | ||||||||||
| Cash flow from operations: |
||||||||||||
| Net income (loss) |
$ | (66 | ) | $ | 62 | $ | (222 | ) | ||||
| Income (loss) from discontinued operations |
(23 | ) | 17 | (14 | ) | |||||||
|
|
|
|
|
|
|
|||||||
| Income (loss) from continuing operations |
(43 | ) | 45 | (208 | ) | |||||||
| Reconciliation of income (loss) from continuing operations to cash flow from (used in) operations: |
||||||||||||
| Depreciation and amortization |
313 | 286 | 243 | |||||||||
| Trade name impairment charge |
— | — | 339 | |||||||||
| Deferred income tax provision (benefit) |
(54 | ) | (24 | ) | (104 | ) | ||||||
| Stock compensation expense |
31 | 39 | 42 | |||||||||
| Amortization of deferred financing fees and debt discount |
36 | 37 | 18 | |||||||||
| Loss on extinguishment of debt |
82 | 6 | 61 | |||||||||
| Other noncash items |
(1 | ) | 1 | — | ||||||||
| Changes in working capital: |
||||||||||||
| Accounts receivable and other current assets |
58 | (3 | ) | (57 | ) | |||||||
| Accounts payable and accrued expenses |
(11 | ) | (5 | ) | (18 | ) | ||||||
| Accrued interest |
(49 | ) | (1 | ) | (5 | ) | ||||||
| Accrued income taxes |
(52 | ) | 7 | 12 | ||||||||
| Deferred revenue |
(23 | ) | 33 | 9 | ||||||||
|
|
|
|
|
|
|
|||||||
| Cash flow from (used in) continuing operations |
287 | 421 | 332 | |||||||||
| Cash flow from (used in) discontinued operations |
(43 | ) | 324 | 33 | ||||||||
|
|
|
|
|
|
|
|||||||
| Cash flow from (used in) operations |
244 | 745 | 365 | |||||||||
|
|
|
|
|
|
|
|||||||
| Investment activities: |
||||||||||||
| Cash paid for acquired businesses, net of cash acquired |
(40 | ) | (2 | ) | (4 | ) | ||||||
| Additions to property and equipment, and software |
(75 | ) | (70 | ) | (81 | ) | ||||||
| Additions to capitalized software |
(22 | ) | (41 | ) | (62 | ) | ||||||
| Other investing activities |
1 | 1 | — | |||||||||
|
|
|
|
|
|
|
|||||||
| Cash provided by (used in) continuing operations |
(136 | ) | (112 | ) | (147 | ) | ||||||
| Cash provided by (used in) discontinued operations |
1,597 | (146 | ) | 7 | ||||||||
|
|
|
|
|
|
|
|||||||
| Cash provided by (used in) investment activities |
1,461 | (258 | ) | (140 | ) | |||||||
|
|
|
|
|
|
|
|||||||
| Financing activities: |
||||||||||||
| Cash received from borrowings, net of fees |
1,715 | 2,171 | (7 | ) | ||||||||
| Cash used to repay debt |
(2,943 | ) | (2,475 | ) | (1,326 | ) | ||||||
| Premium paid to retire debt |
(48 | ) | — | — | ||||||||
| Dividends paid |
(724 | ) | (3 | ) | (2 | ) | ||||||
| Cash used to purchase treasury stock |
(22 | ) | (10 | ) | (9 | ) | ||||||
| Other financing activities |
(14 | ) | (7 | ) | (11 | ) | ||||||
|
|
|
|
|
|
|
|||||||
| Cash provided by (used in) continuing operations |
(2,036 | ) | (324 | ) | (1,355 | ) | ||||||
| Cash provided by (used in) discontinued operations |
(3 | ) | (2 | ) | 887 | |||||||
|
|
|
|
|
|
|
|||||||
| Cash provided by (used in) financing activities |
(2,039 | ) | (326 | ) | (468 | ) | ||||||
|
|
|
|
|
|
|
|||||||
| Effect of exchange rate changes on cash |
7 | (1 | ) | (16 | ) | |||||||
|
|
|
|
|
|
|
|||||||
| Increase (decrease) in cash and cash equivalents |
(327 | ) | 160 | (259 | ) | |||||||
| Beginning cash and cash equivalents includes cash of discontinued operations: 2012, $41; 2013, $11; 2014, $31 |
873 | 546 | 706 | |||||||||
|
|
|
|
|
|
|
|||||||
| Ending cash and cash equivalents includes cash of discontinued operations: 2012, $11; 2013, $31; 2014, $- |
$ | 546 | $ | 706 | $ | 447 | ||||||
|
|
|
|
|
|
|
|||||||
| Supplemental information: |
||||||||||||
| Interest paid |
$ | 444 | $ | 363 | $ | 302 | ||||||
|
|
|
|
|
|
|
|||||||
| Income taxes paid, net of refunds of $8 million, $21 million and $19 million, respectively |
$ | 482 | $ | 86 | $ | 43 | ||||||
|
|
|
|
|
|
|
|||||||
| Non-cash financing activities: |
||||||||||||
| Distribution of net assets of SpinCo (see Note 1) |
$ | — | $ | — | $ | 227 | ||||||
|
|
|
|
|
|
|
|||||||
| Receipt of SpinCo Notes in connection with AS Split-Off (see Note 1) |
$ | — | $ | — | $ | 425 | ||||||
|
|
|
|
|
|
|
|||||||
| Exchange of SpinCo Notes for SunGard Notes (see Note 5) |
$ | — | $ | — | $ | 389 | ||||||
|
|
|
|
|
|
|
|||||||
The accompanying notes are an integral part of these consolidated financial statements.
F-7
Table of Contents
Consolidated Statement of Changes in Equity
(In millions)
| Permanent Equity | ||||||||||||||||||||||||||||||||||||||||||||
| Treasury Stock | ||||||||||||||||||||||||||||||||||||||||||||
| Temporary Equity | Common Stock | Common Stock | ||||||||||||||||||||||||||||||||||||||||||
| Subject to a put option | Number of Shares issued |
Shares | ||||||||||||||||||||||||||||||||||||||||||
| Class L | Class A | Non- controlling Interest |
Class L | Class A | Par Value |
Capital in Excess of Par Value |
Class L | Class A | Par Value |
Amount | ||||||||||||||||||||||||||||||||||
| Balances at December 31, 2011 |
$ | 47 | $ | 6 | $ | 28 | 29 | 260 | $ | — | $ | 2,768 | — | 3 | $ | — | $ | (39 | ) | |||||||||||||||||||||||||
| Net income (loss) |
— | — | 1 | — | — | — | — | — | — | — | — | |||||||||||||||||||||||||||||||||
| Foreign currency translation |
— | — | — | — | — | — | — | — | — | — | — | |||||||||||||||||||||||||||||||||
| Net unrealized gain on derivative instruments (net of tax expense of $2) |
— | — | — | — | — | — | — | — | — | — | — | |||||||||||||||||||||||||||||||||
| Stock compensation expense |
— | — | — | — | — | — | 38 | — | — | — | — | |||||||||||||||||||||||||||||||||
| Dividends declared ($72.80 per preferred share) |
— | — | (3 | ) | — | — | — | (300 | ) | — | — | — | — | |||||||||||||||||||||||||||||||
| Issuance of common and preferred stock |
(1 | ) | — | (1 | ) | — | 1 | — | 1 | — | — | — | — | |||||||||||||||||||||||||||||||
| Purchase of treasury stock |
(1 | ) | — | — | — | — | — | (4 | ) | 1 | 2 | — | (11 | ) | ||||||||||||||||||||||||||||||
| Transfer intrinsic value of vested restricted stock units to temporary equity |
18 | 1 | 10 | — | — | — | (30 | ) | — | — | — | — | ||||||||||||||||||||||||||||||||
| Cancellation of put options due to employee terminations |
(18 | ) | (2 | ) | (9 | ) | — | — | — | 24 | — | — | — | — | ||||||||||||||||||||||||||||||
| Other |
— | — | — | — | — | — | (14 | ) | — | — | — | — | ||||||||||||||||||||||||||||||||
|
|
|
|
|
|
|
|
|
|
|
|
|
|
|
|
|
|
|
|
|
|
|
|||||||||||||||||||||||
| Balances at December 31, 2012 |
45 | 5 | 26 | 29 | 261 | — | 2,483 | 1 | 5 | — | (50 | ) | ||||||||||||||||||||||||||||||||
| Net income (loss) |
— | — | 2 | — | — | — | — | — | — | — | — | |||||||||||||||||||||||||||||||||
| Foreign currency translation |
— | — | — | — | — | — | — | — | — | — | — | |||||||||||||||||||||||||||||||||
| Net unrealized gain on derivative instruments (net of tax expense of $3) |
— | — | — | — | — | — | — | — | — | — | — | |||||||||||||||||||||||||||||||||
| Stock compensation expense |
— | — | — | — | — | — | 46 | — | — | — | — | |||||||||||||||||||||||||||||||||
| Issue common and preferred stock |
— | — | — | — | 1 | — | (9 | ) | — | — | — | 9 | ||||||||||||||||||||||||||||||||
| Purchase of treasury stock |
— | — | — | — | — | — | — | — | — | — | (6 | ) | ||||||||||||||||||||||||||||||||
| Transfer intrinsic value of vested restricted stock units to temporary equity |
23 | 1 | 17 | — | — | — | (41 | ) | — | — | — | — | ||||||||||||||||||||||||||||||||
| Cancellation of put options due to employee terminations |
(10 | ) | (2 | ) | (3 | ) | — | — | — | 12 | — | — | — | — | ||||||||||||||||||||||||||||||
| Other |
— | — | — | — | — | — | (9 | ) | — | — | — | — | ||||||||||||||||||||||||||||||||
|
|
|
|
|
|
|
|
|
|
|
|
|
|
|
|
|
|
|
|
|
|
|
|||||||||||||||||||||||
| Balances at December 31, 2013 |
58 | 4 | 42 | 29 | 262 | — | 2,482 | 1 | 5 | — | (47 | ) | ||||||||||||||||||||||||||||||||
| Net income (loss) |
— | — | 1 | — | — | — | — | — | — | — | — | |||||||||||||||||||||||||||||||||
| Foreign currency translation |
— | — | — | — | — | — | — | — | — | — | — | |||||||||||||||||||||||||||||||||
| Net unrealized gain on derivative instruments (net of tax benefit of $3) |
— | — | — | — | — | — | — | — | — | — | — | |||||||||||||||||||||||||||||||||
| Stock compensation expense |
— | — | — | — | — | — | 44 | — | — | — | — | |||||||||||||||||||||||||||||||||
| Issue common and preferred stock |
(1 | ) | — | — | — | — | — | (12 | ) | (1 | ) | (1 | ) | — | 15 | |||||||||||||||||||||||||||||
| Purchase of treasury stock |
— | — | — | — | — | — | — | — | — | — | (6 | ) | ||||||||||||||||||||||||||||||||
| Impact of exchange of SpinCo common stock for preferred stock of a subsidiary |
— | — | (1 | ) | — | — | — | 174 | — | — | — | — | ||||||||||||||||||||||||||||||||
| Impact of modification of SunGard Awards |
3 | — | (4 | ) | — | — | — | — | — | — | — | — | ||||||||||||||||||||||||||||||||
| Impact of modification of SpinCo Awards |
(8 | ) | — | (6 | ) | — | — | — | 13 | — | — | — | — | |||||||||||||||||||||||||||||||
| Transfer intrinsic value of vested restricted stock units to temporary equity |
20 | — | 13 | — | — | — | (33 | ) | — | — | — | — | ||||||||||||||||||||||||||||||||
| Cancellation of put options due to employee terminations |
(15 | ) | (1 | ) | (8 | ) | — | — | — | 18 | — | — | — | — | ||||||||||||||||||||||||||||||
| Other |
— | — | — | — | — | — | (12 | ) | — | — | — | — | ||||||||||||||||||||||||||||||||
|
|
|
|
|
|
|
|
|
|
|
|
|
|
|
|
|
|
|
|
|
|
|
|||||||||||||||||||||||
| Balances at December 31, 2014 |
$ | 57 | $ | 3 | $ | 37 | 29 | 262 | $ | — | $ | 2,674 | — | 4 | $ | — | $ | (38 | ) | |||||||||||||||||||||||||
|
|
|
|
|
|
|
|
|
|
|
|
|
|
|
|
|
|
|
|
|
|
|
|||||||||||||||||||||||
The accompanying notes are an integral part of these consolidated financial statements
F-8
Table of Contents
SunGard
Consolidated Statement of Changes in Equity (continued)
(In millions)
| Permanent Equity | ||||||||||||||||||||||||
| Accumulated Other Comprehensive Income (Loss) |
||||||||||||||||||||||||
| Retained Earnings (Accumulated Deficit) |
Foreign Currency Translation |
Net Unrealized Gain (Loss) on Derivative Instruments |
Other | Non-controlling Interest |
Total | |||||||||||||||||||
| Balances at December 31, 2011 |
$ | (3,346 | ) | $ | (37 | ) | $ | (9 | ) | $ | — | $ | 2,038 | $ | 1,375 | |||||||||
| Net income (loss) |
(317 | ) | — | — | — | 251 | (66 | ) | ||||||||||||||||
| Foreign currency translation |
— | 33 | — | — | — | 33 | ||||||||||||||||||
| Net unrealized gain on derivative instruments (net of tax expense of $2) |
— | — | 10 | — | — | 10 | ||||||||||||||||||
| Stock compensation expense |
— | — | — | — | — | 38 | ||||||||||||||||||
| Dividends declared ($72.80 per preferred share) |
272 | — | — | — | (714 | ) | (742 | ) | ||||||||||||||||
| Issuance of common and preferred stock |
— | — | — | — | — | 1 | ||||||||||||||||||
| Purchase of treasury stock |
— | — | — | — | (6 | ) | (21 | ) | ||||||||||||||||
| Transfer intrinsic value of vested restricted stock units to temporary equity |
— | — | — | — | — | (30 | ) | |||||||||||||||||
| Cancellation of put options due to employee terminations |
— | — | — | — | 6 | 30 | ||||||||||||||||||
| Other |
— | — | — | — | — | (14 | ) | |||||||||||||||||
|
|
|
|
|
|
|
|
|
|
|
|
|
|||||||||||||
| Balances at December 31, 2012 |
(3,391 | ) | (4 | ) | 1 | — | 1,575 | 614 | ||||||||||||||||
| Net income (loss) |
(107 | ) | — | — | — | 167 | 60 | |||||||||||||||||
| Foreign currency translation |
— | 19 | — | — | — | 19 | ||||||||||||||||||
| Net unrealized gain on derivative instruments (net of tax expense of $3) |
— | — | 3 | — | — | 3 | ||||||||||||||||||
| Stock compensation expense |
— | — | — | — | — | 46 | ||||||||||||||||||
| Issue common and preferred stock |
— | — | — | — | — | — | ||||||||||||||||||
| Purchase of treasury stock |
— | — | — | — | (4 | ) | (10 | ) | ||||||||||||||||
| Transfer intrinsic value of vested restricted stock units to temporary equity |
— | — | — | — | — | (41 | ) | |||||||||||||||||
| Cancellation of put options due to employee terminations |
— | — | — | — | 3 | 15 | ||||||||||||||||||
| Other |
1 | — | — | (3 | ) | — | (11 | ) | ||||||||||||||||
|
|
|
|
|
|
|
|
|
|
|
|
|
|||||||||||||
| Balances at December 31, 2013 |
(3,497 | ) | 15 | 4 | (3 | ) | 1,741 | 695 | ||||||||||||||||
| Net income (loss) |
(396 | ) | — | — | — | 173 | (223 | ) | ||||||||||||||||
| Foreign currency translation |
— | (65 | ) | — | — | — | (65 | ) | ||||||||||||||||
| Net unrealized gain on derivative instruments (net of tax benefit of $3) |
— | — | (5 | ) | — | — | (5 | ) | ||||||||||||||||
| Stock compensation expense |
— | — | — | — | — | 44 | ||||||||||||||||||
| Issue common and preferred stock |
— | — | — | — | — | 3 | ||||||||||||||||||
| Purchase of treasury stock |
— | — | — | — | (3 | ) | (9 | ) | ||||||||||||||||
| Impact of exchange of SpinCo common stock for preferred stock of a subsidiary |
(9 | ) | (75 | ) | — | — | (428 | ) | (338 | ) | ||||||||||||||
| Impact of modification of SunGard Awards |
— | — | — | — | — | — | ||||||||||||||||||
| Impact of modification of SpinCo Awards |
— | — | — | — | — | 13 | ||||||||||||||||||
| Transfer intrinsic value of vested restricted stock units to temporary equity |
— | — | — | — | — | (33 | ) | |||||||||||||||||
| Cancellation of put options due to employee terminations |
— | — | — | — | 6 | 24 | ||||||||||||||||||
| Other |
— | — | — | (3 | ) | 1 | (14 | ) | ||||||||||||||||
|
|
|
|
|
|
|
|
|
|
|
|
|
|||||||||||||
| Balances at December 31, 2014 |
$ | (3,902 | ) | $ | (125 | ) | $ | (1 | ) | $ | (6 | ) | $ | 1,490 | $ | 92 | ||||||||
|
|
|
|
|
|
|
|
|
|
|
|
|
|||||||||||||
The accompanying notes are an integral part of these consolidated financial statements.
F-9
Table of Contents
Notes to Consolidated Financial Statements
1. Basis of Presentation and Summary of Significant Accounting Policies:
SunGard (the “Company”), which was formerly named SunGard Capital Corp., is one of the world’s leading software and technology services companies and has two reportable segments: Financial Systems (“FS”) and Public Sector & Education (“PS&E”). The consolidated financial statements include the accounts of the Company and its majority-owned subsidiaries. All significant intercompany transactions and accounts have been eliminated.
SunGard Data Systems Inc., a wholly owned subsidiary of SunGard, was acquired on August 11, 2005 in a leveraged buy-out (the “LBO”) by a consortium of private equity investment funds associated with Bain Capital Partners, The Blackstone Group, Goldman, Sachs & Co., Kohlberg Kravis Roberts & Co., Providence Equity Partners, Silver Lake and TPG (collectively, the “Sponsors”). SunGard and certain other holding companies have no other operations beyond those of their ownership of SunGard Data Systems Inc.
On March 31, 2014, SunGard completed the split-off of its Availability Services (“AS”) business to its existing stockholders, including its private equity owners, on a tax-free and pro-rata basis. As part of that transaction, the assets and liabilities of the AS business were contributed to a new subsidiary, and then SunGard transferred all of its ownership interests in that subsidiary to Sungard Availability Services Capital, Inc. (“SpinCo”) in exchange for common stock of SpinCo, approximately $425 million of SpinCo senior notes (“SpinCo Notes”), and $1,005 million of net cash proceeds from the issuance of an AS term loan facility (“SpinCo Term Loan”). Immediately after these transactions, SunGard distributed the common stock of SpinCo through SunGard’s ownership chain ultimately to SunGard Capital Corp. II (SCCII), a subsidiary of SunGard, and then all stockholders of preferred stock of SCCII exchanged a portion of their shares of preferred stock for all of the shares of common stock of SpinCo on a pro-rata basis (together, with the transactions described above, the “AS Split-Off”). As a result, on March 31, 2014 the preferred stockholders of SCCII owned 100% of the common stock of SpinCo, a separate, independent company. The distribution of AS’ nets assets in connection with the AS Split-Off was based on the recorded amount of the net assets and did not result in a gain or loss upon disposal in the consolidated financial statements.
The AS business and two small FS businesses that were sold on January 31, 2014 have been included in the Company’s financial results as discontinued operations for all periods presented.
Certain prior year amounts have been reclassified to conform to current presentation. Refer to Note 2 of the Notes to Consolidated Financial Statements for information regarding the reclassification of facilities and information technology-related expenses to more accurately present them within the functional expense categories for the years ended December 31, 2012 and 2013.
The Consolidated Statements of Income (Loss) for the years ended December 31, 2012 and 2013 have been revised to present stock compensation expense and developer time spent on customer billable professional services projects in the correct functional expense categories. Refer to Note 2 of Notes to Consolidated Financial statements for additional details.
The Consolidated Balance Sheet as of December 31, 2013 has been revised to correct an immaterial misclassification of certain income tax receivable balances. Total assets and total liabilities each decreased by $7 million at December 31, 2013.
Estimates
The preparation of consolidated financial statements in conformity with accounting principles generally accepted in the United States of America (“GAAP”) requires management to make many estimates and
F-10
Table of Contents
judgments that affect the reported amounts of assets, liabilities, revenue and expenses. The Company evaluates its estimates and judgments on an ongoing basis and revises them when necessary. Actual results may differ from the original or revised estimates.
Revenue Recognition
The following criteria must be met in determining whether revenue may be recorded: (1) persuasive evidence of a contract exists; (2) software has been delivered and/or services have been provided; (3) the price is fixed or determinable; and (4) collection is reasonably assured.
Revenue is recorded as the software is delivered and/or services are provided based on the relative fair value of each element. Unbilled receivables are created when services are performed or software is delivered and revenue is recognized in advance of billings. Deferred revenue is created when billing occurs in advance of performing services or when all revenue recognition criteria have not been met.
We generate revenue from the following sources: (1) Software revenue, (2) SaaS and cloud revenue, and (3) Services revenue.
Software Revenue: Our Software revenue is comprised of traditional software license fees, maintenance and support fees, and fees from the resale of third-party software licenses. These software license fees include term licenses, perpetual licenses and rental fees. Term licenses generally have three to seven year terms and are generally billed upfront. For software licenses, revenue is recognized at the time the software is delivered assuming all revenue recognition criteria are met. Software rentals are generally offered under either annual or multi-year terms and are billed either monthly or annually in advance. Software rentals combine the license and maintenance services into a bundled element, and the fee is recognized ratably over the corresponding services period when the customer has the right to use the software product and receive maintenance and support services. Maintenance and support are generally offered under annual or multi-year terms and are billed either monthly or annually in advance. Our maintenance and support provides customers with periodic technology updates and interactive support related to our software. Maintenance and support revenue is recognized ratably over the stated term.
SaaS and Cloud Revenue: Our SaaS and cloud offerings are delivered from our private cloud and are generally offered with three to seven year terms. These offerings are billed monthly and allow customers to take advantage of SunGard’s deep domain expertise while avoiding the upfront cost of licensing and IT infrastructure. SaaS and cloud revenue also includes revenue from our proprietary trading algorithms and trade execution network. Our SaaS and cloud revenue includes monthly fees, which may include a fixed minimum fee and/or variable fees based on a measure of volume or activity, such as the number of accounts, trades or transactions, users or the number of hours of service.
Services Revenue: Our services offerings help customers to install, optimize and integrate SunGard’s software into their computing environment. For fixed-fee professional services contracts, revenue is recorded based upon proportional performance, measured by the actual number of hours incurred divided by the total estimated number of hours for the project. Changes in the estimated costs or hours to complete the contract, and losses, if any, are reflected in the period during which the change or loss becomes known. The Company also provides professional services on a time and materials basis, recognized monthly based upon hours incurred to date. In all cases, contract milestones, project risk profile and refund provisions are taken into consideration. Services also includes SunGard’s BPaaS offerings which provide back-office processing services to our customers where the process is closely related to a SunGard application.
Revenue Recognition for Software Related Multiple-Element Arrangements
We often enter into software license contracts that permit the customer to use a SunGard software product at the customer’s designated site or at the site of their choosing which can include 3rd party cloud environments as well as our private cloud. Careful review is required to determine if the software products being run in these
F-11
Table of Contents
cloud environments are considered software or non-software elements. If the customer has the contractual right to take immediate possession of the software without significant penalty the element would be categorized as software and can be bifurcated from the ongoing services.
Generally, these contracts are multiple-element arrangements since they usually include software products, professional services and ongoing software maintenance and support services. If the customer has the contractual right to take immediate possession of the software without significant penalty, software license fees are recognized upon the signing of the contract and delivery of the software if the license fee and fees for other elements within the arrangement are fixed or determinable, collection is probable, and there is sufficient vendor specific evidence of the fair value of each undelivered element.
With respect to software-related multiple element arrangements, sufficient evidence of fair value is defined as vendor specific objective evidence (“VSOE”). VSOE of the fair value for each element within an arrangement is based on either historical stand-alone sales of the element to third parties or stated renewal rates within the contract. If there is no VSOE of the fair value of the delivered element (which is usually the software since the license is rarely if ever sold separately), but there is VSOE of the fair value of each of the undelivered elements (typically maintenance and professional services), then the residual method is used to determine the portion of the arrangement fee allocated to the delivered element. The revenue for each of the undelivered elements is set at the fair value of those elements using VSOE of the price paid when each of the undelivered elements is sold separately. The revenue remaining after allocation to the undelivered elements (i.e., the residual) is allocated to the delivered element.
When there are significant program modifications or customization, installation, systems integration or related services, the professional services and license revenue are combined in accordance with contract accounting guidance and recorded based upon proportional performance, measured in the manner described above. License revenue is recorded as each installment becomes due if customer payments are extended beyond normal billing terms, or at acceptance when there is significant acceptance, technology or service risk. Revenue also is recorded over the longest service period in those instances where the software is bundled together with post-delivery services and there is not sufficient evidence of the fair value of each undelivered service element.
Our maintenance and support offerings entitle the customers to receive product upgrades and enhancements on a “when and if available” basis along with technical support, and revenue is recognized ratably over the term of the maintenance and support arrangement. VSOE supporting the fair value of maintenance and support is based on the stated (optional) renewal rates contained in the initial arrangement. VSOE for the maintenance element is dependent upon the software product and the annual maintenance fee is typically 18% to 20% of the software license fee. VSOE supporting the fair value of professional services is based on the standard daily rates charged when those services are sold separately, represented by a substantial portion of transactions falling within a reasonably tight pricing range.
In some software-related multiple-element arrangements, the maintenance or professional services rates are discounted. In these cases, a portion of the software license fee is deferred and recognized as the maintenance or professional services are performed based on VSOE of the services.
Revenue Recognition for Non-Software Multiple-Element Arrangements
We also enter into arrangements with customers that purchase non-software related services. Each element within a non-software multiple-element arrangement is accounted for as a separate unit of accounting provided the delivered services have value to the customer on a standalone basis, and, for an arrangement that includes a general right of return relative to the delivered services, delivery or performance of the undelivered service is considered probable and is substantially controlled by the Company. Where the criteria for a separate unit of accounting are not met, the deliverable is combined with the undelivered element(s) and treated as a single unit of accounting for the purposes of allocation of the arrangement consideration and revenue recognition.
F-12
Table of Contents
For non-software multiple-element arrangements, the Company allocates revenue to each element based on a selling price hierarchy at the arrangement inception. The selling price for each element is based upon the following selling price hierarchy: VSOE, then third-party evidence (“TPE”), then best estimated selling price (“BESP”). The total arrangement consideration is allocated to each separate unit of accounting for each of the non-software deliverables using the relative selling prices of each unit based on this hierarchy. The Company limits the amount of revenue recognized for delivered elements to an amount that is not contingent upon future delivery of additional products or services or meeting of any specified performance conditions.
To determine the selling price in non-software multiple-element arrangements, the Company establishes VSOE of the selling price using the price charged for a deliverable when sold separately. Where VSOE does not exist, TPE is established by evaluating similar competitor products or services in standalone arrangements with similarly situated customers. If the Company is unable to determine the selling price because VSOE or TPE doesn’t exist, it determines BESP for the purposes of allocating the arrangement consideration. BESP can be determined by considering pricing practices, margin objectives, contractually stated prices, competitive/market conditions and geographies.
In some circumstances, software and non-software deliverables are sold together. In these instances, software elements, which meet separation criteria, can be scoped out from the non-software elements and recognized in accordance with the relevant software guidance.
Cost of Sales and Direct Operating Expenses
Cost of sales and direct operating expenses represents the cost of providing the Company’s software and services offerings to customers and excludes depreciation, amortization and the cost of maintenance.
Cash and Cash Equivalents
Cash and cash equivalents consist of investments that are readily convertible into cash and have original maturities of three months or less.
Concentration of Credit Risk
Financial instruments that potentially subject the Company to concentrations of credit risk consist primarily of accounts receivable. The Company sells a significant portion of its products and services to the financial services industry and could be affected by the overall condition of that industry. The Company believes that any credit risk associated with accounts receivable is substantially mitigated by the relatively large number of customer accounts and reasonably short collection terms. Accounts receivable are stated at estimated net realizable value, which approximates fair value. By policy, the Company places its available cash and short-term investments with institutions of high credit-quality and limits the amount of credit exposure to any one issuer.
Foreign Currency Translation
The functional currency of each of the Company’s foreign operations is generally the local currency of the country in which the operation is located. All assets and liabilities are translated into U.S. dollars using exchange rates in effect at the balance sheet date. Revenue and expenses are translated using average exchange rates during the period. Increases and decreases in net assets resulting from currency translation are reflected in stockholder’s equity as a component of accumulated other comprehensive income (loss).
F-13
Table of Contents
Allowance for Doubtful Accounts Receivable
A reconciliation of the beginning and ending balance of the allowance for doubtful accounts receivable follows (in millions):
| Continuing operations |
Discontinued operations |
Total | ||||||||||
| Balance at December 31, 2013 |
$ | 17 | $ | 6 | $ | 23 | ||||||
| Additions charged to operations |
5 | 2 | 7 | |||||||||
| Translation adjustments and other(1) |
— | (8 | ) | (8 | ) | |||||||
|
|
|
|
|
|
|
|||||||
| Balance at December 31, 2014 |
$ | 22 | $ | — | $ | 22 | ||||||
|
|
|
|
|
|
|
|||||||
| (1) | Translation adjustments and other for discontinued operations includes $7 million that was removed as a result of the AS Split-Off in 2014. |
Property and Equipment
Property and equipment are recorded at cost and depreciated using the straight-line method over the estimated useful lives of the assets (three to eight years for equipment and ten to 40 years for buildings and improvements). Leasehold improvements are amortized ratably over their remaining lease term or useful life, if shorter. Depreciation and amortization of property and equipment in continuing operations was $62 million in 2012, $63 million in 2013 and $55 million in 2014.
Software Products
Software development costs are expensed as incurred and consist primarily of design and development costs of new products, and significant enhancements to existing products incurred before the establishment of technological feasibility. Costs incurred subsequent to technological feasibility of new and enhanced products, costs incurred to purchase or to create and implement internal-use software, and software obtained through business acquisitions are capitalized. Such costs are amortized over the estimated useful lives of the related products, using the straight-line method. For purchased and internally developed software, costs are generally amortized over three to five years. For software acquired in business acquisitions, costs are generally amortized over three to twelve years (average life is nine years).
Amortization of all software products in continuing operations were as follows for 2012, 2013 and 2014 (in millions):
| 2012 | 2013 | 2014 | ||||||||||
| Amortization of all acquired and purchased software products |
$ | 173 | $ | 141 | $ | 102 | ||||||
| Amortization of all internally developed software products (included in depreciation) |
11 | 19 | 27 | |||||||||
Purchase Accounting and Intangible Assets
Purchase accounting requires that all assets and liabilities be recorded at fair value on the acquisition date, including identifiable intangible assets separate from goodwill. Identifiable intangible assets include customer base (which includes customer contracts and relationships), software, trade name and non-compete agreements. Goodwill represents the excess of cost over the fair value of net assets acquired.
The estimated fair values and useful lives of identifiable intangible assets are based on many factors, including estimates and assumptions of future operating performance and cash flows of the acquired business, the nature of the business acquired, the specific characteristics of the identified intangible assets, and our historical
F-14
Table of Contents
experience and that of the acquired business. The estimates and assumptions used to determine the fair values and useful lives of identified intangible assets could change due to numerous factors, including product demand, market conditions, technological developments, economic conditions and competition. In connection with determination of fair values, the Company may engage independent appraisal firms to assist with the valuation of intangible and certain tangible assets acquired and certain assumed obligations.
Customer Base Intangible Assets
Customer base intangible assets represent customer contracts and relationships obtained as a result of the LBO and as part of businesses acquired since the LBO and are amortized using the straight-line method over their estimated useful lives, ranging from three to 18 years (average life is 15 years). Amortization of all customer base intangible assets in continuing operations totaled $63 million in 2012, $61 million in 2013 and $58 million in 2014.
Other Assets
Other assets consist primarily of deferred financing costs incurred in connection with the Company’s outstanding debt (see Note 5), noncompetition agreements and long-term accounts receivable. Deferred financing costs are amortized over the term of the related debt. Noncompetition agreements are amortized using the straight-line method over their stated terms, ranging from three to five years.
Impairment Reviews for Long-Lived Assets
The Company periodically reviews the carrying values and useful lives of long-lived assets for impairment whenever events or changes in circumstances indicate that the carrying value of the asset may not be recoverable. Factors that could indicate an impairment include significant underperformance of the asset as compared to historical or projected future operating results, or significant negative industry or economic trends. When the Company determines that the carrying value of an asset may not be recoverable, the related estimated future undiscounted cash flows expected to result from the use and eventual disposition of the asset are compared to the carrying value of the asset. If the sum of the estimated future undiscounted cash flows is less than the carrying amount, an impairment charge is recorded based on the difference between the carrying value of the asset and its fair value, which the Company estimates based on discounted expected future cash flows. In determining whether an asset is impaired, the Company makes assumptions regarding recoverability of costs, estimated future cash flows from the asset, intended use of the asset and other relevant factors. If these estimates or their related assumptions change, impairment charges for these assets may be required.
Future Amortization of Acquisition-Related Intangible Assets
Based on amounts recorded at December 31, 2014, total expected amortization of all acquisition-related intangible assets in each of the years ended December 31 follows (in millions):
| 2015 |
$ | 84 | ||
| 2016 |
67 | |||
| 2017 |
59 | |||
| 2018 |
54 | |||
| 2019 |
46 |
Trade Name
The trade name intangible asset represents the value of the SunGard trade name and is an indefinite-lived asset not subject to amortization. The Company completes its annual trade name impairment test as of July 1 of each year and more frequently when negative conditions or triggering events arise.
F-15
Table of Contents
Interim Impairment Test
The AS Split-Off triggered an interim impairment test of the carrying value of the SunGard trade name as of March 31, 2014 due to changes in how the trade name was to be used following the AS Split-Off. The Company utilized an income approach known as the relief-from-royalty method to determine the fair value of the SunGard trade name. Under this method, a royalty rate was applied to SunGard’s projected revenues to determine the annual cash savings attributable to ownership of the trade name. This amount was then tax-effected and discounted to present value to ultimately arrive at the estimated fair value of the trade name.
The Company developed certain assumptions and estimates related to the calculation of fair value of its trade name. The fair value assumptions and estimates primarily included projections of future revenues, a royalty rate, a tax rate, and a discount rate. The loss of projected AS revenues due to the AS Split-Off had a significant negative impact on the results of the trade name valuation. Based on the results of the impairment test, the fair value of the trade name was determined to be lower than its carrying value and resulted in a $339 million impairment of the trade name as of March 31, 2014.
In connection with the AS Split-Off, SunGard and AS agreed to a two-year royalty-free period for AS’ limited use of a derivative of the trade name, after which it will pay a pre-determined royalty rate based on its annual revenue for a specified number of years. As of March 31, 2014, SunGard transferred an $8 million “right-to-use” asset representing the value of AS’ limited right to use the “SUNGARD AVAILABILITY SERVICES” trade name during the royalty-free period.
Annual Impairment Test
As of July 1, 2014, the Company completed its annual impairment test and determined that the fair value of the trade name exceeded its carrying value, resulting in no further impairment of the trade name since the interim test performed as of March 31, 2014. From a sensitivity standpoint, a 50 basis point decrease in the assumed royalty rate would have resulted in an impairment of the trade name asset of approximately $123 million. A 50 basis point increase in the discount rate would result in an impairment of the trade name asset of approximately $24 million (100 basis point increase would result in an impairment of approximately $59 million). Furthermore, to the extent that additional businesses are sold, split-off or otherwise divested in the future, or revenues related to continuing operations decline, the revenue supporting the trade name will decline, which may result in further impairment charges.
The following table summarizes changes in the value of the trade name for the year ended December 31, 2014 (in millions):
| Trade name, net | ||||
| Balance at December 31, 2013 |
$ | 1,019 | ||
| Transfer limited “right to use” trade name asset to AS |
(8 | ) | ||
| Trade name impairment |
(339 | ) | ||
|
|
|
|||
| Balance at December 31, 2014 |
$ | 672 | ||
|
|
|
|||
Goodwill
July 1, 2014 Annual Impairment Test
The Company performs a goodwill impairment test annually and more frequently when negative conditions or triggering events arise. The Company completes its annual goodwill impairment test as of July 1 for each of its reporting units. The Company has the option of performing an assessment of certain qualitative factors to determine if it is more likely than not (that is, a likelihood of more than 50 percent) that the fair value of a reporting unit is less than its carrying value (referred to as a “step-zero” test) or proceeding directly to a quantitative analysis (referred to as a “step-one” test).
F-16
Table of Contents
Since each of the reporting units had an estimated fair value in excess of 20% of its respective carrying value as of the most recent step-one test, which was either as of July 1, 2012 or July 1, 2013, and no events were noted that would significantly decrease the fair value of the reporting unit, the Company elected to apply the qualitative assessment under the step-zero testing approach for all reporting units as of July 1, 2014. Based on the results of these tests, no step-one tests were determined to be necessary.
When performing a qualitative test, the Company assesses numerous factors to determine whether it is more likely than not that the fair value of the reporting units are less than their respective carrying values. Examples of qualitative factors that management assesses include the Company’s financial performance, market and competitive factors in the software and services industry, the amount of excess fair value over the carrying value of each reporting unit evident in prior years and other events specific to the Company’s reporting units.
Management considered factors that would impact the reporting unit fair values as estimated by the market and income approaches used in the last step-one test. Management reviewed current projections of cash flows and compared these current projections to the projections included in the most recent step-one test, and considered the fact that no new significant competitors entered the marketplace in the industry and that consumer demand for the industry’s products remains relatively constant, if not growing slightly. Also, economic factors over the past year (or two years in the case of units that were last tested quantitatively as of July 1, 2012) did not significantly affect the discount rates used for the valuation of these reporting units. Management concluded that events occurring since the last step one test did not have a significant impact on the fair value of each of these reporting units. Therefore, management determined that it was not necessary to perform a quantitative (step-one) goodwill impairment test for these reporting units as the fair value of each reporting unit appeared to exceed its respective carrying value.
July 1, 2013 Impairment Test
For the annual impairment test as of July 1, 2013, the Company chose to assess the qualitative factors of five of its reporting units and determined, for each of those five reporting units, a step-one test was not required. Management concluded that events occurring in 2013 did not have a significant impact on the fair value of each of these reporting units. Therefore, management determined that it was not necessary to perform a quantitative (step-one) goodwill impairment test for these reporting units. The Company performed a step-one test for the remaining six reporting units.
In step one, the estimated fair value of each reporting unit is compared to its carrying value. The Company estimated the fair values of each reporting unit by a combination of (i) estimation of the discounted cash flows of each of the reporting units based on projected earnings (the income approach) and (ii) a comparative analysis of revenue and EBITDA multiples of public companies in similar markets (the market approach). An equal weighting of the income approach and the market approach was used in the July 1, 2013 test. If there is a deficiency (the estimated fair value of a reporting unit is less than its carrying value), a step-two test is required. In step two, the amount of any goodwill impairment is measured by comparing the implied fair value of the reporting unit’s goodwill to the carrying value of goodwill, with the resulting impairment reflected as a charge to operations. The implied fair value is determined in the same manner as the amount of goodwill recognized in a business combination.
Estimating the fair value of a reporting unit requires various assumptions including projections of future cash flows, perpetual growth rates and discount rates. The assumptions about future cash flows and growth rates are based on management’s assessment of a number of factors, including the reporting unit’s recent performance against budget, performance in the market that the reporting unit serves, as well as industry and general economic data from third-party sources. Discount rate assumptions reflect an assessment of the risk inherent in those future cash flows. Changes to the underlying businesses could affect the future cash flows, which in turn could affect the fair value of the reporting unit.
F-17
Table of Contents
For the July 1, 2013 impairment test, the discount rates used were between 9% and 13.5% and the perpetual growth rates used were between 1.5% and 4%. Based on the results of the step-one tests, the Company determined that the fair values of each of the reporting units tested exceeded the respective carrying value and a step-two test was not required.
The Company determined that the excess of the estimated fair value over the carrying value of one of its reporting units, which is included in discontinued operations, was 9% of the carrying value as of the July 1, 2013 impairment test. This reporting unit’s goodwill balance at July 1, 2013 was $527 million. As mentioned above, the Company uses a combination of the income approach and market approach to determine the fair value of each reporting unit. Under the income approach, which is subject to variability based on the discount and perpetual growth rate assumptions used, a 50 basis point decrease in the perpetual growth rate or a 50 basis point increase in the discount rate would not have caused this reporting unit to fail the step-one test. A one hundred basis point decrease in the perpetual growth rate or a one hundred basis point increase in the discount rate would have caused this reporting unit to fail the step-one test and require a step-two analysis, and some or all of this goodwill could have been impaired. The other five reporting units for which the Company performed a step one test each had estimated fair values that exceeded the respective carrying value of the reporting unit by at least 25% as of the July 1, 2013 impairment test.
July 1, 2012 Annual Impairment Test
Based on the results of the July 1, 2012 step-one tests, the Company determined that the carrying value of the Availability Services North America (“AS NA”) reporting unit, which is included in discontinued operations, was in excess of its respective fair value and a step-two test was required. The primary driver for the decline in the fair value of the AS NA reporting unit compared to the prior year was the decline in the cash flow projections for AS NA when compared to those used in the 2011 goodwill impairment test as a result of a decline in the overall outlook of this reporting unit.
Prior to completing the step-two test, the Company first evaluated certain long-lived assets, primarily software, customer base and property and equipment, for impairment. In performing the impairment tests for long-lived assets, the Company estimated the undiscounted cash flows for the asset groups over the remaining useful lives of the reporting unit’s primary assets and compared that to the carrying value of the asset groups. There was no impairment of the long-lived assets.
In completing the step-two test to determine the implied fair value of goodwill and therefore the amount of impairment, management first determined the fair value of the tangible and intangible assets and liabilities. Based on the testing performed, the Company determined that the carrying value of goodwill exceeded its implied fair value and recorded a goodwill impairment charge of $385 million in discontinued operations.
For the July 1, 2012 impairment test, the discount rates used were between 10% and 12% and the perpetual growth rates used were between 3% and 4%.
The following table summarizes the 2012 goodwill impairment charge included in discontinued operations by reporting unit (in millions):
| Segment |
Reporting unit |
Net goodwill balance before impairment |
Impairment charge |
Net goodwill balance after impairment |
||||||||||||
| Availability Services |
AS NA | $ | 914 | $ | (385 | ) | $ | 529 | ||||||||
F-18
Table of Contents
The following table summarizes changes in goodwill by segment for continuing operations (in millions):
| Cost | Accumulated impairment | |||||||||||||||||||||||
| FS | PS&E | Subtotal | PS&E | Subtotal | Total | |||||||||||||||||||
| Balance at December 31, 2012 |
$ | 3,485 | $ | 544 | $ | 4,029 | $ | (217 | ) | $ | (217 | ) | $ | 3,812 | ||||||||||
| Adjustments related to the LBO and prior year acquisitions |
(1 | ) | — | (1 | ) | — | — | (1 | ) | |||||||||||||||
| Effect of foreign currency translation |
17 | — | 17 | — | — | 17 | ||||||||||||||||||
|
|
|
|
|
|
|
|
|
|
|
|
|
|||||||||||||
| Balance at December 31, 2013 |
3,501 | 544 | 4,045 | (217 | ) | (217 | ) | 3,828 | ||||||||||||||||
| Adjustments related to the LBO and prior year acquisitions |
(2 | ) | — | (2 | ) | — | — | (2 | ) | |||||||||||||||
| Effect of foreign currency translation |
(66 | ) | — | (66 | ) | — | — | (66 | ) | |||||||||||||||
|
|
|
|
|
|
|
|
|
|
|
|
|
|||||||||||||
| Balance at December 31, 2014 |
$ | 3,433 | $ | 544 | $ | 3,977 | $ | (217 | ) | $ | (217 | ) | $ | 3,760 | ||||||||||
|
|
|
|
|
|
|
|
|
|
|
|
|
|||||||||||||
Other Long-Term Liabilities
Other long-term liabilities consist of straight-line rent expense accruals, asset retirement obligations for leased properties and a $17 million and $7 million dividend payable at December 31, 2013 and 2014, respectively (see Note 8).
Stock Compensation
Stock-based compensation cost is measured at the grant date based on the fair value of the award and is recognized as expense over the appropriate service period. Fair value of restricted stock units (“RSUs”) with service-based or performance-based vesting is equal to the fair market value of the Company’s common and preferred stock at the time of grant. Fair value for stock options and share appreciation rights (“Appreciation Units”) with service-based or performance-based vesting is computed using the Black-Scholes pricing model. Fair value for Appreciation Units and RSUs with market-based vesting is computed using a Monte Carlo simulation. Determining the fair value of stock-based awards requires considerable judgment, including estimating the expected term of stock options, expected volatility of the Company’s stock price, the number of awards expected to be forfeited, and the expected performance of the Company’s stock price. In addition, for stock-based awards where vesting is dependent upon achieving certain operating performance goals, the Company estimates the likelihood of achieving the performance goals. Differences between actual results and these estimates could have a material effect on the consolidated financial results. A deferred income tax asset is recorded over the vesting period as stock compensation expense is recognized. The Company’s ability to use the deferred tax asset is ultimately based on the actual value of the stock option upon exercise or restricted stock unit or Appreciation Unit upon distribution. If the actual value is lower than the fair value determined on the date of grant, there could be an income tax expense for the portion of the deferred tax asset that cannot be used, which could have a material effect on the consolidated financial results.
Income Taxes
Income tax expense is based on income before income taxes, and is accounted for under the asset and liability method. Deferred tax assets and liabilities are recognized for the future tax consequences attributable to differences between the financial statement carrying amounts of existing assets and liabilities and their respective tax bases and operating loss and tax credit carryforwards. Deferred tax assets and liabilities are measured using enacted tax rates expected to apply to taxable income in the years in which those temporary differences are expected to be recovered or settled. The effect on deferred tax assets and liabilities of a change in tax rates is recognized in income in the period that includes the enactment date. Valuation allowances are recorded when it is not more likely than not that a deferred tax asset will be realized. The Company recognizes the effect of income tax positions only if those positions are more likely than not of being sustained. Recognized income tax positions are measured at the largest amount that is greater than 50% likely of being realized. Changes in recognition or
F-19
Table of Contents
measurement are reflected in the period in which the change in judgment occurs. Considerable judgment is required in assessing and estimating these amounts and the difference between the actual outcome of these future tax consequences and the estimates made could have a material impact on the consolidated results. To the extent that new information becomes available which causes the company to change its judgment regarding the adequacy of existing tax liabilities, such changes to tax liabilities will impact income tax expense in the period in which such determination is made. The Company records interest and penalties related to unrecognized tax benefits in income tax expense.
Recent Accounting Pronouncements
Recently Adopted
In March 2013, the Financial Accounting Standards Board (“FASB”) issued Accounting Standards Update (“ASU”) 2013-05, “Parent’s Accounting for the Cumulative Translation Adjustment upon Derecognition of Certain Subsidiaries or Groups of Assets within a Foreign Entity or of an Investment in Foreign Entity.” This new guidance clarified that when a parent either sells a part or all of its investment in a foreign entity or no longer holds a controlling financial interest in a subsidiary or group of assets that is a business, the parent should only release the related cumulative translation adjustment (“CTA”) into net income if the deconsolidation or derecognition results in the complete or substantially complete liquidation of the foreign entity in which the subsidiary or group of assets resided. The adoption of ASU 2013-05 on January 1, 2014 did not have an impact on the consolidated financial statements as the Company has historically accounted for the removal of CTA related to sales of non-U.S. entities consistent with this new guidance.
In July 2013, the FASB issued ASU 2013-11, “Presentation of an Unrecognized Tax Benefit When a Net Operating Loss Carryforward, a Similar Tax Loss, or a Tax Credit Carryforward Exists” to eliminate diversity in practice in the presentation of unrecognized tax benefits in those instances. This ASU requires that companies net their unrecognized tax benefits against all same jurisdiction deferred tax assets for net operating losses or tax credit carryforwards that would be used to settle the position with a tax authority to the extent such deferred tax assets are available. If this criteria does not apply or the tax law of the applicable jurisdiction does not require the entity to use and the entity does not intend to use the deferred tax assets for such purpose, the unrecognized tax benefit should be presented in the financial statements as a liability and should not be combined with deferred tax assets. The adoption of ASU 2013-11 on January 1, 2014 did not have a material impact on the consolidated financial statements.
Recently Issued
In April 2014, the FASB issued ASU 2014-08, “Reporting Discontinued Operations and Disclosures of Disposals of Components of an Entity” that changes the criteria for reporting a discontinued operation. According to the new guidance, only disposals of a component that represents a strategic shift that has (or will have) a major effect on an entity’s operations and financial results is a discontinued operation. The new guidance also requires expanded disclosures about discontinued operations and disposals of a significant part of an entity that does not qualify for discontinued operations reporting. ASU 2014-08 is effective beginning January 1, 2015 with early adoption permitted, but only for disposals (or classifications as held for sale) that have not been reported in previously-issued financial statements. Once adopted, ASU 2014-08 will affect how the Company identifies and presents discontinued operations in the consolidated financial statements for future disposals.
In May 2014, the FASB issued ASU 2014-09, “Revenue from Contracts with Customers,” which outlines a comprehensive revenue recognition model and supersedes most current revenue recognition guidance. This new guidance establishes a five step process that companies must use in order to recognize revenue properly. Those five steps are: (i) identifying contract(s) with a customer, (ii) identifying the performance obligations in the contract, (iii) determining the transaction price, (iv) allocating the transaction price to the performance obligations in the contract, and (v) recognizing revenue when (or as) the entity satisfies a performance obligation. The new ASU will affect any entity that either enters into contracts with customers to transfer goods or services or enters into contracts for the transfer of nonfinancial assets unless those contracts are within the scope of other
F-20
Table of Contents
standards. ASU 2014-09 will be effective for the Company starting in the first quarter of fiscal 2017. ASU 2014-09 allows for two methods of adoption: (a) “full retrospective” adoption, meaning the standard is applied to all periods presented, or (b) “modified retrospective” adoption, meaning the cumulative effect of applying ASU 2014-09 is recognized as an adjustment to the fiscal 2017 opening retained earnings balance. The Company is in the process of determining the adoption method as well as the effects the adoption of ASU 2014-09 will have on its consolidated financial statements.
In August 2014, the FASB issued ASU 2014-15, “Presentation of Financial Statements – Going Concern,” which establishes that in connection with the preparation of financial statements for each annual and interim reporting period, an entity’s management should evaluate whether there are conditions or events, considered in the aggregate, that raise substantial doubt about the entity’s ability to continue as a going concern within one year after the date that the financial statements are issued. ASU 2014-15 requires management to consider qualitative and quantitative information about conditions and events known and reasonably knowable at the date the financial statements are issued. ASU 2014-15 will be effective for the Company for the annual period ending after December 15, 2016 and interim periods beginning after December 15, 2016. The adoption of ASU 2014-15 is not expected to have a material impact on the Company’s consolidated financial statements.
2. Expense Classification:
Effective January 1, 2014, within the Consolidated Statements of Income (Loss), the Company changed its presentation of facilities and information technology-related expenses that are not directly associated with the delivery of its products and services. Formerly, the Company presented these expenses within sales, marketing and administration expense. The Company’s new method for presenting facilities and information technology-related expenses includes allocating these items to all of its functional areas, which the Company considers a better presentation as it more accurately reflects the actual cost of these functions. The presentation of prior year amounts in the consolidated financial statements has been reclassified to conform to the current year presentation.
Also, the Company revised its presentation of stock compensation expense. Formerly, the Company presented this expense entirely within sales, marketing and administration expense. The Company’s revised presentation allocates these costs to the appropriate functional areas. Further, the Company has revised its presentation of the costs for developer time spent on customer billable professional services projects. Formerly, the Company presented this expense within product development and maintenance expense. The Company’s revised presentation records these amounts to cost of sales and direct operating expense.
There was no impact on total reported costs and expenses for any period as a result of the changes. Management does not believe these revisions are material to the previously issued financial statements.
The impact within the functional areas, including the impact of the reclassification of AS to discontinued operations, is as follows for the years ended December 31, 2012 and 2013 as compared to the results included in the Consolidated Statements of Comprehensive Income (Loss) included in the 2013 Annual Report on Form 10-K (in millions):
| Year Ended December 31, 2013 | ||||||||||||||||||||||||
| As reported |
Impact of discontinued operations |
Reclassification of IT and facilities costs |
Revised presentation of stock compensation expense |
Revised presentation of developer time spent on professional services projects |
As presented in the statement of income (loss) |
|||||||||||||||||||
| Cost of sales and direct operating (excluding depreciation) |
$ | 1,706 | $ | (738 | ) | $ | 52 | $ | 5 | $ | 20 | $ | 1,045 | |||||||||||
| Sales, marketing and administration |
964 | (223 | ) | (98 | ) | (10 | ) | — | 633 | |||||||||||||||
| Product development and maintenance |
366 | (5 | ) | 46 | 5 | (20 | ) | 392 | ||||||||||||||||
|
|
|
|
|
|
|
|
|
|
|
|
|
|||||||||||||
| Total functional expenses |
$ | 3,036 | $ | (966 | ) | $ | — | $ | — | $ | — | $ | 2,070 | |||||||||||
|
|
|
|
|
|
|
|
|
|
|
|
|
|||||||||||||
F-21
Table of Contents
| Year Ended December 31, 2012 | ||||||||||||||||||||||||
| As reported |
Impact of discontinued operations |
Reclassification of IT and facilities costs |
Revised presentation of stock compensation expense |
Revised presentation of developer time spent on professional services projects |
As presented in the statement of income (loss) |
|||||||||||||||||||
| Cost of sales and direct operating (excluding depreciation) |
$ | 1,712 | $ | (713 | ) | $ | 64 | $ | 4 | $ | 15 | $ | 1,082 | |||||||||||
| Sales, marketing and administration |
996 | (223 | ) | (122 | ) | (8 | ) | — | 643 | |||||||||||||||
| Product development and maintenance |
380 | (5 | ) | 58 | 4 | (15 | ) | 422 | ||||||||||||||||
|
|
|
|
|
|
|
|
|
|
|
|
|
|||||||||||||
| Total functional expenses |
$ | 3,088 | $ | (941 | ) | $ | — | $ | — | $ | — | $ | 2,147 | |||||||||||
|
|
|
|
|
|
|
|
|
|
|
|
|
|||||||||||||
3. Acquisitions and Discontinued Operations:
Acquisitions
SunGard is focused on generating organic growth from innovative products and services marketed on a global basis. The Company will selectively acquire businesses to help it achieve this goal by enhancing its products and services or extending its geographic reach.
During each of 2013 and 2014, the Company completed one acquisition in its FS segment. Cash paid, net of cash acquired, was $1 million and $4 million in 2013 and 2014, respectively (see Note 19). In addition, in 2013 the Company paid approximately $1 million related to deferred purchase price from a prior year acquisition.
During 2012, the Company completed two acquisitions in its FS segment. Cash paid, net of cash acquired, was $39 million. In addition, the Company paid approximately $1 million related to deferred purchase price from prior year acquisitions.
The acquisitions discussed above were not material to the Company’s operations, financial position or cash flows.
At December 31, 2014, contingent purchase price obligations that depend upon the operating performance of certain acquired businesses were $6 million, of which less than $1 million is included in other long-term liabilities.
Discontinued Operations
In January 2014, the Company completed the sale of two small businesses within the FS segment in exchange for €27 million paid at closing, €9 million to be paid within three years (“deferred purchase price”) and €2 million to be paid upon the successful assignment of certain customer contracts. The deferred purchase price is unconditional and is secured by a bank guarantee. On March 31, 2014, AS was split-off from SunGard (see Note 1). These businesses are included in our financial results as discontinued operations for all periods presented.
In January 2012, the Company sold its Higher Education business (“HE”) and in July 2012 the Company sold one FS subsidiary. A $571 million gain was recorded on the sales. As a result of the HE sale, in 2012, the Company paid approximately $400 million in income tax payments, which is presented within income taxes paid, net of refunds on the Consolidated Statements of Cash Flows.
F-22
Table of Contents
The results for the discontinued operations for the years ended December 31, 2012, 2013 and 2014 were as follows (in millions):
| Year ended December 31, | ||||||||||||
| 2012 | 2013 | 2014 | ||||||||||
| Revenue |
$ | 1,509 | $ | 1,421 | $ | 338 | ||||||
| Operating income (loss), excluding goodwill impairment |
106 | 71 | (25 | ) | ||||||||
| Goodwill impairment charge |
(385 | ) | — | — | ||||||||
|
|
|
|
|
|
|
|||||||
| Operating income (loss) |
(279 | ) | 71 | (25 | ) | |||||||
| Interest expense, net |
(68 | ) | (73 | ) | (18 | ) | ||||||
| Other income (expense) |
(1 | ) | 1 | — | ||||||||
| Gain on sale of business |
571 | — | 22 | |||||||||
|
|
|
|
|
|
|
|||||||
| Income (loss) before income taxes |
223 | (1 | ) | (21 | ) | |||||||
| Benefit from (provision for) income taxes |
(246 | ) | 18 | 4 | ||||||||
|
|
|
|
|
|
|
|||||||
| Income (loss) from discontinued operations |
$ | (23 | ) | $ | 17 | $ | (17 | ) | ||||
|
|
|
|
|
|
|
|||||||
An additional $3 million benefit from income taxes was recorded in 2014 in income (loss) from discontinued operations in the statement of comprehensive income for SunGard due to the deduction of certain previously capitalized costs for income tax purposes available as a result of the AS Split-Off.
Assets of discontinued operations and liabilities of discontinued operations consisted of the following at December 31, 2013 (in millions):
| December 31, 2013 | ||||
| Cash and cash equivalents |
$ | 31 | ||
| Trade receivables, net |
227 | |||
| Prepaid expenses and other current assets |
70 | |||
| Property and equipment, net |
669 | |||
| Software products, net |
40 | |||
| Customer base, net |
734 | |||
| Other |
10 | |||
| Goodwill |
735 | |||
|
|
|
|||
| Assets of discontinued operations |
$ | 2,516 | ||
|
|
|
|||
| Accounts payable |
$ | 47 | ||
| Accrued compensation and benefits |
45 | |||
| Other accrued expenses |
78 | |||
| Deferred revenue |
260 | |||
| Current portion of long-term debt |
2 | |||
| Long-term debt |
5 | |||
| Deferred income taxes |
282 | |||
| Other long-term liabilities |
80 | |||
|
|
|
|||
| Liabilities of discontinued operations |
$ | 799 | ||
|
|
|
|||
F-23
Table of Contents
4. Property and Equipment:
Property and equipment consisted of the following (in millions):
| December 31, 2013 | December 31, 2014 | |||||||
| Computer and telecommunications equipment |
$ | 349 | $ | 374 | ||||
| Leasehold improvements |
81 | 84 | ||||||
| Office furniture and equipment |
68 | 67 | ||||||
| Buildings and improvements |
21 | 26 | ||||||
| Land |
2 | 2 | ||||||
| Construction in progress |
7 | 13 | ||||||
|
|
|
|
|
|||||
| Property and equipment – total cost |
528 | 566 | ||||||
| Accumulated depreciation |
(376 | ) | (414 | ) | ||||
|
|
|
|
|
|||||
| Property and equipment, net |
$ | 152 | $ | 152 | ||||
|
|
|
|
|
|||||
5. Debt and Derivative Instruments:
Debt consisted of the following (in millions):
| December 31, 2013 |
December 31, 2014 |
|||||||
| Senior Secured Credit Facilities: |
||||||||
| Secured revolving credit facility due March 8, 2018 (A) |
$ | — | $ | — | ||||
| Tranche A due February 28, 2014, effective interest rate of 1.92% (A) |
7 | — | ||||||
| Tranche C due February 28, 2017, effective interest rate of 4.41% and 4.44% (A) |
427 | 400 | ||||||
| Tranche D due January 31, 2020, effective interest rate of 4.50% (A) |
713 | — | ||||||
| Tranche E due March 8, 2020, effective interest rate of 4.10% and 4.31% (A) |
2,183 | 1,918 | ||||||
|
|
|
|
|
|||||
| Total Senior Secured Credit Facilities |
3,330 | 2,318 | ||||||
| Senior Secured Notes due 2014 at 4.875% (B) |
250 | — | ||||||
| Senior Notes due 2018 at 7.375% (C) |
900 | 511 | ||||||
| Senior Notes due 2020 at 7.625% (C) |
700 | 700 | ||||||
| Senior Subordinated Notes due 2019 at 6.625% (C) |
1,000 | 1,000 | ||||||
| Secured accounts receivable facility, at 3.67% and 3.16% (D) |
200 | 140 | ||||||
| Other, primarily foreign bank debt, acquisition purchase price and capital lease obligations |
4 | — | ||||||
|
|
|
|
|
|||||
| Total debt |
$ | 6,384 | $ | 4,669 | ||||
|
|
|
|
|
|||||
| Short-term borrowings and current portion of long-term debt |
$ | 290 | $ | — | ||||
| Long-term debt |
6,094 | 4,669 | ||||||
|
|
|
|
|
|||||
| Long-term debt |
$ | 6,384 | $ | 4,669 | ||||
|
|
|
|
|
|||||
The Company was in compliance with all covenants at December 31, 2014. Below is a summary of SunGard’s debt instruments.
(A) Senior Secured Credit Facilities
SunGard has a $600 million revolving credit facility, of which $592 million was available for borrowing after giving effect to $8 million of outstanding letters of credit as of December 31, 2014. In addition, there were $4 million of letters of credit outstanding at December 31, 2014 that did not impact availability under the revolving credit facility.
F-24
Table of Contents
On March 2, 2012, SunGard amended its Amended and Restated Credit Agreement dated as of August 11, 2005, as amended and restated from time to time (“Credit Agreement”) to, among other things, extend the maturity date of approximately $908 million in aggregate principal amount of tranche A and incremental term loans from February 28, 2014 to February 28, 2017 (“tranche C”), extend the maturity of the $880 million revolving credit facility commitments from May 11, 2013 to November 29, 2016, and amend certain covenants and other provisions, in order to, among other things, permit the potential spin-off of AS. The revolving credit facility commitments and tranche C each have springing maturity provisions which are described in the Credit Agreement. The interest rate on tranche C is LIBOR plus 3.75%.
On December 17, 2012, SunGard amended its Credit Agreement to, among other things, allow for the issuance of a $720 million term loan (“tranche D”), permit incremental credit extensions under the restated credit agreement in an amount up to $750 million; and modify certain covenants and other provisions in order to, among other things, permit additional restricted payments to be made with the net proceeds of the tranche D term loan and available cash in an aggregate amount not to exceed $750 million. Tranche D had certain springing maturities, and the interest rate was LIBOR plus 3.5% with a 1% LIBOR floor.
On December 31, 2012, SunGard voluntarily prepaid $48 million of its tranche A term loan and the entire outstanding incremental term loan balance of $169 million.
On March 8, 2013, SunGard amended and restated its Credit Agreement to, among other things, (i) issue an additional term loan of $2,200 million (“tranche E”) maturing on March 8, 2020, the proceeds of which were used to (a) repay in full the $1,719 million tranche B term loan and (b) repay $481 million of the tranche C term loan; (ii) replace the $880 million of revolving commitments with $850 million of new revolving commitments, which will mature on March 8, 2018; and (iii) modify certain covenants and other provisions in order to, among other things (x) modify (and in the case of the term loan facility, remove) the financial maintenance covenants included therein and (y) permit the Company to direct the net cash proceeds of permitted dispositions otherwise requiring a prepayment of term loans to the prepayment of specific tranches of term loans at the Company’s sole discretion. The interest rate on tranche E is LIBOR plus 3% with a 1% LIBOR floor.
During 2013, the Company repaid $200 million of tranche A term loans, $50 million outstanding on the revolving portion of the accounts receivable facility, and made the quarterly amortization payments on tranche D and E which totaled approximately $24 million.
On February 7, 2014, SunGard amended and restated its Credit Agreement to among other things (a) amend certain covenants and other provisions of the Credit Agreement in order to permit the AS Split-Off, including (i) the ability to effect the split-off without requiring an initial public offering, (ii) permitting AS to incur up to $1.5 billion of indebtedness in connection with the split-off, and (iii) SunGard’s total secured leverage ratio (less cash and cash equivalents in excess of $50 million), after giving pro forma effect to the split-off, to increase no more than 0.60x of Adjusted EBITDA at the time of the split-off; and (b) amend certain covenants and other provisions in order to, among other things (i) modify the financial maintenance covenant included therein, and (ii) permit the Company and its affiliates to repurchase term loans.
On February 28, 2014, SunGard repaid at maturity the remaining $7 million Tranche A term loan under the Senior Secured Credit Facilities.
On March 31, 2014, SunGard used net cash proceeds from the issuance of the SpinCo Term Loan to repay term loans (see mandatory prepayments below). Also, as a result of the AS Split-Off on March 31, 2014, SunGard’s revolving credit facility decreased from $850 million to $600 million.
Borrowings under the Credit Agreement bear interest at a rate equal to an applicable margin plus, at SunGard’s option, one of the following:
| • | LIBOR based on the costs of funds for deposits in the currency of such borrowing for either 30, 60, 90 or 180 days, or |
F-25
Table of Contents
| • | a base rate that is the higher of: |
| • | the prime rate of JPMorgan Chase Bank, N.A. and |
| • | the federal funds rate plus one-half of 1%. |
The applicable margin for borrowings under the various Credit Agreement tranches may change subject to attaining certain leverage ratios. In addition to paying interest on outstanding principal under the Credit Agreement, the Company pays a commitment fee to the lenders under the revolving credit facility in respect of the unutilized commitments. The commitment fee rate is currently 1.125% per annum and may change subject to attaining certain leverage ratios.
As of December 31, 2014, the applicable interest rates and the effective interest rates adjusted for swaps (if applicable) were as follows:
| Applicable interest rate | Effective rate adjusted for swaps |
|||||||
| Revolving credit facility |
3.67 | % | N/A | |||||
| Tranche C |
3.92 | % | 4.44 | % | ||||
| Tranche E |
4.00 | % | 4.31 | % | ||||
N/A: Not Applicable
All obligations under the Credit Agreement are fully and unconditionally guaranteed by SunGard Holdco LLC and by substantially all domestic, 100% owned subsidiaries, referred to, collectively, as Guarantors.
Mandatory Prepayments
The Credit Agreement requires SunGard to prepay outstanding term loans, subject to certain exceptions, with 50% of annual excess cash flow (subject to attaining a certain leverage ratio) and proceeds from certain asset sales, casualty and condemnation events, other borrowings and certain financings under SunGard’s secured accounts receivable facility. Any mandatory prepayment resulting from a permitted disposition or the AS Split-Off are applied pro rata to the lenders of specific tranches of term loans at the Company’s sole discretion. All other mandatory payments would be applied pro rata to the term loan lenders and to installments of the term loans in direct order of maturity. Pursuant to the terms of the Credit Agreement, SunGard made the following mandatory prepayments:
| • | In January 2012, SunGard completed the sale of HE and used net cash proceeds (as defined in the Credit Agreement) of $1.22 billion to repay, on a pro-rata basis, $396 million, $689 million and $137 million of tranche A, tranche B and the incremental term loan, respectively. As a result of the prepayment, the Company incurred a loss on the extinguishment of debt of approximately $15 million; and |
| • | On March 31, 2014, SunGard used the $1,005 million net cash proceeds from the issuance of the SpinCo Term Loan in connection with the AS Split-Off, to repay approximately $27 million of its tranche C term loan, $713 million of its tranche D term loan and $265 million of its tranche E term loan. |
As a result of loan prepayments, SunGard is no longer required to make quarterly principal payments on the tranche C or tranche E term loans.
The Credit Agreement contains a number of covenants that, among other things, restrict, subject to certain exceptions, SunGard’s (and most or all of its subsidiaries’) ability to incur additional debt or issue preferred stock, pay dividends and distributions on or repurchase capital stock, create liens on assets, enter into sale and
F-26
Table of Contents
leaseback transactions, repay subordinated indebtedness, make investments, loans or advances, make capital expenditures, engage in certain transactions with affiliates, amend certain material agreements, change its lines of business, sell assets and engage in mergers or consolidations. In addition, under the revolving credit facility within the Credit Agreement, SunGard may be required to satisfy the total leverage ratio covenant if there is an amount outstanding under the revolving credit facility (minus the lesser of (i) the amount of outstanding letters of credit issued under the Credit Agreement and (ii) $25 million) that is greater than or equal to 25% of the total revolving commitments available under the Credit Agreement. If applicable, the financial maintenance covenant allows a maximum total leverage ratio of 6.00x at the end of any quarter ending on or prior to December 31, 2015 and 5.75x thereafter.
SunGard uses interest rate swap agreements to manage the amount of its floating rate debt in order to reduce its exposure to variable rate interest payments associated with the Credit Agreement. Each of these swap agreements is designated as a cash flow hedge. SunGard pays a stream of fixed interest payments for the term of the swap, and in turn, receives variable interest payments based on LIBOR. At December 31, 2014, one-month LIBOR was 0.17% and three-month LIBOR was 0.26%. The net receipt or payment from the interest rate swap agreements is included in interest expense.
A summary of the Company’s interest rate swaps at December 31, 2014 follows:
| Inception |
Maturity | Notional Amount (in millions) |
Interest rate paid |
Interest rate received (LIBOR) |
||||||||||||
| August-September 2012 |
February 2017 | $ | 400 | 0.69 | % | 1-Month | ||||||||||
| June 2013 |
June 2019 | 100 | 1.86 | % | 3-Month | |||||||||||
| September 2013 |
June 2019 | 100 | 2.26 | % | 3-Month | |||||||||||
| February-March 2014 |
March 2020 | 300 | 2.27 | % | 3-Month | |||||||||||
|
|
|
|||||||||||||||
| Total / Weighted Average Interest Rate |
$ | 900 | 1.52 | % | ||||||||||||
|
|
|
|||||||||||||||
The interest rate swaps are included at estimated fair value as an asset or a liability in the consolidated balance sheet based on a discounted cash flow model using applicable market swap rates and certain assumptions. For 2012 and 2013, the Company included unrealized after-tax gains of $2 million, $5 million respectively, and in 2014, the company had a $4 million unrealized after-tax loss in Other Comprehensive Income (Loss) related to the change in market value of the swaps. The market value of the swaps recorded in Other Comprehensive Income (Loss) may be recognized in the statement of operations if certain terms of the Credit Agreement change, are modified or if the loan is extinguished. The fair values of the swap agreements at December 31, 2013 are $4 million and are included in other assets. The fair values of the swap agreements at December 31, 2014 are $1 million and $5 million and are included in other assets and other accrued expenses, respectively. The effects of the interest rate swaps are reflected in the effective interest rate for the Credit Agreement loans in the components of the debt table above. The Company had no ineffectiveness related to its swap agreements as of December 31, 2014. The Company expects to reclassify in the next twelve months approximately $8 million from other comprehensive income (loss) into earnings related to the Company’s interest rate swaps based on the borrowing rates at December 31, 2014.
(B) Senior Secured Notes due 2014
On January 15, 2004, SunGard issued $250 million of 4.875% senior unsecured notes due January 2014, which were subject to certain standard covenants. As a result of the LBO, these senior notes became collateralized on an equal and ratable basis with loans under the Credit Agreement and were guaranteed by all subsidiaries that guarantee the senior notes due 2018 and 2020 and senior subordinated notes due 2019. The Senior Secured Notes were fully repaid and retired in January 2014.
F-27
Table of Contents
(C) Senior Notes due 2015, 2018 and 2020 and Senior Subordinated Notes due 2015 and 2019
In November 2010, SunGard issued $900 million of 7.375% senior notes due 2018 (“SunGard 2018 Notes”) and $700 million of 7.625% of senior notes due 2020 (“SunGard 2020 Notes” and together with SunGard 2018 Notes “SunGard Senior Notes”). The proceeds, together with other cash, were used to retire the former $1.6 billion 9.125% senior notes that would have been due 2013. The SunGard Senior Notes (i) rank equally in right of payment to all existing and future senior debt and other obligations that are not, by their terms, expressly subordinated in right of payment to the SunGard Senior Notes, (ii) are effectively subordinated in right of payment to all existing and future secured debt to the extent of the value of the assets securing such debt, and (iii) are structurally subordinated to all obligations of each subsidiary that is not a guarantor of the SunGard Senior Notes. All obligations under the SunGard Senior Notes are fully and unconditionally guaranteed, subject to certain exceptions, by substantially all domestic, 100% owned subsidiaries of SunGard.
On April 2, 2012, SunGard redeemed for $527 million plus accrued and unpaid interest to the redemption date, all of its outstanding $500 million 10.625% senior notes due 2015 (“2015 Notes”) under the Indenture dated as of September 29, 2008 among SunGard, the guarantors named therein, and The Bank of New York Mellon, as trustee, as amended or supplemented from time to time. In conjunction with the redemption of the 2015 Notes, the Company incurred a $37 million loss on the extinguishment of debt which included a $27 million premium.
On November 1, 2012, SunGard issued $1 billion aggregate principal amount of 6.625% senior subordinated notes due 2019 (“Senior Subordinated Notes”) and used a portion of the net proceeds from this offering to repurchase approximately $490 million of its $1 billion 10.25% senior subordinated notes due 2015 (“existing 10.25% senior subordinated notes”). On December 3, 2012, SunGard redeemed the remaining existing 10.25% senior subordinated notes. As a result of this transaction, the Company incurred a $29 million loss on the extinguishment of debt which included a $21 million premium.
On March 31, 2014, SunGard exchanged the SpinCo senior notes with an aggregate principal amount of approximately $425 million for an aggregate principal amount of approximately $389 million of existing SunGard 2018 Notes which were then retired. The retirement of the SunGard 2018 Notes resulted in a $36 million loss on extinguishment of debt during the three months ended March 31, 2014. In addition, SunGard wrote-off approximately $25 million of capitalized deferred financing fees resulting from the repayment or retirement of debt during the three months ended March 31, 2014.
The Senior Subordinated Notes are unsecured senior subordinated obligations that are subordinated in right of payment to the existing and future senior debt, including the senior secured credit facilities, the SunGard 2018 Notes and the SunGard 2020 Notes. The Senior Subordinated Notes (i) rank equally in right of payment to all future senior subordinated debt, (ii) are effectively subordinated in right of payment to all existing and future secured debt to the extent of the value of the assets securing such debt, (iii) are structurally subordinated to all obligations of each subsidiary that is not a guarantor of the Senior Subordinated Notes, and (iv) rank senior in right of payment to all future debt and other obligations that are, by their terms, expressly subordinated in right of payment to the Senior Subordinated Notes.
The SunGard Senior Notes and Senior Subordinated Notes are redeemable in whole or in part, at SunGard’s option, at any time at varying redemption prices that generally include premiums, which are defined in the applicable indentures. In addition, upon a change of control, SunGard is required to make an offer to redeem all of the SunGard Senior Notes and Senior Subordinated Notes at a redemption price equal to 101% of the aggregate principal amount thereof plus accrued and unpaid interest.
The indentures governing the SunGard Senior Notes and Senior Subordinated Notes contain a number of covenants that restrict, subject to certain exceptions, SunGard’s ability and the ability of its restricted subsidiaries to incur additional debt or issue certain preferred shares, pay dividends on or make other distributions in respect of its capital stock or make other restricted payments, make certain investments, enter into certain types of
F-28
Table of Contents
transactions with affiliates, create liens securing certain debt without securing the SunGard Senior Notes or Senior Subordinated Notes, as applicable, sell certain assets, consolidate, merge, sell or otherwise dispose of all or substantially all of its assets and designate its subsidiaries as unrestricted subsidiaries.
(D) Secured Accounts Receivable Facility
SunGard’s syndicated secured accounts receivable facility limit was $200 million at December 31, 2014, which consists of a term loan of $140 million and a revolving commitment of $60 million. Advances may be borrowed and repaid under the revolving commitment with no impact on the facility limit. The term loan commitment may be repaid at any time at SunGard’s option, but will result in a permanent reduction in the facility limit. The interest rate is one-month LIBOR plus 3.5% and one-month LIBOR plus 3.0% at December 31, 2013 and 2014 respectively, which were 3.67% and 3.16 % at December 31, 2013 and 2014 respectively. At December 31, 2014, $140 million was drawn against the term loan commitment and no amount was outstanding under the revolving credit commitment. Also at December 31, 2014, $364 million of accounts receivable secured the borrowings under the receivables facility.
On January 31, 2014, SunGard removed AS as a seller and, as a result, repaid $60 million of the term loan commitment. Before the removal of AS and the $60 million repayment of the term loan, the aggregate facility limit was $275 million, consisting of a $200 million term loan commitment and a $75 million revolving credit commitment.
On May 14, 2014 SunGard amended and restated its secured accounts receivables facility in order to, among other things, (i) extend the maturity date of the receivables facility from December 19, 2017 to May 14, 2019; and (ii) reduce the applicable margin on the advances under the facility from 3.50% for LIBOR advances and 2.50% for base rate advances to 3.00% and 2.00%, respectively.
SunGard is subject to a fee on the unused portion of 0.75% per annum. The receivables facility contains certain covenants and SunGard is required to satisfy and maintain specified facility performance ratios, financial ratios and other financial condition tests.
Future Maturities
At December 31, 2014, the contractual future maturities of debt are as follows (in millions):
| Contractual | ||||
| 2015 |
$ | — | ||
| 2016 |
— | |||
| 2017 |
400 | |||
| 2018 |
511 | |||
| 2019 |
1,140 | |||
| Thereafter |
2,618 | |||
|
|
|
|||
| Total |
$ | 4,669 | ||
|
|
|
|||
F-29
Table of Contents
6. Accumulated Other Comprehensive Income (Loss):
The following table summarizes the unrealized gains (losses) on derivative instruments including the impact of components reclassified into net income from accumulated other comprehensive income (loss) for the years ended December 31, 2012, 2013 and 2014 (in millions):
|
Affected Line Item in the Statement of Comprehensive Income (Loss) for Components | ||||||||||||||
| Year Ended December 31, | ||||||||||||||
| Other Comprehensive Income (Loss) Components |
2012 | 2013 | 2014 | |||||||||||
| Unrealized gain (loss) on derivative instruments identified as accounting hedges |
$ | (1 | ) | $ | — | $ | (15 | ) | ||||||
| Loss (gain) on derivatives reclassified into income: |
||||||||||||||
| Interest rate contracts |
10 | 6 | 7 | Interest expense and amortization of deferred financing fees | ||||||||||
| Forward Currency Hedges |
3 | — | — | Cost of sales and direct operating | ||||||||||
|
|
|
|
|
|
|
|||||||||
| Total reclassified into income |
13 | 6 | 7 | |||||||||||
| Income tax benefit (expense) |
(2 | ) | (3 | ) | 3 | |||||||||
|
|
|
|
|
|
|
|||||||||
| Amounts reclassified from accumulated other comprehensive income,net of tax |
11 | 3 | 10 | |||||||||||
|
|
|
|
|
|
|
|||||||||
| Unrealized gain (loss) on derivative instruments, net of tax |
$ | 10 | $ | 3 | $ | (5 | ) | |||||||
|
|
|
|
|
|
|
|||||||||
The following table provides a rollforward of the components of accumulated other comprehensive loss, net of tax, through December 31, 2014 as follows (in millions):
| Gains and Losses on Cash Flow Hedges |
Currency Translation |
Other | Accumulated Other Comprehensive Income (Loss) |
|||||||||||||
| Balance at December 31, 2012 |
$ | 1 | $ | (4 | ) | $ | — | $ | (3 | ) | ||||||
| Other comprehensive income before reclassifications |
— | 19 | (3 | ) | 16 | |||||||||||
| Amounts reclassified from accumulated other comprehensive income net of tax |
3 | — | — | 3 | ||||||||||||
|
|
|
|
|
|
|
|
|
|||||||||
| Net current-period other comprehensive income |
3 | 19 | (3 | ) | 19 | |||||||||||
|
|
|
|
|
|
|
|
|
|||||||||
| Balance at December 31, 2013 |
4 | 15 | (3 | ) | 16 | |||||||||||
|
|
|
|
|
|
|
|
|
|||||||||
| Other comprehensive income before reclassifications |
(15 | ) | (65 | ) | (3 | ) | (83 | ) | ||||||||
| Amounts reclassified from accumulated other comprehensive income net of tax |
10 | — | — | 10 | ||||||||||||
|
|
|
|
|
|
|
|
|
|||||||||
| Net current-period other comprehensive income |
(5 | ) | (65 | ) | (3 | ) | (73 | ) | ||||||||
| Impact from AS Split-Off |
— | (75 | ) | — | (75 | ) | ||||||||||
|
|
|
|
|
|
|
|
|
|||||||||
| Balance at December 31, 2014 |
$ | (1 | ) | $ | (125 | ) | $ | (6 | ) | $ | (132 | ) | ||||
|
|
|
|
|
|
|
|
|
|||||||||
F-30
Table of Contents
7. Fair Value Measurements:
Accounting guidance defines fair value as the price that would be received to sell an asset or paid to transfer a liability in an orderly transaction between market participants at the measurement date. Under this guidance, the Company is required to classify certain assets and liabilities based on the following fair value hierarchy:
| • | Level 1 – Quoted prices (unadjusted) in active markets for identical assets or liabilities that can be accessed at the measurement date; |
| • | Level 2 – Inputs other than quoted prices included within Level 1 that are observable for the asset or liability, either directly or indirectly; and |
| • | Level 3 – Unobservable inputs for the asset or liability. |
The following table summarizes assets and liabilities measured at fair value on a recurring basis at December 31, 2014 (in millions):
| Fair Value Measures Using | ||||||||||||||||||
| Balance Sheet Caption |
Level 1 | Level 2 | Level 3 | Total | ||||||||||||||
| Assets |
||||||||||||||||||
| Money market funds |
Cash and cash equivalents | $ | 106 | $ | — | $ | — | $ | 106 | |||||||||
| Interest rate swap agreements |
Other assets | — | 1 | — | 1 | |||||||||||||
| Currency forward contracts |
Prepaid expenses and other current assets |
— | 3 | — | 3 | |||||||||||||
|
|
|
|
|
|
|
|
|
|||||||||||
| Total |
$ | 106 | $ | 4 | $ | — | $ | 110 | ||||||||||
|
|
|
|
|
|
|
|
|
|||||||||||
| Liabilities |
||||||||||||||||||
| Interest rate swap agreements |
Other accrued expenses | $ | — | $ | 5 | $ | — | $ | 5 | |||||||||
| Currency forward contracts |
Other accrued expenses | — | 1 | — | 1 | |||||||||||||
|
|
|
|
|
|
|
|
|
|||||||||||
| Total |
$ | — | $ | 6 | $ | — | $ | 6 | ||||||||||
|
|
|
|
|
|
|
|
|
|||||||||||
The following table summarizes assets and liabilities measured at fair value on a recurring basis at December 31, 2013 (in millions):
| Fair Value Measures Using | ||||||||||||||||||
| Balance Sheet Caption |
Level 1 | Level 2 | Level 3 | Total | ||||||||||||||
| Assets |
||||||||||||||||||
| Money market funds |
Cash and cash equivalents | $ | 407 | $ | — | $ | — | $ | 407 | |||||||||
| Interest rate swap agreements |
Other assets | — | 4 | — | 4 | |||||||||||||
| Currency forward contracts |
Prepaid expenses and other current assets |
— | 2 | — | 2 | |||||||||||||
|
|
|
|
|
|
|
|
|
|||||||||||
| Total |
$ | 407 | $ | 6 | $ | — | $ | 413 | ||||||||||
|
|
|
|
|
|
|
|
|
|||||||||||
Money market funds are recognized and measured at fair value in the Company’s financial statements. Fair values of the interest rate swap agreements are calculated using a discounted cash flow model using observable applicable market swap rates and assumptions and are compared to market valuations obtained from brokers.
The Company uses currency forward contracts to manage its exposure to fluctuations in costs caused by variations in Indian Rupee (“INR”) exchange rates. These INR forward contacts are designated as cash flow hedges. The fair value of these currency forward contracts is determined using currency exchange market rates, obtained from reliable, independent, third-party banks, at the balance sheet date. This fair value of forward contracts is subject to changes in currency exchange rates. The Company has no ineffectiveness related to its use of currency forward contracts. The fair value of the INR forward contracts were an asset of $2 million and $3 million at December 31, 2013 and 2014, respectively. The Company expects to reclassify in the next twelve months approximately $2 million from other comprehensive income (loss) into earnings related to the Company’s INR forward contracts.
F-31
Table of Contents
Certain assets and liabilities are measured on a non-recurring basis. During the first quarter of 2014, the trade name (a level 3 non-recurring fair value measure) was written down to a fair value of $672 million due to the recognition of a $339 million impairment charge, which was the result of the AS Split-Off (see Note 3). The fair value of the trade name is categorized as Level 3, a fair value measurement using significant unobservable inputs, and is estimated by discounted cash flows based on projected future revenues. This requires the use of various assumptions including projections of future cash flows, perpetual growth rates and discount rates. In 2012, goodwill (a level 3 non-recurring fair value measure) with a carrying value of $914 million was written down to a fair value of $529 million due to the recognition of a $385 million impairment loss, which is reflected in discontinued operations (see Note 1).
The fair value of goodwill is categorized in Level 3, fair value measurement using significant unobservable inputs, and is estimated by a combination of (i) discounted cash flows based on projected earnings in the future (the income approach) and (ii) a comparative analysis of revenue and EBITDA multiples of public companies in similar markets (the market approach). This requires the use of various assumptions including projections of future cash flows, perpetual growth rates and discount rates.
The following table summarizes assets and liabilities measured at fair value on a non-recurring basis at December 31, 2014 (in millions):
| Fair Value Measures Using | ||||||||||||
| Level 1 | Level 2 | Level 3 | ||||||||||
| Assets |
||||||||||||
| Trade name |
$ | — | $ | — | $ | 672 | ||||||
|
|
|
|
|
|
|
|||||||
Fair Value of Financial Instruments
The fair values of cash and cash equivalents, accounts receivable, accounts payable and accrued expenses, to the extent the underlying liability will be settled in cash, approximate carrying values because of the short-term nature of these instruments. The derivative financial instruments are carried at fair value. The fair value of the Company’s floating rate and fixed rate long-term debt (Level 2) is determined using actual market quotes and benchmark yields received from independent vendors. The following table presents the carrying amount and estimated fair value of the Company’s debt, including current portion and excluding the interest rate swaps (in millions):
| December 31, 2013 | December 31, 2014 | |||||||||||||||
| Carrying Value |
Fair Value |
Carrying Value |
Fair Value |
|||||||||||||
| Floating rate debt |
$ | 3,530 | $ | 3,548 | $ | 2,458 | $ | 2,431 | ||||||||
| Fixed rate debt |
2,862 | 3,024 | 2,211 | 2,286 | ||||||||||||
8. Preferred Stock
Preferred stock of SCCII is classified as non-controlling interest in the equity section and temporary equity of the balance sheet of SunGard.
SCCII has preferred and common stock outstanding at December 31, 2013 and 2014. The preferred stock is non-voting and ranks senior in right of payment to the common stock. Each share of preferred stock has a liquidation preference of $100 (the initial Class P liquidation preference) plus an amount equal to the accrued and unpaid dividends accruing at a rate of 11.5% per year of the initial Class P liquidation preference ($100 per share), compounded quarterly. Holders of preferred stock are entitled to receive cumulative preferential dividends to the extent a dividend is declared by the Board of Directors of SCCII at a rate of 11.5% per year of the initial Class P liquidation preference ($100 per share) payable quarterly in arrears. The aggregate amount of cumulative but undeclared preferred stock dividends at December 31, 2013 and 2014 was $764 million and $744 million, respectively ($77.35 and $98.64 per share, respectively).
F-32
Table of Contents
Preferred shares and stock awards which include preferred shares are held by certain members of management. In the case of termination resulting from disability or death, an employee or his/her estate may exercise a put option which would require the Company to repurchase vested shares at the current fair market value. Accordingly, these shares of preferred stock must be classified as temporary equity (between liabilities and stockholder’s equity) on the balance sheet.
In December 2012, SunGard borrowed $720 million (see Note 5) and used the net proceeds, along with available cash, to finance a preferred stock dividend of approximately $718 million, or $72.80 per preferred share (equivalent to $3.64 per pre-split Unit, as defined in Note 11). As a result of the dividend, under the terms of various equity award agreements and the SCC and SCCII Dividend Rights Plan, SCC was required to make dividend-equivalent cash payments of up to approximately $30 million to equity award holders. Of the $30 million, approximately $6 million was paid in December 2012 and the remaining balance will be paid over approximately five years, subject to vesting of the underlying equity awards. The total dividend and dividend-equivalents paid in 2012 was $724 million. In order to effect this transaction, SDS declared a dividend of approximately $747 million through holding companies ultimately to SCCII, which in turn declared a dividend of approximately $718 million to the holders of the preferred stock and a dividend of approximately $30 million, representing the amount of the dividend-equivalent cash payments, to SCC as the sole holder of the common stock. Also as a result of the dividend, all outstanding options on Units, except for the options with an exercise price of $4.50 per Unit, were modified to reduce the exercise price by $3.64 per Unit. There was no incremental stock compensation expense as a result of the dividend. Approximately $3 million and $2 million of dividend-equivalents were paid in 2013 and 2014, respectively.
On March 31, 2014, SCCII exchanged all of the common stock of SpinCo for 2,358,065 shares of its preferred stock held by its stockholders, which was recorded as treasury stock at the book value of the investment SCCII had in SpinCo. The decrease in the undeclared dividend is due to the reduced quantity of preferred stock outstanding partially offset by continued compounding.
9. Common Stock
SunGard has nine classes of common stock, Class L and Class A-1 through A-8. Class L common stock has identical terms as Class A common stock except as follows:
| • | Class L common stock has a liquidation preference: distributions by SunGard are first allocated to Class L common stock up to its $81 per share liquidation preference plus an amount sufficient to generate a rate of return of 13.5% per annum, compounded quarterly (“Class L Liquidation Preference”). All holders of Common stock, as a single class, share in any remaining distributions pro rata based on the number of outstanding shares of Common stock; and |
| • | each share of Class L common stock automatically converts into Class A common stock upon an initial public offering or other registration of the Class A common stock and is convertible into Class A common stock upon a majority vote of the holders of the outstanding Class L common stock upon a change in control or other realization events. If converted, each share of Class L common stock is convertible into one share of Class A common stock plus an additional number of shares of Class A common stock determined by dividing the Class L Liquidation Preference at the date of conversion by the adjusted market value of one share of Class A common stock as set forth in the certificate of incorporation of SunGard. |
In the case of termination resulting from disability or death, an employee or his/her estate may exercise a put option which would require the Company to repurchase vested shares at the current fair market value. Accordingly, these common shares must be classified as temporary equity (between liabilities and equity) on the balance sheet of SunGard.
F-33
Table of Contents
10. Earnings (Loss) Per Share
Earnings (loss) per share is calculated using the two-class method, which is an earnings allocation formula that determines earnings (loss) per share for the holders of the Company’s Class A common stock and the holders of Class L common stock, as if all earnings for the period were distributed pursuant to their contractual right to receive dividends. Class L common stock is legally designated as common stock, but is entitled to a preferential return equal to the sum of (i) an $81 per share base amount plus (ii) an amount sufficient to generate an internal rate of return equal to 13.5% per annum (compounded quarterly). After this amount has been distributed, the Class L participates in all distributions on a pro-rata basis with the Class A.
The numerator in calculating Class L basic and diluted income per share is an amount equal to the 13.5% preferential return for the reporting period.
The numerator in calculating Class A basic earnings (loss) per share is Net income (loss) attributable to SunGard, less an amount equal to the 13.5% preferential return for the reporting period. In determining the net income (loss) attributable to Class A stockholders for purposes of computing diluted earnings (loss) per share, the Company increased the loss to reflect the preference amount for dilutive Class L shares. The basic and diluted earnings (loss) per share attributable to Class A stockholders is presented for both continuing and discontinued operations for all periods.
Reconciliations of the numerators and denominators used in the computation of basic and diluted earnings (loss) per common share are as follows:
| Year ended December 31, | ||||||||||||
| 2012 | 2013 | 2014 | ||||||||||
| Numerators: |
|
|||||||||||
| Net loss attributable to SunGard |
$ | (317 | ) | $ | (107 | ) | $ | (396 | ) | |||
| Income (loss) from discontinued operations, net of tax |
(23 | ) | 17 | (14 | ) | |||||||
|
|
|
|
|
|
|
|||||||
| Loss from continuing operations attributable to SunGard |
(294 | ) | (124 | ) | (382 | ) | ||||||
| Less: Additional income attributable to the non-controlling interest for vested unissued shares |
(2 | ) | (2 | ) | (2 | ) | ||||||
| Less: Preference amount for Class L outstanding and vested unissued shares |
(773 | ) | (886 | ) | (1,016 | ) | ||||||
|
|
|
|
|
|
|
|||||||
| Numerator for basic earnings (loss) per share – Income (loss) available to Class A stockholders from continuing operations |
$ | (1,069 | ) | $ | (1,012 | ) | $ | (1,400 | ) | |||
|
|
|
|
|
|
|
|||||||
| Less: Additional income attributable to the non-controlling interest for dilutive preferred stock options and preferred shares included in restricted stock units |
— | (2 | ) | — | ||||||||
| Less: Preference amount for dilutive Class L options and Class L shares included in restricted stock units |
— | (11 | ) | — | ||||||||
|
|
|
|
|
|
|
|||||||
| Numerator for diluted earnings (loss) per share – Income (loss) available to Class A stockholders from continuing operations |
$ | (1,069 | ) | $ | (1,025 | ) | $ | (1,400 | ) | |||
|
|
|
|
|
|
|
|||||||
| Denominators: |
||||||||||||
| Class A Common Stock: |
||||||||||||
| Weighted average number of shares – Basic |
259 | 260 | 261 | |||||||||
| Effect of potentially dilutive Class A shares |
— | 3 | — | |||||||||
|
|
|
|
|
|
|
|||||||
| Weighted average number of shares – Diluted |
259 | 263 | 261 | |||||||||
|
|
|
|
|
|
|
|||||||
| Class L Common Shares: |
||||||||||||
| Weighted average number of shares – Basic |
29 | 29 | 29 | |||||||||
| Effect of potentially dilutive Class L shares |
— | — | — | |||||||||
|
|
|
|
|
|
|
|||||||
| Weighted average number of shares – Diluted |
29 | 29 | 29 | |||||||||
|
|
|
|
|
|
|
|||||||
| Earnings (loss) per share: |
||||||||||||
| Net income (loss) per share – Basic: |
||||||||||||
| Class L stockholders |
$ | 26.86 | $ | 30.68 | $ | 35.03 | ||||||
| Class A stockholders – continuing operations |
(4.12 | ) | (3.89 | ) | (5.37 | ) | ||||||
| Class A stockholders – discontinued operations |
(0.10 | ) | 0.06 | (0.05 | ) | |||||||
|
|
|
|
|
|
|
|||||||
| Class A stockholders – total |
(4.22 | ) | (3.83 | ) | (5.42 | ) | ||||||
|
|
|
|
|
|
|
|||||||
| Net income (loss) per share – Diluted: |
||||||||||||
| Class L stockholders |
$ | 26.86 | $ | 30.68 | $ | 35.03 | ||||||
| Class A stockholders – continuing operations |
(4.12 | ) | (3.90 | ) | (5.37 | ) | ||||||
| Class A stockholders – discontinued operations |
(0.10 | ) | 0.06 | (0.05 | ) | |||||||
|
|
|
|
|
|
|
|||||||
| Class A stockholders – total |
(4.22 | ) | (3.84 | ) | (5.42 | ) | ||||||
|
|
|
|
|
|
|
|||||||
The Company included $10 million and $17 million in the calculation of diluted earnings per share for Class L stockholders for the years ended December 31, 2012 and 2014, respectively, related to the preference amount for dilutive Class L options and Class L shares included in restricted stock units. These amounts are excluded from the calculation of diluted earnings (loss) per share for Class A stockholders for the same periods as the effect would be anti-dilutive.
F-34
Table of Contents
The following potential common shares were excluded from the calculation of earnings (loss) per share attributable to common stockholders because their effect would have been anti-dilutive for the periods presented:
| Year ended December 31, | ||||||||||||
| 2012 | 2013 | 2014 | ||||||||||
| Class A Common Stock: |
||||||||||||
| Restricted Stock Units |
6 | 7 | 7 | |||||||||
| Stock options |
22 | 17 | 16 | |||||||||
| Stock appreciation rights |
— | 6 | 7 | |||||||||
| Class L Common Stock: |
||||||||||||
| Restricted Stock Units |
1 | 1 | 1 | |||||||||
| Stock options |
2 | 1 | 1 | |||||||||
| Stock appreciation rights |
— | 1 | 1 | |||||||||
Unaudited Pro Forma Earnings (Loss) Per Share
Pro forma basic and diluted earnings (loss) per share were computed to give effect to the cancelation of SunGard Class A common stock, the conversion of Sungard Class L common stock into common stock, and the exchange of SCCII preferred stock for shares of common stock as if these actions had occurred as of the beginning of the period.
| Year ended December 31, 2014 |
||||
| Income (loss) from continuing operations |
— | |||
| Basic shares: |
||||
| Weighted average number of shares used to calculate basic earnings (loss) per share from continuing operations |
— | |||
| Pro forma adjustment to reflect cancelation of SunGard Class A common stock prior to completion of the company’s initial public offering |
— | |||
| Pro forma adjustment to reflect conversion of Sungard Class L common stock into common stock prior to completion of the company’s initial public offering |
— | |||
| Pro forma adjustment to reflect the exchange of SCCII preferred stock for shares of common stock prior to completion of the company’s initial public offering |
— | |||
|
|
|
|||
| Weighted average number of shares used to calculate basic pro forma earnings (loss) per share from continuing operations |
— | |||
| Diluted shares: |
||||
| Weighted average number of shares used to calculate basic pro forma earnings (loss) per share from continuing operations |
— | |||
| Effect of potentially dilutive securities |
— | |||
|
|
|
|||
| Weighted average number of shares used to calculate diluted pro forma earnings (loss) per share from continuing operations |
— | |||
| Pro forma earnings (loss) per share from continuing operations attributable to common stockholders: |
||||
| Basic |
— | |||
| Diluted |
— | |||
F-35
Table of Contents
The following potential common shares were excluded from the calculation of pro forma diluted earnings (loss) per share attributable to common stockholders because their effect would have been anti-dilutive for the periods presented:
| Year ended December 31, 2014 |
||||
| Restricted Stock Units |
— | |||
| Stock options |
— | |||
| Stock Appreciation Rights |
— | |||
11. Stock Option and Award Plans and Stock-Based Compensation:
The SunGard 2005 Management Incentive Plan as amended from time to time (“Plan”) was established to provide long-term equity incentives. The Plan authorizes the issuance of equity subject to awards made under the Plan for up to 70 million shares of Class A common stock and 7 million shares of Class L common stock of SunGard and 2.5 million shares of preferred stock of SCCII.
Under the Plan, awards of time-based and performance-based options have been granted to purchase “Units” in the Parent Companies. Each “Unit” consisted of 1.3 shares of Class A common stock and 0.1444 shares of Class L common stock of SunGard and 0.05 shares of preferred stock of SCCII before the AS Split-Off and 0.038 shares of preferred stock of SCCII after the AS Split-Off. The shares comprising a Unit are in the same proportion as the shares issued to all stockholders of the Parent Companies. From 2005 to 2007, options for Units were granted. Options for Units cannot be separately exercised for the individual classes of stock. Beginning in late 2007, awards were composed of restricted stock units (“RSUs”) for Units and options to purchase Class A common stock in SunGard. Class A options were no longer granted after September 2010. Currently, RSUs and Appreciation Units (discussed below) are granted. All awards under the Plan are granted at fair market value on the date of grant.
As a result of the AS Split-Off, the proportion of preferred stock of SCCII included in each “Unit” of equity in the Parent Companies changed from 0.05 shares to 0.038 shares, while there was no change in the proportion of the Class A or Class L common stock of SunGard. Accordingly, post-split, a “Unit” consists of 1.3 shares of Class A common stock and 0.1444 shares of Class L common stock of SunGard and 0.038 shares of preferred stock of SCCII.
In conjunction with the AS Split-Off, SunGard and SCCII amended all outstanding share-based awards to comply with the existing anti-dilution provisions in the Plan and respective share-based award agreements. The anti-dilution provisions require modification of the share-based awards in certain circumstances in order to prevent enlargement or dilution of benefits intended to be made available under the Plan.
To comply with the requirement of the Plan, all outstanding options and other long-term incentive equity awards were modified to (i) maintain the ratio of the exercise or base price to the fair market value of the stock prior to the modification and (ii) increase the quantity granted to maintain the intrinsic value of the awards based on the Unit price and the SpinCo share price, as applicable. In addition, all outstanding share-based awards were modified such that employees remaining with SunGard would hold awards in SunGard only and employees of AS would hold awards in SpinCo only. In order to achieve this result, all outstanding awards held by employees of AS were converted immediately prior to the AS Split-Off into SpinCo Awards. There was no incremental stock-based compensation expense as a result of these modifications.
Time-based options and RSUs granted generally vest over four or five years with monthly or annual vesting depending on the timing of the grant. Performance-based options and RSUs are earned upon the attainment of certain annual earnings goals based on Adjusted EBITA (defined as operating income before amortization of acquisition-related intangible assets, stock compensation expense and certain other items) or Adjusted EBITDA
F-36
Table of Contents
(defined as operating income before amortization of acquisition-related intangible assets, stock compensation expense, depreciation and certain other items) targets for the Company, depending on the date of grant, during a specified performance period. For awards granted prior to May 2011, there were generally five annual performance periods, of which 2014 was the last performance period included. For awards granted after May 2011, the performance period is generally 12 months at the end of which a portion of what was earned vests and the remainder of what was earned vests monthly or annually generally over three years. Time-based and performance-based options can partially or fully vest upon a change of control and certain other termination events, subject to certain conditions, and expire ten years from the date of grant. Once vested, time-based and performance-based RSUs become payable in shares upon the first to occur of a change of control, separation from service without cause, or the date that is four or five years (ten years for certain performance-based RSUs) after the date of grant.
In 2013 and 2014, certain senior executives of the Company were granted long-term incentive equity awards (“Appreciation Units”) to be settled in stock. The Appreciation Units vesting terms are either market-based dependent upon the performance of the Company’s Unit price (“Performance-based”) or time-based. Performance-based Appreciation Units will vest only if the average value per Unit at each measurement date (as defined in the agreements) increases over a base Unit value specified in the agreements and may be subject to continued employment through June 1, 2017. Time-based Appreciation Units will vest in annual installments over a period of years as specified in the applicable award agreement, subject to continued employment. The Company determined the fair value of the Performance-based Appreciation Units using a Monte Carlo valuation model and will record the aggregate expense over the measurement period on a straight-line basis regardless of vesting, subject to continued employment, if applicable. Time-based Appreciation Units were valued using the Black-Scholes pricing model, and will be expensed over the service period on a straight-line basis.
In June 2014, in addition to granting RSUs subject to time-based vesting, the Company granted RSUs with market-based vesting dependent upon the performance of the Company’s Unit price in relation to predetermined Unit price thresholds (“Market-based”). Each threshold signifies a level of vesting with interpolation between levels. Vesting is subject to continued employment through June 1, 2017, the measurement date. The Company determined the fair value of the Market-based RSUs using a Monte Carlo valuation model and will record the aggregate expense of $26 million over the three-year service period on a straight-line basis regardless of vesting, subject to continued employment, as required by GAAP.
The total fair value of options that vested for 2012, 2013 and 2014 was $4 million, $2 million and $1 million, respectively. The total fair value of Appreciation Units that vested during 2013 and 2014 was $2 million and $1 million, respectively. The total fair value of RSUs that vested for the years 2012, 2013 and 2014 was $30 million, $41 million and $32 million, respectively. At December 31, 2013 and 2014, approximately 3.2 million and 3.1 million RSUs, respectively, were vested.
The assumptions used in valuing the Appreciation Units and the RSUs with market-based vesting follow:
| Year ended December 31, 2013 | Year ended December 31, 2014 | |||||||||||||||
| Award type |
Appreciation Units | Appreciation Units | RSUs | |||||||||||||
| Vesting terms |
Market-based | Time-based | Market-based | Market-based | ||||||||||||
| Valuation model |
Monte-Carlo | Black-Scholes | Monte-Carlo | Monte-Carlo | ||||||||||||
| Weighted-average fair value on date of grant |
$ | 5.45 | $ | 5.91 | $ | 6.51 | $ | 16.44 | ||||||||
| Assumptions used to calculate fair value: |
||||||||||||||||
| Volatility |
38 | % | 38 | % | 45 | % | 45 | % | ||||||||
| Risk-free interest rate |
0.8 | % | 0.8 | % | 0.9 | % | 0.8 | % | ||||||||
| Expected term |
4 years | 4 years | 3.2 years | 3 years | ||||||||||||
| Dividends |
zero | zero | zero | zero | ||||||||||||
F-37
Table of Contents
Since the Company is not publicly traded, the Company utilizes equity valuations based on (a) stock market valuations of public companies in comparable businesses, (b) recent transactions involving comparable companies and (c) any other factors deemed relevant. The risk-free rate for periods within the contractual life of the Appreciation Unit or RSU is based on the U.S. Treasury yield curve in effect at the time of grant. Expected volatilities are based on implied volatilities from market comparisons of certain publicly traded companies and other factors. The expected term of Appreciation Units and Market-based RSUs granted is the term from grant date until distribution date.
For 2012, 2013 and 2014, the Company included stock compensation expense in the Consolidated Statements of Income (Loss) as follows:
| 2012 | 2013 | 2014 | ||||||||||
| Cost of sales and direct operating expenses |
$ | 4 | $ | 5 | $ | 7 | ||||||
| Sales, marketing and administration |
23 | 29 | 30 | |||||||||
| Product development and maintenance |
4 | 5 | 5 | |||||||||
|
|
|
|
|
|
|
|||||||
| Stock compensation expense – continuing operations |
31 | 39 | 42 | |||||||||
| Stock compensation expense – discontinued operations |
7 | 7 | 2 | |||||||||
|
|
|
|
|
|
|
|||||||
| Total stock compensation |
$ | 38 | $ | 46 | $ | 44 | ||||||
|
|
|
|
|
|
|
|||||||
At December 31, 2014, there was approximately $1 million and $45 million of unearned non-cash stock-based compensation related to time-based options and RSUs, respectively, that the Company expects to record as expense over a weighted average of 1.9 and 3.0 years, respectively. Also, at December 31, 2014, there was approximately $15 million of unearned non-cash stock compensation related to Appreciation Units that the Company expects to record over 2.4 years. In addition, at December 31, 2014, there was approximately $0.2 million and $9 million of unearned non-cash stock-based compensation related to performance-based options and RSUs, respectively, that the Company could record as expense over a weighted average of 2.1 and 2.5 years, respectively, primarily depending on continued service. Included in the unrecognized expense related to performance award amounts above are approximately 39,000 option Units ($0.2 million) and 559,000 RSUs ($9 million) that were earned during 2012 through 2014, but that will vest monthly or annually during 2015 through 2017. For time-based options and RSUs, compensation expense is recorded on a straight-line basis over the requisite service period of four or five years. For performance-based options and RSUs, recognition of compensation expense starts when the achievement of financial performance goals becomes probable and is recorded over the remaining service period.
The following table summarizes option, RSU and Appreciation Unit activity during 2014:
| Units | ||||||||||||||||||||||||||||||||
| Options (in millions) |
Weighted- Average Exercise Price |
RSUs (in millions) |
Weighted- Average Grant Date Fair Value |
Appreciation Units (in millions) |
Weighted- Average Base Unit Value |
Class A Options (in millions) |
Weighted- Average Exercise Price |
|||||||||||||||||||||||||
| Outstanding at December 31, 2013 |
14.8 | $ | 14.30 | 9.4 | $ | 20.59 | 4.6 | $ | 17.37 | 5.4 | $ | 1.72 | ||||||||||||||||||||
| Granted |
— | 3.1 | 19.09 | 0.5 | 17.44 | — | ||||||||||||||||||||||||||
| Exercised / released |
(0.9 | ) | 8.69 | (1.3 | ) | 20.25 | — | — | ||||||||||||||||||||||||
| Canceled |
(0.6 | ) | 15.26 | (1.5 | ) | 17.62 | (0.5 | ) | 17.34 | (1.7 | ) | 1.40 | ||||||||||||||||||||
| Impact of SunGard awards modified |
0.6 | n/a | 0.9 | n/a | 0.5 | n/a | — | |||||||||||||||||||||||||
| Impact of SpinCo awards modified |
(1.8 | ) | 14.41 | (1.6 | ) | 20.56 | — | — | ||||||||||||||||||||||||
|
|
|
|
|
|
|
|
|
|||||||||||||||||||||||||
| Outstanding at December 31, 2014 |
12.1 | 13.08 | 9.0 | 18.67 | 5.1 | 16.58 | 3.7 | 1.86 | ||||||||||||||||||||||||
|
|
|
|
|
|
|
|
|
|||||||||||||||||||||||||
F-38
Table of Contents
Included in the table above are 1.4 million option Units (weighted-average exercise price of $13.43), 0.5 million RSUs (weighted-average grant-date fair value of $19.87) and 1.0 million Class A options (weighted-average exercise price of $1.82) that have not vested and for which the performance period has ended. These options and RSUs may be canceled in the future. Also, approximately 1.7 million of the RSUs granted in 2014 are subject to Market-based vesting and may vest of up to 200% of the quantity granted based upon the stock price on the measurement date.
Shares available for grant under the Plan at December 31, 2014 were approximately 27.9 million shares of Class A common stock and 2.7 million shares of Class L common stock of SunGard and 0.8 million shares of preferred stock of SCCII.
The total intrinsic value of options exercised during the years 2012, 2013 and 2014 was $22 million, $4 million and $8 million, respectively.
Cash proceeds received by SunGard, including proceeds received by SCCII, from exercise of stock options were $0.2 million in 2012. Cash proceeds received by SunGard and SCCII from exercise of stock options in 2013 was not material. Cash proceeds received by SunGard, including proceeds received from SCCII, from purchases of stock were $0.5 million in 2014. No cash proceeds from exercise of stock options were received in 2014.
The tax benefit from options exercised during 2012, 2013 and 2014 was $7 million, $1 million and $3 million, respectively. The tax benefit from release of RSUs during each of 2012, 2013 and 2014 was $6 million. The tax benefit is realized by SunGard since SunGard files as a consolidated group which includes SCCII and SunGard.
The following table summarizes information as of December 31, 2014 concerning options for Units, Appreciation Units and options for Class A shares that have vested and that are expected to vest in the future:
| Vested and Expected to Vest | Exercisable | |||||||||||||||||||||||
| Exercise Price ($) |
Quantity Outstanding (in millions) |
Weighted- average Remaining Life (years) |
Aggregate Intrinsic Value (in millions) |
Quantity (in millions) |
Weighted- average Remaining Life (years) |
Aggregate Intrinsic Value (in millions) |
||||||||||||||||||
| Option Units |
||||||||||||||||||||||||
| 4.03 |
0.21 | 0.2 | $ | 3 | 0.21 | 0.2 | $ | 3 | ||||||||||||||||
| 12.87-15.31 |
10.04 | 0.9 | 39 | 9.94 | 0.9 | 39 | ||||||||||||||||||
| 15.85-18.91 |
0.37 | 5.4 | — | 0.33 | 5.2 | — | ||||||||||||||||||
| Appreciation Units |
||||||||||||||||||||||||
| 14.89-15.96 |
2.00 | 2.4 | 3 | n/a | ||||||||||||||||||||
| Options for Class A shares |
||||||||||||||||||||||||
| 0.21-0.44 |
1.00 | 4.9 | — | 0.98 | 4.9 | — | ||||||||||||||||||
| 1.41 |
0.17 | 3.9 | — | 0.17 | 3.9 | — | ||||||||||||||||||
| 2.22-3.06 |
1.50 | 3.3 | — | 1.50 | 3.3 | — | ||||||||||||||||||
12. Savings Plans:
The Company and its subsidiaries maintain savings and other defined contribution plans. Certain of these plans generally provide that employee contributions are matched with cash contributions by the Company subject to certain limitations including a limitation on the Company’s contributions to 4% of the employee’s compensation. Total expense for continuing operations under these plans aggregated $43 million in 2012, $45 million in 2013 and $51 million in 2014.
F-39
Table of Contents
13. Income Taxes:
Income (loss) from continuing operations before income taxes for 2012, 2013 and 2014 consisted of the following (in millions):
| 2012 | 2013 | 2014 | ||||||||||
| U.S. operations |
$ | (154 | ) | $ | (31 | ) | $ | (363 | ) | |||
| Foreign operations |
62 | 102 | 98 | |||||||||
|
|
|
|
|
|
|
|||||||
| Total |
$ | (92 | ) | $ | 71 | $ | (265 | ) | ||||
|
|
|
|
|
|
|
|||||||
The continuing operations provision (benefit) for income taxes for 2012, 2013 and 2014 consisted of the following (in millions):
| 2012 | 2013 | 2014 | ||||||||||
| Current: |
||||||||||||
| Federal |
$ | (21 | ) | $ | 5 | $ | 1 | |||||
| State |
4 | 9 | 4 | |||||||||
| Foreign |
22 | 36 | 42 | |||||||||
|
|
|
|
|
|
|
|||||||
| Total current |
5 | 50 | 47 | |||||||||
|
|
|
|
|
|
|
|||||||
| Deferred: |
||||||||||||
| Federal |
(27 | ) | (13 | ) | (122 | ) | ||||||
| State |
1 | — | 33 | |||||||||
| Foreign |
(28 | ) | (11 | ) | (15 | ) | ||||||
|
|
|
|
|
|
|
|||||||
| Total deferred |
(54 | ) | (24 | ) | (104 | ) | ||||||
|
|
|
|
|
|
|
|||||||
| Total |
$ | (49 | ) | $ | 26 | $ | (57 | ) | ||||
|
|
|
|
|
|
|
|||||||
Differences between income tax expense (benefit) at the expected U.S. federal statutory income tax rate of 35% and the Company’s continuing operations reported income tax (benefit) expense and effective tax rate for 2012, 2013 and 2014 were as follows (in millions):
| 2012 | 2013 | 2014 | ||||||||||
| Tax at federal statutory rate |
$ | (32 | ) | $ | 25 | $ | (93 | ) | ||||
| State income taxes, net of federal benefit |
2 | 5 | (10 | ) | ||||||||
| Foreign taxes, net of U.S. foreign tax credit (1) |
(20 | ) | 1 | 1 | ||||||||
| Tax rate changes (2) |
7 | (1 | ) | 46 | ||||||||
| Nondeductible expenses |
2 | 3 | 4 | |||||||||
| Change in uncertain tax positions (3) |
10 | 1 | 2 | |||||||||
| Research and development credit |
(1 | ) | (9 | ) | (6 | ) | ||||||
| Domestic Production Activities Deduction |
— | (1 | ) | (1 | ) | |||||||
| U.S. income taxes on non-U.S. unremitted earnings |
(20 | ) | 4 | (3 | ) | |||||||
| Other, net |
3 | (2 | ) | 3 | ||||||||
|
|
|
|
|
|
|
|||||||
| Total |
$ | (49 | ) | $ | 26 | $ | (57 | ) | ||||
|
|
|
|
|
|
|
|||||||
| Effective income tax rate |
53 | % | 36 | % | 22 | % | ||||||
|
|
|
|
|
|
|
|||||||
| (1) | Includes foreign taxes, dividends, utilization of foreign tax credits, and the rate differential between U.S. and foreign countries, and the change in foreign valuation allowance, as described in more detail below. Also includes $6 million, $4 million and $3 million in 2012, 2013 and 2014, respectively, related to benefits of tax holidays in Tunisia and India which expire in 2017 and 2024, respectively. |
F-40
Table of Contents
| (2) | Tax rate changes in 2014 includes an expense of $48 million due to changes in certain state deferred income tax rates, which are primarily driven by the change in the legal entity ownership of the SunGard trade name caused by the AS Split-Off. |
| (3) | The change in uncertain tax positions recorded in continuing operations was an expense of $10 million, $1 million and $2 million in 2012, 2013 and 2014, respectively, which reflects the offsetting benefits recorded in prepaid expenses and other current assets and deferred income and other taxes on the balance sheet. The balance is recorded in discontinued operations. |
Deferred income taxes are recorded based upon differences between financial statement carrying amounts of existing assets and liabilities and their respective tax bases and operating and tax credit carryforwards. Deferred income tax assets and liabilities at December 31, 2013 and 2014 consisted of the following (in millions):
| December 31, 2013 |
December 31, 2014 |
|||||||
| Current: |
||||||||
| Trade receivables and other current assets |
$ | (2 | ) | $ | — | |||
| Accrued expenses, net |
28 | 17 | ||||||
| Tax credit carryforwards |
20 | — | ||||||
| Other current |
(11 | ) | (5 | ) | ||||
|
|
|
|
|
|||||
| Total current deferred income tax asset (liability) |
35 | 12 | ||||||
| Valuation allowance |
(5 | ) | (4 | ) | ||||
| Net current deferred income tax asset (liability) |
30 | 8 | ||||||
|
|
|
|
|
|||||
| Less: amounts classified as related to discontinued operations |
(13 | ) | — | |||||
|
|
|
|
|
|||||
| Net current deferred income tax asset (liability) – continuing operations |
$ | 17 | $ | 8 | ||||
|
|
|
|
|
|||||
| Long-term: |
||||||||
| Property and equipment |
$ | 1 | $ | (2 | ) | |||
| Intangible assets |
(1,026 | ) | (596 | ) | ||||
| Net operating loss carry-forwards |
98 | 71 | ||||||
| Stock compensation |
62 | 55 | ||||||
| U.S. income taxes on non-U.S. unremitted earnings |
(24 | ) | (13 | ) | ||||
| Other non-current |
34 | 6 | ||||||
| Other, net |
(12 | ) | 15 | |||||
|
|
|
|
|
|||||
| Total long-term deferred income tax liability |
(867 | ) | (464 | ) | ||||
| Valuation allowance |
(62 | ) | (48 | ) | ||||
|
|
|
|
|
|||||
| Net long-term deferred income tax liability |
(929 | ) | (512 | ) | ||||
| Less: amounts classified as related to discontinued operations |
282 | — | ||||||
|
|
|
|
|
|||||
| Net long-term deferred income tax liability – continuing operations |
$ | (647 | ) | $ | (512 | ) | ||
|
|
|
|
|
|||||
The deferred income tax assets and liabilities include amounts classified as related to discontinued operations on the face of the financial statements for the year ended December 31, 2013.
As of December 31, 2014 the Company has net operating loss carryforwards, the tax effect of which is $71 million, which consist of $12 million for U.S. federal income tax purposes, $17 million for U.S. state income tax purposes and $42 million for foreign income tax purposes. The tax benefit recorded for net operating losses, net of valuation allowance, is $30 million, which consists of $6 million for U.S. federal income tax purposes, $2 million for U.S. state income tax purposes and $22 million for foreign income tax purposes. These tax loss carryforwards expire through 2034 and utilization is limited in certain jurisdictions. Some foreign losses have indefinite carryforward periods.
F-41
Table of Contents
The valuation allowances of $67 million and $52 million at December 31, 2013 and 2014, respectively, were primarily related to federal, state and foreign net operating loss carryforwards that, in the judgment of management, are not more-likely-than-not to be realized.
A reconciliation of the beginning and ending balance of the valuation allowance follows (in millions):
| Continuing operations |
Discontinued operations |
Total | ||||||||||
| Balance at December 31, 2013 |
$ | 41 | $ | 26 | $ | 67 | ||||||
| Additions, net |
12 | 1 | 13 | |||||||||
| Translation adjustments and other |
(1 | ) | (27 | )(1) | (28 | ) | ||||||
|
|
|
|
|
|
|
|||||||
| Balance at December 31, 2014 |
$ | 52 | $ | — | $ | 52 | ||||||
|
|
|
|
|
|
|
|||||||
| (1) | Translation adjustments and other for discontinued operations includes $27 million that was sold or removed as a result of the AS Split-Off in 2014. |
In assessing the realizability of deferred tax assets, management considers whether it is more-likely-than-not that some portion or all of the deferred tax assets will not be realized. The ultimate realization of deferred tax assets is dependent upon the generation of future taxable income during the periods in which those temporary differences become deductible. Management considers the scheduled reversal of deferred tax liabilities (including the impact of available carryback and carryforward periods), projected future taxable income, and tax-planning strategies in making this assessment. In the fourth quarter of 2014 after weighing the positive and negative evidence required, the Company recorded a valuation allowance of $3 million against certain losses generated in France. These losses were larger than anticipated and exceeded the scheduled reversal of deferred tax liabilities. The tax benefit of the French losses totals $24 million at December 31, 2014 and have an indefinite carryover period. Based upon the level of historical taxable income, projections for future taxable income and the reversal of deferred tax liabilities over the periods in which the deferred tax assets are deductible, management believes it is more-likely-than-not that the Company will realize the benefits of these deductible differences, net of the existing valuation allowances at December 31, 2013 and 2014. The amount of the deferred tax asset considered realizable, however, could be reduced in the near term if estimates of future taxable income during the carryforward period are reduced or as the reversal of certain deferred tax liabilities continues.
A reconciliation of the beginning and ending amount of unrecognized tax benefits follows (in millions):
| 2012 | 2013 | 2014 | ||||||||||
| Balance at beginning of year |
$ | 22 | $ | 94 | $ | 99 | ||||||
| Additions for tax positions of prior years |
22 | 7 | 4 | |||||||||
| Reductions for tax positions of prior years |
— | (5 | ) | (3 | ) | |||||||
| Additions for tax positions of current year |
50 | 3 | 7 | |||||||||
| Settlements for tax positions of prior years |
— | — | (3 | ) | ||||||||
|
|
|
|
|
|
|
|||||||
| Balance at end of year |
$ | 94 | $ | 99 | $ | 104 | ||||||
|
|
|
|
|
|
|
|||||||
As of December 31, 2014 the Company had unrecognized tax benefits and related accrued interest of approximately $104 million which, if recognized, would favorably affect the effective tax rate. Included in prepaid and other assets are amounts that would partially offset the impact on the effective tax rate. Increases in 2012 relate primarily to state income tax related matters. Included in the balance of unrecognized tax benefits is accrued interest and penalties, net of federal benefits of $4 million, $6 million and $8 million for 2012, 2013 and 2014, respectively. The Company recognizes interest and penalties in income tax expense.
As part of the AS Split-Off, SunGard entered into a tax sharing and disaffiliation agreement with AS that apportions responsibility for U.S. federal, state and local and foreign income and other taxes between the parties. See Note 16 for further information.
F-42
Table of Contents
Tax years after 2006 remain open for examination by the Internal Revenue Service, although years 2007-2010 are effectively settled. The Internal Revenue Service recently completed its examination of tax years 2009 and 2010. In addition, French tax authorities have just begun an examination of the tax year 2012. SunGard entities in other jurisdictions are also under examination at December 31, 2014 and tax years after 2005 remain open for audit by various state, local and other foreign jurisdictions. The Company anticipates that it is reasonably possible that between $0 and $38 million of unrecognized tax benefits may be resolved within the next 12 months.
During the fourth quarter of 2012 as a result of debt refinancing activities, the Company reevaluated the earnings of all its foreign subsidiaries and those that could be expected to be permanently reinvested outside the U.S. The Company determined that certain of its foreign subsidiaries earnings are permanently reinvested. The recognition of U.S. income tax is required when earnings of the foreign subsidiaries are not considered permanently reinvested outside the U.S. As of December 31, 2013 and 2014, the Company provided a deferred income tax liability of approximately $24 million and $13 million, respectively for non-U.S. withholding and U.S. income taxes associated with the future repatriation of earnings for certain non-U.S. subsidiaries. The Company has not provided deferred taxes on approximately $94 million of undistributed earnings of non-U.S. subsidiaries at December 31, 2014. Quantification of the related deferred tax liability, if any, associated with permanently reinvested earnings is not practicable.
14. Employee Termination Benefits and Facility Closures:
The following table provides a rollforward of the liability balances for workforce reductions and facility closures for 2012, 2013 and 2014 (in millions):
| Workforce- related |
Facilities | Total | ||||||||||
| Balance at December 31, 2011 |
$ | 24 | $ | 5 | $ | 29 | ||||||
| Expense related to 2012 actions |
34 | 12 | 46 | |||||||||
| Paid |
(31 | ) | — | (31 | ) | |||||||
| Other adjustments (1) |
(4 | ) | — | (4 | ) | |||||||
|
|
|
|
|
|
|
|||||||
| Balance at December 31, 2012 |
23 | 17 | 40 | |||||||||
| Expense related to 2013 actions |
20 | 2 | 22 | |||||||||
| Paid |
(23 | ) | (3 | ) | (26 | ) | ||||||
| Other adjustments (1) |
(6 | ) | (1 | ) | (7 | ) | ||||||
|
|
|
|
|
|
|
|||||||
| Balance at December 31, 2013 |
14 | 15 | 29 | |||||||||
| Expense related to 2014 actions |
28 | (2) | 4 | 32 | (3) | |||||||
| Paid |
(26 | ) | (6 | ) | (32 | ) | ||||||
| Other adjustments (1) |
(4 | ) | — | (4 | )(3) | |||||||
|
|
|
|
|
|
|
|||||||
| Balance at December 31, 2014 |
$ | 12 | $ | 13 | $ | 25 | ||||||
|
|
|
|
|
|
|
|||||||
| (1) | The other adjustments rows in the table principally relate to changes in estimates from when the initial charge was recorded and also foreign currency translation adjustments. |
| (2) | During the three months ended September 30, 2014, the Company recorded a $17 million severance charge related to a workforce reduction plan to reduce headcount by approximately 3% of the total workforce. |
| (3) | The sum of the expense related to 2014 actions and other adjustments in 2014 is the net amount of expense related to employee termination benefits and facility closures and may include rounding (see Note 15). |
The workforce related actions are expected to be paid out over the next 18 months (the majority within 12 months). The facilities accruals are for ongoing obligations to pay rent for vacant space and are net of sublease reserves. The lengths of these obligations vary by lease with the majority ending in 2019. The $13 million of facilities reserves is included in the future minimum rentals under operating leases (see Note 17).
F-43
Table of Contents
15. Segment Information:
The Company has two reportable segments: FS and PS&E.
FS primarily serves financial services companies through a broad range of software solutions that process their investment and trading transactions. The principal purpose of most of these systems is to automate the many detailed processes associated with trading securities, managing investment portfolios and accounting for investment assets.
PS&E primarily provides software and processing solutions designed to meet the specialized needs of local, state and federal governments, public safety and justice agencies, public schools, utilities, non-profits and other public sector institutions.
In reporting our results, we categorize revenue into three categories:
| • | Software Revenue |
| • | SaaS and cloud Revenue |
| • | Services Revenue |
The Company’s measure of segment profit or loss is Adjusted EBITDA. Management believes Adjusted EBITDA is an effective tool to measure the Company’s operating performance since it excludes non-cash items, including depreciation (which includes amortization of capitalized software), amortization of acquisition-related intangible assets, trade name and goodwill impairment charges and stock compensation expense, and certain variable charges including severance and facility closure costs, management fees paid to the Sponsors and certain other costs. Management uses Adjusted EBITDA extensively to measure the financial performance of SunGard and its reportable segments, and also to report the Company’s results to its board of directors. The Company uses a similar measure, as defined in its senior secured credit agreement, for purposes of computing its debt covenants.
The operating results for the years ended December 31, 2014, 2013 and 2012 for each segment follow (in millions):
| Year Ended December 31, 2014 | ||||||||||||||||||||
| FS | PS&E | Sum of segments |
Corporate (1) | Total | ||||||||||||||||
| Software |
$ | 988 | $ | 138 | $ | 1,126 | $ | — | $ | 1,126 | ||||||||||
| SaaS and cloud |
1,040 | 37 | 1,077 | — | 1,077 | |||||||||||||||
| Services |
564 | 42 | 606 | — | 606 | |||||||||||||||
|
|
|
|
|
|
|
|
|
|
|
|||||||||||
| Total revenue |
$ | 2,592 | $ | 217 | $ | 2,809 | $ | — | $ | 2,809 | ||||||||||
|
|
|
|
|
|
|
|
|
|
|
|||||||||||
| Adjusted EBITDA |
$ | 742 | $ | 68 | $ | 810 | $ | (45 | ) | $ | 765 | |||||||||
| Depreciation (2) |
95 | 9 | 104 | 3 | 107 | |||||||||||||||
| Amortization of acquisition-related intangible assets |
129 | 7 | 136 | — | 136 | |||||||||||||||
| Capital expenditures |
131 | 10 | 141 | 2 | 143 | |||||||||||||||
| Total assets |
6,225 | 833 | 7,058 | (547 | )(7) | 6,511 | ||||||||||||||
F-44
Table of Contents
| Year Ended December 31, 2013 | ||||||||||||||||||||
| FS | PS&E | Sum of segments |
Corporate (1) | Total | ||||||||||||||||
| Software |
$ | 987 | $ | 137 | $ | 1,124 | $ | — | $ | 1,124 | ||||||||||
| SaaS and cloud |
1,021 | 36 | 1,056 | — | 1,057 | |||||||||||||||
| Services |
543 | 37 | 580 | — | 580 | |||||||||||||||
|
|
|
|
|
|
|
|
|
|
|
|||||||||||
| Total revenue |
$ | 2,551 | (2) | $ | 210 | $ | 2,761 | $ | — | $ | 2,761 | |||||||||
|
|
|
|
|
|
|
|
|
|
|
|||||||||||
| Adjusted EBITDA |
$ | 746 | (2) | $ | 66 | $ | 812 | $ | (46 | ) | $ | 766 | ||||||||
| Depreciation (2) |
95 | 7 | 102 | 2 | 104 | |||||||||||||||
| Amortization of acquisition-related intangible assets |
168 | 13 | 181 | 1 | 182 | |||||||||||||||
| Capital expenditures |
102 | 8 | 110 | 1 | 111 | |||||||||||||||
| Total assets |
5,956 | 780 | 6,736 | 3,042 | (7) | 9,778 | ||||||||||||||
| Year Ended December 31, 2012 | ||||||||||||||||||||
| FS | PS&E | Sum of segments |
Corporate (1) | Total | ||||||||||||||||
| Software |
$ | 982 | $ | 135 | $ | 1,117 | $ | — | $ | 1,117 | ||||||||||
| SaaS and cloud |
1,051 | 33 | 1,084 | — | 1,084 | |||||||||||||||
| Services |
571 | 36 | 607 | — | 607 | |||||||||||||||
|
|
|
|
|
|
|
|
|
|
|
|||||||||||
| Total revenue |
$ | 2,604 | $ | 204 | $ | 2,808 | $ | — | $ | 2,808 | ||||||||||
|
|
|
|
|
|
|
|
|
|
|
|||||||||||
| Adjusted EBITDA |
$ | 727 | $ | 66 | $ | 793 | $ | (44 | ) | $ | 749 | |||||||||
| Depreciation (2) |
88 | 7 | 95 | 1 | 96 | |||||||||||||||
| Amortization of acquisition-related intangible assets |
199 | 17 | 216 | 1 | 217 | |||||||||||||||
| Capital expenditures |
88 | 7 | 95 | 2 | 97 | |||||||||||||||
| Total assets |
5,718 | 730 | 6,448 | 3,570 | (7) | 10,018 | ||||||||||||||
| (1) | Corporate is included to reconcile each item to the total for the Company. |
Reconciliation of Adjusted EBITDA to income (loss) from continuing operations before income taxes:
| Year Ended December 31, | ||||||||||||
| 2012 | 2013 | 2014 | ||||||||||
| Adjusted EBITDA (including corporate) |
$ | 749 | $ | 766 | $ | 765 | ||||||
| Depreciation (3) |
(96 | ) | (104 | ) | (107 | ) | ||||||
| Amortization of acquisition-related intangible assets |
(217 | ) | (182 | ) | (136 | ) | ||||||
| Trade name impairment charge |
— | — | (339 | ) | ||||||||
| Severance and facility closure costs |
(42 | )(4) | (17 | )(5) | (27 | )(6) | ||||||
| Stock compensation expense |
(31 | ) | (39 | ) | (42 | ) | ||||||
| Management fees |
(9 | ) | (8 | ) | (9 | ) | ||||||
| Other costs (included in operating income) |
(6 | ) | (12 | ) | (19 | ) | ||||||
| Interest expense, net |
(359 | ) | (325 | ) | (290 | ) | ||||||
| Loss on extinguishment of debt |
(82 | ) | (6 | ) | (61 | ) | ||||||
| Other income (expense) |
1 | (2 | ) | — | ||||||||
|
|
|
|
|
|
|
|||||||
| Income (loss) from continuing operations before income taxes |
$ | (92 | ) | $ | 71 | $ | (265 | ) | ||||
|
|
|
|
|
|
|
|||||||
| (2) | SunGard received approximately $12 million in proceeds related to a bankruptcy claim assigned and sold to a third party in the third quarter of 2013. The claim related to a FS customer that filed for Chapter 11 bankruptcy in January 2013. The amount of the claim represented previously reserved revenue, which now has been recognized, and a termination charge related to the customer contract. |
| (3) | Includes amortization of capitalized software. |
| (4) | Includes $27 million, $2 million and $1 million of severance in FS, PS&E and corporate, respectively. Also includes $12 million of lease exit costs in FS. |
F-45
Table of Contents
| (5) | Includes $13 million and $1 million of severance in FS and corporate, respectively. Also includes $3 million of lease exit costs in FS. |
| (6) | Includes $22 million and $1 million of severance in FS and PS&E, respectively. Also includes $4 million of lease exit costs in FS. |
| (7) | Includes items that are eliminated in consolidation, trade name, deferred income taxes and the assets of the Company’s assets of discontinued operations. |
Geographic Presence
The Company transacts business and has operations globally. The Company’s revenue by customer location follows (in millions):
| Year ended December 31, | ||||||||||||
| 2012 | 2013 | 2014 | ||||||||||
| United States |
$ | 1,733 | $ | 1,685 | $ | 1,712 | ||||||
| International: |
||||||||||||
| United Kingdom |
171 | 170 | 182 | |||||||||
| Continental Europe |
466 | 453 | 428 | |||||||||
| Asia/Pacific |
253 | 261 | 280 | |||||||||
| Canada |
89 | 85 | 90 | |||||||||
| Other |
96 | 107 | 117 | |||||||||
|
|
|
|
|
|
|
|||||||
| Subtotal – International |
1,075 | 1,076 | 1,097 | |||||||||
|
|
|
|
|
|
|
|||||||
| Total |
$ | 2,808 | $ | 2,761 | $ | 2,809 | ||||||
|
|
|
|
|
|
|
|||||||
The Company’s property and equipment by geographic location follows (in millions):
| December 31, 2012 |
December 31, 2013 |
December 31, 2014 |
||||||||||
| United States |
$ | 98 | $ | 92 | $ | 99 | ||||||
| International: |
||||||||||||
| United Kingdom |
20 | 16 | 16 | |||||||||
| Continental Europe |
16 | 17 | 15 | |||||||||
| Canada |
1 | 1 | — | |||||||||
| Asia/Pacific |
27 | 23 | 19 | |||||||||
| Other |
3 | 3 | 3 | |||||||||
|
|
|
|
|
|
|
|||||||
| Total |
$ | 165 | $ | 152 | $ | 152 | ||||||
|
|
|
|
|
|
|
|||||||
16. Related Party Transactions:
Sponsor Transactions
SunGard is required to pay management fees to affiliates of the Sponsors in connection with management consulting services provided to SunGard and the Parent Companies. These services include financial, managerial and operational advice and implementation strategies for improving the operating, marketing and financial performance of SunGard and its subsidiaries. In March 2014, the Company and the Sponsors amended the management agreement to increase the management fee from 1% to 1.1% of quarterly Adjusted EBITDA for five of seven Sponsors and fixed payments of $50,000 per quarter for each of the two remaining Sponsors. Adjusted EBITDA is defined as earnings before interest, taxes, depreciation and amortization, and goodwill and trade name impairments, further adjusted to exclude unusual items and other adjustments as defined in the management agreement, which is consistent with the Credit Agreement. Management fees are payable quarterly in arrears. In addition, these affiliates of the Sponsors may be entitled to additional fees in connection with
F-46
Table of Contents
certain financing, acquisition, disposition and change in control transactions. For the years ended December 31, 2012, 2013 and 2014, SunGard recorded $9 million, $8 million and $9 million, respectively, relating to management fees in Consolidated Statements of Income (Loss), of which $4 million and $3 million is included in other accrued expenses at December 31, 2013 and 2014, respectively. In addition, for the years ended December 31, 2012 and 2013, SunGard recorded $23 million and $4 million, respectively, relating to management fees in discontinued operations in the Consolidated Statements of Income (Loss).
During 2012, Goldman, Sachs & Co. and/or its respective affiliates received fees in connection with the March 2012 amendment and restatement of SunGard’s Credit Agreement, November 2012 Senior Subordinated Notes issuance and December 2012 amendment and restatement of SunGard’s Credit Agreement. In connection with these transactions, Goldman, Sachs & Co. was paid approximately $3 million.
During 2013 and 2014, Goldman, Sachs & Co. and/or its respective affiliates received fees of approximately $1 million and less than $1 million, respectively, in connection with the March 2013 and February 2014 amendments of SunGard’s Credit Agreement.
In addition to the amounts above, on March 31, 2014 the Company recorded approximately $15 million of management fees, which is included in income (loss) from discontinued operations, as provided in the Management Agreement for services rendered in connection with the issuance of the $1.025 billion SpinCo Term Loan and $425 million of SpinCo Notes. Also during the first quarter of 2014, the Company recorded approximately $1 million of management fees which is included in income (loss) from discontinued operations resulting from the sale of two FS businesses.
AS Transactions
In connection with the AS Split-Off, the following agreements, among others, were entered into on March 31, 2014:
(i) a Trademark License Agreement (the “Trademark License Agreement”) between a wholly-owned subsidiary of SunGard that owns the trademark “SunGard” and SpinCo. The Trademark License Agreement sets forth the terms under which SpinCo and its affiliates are permitted to use the mark “SUNGARD AVAILABILITY SERVICES.” During the first two years following the AS Split-Off, the use of the licensed mark is royalty free. In years 3 through 5, SpinCo will pay a royalty payment of 0.30% of their worldwide revenue, subject to certain exceptions. In years 6 and 7, the royalty will be reduced to 0.15% and 0.075%, respectively. Following year 7, SpinCo will have a perpetual, royalty-free license to use the mark going forward assuming they maintain compliance with the Trademark License Agreement;
(ii) a Transition Services Agreement (“TSA”) whereby SunGard agreed to provide certain transitional and administrative support services, including employee benefits services, to AS and AS agreed to provide transitional and administrative support services to SunGard generally for up to twelve months. At December 31, 2014, the Company had recorded approximately $2 million of accounts receivable from AS under the TSA;
(iii) a Global Master Services Agreement (“GMSA”) replaced the existing agreements under which AS provides certain availability services, managed services, and recovery services to SunGard. SunGard agreed to spend a minimum of approximately $66 million under the GMSA for the period from the AS Split-Off through March 31, 2016. For the nine months ended December 31, 2014, the Company incurred expenses of $25 million for services provided under the GMSA, substantially all of which is included in cost of sales and direct operating expenses in the consolidated statement of comprehensive income (loss). At December 31, 2014, the Company had recorded approximately $1 million of accounts receivable, $4 million of accounts payable, and a $1 million prepaid maintenance contract related to AS under the GMSA; and
(iv) a Tax Sharing and Disaffiliation Agreement (the “Agreement”) between the Company and SpinCo. Pursuant to the Agreement, the parties allocated responsibility for U.S. federal, state and local, and foreign
F-47
Table of Contents
income and other taxes relating to taxable periods before and after the AS Split-Off, and provided for computation and apportionment of tax liabilities and tax benefits between the parties. AS is generally responsible for all taxes attributable to the AS business for periods subsequent to the AS Split-Off and non-income related taxes attributable to the AS business for any taxable period before and after the date of the AS Split-Off. The Company retains responsibility for U.S. federal, state and local, and foreign income taxes for periods ending on or before the date of the AS Split-Off and has recorded a related $3 million liability payable to AS at December 31, 2014.
In addition, during the nine months ended December 31, 2014, AS purchased certain data center outsourcing services and treasury products from FS, for which FS recognized approximately $2 million of revenue.
17. Commitments, Contingencies and Guarantees:
The Company leases a substantial portion of its computer equipment and facilities under operating leases. The Company’s leases are generally non-cancelable or cancelable only upon payment of cancellation fees. All lease payments are based on the passage of time, but include, in some cases, payments for insurance, maintenance and property taxes. There are no bargain purchase options on operating leases at favorable terms, but most facility leases have one or more renewal options and have either fixed or Consumer Price Index escalation clauses. Certain facility leases include an annual escalation for increases in utilities and property taxes. In addition, certain facility leases are subject to restoration clauses, whereby the facility may need to be restored to its original condition upon termination of the lease. There were a combined $10 million of restoration liabilities included in accrued expenses and other long term liabilities at December 31, 2014.
Future minimum rentals and sublease income under operating leases with initial or remaining non-cancelable lease terms in excess of one year for continuing operations at December 31, 2014 follow (in millions):
| Future minimum rentals |
Future minimum sublease rental income |
|||||||
| 2015 |
$ | 62 | $ | 5 | ||||
| 2016 |
56 | 5 | ||||||
| 2017 |
45 | 5 | ||||||
| 2018 |
33 | 4 | ||||||
| 2019 |
14 | — | ||||||
| Thereafter |
21 | — | ||||||
|
|
|
|
|
|||||
| $ | 231 | $ | 19 | |||||
|
|
|
|
|
|||||
Rent expense from continuing operations aggregated to $69 million in 2012, $62 million in 2013 and $58 million in 2014. Sublease income was $3 million, $5 million and $6 million in 2012, 2013 and 2014, respectively. At December 31, 2014, the Company had unconditional purchase obligations of approximately $123 million which includes the amounts due under the GMSA (see Note 16) and $19 million of outstanding letters of credit and bid bonds issued primarily as security for performance under certain customer contracts.
In the event that the management agreement described in Note 16 is terminated by the Sponsors (or their affiliates) or SunGard and its Parent Companies, the Sponsors (or their affiliates) will receive a lump sum payment equal to the present value of the annual management fees that would have been payable for the remainder of the term of the management agreement. The initial term of the management agreement is ten years, and it extends annually for one year unless the Sponsors (or their affiliates) or SunGard and its Parent Companies provide notice to the other. The initial ten year term expires August 11, 2015.
The Company is presently a party to certain lawsuits arising in the ordinary course of its business. In the opinion of management, none of its current legal proceedings are expected to have a material impact on the
F-48
Table of Contents
Company’s business or financial results. The Company’s customer contracts generally include typical indemnification of customers, primarily for intellectual property infringement claims. Liabilities in connection with such obligations have not been material.
The Company has had patent infringement lawsuits filed against it or certain of its customers claiming that certain of its products infringe the intellectual property rights of others. Adverse results in these lawsuits may include awards of substantial monetary damages, costly royalty or licensing agreements, or limitations on the Company’s ability to offer certain features, functionalities, products, or services, and may also cause the Company to change its business practices, and require development of non-infringing products or technologies, which could result in a loss of revenues and otherwise harm the Company’s business. Also, certain agreements with previously owned businesses of the Company require indemnification to the new owners for certain matters as part of the sale of those businesses. At December 31, 2014, the Company does not have any significant accruals related to patent indemnification or infringement claims.
The Company evaluates, on a regular basis, developments in its legal matters. The Company records a provision for a liability when it believes that it is both probable that a liability has been incurred, and the amount can be reasonably estimated.
With respect to any current legal proceedings or claims pending against the Company for which it has not made an accrual, but for which it is reasonably possible that a loss may occur, the Company is unable to estimate a range of loss due to various reasons, including, among others: (1) that the proceedings are in early stages, (2) that there is uncertainty as to the outcome of pending appeals, motions, or settlements, (3) that there are significant factual issues to be resolved, and (4) that there are novel legal issues presented. Such legal matters are inherently unpredictable and subject to significant uncertainties, some of which are beyond the Company’s control. Based on current knowledge, the Company believes that the final outcome of the matters discussed above will not, individually or in the aggregate, have a material adverse effect on its business, consolidated financial position, results of operations, or cash flows. While the Company intends to vigorously defend these matters, in light of the uncertainties involved in such matters, there exists the possibility of adverse outcomes, and the final outcome of a particular matter could have a material adverse effect on results of operations or cash flows in a particular period.
The Company has recorded a reserve for unrecognized tax benefits and related accrued interest for certain matters. Also, the Company is under examination in various federal, state and local and foreign jurisdictions related to income and non-income tax matters. Based on current knowledge, the Company believes that resolution of these matters, giving recognition to the reserve for unrecognized tax benefits, will not have a materially adverse impact on its business, consolidated financial position, results of operations or cash flows.
The State of Delaware, Department of Finance, Division of Revenue (Unclaimed Property) and nine other states are currently conducting a joint examination of the books and records of certain wholly owned subsidiaries of the Company to determine compliance with the unclaimed property laws. Additionally, the Company has entered into voluntary disclosure agreements to address the potential unclaimed property exposure for certain entities not included in the scope of the ongoing unclaimed property examination. The potential exposure related to the examination and the voluntary disclosure programs is not currently determinable.
F-49
Table of Contents
18. Quarterly Financial Data (unaudited):
| First Quarter |
Second Quarter |
Third Quarter |
Fourth Quarter |
|||||||||||||
| 2013 |
||||||||||||||||
| Revenue |
$ | 639 | $ | 672 | $ | 678 | $ | 772 | ||||||||
| Gross profit (excluding items described in Note 1) (1) |
372 | 414 | 427 | 503 | ||||||||||||
| Income (loss) before income taxes |
(52 | ) | 10 | (2) | 29 | (2)(3) | 84 | (2) | ||||||||
| Income (loss) from continuing operations |
(35 | ) | 5 | (2) | 22 | (2)(3) | 53 | (2) | ||||||||
| Income (loss) from discontinued operations |
(12 | ) | 10 | 1 | 18 | |||||||||||
| Net income (loss) |
(47 | ) | 15 | (2) | 23 | (2)(3) | 71 | (2) | ||||||||
| Net income (loss) attributable to SunGard |
(72 | ) | (32 | )(2) | (26 | )(2)(3) | 23 | (2) | ||||||||
| 2014 |
||||||||||||||||
| Revenue |
$ | 653 | $ | 673 | $ | 691 | $ | 792 | ||||||||
| Gross profit (excluding items described in Note 1) (1) |
384 | 400 | 411 | 516 | ||||||||||||
| Income (loss) before income taxes |
(424 | )(4) | 5 | 22 | (5) | 132 | ||||||||||
| Income (loss) from continuing operations |
(323 | )(4) | 3 | 11 | (5) | 101 | ||||||||||
| Income (loss) from discontinued operations |
(17 | ) | — | — | 3 | |||||||||||
| Net income (loss) |
(340 | )(4) | 3 | 11 | (5) | 104 | ||||||||||
| Net income (loss) attributable to SunGard |
(390 | )(4) | (37 | ) | (31 | )(5) | 62 | |||||||||
| (1) | Gross profit equals revenue less cost of sales and direct operating expenses. |
| (2) | During the second quarter of 2013, the Company completed a review of its accounting practices related to vacation pay obligations. In countries where the vacation policy stipulated that vacation days earned in the current year must be used in that same year, the Company adjusted its quarterly estimate of accrued vacation costs to better match expense recognition with amounts payable to employees when leaving the Company. The impact of the change in estimate was an aggregate decrease to costs and expenses of $10 million in the quarter ended June 30, 2013. The impact of this change was negligible for the full year since the balance would have naturally reversed, with a substantial majority of that reversal occurring during the fourth quarter. |
| (3) | SunGard received approximately $12 million in proceeds related to a bankruptcy claim assigned and sold to a third party in the third quarter of 2013. The claim related to an FS customer that filed for Chapter 11 bankruptcy in January 2013. The amount of the claim represented previously reserved revenue, which now has been recognized, and a termination charge related to the customer contract. |
| (4) | Includes a $339 million impairment charge of the trade name asset (see Note 1 of Notes to Consolidated Financial Statements) and a $61 million loss on extinguishment of debt (see Note 5 of Notes to Consolidated Financial Statements). |
| (5) | During the three months ended September 30, 2014, the Company recorded a $17 million severance charge related to a workforce reduction plan to reduce headcount by approximately 3% of the total workforce. |
All of the previously-issued interim financial statements included in Quarterly Reports on Form 10-Q for 2014 included an error in the Condensed Consolidated Statements of Comprehensive Income (Loss) related to the removal of the cumulative foreign currency translation loss associated with the AS businesses that were split-off on March 31, 2014. The removal of the cumulative foreign currency translation loss was reflected in both the Condensed Consolidated Statements of Comprehensive Income (Loss) and the rollforwards of stockholders’ equity included in the notes to the condensed consolidated financial statements in each of the Quarterly Reports. However, the inclusion of this item in the 2014 Condensed Consolidated Statements of Comprehensive Income (Loss) was not appropriate since it relates to the distribution of the AS businesses to our owners and should have been excluded from the 2014 Other Comprehensive Income according to GAAP. Management does not believe the error is material to any of the previously-issued financial statements. The table below shows the impact of the correction of this error for each period. These revisions will also be reflected in the Company’s 2015 quarterly filings.
F-50
Table of Contents
The following table presents the amounts as originally reported and as revised (in millions):
| Three Months Ended March 31, 2014 |
Six Months Ended June 30, 2014 |
Nine Months Ended September 30, 2014 |
||||||||||||||||||||||
| As reported |
As revised | As reported |
As revised | As reported |
As revised | |||||||||||||||||||
| Other Comprehensive Income (Loss) |
$ | (57 | ) | $ | 25 | $ | (63 | ) | $ | 19 | $ | (110 | ) | $ | (35 | ) | ||||||||
| Comprehensive Income (Loss) |
(397 | ) | (315 | ) | (400 | ) | (318 | ) | (436 | ) | (361 | ) | ||||||||||||
| Comprehensive Income (Loss) attributable to SunGard |
(447 | ) | (365 | ) | (490 | ) | (408 | ) | (568 | ) | (493 | ) | ||||||||||||
19. Supplemental Cash Flow Information:
Supplemental cash flow information for 2012, 2013 and 2014 follows (in millions):
| Year ended December 31, | ||||||||||||
| 2012 | 2013 | 2014 | ||||||||||
| Supplemental information: |
||||||||||||
| Acquired businesses: |
||||||||||||
| Property and equipment |
$ | — | $ | — | $ | — | ||||||
| Software products |
12 | 1 | 3 | |||||||||
| Customer base |
12 | — | 1 | |||||||||
| Goodwill |
28 | 1 | — | |||||||||
| Other assets |
1 | — | — | |||||||||
| Deferred income taxes |
(3 | ) | — | — | ||||||||
| Purchase price obligations and debt assumed |
1 | — | — | |||||||||
| Net current assets (liabilities) assumed |
(11 | ) | — | — | ||||||||
|
|
|
|
|
|
|
|||||||
| Cash paid for acquired businesses, net of cash acquired of $2 million and $— million and $— million, respectively |
$ | 40 | $ | 2 | $ | 4 | ||||||
|
|
|
|
|
|
|
|||||||
20. SunGard’s Holding Company Status
On a standalone basis, SunGard has no material assets or operations other than its ownership in SunGard Capital Corp II and its subsidiaries. Due to the agreements governing the Company’s indebtedness, there are restrictions on SunGard’s ability to obtain funds from any of its subsidiaries through dividends, loans or advances. Substantially all of the revenues, operating cash flows, and net assets of the Company as reported in the Company’s consolidated financial statements exist at the subsidiary level and are subject to these restrictions.
F-51
Table of Contents
Condensed Consolidated Balance Sheets
(In millions except share and per-share amounts)
(Unaudited)
| December 31, 2014 |
March 31, 2015 |
Pro forma March 31, 2015 (Note 1) |
||||||||||
| Assets |
||||||||||||
| Current: |
||||||||||||
| Cash and cash equivalents |
$ | 447 | $ | 555 | $ | — | ||||||
| Trade receivables, less allowance for doubtful accounts of $22 and $20 |
572 | 449 | — | |||||||||
| Earned but unbilled receivables |
114 | 110 | — | |||||||||
| Prepaid expenses and other current assets |
116 | 105 | — | |||||||||
|
|
|
|
|
|
|
|||||||
| Total current assets |
1,249 | 1,219 | ||||||||||
| Property and equipment, less accumulated depreciation of $414 and $420 |
152 | 147 | — | |||||||||
| Software products, less accumulated amortization of $1,754 and $1,760 |
224 | 220 | — | |||||||||
| Customer base, less accumulated amortization of $531 and $539 |
360 | 346 | — | |||||||||
| Other assets, less accumulated amortization of $22 and $23 |
94 | 74 | — | |||||||||
| Trade name |
672 | 672 | — | |||||||||
| Goodwill |
3,760 | 3,711 | — | |||||||||
|
|
|
|
|
|
|
|||||||
| Total Assets |
$ | 6,511 | $ | 6,389 | $ | — | ||||||
|
|
|
|
|
|
|
|||||||
| Liabilities and Equity |
||||||||||||
| Current: |
||||||||||||
| Short-term and current portion of long-term debt |
$ | — | $ | 1 | $ | — | ||||||
| Accounts payable |
21 | 10 | — | |||||||||
| Accrued compensation and benefits |
227 | 143 | — | |||||||||
| Accrued interest expense |
30 | 68 | — | |||||||||
| Other accrued expenses |
131 | 132 | — | |||||||||
| Deferred revenue |
589 | 569 | — | |||||||||
|
|
|
|
|
|
|
|||||||
| Total current liabilities |
998 | 923 | — | |||||||||
| Long-term debt |
4,669 | 4,669 | — | |||||||||
| Deferred and other income taxes |
616 | 607 | — | |||||||||
| Other long-term liabilities |
39 | 37 | — | |||||||||
|
|
|
|
|
|
|
|||||||
| Total liabilities |
6,322 | 6,236 | — | |||||||||
|
|
|
|
|
|
|
|||||||
| Commitments and contingencies |
||||||||||||
| Non-controlling interest in preferred stock of a subsidiary subject to a put option |
37 | 37 | — | |||||||||
| Class L common stock subject to a put option |
57 | 56 | — | |||||||||
| Class A common stock subject to a put option |
3 | 3 | — | |||||||||
| Stockholders’ equity: |
||||||||||||
| Class L common stock, convertible, par value $.001 per share; cumulative 13.5% per annum, compounded quarterly; aggregate liquidation preference of $8,064 million and $8,337 million; 50,000,000 shares authorized, 29,062,421 shares issued; none pro forma |
— | — | — | |||||||||
| Class A common stock, par value $.001 per share; 550,000,000 shares authorized, 261,565,118 shares issued; none pro forma |
— | — | — | |||||||||
| Capital in excess of par value |
2,674 | 2,681 | — | |||||||||
| Treasury stock, 442,460 and 418,438 shares of Class L common stock; and 3,985,453 and 3,769,251 shares of Class A common stock; none pro forma |
(38 | ) | (36 | ) | — | |||||||
| Common stock, par value $.01 per share; 1,000,000,000 shares authorized, none issued, XXX shares issued pro forma |
— | — | ||||||||||
| Accumulated deficit |
(3,902 | ) | (3,917 | ) | — | |||||||
| Accumulated other comprehensive income (loss) |
(132 | ) | (203 | ) | — | |||||||
|
|
|
|
|
|
|
|||||||
| Total SunGard stockholders’ equity (deficit) |
(1,398 | ) | (1,475 | ) | — | |||||||
| Non-controlling interest in preferred stock of a subsidiary |
1,490 | 1,532 | — | |||||||||
|
|
|
|
|
|
|
|||||||
| Total equity |
92 | 57 | — | |||||||||
|
|
|
|
|
|
|
|||||||
| Total Liabilities and Equity |
$ | 6,511 | $ | 6,389 | $ | — | ||||||
|
|
|
|
|
|
|
|||||||
The accompanying notes are an integral part of these condensed consolidated financial statements.
F-52
Table of Contents
Condensed Consolidated Statements of Income (Loss)
(In millions, except per share amounts)
(Unaudited)
| (Unaudited) | Three Months Ended March 31, | |||||||
| 2014 | 2015 | |||||||
| Revenue |
$ | 653 | $ | 671 | ||||
| Costs and expenses: |
||||||||
| Cost of sales and direct operating (excluding items described in Note 1) |
269 | 268 | ||||||
| Sales, marketing and administration |
168 | 152 | ||||||
| Product development and maintenance |
99 | 86 | ||||||
| Depreciation |
24 | 29 | ||||||
| Amortization of acquisition-related intangible assets |
43 | 21 | ||||||
| Trade name impairment charge |
339 | — | ||||||
|
|
|
|
|
|||||
| Total costs and expenses |
942 | 556 | ||||||
|
|
|
|
|
|||||
| Operating income (loss) |
(289 | ) | 115 | |||||
| Other income (expense): |
||||||||
| Interest expense and amortization of deferred financing fees |
(74 | ) | (71 | ) | ||||
| Loss on extinguishment of debt |
(61 | ) | — | |||||
|
|
|
|
|
|||||
| Other income (expense) |
(135 | ) | (71 | ) | ||||
|
|
|
|
|
|||||
| Income (loss) from continuing operations before income taxes |
(424 | ) | 44 | |||||
| Benefit from (provision for) income taxes |
101 | (18 | ) | |||||
|
|
|
|
|
|||||
| Income (loss) from continuing operations |
(323 | ) | 26 | |||||
| Income (loss) from discontinued operations, net of tax |
(17 | ) | 2 | |||||
|
|
|
|
|
|||||
| Net income (loss) |
(340 | ) | 28 | |||||
| Income attributable to the non-controlling interest |
(50 | ) | (43 | ) | ||||
|
|
|
|
|
|||||
| Net loss attributable to SunGard |
$ | (390 | ) | $ | (15 | ) | ||
|
|
|
|
|
|||||
| Basic earnings (loss) per share: |
||||||||
| Allocation of net income (loss) to common stockholders – Basic: |
||||||||
| Class L stockholders |
$ | 236 | $ | 270 | ||||
| Class A stockholders – continuing operations |
(610 | ) | (288 | ) | ||||
| Class A stockholders – total |
(627 | ) | (286 | ) | ||||
| Net income (loss) per share – Basic: |
||||||||
| Class L stockholders |
$ | 8.14 | $ | 9.29 | ||||
| Class A stockholders – continuing operations |
(2.34 | ) | (1.10 | ) | ||||
| Class A stockholders – total |
(2.40 | ) | (1.09 | ) | ||||
| Weighted average number of shares – Basic: |
||||||||
| Class L stockholders |
29 | 29 | ||||||
| Class A stockholders |
261 | 262 | ||||||
| Diluted earnings (loss) per share: |
||||||||
| Allocation of net income (loss) to common stockholders – Diluted: |
||||||||
| Class L stockholders |
$ | 240 | $ | 275 | ||||
| Class A stockholders – continuing operations |
(610 | ) | (294 | ) | ||||
| Class A stockholders – total |
(627 | ) | (292 | ) | ||||
| Net income (loss) per share – Diluted: |
||||||||
| Class L stockholders |
$ | 8.14 | $ | 9.29 | ||||
| Class A stockholders – continuing operations |
(2.34 | ) | (1.10 | ) | ||||
| Class A stockholders – total |
(2.40 | ) | (1.09 | ) | ||||
| Weighted average number of shares – Diluted: |
||||||||
| Class L stockholders |
29 | 30 | ||||||
| Class A stockholders |
261 | 267 | ||||||
| Unaudited pro forma earnings per share from continuing operations (Note 9): |
||||||||
| Basic |
— | |||||||
| Diluted |
— | |||||||
The accompanying notes are an integral part of these condensed consolidated financial statements.
F-53
Table of Contents
Condensed Consolidated Statements of Comprehensive Income (Loss)
(In millions)
(unaudited)
| Three Months Ended March 31, | ||||||||
| 2014 | 2015 | |||||||
| Net income (loss) |
$ | (340 | ) | $ | 28 | |||
| Other comprehensive income (loss): |
||||||||
| Foreign currency translation, net |
22 | (67 | ) | |||||
| Unrealized gain (loss) on derivative instruments, net of tax |
3 | (4 | ) | |||||
|
|
|
|
|
|||||
| Other comprehensive income (loss), net of tax |
25 | (71 | ) | |||||
|
|
|
|
|
|||||
| Comprehensive loss |
(315 | ) | (43 | ) | ||||
| Comprehensive income attributable to the non-controlling interest |
(50 | ) | (43 | ) | ||||
|
|
|
|
|
|||||
| Comprehensive loss attributable to SunGard |
$ | (365 | ) | $ | (86 | ) | ||
|
|
|
|
|
|||||
The accompanying notes are an integral part of these condensed consolidated financial statements.
F-54
Table of Contents
Condensed Consolidated Statements of Cash Flows
(In millions)
(Unaudited)
| Three Months Ended March 31, | ||||||||
| 2014 | 2015 | |||||||
| Cash flow from operations: |
||||||||
| Net income (loss) |
$ | (340 | ) | $ | 28 | |||
| Income (loss) from discontinued operations |
(17 | ) | 2 | |||||
|
|
|
|
|
|||||
| Income (loss) from continuing operations |
(323 | ) | 26 | |||||
| Reconciliation of income (loss) from continuing operations to cash flow from (used in) operations: |
||||||||
| Depreciation and amortization |
67 | 50 | ||||||
| Trade name impairment charge |
339 | — | ||||||
| Deferred income tax provision (benefit) |
(83 | ) | (6 | ) | ||||
| Stock compensation expense |
9 | 10 | ||||||
| Amortization of deferred financing costs and debt discount |
7 | 4 | ||||||
| Loss on extinguishment of debt |
61 | — | ||||||
| Changes in working capital: |
||||||||
| Accounts receivable and other current assets |
101 | 125 | ||||||
| Accounts payable and accrued expenses |
(111 | ) | (104 | ) | ||||
| Accrued interest |
34 | 39 | ||||||
| Accrued income taxes |
(17 | ) | 23 | |||||
| Deferred revenue |
2 | (13 | ) | |||||
|
|
|
|
|
|||||
| Cash flow from (used in) continuing operations |
86 | 154 | ||||||
| Cash flow from (used in) discontinued operations |
36 | — | ||||||
|
|
|
|
|
|||||
| Cash flow from (used in) operations |
122 | 154 | ||||||
|
|
|
|
|
|||||
| Investment activities: |
||||||||
| Cash paid for acquired businesses, net of cash acquired |
— | (4 | ) | |||||
| Addition to property and equipment, and software |
(15 | ) | (13 | ) | ||||
| Additions to capitalized software |
(13 | ) | (15 | ) | ||||
|
|
|
|
|
|||||
| Cash provided by (used in) continuing operations |
(28 | ) | (32 | ) | ||||
| Cash provided by (used in) discontinued operations |
5 | 1 | ||||||
|
|
|
|
|
|||||
| Cash provided by (used in) investment activities |
(23 | ) | (31 | ) | ||||
|
|
|
|
|
|||||
| Financing activities: |
||||||||
| Cash received from borrowings, net of fees |
(6 | ) | — | |||||
| Cash used to repay debt |
(1,324 | ) | — | |||||
| Cash used to purchase treasury stock |
(4 | ) | (1 | ) | ||||
| Other financing activities |
(4 | ) | (3 | ) | ||||
|
|
|
|
|
|||||
| Cash provided by (used in) continuing operations |
(1,338 | ) | (4 | ) | ||||
| Cash provided by (used in) discontinued operations |
887 | — | ||||||
|
|
|
|
|
|||||
| Cash provided by (used in) financing activities |
(451 | ) | (4 | ) | ||||
|
|
|
|
|
|||||
| Effect of exchange rate changes on cash |
1 | (11 | ) | |||||
|
|
|
|
|
|||||
| Increase (decrease) in cash and cash equivalents |
(351 | ) | 108 | |||||
| Beginning cash and cash equivalents, including cash of discontinued operations: 2014, $31; 2015, $— |
706 | 447 | ||||||
|
|
|
|
|
|||||
| Ending cash and cash equivalents |
$ | 355 | $ | 555 | ||||
|
|
|
|
|
|||||
| Supplemental information: |
||||||||
| Interest paid |
$ | 58 | $ | 28 | ||||
|
|
|
|
|
|||||
| Income taxes paid, net of refunds of $12 million and $12 million, respectively |
$ | 4 | $ | 1 | ||||
|
|
|
|
|
|||||
| Non-cash financing activities: |
||||||||
| Distribution of net assets of SpinCo (See Note 1) |
$ | 223 | $ | — | ||||
|
|
|
|
|
|||||
| Receipt of SpinCo Notes in connection with the AS Split-Off (See Note 1) |
$ | 425 | $ | — | ||||
|
|
|
|
|
|||||
| Exchange of SpinCo Notes for SunGard Notes |
$ | 389 | $ | — | ||||
|
|
|
|
|
|||||
The accompanying notes are an integral part of these condensed consolidated financial statements.
F-55
Table of Contents
NOTES TO CONDENSED CONSOLIDATED FINANCIAL STATEMENTS (UNAUDITED)
1. Basis of Presentation:
SunGard (the “Company”), which was formerly named SunGard Capital Corp., is one of the world’s leading software and technology services companies and has two reportable segments: Financial Systems (“FS”) and Public Sector & Education (“PS&E”). The condensed consolidated financial statements include the accounts of the Company and its majority-owned subsidiaries. All significant intercompany transactions and accounts have been eliminated.
SunGard Data Systems Inc., a wholly owned subsidiary of SunGard, (“SDS”) was acquired on August 11, 2005 in a leveraged buy-out (the “LBO”) by a consortium of private equity investment funds associated with Bain Capital Partners, The Blackstone Group, Goldman, Sachs & Co., Kohlberg Kravis Roberts & Co., Providence Equity Partners, Silver Lake and TPG (collectively, the “Sponsors”). SunGard and certain other holding companies have no other operations beyond those of their ownership of SunGard Data Systems Inc.
On March 31, 2014, SunGard completed the split-off of its Availability Services (“AS”) business to its existing stockholders, including its private equity owners, on a tax-free and pro-rata basis. As part of that transaction, the assets and liabilities of the AS business were contributed to a new subsidiary, and then SunGard transferred all of its ownership interests in that subsidiary to Sungard Availability Services Capital, Inc. (“SpinCo”) in exchange for common stock of SpinCo, approximately $425 million of SpinCo senior notes (“SpinCo Notes”), and $1,005 million of net cash proceeds from the issuance of an AS term loan facility (“SpinCo Term Loan”). Immediately after these transactions, SunGard distributed the common stock of SpinCo through SunGard’s ownership chain ultimately to SunGard Capital Corp. II (SCCII), a subsidiary of SunGard, and then all stockholders of preferred stock of SCCII exchanged a portion of their shares of preferred stock for all of the shares of common stock of SpinCo on a pro-rata basis (together, with the transactions described above, the “AS Split-Off”).
The AS business, which was split-off on March 31, 2014, and two small FS businesses, which were sold on January 31, 2014, have been included in our financial results as discontinued operations for all periods presented.
The accompanying interim condensed consolidated financial statements of the Company have been prepared in conformity with accounting principles generally accepted in the United States of America (“GAAP”), consistent in all material respects with those applied in the Company’s Annual Report on Form 10-K for the year ended December 31, 2014. Interim financial reporting does not include all of the information and footnotes required by GAAP for annual financial statements. The interim financial information is unaudited, but, in the opinion of management, includes all adjustments, consisting only of normal recurring adjustments necessary to provide a fair statement of results for the interim periods presented. Operating results for the interim periods presented are not necessarily indicative of the results that may be expected for the year ending December 31, 2015.
The Condensed Consolidated Statement of Income (Loss) for the three months ended March 31, 2014 has been revised to present stock compensation expense and developer time spent on customer billable professional services projects in the correct functional expense categories. Refer to Note 2 for additional details.
All of the previously-issued interim financial statements included in Quarterly Reports on Form 10-Q for 2014 included an error in the Condensed Consolidated Statements of Comprehensive Income (Loss) related to the removal of the cumulative foreign currency translation loss associated with the AS businesses that were split-off on March 31, 2014. The removal of the cumulative foreign currency translation loss was reflected in both the Condensed Consolidated Statements of Comprehensive Income (Loss) and the rollforwards of stockholders’ equity included in the notes to the condensed consolidated financial statements in each of the Quarterly Reports.
F-56
Table of Contents
However, the inclusion of this item in the 2014 Condensed Consolidated Statements of Comprehensive Income (Loss) was not appropriate since it relates to the distribution of the AS businesses to the Company’s owners and should have been excluded from the 2014 Other Comprehensive Income according to GAAP. Management does not believe the error is material to any of the previously-issued financial statements. The table below shows the impact of the correction of this error for the three months ended March 31, 2014. The following table presents the amounts as originally reported and as revised (in millions):
| Three Months Ended March 31, 2014 | ||||||||
| As Reported | As Revised | |||||||
| Other Comprehensive Income (loss) |
$ | (57 | ) | $ | 25 | |||
| Comprehensive Income (Loss) |
(397 | ) | (315 | ) | ||||
| Comprehensive Income (Loss) attributable to SunGard |
(447 | ) | (365 | ) | ||||
Unaudited Pro Forma Consolidated Balance Sheet
Prior to the consummation of the initial public offering of common stock being contemplated by the Company, SunGard will fully and unconditionally guarantee the dividend and liquidation payment obligations of SunGard Capital Corp. II’s (SCCII) preferred stock. Thereafter, and at or prior to the consummation of this offering, the Company will recapitalize its Class A common stock and its Class L common stock into a new, single class of common stock, which is the same class of common stock included in the initial public offering. The existing shares of SunGard Class A common stock will be cancelled, and the SunGard Class L common stock will be converted into a number of shares of common stock based on a specified conversion factor. In addition, all outstanding shares of SunGard Capital Corp. II preferred stock will be exchanged for shares of SunGard common stock.
The unaudited pro forma consolidated balance sheet as of March 31, 2015 has been prepared assuming the cancelation of SunGard Class A common stock, the conversion of Sungard Class L common stock into common stock, and the exchange of SCCII preferred stock for shares of common stock. The pro forma adjustments also give effect to the reclassification of SunGard Class A common stock, SunGard Class L common stock, and the SCCII preferred stock presented as a non-controlling interest in SunGard’s consolidated balance sheet; which are all subject to a put option, from temporary equity to permanent equity.
Cost of Sales and Direct Operating Expenses
Cost of sales and direct operating expenses represents the cost of providing the Company’s software and services offerings to customers and excludes depreciation, amortization and the cost of maintenance.
Recent Accounting Pronouncements
Recently Adopted
In April 2014, the Financial Accounting Standards Board (“FASB”) issued Auditing Standards Update (“ASU”) 2014-08, “Reporting Discontinued Operations and Disclosures of Disposals of Components of an Entity” that changes the criteria for reporting a discontinued operation. According to the new guidance, only disposals of a component that represents a strategic shift that has (or will have) a major effect on an entity’s operations and financial results is a discontinued operation. The new guidance also requires expanded disclosures about discontinued operations and disposals of a significant part of an entity that does not qualify for discontinued operations reporting. ASU 2014-08 was effective beginning January 1, 2015, but only for disposals (or classifications as held for sale) that have not been reported in previously-issued financial statements. ASU 2014-08 will affect how the Company identifies and presents discontinued operations in the consolidated financial statements.
F-57
Table of Contents
Recently Issued
In May 2014, the FASB issued ASU 2014-09, “Revenue from Contracts with Customers,” which outlines a comprehensive revenue recognition model and supersedes most current revenue recognition guidance. This new guidance establishes a five step process that companies must use in order to recognize revenue properly. Those five steps are: (i) identifying contract(s) with a customer, (ii) identifying the performance obligations in the contract, (iii) determining the transaction price, (iv) allocating the transaction price to the performance obligations in the contract, and (v) recognizing revenue when (or as) the entity satisfies a performance obligation. The new ASU will affect any entity that either enters into contracts with customers to transfer goods or services or enters into contracts for the transfer of nonfinancial assets unless those contracts are within the scope of other standards. ASU 2014-09 was to be effective for the Company starting in the first quarter of fiscal 2017. However, in April 2015, the FASB proposed a deferral of the effective date of the new revenue standard by one year, but to permit entities to adopt one year earlier if they choose (i.e., the original effective date). ASU 2014-09 allows for two methods of adoption: (a) “full retrospective” adoption, meaning the standard is applied to all periods presented, or (b) “modified retrospective” adoption, meaning the cumulative effect of applying ASU 2014-09 is recognized as an adjustment to the opening retained earnings balance. The Company is in the process of determining the adoption method as well as the effects the adoption of ASU 2014-09 will have on its consolidated financial statements.
In April 2015, the FASB issued ASU 2015-03, “Simplifying the Presentation of Debt Issuance Costs,” in conjunction with their initiative to reduce complexity in accounting standards. This new guidance requires that debt issuance costs related to a recognized debt liability be presented in the balance sheet as a direct deduction from the carrying amount of that debt liability, consistent with presentation of a debt discount. The new standard is limited to the presentation of debt issuance costs and will not affect the recognition and measurement of debt issuance costs. ASU 2015-03 will be effective for the Company for the annual period beginning after December 15, 2015 and interim periods beginning after December 15, 2016, with early adoption permitted. The adoption of ASU 2015-03 is not expected to have a material impact on the Company’s consolidated financial statements.
In April 2015, the FASB issued ASU 2015-05, “Customer’s Accounting for Fees Paid in a cloud Computing Arrangement.” Under the new standard, customers will apply the same criteria as vendors to determine whether a cloud computing arrangement contains a software license or is solely a service contract. For public companies, the new standard is effective for annual periods, including interim periods, beginning after December 15, 2015. For non-public companies, it is effective for annual periods beginning after December 15, 2015, and interim periods in annual periods beginning after December 15, 2016. The adoption of ASU 2015-05 is not expected to have a material impact on the Company’s consolidated financial statements.
2. Expense Classification:
Effective December 31, 2014, within the Condensed Consolidated Statements of Income (Loss), the Company revised its presentation of stock compensation expense. Formerly, the Company presented this expense entirely within sales, marketing and administration expense. The Company’s revised presentation allocates these costs to the appropriate functional areas. Further, the Company has revised its presentation of the costs for developer time spent on customer billable professional services projects. Formerly, the Company presented this expense within product development and maintenance expense. The Company’s revised presentation records these amounts to cost of sales and direct operating expense. There was no impact on total reported costs and expenses for any period as a result of the changes. Management does not believe these revisions are material to the previously issued financial statements.
F-58
Table of Contents
The impact of these items within the functional areas for the three months ended March 31, 2014 is as follows (in millions):
| Three Months Ended March 31, 2014 | ||||||||||||||||
| As reported | Revised presentation of stock compensation expense |
Revised presentation of developer time spent on professional services projects |
As presented in the statement of income (loss) |
|||||||||||||
| Cost of sales and direct operating (See Note 1) |
$ | 263 | $ | 1 | $ | 5 | $ | 269 | ||||||||
| Sales, marketing and administration |
170 | (2 | ) | — | 168 | |||||||||||
| Product development and maintenance |
103 | 1 | (5 | ) | 99 | |||||||||||
|
|
|
|
|
|
|
|
|
|||||||||
| Total functional expenses |
$ | 536 | $ | — | $ | — | $ | 536 | ||||||||
|
|
|
|
|
|
|
|
|
|||||||||
3. Discontinued Operations:
On January 31, 2014, the Company completed the sale of two small businesses within the FS segment in exchange for €27 million paid at closing, €9 million to be paid no later than March 2016 (“deferred purchase price”) and €2 million to be paid upon the successful assignment of certain customer contracts. The deferred purchase price is unconditional and is secured by a bank guarantee. During the first quarter of 2015, the Company successfully assigned certain of these customer contracts and recognized a $2 million gain in discontinued operations. Also included in discontinued operations are the results of our former AS business as a result of the AS Split-Off (see Note 1), which was completed on March 31, 2014. These businesses have been included in our financial results as discontinued operations for all periods presented.
The results for discontinued operations for the three months ended March 31, 2014 and 2015 were as follows (in millions):
| Three Months Ended March 31, | ||||||||
| 2014 | 2015 | |||||||
| Revenue |
$ | 338 | $ | — | ||||
|
|
|
|
|
|||||
| Operating income (loss) |
(26 | ) | — | |||||
| Interest expense |
(18 | ) | — | |||||
| Gain on sale of business |
23 | 2 | ||||||
|
|
|
|
|
|||||
| Income (loss) before income taxes |
(21 | ) | 2 | |||||
| Benefit from income taxes |
4 | — | ||||||
|
|
|
|
|
|||||
| Income (loss) from discontinued operations |
$ | (17 | ) | $ | 2 | |||
|
|
|
|
|
|||||
4. Intangible Assets and Goodwill:
Goodwill
The following table summarizes the changes in goodwill, by segment, for the three months ended March 31, 2015 (in millions):
| Cost | Accumulated impairment |
|||||||||||||||||||
| FS | PS&E | Subtotal | PS&E | Total | ||||||||||||||||
| Balance at December 31, 2014 |
$ | 3,433 | $ | 544 | $ | 3,977 | $ | (217 | ) | $ | 3,760 | |||||||||
| 2015 acquisitions |
2 | — | 2 | — | 2 | |||||||||||||||
| Effect of foreign currency translation |
(50 | ) | — | (50 | ) | — | (50 | ) | ||||||||||||
| Other |
(1 | ) | — | (1 | ) | — | (1 | ) | ||||||||||||
|
|
|
|
|
|
|
|
|
|
|
|||||||||||
| Balance at March 31, 2015 |
$ | 3,384 | $ | 544 | $ | 3,928 | $ | (217 | ) | $ | 3,711 | |||||||||
|
|
|
|
|
|
|
|
|
|
|
|||||||||||
F-59
Table of Contents
A portion of the Company’s goodwill is denominated in currencies other than the U.S. Dollar.
Intangible Asset amortization
The total expected amortization of acquisition-related intangible assets for years ended December 31 is as follows (in millions):
| 2015 |
$ | 84 | ||
| 2016 |
68 | |||
| 2017 |
60 | |||
| 2018 |
55 | |||
| 2019 |
48 |
5. Accumulated Other Comprehensive Income:
The following table provides a rollforward of the components of accumulated other comprehensive loss, net of tax, for the three months ended March 31, 2015 (in millions):
| Gains and Losses on Cash Flow Hedges |
Currency Translation |
Other | Accumulated Other Comprehensive Income (Loss) |
|||||||||||||
| Balance at December 31, 2014 |
$ | (1 | ) | $ | (125 | ) | $ | (6 | ) | $ | (132 | ) | ||||
|
|
|
|
|
|
|
|
|
|||||||||
| Other comprehensive loss before reclassifications |
(9 | ) | (67 | ) | — | (76 | ) | |||||||||
| Amounts reclassified from accumulated other comprehensive income, net of tax |
5 | — | — | 5 | ||||||||||||
|
|
|
|
|
|
|
|
|
|||||||||
| Net current-period other comprehensive loss |
(4 | ) | (67 | ) | — | (71 | ) | |||||||||
|
|
|
|
|
|
|
|
|
|||||||||
| Balance at March 31, 2015 |
$ | (5 | ) | $ | (192 | ) | $ | (6 | ) | $ | (203 | ) | ||||
|
|
|
|
|
|
|
|
|
|||||||||
The following table summarizes the unrealized gains (losses) on derivative instruments, including the impact of components reclassified into net income from accumulated other comprehensive income, for the three months ended March 31, 2014 and 2015 (in millions):
| Three months end March 31, | Affected Line Item in the | |||||||||
| Other Comprehensive Income (Loss) Components |
2014 | 2015 | ||||||||
| Unrealized gain (loss) on derivative instruments |
$ | 2 | $ | (9 | ) | |||||
|
|
|
|
|
|||||||
| Loss (gain) on derivatives reclassified into income: |
||||||||||
| Interest rate contracts |
2 | 2 | Interest expense and amortization of deferred financing fees | |||||||
| Forward currency hedges |
(1 | ) | 1 | Cost of sales and direct operating | ||||||
|
|
|
|
|
|||||||
| Total reclassified into income |
1 | 3 | ||||||||
| Income tax benefit |
— | 2 | ||||||||
|
|
|
|
|
|||||||
| Amounts reclassified from accumulated other comprehensive income, net of tax |
1 | 5 | ||||||||
|
|
|
|
|
|||||||
| Unrealized gain (loss) on derivative instruments, net of tax |
$ | 3 | $ | (4 | ) | |||||
|
|
|
|
|
|||||||
F-60
Table of Contents
6. Debt and Derivatives:
On March 31, 2015, the Company had $593 million of available borrowing capacity and $7 million of outstanding letters of credit under its $600 million revolving credit facility. In addition, there were $4 million of letters of credit outstanding at March 31, 2015 that did not impact availability under the revolving credit facilities.
SunGard’s ability to make dividend payments to its equity holders is governed by the covenants in its debt agreements. Without obtaining an amendment to those documents, SunGard’s covenants currently limit such a dividend to a total of $200 million.
Debt consisted of the following (in millions):
| December 31, 2014 |
March 31, 2015 |
|||||||
| Senior Secured Credit Facilities: |
||||||||
| Secured revolving credit facility due March 8, 2018 |
$ | — | $ | — | ||||
| Tranche C due February 28, 2017, effective interest rate of 4.44% and 4.44% |
400 | 400 | ||||||
| Tranche E due March 8, 2020, effective interest rate of 4.31% and 4.31% |
1,918 | 1,918 | ||||||
|
|
|
|
|
|||||
| Total Senior Secured Credit Facilities |
2,318 | 2,318 | ||||||
| Senior Notes due 2018 at 7.375% |
511 | 511 | ||||||
| Senior Notes due 2020 at 7.625% |
700 | 700 | ||||||
| Senior Subordinated Notes due 2019 at 6.625% |
1,000 | 1,000 | ||||||
| Secured Accounts Receivable Facility, at 3.16% and 3.18% |
140 | 140 | ||||||
| Other |
— | 1 | ||||||
|
|
|
|
|
|||||
| Total debt |
$ | 4,669 | $ | 4,670 | ||||
|
|
|
|
|
|||||
| Short-term borrowings and current portion of long-term debt |
$ | — | $ | 1 | ||||
| Long-term debt |
4,669 | 4,669 | ||||||
|
|
|
|
|
|||||
| Total debt |
$ | 4,669 | $ | 4,670 | ||||
|
|
|
|
|
|||||
Future Maturities
At March 31, 2015, the contractual future maturities of debt are as follows (in millions):
| Contractual Maturities | ||||
| 2015 |
$ | 1 | ||
| 2016 |
— | |||
| 2017 |
400 | |||
| 2018 |
511 | |||
| 2019 |
1,140 | |||
| Thereafter |
2,618 | |||
|
|
|
|||
| Total debt |
$ | 4,670 | ||
|
|
|
|||
SunGard uses interest rate swaps to manage the amount of its floating rate debt in order to reduce its exposure to variable rate interest payments associated with the Amended and Restated Credit Agreement (“Credit Agreement”). Each swap agreement is designated as a cash flow hedge. SunGard pays a stream of fixed interest payments for the term of the swap, and in turn, receives variable interest payments based on LIBOR. At March 31, 2015, one-month and three-month LIBOR were 0.18% and 0.27%, respectively. The net receipt or payment from the interest rate swap agreements is included in the Condensed Consolidated Statements of Income (Loss) as interest expense. The interest rates in the components of the debt table above reflect the impact of the swaps.
F-61
Table of Contents
A summary of the Company’s interest rate swaps at March 31, 2015 follows (in millions):
| Inception |
Maturity | Notional amount (in millions) |
Weighted- average Interest rate paid |
Interest rate received (LIBOR) |
||||||||||
| August-September 2012 |
February 2017 | $ | 400 | 0.69 | % | 1-Month | ||||||||
| June 2013 |
June 2019 | 100 | 1.86 | % | 3-Month | |||||||||
| September 2013 |
June 2019 | 100 | 2.26 | % | 3-Month | |||||||||
| February-March 2014 |
March 2020 | 300 | 2.27 | % | 3-Month | |||||||||
|
|
|
|||||||||||||
| Total / Weighted-Average Interest Rate |
$ | 900 | 1.52 | % | ||||||||||
|
|
|
|||||||||||||
The fair values of the swap agreements at December 31, 2014 were $1 million and $5 million and were included in other assets and other accrued expenses, respectively. The fair value of the swap agreements at March 31, 2015 is $10 million and is included in other accrued expenses.
The Company has no ineffectiveness related to its swap agreements. During the next twelve months, the Company expects to reclassify approximately $8 million from accumulated other comprehensive income (loss) into earnings related to the Company’s interest rate swaps based on the borrowing rates at March 31, 2015.
7. Fair Value Measurements:
Accounting guidance defines fair value as the price that would be received to sell an asset or paid to transfer a liability in an orderly transaction between market participants at the measurement date. Under this guidance, the Company is required to classify certain assets and liabilities based on the following fair value hierarchy:
| • | Level 1 – Quoted prices (unadjusted) in active markets for identical assets or liabilities that can be accessed at the measurement date; |
| • | Level 2 – Inputs other than quoted prices included within Level 1 that are observable for the asset or liability, either directly or indirectly; and |
| • | Level 3 – Unobservable inputs for the asset or liability. |
The following table summarizes assets and liabilities measured at fair value on a recurring basis at March 31, 2015 (in millions):
| Fair Value Measures Using | ||||||||||||||||||
| Balance Sheet Caption | Level 1 | Level 2 | Level 3 | Total | ||||||||||||||
| Assets |
||||||||||||||||||
| Money market funds |
Cash and cash equivalents | $ | 60 | $ | — | $ | — | $ | 60 | |||||||||
| Currency forward contracts |
Prepaid expenses and other current assets |
— | 3 | — | 3 | |||||||||||||
|
|
|
|
|
|
|
|
|
|||||||||||
| Total |
$ | 60 | $ | 3 | $ | — | $ | 63 | ||||||||||
|
|
|
|
|
|
|
|
|
|||||||||||
| Liabilities |
||||||||||||||||||
| Interest rate swap agreements |
Other accrued expenses | $ | — | $ | 10 | $ | — | $ | 10 | |||||||||
| Currency forward contracts |
Other accrued expenses | — | 2 | — | 2 | |||||||||||||
|
|
|
|
|
|
|
|
|
|||||||||||
| Total |
$ | — | $ | 12 | $ | — | $ | 12 | ||||||||||
|
|
|
|
|
|
|
|
|
|||||||||||
F-62
Table of Contents
The following table summarizes assets and liabilities measured at fair value on a recurring basis at December 31, 2014 (in millions):
| Fair Value Measures Using | ||||||||||||||||||
| Balance Sheet Caption | Level 1 | Level 2 | Level 3 | Total | ||||||||||||||
| Assets |
||||||||||||||||||
| Money market funds |
Cash and cash equivalents | $ | 106 | $ | — | $ | — | $ | 106 | |||||||||
| Interest rate swap agreements |
Other assets | — | 1 | — | 1 | |||||||||||||
| Currency forward contracts |
Prepaid expenses and other current assets |
— | 3 | — | 3 | |||||||||||||
|
|
|
|
|
|
|
|
|
|||||||||||
| Total |
$ | 106 | $ | 4 | $ | — | $ | 110 | ||||||||||
|
|
|
|
|
|
|
|
|
|||||||||||
| Liabilities |
||||||||||||||||||
| Interest rate swap agreements |
Other accrued expenses | $ | — | $ | 5 | $ | — | $ | 5 | |||||||||
| Currency forward contracts |
Other accrued expenses | — | 1 | — | 1 | |||||||||||||
|
|
|
|
|
|
|
|
|
|||||||||||
| Total |
$ | — | $ | 6 | $ | — | $ | 6 | ||||||||||
|
|
|
|
|
|
|
|
|
|||||||||||
Money market funds are recognized and measured at fair value in the Company’s financial statements. Fair values of the interest rate swap agreements are calculated using a discounted cash flow model using observable applicable market swap rates and assumptions and are compared to market valuations obtained from brokers.
The Company uses currency forward contracts to manage its exposure to fluctuations in costs caused by variations in Indian Rupee (“INR”) exchange rates. These INR forward contracts are designated as cash flow hedges. The fair value of these currency forward contracts is determined using currency exchange market rates, obtained from reliable, independent, third-party banks, at the balance sheet date. The fair value of forward contracts is subject to changes in currency exchange rates. The Company has no ineffectiveness related to its use of currency forward contracts in connection with INR cash flow hedges. The Company expects to reclassify in the next twelve months approximately $3 million from other comprehensive income (loss) into earnings related to the Company’s INR forward contracts.
The fair value of the trade name is categorized as Level 3, a non-recurring fair value measurement using significant unobservable inputs, and is estimated by discounted cash flows based on projected future revenues. This requires the use of various assumptions including projections of future cash flows, perpetual growth rates and discount rates. During the three months ended March 31, 2014, the Company recorded a $339 million trade name impairment charge. See Notes 1 and 7 of Notes to Consolidated Financial Statements in the Company’s Annual Report on Form 10-K for the year ended December 31, 2014.
The fair values of cash and cash equivalents, accounts receivable, accounts payable and accrued expenses, to the extent the underlying liability will be settled in cash, approximate carrying values because of the short-term nature of these instruments. Derivative financial instruments are recorded at fair value. The fair value of the Company’s floating rate and fixed rate long-term debt (Level 2) is determined using actual market quotes and benchmark yields received from independent vendors.
The following table presents the carrying amount and estimated fair value of the Company’s debt, including the current portion and excluding the interest rate swaps, as of December 31, 2014 and March 31, 2015 (in millions):
| December 31, 2014 | March 31, 2015 | |||||||||||||||
| Carrying Value |
Fair Value |
Carrying Value |
Fair Value |
|||||||||||||
| Floating rate debt |
$ | 2,458 | $ | 2,431 | $ | 2,458 | $ | 2,463 | ||||||||
| Fixed rate debt |
2,211 | 2,286 | 2,212 | 2,303 | ||||||||||||
F-63
Table of Contents
8. Non-controlling Interest:
A rollforward of SunGard’s non-controlling interest for the three months ended March 31, 2015 is as follows (in millions):
| Non-controlling interest | ||||||||||||
| Temporary equity |
Permanent equity |
Total | ||||||||||
| Balances at December 31, 2014 |
$ | 37 | $ | 1,490 | $ | 1,527 | ||||||
| Net income |
1 | 42 | 43 | |||||||||
| Purchase of treasury stock |
— | (1 | ) | (1 | ) | |||||||
| Transfer intrinsic value of vested restricted stock units to temporary equity |
1 | — | 1 | |||||||||
| Cancellation of put options due to employee terminations |
(1 | ) | 1 | — | ||||||||
| Other |
(1 | ) | — | (1 | ) | |||||||
|
|
|
|
|
|
|
|||||||
| Balances at March 31, 2015 |
$ | 37 | $ | 1,532 | $ | 1,569 | ||||||
|
|
|
|
|
|
|
|||||||
A rollforward of SunGard’s non-controlling interest for the three months ended March 31, 2014 follows (in millions):
| Non-controlling interest | ||||||||||||
| Temporary equity |
Permanent equity |
Total | ||||||||||
| Balances at December 31, 2013 |
$ | 42 | $ | 1,741 | $ | 1,783 | ||||||
| Net income |
— | 50 | 50 | |||||||||
| Issuance of common and preferred stock |
(1 | ) | — | (1 | ) | |||||||
| Purchase of treasury stock |
— | (2 | ) | (2 | ) | |||||||
| Impact of exchange of SpinCo common stock for preferred stock of a subsidiary |
(1 | ) | (428 | ) | (429 | ) | ||||||
| Impact of modification of SunGard Awards |
(4 | ) | — | (4 | ) | |||||||
| Impact of modification of SpinCo Awards |
(6 | ) | — | (6 | ) | |||||||
| Transfer intrinsic value of vested restricted stock units to temporary equity |
2 | — | 2 | |||||||||
| Cancellation of put options due to employee terminations |
(4 | ) | 4 | — | ||||||||
|
|
|
|
|
|
|
|||||||
| Balances at March 31, 2014 |
$ | 28 | $ | 1,365 | $ | 1,393 | ||||||
|
|
|
|
|
|
|
|||||||
9. Earnings (Loss) Per Share
Earnings (loss) per share is calculated using the two-class method, which is an earnings allocation formula that determines earnings (loss) per share for the holders of the Company’s Class A common stock and the holders of Class L common stock, as if all earnings for the period were distributed pursuant to their contractual right to receive dividends. Class L common stock is legally designated as common stock, but is entitled to a preferential return equal to the sum of (i) an $81 per share base amount plus (ii) an amount sufficient to generate an internal rate of return equal to 13.5% per annum (compounded quarterly). After this amount has been distributed, the Class L participates in all distributions on a pro-rata basis with the Class A.
The numerator in calculating Class L basic and diluted income per share is an amount equal to the 13.5% preferential return for the reporting period.
The numerator in calculating Class A basic earnings (loss) per share is Net income (loss) attributable to SunGard, less an amount equal to the 13.5% preferential return for the reporting period. In determining the net income (loss) attributable to Class A stockholders for purposes of computing diluted earnings (loss) per share,
F-64
Table of Contents
the Company increased the loss to reflect the preference amount for dilutive Class L shares. The basic and diluted earnings (loss) per share attributable to Class A stockholders is presented for both continuing and discontinued operations for all periods.
Reconciliations of the numerators and denominators used in the computation of basic and diluted earnings (loss) per common share are as follows (in millions, except per share amounts):
| Three months ended March 31, |
||||||||
| 2014 | 2015 | |||||||
| Numerators: |
||||||||
| Net income (loss) attributable to SunGard |
$ | (390 | ) | $ | (15 | ) | ||
| Income (loss) from discontinued operations, net of tax |
(17 | ) | 2 | |||||
|
|
|
|
|
|||||
| Income (loss) from continuing operations attributable to SunGard |
(373 | ) | (17 | ) | ||||
| Less: Additional income attributable to the non-controlling interest for vested unissued shares |
(1 | ) | (1 | ) | ||||
| Less: Preference amount for Class L outstanding and vested unissued shares |
(236 | ) | (270 | ) | ||||
|
|
|
|
|
|||||
| Numerator for basic earnings (loss) per share – Income (loss) available to Class A stockholders from continuing operations |
$ | (610 | ) | $ | (288 | ) | ||
|
|
|
|
|
|||||
| Less: Additional income attributable to the non-controlling interest for vested unissued shares |
— | (1 | ) | |||||
| Less: Preference amount for dilutive Class L options and Class L shares included in restricted stock units |
— | (5 | ) | |||||
|
|
|
|
|
|||||
| Numerator for diluted earnings (loss) per share – Income (loss) available to Class A stockholders from continuing operations |
$ | (610 | ) | $ | (294 | ) | ||
|
|
|
|
|
|||||
| Denominators: |
||||||||
| Class A Common Stock: |
||||||||
| Weighted average number of shares – Basic |
261 | 262 | ||||||
| Effect of potentially dilutive Class A shares |
— | 5 | ||||||
|
|
|
|
|
|||||
| Weighted average number of shares – Diluted |
261 | 267 | ||||||
|
|
|
|
|
|||||
| Class L Common stock: |
||||||||
| Weighted average number of shares – Basic |
29 | 29 | ||||||
| Effect of potentially dilutive Class L shares |
— | 1 | ||||||
|
|
|
|
|
|||||
| Weighted average number of shares – Diluted |
29 | 30 | ||||||
|
|
|
|
|
|||||
| Earnings (loss) per share: |
||||||||
| Net income (loss) per share – Basic: |
||||||||
| Class L stockholders |
$ | 8.14 | $ | 9.29 | ||||
| Class A stockholders – continuing operations |
(2.34 | ) | (1.10 | ) | ||||
| Class A stockholders – discontinued operations |
(0.06 | ) | 0.01 | |||||
|
|
|
|
|
|||||
| Class A stockholders – total |
$ | (2.40 | ) | $ | (1.09 | ) | ||
|
|
|
|
|
|||||
| Net income (loss) per share – Diluted: |
||||||||
| Class L stockholders |
$ | 8.14 | $ | 9.29 | ||||
| Class A stockholders – continuing operations |
(2.34 | ) | (1.10 | ) | ||||
| Class A stockholders – discontinued operations |
(0.06 | ) | 0.01 | |||||
|
|
|
|
|
|||||
| Class A stockholders – total |
$ | (2.40 | ) | $ | (1.09 | ) | ||
|
|
|
|
|
|||||
The Company included $4 million in the calculation of diluted earnings per share for Class L stockholders for the three months ended March 31, 2014 related to the preference amount for dilutive Class L options and Class L shares included in restricted stock units. This amount is excluded from the calculation of diluted earnings (loss) per share for Class A stockholders for the same period as the effect would be anti-dilutive.
F-65
Table of Contents
The following potential common shares were excluded from the calculation of earnings (loss) per share attributable to common stockholders because their effect would have been anti-dilutive for the periods presented:
| Three months ended March 31, | ||||||||
| 2014 | 2015 | |||||||
| Numerators: |
||||||||
| Class A Common Stock: |
||||||||
| Restricted Stock Units |
6 | 6 | ||||||
| Stock options |
18 | 12 | ||||||
| Stock appreciation rights |
7 | 6 | ||||||
| Class L Common Stock: |
||||||||
| Restricted Stock Units |
1 | 1 | ||||||
| Stock options |
1 | 1 | ||||||
| Stock appreciation rights |
1 | 1 | ||||||
Unaudited Pro Forma Earnings (Loss) Per Share
Pro forma basic and diluted earnings (loss) per share were computed to give effect to the cancelation of SunGard Class A common stock, the conversion of Sungard Class L common stock into common stock, and the exchange of SCCII preferred stock for shares of common stock as if these actions had occurred as of the beginning of the period.
| Three months ended March 31, 2015 |
||||
| Income (loss) from continuing operations |
— | |||
| Basic shares: |
||||
| Weighted average number of shares used to calculate basic earnings (loss) per share from continuing operations |
— | |||
| Pro forma adjustment to reflect cancelation of SunGard Class A common stock prior to completion of the company’s initial public offering |
— | |||
| Pro forma adjustment to reflect conversion of Sungard Class L common stock into common stock prior to completion of the company’s initial public offering |
— | |||
| Pro forma adjustment to reflect the exchange of SCCII preferred stock for shares of common stock prior to completion of the company’s initial public offering |
— | |||
|
|
|
|||
| Weighted average number of shares used to calculate basic pro forma earnings (loss) per share from continuing operations |
— | |||
| Diluted shares: |
||||
| Weighted average number of shares used to calculate basic pro forma earnings (loss) per share from continuing operations |
— | |||
| Effect of potentially dilutive securities |
— | |||
|
|
|
|||
| Weighted average number of shares used to calculate diluted pro forma earnings (loss) per share from continuing operations |
— | |||
| Pro forma earnings (loss) per share from continuing operations attributable to common stockholders: |
||||
| Basic |
— | |||
| Diluted |
— | |||
F-66
Table of Contents
The following potential common shares were excluded from the calculation of pro forma diluted earnings (loss) per share attributable to common stockholders because their effect would have been anti-dilutive for the periods presented:
| Three months ended March 31, 2015 |
||||
| Restricted Stock Units |
— | |||
| Stock options |
— | |||
| Stock Appreciation Rights |
— | |||
10. Income Taxes:
The effective income tax rates for the three month periods ended March 31, 2015 and 2014 were 41% and 24%, respectively. The Company’s effective tax rate reflects changes in the mix of income or losses in jurisdictions with a wide range of tax rates, permanent differences between GAAP and local tax laws, the impact of valuation allowances, unrecognized tax benefits, and the timing of recording discrete items. The Company continues to generate losses in France which exceed the scheduled reversal of deferred tax liabilities. As a result, no benefit has been recorded for these losses for the three months ended March 31, 2015.
For the three months ended March 31, 2014, the benefit for income taxes includes a benefit of $138 million recorded as a discrete item related to the impairment of the trade name, an expense of $46 million recorded as a discrete item due to changes in certain state deferred tax rates, primarily driven by the change in the legal entity ownership of the trade name caused by the AS Split-Off, and an expense of $9 million recorded as a discrete item to increase the valuation allowance on state net operating losses driven by the change in management’s judgment of their realizability due to the AS Split-Off.
In evaluating the realizability of deferred tax assets, management considered the scheduled reversal of deferred tax liabilities (including the impact of available carryback and carryforward periods), projected future taxable income, and tax planning strategies in making this assessment. Changes in the mix of income, losses in particular jurisdictions or the total amount of income for 2015 may significantly impact the estimated effective income tax rate for the year.
11. Segment Information:
The Company’s measure of segment profit or loss is Adjusted EBITDA. Management believes Adjusted EBITDA is an effective tool to measure the Company’s operating performance since it excludes non-cash items, including depreciation (which includes amortization of capitalized software), amortization of acquisition-related intangible assets, trade name and goodwill impairment charges and stock compensation expense, and certain variable charges including severance and facility closure costs, management fees paid to the Sponsors and certain other costs. Management uses Adjusted EBITDA extensively to measure the financial performance of SunGard and its reportable segments, and also to report the Company’s results to its board of directors. The Company uses a similar measure, as defined in its senior secured credit agreement, for purposes of computing its debt covenants.
F-67
Table of Contents
The operating results for the three months ended March 31, 2015 and 2014 for each segment follow (in millions):
| Three Months Ended March 31, 2015 | ||||||||||||||||||||
| FS | PS&E | Sum of segments |
Corporate (1) | Total | ||||||||||||||||
| Software |
$ | 218 | $ | 34 | $ | 252 | $ | — | $ | 252 | ||||||||||
| SaaS and cloud |
268 | 9 | 277 | — | 277 | |||||||||||||||
| Services |
131 | 11 | 142 | — | 142 | |||||||||||||||
|
|
|
|
|
|
|
|
|
|
|
|||||||||||
| Total revenue |
$ | 617 | $ | 54 | $ | 671 | $ | — | $ | 671 | ||||||||||
|
|
|
|
|
|
|
|
|
|
|
|||||||||||
| Adjusted EBITDA |
$ | 174 | $ | 16 | $ | 190 | $ | (15 | ) | $ | 175 | |||||||||
| Depreciation (2) |
26 | 3 | 29 | — | 29 | |||||||||||||||
| Amortization of acquisition-related intangible assets |
20 | 1 | 21 | — | 21 | |||||||||||||||
| Capital expenditures |
22 | 4 | 26 | 2 | 28 | |||||||||||||||
| Three Months Ended March 31, 2014 | ||||||||||||||||||||
| FS | PS&E | Sum of segments |
Corporate (1) | Total | ||||||||||||||||
| Software |
$ | 217 | $ | 34 | $ | 251 | $ | — | $ | 251 | ||||||||||
| SaaS and cloud |
259 | 9 | 268 | — | 268 | |||||||||||||||
| Services |
124 | 10 | 134 | — | 134 | |||||||||||||||
|
|
|
|
|
|
|
|
|
|
|
|||||||||||
| Total revenue |
$ | 600 | $ | 53 | $ | 653 | $ | — | $ | 653 | ||||||||||
|
|
|
|
|
|
|
|
|
|
|
|||||||||||
| Adjusted EBITDA |
$ | 139 | $ | 16 | $ | 155 | $ | (10 | ) | $ | 145 | |||||||||
| Depreciation (2) |
22 | 2 | 24 | — | 24 | |||||||||||||||
| Amortization of acquisition-related intangible assets |
41 | 2 | 43 | — | 43 | |||||||||||||||
| Capital expenditures |
26 | 2 | 28 | — | 28 | |||||||||||||||
| (1) | Corporate is included to reconcile each item to the total for the Company. |
Reconciliation of consolidated Adjusted EBITDA to income (loss) from continuing operations before income taxes:
| Three Months Ended March 31, | ||||||||
| 2014 | 2015 | |||||||
| Adjusted EBITDA (including corporate) |
$ | 145 | $ | 175 | ||||
| Depreciation (2) |
(24 | ) | (29 | ) | ||||
| Amortization of acquisition-related intangible assets |
(43 | ) | (21 | ) | ||||
| Trade name impairment charge |
(339 | ) | — | |||||
| Severance and facility closure costs |
(5 | ) | (2 | ) | ||||
| Stock compensation expense |
(9 | ) | (10 | ) | ||||
| Management fees |
(2 | ) | (2 | ) | ||||
| Other costs (included in operating income) |
(12 | ) | 4 | |||||
| Interest expense, net |
(74 | ) | (71 | ) | ||||
| Loss on extinguishment of debt |
(61 | ) | — | |||||
|
|
|
|
|
|||||
| Income (loss) from continuing operations before income taxes |
$ | (424 | ) | $ | 44 | |||
|
|
|
|
|
|||||
| (2) | Includes amortization of capitalized software. |
F-68
Table of Contents
12. Employee Termination Benefits and Facility Closures:
The following table provides a rollforward of the liability balances for workforce reductions and facility closures for the three months ended March 31, 2015 (in millions):
| Workforce- related |
Facilities | Total | ||||||||||
| Balance at December 31, 2014 |
$ | 12 | $ | 13 | $ | 25 | ||||||
| Expense related to 2015 actions |
4 | — | 4 | |||||||||
| Paid |
(6 | ) | — | (6 | ) | |||||||
| Other adjustments |
(2 | ) | (1 | ) | (3 | ) | ||||||
|
|
|
|
|
|
|
|||||||
| Balance at March 31, 2015 |
$ | 8 | $ | 12 | $ | 20 | ||||||
|
|
|
|
|
|
|
|||||||
The majority of the workforce-related actions are expected to be completed over the next 12 months. The facilities accruals are for ongoing obligations to pay rent for vacant space and are net of sublease reserves. The lengths of these obligations vary by lease with the majority ending in 2019.
13. Related Party Transactions:
Sponsor Transactions
In accordance with the Management Agreement between the Company and affiliates of the Sponsors, the Company recorded $2 million of management fees in sales, marketing and administration expenses for each of the three months ended March 31, 2014 and 2015. In the three months ended March 31, 2014, the Company recorded approximately $1 million of management fees in income (loss) from discontinued operations. At December 31, 2014 and March 31, 2015, the Company had accrued management fees included in other accrued expenses of $3 million and $2 million, respectively.
For the three months ended March 31, 2014, Goldman, Sachs & Co. and/or its respective affiliates, received less than $1 million in connection with amendments to SunGard’s Credit Agreement.
In addition to the amounts above, on March 31, 2014 the Company recorded $15 million of management fees, which is included in income (loss) from discontinued operations, as provided in the Management Agreement for services rendered in connection with the issuance of the $1.025 billion SpinCo Term Loan and $425 million of SpinCo Notes. Also during the first quarter of 2014, the Company recorded $1 million of management fees which is included in income (loss) from discontinued operations resulting from the sale of two FS businesses.
AS Transactions
In connection with the Global Master Services Agreement (“GMSA”) with AS, the Company incurred expenses of $8 million for services provided under the GMSA, most of which are included in cost of sales and direct operating expenses, in the Condensed Consolidated Statement of Income (Loss) for the three months ended March 31, 2015. At March 31, 2015, the Company had recorded approximately $4 million of accounts payable, and a $1 million prepaid maintenance contract from AS under the GMSA. The Company has a remaining commitment under the GMSA, which expires on March 31, 2016, of approximately $34 million.
In addition, during the three months ended March 31, 2015, AS purchased certain data center outsourcing services and treasury products from FS, for which FS recognized approximately $1 million of revenue.
14. Commitments and Contingencies:
The Company is presently a party to certain lawsuits arising in the ordinary course of its business. In the opinion of management, none of its current legal proceedings are expected to have a material impact on the Company’s business or financial results. The Company’s customer contracts generally include typical indemnification of customers, primarily for intellectual property infringement claims. Liabilities in connection with such obligations have not been material.
F-69
Table of Contents
The Company has had patent infringement lawsuits filed against it or certain of its customers claiming that certain of its products infringe the intellectual property rights of others. Adverse results in these lawsuits may include awards of substantial monetary damages, costly royalty or licensing agreements, or limitations on the Company’s ability to offer certain features, functionalities, products, or services, and may also cause the Company to change its business practices, and require development of non-infringing products or technologies, which could result in a loss of revenues and otherwise harm the Company’s business. Also, certain agreements with previously owned businesses of the Company require indemnification to the new owners for certain matters as part of the sale of those businesses. At March 31, 2015, the Company does not have any significant accruals related to patent indemnification or infringement claims.
The Company evaluates, on a regular basis, developments in its legal matters. The Company records a provision for a liability when it believes that it is both probable that a liability has been incurred, and the amount can be reasonably estimated.
With respect to any current legal proceedings or claims pending against the Company for which it has not made an accrual, but for which it is reasonably possible that a loss may occur, the Company is unable to estimate a range of loss due to various reasons, including, among others: (1) that the proceedings are in early stages, (2) that there is uncertainty as to the outcome of pending appeals, motions, or settlements, (3) that there are significant factual issues to be resolved, and (4) that there are novel legal issues presented. Such legal matters are inherently unpredictable and subject to significant uncertainties, some of which are beyond the Company’s control. Based on current knowledge, the Company believes that the final outcome of the matters discussed above will not, individually or in the aggregate, have a material adverse effect on its business, consolidated financial position, results of operations, or cash flows. While the Company intends to vigorously defend these matters, in light of the uncertainties involved in such matters, there exists the possibility of adverse outcomes, and the final outcome of a particular matter could have a material adverse effect on results of operations or cash flows in a particular period.
The Company has recorded a reserve for unrecognized tax benefits and related accrued interest for certain matters. Also, the Company is under examination in various federal, state and local and foreign jurisdictions related to income and non-income tax matters. Based on current knowledge, the Company believes that resolution of these matters, giving recognition to the reserve for unrecognized tax benefits, will not have a materially adverse impact on its business, consolidated financial position, results of operations or cash flows.
The State of Delaware, Department of Finance, Division of Revenue (Unclaimed Property) and nine other states are currently conducting a joint examination of the books and records of certain wholly owned subsidiaries of the Company to determine compliance with the unclaimed property laws. Additionally, the Company has entered into voluntary disclosure agreements to address the potential unclaimed property exposure for certain entities not included in the scope of the ongoing unclaimed property examination. The potential exposure related to the examination and the voluntary disclosure programs is not currently determinable.
15. Subsequent Events
On May 6, 2015, the Company announced that SunGard is considering pursuing an initial public offering of common stock in 2015. The timing, number of shares to be offered and the price range of the proposed offering have not yet been determined. The Company expects to use net proceeds of the proposed offering to repay debt.
On May 19, 2015, an appellate body reached a decision favorable to SunGard on a matter between the Company and a state taxing authority. As a result, in the second quarter of 2015, the Company will release an appropriate portion of its reserve for uncertain tax positions in the range of $10 million to $18 million related to the matter.
F-70
Table of Contents
Shares
Common Stock
Joint Book-Running Managers
| J.P. Morgan | Goldman, Sachs & Co. | Barclays | Deutsche Bank Securities | Credit Suisse |
| BofA Merrill Lynch | ||||||||||||
| Citigroup | ||||||||||||
| Morgan Stanley | ||||||||||||
| RBC Capital Markets | ||||||||||||
| UBS Investment Bank | ||||||||||||
| Wells Fargo Securities |
Through and including the 25th day after the date of this prospectus, all dealers that effect transactions in these securities, whether or not participating in this offering, may be required to deliver a prospectus. This is in addition to the dealers’ obligations to deliver a prospectus when acting as underwriters and with respect to their unsold allotments or subscriptions.
Table of Contents
PART II
INFORMATION NOT REQUIRED IN PROSPECTUS
Item 13. Other Expenses of Issuance and Distribution.
The following table sets forth the expenses payable by the registrant expected to be incurred in connection with the issuance and distribution of common stock being registered hereby (other than underwriting discounts and commissions). All of such expenses are estimates, except for the Securities and Exchange Commission (“SEC”) registration fee, the FINRA filing fee and listing fee.
| SEC registration fee |
$ | 11,620 | ||
| FINRA filing fee |
$ | 15,500 | ||
| Listing fee |
* | |||
| Printing fees and expenses |
* | |||
| Legal fees and expenses |
* | |||
| Blue sky fees and expenses |
* | |||
| Registrar and transfer agent fees |
* | |||
| Accounting fees and expenses |
* | |||
| Miscellaneous |
* | |||
|
|
|
|||
| Total |
* | |||
|
|
|
| * | To be completed by amendment. |
Item 14. Indemnification of Directors and Officers.
SunGard is incorporated under the laws of Delaware.
Section 102(b)(7) of the Delaware General Corporation Law (the “DGCL”) allows a corporation to provide in its certificate of incorporation that a director of the corporation will not be personally liable to the corporation or its stockholders for monetary damages for breach of fiduciary duty as a director, except where the director breached the duty of loyalty, failed to act in good faith, engaged in intentional misconduct or knowingly violated a law, authorized the payment of a dividend or approved a stock repurchase in violation of Delaware corporate law or obtained an improper personal benefit. Our Third Amended and Restated Certificate of Incorporation will provide for this limitation of liability. We will enter into indemnification agreements with our director nominees that provide for us to indemnify them to the fullest extent permitted by Delaware law.
Section 145 of the DGCL, or Section 145, provides, among other things, that a Delaware corporation may indemnify any person who was, is or is threatened to be made, party to any threatened, pending or completed action, suit or proceeding, whether civil, criminal, administrative or investigative (other than an action by or in the right of such corporation), by reason of the fact that such person is or was an officer, director, employee or agent of such corporation or is or was serving at the request of such corporation as a director, officer, employee or agent of another corporation or enterprise. The indemnity may include expenses (including attorneys’ fees), judgments, fines and amounts paid in settlement actually and reasonably incurred by such person in connection with such action, suit or proceeding, provided such person acted in good faith and in a manner he or she reasonably believed to be in or not opposed to the corporation’s best interests and, with respect to any criminal action or proceeding, had no reasonable cause to believe that his or her conduct was unlawful. A Delaware corporation may indemnify any persons who were or are a party to any threatened, pending or completed action or suit by or in the right of the corporation by reason of the fact that such person is or was a director, officer, employee or agent of another corporation or enterprise. The indemnity may include expenses (including attorneys’ fees) actually and reasonably incurred by such person in connection with the defense or settlement of such action or suit, provided such person acted in good faith and in a manner he or she reasonably believed to be in or not opposed to the corporation’s best interests, provided further that no indemnification is permitted without judicial approval if the officer, director, employee or agent is adjudged to be liable to the corporation. Where an
II-1
Table of Contents
officer or director is successful on the merits or otherwise in the defense of any action referred to above, the corporation must indemnify him or her against the expenses (including attorneys’ fees) which such officer or director has actually and reasonably incurred.
Section 145 further authorizes a corporation to purchase and maintain insurance on behalf of any person who is or was a director, officer, employee or agent of the corporation or is or was serving at the request of the corporation as a director, officer, employee or agent of another corporation or enterprise, against any liability asserted against such person and incurred by such person in any such capacity, or arising out of his or her status as such, whether or not the corporation would otherwise have the power to indemnify such person under Section 145.
Our Second Amended and Restated Bylaws will provide that we must indemnify our directors and officers to the full extent authorized by the DGCL.
The indemnification rights set forth above shall not be exclusive of any other right which an indemnified person may have or hereafter acquire under any statute, provision of our Third Amended and Restated Certificate of Incorporation, our Second Amended and Restated Bylaws, agreement, vote of stockholders or disinterested directors or otherwise. Notwithstanding the foregoing, we shall not be obligated to indemnify a director or officer in respect of a proceeding (or part thereof) instituted by such director or officer, unless such proceeding (or part thereof) has been authorized by the Board of Directors pursuant to the applicable procedure outlined in the Second Amended and Restated Bylaws.
Section 174 of the DGCL provides, among other things, that a director, who willfully or negligently approves of an unlawful payment of dividends or an unlawful stock purchase or redemption, may be held jointly and severally liable for such actions. A director who was either absent when the unlawful actions were approved or dissented at the time may avoid liability by causing his or her dissent to such actions to be entered in the books containing the minutes of the meetings of the board of directors at the time such action occurred or immediately after such absent director receives notice of the unlawful acts.
We expect to maintain standard policies of insurance that provide coverage (1) to our directors and officers against loss rising from claims made by reason of breach of duty or other wrongful act and (2) to us with respect to indemnification payments that we may make to such directors and officers.
The underwriting agreement provides for indemnification by the underwriters of us and our officers and directors, and by us of the underwriters, for certain liabilities arising under the Securities Act or otherwise in connection with this offering.
Item 15. Recent Sales of Unregistered Securities.
Within the past three years, the registrant has granted or issued the following securities of the registrant which were not registered under the Securities Act of 1933, as amended (the “Securities Act”).
Equity Securities
During the years ended December 31, 2012 and December 31, 2013, we did not sell any of our equity securities on an unregistered basis.
On May 30, 2014, we sold 27,317 Units at a price of $18.14 per Unit to a limited liability company which is beneficially owned by Russell P. Fradin, the President and Chief Executive Officer of SunGard and a member of our board of directors. Each Unit consists of 1.3 shares of Class A common stock and 0.1444 shares of Class L common stock of SunGard and 0.03807 shares of preferred stock of SCCII. We conducted the sale in reliance on the exemption from registration set forth in Section 4(a)(2) under the Securities Act. During the year ended December 31, 2014, we did not otherwise sell any of our equity securities on an unregistered basis.
II-2
Table of Contents
Debt Securities
On November 1, 2012, we issued $1.0 billion aggregate principal amount of 6.625% senior subordinated notes due November 1, 2019 at a price of 100% of their face value resulting in approximately $1,000,000,000 of gross proceeds, which we used, along with cash on hand, to repurchase or optionally redeem all of our outstanding $1.0 billion aggregate principal amount of 10.25% senior subordinated notes due 2015. The initial purchasers for these notes were Citigroup Global Markets Inc., Deutsche Bank Securities Inc., Morgan Stanley & Co. LLC, Merrill Lynch, Pierce, Fenner & Smith Incorporated, J.P. Morgan Securities LLC, Goldman, Sachs & Co., Barclays Capital Inc., Credit Suisse Securities (USA) LLC and RBC Capital Markets, LLC.
The above offerings of debt securities was offered and sold to qualified institutional buyers pursuant to Rule 144A under the Securities Act or to non-U.S. investors outside the United States in compliance with Regulation S of the Securities Act.
Item 16. Exhibits and Financial Statement Schedules.
| (a) | Exhibits |
See the Exhibit Index immediately following the signature page hereto, which is incorporated by reference as if fully set forth herein.
| (b) | Financial Statement Schedules |
None.
Item 17. Undertakings.
The undersigned registrant hereby undertakes that:
| (1) | Insofar as indemnification for liabilities arising under the Securities Act of 1933 may be permitted to directors, officers and controlling persons of the registrant pursuant to the foregoing provisions, or otherwise, the registrant has been advised that in the opinion of the Securities and Exchange Commission such indemnification is against public policy as expressed in the Securities Act of 1933 and is, therefore, unenforceable. In the event that a claim for indemnification against such liabilities (other than the payment by the registrant of expenses incurred or paid by a director, officer or controlling person of the registrant in the successful defense of any action, suit or proceeding) is asserted by such director, officer or controlling person in connection with the securities being registered, the registrant will, unless in the opinion of its counsel the matter has been settled by controlling precedent, submit to a court of appropriate jurisdiction the question of whether such indemnification by it is against public policy as expressed in the Securities Act of 1933 and will be governed by the final adjudication of such issue. |
| (2) | (A) For purposes of determining any liability under the Securities Act of 1933, the information omitted from the form of prospectus filed as part of this registration statement in reliance upon Rule 430A and contained in a form of prospectus filed by the registrant pursuant to Rule 424(b)(1) or (4) or 497(h) under the Securities Act shall be deemed to be part of this registration statement as of the time it was declared effective. |
| (B) For the purpose of determining any liability under the Securities Act of 1933, each post-effective amendment that contains a form of prospectus shall be deemed to be a new registration statement relating to the securities offered therein, and the offering of such securities at that time shall be deemed to be the initial bona fide offering thereof. |
II-3
Table of Contents
SIGNATURES
Pursuant to the requirements of the Securities Act of 1933, as amended, the registrant has duly caused this Registration Statement to be signed on its behalf by the undersigned, thereunto duly authorized, in the City of Wayne, Pennsylvania, on June 3, 2015
| SUNGARD | ||||
| By: | /s/ | Russell P. Fradin | ||
| Name: | Russell P. Fradin | |||
| Title: | President and Chief Executive Officer | |||
Pursuant to the requirements of the Securities Act of 1933, this Registration Statement has been signed by the following persons in the capacities indicated on June 3, 2015.
| Signature |
Capacity | |||||
| /s/ Russell P. Fradin Russell P. Fradin |
Director, President and Chief Executive Officer (Principal Executive Officer) | |||||
| /s/ Charles J. Neral Charles J. Neral |
Senior Vice President-Finance and Chief Financial Officer (Principal Financial Officer) | |||||
| /s/ Christopher P. Breakiron Christopher P. Breakiron |
Vice President and Chief Accounting Officer (Principal Accounting Officer) | |||||
| * Glenn H. Hutchins |
Director, Chairman of the Board of Directors | |||||
| * David L. Johnson |
Director | |||||
| * Ian K. Loring |
Director | |||||
| * John W. Marren |
Director | |||||
| * Sanjeev K. Mehra |
Director | |||||
| * R. Davis Noell |
Director | |||||
| * John I. Park |
Director | |||||
| * By: | /s/ Victoria E. Silbey | |||||
| Name: | Victoria E. Silbey | |||||
| Title: | Attorney-in-Fact | |||||
II-4
Table of Contents
EXHIBIT INDEX
| Exhibit |
Description | |
| 1.1** | Form of Underwriting Agreement by and among SunGard and the underwriters named therein | |
| 3.1** | Form of Third Amended and Restated Certificate of Incorporation of SunGard | |
| 3.2** | Form of Second Amended and Restated Bylaws of SunGard | |
| 4.1** | Specimen Stock Certificate evidencing the shares of common stock | |
| 4.2 | Indenture, dated as of November 16, 2010, among SunGard Data Systems Inc. (“SDS”), the Guarantors named therein and The Bank of New York Mellon, as Trustee, governing the 7.375% Senior Notes due 2018 (Incorporated by reference to Exhibit 4.1 to SunGard’s Current Report on Form 8-K filed November 16, 2010) | |
| 4.3 | Indenture, dated as of November 16, 2010, among SDS, the Guarantors named therein and The Bank of New York Mellon, as Trustee, governing the 7.625% Senior Notes due 2020 (Incorporated by reference to Exhibit 4.2 to SunGard’s Current Report on Form 8-K filed November 16, 2010) | |
| 4.4 | Indenture, dated as of November 1, 2012, among SDS, the Guarantors named therein and the Bank of New York Mellon, as Trustee, governing the 6.625% Senior Subordinated Notes due 2019 (Incorporated by reference to Exhibit 4.1 to SunGard’s Current Report on Form 8-K filed November 7, 2012) | |
| 5.1** | Opinion of Simpson Thacher & Bartlett LLP | |
| 10.1†** | Form of 2015 Incentive Plan | |
| 10.2 | Amended and Restated Credit Agreement, dated as of August 11, 2005, as amended by the Seventh Amendment and Restatement Agreement dated as of February 7, 2014, among SDS, SunGard Holdco LLC, JPMorgan Chase Bank, N.A., as Administrative Agent, and the lenders party thereto (Incorporated by reference to Exhibit 10.1 to SunGard’s Current Report on Form 8-K filed February 13, 2014) | |
| 10.3 | Guarantee Agreement, dated as of August 11, 2005, among SunGard Holdco LLC, SDS, Solar Capital Corp., the Subsidiaries of SDS identified therein and JPMorgan Chase Bank, N.A., as Administrative Agent (Incorporated by reference to Exhibit 10.2 to SDS’s Quarterly Report on Form 10-Q for the period ended September 30, 2005) | |
| 10.4 | Security Agreement, dated as of August 11, 2005, among SunGard Holdco LLC, SDS, Solar Capital Corp., the Subsidiaries of SDS identified therein and JPMorgan Chase Bank, N.A., as Collateral Agent (Incorporated by reference to Exhibit 10.3 to SDS’s Quarterly Report on Form 10-Q for the period ended September 30, 2005) | |
| 10.5 | Intellectual Property Security Agreement, dated as of August 11, 2005, among SunGard Holdco LLC, SDS, Solar Capital Corp., the Subsidiaries of SDS identified therein and JPMorgan Chase Bank, N.A., as Collateral Agent (Incorporated by reference to Exhibit 10.4 to SDS’s Quarterly Report on Form 10-Q for the period ended September 30, 2005) | |
| 10.6 | Third Amended and Restated Credit and Security Agreement, dated as of May 14, 2014, by and among SunGard AR Financing LLC, as borrower, the financial institutions party thereto from time to time as lenders and General Electric Capital Corporation as a lender, swing line lender and administrative agent (Incorporated by reference to Exhibit A to Exhibit 10.1to SunGard’s Current Report on Form 8-K filed May 19, 2014) | |
| 10.7 | Amendment and Restatement Agreement, dated as of May 14, 2014, by and among SDS, as parent, SunGard AR Financing LLC, as borrower, certain subsidiaries of SunGard Data Systems Inc., as sellers, the financial institutions party thereto from time to time as lenders and General Electric Capital Corporation as a lender, swing line lender and administrative agent (Incorporated by reference to Exhibit 10.1 to SunGard’s Current Report on Form 8-K filed May 19, 2014) | |
Table of Contents
| Exhibit |
Description | |
| 10.8 | Amended and Restated Receivables Sales Agreement, dated as of May 14, 2014, by and among each of the persons signatory thereto from time to time as Sellers, SunGard AR Financing LLC as Buyer, and SDS, as Seller Agent (Incorporated by reference to Exhibit 10.3 to SunGard’s Current Report on Form 8-K filed May 19, 2014) | |
| 10.9 | Seller Support Agreement, dated as of March 27, 2009, by SunGard Data Systems Inc., in favor of SunGard AR Financing LLC (Incorporated by reference to Exhibit 10.3 to SDS’s Current Report on Form 8-K filed April 2, 2009) | |
| 10.10†*** | Employment Agreement by and among Russell Fradin, SDS, SunGard and SunGard Capital Corp. II (“SCC II”), dated May 13, 2011 and effective as of May 31, 2011 (Incorporated by reference to Exhibit 10.1 to SunGard’s Quarterly Report on Form 10-Q for the period ended June 30, 2011) | |
| 10.11† | Employment Agreement by and between SDS and Charles Neral effective as of July 2, 2012 (Incorporated by reference to Exhibit 99.2 to SDS’s Current Report on Form 8-K filed June 14, 2012) | |
| 10.12† | Employment Agreement by and among Marianne Brown, SDS, SunGard and SCC II, effective as of February 24, 2014 (Incorporated by reference to Exhibit 10.11 to SunGard’s Annual Report on Form 10-K for the year ended December 31, 2014) | |
| 10.13† | Employment Agreement by and among Kevin McCurry, SDS, SunGard and SCC II, effective as of January 20, 2014 (Incorporated by reference to Exhibit 10.12 to SunGard’s Annual Report on Form 10-K for the year ended December 31, 2014) | |
| 10.14† | SunGard 2005 Management Incentive Plan as Amended and Restated February 13, 2013 (Incorporated by reference to Exhibit 10.36 to SunGard’s Annual Report on Form 10-K for the year ended December 31, 2012) | |
| 10.15† | SunGard Dividend Rights Plan as Amended September 6, 2007 (Incorporated by reference to Exhibit 10.6 to SDS’s Quarterly Report on Form 10-Q for the period ended September 30, 2007) | |
| 10.16† | Forms of 2005 Time-Based Stock Option Award Agreement (Incorporated by reference to Exhibit 10.31 to SDS’s Quarterly Report on Form 10-Q for the period ended September 30, 2005) | |
| 10.17† | Forms of 2005 Performance-Based Stock Option Award Agreements (Incorporated by reference to Exhibit 10.32 to SDS’s Quarterly Report on Form 10-Q for the period ended September 30, 2005) | |
| 10.18† | Forms of 2007 Performance-Based Restricted Stock Unit Award Agreements (Incorporated by reference to Exhibit 10.2 to SDS’s Quarterly Report on Form 10-Q for the period ended September 30, 2007) | |
| 10.19† | Form of Amendment to the Performance-Based Stock Option Award Agreements (Incorporated by reference to Exhibit (a)(7) to SunGard’s Tender Offer Statement on Schedule TO filed August 13, 2009) | |
| 10.20† | Form of Amendment to the Performance-Based Restricted Stock Unit Award Agreements (Incorporated by reference to Exhibit (a)(9) to SunGard’s Tender Offer Statement on Schedule TO filed August 13, 2009) | |
| 10.21† | Forms of May 2010 Performance-Based Restricted Stock Unit Award Agreements (Incorporated by reference to Exhibit 10.3 to SunGard’s Quarterly Report on Form 10-Q for the period ended June 30, 2010) | |
| 10.22 | Forms of May 2010 Time-Based Restricted Stock Unit Award Agreements (Incorporated by reference to Exhibit 10.4 to SunGard’s Quarterly Report on Form 10-Q for the period ended June 30, 2010) | |
| 10.23 | Forms of June 25, 2010 Amendment to the Performance-Based Equity Award Agreements (Incorporated by reference to Exhibit 10.2 to SunGard’s Quarterly Report on Form 10-Q for the period ended June 30, 2010) | |
Table of Contents
| Exhibit |
Description | |
| 10.24 | Time-Based Restricted Stock Unit Award Agreement dated September 12, 2012 granted to Charles Neral (Incorporated by reference to Exhibit 10.2 to SunGard’s Quarterly Report on Form 10-Q for the period ended September 30, 2012) | |
| 10.25 | Performance-Based Restricted Stock Unit Award Agreement dated September 12, 2012 granted to Charles Neral (Incorporated by reference to Exhibit 10.3 to SunGard’s Quarterly Report on Form 10-Q for the period ended September 30, 2012) | |
| 10.26 | Form of November 2012 Time-Based Restricted Stock Unit Award Agreement (Incorporated by reference to Exhibit 10.65 to SunGard’s Annual Report on Form 10-K for the year ended December 31, 2012) | |
| 10.27 | Form of November 2012 Performance-Based Restricted Stock Unit Award Agreement (Incorporated by reference to Exhibit 10.66 to SunGard’s Annual Report on Form 10-K for the year ended December 31, 2012) | |
| 10.28 | Form of June 2013 Performance-Based Appreciation Unit Award Agreement (Incorporated by reference to Exhibit 10.1 to SunGard’s Current Report on Form 8-K filed June 14, 2013) | |
| 10.29 | Form of June 2013 Time-Based Appreciation Unit Award Agreement (Incorporated by reference to Exhibit 10.2 to SunGard’s Current Report on Form 8-K filed June 14, 2013) | |
| 10.30 | Form of June 2014 Performance-Based Appreciation Unit Award Agreement (Incorporated by reference to Exhibit 10.37 to SunGard’s Annual Report on Form 10-K for the year ended December 31, 2014) | |
| 10.31 | Form of June 2014 Time-Based Appreciation Unit Award Agreement (Incorporated by reference to Exhibit 10.38 to SunGard’s Annual Report on Form 10-K for the year ended December 31, 2014) | |
| 10.32 | SunGard Annual Incentive Compensation Plan, as Amended and Restated on November 15, 2012 (Incorporated by reference to Exhibit 10.67 to SunGard’s Annual Report on Form 10-K for the year ended December 31, 2012) | |
| 10.33 | Form of Indemnification Agreement between SunGard, SCC II, SunGard Holding Corp., SunGard HoldCo LLC, SDS and directors and certain officers of SDS (Incorporated by reference to Exhibit 10.28 to SDS’s Quarterly Report on Form 10-Q for the period ended September 30, 2005) | |
| 10.34 | Second Amended and Restated Stockholders Agreement, dated March 31, 2014, by and among SDS, SunGard, SCC II, SunGard Holding Corp., SunGard Holdco LLC, and the stockholder parties provided therein (Incorporated by reference to Exhibit 2.7 to SunGard’s Current Report on Form 8-K filed April 4, 2014) | |
| 10.35 | Second Amended and Restated Participation, Registration Rights and Coordination Agreement, dated March 31, 2014, by and among SDS, SunGard, SCC II, SunGard Holding Corp., SunGard Holdco LLC, and certain stockholder parties provided therein (Incorporated by reference to Exhibit 2.6 to SunGard’s Current Report on Form 8-K filed April 4, 2014) | |
| 10.36 | Second Amended and Restated Principal Investor Agreement, dated March 31, 2014, by and among SDS, SunGard, SCC II, SunGard Holding Corp., SunGard Holdco LLC, and certain principal investor parties provided therein (Incorporated by reference to Exhibit 2.5 to SunGard’s Current Report on Form 8-K filed April 4, 2014) | |
| 10.37 | Amended & Restated Management Agreement, dated March 31, 2014, by and among SDS, SunGard, SCC II, SunGard Holding Corp., SunGard Holdco LLC, Bain Capital Partners, LLC, Blackstone Communications Advisors I L.L.C., Blackstone Management Partners IV L.L.C., Goldman, Sachs & Co., Kohlberg Kravis Roberts & Co. L.P., Providence Equity Partners L.L.C., Silver Lake Management Company, L.L.C. and TPG GenPar IV, L.P. (Incorporated by reference to Exhibit 2.4 to SunGard’s Current Report on Form 8-K filed April 4, 2014) | |
Table of Contents
| Exhibit |
Description | |
| 10.38 | Separation and Distribution Agreement, dated March 31, 2014, by and among SunGard, SCC II, SunGard Holding Corp., SunGard Holdco LLC, SDS, Sungard Availability Services Capital, Inc., and Sungard Availability Services Holdings, LLC (Incorporated by reference to Exhibit 2.1 to SunGard’s Current Report on Form 8-K filed April 4, 2014) | |
| 10.39 | Tax Sharing and Disaffiliation Agreement, dated March 31, 2014, by and among SunGard, SDS, Sungard Availability Services Capital, Inc., and Sungard Availability Services Holdings, LLC (Incorporated by reference to Exhibit 2.2 to SunGard’s Current Report on Form 8-K filed April 4, 2014) | |
| 10.40 | Trademark License Agreement, dated March 31, 2014, between SunGard Development LLC and Sungard Availability Services Capital, Inc. (Incorporated by reference to Exhibit 2.3 to SunGard’s Current Report on Form 8-K filed April 4, 2014) | |
| 10.41 | Exchange Agreement, dated as of March 17, 2014, among SDS, Citigroup Global Markets Inc., Deutsche Bank Securities Inc. and Merrill Lynch, Pierce, Fenner & Smith Incorporated and, with respect to certain sections thereof, Sungard Availability Services Capital, Inc. (Incorporated by reference to Exhibit 10.1 to SunGard’s Current Report on Form 8-K filed March 21, 2014) | |
| 21.1* | Subsidiaries of Registrant | |
| 23.1** | Consent of Simpson Thacher & Bartlett LLP (included in Exhibit 5.1) | |
| 23.2* | Consent of PricewaterhouseCoopers LLP | |
| 24.1* | Omnibus Powers of Attorney | |
| * | Filed herewith |
| ** | To be filed by amendment |
| † | Management contract or compensatory plan or arrangement. |
| *** | Portions of this exhibit have been omitted in accordance with an order granting confidential treatment. |