Attached files
| file | filename |
|---|---|
| 8-K - FORM 8-K - PUBLIC SERVICE ENTERPRISE GROUP INC | d936111d8k.htm |
 2 Forward-Looking Statement EXHIBIT 99 Certain of the matters discussed in this report about our and our subsidiaries' future performance, including, without limitation, future
revenues, earnings, strategies, prospects, consequences and all
other statements that are not purely historical constitute
“forward-looking statements” within the meaning of the Private Securities Litigation Reform Act of 1995. Such forward-looking statements are subject to risks and uncertainties, which could cause actual results to differ materially from those anticipated. Such statements are
based on management's beliefs as well as assumptions made by and
information currently available to management. When used herein, the words “anticipate,” “intend,” “estimate,” “believe,” “expect,” “plan,” “should,” “hypothetical,”
“potential,” “forecast,” “project,”
variations of such words and similar expressions are intended to identify forward-looking statements. Factors that may cause actual results to differ are often presented with the forward-
looking statements themselves. Other factors that could cause actual results to
differ materially from those contemplated in any forward-looking statements made by us herein are discussed in filings we make with the United States Securities and Exchange Commission (SEC), including our Annual Report on Form 10-K and subsequent
reports on Form 10-Q and Form 8-K and available on our
website: http://www.pseg.com. These factors include, but are not limited to:
adverse changes in the demand for or the price of the capacity and energy that we sell into wholesale electricity markets,
adverse changes in energy industry law, policies and regulation, including market structures and transmission planning,
any inability of our transmission and distribution businesses to obtain adequate and timely rate relief and regulatory approvals from
federal and state regulators, changes in federal and state environmental regulations and enforcement that
could increase our costs or limit our operations, changes in nuclear regulation and/or general developments in the nuclear power
industry, including various impacts from any accidents or incidents experienced at our facilities or by others in the industry, that could limit operations of our nuclear generating units,
actions or activities at one of our nuclear units located on a multi-unit site that might adversely affect our ability to continue to
operate that unit or other units located at the same site, any inability to manage our energy obligations, available supply and risks,
adverse outcomes of any legal, regulatory or other proceeding, settlement, investigation or claim applicable to us and/or the energy
industry, any deterioration in our credit quality or the credit quality of our
counterparties, availability of capital and credit at commercially reasonable terms and
conditions and our ability to meet cash needs, changes in the cost of, or interruption in the supply of, fuel and other
commodities necessary to the operation of our generating units, delays in receipt of necessary permits and approvals for our
construction and development activities, delays or unforeseen cost escalations in our construction and development
activities, any inability to achieve, or continue to sustain, our expected levels of
operating performance, any equipment failures, accidents, severe weather events or other incidents
that impact our ability to provide safe and reliable service to our customers, and any inability to obtain sufficient insurance coverage or recover proceeds of insurance with respect to such events,
acts of terrorism, cybersecurity attacks or intrusions that could adversely impact our businesses,
increases in competition in energy supply markets as well as for transmission projects,
any inability to realize anticipated tax benefits or retain tax credits,
challenges associated with recruitment and/or retention of a qualified workforce,
adverse performance of our decommissioning and defined benefit plan trust fund investments and changes in funding requirements,
changes in technology, such as distributed generation and micro grids, and greater reliance on these technologies, and
changes in customer behaviors, including increases in energy efficiency, net-metering and demand response.
All of the forward-looking statements made in this report are qualified by these cautionary statements and we cannot assure you that
the results or developments anticipated by management will be
realized or even if realized, will have the expected consequences to, or
effects on, us or our business prospects, financial condition or results of operations. Readers are cautioned not to place undue reliance on these forward-looking statements in making any investment decision. Forward-looking statements made in this report
apply only as of the date of this report. While we may elect to
update forward-looking statements from time to time, we specifically
disclaim any obligation to do so, even if internal estimates change, unless otherwise required by applicable securities laws. The forward-looking statements contained in this report are intended to qualify for the safe harbor provisions of Section 27A of the
Securities Act of 1933, as amended, and Section 21E of the
Securities Exchange Act of 1934, as amended.
2 |
 3 GAAP Disclaimer These materials and other financial releases can be found on the pseg.com
website under the investor tab, or at
http://investor.pseg.com/ PSEG presents Operating
Earnings and Adjusted Earnings Before Interest, Taxes, Depreciation and Amortization (EBITDA) in addition to its Income from Continuing Operations/Net Income reported in
accordance with accounting principles generally accepted in the
United States (GAAP). Operating Earnings and
Adjusted EBITDA are non-GAAP financial measures that differ from Income from Continuing Operations/Net Income. Operating Earnings exclude gains or losses associated with Nuclear
Decommissioning Trust (NDT), Mark-to-Market (MTM)
accounting, and other material one-time items. PSEG presents Operating Earnings because management believes that it is appropriate for investors to consider
results excluding these items in addition to the results
reported in accordance with GAAP. PSEG believes
that the non-GAAP financial measure of Operating Earnings provides a consistent and comparable measure of performance of its businesses to help shareholders understand performance trends.
PSEG
is
presenting
Adjusted
EBITDA
because
it
provides
investors
with
additional
information
to
compare
our
business performance to other companies and understand
performance trends. Adjusted EBITDA excludes the
same items as our Operating Earnings measure as well as income tax expense, interest expense, depreciation and amortization and major maintenance expense costs at Power’s fossil generation facilities.
This
information
is
not
intended
to
be
viewed
as
an
alternative
to
GAAP
information.
The
last
three
slides
in
this presentation (Slides A, B and C) include a list of items
excluded from Income from Continuing
Operations/Net Income to reconcile to Operating Earnings and
Adjusted EBITDA with a reference to that slide
included on each of the slides where the non-GAAP
information appears. 3
|
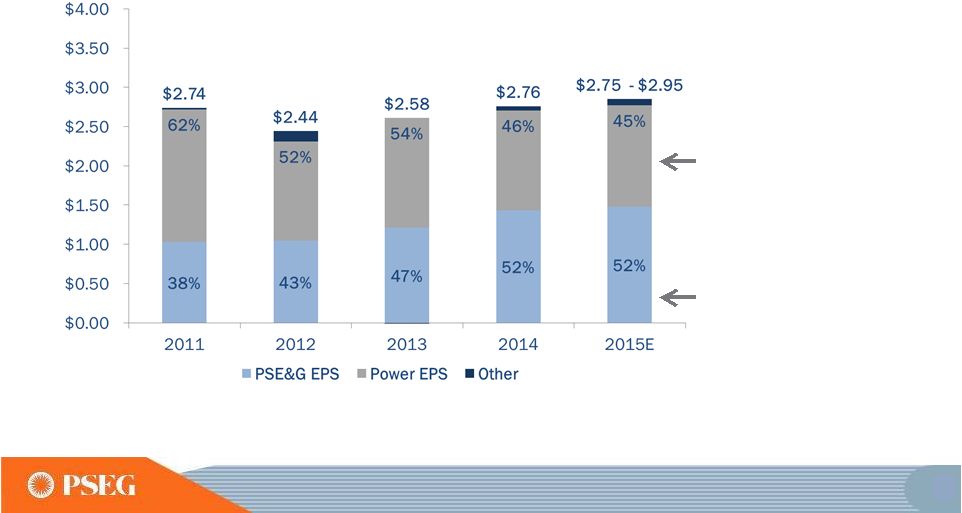 ** ** Operating Earnings Disciplined investment program and focus on operational excellence have supported growth Power’s diverse fuel mix and dispatch flexibility continue to generate strong earnings and free cash flow in low price environment PSE&G’s investment program has driven double digit compound annual earnings growth since 2010 Operating Earnings* Contribution by Subsidiary *SEE SLIDE A FOR
ITEMS EXCLUDED FROM INCOME FROM CONTINUING OPERATIONS/ NET INCOME TO RECONCILE TO OPERATING EARNINGS. E=ESTIMATE
** 2015 PERCENTS USE MIDPOINT OF EARNINGS
GUIDANCE. 8 |
 Gas System Modernization Program of ~$1.6B focusing on aging gas mains • PSE&G’s gas distribution system currently operates and maintains over
4,800 miles of cast iron and unprotected steel main, the largest
such system in any single state
• The program provides for investment of ~$1.6B focused on replacing cast
iron and unprotected steel main over a five-year period,
beginning mid-2016 •
Program will replace approximately 160 miles of main per
year •
Requested accelerated clause-based recovery similar to the
Energy Strong program with a 9.75%
ROE •
This program is the first phase of a long-term, 30-year
cast iron and unprotected steel replacement
plan •
Benefits:
• Methane emission reduction is estimated at 24,500 metric tons of CO
2
equivalent per year*
• Directly creates and supports 500 New Jersey jobs • Higher pressure system allows usage of high efficiency appliances by customers
* EPA SUBPART W METHODOLOGY.
34 |
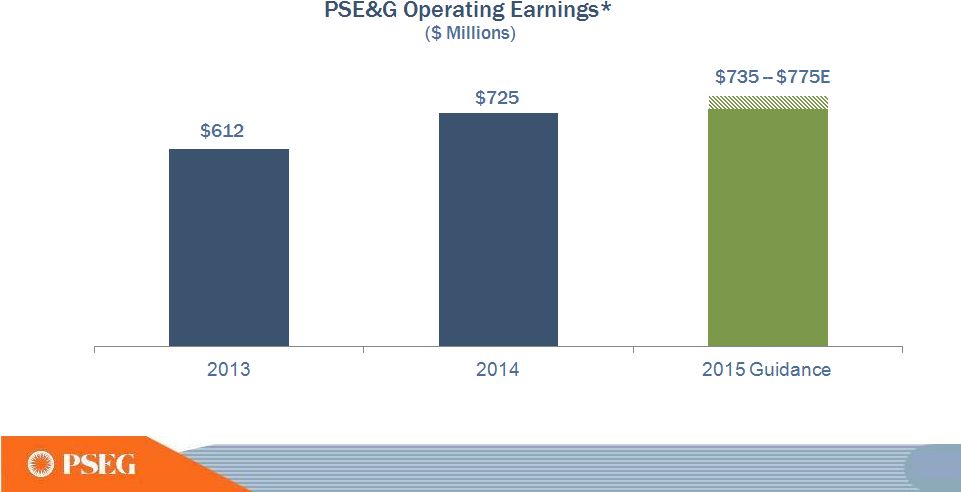 PSE&G’s 2015 operating earnings expected to benefit from increased investment in Transmission
37
*SEE SLIDE A FOR ITEMS EXCLUDED
FROM NET INCOME TO RECONCILE TO OPERATING EARNINGS. E =ESTIMATE. DATA AS OF MARCH 2, 2015. |
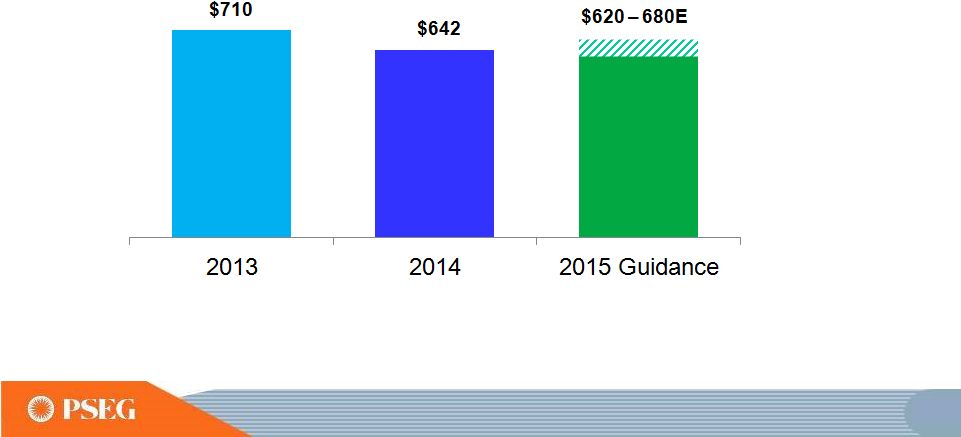 Power’s 2015 operating earnings maintain solid performance Power Operating Earnings* ($ Millions) 2015 Observations • 75-80% hedged at $52/MWh • Increase in average hedge price for energy helps mitigate reset in capacity price and volume * SEE SLIDE A FOR ITEMS EXCLUDED FROM NET INCOME TO RECONCILE TO OPERATING EARNINGS. E
= ESTIMATE. 66
|
 PSEG 2015 Guidance for Operating Income – by Subsidiary and PSEG Power Adjusted EBITDA Anticipates Another Year of Growth in Operating Earnings $ millions (except EPS) 2015E 2014 PSE&G $735 - $775 $725 PSEG Power $620 - $680 $642 PSEG Enterprise/Other $40 - $45 $33 Operating Earnings*
$1,395 -
$1,500
$1,400
Earnings per Share
$2.75 -
$2.95E
$2.76
PSEG Power Adjusted EBITDA**
$ millions (except EPS)
2015E
2014
PSEG Power
$1,545 -
$1,645
$1,584
*
SEE
SLIDE
A
FOR
ITEMS
EXCLUDED
FROM
NET
INCOME
TO
RECONCILE
TO
OPERATING
EARNINGS;
INCLUDES
THE
FINANCIAL
IMPACT
FROM
MARK-TO-MARKET
POSITIONS
WITH
FORWARD
DELIVERY
MONTHS.
**
SEE
SLIDE
B
FOR
A
RECONCILIATION
OF
ADJUSTED
EBITDA
TO
OPERATING
EARNINGS
AND
NET
INCOME.
E
=
ESTIMATE.
96 |
 PSEG Summary • Our 2014 earnings of $2.76 exceeded our revised operating earnings
guidance of $2.60 -
$2.75 per share
• Continued third year of anticipated positive earnings trend in 2015 with
operating earnings guidance of $2.75 to $2.95 per
share •
Continued 5
th
straight year of expected double digit, 5 year growth in rate
base •
Anticipated high single digit earnings growth at PSE&G on
three-year basis from 2014 to 2017, driven by
transmission investments and planned programs •
Power’s
continued
focus
on
operational
excellence,
market
expertise
and
financial strength delivers value in current price
environment •
Strong Balance Sheet and Cash Flow support full capital program
and new potential opportunities without the need
for equity •
Our $0.08 per share dividend increase is consistent with our
long history of returning cash to the shareholder
through the common dividend, with potential for
consistent and sustainable growth 99
|
 Items Excluded from Income from Continuing Operations/Net Income to Reconcile to Operating Earnings PLEASE SEE PAGE 3 FOR AN EXPLANATION OF PSEG’S USE OF OPERATING EARNINGS AS A NON-GAAP FINANCIAL MEASURE AND HOW
IT DIFFERS FROM NET INCOME.
2014 2013 2012 2011 2010 2009 Earnings Impact ($ Millions) Operating Earnings 1,400 $ 1,309 $ 1,236 $ 1,389 $ 1,584 $ 1,567 $ Gain (Loss) on Nuclear Decommissioning Trust (NDT) Fund Related Activity (PSEG Power) 68 40 52 50 46 9 Gain (Loss) on Mark-to-Market (MTM) (PSEG Power) 66 (74) (10) 107 (1) (11) Lease Transaction Activity (PSEG Enterprise/Other) - - 36 (173) - 29 Storm O&M (PSEG Power) (16) (32) (39) - - - Market Transition Charge Refund (PSE&G) - - - - (72) - Gain (Loss) on Asset Sales and Impairments (PSEG Enterprise/Other) - - - 34 - - Income from Continuing Operations 1,518 $ 1,243 $ 1,275 $ 1,407 $ 1,557 $ 1,594 $ Discontinued Operations - - - 96 7 (2) Net Income 1,518 $ 1,243 $ 1,275 $ 1,503 $ 1,564 $ 1,592 $ Fully Diluted Average Shares Outstanding (in Millions) 508 508 507 507 507 507 Per Share Impact (Diluted) Operating Earnings 2.76 $ 2.58 $ 2.44 $ 2.74 $ 3.12 $ 3.09 $ Gain (Loss) on NDT Fund Related Activity (PSEG Power) 0.13 0.08 0.10 0.10 0.09 0.02 Gain (Loss) on MTM (PSEG Power) 0.13 (0.14) (0.02) 0.21 - (0.02) Lease Transaction Activity (PSEG Enterprise/Other) - - 0.07 (0.34) - 0.05 Storm O&M (PSEG Power) (0.03) (0.07) (0.08) - - - Market Transition Charge Refund (PSE&G) - - - - (0.14) - Gain (Loss) on Asset Sales and Impairments (PSEG Enterprise/Other) - - - 0.06 - - Income from Continuing Operations 2.99 $ 2.45 $ 2.51 $ 2.77 $ 3.07 $ 3.14 $ Discontinued Operations - - - 0.19 0.01 - Net Income 2.99 $ 2.45 $ 2.51 $ 2.96 $ 3.08 $ 3.14 $ (Unaudited) For the Year Ended December 31, PUBLIC SERVICE ENTERPRISE GROUP INCORPORATED Reconciling Items, net of tax (a) Includes the financial impact from positions with forward delivery months.
A
(a) (a) |
 B Items Excluded from Net Income to Reconcile to Operating Earnings and Adjusted EBITDA PLEASE SEE PAGE 3 FOR AN EXPLANATION OF PSEG’S USE OF OPERATING EARNINGS AND ADJUSTED EBITDA AS NON-GAAP
FINANCIAL MEASURES AND HOW THEY DIFFER FROM NET
INCOME. 2015
2014 Adjusted EBITDA 626 $ 651 $ 1,584 $ Fossil Major Maintenance, pre-tax (49) (58) (144) Depreciation and Amortization, pre-tax (b) (77) (73) (291) Interest Expense, pre-tax (b) (31) (31) (120) Income Taxes (b) (191) (196) (387) Operating Earnings 278 $ 293 $ 642 $ Gain (Loss) on NDT Fund Related Activity, pre-tax 7 19 138 Gain (Loss) on MTM, pre-tax (a) (34) (223) 111 Storm O&M, net of insurance recoveries, pre-tax 127 (10) (27) Income Taxes related to Operating Earnings reconciling items (43) 85 (104) Net Income 335 $ 164 $ 760 $ (a) Includes the financial impact from positions with forward delivery months. (b) Excludes amounts related to Operating Earnings reconciling items ($ Millions, Unaudited) PSEG Power Adjusted EBITDA Reconcilation Year Ended December 31, 2014 Reconciling Items Three Months Ended March 31, B |