Attached files
| file | filename |
|---|---|
| 8-K - 8-K - Gogo Inc. | d935365d8k.htm |
 June 4,
2015 Leveraged Finance
Conference Presentation Exhibit 99.1 |
 ©2015 Gogo Inc. and Affiliates. Proprietary & Confidential.
2 SAFE HARBOR STATEMENT 2 This presentation contains “forward-looking statements” within the meaning of Section 27A of the Securities Act of 1933 and Section 21E of the Securities Exchange Act of 1934 that are based on management’s beliefs and assumptions and on information currently available to management. Most forward-looking statements contain words that identify them as forward-looking, such as “anticipates,” “believes,” “continues,” “could,” “seeks,” “estimates,” “expects,” “intends,” “may,” “plans,” “potential,” “predicts,” “projects,” “should,” “will,” “would” or similar expressions and the negatives of those terms that relate to future events. Forward-looking statements involve known and unknown risks, uncertainties and other factors that may cause Gogo’s actual results, performance or achievements to be materially different from any projected results, performance or achievements expressed or implied by the forward-looking statements. Forward-looking statements represent the beliefs and assumptions of Gogo only as of the date of this presentation and Gogo undertakes no obligation to update or revise publicly any such forward-looking statements, whether as a result of new information, future events or otherwise. As such, Gogo’s future results may vary from any expectations or goals expressed in, or implied by, the forward-looking statements included in this presentation, possibly to a material degree.
Gogo cannot assure you that the assumptions made in preparing any of the forward-looking statements will prove accurate or that any long-term financial or operational goals and targets will be realized. In particular, the availability and performance of certain technology solutions yet to be implemented by the Company set forth in this presentation represent aspirational long-term goals based on current expectations. For a discussion of some of the important factors that could cause Gogo’s results to differ materially from those expressed in, or implied by, the forward-looking statements included in this presentation, investors should refer to the disclosure contained under the headings “Risk Factors” and “Cautionary Note Regarding Forward-Looking Statements” in the Company’s Annual Report on Form 10-K filed with the SEC on February 27, 2015. Note to Certain Operating and Financial Data In addition to disclosing financial results that are determined in accordance with U.S. generally accepted accounting principles (“GAAP”), Gogo also discloses in this presentation certain non-GAAP financial information, including Adjusted EBITDA and Cash CapEx. These financial measures are not recognized measures under GAAP, and when analyzing our performance or liquidity, as applicable, investors should (i) use Adjusted EBITDA in addition to, and not as an alternative to, net loss attributable to common stock as a measure of operating results, and (ii) use Cash CAPEX in addition to, and not as an alternative to, consolidated capital expenditures when evaluating our liquidity. In addition, this presentation contains various customer metrics and operating data, including numbers of aircraft or units online, that are based on internal company data, as well as information relating to the commercial and business aviation market, and our position within those markets. While management believes such information and data are reliable, they have not been verified by an independent source and there are inherent challenges and limitations involved in compiling data across various geographies and from various sources. |
 ©2015 Gogo Inc. and Affiliates. Proprietary & Confidential.
KEY CREDIT HIGHLIGHTS
3 LARGE GROWTH OPPORTUNITY LARGE GROWTH OPPORTUNITY HIGH BARRIERS TO ENTRY HIGH BARRIERS TO ENTRY EXPERIENCE & SCALE EXPERIENCE & SCALE LEADING POSITION LEADING POSITION ATTRACTIVE ECONOMICS ATTRACTIVE ECONOMICS |
   MARKET
& COMPANY OVERVIEW |
 ©2015 Gogo Inc. and Affiliates. Proprietary & Confidential.
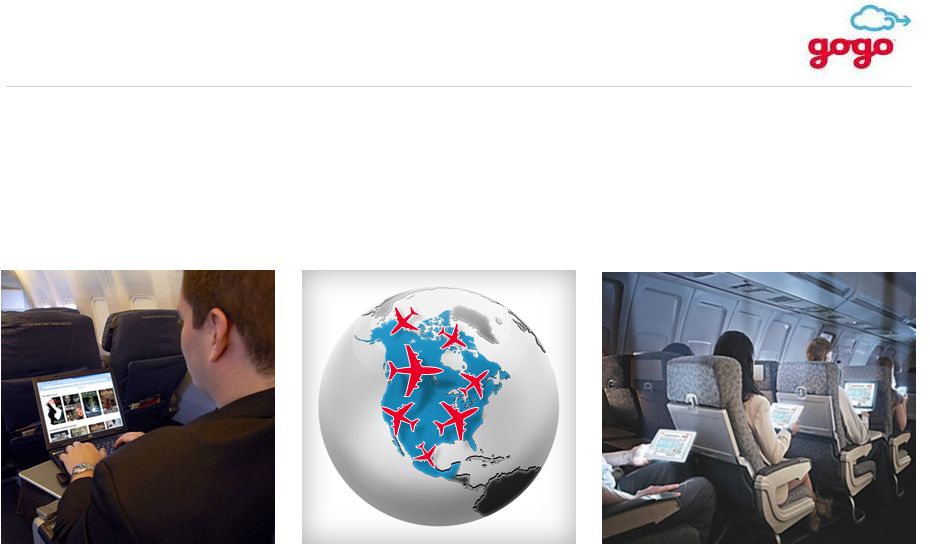
AVIATION INTERNET TRENDS
5 1 2 3 4 5 Connected aircraft transform global aviation – the last frontier of internet connectivity Cost, coverage, capacity and reliability are just now reaching critical
inflection points
Next gen technologies expected to increase speeds from 10 to 100Mbps
within 5 years with a comparable reduction in
costs More bandwidth drives demand from business traveler
connectivity today to every person and most
‘things’ on aircraft in 10 years Airlines will
demand ‘Always Available Everywhere for Every
Plane’ |
 ©2015 Gogo Inc. and Affiliates. Proprietary & Confidential.
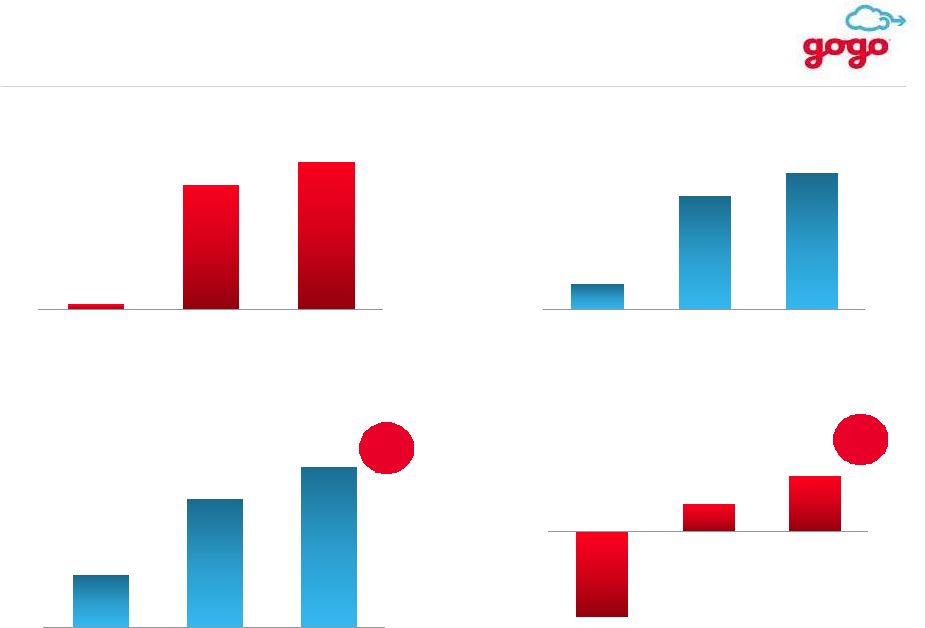
CA - North America (“CA-NA”) 1.4x 1.2x CA - Rest of World (“CA-ROW”) 2.3x (1) Source: Boeing Current Market Outlook 2014 – 2033, excludes: cargo aircraft. (2) Source: JetNet iQ Report Q4 2014; General Aviation Manufacturers Association 2014 Statistical Databook, excludes Rest of World turbo props. ADDRESSABLE CONNECTED AIRCRAFT ADDRESSABLE CONNECTED AIRCRAFT Commercial Aviation (“CA”) Commercial Aviation (“CA”) Business Aviation (“BA”) Business Aviation (“BA”) 2.6x size of CA-NA 2.6x size of CA-NA A LARGE AND GROWING GLOBAL CONNECTED AVIATION MARKET The connected aircraft industry is worth up to $30 billion The connected aircraft industry is worth up to $30 billion 6 5,300 7,300 2013 2033F 13,900 32,000 2013 2033F 30,300 37,800 2014 2024F (1) (2) |
 ©2015 Gogo Inc. and Affiliates. Proprietary & Confidential.
Largest Market Share in CA-NA
Largest Market Share in CA-NA
GOGO’S IMPRESSIVE SCALE AND REACH
Largest Market Share in BA
Largest Market Share in BA
2,200 524 349 154 Global Eagle Thales/LiveTV Panasonic 68% of connected aircraft Note: Data based on management estimates, trade publications and other public sources as of 3/31/2015
(1) Gogo satellite business aircraft includes 5,402 aircraft online comprised of 5,353
Iridium equipped aircraft and 49 SwiftBroadband equipped aircraft as of 3/31/15 (2) Based on management estimates as of 3/31/2015 (3) Includes Gogo awarded aircraft as of 5/7/2015 2,983 400 ViaSat 5,353 3,144 Competitors Broadband Narrowband #1 Global in-flight connectivity provider Leader in North America and expanding internationally #1 Global in-flight connectivity provider Leader in North America and expanding internationally 7 Untapped CA-ROW market Untapped CA-ROW market 318 10,700 Available Aircraft 88% of broadband aircraft 63% of Iridium satellite aircraft 1 2Ku – Leading global satellite technology – 300+ aircraft to be installed w/ 2Ku Awarded Aircraft (2) (2) (2) (3) |
 ©2015 Gogo Inc. and Affiliates. Proprietary & Confidential.
LONG-TERM PARTNERSHIPS WITH OUR MAJOR
AVIATION PARTNERS
8 North America North America Original Equipment Manufacturers Original Equipment Manufacturers Fractional Jet Operators Fractional Jet Operators Commercial Aviation Commercial Aviation Business Aviation Business Aviation International International |
 ©2015 Gogo Inc. and Affiliates. Proprietary & Confidential.
9 WHY WE WIN Specialize in aviation and telecom Specialize in aviation and telecom Excellent reliability Excellent reliability Superior technology & economics Superior technology & economics End-to-end service provider End-to-end service provider 1 2 3 4 |
 ©2015 Gogo Inc. and Affiliates. Proprietary & Confidential.
10 WE SPECIALIZE IN AIRCRAFT AND HAVE A TRACK RECORD OF INNOVATION ATG / ATG-4 1 st generation of technology North America coverage 2Ku 2 nd generation of technology Global coverage Intellectual Property 100+ patents globally Other Aviation Innovations Leader in wireless in-flight entertainment: 1,800+ aircraft installed Other industry leading IFC & IFE product innovations: Crew Connect, Text & Talk, Universal Cabin System, and others 1 2 3 4 EXPERTISE IN INTERNET, AVIATION AND TELECOM EXPERTISE IN INTERNET, AVIATION AND TELECOM |
 ©2015 Gogo Inc. and Affiliates. Proprietary & Confidential.
Technology
Region Peak Speed Key Attributes Iridium Global 2.4 Kbps - Low data speeds Swift Broadband Global 432 Kbps - Low data speeds ATG / ATG-4 Regional 3.1 / 9.8 Mbps - Overnight install - Suits all aircraft types - Lower latency vs. satellite 2Ku Global 70-100 Mbps - 2x spectrally efficient vs. Ku / Ka band - Lower profile radome - More robust and reliable Expected 2015 Launch Ku Band Global 50 Mbps - Global coverage - Multiple suppliers Ka Band Global 50 Mbps - Spot beam technology - Next Generation Expected 2015 Launch Expected 2015 Launch (Regional) Expected 2015 Launch Global Eagle Broadest suite of technologies and full fleet connectivity solutions
Proprietary 2Ku technology: higher peak speed (70-100 Mbps) than
competitors at half the bandwidth cost ATG / ATG-4:
fastest deployment time (overnight) and lightest equipment
Broadest suite of technologies and full fleet connectivity
solutions Proprietary 2Ku technology: higher peak speed
(70-100 Mbps) than competitors at half the bandwidth cost
ATG / ATG-4: fastest deployment time (overnight) and lightest
equipment LARGEST TECHNOLOGY PORTFOLIO
11 |
 ©2015 Gogo Inc. and Affiliates. Proprietary & Confidential.
12 EXCELLENT RELIABILITY 75+ million sessions 7,800+ flights per day 98% + ATG End-to-End System Availability Source: Company information |
 ©2015 Gogo Inc. and Affiliates. Proprietary & Confidential.
13 THE MOST COMPLETE END-TO-END AVIATION SERVICE PROVIDER Real-time credit card processing Real-time weather information Other applications to enhance airlines operational efficiency Account support Network monitoring and management Passenger support services, portal design, developing and hosting Airborne equipment for ATG and satellite Certification, installation, maintenance, etc. Passenger connectivity Passenger entertainment Portal content ATG / ATG-4 for North America 2Ku / Ku / Ka for global satellite service Passenger Services Equipment and Equipment Related Services Airline / Owner / Operator Services Operations-Oriented Communications Services Global Network Solutions |
 FINANCIALS AND CAPITAL STRUCTURE |
 ©2015 Gogo Inc. and Affiliates. Proprietary & Confidential.
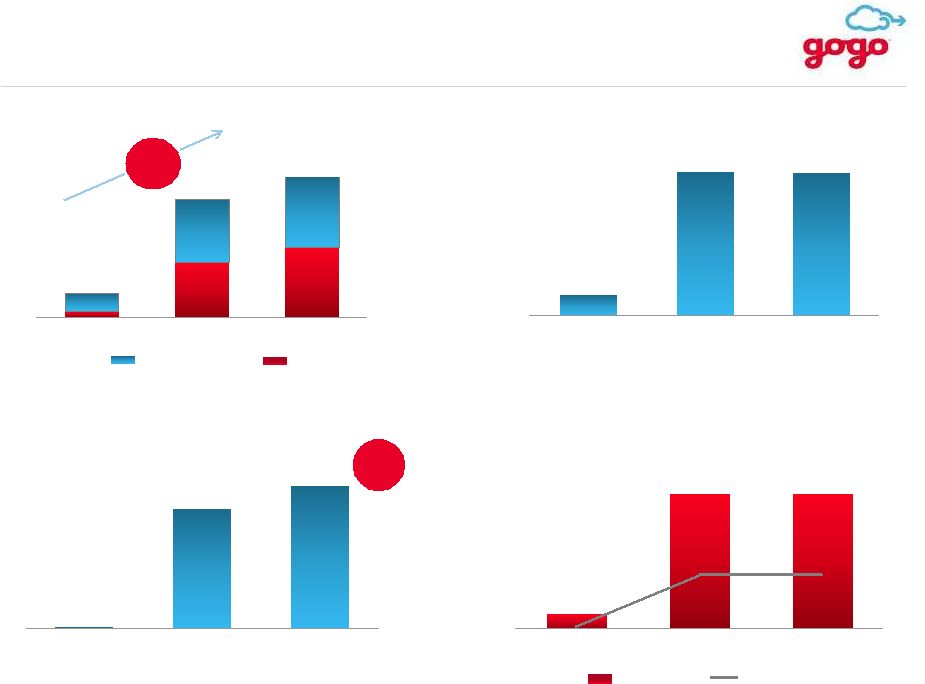
15 GROWING REVENUE DRIVES PROFITABILITY Note: Minor differences exist due to rounding (1) Please see reconciliation of Adjusted EBITDA in appendix Adjusted EBITDA (1) ($MM) $37 $160 $328 $408 $428 2009 2011 2013 2014 Q1 2015 LTM ($89) ($1) $8 $11 $14 $41 $78 $80 2009 2011 2013 2014 Q1 2015 LTM $49 CA-ROW Segment Loss Revenue
($MM) 62% CAGR $89 Adjusted EBITDA $93 |
 ©2015 Gogo Inc. and Affiliates. Proprietary & Confidential.
16 CA - NA: REVENUE AND SEGMENT PROFIT GROWTH Note: Minor differences exist due to rounding (1) We define ARPA as the aggregate service revenue for the annual period divided by the number of aircraft online during that period
$11 $251 $266 2009 2014 Q1 2015 LTM Revenue ($MM) $24 $121 $127 2009 2014 Q1 2015 LTM Annualized ARPA (1) ($000s) $(91) $26 $30 2009 2014 Q1 2015 LTM Segment Profit ($MM) 11% Margin 692 2,098 2,200 2009 2014 Q1 2015 Aircraft Online (End of Period) 102 Q/Q Increase |
 ©2015 Gogo Inc. and Affiliates. Proprietary & Confidential.
$6 $72 $78 $20 $84 $81 2009 2014 Q1 2015 LTM 17 BA: HIGH-MARGIN SERVICE REVENUE DRIVES PROFITABILITY AND CASH FLOW $26 $156 $159 Equipment Revenue Service Revenue Revenue ($MM) $3 $63 $63 11% 40% 40% 2009 2014 Q1 2015 LTM Segment Profit ($MM) Segment Profit Margin Segment Profit 49 2,797 2,983 2009 2014 Q1 2015 ATG Aircraft Online (End of Period) 186 Q/Q Increase 139 943 936 2009 2014 Q1 2015 LTM ATG Units Shipped Note: Minor differences exist due to rounding. 43% CAGR |
 ©2015 Gogo Inc. and Affiliates. Proprietary & Confidential.
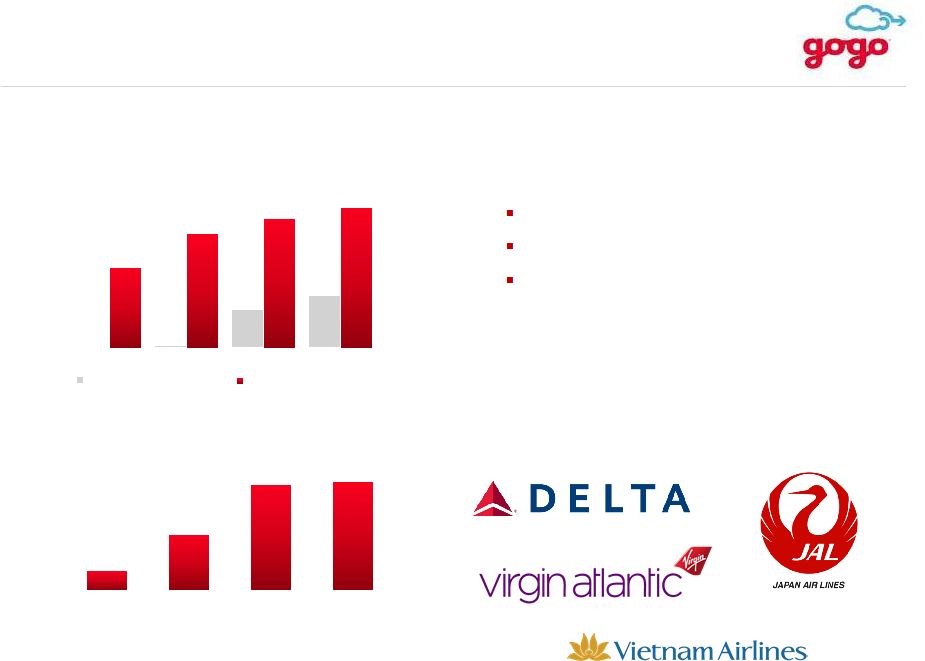
18 116 aircraft online as of 3/31/2015 Near global Ku-band satellite network 2Ku technology selected by 6 airlines for trial or adoption 1 85 116 180 257 293 318 2012 2013 2014 Q1 2015 Aircraft Online (end of period) Cumulative Aircraft Awards (1) Figures reflect aircraft under non-binding agreements (2) Includes Gogo awarded aircraft as of 5/7/2015 $14 $41 $78 $80 2012 2013 2014 Q1 2015 LTM International Aircraft Wins (cumulative) Executing Our International Expansion CA-ROW Segment Loss ($MM) International Partners CA - ROW: FOCUS ON INTERNATIONAL EXPANSION (1) (2) |
 ©2015 Gogo Inc. and Affiliates. Proprietary & Confidential.
19 NORMALIZED CAPEX MODEL (1) Please see reconciliation of Cash CapEx in the Appendix Gross CapEx Capitalized software Airborne equipment Network equipment Over the past two years, Gogo’s Cash CapEx has been stable at ~$100 million Over the past two years, Gogo’s Cash CapEx has been stable at ~$100 million Equipment proceeds received from airlines and landlord incentives Cash CapEx (1) |
 ©2014 Gogo Inc. and Affiliates. Proprietary & Confidential.
GOGO CAPITAL STRUCTURE
Note: Senior Unsecured Convertible Notes and total debt represent the principal amounts
outstanding, which includes amounts treated as equity for accounting
purposes. Balance ($MM)
3/31/2015
Cash & Cash Equivalents
$400 Senior Secured Credit Facility $307 Senior Unsecured Convertible Notes $362 Total Debt $669 Total Net Debt $269 Senior Secured Credit Facility ($MM) Tranche Amount 3/31/2015 LIBOR Floor Margin Maturity Next Call Date Call Premium Tranche B-1 Loan $232 1.5% L+975 3/21/2018 12/21/2015 103 Tranche B-2 Loan $74 1.0% L+650 3/21/2018 12/21/2015 103 Senior Unsecured Convertible Notes ($MM) Amount 3/31/2015 Coupon Maturity Convertible Notes $362 3.75% 3/1/2020 20 |
 ©2015 Gogo Inc. and Affiliates. Proprietary & Confidential.
Attractive Credit
Attractive Credit
Large growth opportunity
Large growth opportunity
Attractive Economics
Attractive Economics
Leading position, high barriers to entry
Leading position, high barriers to entry
Experience & Scale
Experience & Scale
Focused Strategy
Focused Strategy
Gain global share
Gain global share
Grow ARPA
Grow ARPA
Increase bandwidth to aircraft
Increase bandwidth to aircraft
Deliver consistent execution
Deliver consistent execution
KEY CREDIT HIGHLIGHTS
Gogo is a leading aero
communications service provider for the global aviation industry
21 |
 Q&A |
 APPENDIX |
 ©2015 Gogo Inc. and Affiliates. Proprietary & Confidential.
24 ADJUSTED EBITDA RECONCILIATION ($MM) 2009 2010 2011 2012 2013 2014 Q1 2014 Q2 2014 Q3 2014 Q4 2015 Q1 Net Income (142) (140) (18) (96) (146) (17) (19) (25) (24) (20) Interest Income (0) (0) (0) (0) (0) (0) (0) (0) (0) (0) Interest Expense 30 – 1 9 29 7 7 9 9 10 Income Tax Provision – 3 1 1 1 – – – – – Depreciation & Amortization 22 31 33 37 56 16 15 17 17 19 EBITDA (91) (106) 16 (49) (60) 6 4 2 2 9 Fair Value Derivative Adjustments – 33 (59) (10) 36 – – – – – Class A and Class B Senior Convertible Preferred Stock Return – 18 31 52 29 – – – – – Accretion of Preferred Stock – 9 10 10 5 – – – – – Stock-based Compensation Expense 1 2 2 4 6 2 2 3 3 3 Loss on Extinguishment of Debt 2 – – – – – – – – – Write Off of Deferred Equity Financing Costs – – – 5 – – – – – – Amortization of Deferred Airborne Lease Incentives – (1) (1) (4) (8) (3) (3) (4) (4) (4) Adjusted EBITDA (89) (45) (1) 9 8 5 3 1 1 8 Note: Minor differences exist due to rounding |
 ©2015 Gogo Inc. and Affiliates. Proprietary & Confidential.
25 CASH CAPEX RECONCILIATION ($MM) 2009 2010 2011 2012 2013 2014 Q1 2014 Q2 2014 Q3 2014 Q4 2015 Q1 Purchases of Property and Equipment (69) (33) (33) (67) (105) (32) (28) (35) (37) (53) Acquisition of Intangible Assets (Capitalized Software) (8) (7) (10) (12) (16) (4) (5) (5) (3) (4) Consolidated Capital Expenditures (77) (40) (43) (79) (121) (36) (33) (41) (40) (57) Change in Deferred Airborne Lease Incentives – 9 11 18 9 5 3 5 17 9 Amortization of Deferred Airborne Lease Incentives – 1 1 4 8 3 3 3 4 4 Landlord Incentives – – – – – – – 2 7 12 Cash CapEx (77) (30) (31) (58) (104) (29) (27) (30) (12) (32) Note: Minor differences exist due to rounding |