Attached files
| file | filename |
|---|---|
| 8-K - FORM 8-K - Federal Home Loan Bank of New York | d936816d8k.htm |
 FHLBNY:
Strong Performance for Customers and Shareholders
Stockholders Meeting
June 4, 2015 Exhibit 99.1 © 2015 FEDERAL HOME LOAN BANK OF NEW YORK • 101 PARK AVENUE • NEW YORK, NY 10178 • WWW.FHLBNY.COM
|
 FHLBNY » “Advances Bank” strategy » Strong performance record for customers and shareholders » Conservatively positioned balance sheet » FHLBank System’s financial results have improved since the financial crisis Key Messages 2 |
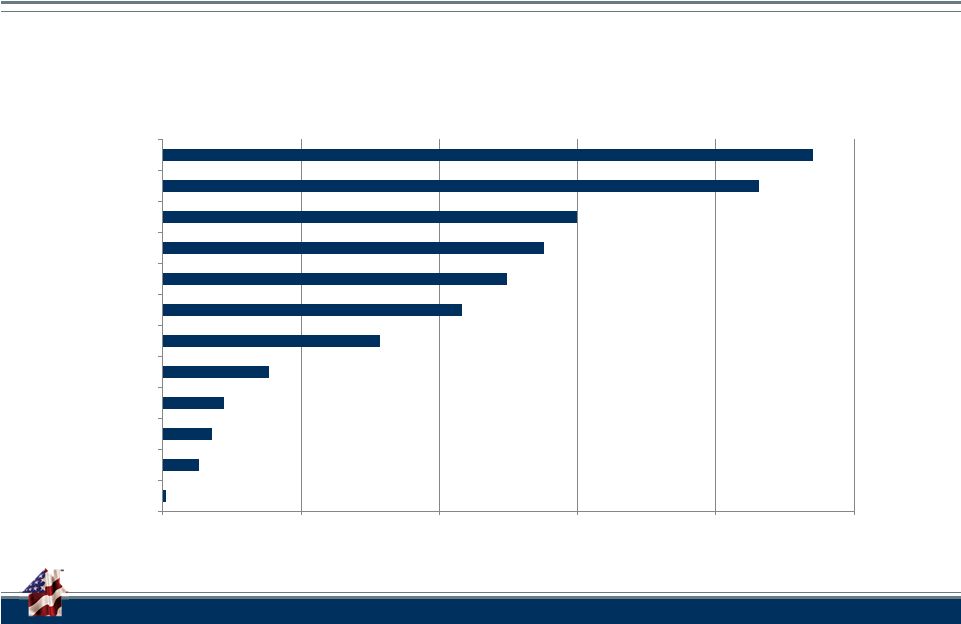
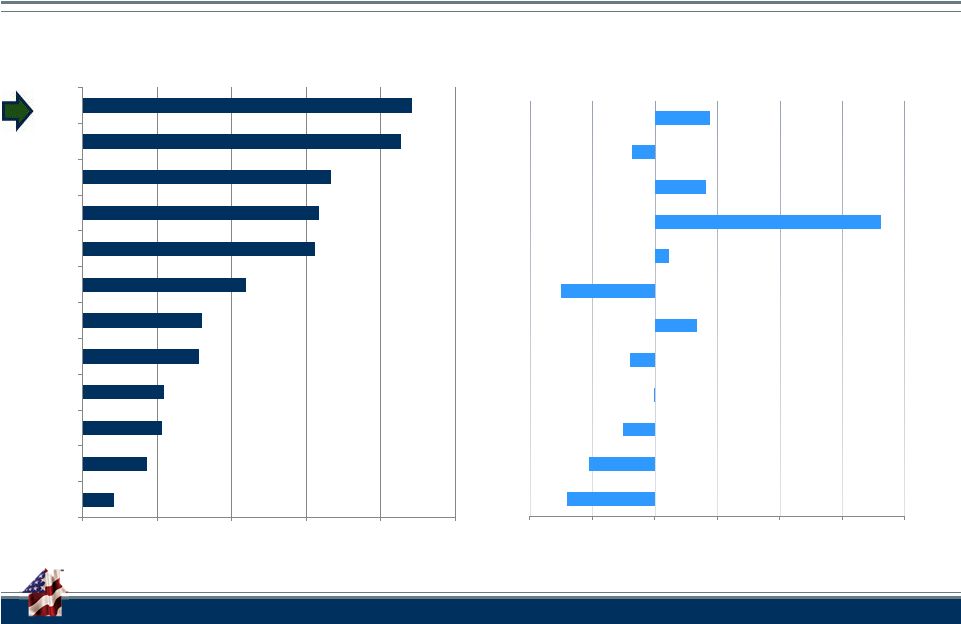 FHLBNY FHLBNY is the Largest Home Loan Bank as Measured by Advances and 2 nd Largest by Asset Balances Total Advances ($ Billions) Change in Advances: 2Q07 vs 1Q15 Note: As of March 31, 2015 $0 $20 $40 $60 $80 $100 SEA DAL TOP IND BOS CHI SFR PIT DSM CIN ATL NYK -70% -53% -25% -1% -20% 34% -74% 12% 181% 41% -18% 45% -100% -50% 0% 50% 100% 150% 200% SEA DAL TOP IND BOS CHI SFR PIT DSM CIN ATL NYK 3 |
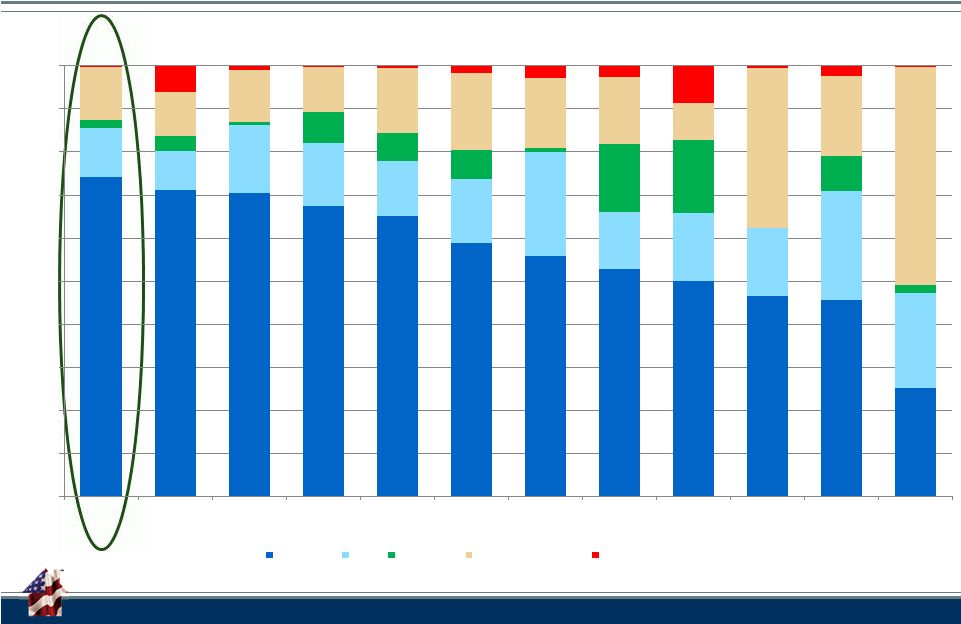 FHLBNY 0% 10% 20% 30% 40% 50% 60% 70% 80% 90% 100% NYK PIT ATL CIN DSM BOS SFR TOP IND DAL CHI SEA Advances MBS MPF/MPP Other Investments Cash and Other We Have Consistently Maintained a High Percentage of Advances Relative to Assets HLBanks Balance Sheet Mix 4 Note: As of March 31, 2015 4 |
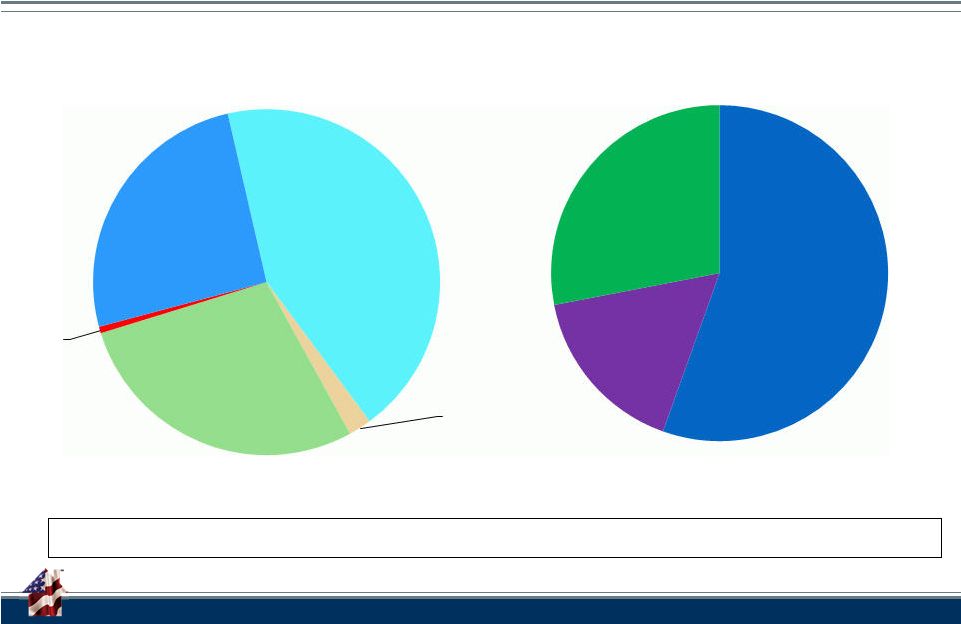 FHLBNY 5 FHLBNY’s Member Base is Diverse Total Advances (Par) = $86.8 B Top Borrowers Member Type Advances to Puerto Rico members totaled $1.3 billion. Note: As of March 31, 2015 Commercial Bank 143 Insurance Company 7 Savings Bank 93 CDFI 2 Credit Union 84 Top 5 Borrowers $48.2 Next 5 Borrowers $14.3 All Other Borrowers $24.3 |
 FHLBNY 6 The Bank’s Financial Performance Has Been Strong FHLBNY - Financial Results Highlights March 31, 2015 December 31, 2014 December 31, 2013 December 31, 2012 Period End Balances Advances $88,524 $98,797 $90,765 $75,888 MBS Investments* 13,589 13,552 13,373 12,620 Total Assets 119,379 132,825 128,333 102,989 Consolidated Obligations 111,007 123,580 119,146 94,564 Capital Stock 5,112 5,580 5,571 4,797 Retained Earnings 1,107 1,083 999 894 Results Net Interest Income $119 $444 $421 $467 Operating Expenses 23 86 83 83 Net Income 88 315 305 361 Notes: All $ millions. * 97% of the bank’s MBS investments are GSE securities.
6 |
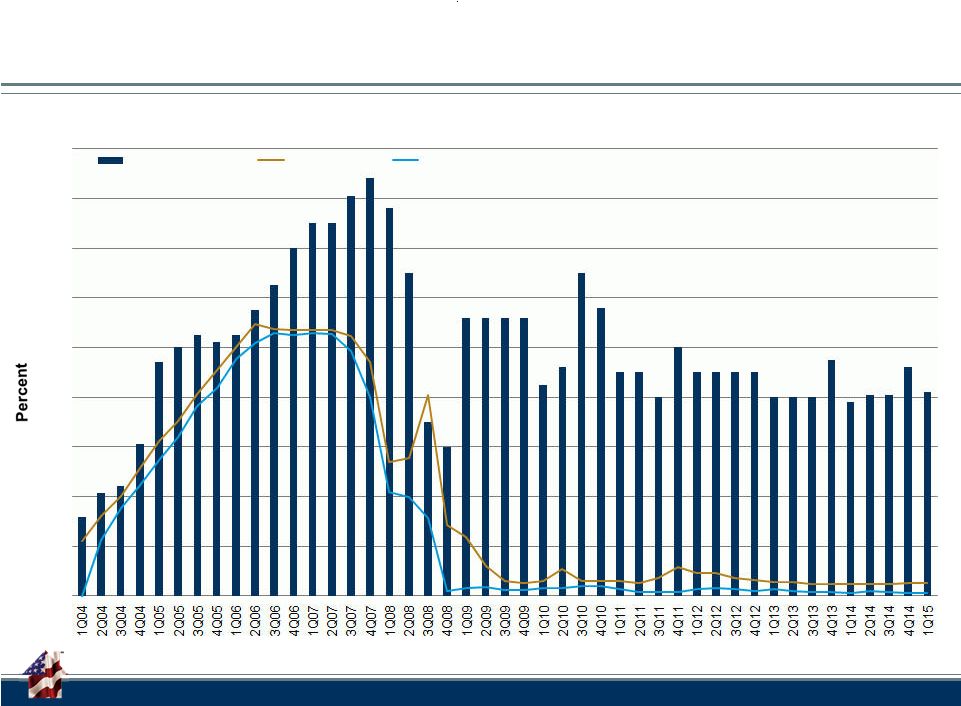 FHLBNY 7 Our Dividends Have Been Reliable and Exceeded Market Reference Rates FHLBNY Dividend History 0.0 1.0 2.0 3.0 4.0 5.0 6.0 7.0 8.0 9.0 FHLBNY Dividend 3 Month Libor Fed Funds (Effective Rate) |
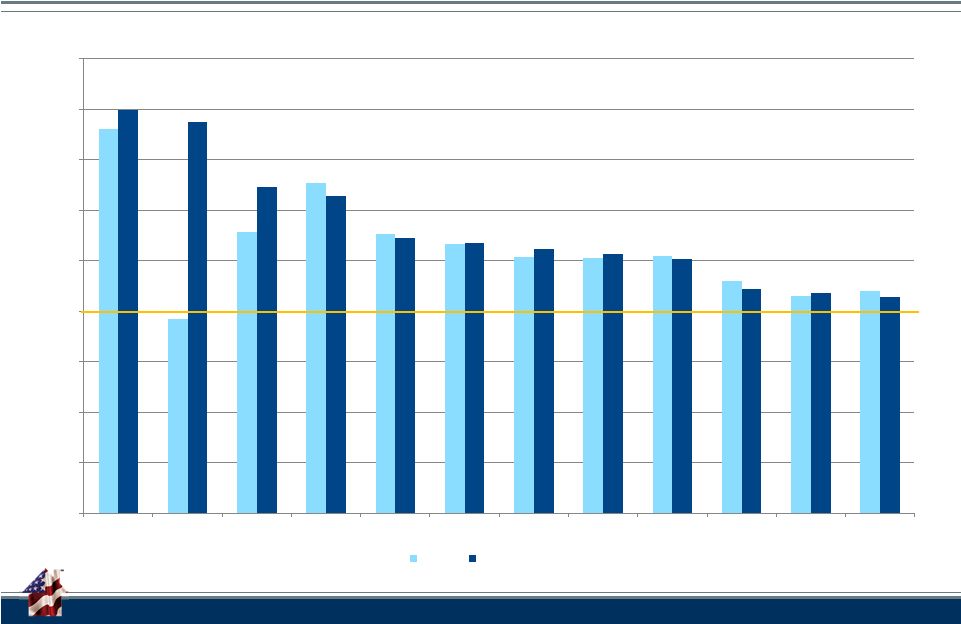
 FHLBNY 8 FHLBNY Dividend Returns Have Exceeded Those of Other FHLBanks 0% 1% 2% 3% 4% 5% SEA CHI DAL BOS PIT ATL SFR DSM TOP IND CIN NYK Average HLB Dividend Rates 2009-2014 |
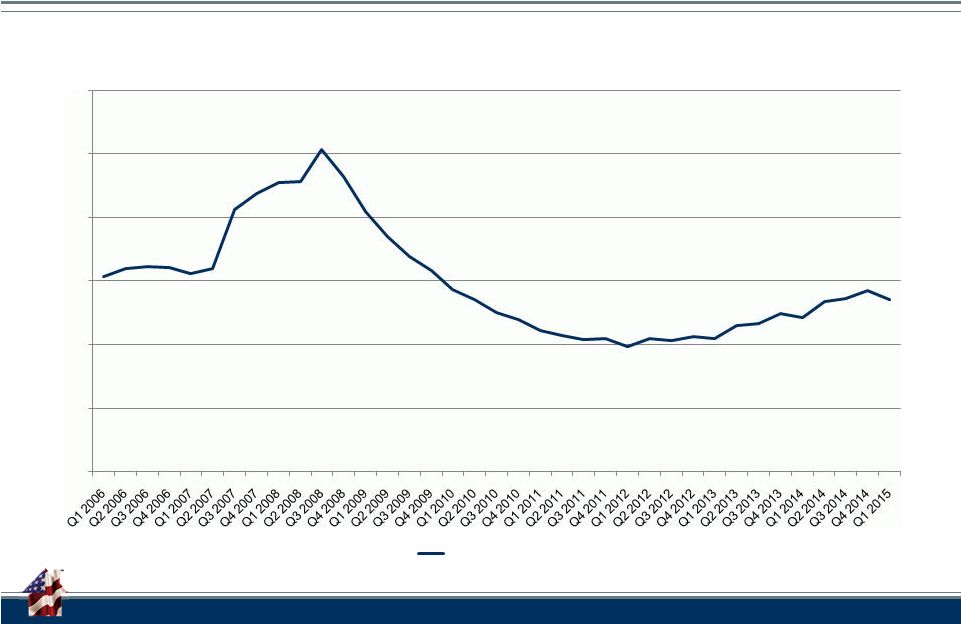 FHLBNY FHLBank Balance Sheets Are Scalable to Meet Member Liquidity Needs 0 200,000 400,000 600,000 800,000 1,000,000 1,200,000 HLBank System Advances Balances FHLB System 9 |
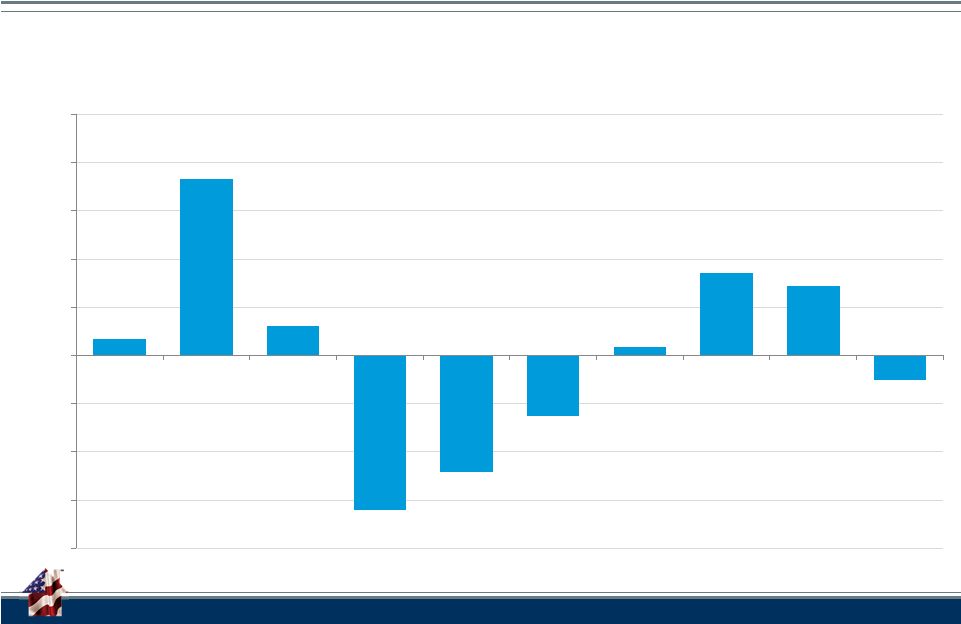 FHLBNY 3.4% 36.6% 6.1% -32.0% -24.2% -12.6% 1.8% 17.1% 14.5% -5.0% -40% -30% -20% -10% 0% 10% 20% 30% 40% 50% 2006 2007 2008 2009 2010 2011 2012 2013 2014 1Q15 System Advances Decreased During the First Quarter After Strong Growth in 2013 and 2014 10 HLB System Change in Advance Balances |
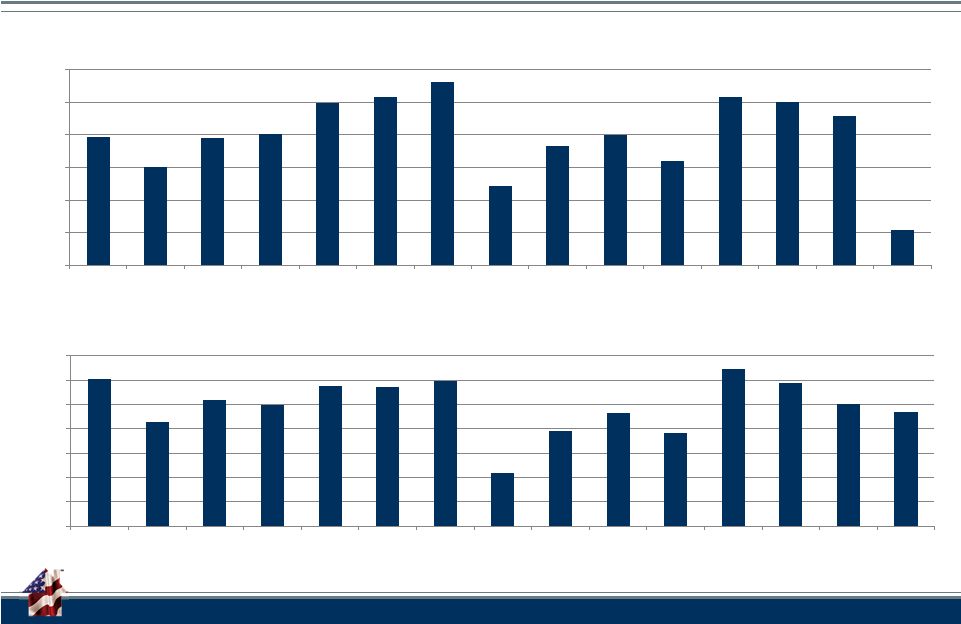 FHLBNY System Financial Performance Has Improved Considerably Since the Financial Crisis FHLBank System Net Income: 2001-1Q 2015 ($Millions) 11 FHLBank System ROE: 2001-1Q 2015 $0 $500 $1,000 $1,500 $2,000 $2,500 $3,000 2001 2002 2003 2004 2005 2006 2007 2008 2009 2010 2011 2012 2013 2014 Q1 2015 0.00% 1.00% 2.00% 3.00% 4.00% 5.00% 6.00% 7.00% 2001 2002 2003 2004 2005 2006 2007 2008 2009 2010 2011 2012 2013 2014 1Q 2015 11 Note: The calculation of ROE and Net Income in the charts excluded $480 mm the gains PLMBS on litigation settlements in the 1Q
2015 |
 FHLBNY Retained Earnings Grew Four-fold Since the End of 2008 While System Assets Declined 35% HLBank System: Retained Earnings Growth 12 Notes: URE = Unrestricted Retained Earnings. RRE = Restricted Retained Earnings.
Retained earnings and capital stock are defined on a regulatory basis.
0% 5% 10% 15% 20% 25% 30% 35% 40% 45% 50% $- $2 $4 $6 $8 $10 $12 $14 2003 2004 2005 2006 2007 2008 2009 2010 2011 2012 2013 2014 1Q 2015 $Billion URE (LHS) RRE (LHS) %RE/Capital Stock (RHS) |
 FHLBNY 0.00% 1.00% 2.00% 3.00% 4.00% 5.00% 6.00% 7.00% 8.00% 9.00% SFR SEA BOS CHI IND DAL NYK CIN ATL PIT TOP DSM GAAP Regulatory All FHLBanks Exceed Minimum Regulatory Capital Requirements FHLBanks Capital-to-Assets Ratio 13 Note: As of March 31, 2015 |
 Advancing Housing and Community Growth
The information provided by the Federal Home Loan Bank of New York (FHLBNY) in this communications is set forth for informational purposes only. The information should not be construed as an opinion, recommendation or solicitation regarding the use of any financial strategy and/or the purchase or sale of any financial instrument. All customers are advised to conduct their own independent due diligence before making any financial decisions. Please note that the past performance of any FHLBNY service or product should not be viewed as a guarantee of future results. Also, the information presented here and/or the services or products provided by the FHLBNY may change at any time without notice. Questions? 101 PARK AVENUE • NEW YORK, NY 10178 • WWW.FHLBNY.COM |
 FHLBNY
Business Update Stockholders’ Meeting
June 4, 2015 © 2015 FEDERAL HOME LOAN BANK OF NEW YORK • 101 PARK AVENUE • NEW YORK, NY 10178 • WWW.FHLBNY.COM |
 FHLBNY FHLBNY Mission 2 To advance housing opportunity and local community development by maximizing the capacity of community-based member-lenders to serve their markets.
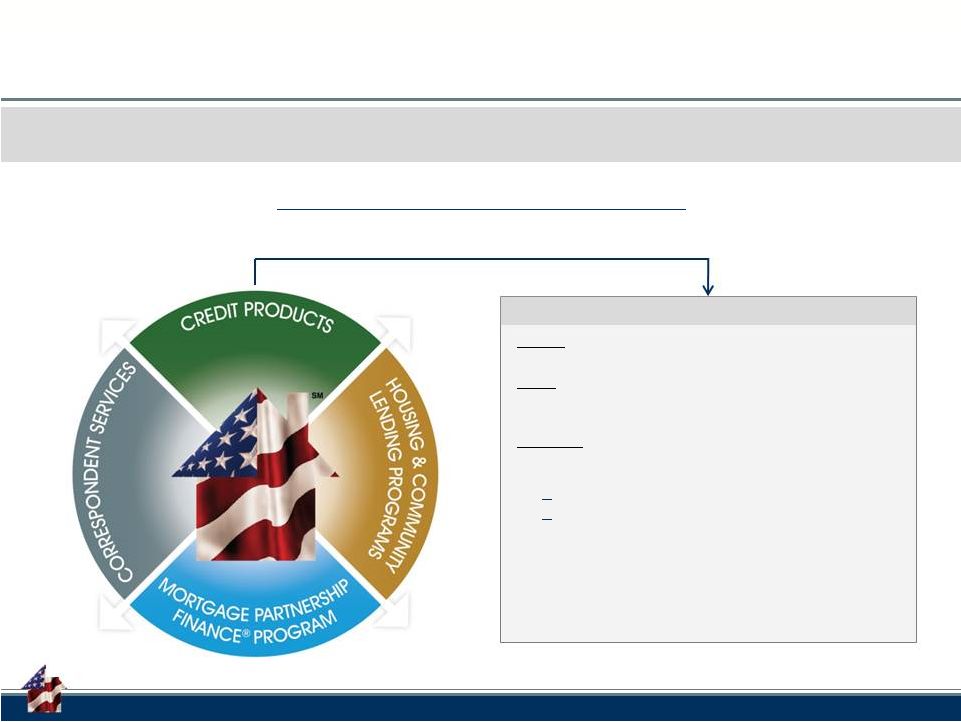
The four business lines help meet members’ needs & achieve the FHLBNY
Mission. FHLBNY LINES OF BUSINESS
TENOR: » Overnight to 30 years TERM: » Fixed Rate, Floating Rate, Callable, Putable, Forward Starting, or Amortizing PURPOSE: » Liquidity management » Asset/liability management Transactional micro hedges Balance sheet macro hedges » Minimizing liability costs » Wholesale leveraging » Funding retail loan growth » Prefunding branches Advance Characteristics: |
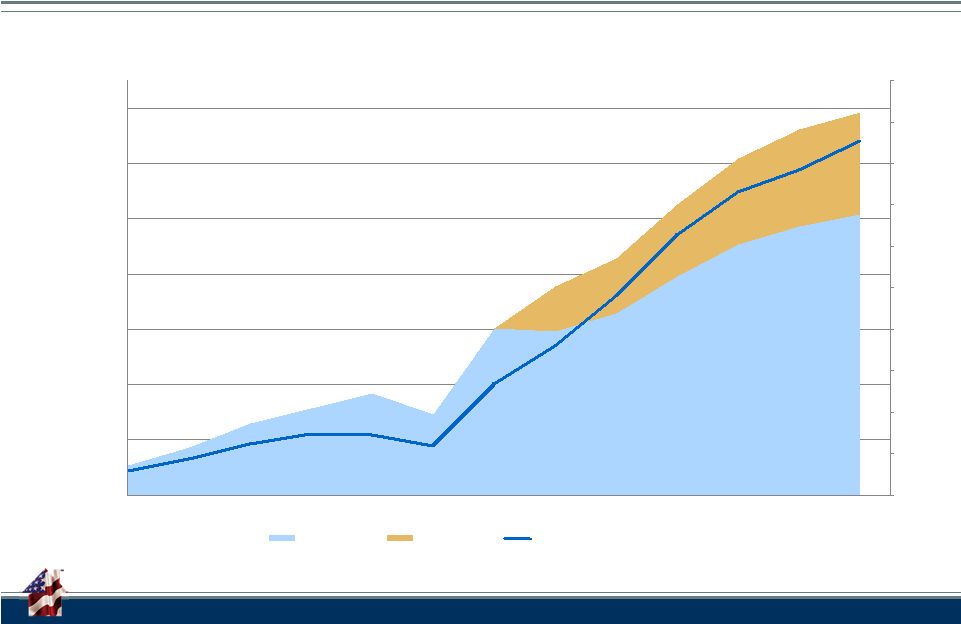
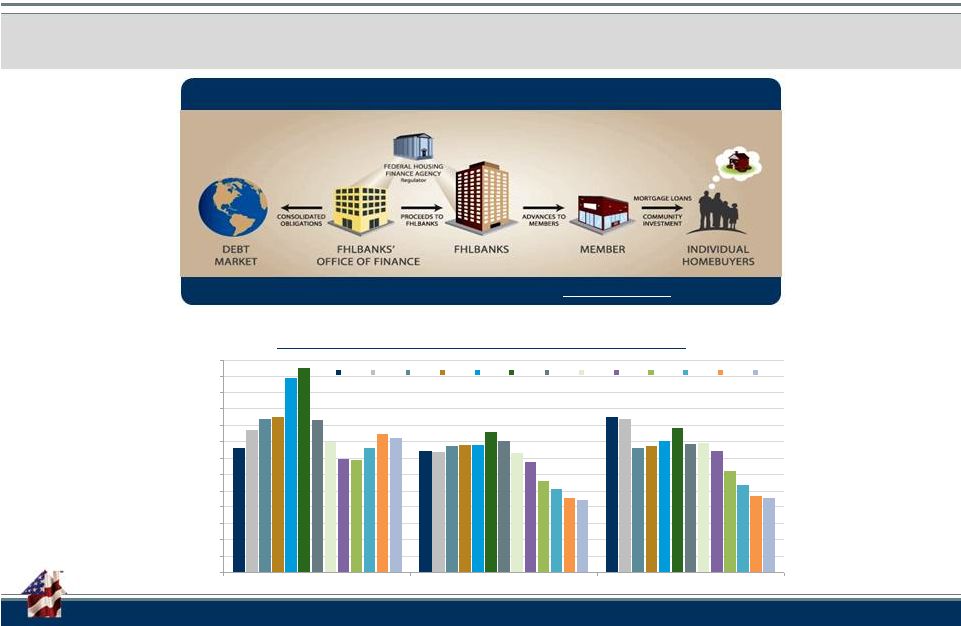 FHLBNY $824 $441 $452 $0 $100 $200 $300 $400 $500 $600 $700 $800 $900 $1,000 $1,100 $1,200 $1,300 FHLBanks Freddie Mac Fannie Mae* YE03 YE04 YE05 YE06 YE07 YE08 YE09 YE10 YE11 YE12 YE13 YE14 04/15 Federal Home Loan Bank System (FHLBank) Bond Issuance *As of 3/31/2015 3 The types of bonds offered, frequency of issuances, size of issuances and investor base continue to improve.
The Federal Home Loan Bank System Guide: www.fhlbanks.com Connecting Investors with Homeowners GSE DEBT OUTSTANDING |
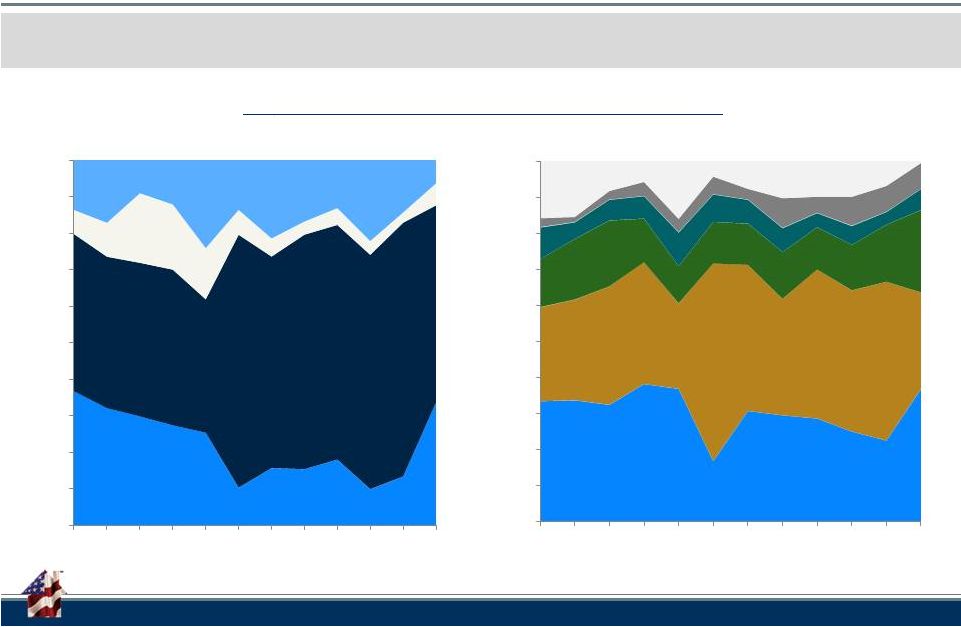 FHLBNY FHLBank Bond Issuance 4 Investor appetite for FHLBank Bonds remain strong both domestically and abroad. GLOBAL BOND INVESTOR DISTRIBUTION By Geographic Region By Investor Type Asia US Europe Other/ Unknown 0% 10% 20% 30% 40% 50% 60% 70% 80% 90% 100% 2004 2005 2006 2007 2008 2009 2010 2011 2012 2013 2014 2015 Central Banks Fund Managers Banks Pension/Ins State/Local Other/ Unknown 0% 10% 20% 30% 40% 50% 60% 70% 80% 90% 100% 2004 2005 2006 2007 2008 2009 2010 2011 2012 2013 2014 2015 |
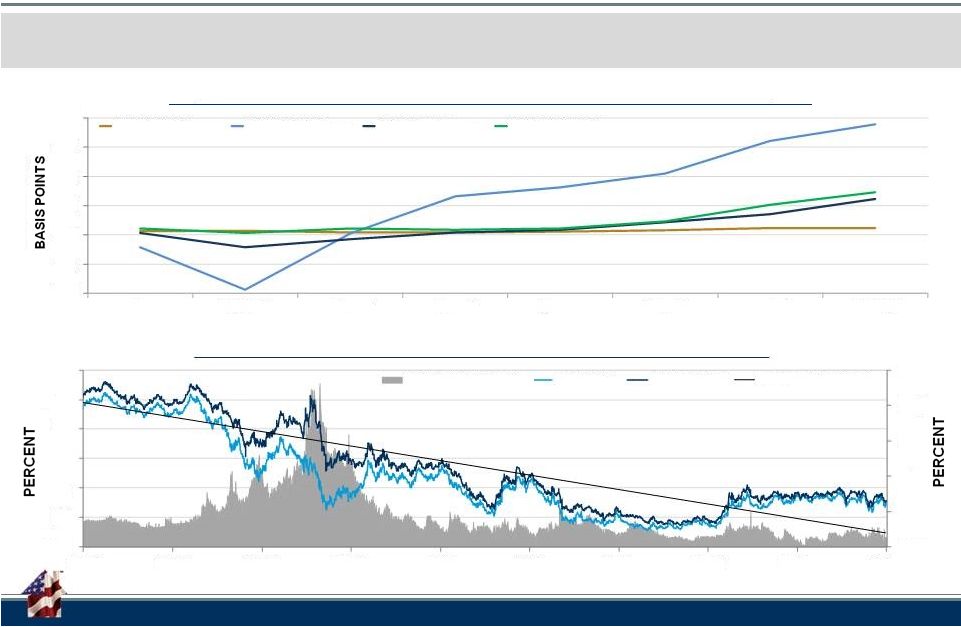 FHLBNY FHLBank Bond Issuance 5 FHLBank Debt spreads to LIBOR continue to improve and spreads to treasury are historically tight.
HISTORY OF CONSOLIDATED OBLIGATIONS AGAINST LIBOR
5Y FHLB COST OF DEBT VS. 5Y TREASURY
-100 -60 -20 20 60 100 140 1 Month 3 Month 1 Year 2 Year 3 Year 5 Year 7 Year 10 Year 6/29/07 COF Curve 3/31/09 COF Curve 3/30/12 COF Curve 3/31/2015 COF Curve 0.00 0.50 1.00 1.50 2.00 2.50 0.00 1.00 2.00 3.00 4.00 5.00 6.00 3/06 3/07 3/08 3/09 3/10 3/11 3/12 3/13 3/14 3/15 5Y Spread (Right- 5Y Treasury 5Y FHLB Debt Linear (5Y FHLB Debt) Axis) |
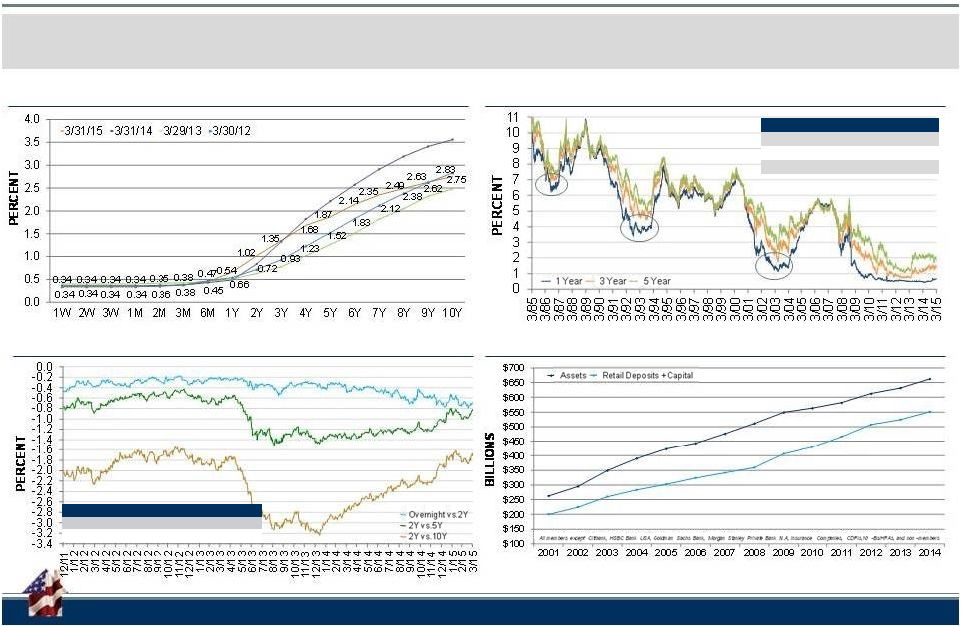 FHLBNY Advance Rates, Trends and Offerings 6 Advance rates are at historic lows and the shape of the Advance Curve is surfacing opportunities. The
Funding Gap is the basis for advance demand, and remains wide.
FHLBNY ADVANCE CURVE FIXED-RATE ADVANCES ARE AT HISTORIC LOWS THE COST TO EXTEND HAS DECREASED FHLBNY MEMBERS FUNDING GAP 2Y vs. 5Y 2Y vs. 10Y 3/31/15 -0.90 -1.77 24 Month Low -0.70 (1/15) -1.73 (1/15) New Lows for Last 12 Months 1Y Adv: 0.42 On 5/23/2014 3Y Adv: 1.14 On 5/6/2014 5Y Adv: 1.69 On 1/14/2015 |
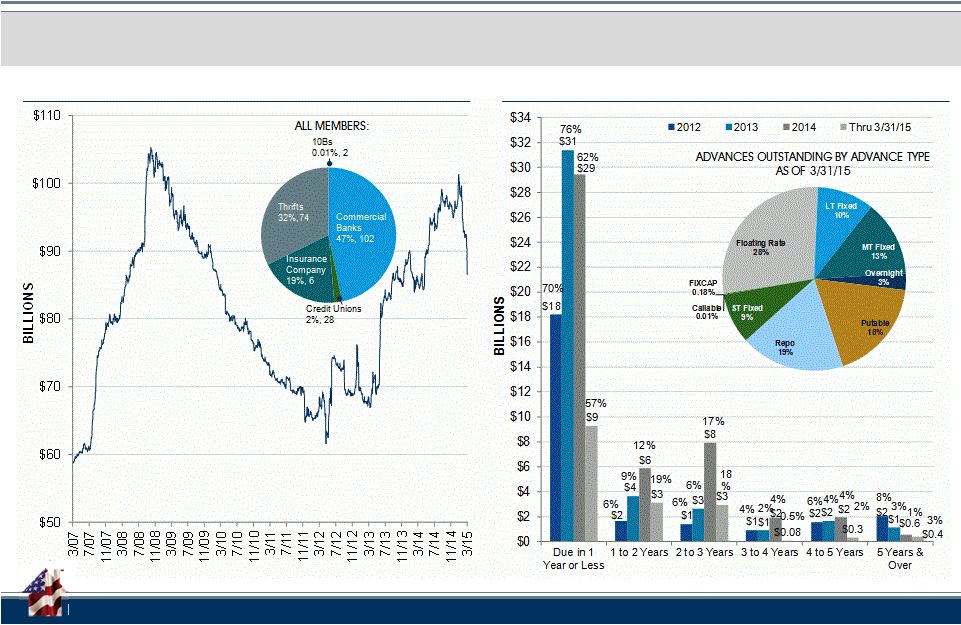 FHLBNY Advance Rates, Trends and Offerings 7 The growth in member balance sheets and the increased focus on interest rate risk
are the main drivers behind member funding preferences.
MEMBER ADVANCES OUTSTANDING
FHLBNY ADVANCES ISSUED & STILL OUTSTANDING |
 FHLBNY The FHLBNY continually looks for ways to create value for Members through the advances program.
Advance Rates, Trends and Offerings
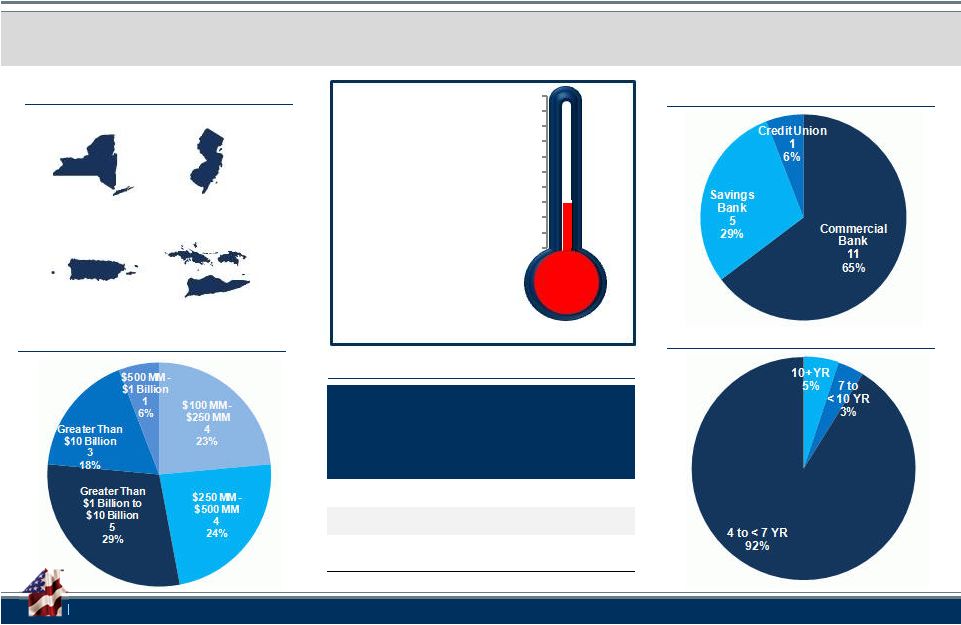
Results of the Long-Term Advance Special
8 NEW YORK NEW JERSEY PUERTO RICO U.S. VIRGIN ISLANDS 9 7 1 0 BORROWERS COMPOSITION BY REGION Term (YR) Discount to Regular Advance Pricing (BPS) Amount Cap ($MM) Total Program Amount Cap ($MM) Per Member 4 to < 7 -5 $500 $125 7 to < 10 -7 $1,000 $250 10 and Longer -10 $1,000 $250 PROGRAM TERMS ASSET SIZE INSTITUTION TYPE ADVANCE TERMS to $2.5B Target Millions Borrowing Members # Transactions 31.40% 17 $785.05 28 0% 10% 20% 30% 40% 50% 60% 70% 80% 90% 100% |
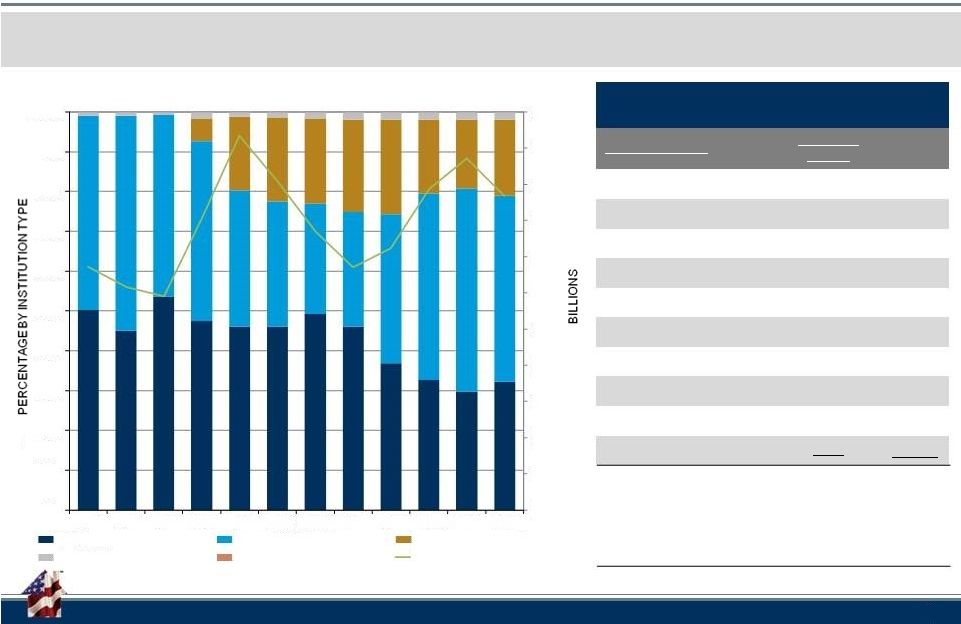 FHLBNY Top 10 Borrowers ($Billions) Customer Name Advances 3/31/15 YTD Change Citibank, N.A. $15.25 ($12.75) Metropolitan Life Insurance Co. $12.57 $0 New York Community Bank $7.93 ($0.954) Hudson City Savings Bank, FSB $6.03 $0 HSBC Bank USA $5.60 +$4.60 First Niagara Bank $4.78 ($0.262) Investors Bank $3.01 +$0.396 Astoria Bank $2.40 +$0.016 Prudential Insurance $2.23 $0 Valley National Bank $1.90 $0 Total of Top 10 Borrowers $61.70 ($8.954) Total Advances Outstanding $86.832 ($10.385) Top 10 as a % of Total Advances 74% - Advances Outstanding by Institution Type 9 2004-YTD15 The types of borrowing Members is becoming more diverse. $0 $10 $20 $30 $40 $50 $60 $70 $80 $90 $100 $110 0% 10% 20% 30% 40% 50% 60% 70% 80% 90% 100% 12/04 12/05 12/06 12/07 12/08 12/09 12/10 12/11 12/12 12/13 12/14 03/15 Thrifts Commercial Banks Insurance Company Credit Unions Housing Associates Total Advances Outstanding |
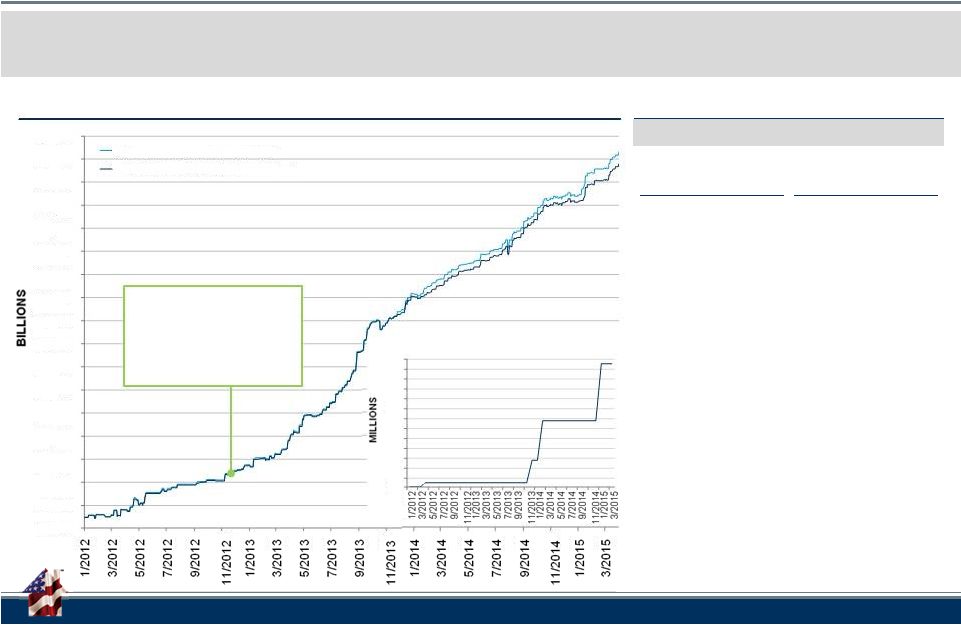 FHLBNY Community Development Programs 10 The popularity of the CI program has been growing, particularly in the Caribbean region as of late,
as Members have placed an emphasis on investing in their communities.
TOTAL CI ADVANCES (DAILY AVERAGE)
11/8/12 – FHLBNY initiates Disaster Relief Funding program (DRF), designed for Members to assist in rebuilding communities affected by Superstorm Sandy. FHLBNY allocates $1B in low-cost funding. Program closed 12/31/13. Recent Growth in CI Participation by Caribbean Members COMMUNITY LENDING PROGRAMS » Equipment Purchase for Small Business Expansion » Debt Refinancing for Small Businesses » Debt Consolidation for Small Businesses » Handicapped-Accessible Vans » Fire Stations and Trucks » Grocery Stores » Retail Stores » Educational Facilities » Healthcare Facilities » Office Buildings » Daycare Centers » Origination of single-family mortgages Commercial/Economic Development Housing » Refinancing of single-family mortgages » Financing of housing projects: – Property acquisition – Construction – Permanent financing – Re-financing – Renovation/Rehabilitation – Home Improvement Project specific uses of CIP, UDA & RDA Funds $1,000 $1,200 $1,400 $1,600 $1,800 $2,000 $2,200 $2,400 $2,600 $2,800 $3,000 $3,200 $3,400 $3,600 $3,800 $4,000 $4,200 $4,400 Total CI with Caribbean Members Total CI without Caribbean Members $0 $8 $16 $24 $32 $40 $48 $56 $64 $72 $80 $88 $96 $104 |
 FHLBNY Continuous Educational Outreach Initiatives 11 We provide relevant education, emerging topics, and trends to our Members. FHLBNY RESOURCE CENTER — CREATED TO HELP YOU MAXIMIZE YOUR MEMBERSHIP Gain access to educational information and various tools to help address your institution’s unique set of challenges, such as: » Managing interest rate risk » Increasing profitability » Increasing Net Interest Margin » Locking in spreads to preserve margins Examples of the materials you can find: » Strategy articles » Presentations, Tutorials and Webinars » Workshops and Tools » Fact Sheets and Other Information Take advantage of this readily available center by visiting: www.fhlbny.com/members/resource-center
»
Mitigating Net Interest Income at Risk and Economic Value of Equity at
Risk »
Achieving asset/liability management goals without increasing the size of the balance
sheet Through
the FHLBNY Resource Center you can also request a Member-Director Education Session This program is specifically created for our Members’ directors and managers, and is customized to address their
specific needs and concerns, as well as a wide range of issues commonly faced by most
community lenders. |
 Advancing Housing and Community Growth
Adam Goldstein SVP, Head of Sales & Marketing 212-441-6703 goldstein@fhlbny.com 101 PARK AVENUE • NEW YORK, NY 10178 • WWW.FHLBNY.COM The information provided by the Federal Home Loan Bank of New York (FHLBNY) in this communications is set forth for informational purposes only.
The information
should not be construed as an opinion, recommendation or solicitation regarding the use of any financial strategy and/or the purchase or sale of any financial instrument. All customers are advised to conduct their own independent due diligence before making any financial decisions. Please
note that the past performance of any FHLBNY service or product should
not be viewed as a guarantee of future results. Also, the information presented here and/or the services or products provided by the FHLBNY may change at any time without notice. |