Attached files
| file | filename |
|---|---|
| 8-K - 8-K - Virtu Financial, Inc. | a15-13397_18k.htm |
Exhibit 99.1
|
|
Sandler O’Neill Conference June 2015 |
|
|
2 This presentation contains forward-looking statements that are based on current expectations, forecasts and projections, including (but not limited to) expected financial results and other planned events. Forward-looking statements should not be read as a guarantee of future performance or results, and will not necessarily be accurate indications of the times at, or by which, such performance or results will be achieved. Forward-looking information is based on information available at the time and/or management’s good faith belief with respect to future events, and is subject to risks and uncertainties, some or all of which are not predictable or within the control of Virtu Financial Inc (“Virtu" or the "Company"), that could cause actual performance or results to differ materially from those expressed in the statements. Forward-looking statements speak only as of the date the statements are made. The Company assumes no obligation to update forward-looking statements to reflect actual results, changes in assumptions or changes in other factors affecting forward-looking information. If the Company does update one or more forward-looking statements, no inference should be drawn that the Company will make additional updates with respect thereto or with respect to other forward-looking statements. Factors that could cause results to differ include those set forth section “Risk Factors” in the prospectus for the offering to which this presentation relates. This presentation includes certain non-GAAP financial measures, including Adjusted Net Trading Income (“Adj. NTI”), Adjusted EBITDA, Adjusted EBITDA Margin. Non-GAAP financial measures such as Adjusted EBITDA, Adjusted EBITDA Margin should be considered only as supplemental to, and not as superior to, financial measures prepared in accordance with GAAP. Other companies may use similarly titled non-GAAP financial measures that are calculated differently from the way we calculate such measures, including in respect of the Adj. NTI of other companies included herein. Accordingly, our non-GAAP financial measures may not be comparable to similar measures used by other companies. We caution investors not to place undue reliance on such non-GAAP measures, but instead to consider them with the most directly comparable GAAP measure. Non-GAAP financial measures have limitations as analytical tools, and should not be considered in isolation, or as a substitute for our results as reported under GAAP. A reconciliation of non-GAAP measures to the most directly comparable financial measure prepared in accordance with GAAP is included in Annex A hereto. Disclaimer |
|
|
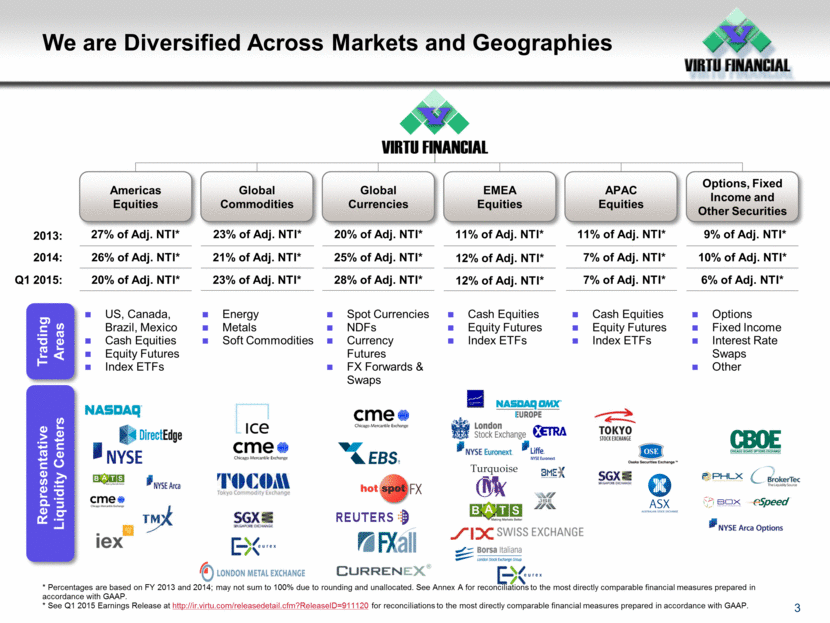
3 Americas Equities Global Commodities Global Currencies EMEA Equities Trading Areas Representative Liquidity Centers APAC Equities 27% of Adj. NTI* * Percentages are based on FY 2013 and 2014; may not sum to 100% due to rounding and unallocated. See Annex A for reconciliations to the most directly comparable financial measures prepared in accordance with GAAP. * See Q1 2015 Earnings Release at http://ir.virtu.com/releasedetail.cfm?ReleaseID=911120 for reconciliations to the most directly comparable financial measures prepared in accordance with GAAP. Options, Fixed Income and Other Securities 23% of Adj. NTI* 20% of Adj. NTI* 11% of Adj. NTI* 11% of Adj. NTI* 9% of Adj. NTI* Options Fixed Income Interest Rate Swaps Other US, Canada, Brazil, Mexico Cash Equities Equity Futures Index ETFs Turquoise Cash Equities Equity Futures Index ETFs Cash Equities Equity Futures Index ETFs Energy Metals Soft Commodities Spot Currencies NDFs Currency Futures FX Forwards & Swaps We are Diversified Across Markets and Geographies 26% of Adj. NTI* 12% of Adj. NTI* 7% of Adj. NTI* 21% of Adj. NTI* 25% of Adj. NTI* 10% of Adj. NTI* 2014: 2013: 20% of Adj. NTI* 12% of Adj. NTI* 7% of Adj. NTI* 23% of Adj. NTI* 28% of Adj. NTI* 6% of Adj. NTI* Q1 2015: |
|
|
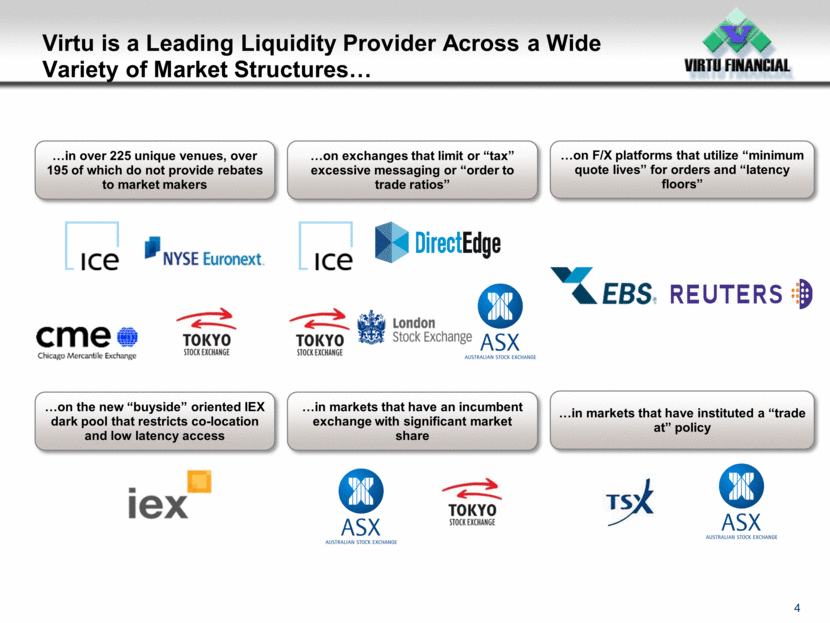
4 in over 225 unique venues, over 195 of which do not provide rebates to market makers on exchanges that limit or “tax” excessive messaging or “order to trade ratios” on F/X platforms that utilize “minimum quote lives” for orders and “latency floors” on the new “buyside” oriented IEX dark pool that restricts co-location and low latency access in markets that have an incumbent exchange with significant market share in markets that have instituted a “trade at” policy Virtu is a Leading Liquidity Provider Across a Wide Variety of Market Structures |
|
|
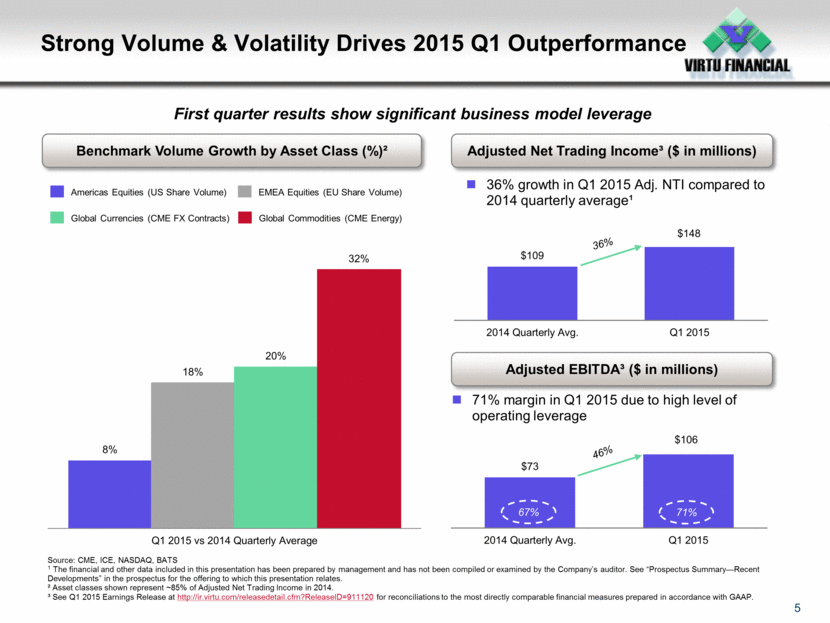
Strong Volume & Volatility Drives 2015 Q1 Outperformance 5 Adjusted Net Trading Income³ ($ in millions) Adjusted EBITDA³ ($ in millions) $148 Source: CME, ICE, NASDAQ, BATS 1 The financial and other data included in this presentation has been prepared by management and has not been compiled or examined by the Company’s auditor. See “Prospectus Summary—Recent Developments” in the prospectus for the offering to which this presentation relates. ² Asset classes shown represent ~85% of Adjusted Net Trading Income in 2014. ³ See Q1 2015 Earnings Release at http://ir.virtu.com/releasedetail.cfm?ReleaseID=911120 for reconciliations to the most directly comparable financial measures prepared in accordance with GAAP. Benchmark Volume Growth by Asset Class (%)² Americas Equities (US Share Volume) EMEA Equities (EU Share Volume) Global Commodities (CME Energy) Global Currencies (CME FX Contracts) 36% growth in Q1 2015 Adj. NTI compared to 2014 quarterly average¹ First quarter results show significant business model leverage 46% 71% margin in Q1 2015 due to high level of operating leverage 71% 36% $106 67% $109 2014 Quarterly Avg. Q1 2015 $73 2014 Quarterly Avg. Q1 2015 67.0% 8% 18% 20% 32% Q1 2015 vs 2014 Quarterly Average |
|
|
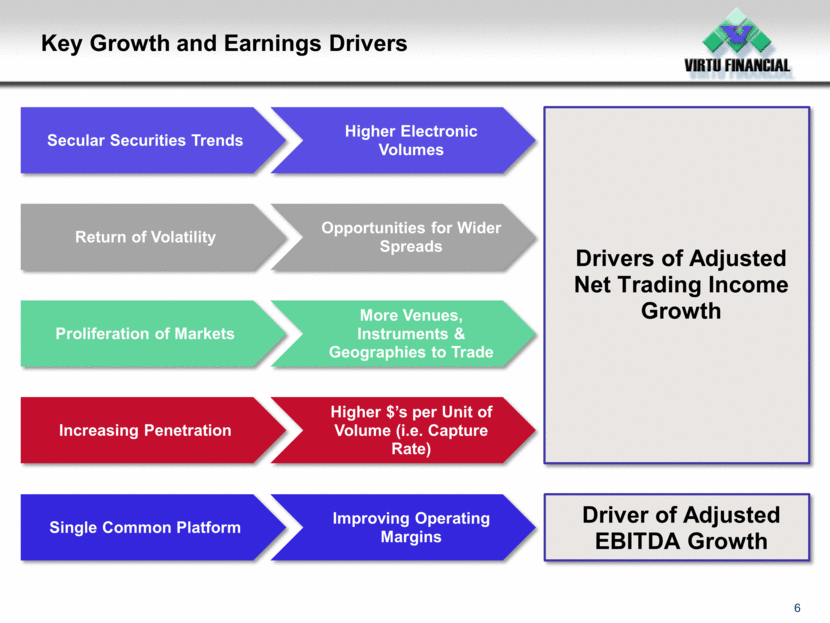
6 Key Growth and Earnings Drivers Higher Electronic Volumes Opportunities for Wider Spreads More Venues, Instruments & Geographies to Trade Higher $’s per Unit of Volume (i.e. Capture Rate) Improving Operating Margins Return of Volatility Proliferation of Markets Increasing Penetration Single Common Platform Secular Securities Trends Drivers of Adjusted Net Trading Income Growth Driver of Adjusted EBITDA Growth |


