Attached files
| file | filename |
|---|---|
| 8-K - 8-K - BIOLASE, INC | d936105d8k.htm |
| Exhibit 99.1
|
World’s Leading Provider of Dental Laser Technology
BIOLASE: Creating Value Through Transformational Innovation
Elevating the Total Dental Experience
NASDAQ: BIOL
June 2015
|
|
BIOLASE KEY TOPICS:
Leadership Team Transition Company Background
Large Market Opportunity
Financial Overview
| 2 |
|
|
|
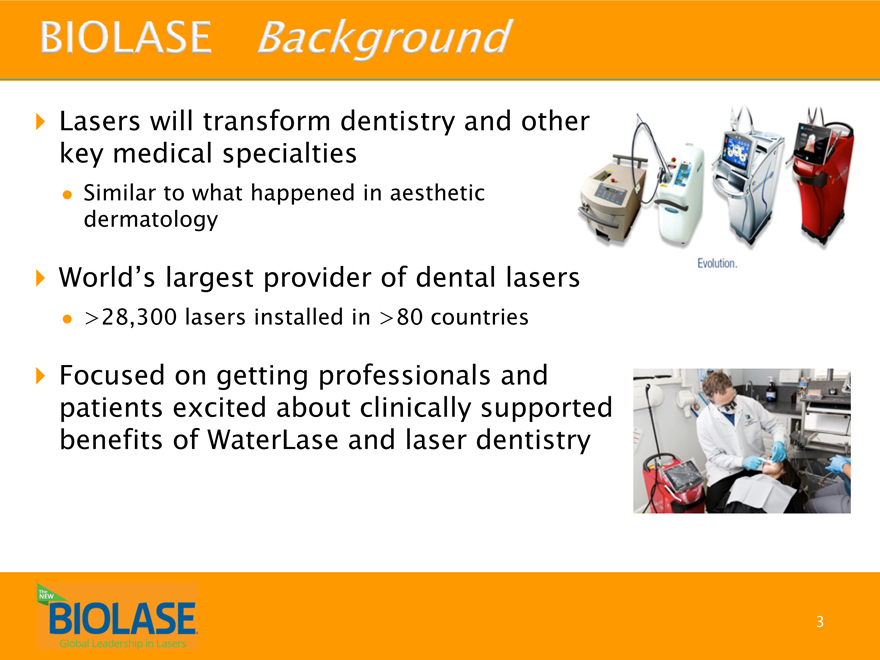
BIOLASE BACKGROUND
Lasers will transform dentistry and other key medical specialties
Similar to what happened in aesthetic dermatology
World’s largest provider of dental lasers
>28,300 lasers installed in >80 countries
Focused on getting professionals and patients excited about clinically supported benefits of WaterLase and laser dentistry
| 3 |
|
|
|
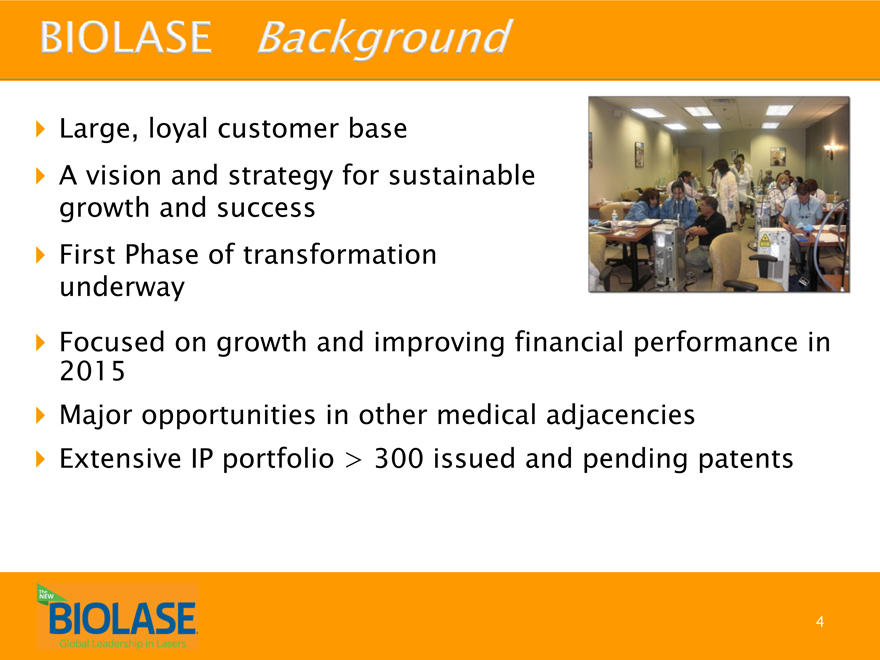
Large, loyal customer base
A vision and strategy for sustainable growth and success First Phase of transformation underway
Focused 2015 on growth and improving financial performance in Major opportunities in other medical adjacencies Extensive IP portfolio > 300 issued and pending patents
| 4 |
|
|
|
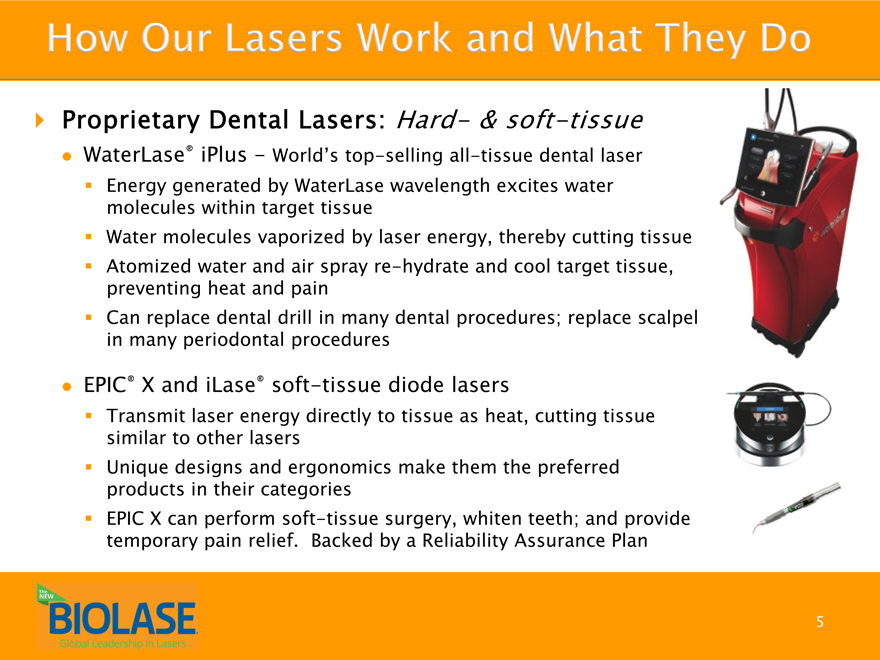
HOW OUR LASERS WORK AND WHAT THEY DO
Proprietary Dental Lasers: Hard- & soft-tissue
WaterLase® iPlus—World’s top-selling all-tissue dental laser Energy generated by WaterLase wavelength excites water molecules within target tissue Water molecules vaporized by laser energy, thereby cutting tissue Atomized water and air spray re-hydrate and cool target tissue, preventing heat and pain Can replace dental drill in many dental procedures; replace scalpel in many periodontal procedures
EPIC® X and iLase® soft-tissue diode lasers
Transmit laser energy directly to tissue as heat, cutting tissue similar to other lasers Unique designs and ergonomics make them the preferred products in their categories EPIC X can perform soft-tissue surgery, whiten teeth; and provide temporary pain relief. Backed by a Reliability Assurance Plan
| 5 |
|
|
|
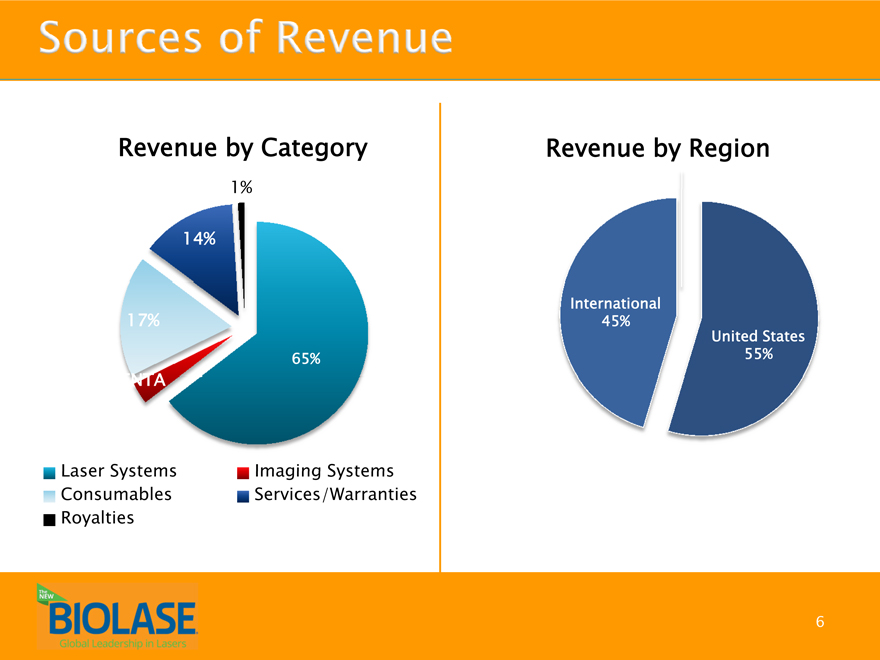
SOURCE OF REVENUE
Revenue by Category Revenue by Region
1%
14%
International
17% 45%
United States 65% 55%
GE]
Laser Systems Imaging Systems Consumables Services/Warranties Royalties
| 6 |
|
|
|
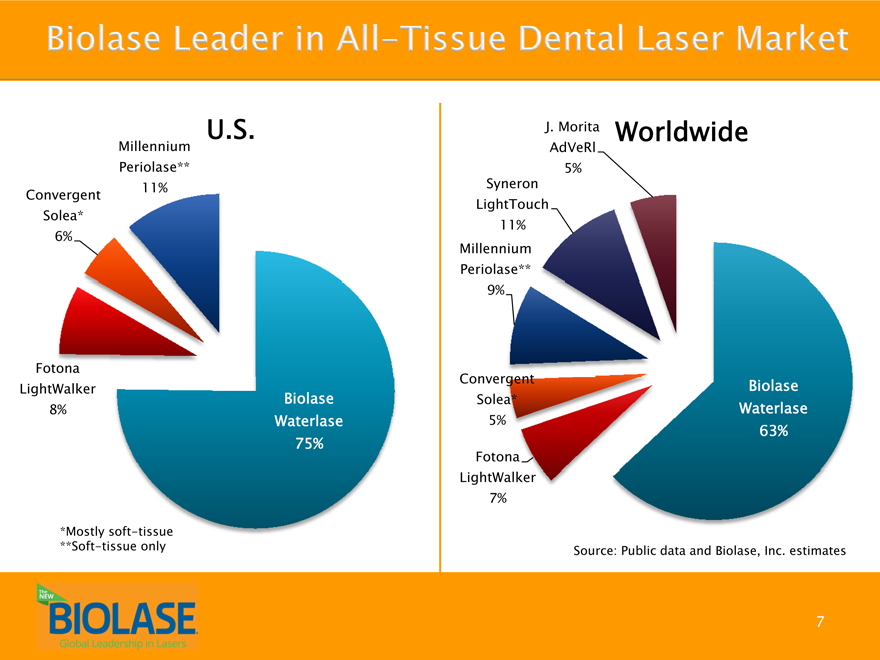
BIOLASE LEADER IN ALL-TISSUE DENTAL LASER MARKET
U.S. J. Morita Worldwide
Millennium AdVeRl Periolase** 5% 11% Syneron Convergent LightTouch Solea* 11% 6% Millennium Periolase** 9%
Fotona
Convergent Biolase LightWalker
Biolase Solea*
8% Waterlase Waterlase 5% 63% 75%
Fotona LightWalker 7%
*Mostly soft-tissue
**Soft-tissue only Source: Public data and Biolase, Inc. estimates
| 7 |
|
|
|
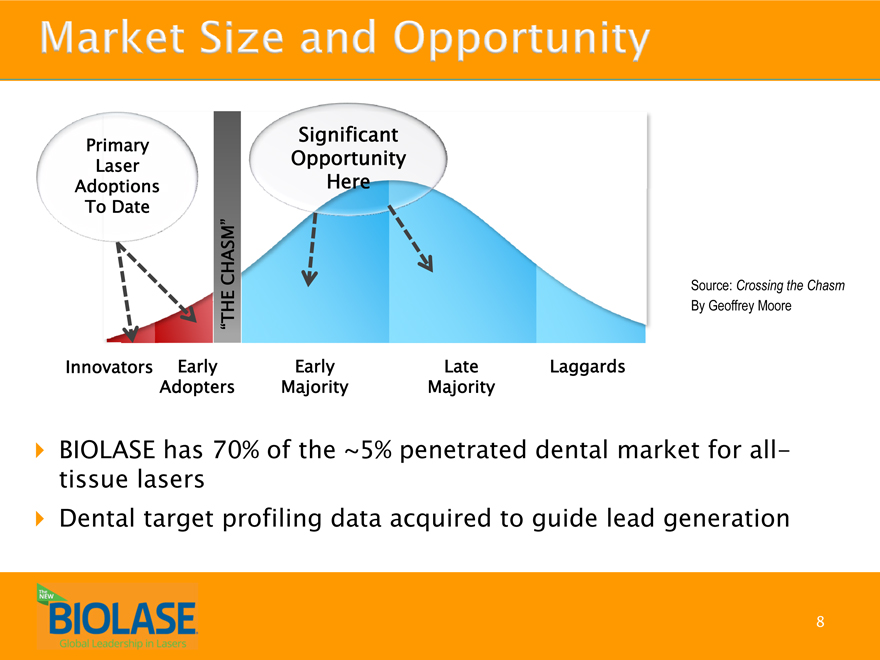
MARKET SIZE AND OPPORTUNITY
Significant
Primary
Laser Opportunity
Adoptions Here To Date
CHASM” Source: Crossing the Chasm
“THE By Geoffrey Moore
Innovators Early Early Late Laggards Adopters Majority Majority
BIOLASE has 70% of the ~5% penetrated dental market for all-tissue lasers Dental target profiling data acquired to guide lead generation
| 8 |
|
|
|
Quality levels have dramatically improved Significant improvement in Customer Satisfaction
NPS = 3X Q3’14 Levels
Core laser business returned to growth in Q1’15 after +2 year decline Introduced two major new products worldwide – EpicX & WaterLase iPlus 2.0 with Practice Growth Guarantee
9
|
|
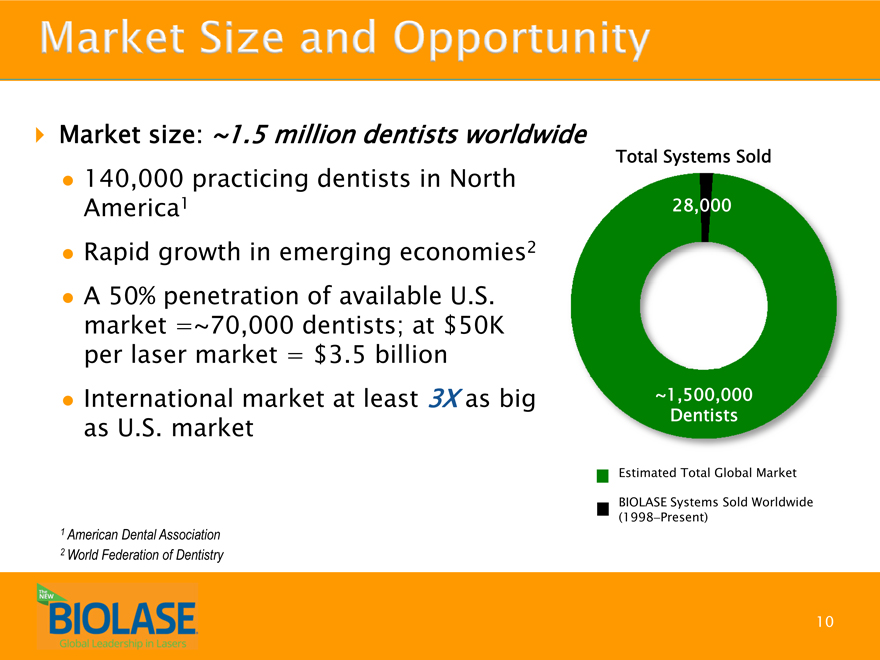
MARKET SIZE AND OPPORTUNITY
Market size: ~1.5 million dentists worldwide
140,000 practicing dentists in North America1 Rapid growth in emerging economies2 A 50% penetration of available U.S. market =~70,000 dentists; at $50K per laser market = $3.5 billion International market at least 3X as big as U.S. market
| 1 |
|
American Dental Association |
| 2 |
|
World Federation of Dentistry |
Total Systems Sold
28,000
~1,500,000 Dentists
Estimated Total Global Market BIOLASE Systems Sold Worldwide (1998-Present)
10
|
|
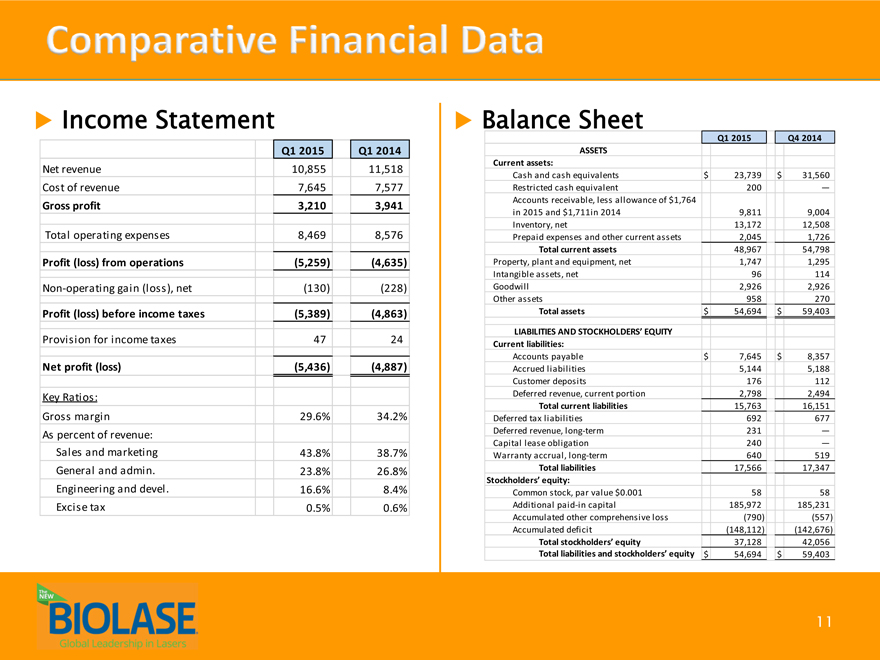
COMPARATIVE FINANCIAL DATA
Income Statement
Q1 2015 Q1 2014
Net revenue 10,855 11,518
Cost of revenue 7,645 7,577
Gross profit 3,210 3,941
Total operating expenses 8,469 8,576
Profit (loss) from operations(5,259)(4,635)
Non-operating gain (loss), net(130)(228)
Profit (loss) before income taxes(5,389)(4,863)
Provision for income taxes 47 24
Net profit (loss)(5,436)(4,887)
Key Ratios:
Gross margin 29.6% 34.2%
As percent of revenue:
Sales and marketing 43.8% 38.7%
General and admin. 23.8% 26.8%
Engineering and devel . 16.6% 8.4%
Excise tax 0.5% 0.6%
Balance Sheet
Q1 2015 Q4 2014
ASSETS
Current assets:
Cash and cash equivalents $ 23,739 $ 31,560
Restricted cash equivalent 200 —
Accounts receivable, less allowance of $1,764
in 2015 and $1,711in 2014 9,811 9,004
Inventory, net 13,172 12,508
Prepaid expenses and other current assets 2,045 1,726
Total current assets 48,967 54,798
Property, plant and equipment, net 1,747 1,295
Intangible assets, net 96 114
Goodwill 2,926 2,926
Other assets 958 270
Total assets $ 54,694 $ 59,403
LIABILITIES AND STOCKHOLDERS’ EQUITY
Current liabilities:
Accounts payable $ 7,645 $ 8,357
Accrued liabilities 5,144 5,188
Customer deposits 176 112
Deferred revenue, current portion 2,798 2,494
Total current liabilities 15,763 16,151
Deferred tax liabilities 692 677
Deferred revenue, long-term 231 —
Capital lease obligation 240 —
Warranty accrual, long-term 640 519
Total liabilities 17,566 17,347
Stockholders’ equity:
Common stock, par value $0.001 58 58
Additional paid-in capital 185,972 185,231
Accumulated other comprehensive loss(790)(557)
Accumulated deficit(148,112)(142,676)
Total stockholders’ equity 37,128 42,056
Total liabilities and stockholders’ equity $ 54,694 $ 59,403
11
|
|
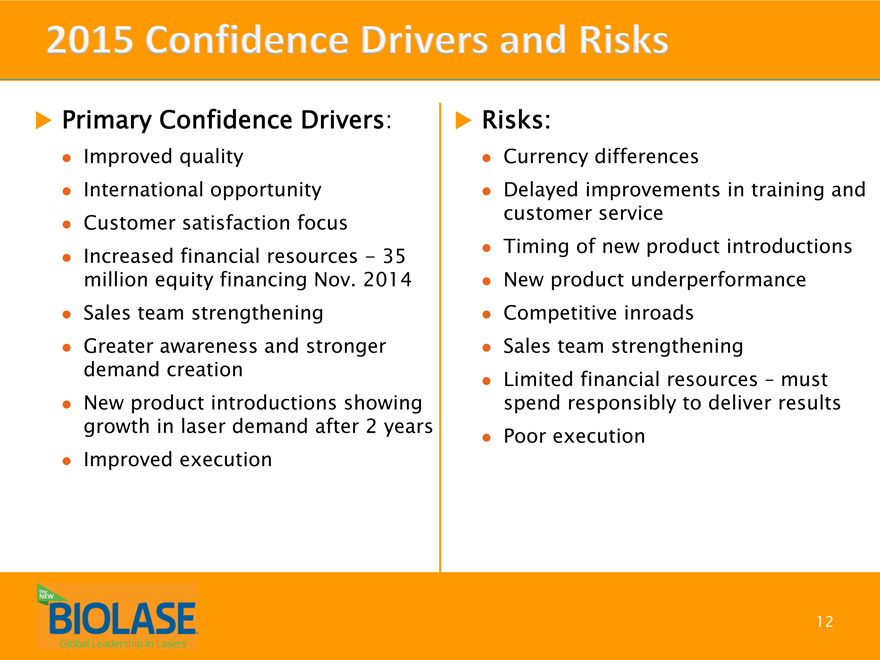
Primary Confidence Drivers:
Improved quality
International opportunity Customer satisfaction focus Increased financial resources—35 million equity financing Nov. 2014 Sales team strengthening Greater awareness and stronger demand creation New product introductions showing growth in laser demand after 2 years Improved execution
Risks:
Currency differences
Delayed improvements in training and customer service Timing of new product introductions New product underperformance Competitive inroads Sales team strengthening Limited financial resources – must spend responsibly to deliver results Poor execution
12
|
|
SAFE HARBOR STATEMENT
Statements contained in this presentation that refer to BIOLASE’s estimated or anticipated future results or other non-historical facts are forward-looking statements, as are any statements in this presentation concerning prospects related to BIOLASE’s strategic initiatives and anticipated financial performance. Forward-looking statements can also be identified through the use of words such as “anticipates,” “expects,” “intends,” “plans,” “believes,” “seeks,” “estimates,” “may,” “will,” and variations of these words or similar expressions. Readers are cautioned not to place undue reliance on these forward-looking statements, which reflect BIOLASE’s current perspective of existing trends and information and speak only as of the date of this presentation. Actual results may differ materially from BIOLASE’s current expectations depending upon a number of factors affecting BIOLASE’s business. These factors include, among others, adverse changes in general economic and market conditions, competitive factors including but not limited to pricing pressures and new product introductions, uncertainty of customer acceptance of new product offerings and market changes, risks associated with managing the growth of the business, and those other risks and uncertainties that may be detailed, from time-to-time, in BIOLASE’s reports filed with the SEC. BIOLASE does not undertake any responsibility to revise or update any forward-looking statements contained herein.
13
|
|

World’s Leading Provider of Dental Laser Technology
BIOLASE: Creating Value Through Transformational Innovation
Elevating the Total Dental Experience
NASDAQ: BIOL
June 2015