Attached files
| file | filename |
|---|---|
| 8-K - FORM 8-K - ABM INDUSTRIES INC /DE/ | t1501254_8k.htm |
| EX-99.1 - EXHIBIT 99.1 - ABM INDUSTRIES INC /DE/ | t1501254_ex99-1.htm |
Exhibit 99.2

Cover Slide Title (20pt. Bold) Second Quarter 2015 Teleconference June 3, 2015 1

Agenda 2 1 2 3 4 Introduction, Overview & Highlights Second Quarter 2015 Operational Results Capital Structure Fiscal 2015 Outlook 5 Questions & Answers Forward - Looking Statements and Non - GAAP Financial Information: Our discussions during this conference call will include forward - looking statements. Actual results could differ materially fro m those projected in the forward - looking statements. The factors that could cause actual results to differ are discussed in the Company’s 2014 Annual Report on Form 10 - K and in our 2015 reports on Form 10 - Q and Form 8 - K that will be filed Wednesday, June 3rd. These reports are available on our website at http://investor.abm.com/ under “SEC Filings”. A description of factors that could cause actual results to differ is also set forth at the end of this presentation. Also, the discussion during this conference call will include certain financial measures that were not prepared in accordance wi th U.S. generally accepted accounting principles (“U.S. GAAP”). Reconciliations of those non - GAAP financial measures to the most directly comparable U.S. GAAP financ ial measures can be found on the Investor Relations portion of our website at http://investor.abm.com and at the end of this presentation.
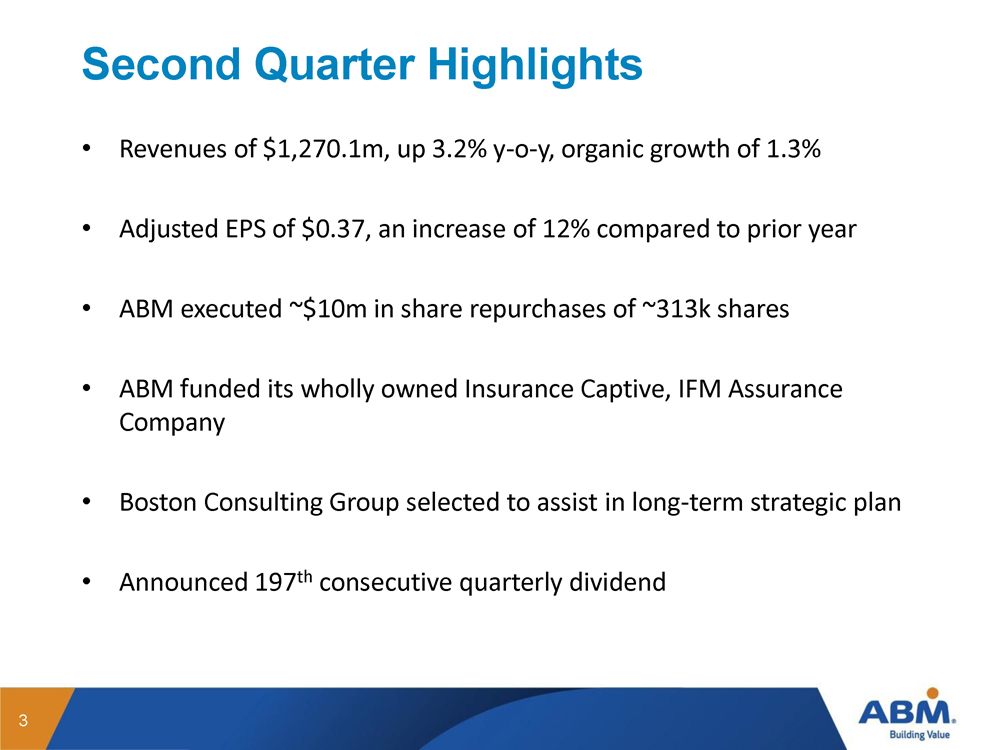
Second Quarter Highlights • Revenues of $1,270.1m, up 3.2% y - o - y, organic growth of 1.3% • Adjusted EPS of $0.37, an increase of 12% compared to prior year • ABM executed ~$10m in share repurchases of ~313k shares • ABM funded its wholly owned Insurance Captive, IFM Assurance Company • Boston Consulting Group selected to assist in long - term strategic plan • Announced 197 th consecutive quarterly dividend 3

Second Quarter 2015 Review of Operational Results

Onsite Operational Results 5 Janitorial Services • Revenues of $659.5m, increase of 4.4% y - o - y − Includes revenues of $17.8m from the acquisition of GBM − Organic revenue growth of 1.6% ▪ 3.9%, excluding the termination of a large multi - regional contract • Operating profit of $39.9m, increase of 7.3% y - o - y − Operating profit margins increased to 6.1% Facility Services • Revenues of $145.8m, decrease of 2.5% y - o - y • Operating profit of $6.6m, increase of 32.0% y - o - y − Operating profit margins increased to 4.5% Parking • Revenues of $153.5m, increase of 0.6% y - o - y − Excluding management reimbursement Parking was up $2.9m, increase of 3.8% y - o - y • Operating profit of $6.7m, increase of 11.7% y - o - y − Operating profit margins increased to 4.4% Security • Revenues of $93.7m, decrease of 0.1% y - o - y • Operating profit of $2.6m, increase of 30.0% y - o - y − Operating profit margins increased to 2.8%

Operational Results 6 BESG Other ( AirServ ) • Revenues of $121.5m, increase of 2.5% y - o - y − Includes incremental revenues of $5.1m from recent acquisitions − ABES delivered 1.4% revenue growth − Healthcare Support Services delivered 12% revenue growth − Government saw a decline - 3.7% • Operating profit of $3.2m, decrease of 8.6% y - o - y − Operating profit margins decreased to 2.6% • Revenues of $96.1m, increase of 12.8% y - o - y • Operating profit of $3.0m, increase of 25.0% y - o - y − Operating profit margins increased to 3.1%

7 Capital Structure

Select Cash Flow & Balance Sheet Items Cash Flow from Operating Activities 8 • DSO unchanged on a y - o - y basis and down 3 days sequentially • Days sales outstanding (DSO) for the second quarter were 53 days

Select Cash Flow & Balance Sheet Items Leverage 9 Q2 FY15 Leverage of 1.93x Note: Acquisitions shown represent purchase above $15m

Select Cash Flow & Balance Sheet Items Shareholder Return 10 *Accelerated Q2 FY13 dividend payment in Q1 FY13

The Captive Vision • The Company formed a wholly - owned captive insurance entity (“IFM Assurance Company”) as a vehicle for change and continuous improvement as part of a multi - year risk and safety strategy • There will be multiple elements of the Captive strategy that will help us gain efficiencies over the long - term. Several of the initial areas we plan to look at include : − “True Cost” Analytics. More precisely assess where our risks lie which will allow us to make more informed risk tolerance and pricing decisions within the operating units − Allocation Practices. Continue to d evelop and deploy accountability - based risk allocation strategies with the goal of driving the right behaviors to minimize our risk exposure − Investments. Consider the implementation of new technology - based tools to document our work practices and expand our safety training curriculum − Retention. Evaluate whether or not our current retained limits and per - claim deductibles are at the optimal levels when considering the current legislative and legal climates 11

O utlook

Fiscal 2015 Outlook • The Company is providing the following guidance: − A djusted net income to $1.75 to $1.85 per diluted share − Net income of $1.55 to $1.65 per diluted share − This guidance excludes potential benefits associated with the Work Opportunity Tax Credit, should Congress extend the WOTC for calendar 2015, prior to October 31, 2015,the Company could have a further benefit of $0.08 per diluted share in fiscal 2015 • Effective tax rate in the range of 32% to 36% • Fiscal 2015 has one less work day, which the Company anticipates will reduce labor expense by approximately $4.0 million on a pre - tax basis: − Work days for fiscal 2015 by quarter are as follows: Q1 65; Q2 64; Q3 66; and Q4 65. Year - over - year compared to fiscal 2014, Q1 has one less work day; Q2 has one more work day; Q3 works days are the same; and Q4 has one less work day • Interest expense of $11.0 million to $13.0 million • Depreciation and amortization expense of $56.0 million to $60.0 million • Capital expenditures are expected to be in the range of $31.0 million to $35.0 million 13

Forward - Looking Statement This presentation contains forward - looking statements that set forth management's anticipated results based on management's curr ent plans and assumptions. Any number of factors could cause the Company's actual results to differ materially from those anticipated. Thes e f actors include but are not limited to the following: (1) risks relating to our acquisition strategy may adversely impact our results of operatio ns; (2) our strategy of moving to an integrated facility solutions provider platform, which focuses on vertical markets, may not generate the organic gr owth in revenues or profitability that we expect; (3) we are subject to intense competition that can constrain our ability to gain business as we ll as our profitability; (4) our business success depends on our ability to preserve our long - term relationships with clients; (5) increases in costs that we cannot pass on to clients could affect our profitability; (6) we have high deductibles for certain insurable risks, and therefore we are subjec t t o volatility associated with those risks; (7) our restructuring initiatives may not achieve the expected cost reductions; (8) our business success depends on retaining senior management and attracting and retaining qualified personnel; (9) we are at risk of losses stemming from accidents or other in cid ents at facilities in which we operate, which could cause significant damage to our reputation and financial loss; (10) negative or unexpected tax con sequences could adversely affect our results of operations; (11) federal health care reform legislation may adversely affect our business and re sults of operations; (12) changes in energy prices and government regulations could adversely impact the results of operations of our Building & Energy So lutions business; (13) significant delays or reductions in appropriations for our government contracts may negatively affect our business and c oul d have an adverse effect on our financial position, results of operations, and cash flows; (14) we conduct some of our operations through joint ve ntures, and our ability to do business may be affected by the failure of our joint venture partners to perform their obligations; (15) our business m ay be negatively affected by adverse weather conditions; (16) we are subject to business continuity risks associated with centralization of certain adm ini strative functions; (17) our services in areas of military conflict expose us to additional risks; (18) we are subject to cyber - security risks arising ou t of breaches of security relating to sensitive company, client, and employee information and to the technology that manages our operations and other b usi ness processes; (19) a decline in commercial office building occupancy and rental rates could affect our revenues and profitability; (20) det eri oration in general economic conditions could reduce the demand for facility services and, as a result, reduce our earnings and adversely affect our financial condition; (21) financial difficulties or bankruptcy of one or more of our clients could adversely affect our results; (22) any future increase in the level of our debt or in interest rates could affect our results of operations; ( 23) our ability to operate and pay our debt obligations depends upon our access to cash; ( 24) goodwill impairment charges could have a material adverse effect on our financial condition and results of operations; ( 25) impairment of long - lived assets may adversely affect our operating results; ( 26) we are defendants in class and representative actions and other lawsuits alleging various claims that could cause us to incur substantial liabilities; ( 27) changes in immigration laws or enforcement actions or investigations under such laws could significantly adversely affect our labor force, operations, and financial results; ( 28) labor disputes could lead to loss of revenues or expense variations; (29) we participate in multiemployer pension plans that under certain circumstances could result in material liabilities being incurred; and ( 30) disasters or acts of terrorism could disrupt services. 14
Appendix - Unaudited Reconciliation of non - GAAP Financial Measures

Unaudited Reconciliation of non - GAAP Financial Measures 16 ABM INDUSTRIES INCORPORATED AND SUBSIDIARIES RECONCILIATIONS OF NON-GAAP FINANCIAL MEASURES (UNAUDITED) (in millions, except per share amounts) 2015 2014 2015 2014 Reconciliation of Adjusted Net Income to Net Income Adjusted net income 21.3$ 18.8$ 42.8$ 32.9$ Items impacting comparability: CEO/CFO Change (a) (1.4) - (4.6) - Litigation and other settlements - (3.4) (2.3) (3.4) Restructuring (b) (0.1) (1.0) (0.8) (1.6) Acquisition costs (0.5) (0.2) (0.7) (0.3) Rebranding (c) - (1.4) (0.1) (1.8) U.S. Foreign Corrupt Practices Act investigation (d) (0.1) (0.3) (0.2) (0.9) Insurance adjustment (3.0) - (3.0) - Total items impacting comparability (5.1) (6.3) (11.7) (8.0) Benefit from income taxes 2.1 2.7 4.9 3.4 Items impacting comparability, net of taxes (3.0) (3.6) (6.8) (4.6) Net income 18.3$ 15.2$ 36.0$ 28.3$ (a) Represents severance and other costs related to the departure of our former CEO and CFO. (b) Restructuring costs associated with realignment of our operational structure. (c) Represents costs related to the Company's branding initiative. (d) Includes legal and other cost incurred in connection with an internal investigation into a foreign entity affiliated with a former joint venture partner. Three Months Ended April 30, Six Months Ended April 30,

Unaudited Reconciliation of non - GAAP Financial Measures 17 2015 2014 2015 2014 Reconciliation of Adjusted Operating Profit to Operating Profit Adjusted operating profit 35.9$ 34.2$ 61.7$ 59.8$ Total items impacting comparability (5.1) (6.3) (11.7) (8.0) Operating profit 30.8$ 27.9$ 50.0$ 51.8$ Reconciliation of Adjusted EBITDA to Net Income Adjusted EBITDA 52.5$ 49.4$ 93.8$ 90.9$ Items impacting comparability (5.1) (6.3) (11.7) (8.0) Provision for income taxes (12.2) (11.2) (12.5) (20.8) Interest expense (2.5) (2.7) (5.2) (5.4) Depreciation and amortization (14.4) (14.0) (28.4) (28.4) Net income 18.3$ 15.2$ 36.0$ 28.3$ 2015 2014 2015 2014 Adjusted net income per diluted share 0.37$ 0.33$ 0.75$ 0.58$ Items impacting comparability, net of taxes (0.05) (0.06) (0.12) (0.08) Net income per diluted share 0.32$ 0.27$ 0.63$ 0.50$ Diluted shares 57.6 57.0 57.4 57.0 Six Months Ended April 30, Six Months Ended April 30, Three Months Ended April 30, Three Months Ended April 30, Reconciliation of Adjusted Net Income per Diluted Share to Net Income per Diluted Share

Unaudited Reconciliation of non - GAAP Financial Measures 18 ABM INDUSTRIES INCORPORATED AND SUBSIDIARIES RECONCILIATION OF ESTIMATED ADJUSTED NET INCOME PER DILUTED SHARE TO ESTIMATED NET INCOME PER DILUTED SHARE FOR THE YEAR ENDING OCTOBER 31, 2015 Estimated net income per diluted share (a) Low Estimate High Estimate Adjusted net income per diluted share 1.75$ 1.85$ Adjustments (b) (0.20)$ (0.20)$ Net income per diluted share 1.55$ 1.65$ (b) Adjustments include certain rebranding costs and legal settlements, adjustments to self- insurance reserves pertaining to prior year's claims and other unique items impacting comparability. Year Ending October 31, 2015 (per diluted share) (a) This guidance excludes potential benefit associated with the Work Opportunity Tax Credit for calendar 2015. If Congress were to extend the WOTC for calendar 2015 prior to October 31, 2015, the Company could have a further benefit of $0.08 per diluted share.