Attached files
| file | filename |
|---|---|
| 8-K - 8-K - Forestar Group Inc. | form8-kxinvestorpresentati.htm |

Investor Presentation June 2015
Notice to Investors This presentation contains “forward-looking statements” within the meaning of the federal securities laws. Forward-looking statements are typically identified by words or phrases such as “will,” “anticipate,” “estimate,” “expect,” “project,” “intend,” “plan,” “believe,” “target,” “forecast,” and other words and terms of similar meaning. These statements reflect management’s current views with respect to future events and are subject to risk and uncertainties. We note that a variety of factors and uncertainties could cause our actual results to differ significantly from the results discussed in the forward-looking statements, including but not limited to: general economic, market, or business conditions; changes in commodity prices; opportunities (or lack thereof) that may be presented to us and that we may pursue; fluctuations in costs and expenses including development costs; demand for new housing, including impacts from mortgage credit rates or availability; lengthy and uncertain entitlement processes; cyclicality of our businesses; accuracy of accounting assumptions; competitive actions by other companies; changes in laws or regulations; and other factors, many of which are beyond our control. Except as required by law, we expressly disclaim any obligation to publicly revise any forward-looking statements contained in this presentation to reflect the occurrence of events after the date of this presentation. This presentation includes Non-GAAP financial measures. The required reconciliation to GAAP financial measures can be found as an exhibit to this presentation and on our website at www.forestargroup.com. 2
• Acquiring, Entitling and Developing Residential and Mixed-Use Communities • Investing in Multifamily Opportunities, Including Projects That Provide Additional Recurring Cash Flow • Harvesting Cash Flow From Oil and Gas By Significantly Lowering Capital Investments and Operating Costs • Transitioning Timberland into Real Estate Properties Forestar Focused On Growing Core Real Estate Business Following Strategic Review 3 Strategic Review Focused on Maximizing Long-Term Shareholder Value, Establishing Solid Real Estate Growth Platform and Maintaining Financial Flexibility
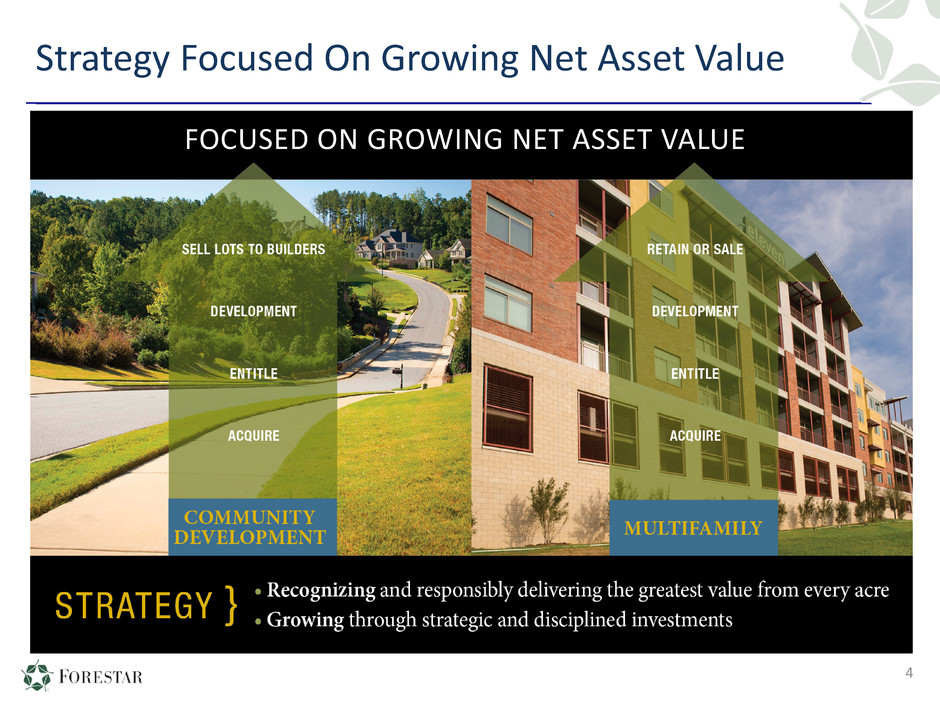
Strategy Focused On Growing Net Asset Value 4 FOCUSED ON GROWING NET ASSET VALUE
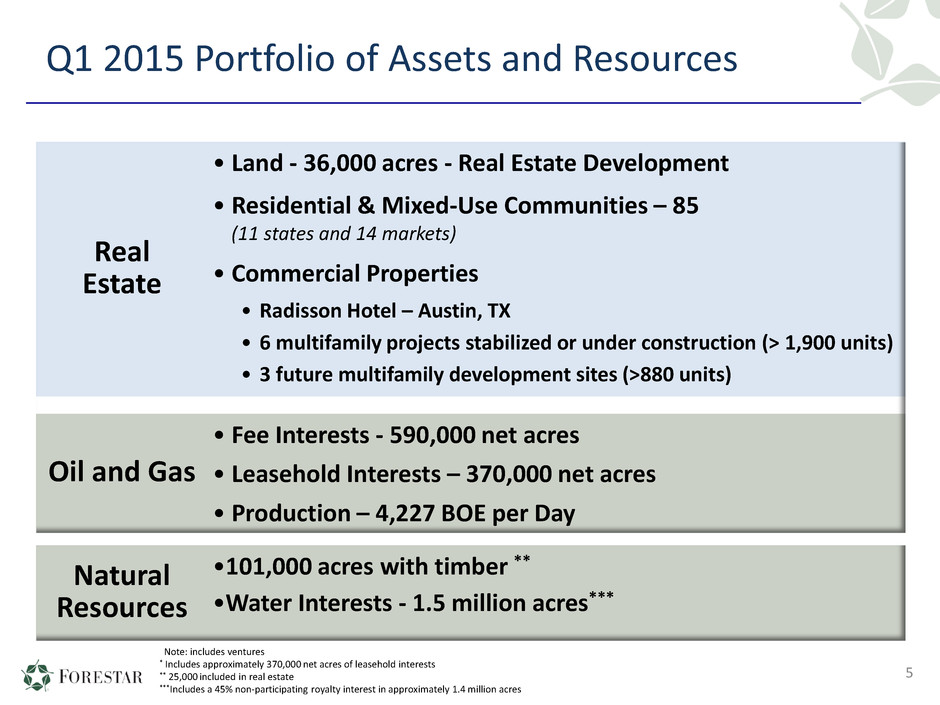
Q1 2015 Portfolio of Assets and Resources 5 Real Estate • Land - 36,000 acres - Real Estate Development • Residential & Mixed-Use Communities – 85 (11 states and 14 markets) • Commercial Properties • Radisson Hotel – Austin, TX • 6 multifamily projects stabilized or under construction (> 1,900 units) • 3 future multifamily development sites (>880 units) Oil and Gas • Fee Interests - 590,000 net acres • Leasehold Interests – 370,000 net acres • Production – 4,227 BOE per Day Natural Resources •101,000 acres with timber ** •Water Interests - 1.5 million acres*** Note: includes ventures * Includes approximately 370,000 net acres of leasehold interests ** 25,000 included in real estate ***Includes a 45% non-participating royalty interest in approximately 1.4 million acres
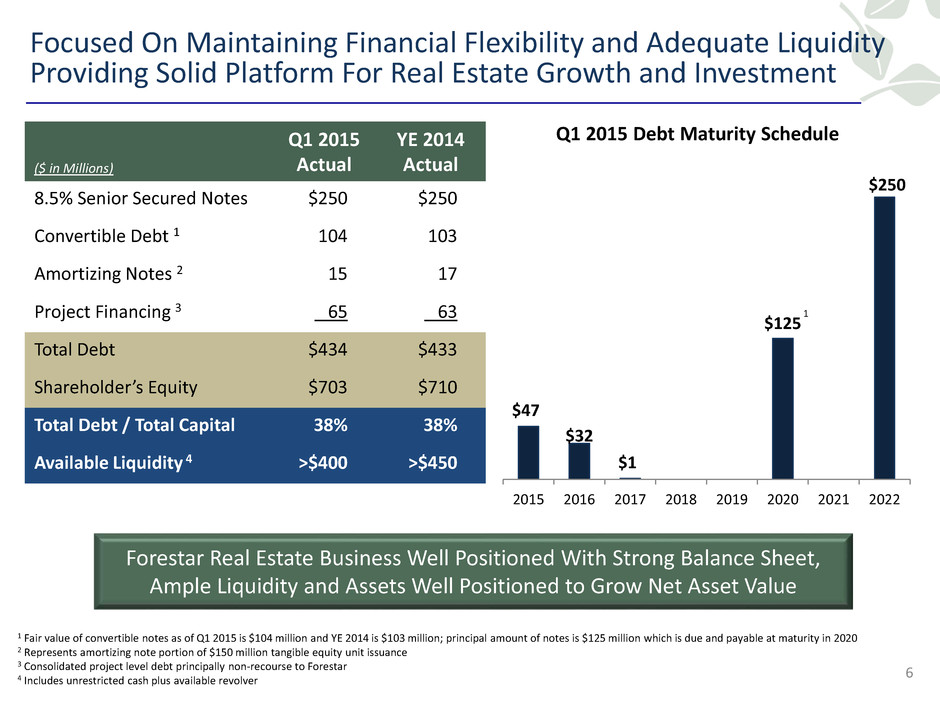
$47 $32 $1 $125 $250 2015 2016 2017 2018 2019 2020 2021 2022 Focused On Maintaining Financial Flexibility and Adequate Liquidity Providing Solid Platform For Real Estate Growth and Investment 6 ($ in Millions) Q1 2015 Actual YE 2014 Actual 8.5% Senior Secured Notes $250 $250 Convertible Debt 1 104 103 Amortizing Notes 2 15 17 Project Financing 3 65 63 Total Debt $434 $433 Shareholder’s Equity $703 $710 Total Debt / Total Capital 38% 38% Available Liquidity 4 >$400 >$450 1 Q1 2015 Debt Maturity Schedule Forestar Real Estate Business Well Positioned With Strong Balance Sheet, Ample Liquidity and Assets Well Positioned to Grow Net Asset Value 1 Fair value of convertible notes as of Q1 2015 is $104 million and YE 2014 is $103 million; principal amount of notes is $125 million which is due and payable at maturity in 2020 2 Represents amortizing note portion of $150 million tangible equity unit issuance 3 Consolidated project level debt principally non-recourse to Forestar 4 Includes unrestricted cash plus available revolver

Morgan Farms - Tennessee
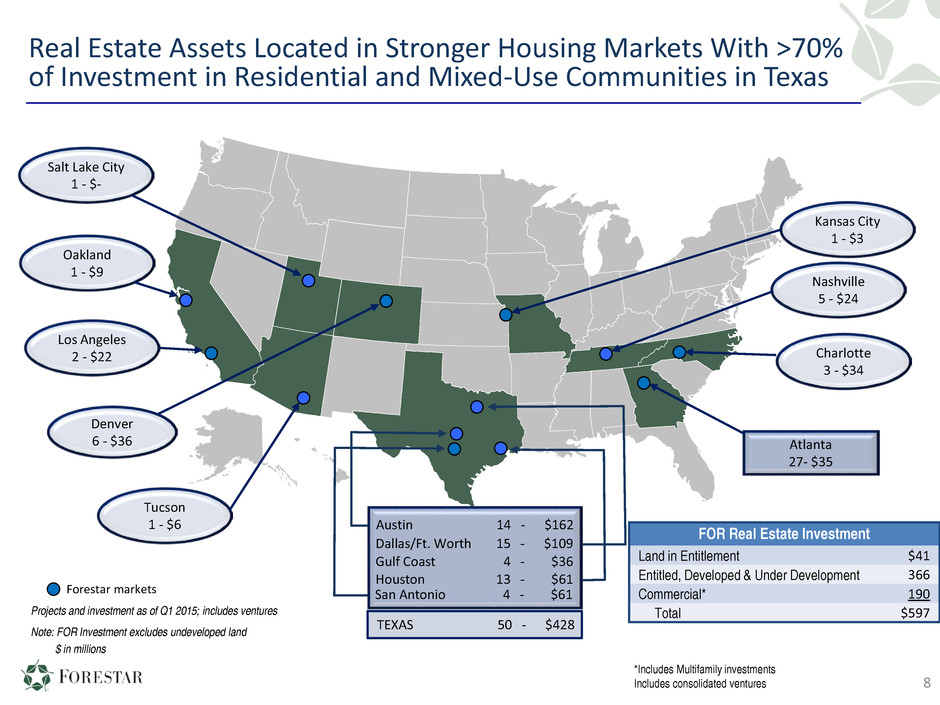
Real Estate Assets Located in Stronger Housing Markets With >70% of Investment in Residential and Mixed-Use Communities in Texas 8 Salt Lake City 1 - $- Oakland 1 - $9 Los Angeles 2 - $22 Denver 6 - $36 Kansas City 1 - $3 Nashville 5 - $24 Atlanta 27- $35 Austin 14 - $162 Dallas/Ft. Worth 15 - $109 Gulf Coast 4 - $36 Houston 13 - $61 San Antonio 4 - $61 TEXAS 50 - $428 Forestar markets $ in millions Projects and investment as of Q1 2015; includes ventures Note: FOR Investment excludes undeveloped land Charlotte 3 - $34 Tucson 1 - $6 FOR Real Estate Investment Land in Entitlement $41 Entitled, Developed & Under Development 366 Commercial* 190 Total $597 *Includes Multifamily investments Includes consolidated ventures
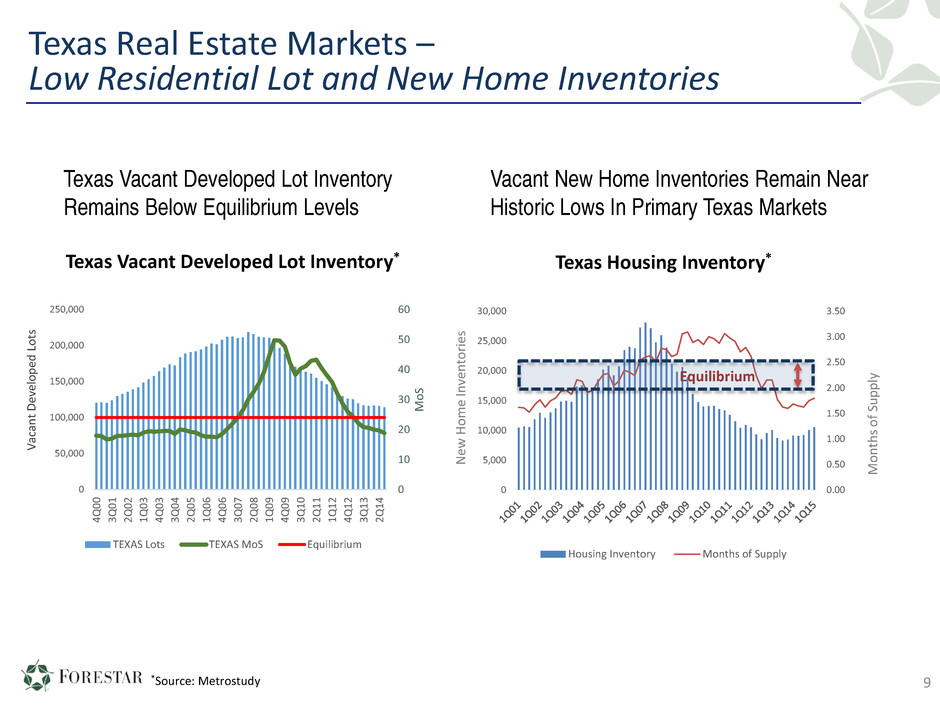
Texas Real Estate Markets – Low Residential Lot and New Home Inventories 9 Texas Housing Inventory* 0.00 0.50 1.00 1.50 2.00 2.50 3.00 3.50 0 5,000 10,000 15,000 20,000 25,000 30,000 Housing Inventory Months of Supply Equilibrium M on th s of S up pl y N ew H om e In ve nt or ie s Vacant New Home Inventories Remain Near Historic Lows In Primary Texas Markets *Source: Metrostudy Texas Vacant Developed Lot Inventory* 0 10 20 30 40 50 60 0 50,000 100,000 150,000 200,000 250,000 4Q 00 3Q 01 2Q 02 1Q 03 4Q 03 3Q 04 2Q 05 1Q 06 4Q 06 3Q 07 2Q 08 1Q 09 4Q 09 3Q 10 2Q 11 1Q 12 4Q 12 3Q 13 2Q 14 M oS TEXAS Lots TEXAS MoS Equilibrium V ac an t D ev el op ed L ot s Texas Vacant Developed Lot Inventory Remains Below Equilibrium Levels
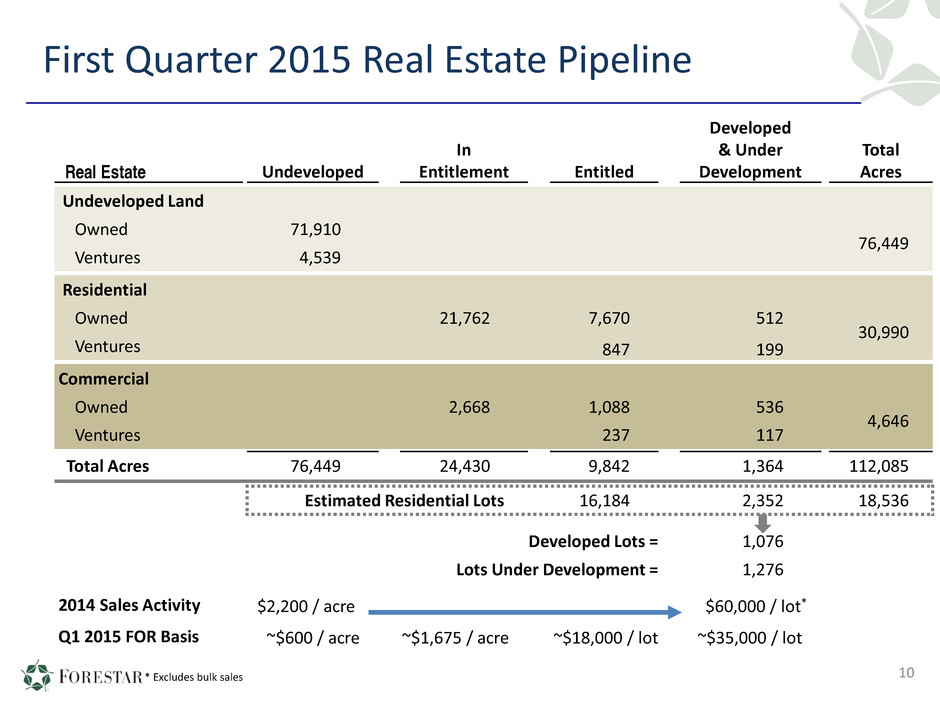
First Quarter 2015 Real Estate Pipeline 10 Real Estate Undeveloped In Entitlement Entitled Developed & Under Development Total Acres Undeveloped Land Owned 71,910 76,449 Ventures 4,539 Residential Owned 21,762 7,670 512 30,990 Ventures 847 199 Commercial Owned 2,668 1,088 536 4,646 Ventures 237 117 Total Acres 76,449 24,430 9,842 1,364 112,085 Estimated Residential Lots 16,184 2,352 18,536 Developed Lots = 1,076 Lots Under Development = 1,276 2014 Sales Activity $2,200 / acre $60,000 / lot* Q1 2015 FOR Basis ~$600 / acre ~$1,675 / acre ~$18,000 / lot ~$35,000 / lot * Excludes bulk sales
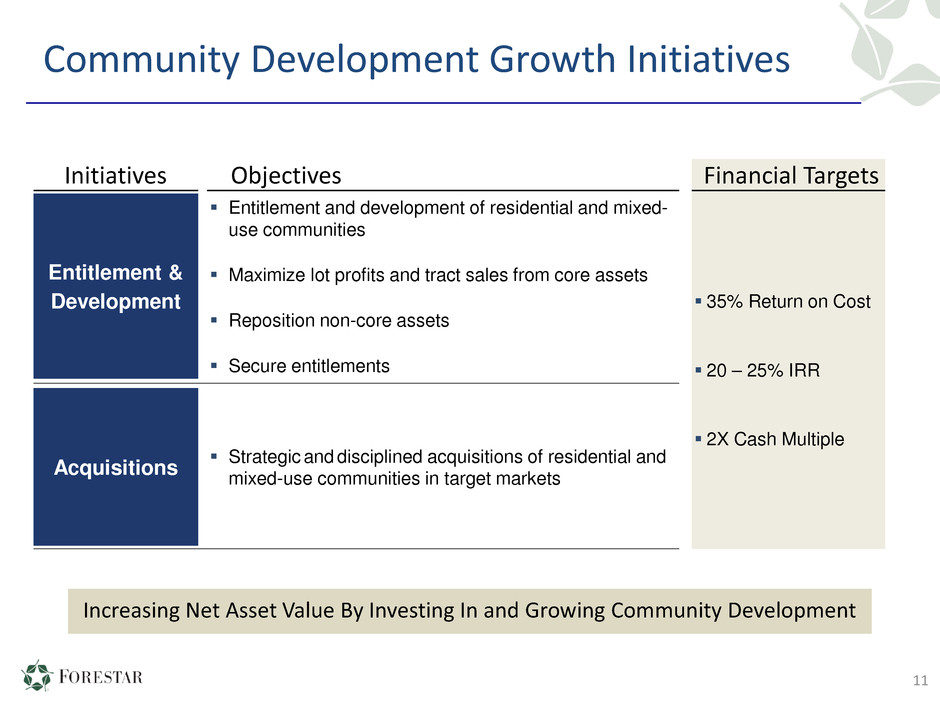
11 Community Development Growth Initiatives Initiatives Objectives Financial Targets Entitlement & Development Entitlement and development of residential and mixed- use communities Maximize lot profits and tract sales from core assets Reposition non-core assets Secure entitlements 35% Return on Cost 20 – 25% IRR 2X Cash Multiple Acquisitions Strategic and disciplined acquisitions of residential and mixed-use communities in target markets Increasing Net Asset Value By Investing In and Growing Community Development
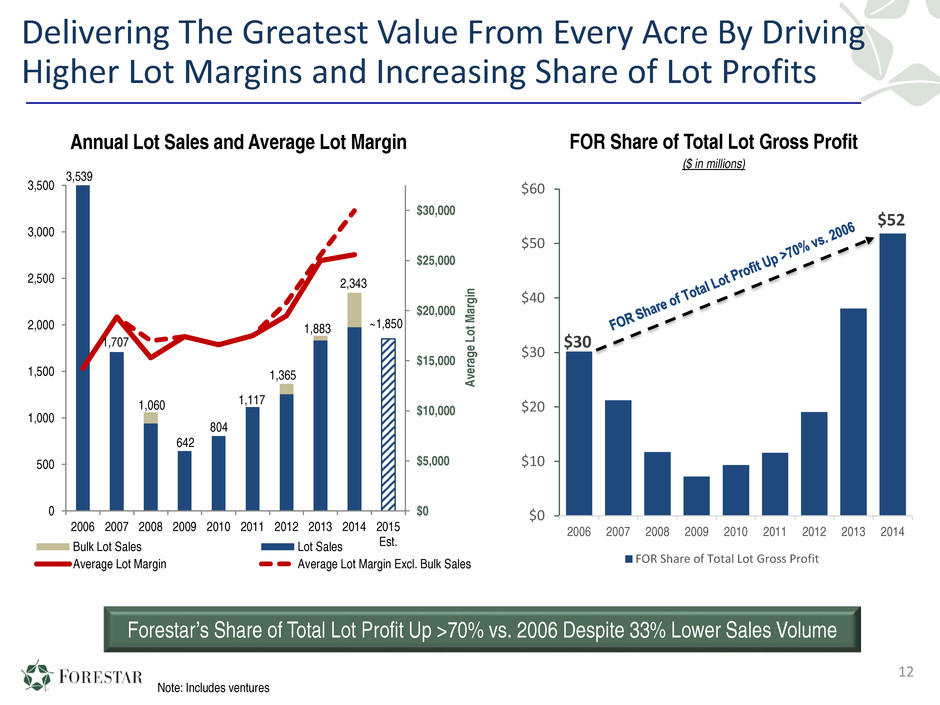
1,707 $0 $5,000 $10,000 $15,000 $20,000 $25,000 $30,000 0 500 1,000 1,500 2,000 2,500 3,000 3,500 2006 2007 2008 2009 2010 2011 2012 2013 2014 2015 Est.Bulk Lot Sales Lot Sales Average Lot Margin Average Lot Margin Excl. Bulk Sales Delivering The Greatest Value From Every Acre By Driving Higher Lot Margins and Increasing Share of Lot Profits Annual Lot Sales and Average Lot Margin Note: Includes ventures 1,060 642 804 1,117 1,365 1,883 2,343 FOR Share of Total Lot Gross Profit ($ in millions) $30 $52 $0 $10 $20 $30 $40 $50 $60 2006 2007 2008 2009 2010 2011 2012 2013 2014 FOR Share of Total Lot Gross Profit Av er ag e Lo t M ar gi n 12 ~1,850 Forestar’s Share of Total Lot Profit Up >70% vs. 2006 Despite 33% Lower Sales Volume 3,539
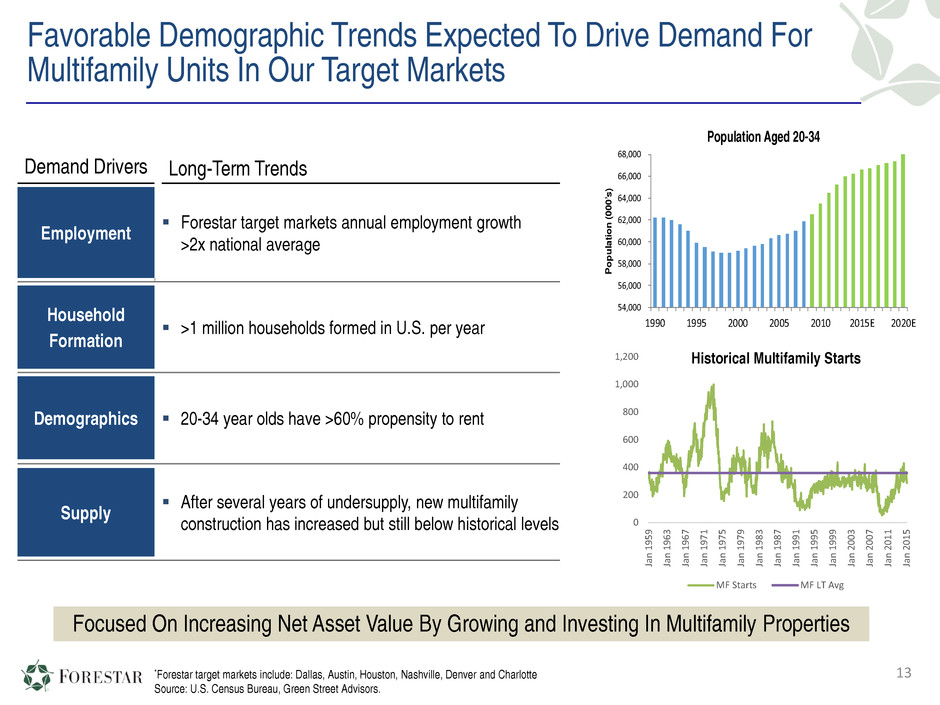
Favorable Demographic Trends Expected To Drive Demand For Multifamily Units In Our Target Markets 13 Focused On Increasing Net Asset Value By Growing and Investing In Multifamily Properties 54,000 56,000 58,000 60,000 62,000 64,000 66,000 68,000 1990 1995 2000 2005 2010 2015E 2020E P o p u la ti o n ( 0 0 0 ’s ) Population Aged 20-34 *Forestar target markets include: Dallas, Austin, Houston, Nashville, Denver and Charlotte Source: U.S. Census Bureau, Green Street Advisors. Demand Drivers Long-Term Trends Employment Forestar target markets annual employment growth >2x national average Z Z Household Formation >1 million households formed in U.S. per year Demographics 20-34 year olds have >60% propensity to rent Supply After several years of undersupply, new multifamily construction has increased but still below historical levels 0 200 400 600 800 1,000 1,200 Ja n 19 59 Ja n 19 63 Ja n 19 67 Ja n 19 71 Ja n 19 75 Ja n 19 79 Ja n 19 83 Ja n 19 87 Ja n 19 91 Ja n 19 95 Ja n 19 99 Ja n 20 03 Ja n 20 07 Ja n 20 11 Ja n 20 15 MF Starts MF LT Avg Historical Multifamily Starts
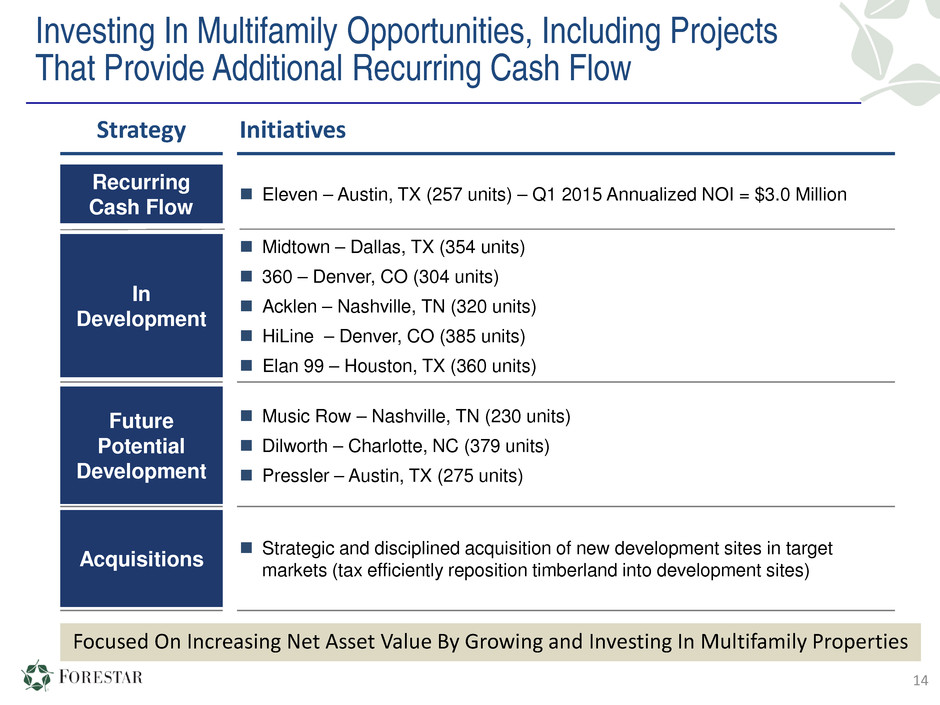
14 Investing In Multifamily Opportunities, Including Projects That Provide Additional Recurring Cash Flow Strategy Initiatives Recurring Cash Flow Eleven – Austin, TX (257 units) – Q1 2015 Annualized NOI = $3.0 Million In Development Midtown – Dallas, TX (354 units) 360 – Denver, CO (304 units) Acklen – Nashville, TN (320 units) HiLine – Denver, CO (385 units) Elan 99 – Houston, TX (360 units) 3 Future Potential Development Music Row – Nashville, TN (230 units) Dilworth – Charlotte, NC (379 units) Pressler – Austin, TX (275 units) Acquisitions Strategic and disciplined acquisition of new development sites in target markets (tax efficiently reposition timberland into development sites) Focused On Increasing Net Asset Value By Growing and Investing In Multifamily Properties
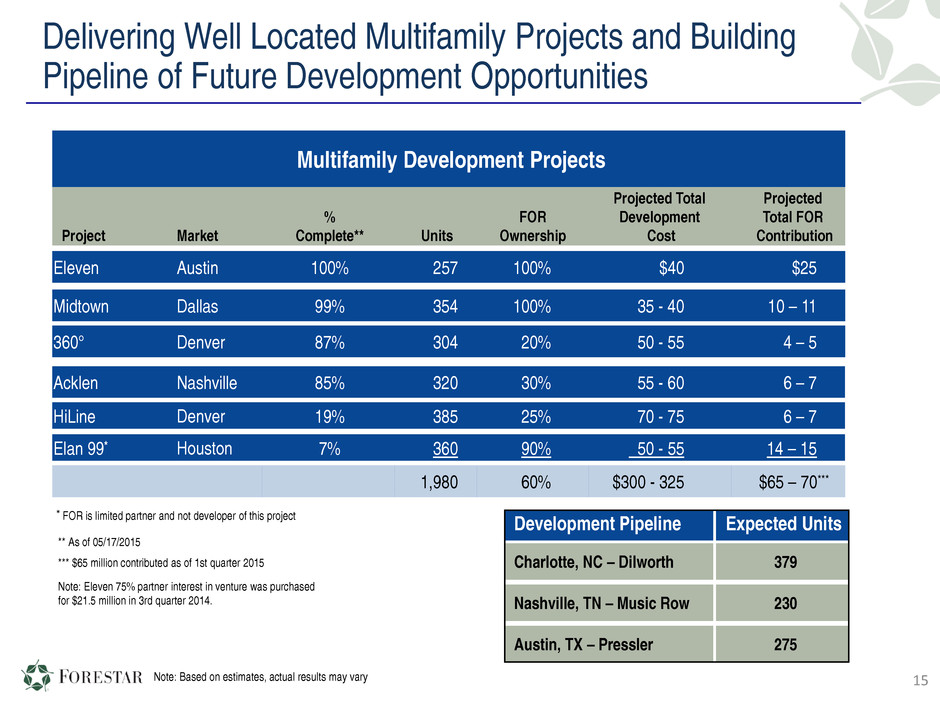
Delivering Well Located Multifamily Projects and Building Pipeline of Future Development Opportunities Multifamily Development Projects Project Market % Complete** Units FOR Ownership Projected Total Development Cost Projected Total FOR Contribution Eleven Austin 100% 257 100% $40 $25 Midtown Dallas 99% 354 100% 35 - 40 10 – 11 360° Denver 87% 304 20% 50 - 55 4 – 5 Acklen Nashville 85% 320 30% 55 - 60 6 – 7 HiLine Denver 19% 385 25% 70 - 75 6 – 7 Elan 99* Houston 7% 360 90% 50 - 55 14 – 15 1,980 60% $300 - 325 $65 – 70*** Development Pipeline Expected Units Charlotte, NC – Dilworth 379 Nashville, TN – Music Row 230 Austin, TX – Pressler 275 * FOR is limited partner and not developer of this project Note: Eleven 75% partner interest in venture was purchased for $21.5 million in 3rd quarter 2014. 15Note: Based on estimates, actual results may vary ** As of 05/17/2015 *** $65 million contributed as of 1st quarter 2015

Developing Portfolio of Class A Multifamily Projects 16 Eleven – Austin, Texas 360 – Denver, Colorado HiLine – Denver, ColoradoAcklen – Nashville, Tennessee • 257 Units – Located by downtown Austin near new medical school • 100% completed; 95% leased; 93% occupied • 304 Units – Located near Denver Tech Center. Major employment and shopping. • 87% completed; 45% leased; 36% occupied • 320 Units – Located in west end Nashville. Near shopping, dining and nightlife. • 85% completed; 22% leased • 385 Units – Located in Littleton. Employment and retail, close to Denver light rail. • 19% completed Note: Lease and occupancy rates as of 05/17/2015
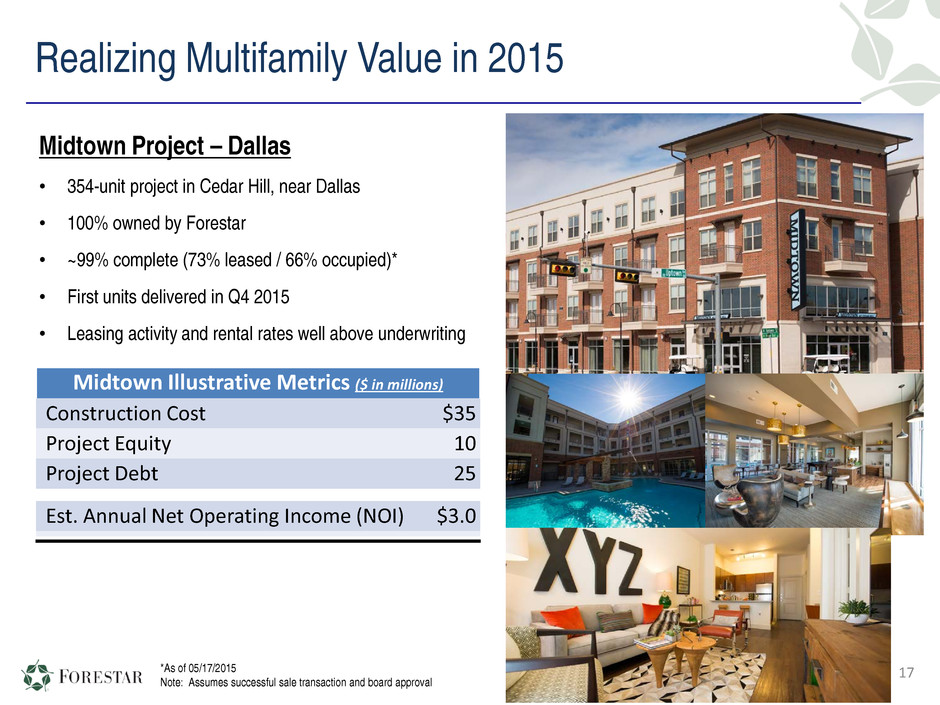
17 Realizing Multifamily Value in 2015 Midtown Project – Dallas • 354-unit project in Cedar Hill, near Dallas • 100% owned by Forestar • ~99% complete (73% leased / 66% occupied)* • First units delivered in Q4 2015 • Leasing activity and rental rates well above underwriting Midtown Illustrative Metrics ($ in millions) Construction Cost $35 Project Equity 10 Project Debt 25 Est. Annual Net Operating Income (NOI) $3.0 *As of 05/17/2015 Note: Assumes successful sale transaction and board approval
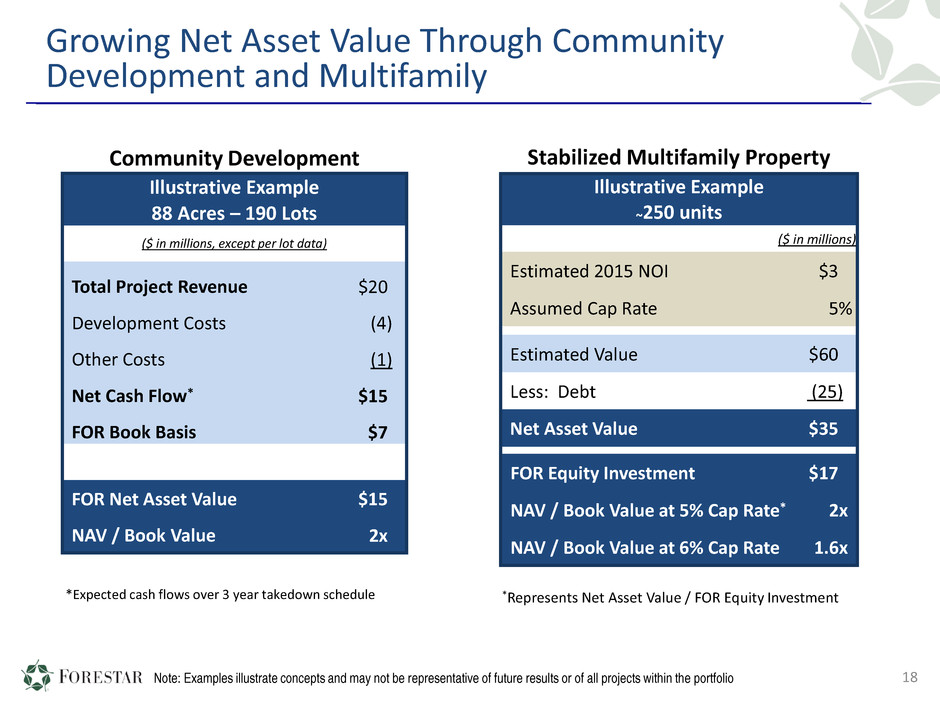
Growing Net Asset Value Through Community Development and Multifamily 18 Stabilized Multifamily Property Illustrative Example ~250 units ($ in millions) Estimated 2015 NOI $3 Assumed Cap Rate 5% Estimated Value $60 Less: Debt (25) Net Asset Value $35 FOR Equity Investment $17 NAV / Book Value at 5% Cap Rate* 2x NAV / Book Value at 6% Cap Rate 1.6x Community Development Illustrative Example 88 Acres – 190 Lots ($ in millions, except per lot data) Total Project Revenue $20 Development Costs (4) Other Costs (1) Net Cash Flow* $15 FOR Book Basis $7 FOR Net Asset Value $15 NAV / Book Value 2x *Represents Net Asset Value / FOR Equity Investment*Expected cash flows over 3 year takedown schedule Note: Examples illustrate concepts and may not be representative of future results or of all projects within the portfolio
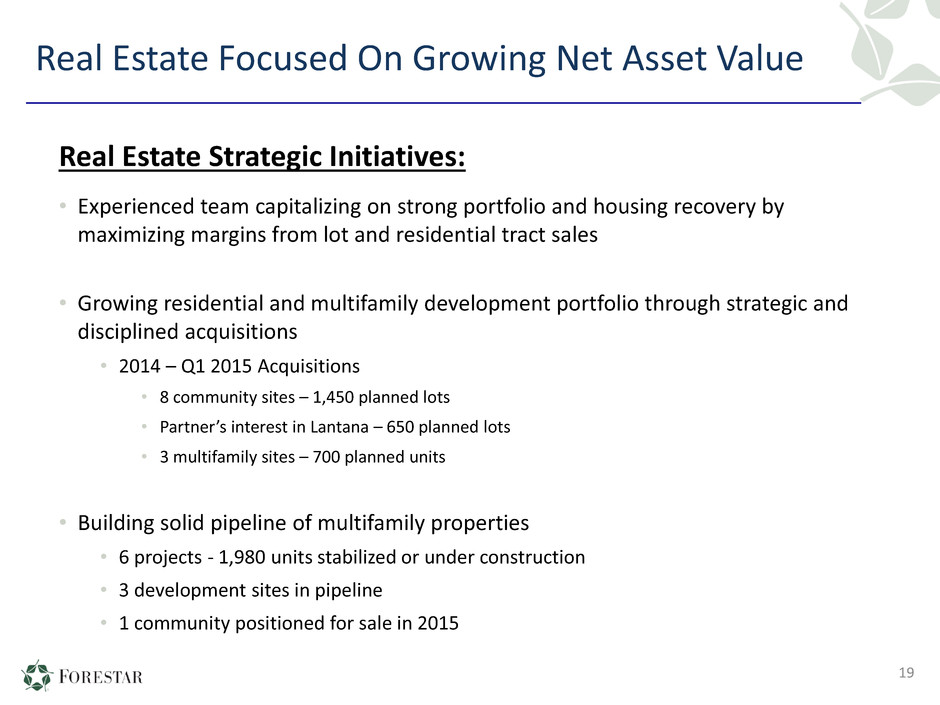
Real Estate Focused On Growing Net Asset Value Real Estate Strategic Initiatives: • Experienced team capitalizing on strong portfolio and housing recovery by maximizing margins from lot and residential tract sales • Growing residential and multifamily development portfolio through strategic and disciplined acquisitions • 2014 – Q1 2015 Acquisitions • 8 community sites – 1,450 planned lots • Partner’s interest in Lantana – 650 planned lots • 3 multifamily sites – 700 planned units • Building solid pipeline of multifamily properties • 6 projects - 1,980 units stabilized or under construction • 3 development sites in pipeline • 1 community positioned for sale in 2015 19
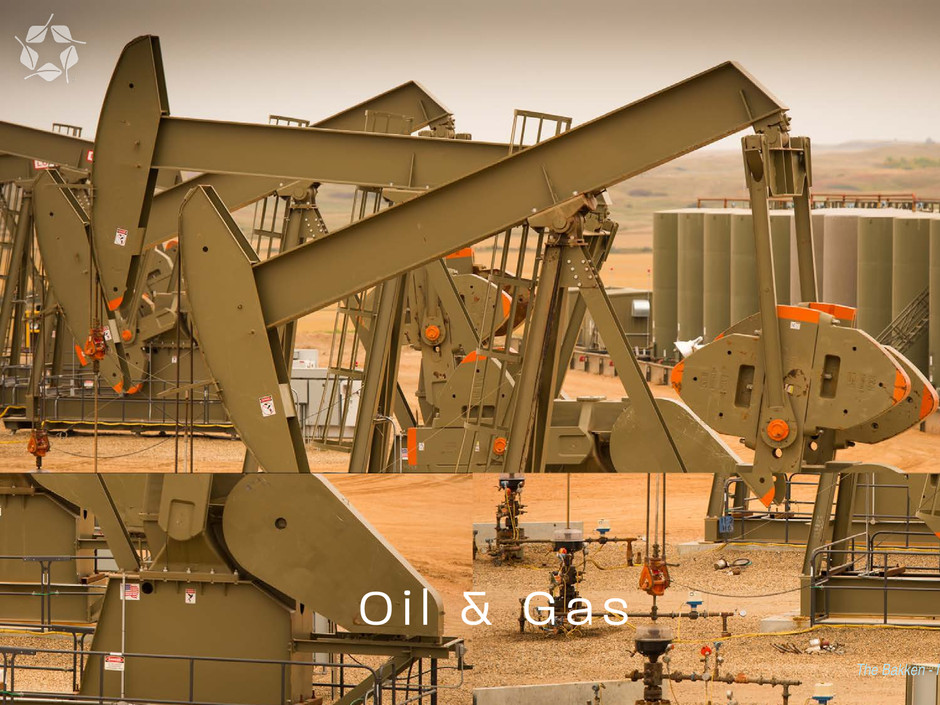
The Bakken - N
Harvesting Cash Flow From Non-Core Oil and Gas Operating Assets By Significantly Lowering Investments and Reducing Costs 21 Oil and Gas Strategic Initiatives: Planned 50% reduction in operating expenses vs 2014* Closed Fort Worth office and reduced headcount by ~50% 2015 capital investments planned to be down significantly vs. 2014 • 2015 investments principally associated with 2014 well commitments and completions • Core Bakken / Three Forks opportunities that meet disciplined return criteria • Expect drilling activity to continue to slow vs. 2014 at current strip pricing Target cash flow positive in 2015* * Excluding restructuring costs; actual results may vary
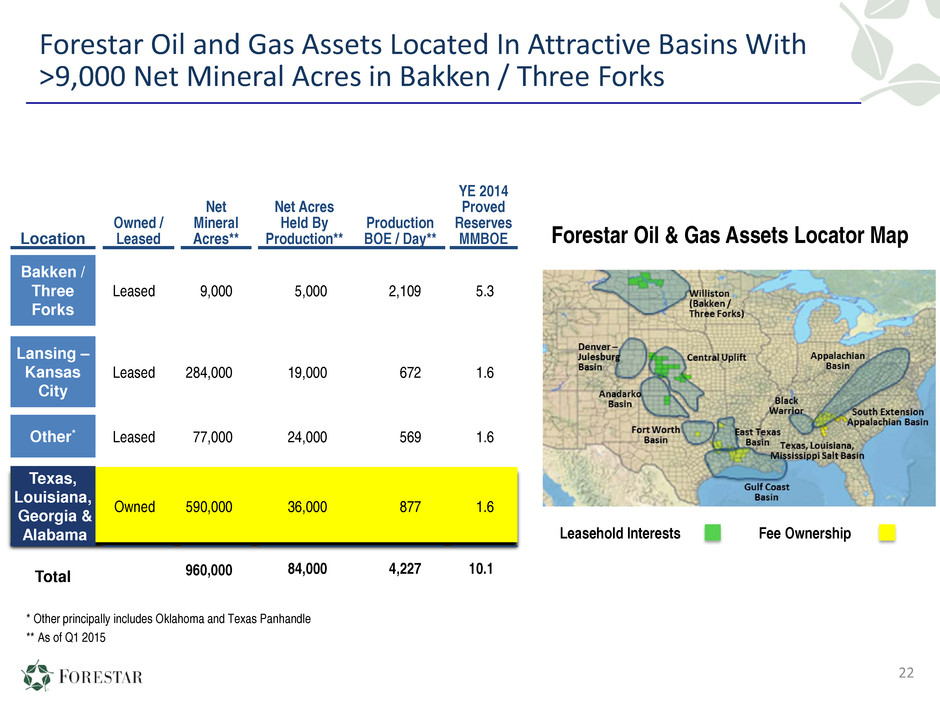
Location Owned / Leased Net Mineral Acres** Net Acres Held By Production** Production BOE / Day** YE 2014 Proved Reserves MMBOE Bakken / Three Forks Leased 9,000 5,000 2,109 5.3 Lansing – Kansas City Leased 284,000 19,000 672 1.6 Other* Leased 77,000 24,000 569 1.6 Texas, Louisiana, Georgia & Alabama Owned 590,000 36,000 877 1.6 Total 960,000 84,000 4,227 10.1 22 Forestar Oil and Gas Assets Located In Attractive Basins With >9,000 Net Mineral Acres in Bakken / Three Forks * Other principally includes Oklahoma and Texas Panhandle ** As of Q1 2015 Forestar Oil & Gas Assets Locator Map Leasehold Interests Fee Ownership
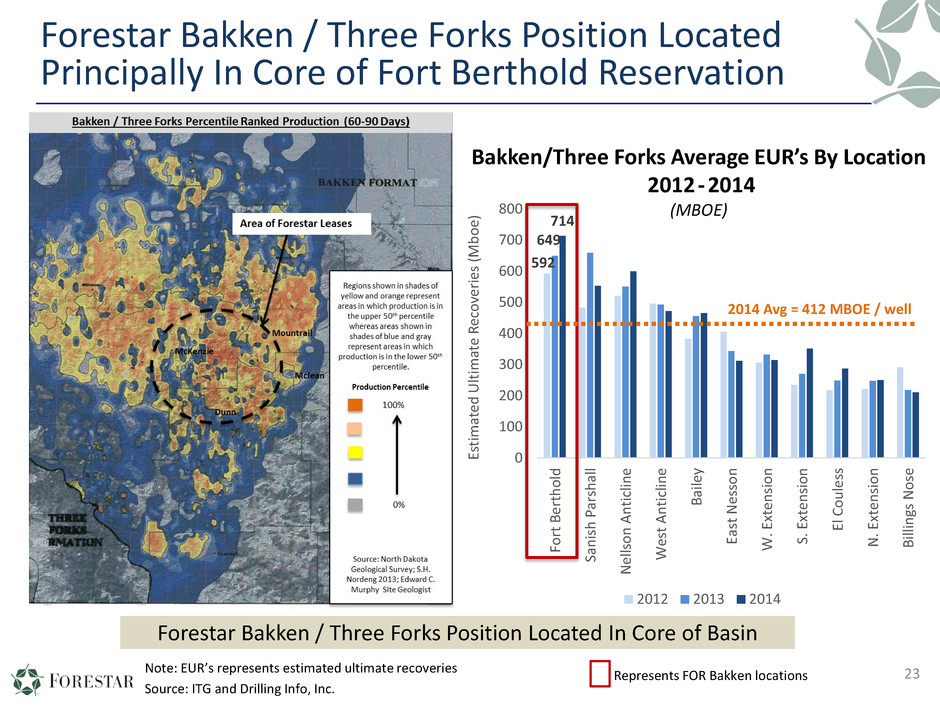
Forestar Bakken / Three Forks Position Located Principally In Core of Fort Berthold Reservation 23Note: EUR’s represents estimated ultimate recoveries Source: ITG and Drilling Info, Inc. Forestar Bakken / Three Forks Position Located In Core of Basin 592 649 714 0 100 200 300 400 500 600 700 800 Fo rt B er th ol d Sa ni sh P ar sh al l N el ls on A nt ic lin e W es t A nt ic lin e Ba ile y Ea st N es so n W . E xt en si on S. E xt en si on El C ou le ss N . E xt en si on Bi lli ng s N os e Es ti m at ed U lt im at e Re co ve ri es (M bo e) 2012 2013 2014 2014 Avg = 412 MBOE / well Represents FOR Bakken locations Bakken/Three Forks Average EUR’s By Location 2012- 2014 (MBOE)
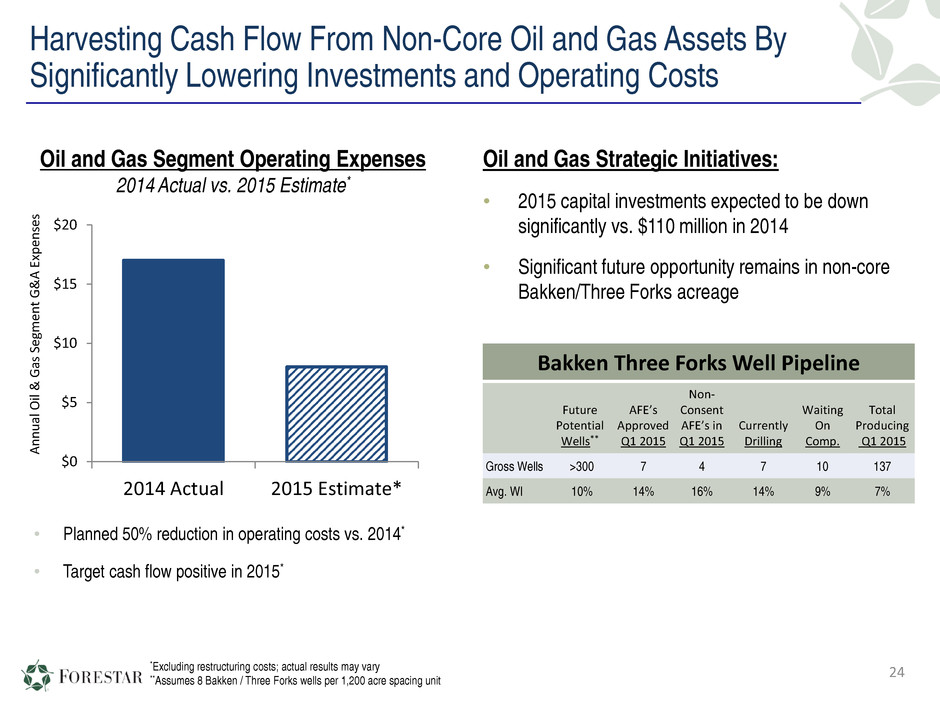
Harvesting Cash Flow From Non-Core Oil and Gas Assets By Significantly Lowering Investments and Operating Costs Oil and Gas Strategic Initiatives: • 2015 capital investments expected to be down significantly vs. $110 million in 2014 • Significant future opportunity remains in non-core Bakken/Three Forks acreage 24 *Excluding restructuring costs; actual results may vary **Assumes 8 Bakken / Three Forks wells per 1,200 acre spacing unit $0 $5 $10 $15 $20 2014 Actual 2015 Estimate* A nn ua l O il & G as S eg m en t G & A E xp en se s Oil and Gas Segment Operating Expenses 2014 Actual vs. 2015 Estimate* Bakken Three Forks Well Pipeline Future Potential Wells** AFE’s Approved Q1 2015 Non- Consent AFE’s in Q1 2015 Currently Drilling Waiting On Comp. Total Producing Q1 2015 Gross Wells >300 7 4 7 10 137 Avg. WI 10% 14% 16% 14% 9% 7% • Planned 50% reduction in operating costs vs. 2014* • Target cash flow positive in 2015*

Georgia
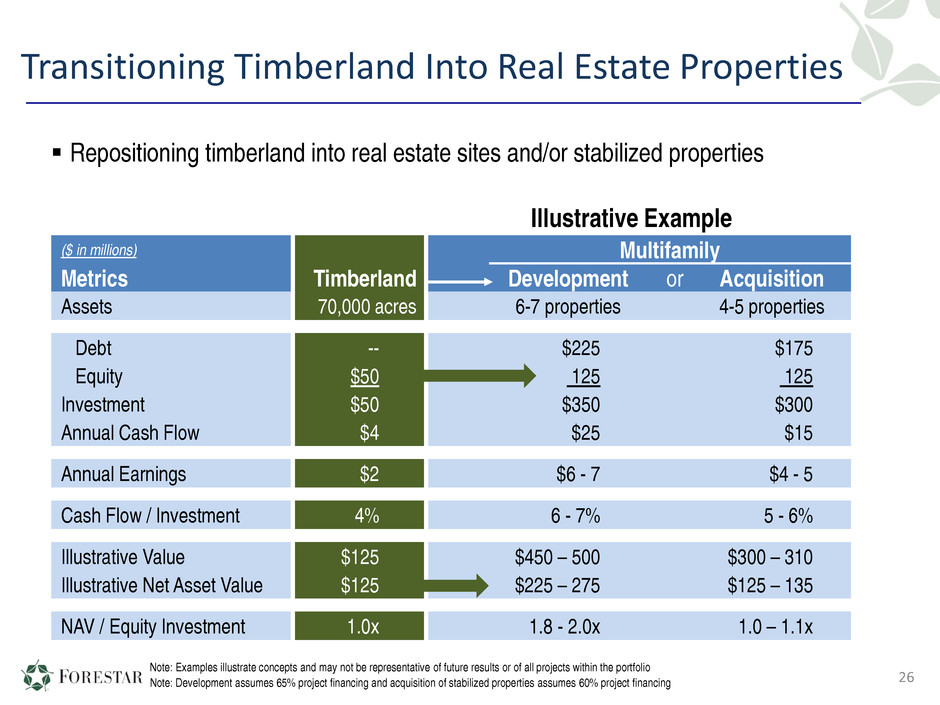
26 Transitioning Timberland Into Real Estate Properties ($ in millions) Multifamily Metrics Timberland Development or Acquisition Assets 70,000 acres 6-7 properties 4-5 properties Debt -- $225 $175 Equity $50 125 125 Investment $50 $350 $300 Annual Cash Flow $4 $25 $15 Annual Earnings $2 $6 - 7 $4 - 5 Cash Flow / Investment 4% 6 - 7% 5 - 6% Illustrative Value $125 $450 – 500 $300 – 310 Illustrative Net Asset Value $125 $225 – 275 $125 – 135 NAV / Equity Investment 1.0x 1.8 - 2.0x 1.0 – 1.1x Illustrative Example Repositioning timberland into real estate sites and/or stabilized properties Note: Development assumes 65% project financing and acquisition of stabilized properties assumes 60% project financing Note: Examples illustrate concepts and may not be representative of future results or of all projects within the portfolio

Strategic Review Update 27
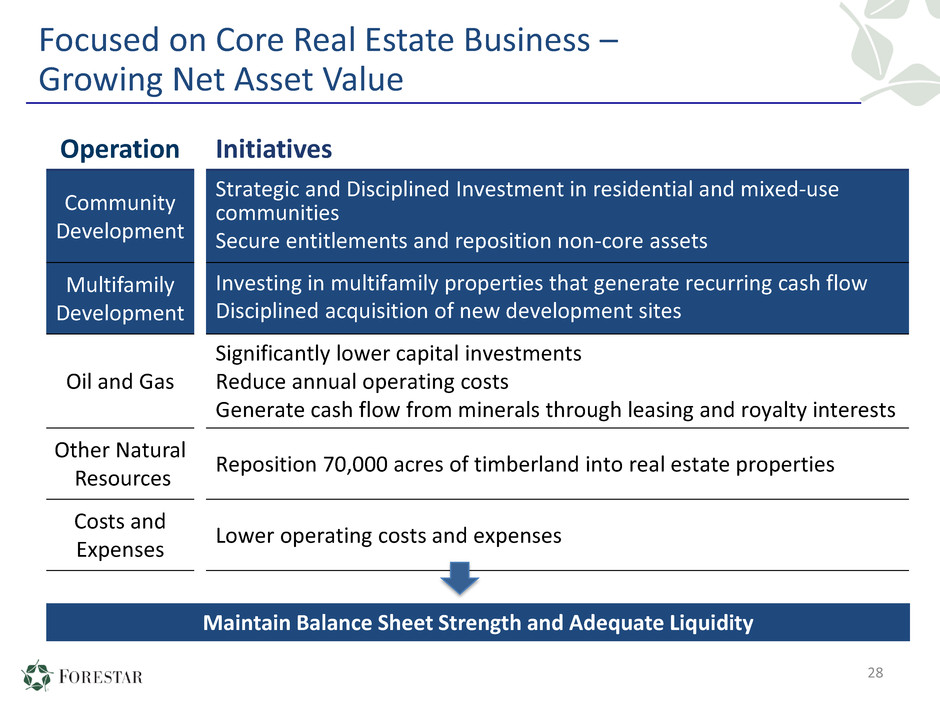
Operation Initiatives Community Development Strategic and Disciplined Investment in residential and mixed-use communities Secure entitlements and reposition non-core assets Multifamily Development Investing in multifamily properties that generate recurring cash flow Disciplined acquisition of new development sites Oil and Gas Significantly lower capital investments Reduce annual operating costs Generate cash flow from minerals through leasing and royalty interests Other Natural Resources Reposition 70,000 acres of timberland into real estate properties Costs and Expenses Lower operating costs and expenses Focused on Core Real Estate Business – Growing Net Asset Value 28 Maintain Balance Sheet Strength and Adequate Liquidity

29
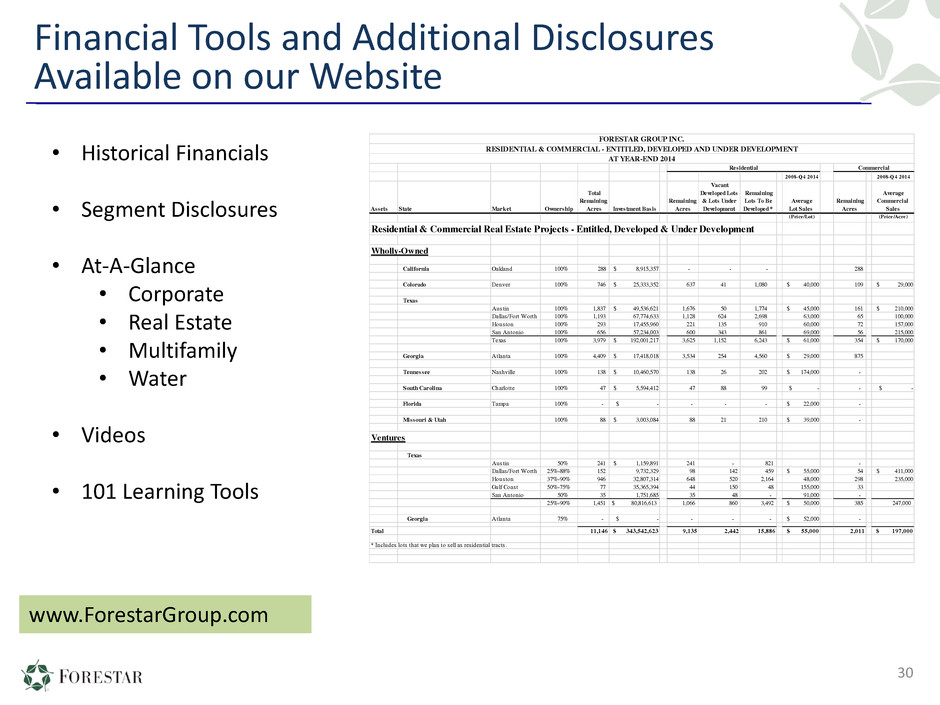
Financial Tools and Additional Disclosures Available on our Website 30 www.ForestarGroup.com • Historical Financials • Segment Disclosures • At-A-Glance • Corporate • Real Estate • Multifamily • Water • Videos • 101 Learning Tools 2008-Q 4 2014 2008-Q 4 2014 Assets State Market Ownership Total Remaining Acres Investment Basis Remaining Acres Vacant Developed Lots & Lots Under Development Remaining Lots To Be Developed * Average Lot Sales Remaining Acres Average Commercial Sales (Price/Lot) (Price/Acre) Residential & Commercial Real Estate Projects - Entitled, Developed & Under Development Wholly-Owned California Oakland 100% 288 $ 8,915,357 - - - 288 Colorado Denver 100% 746 $ 25,333,352 637 41 1,080 $ 40,000 109 $ 29,000 Texas Austin 100% 1,837 $ 49,536,621 1,676 50 1,774 $ 45,000 161 $ 210,000 Dallas/Fort Worth 100% 1,193 67,774,633 1,128 624 2,698 63,000 65 100,000 Houston 100% 293 17,455,960 221 135 910 60,000 72 157,000 San Antonio 100% 656 57,234,003 600 343 861 69,000 56 215,000 Texas 100% 3,979 $ 192,001,217 3,625 1,152 6,243 $ 61,000 354 $ 170,000 Georgia Atlanta 100% 4,409 $ 17,418,018 3,534 254 4,560 $ 29,000 875 Tennessee Nashville 100% 138 $ 10,460,570 138 26 202 $ 174,000 - South Carolina Charlotte 100% 47 $ 5,594,412 47 88 99 $ - - $ - Florida Tampa 100% - $ - - - - $ 22,000 - Missouri & Utah 100% 88 $ 3,003,084 88 21 210 $ 39,000 - Ventures Texas Austin 50% 241 $ 1,159,891 241 - 821 - Dallas/Fort Worth 25%-88% 152 9,732,329 98 142 459 $ 55,000 54 $ 411,000 Houston 37%-90% 946 32,807,314 648 520 2,164 48,000 298 235,000 Gulf Coast 50%-75% 77 35,365,394 44 150 48 155,000 33 San Antonio 50% 35 1,751,685 35 48 - 91,000 - 25%-90% 1,451 $ 80,816,613 1,066 860 3,492 $ 50,000 385 247,000 Georgia Atlanta 75% - $ - - - - $ 52,000 - Total 11,146 $ 343,542,623 9,135 2,442 15,886 $ 55,000 2,011 $ 197,000 * Includes lots that we plan to sell as residential tracts. FORESTAR GROUP INC. RESIDENTIAL & COMMERCIAL - ENTITLED, DEVELOPED AND UNDER DEVELOPMENT Residential Commercial AT YEAR-END 2014
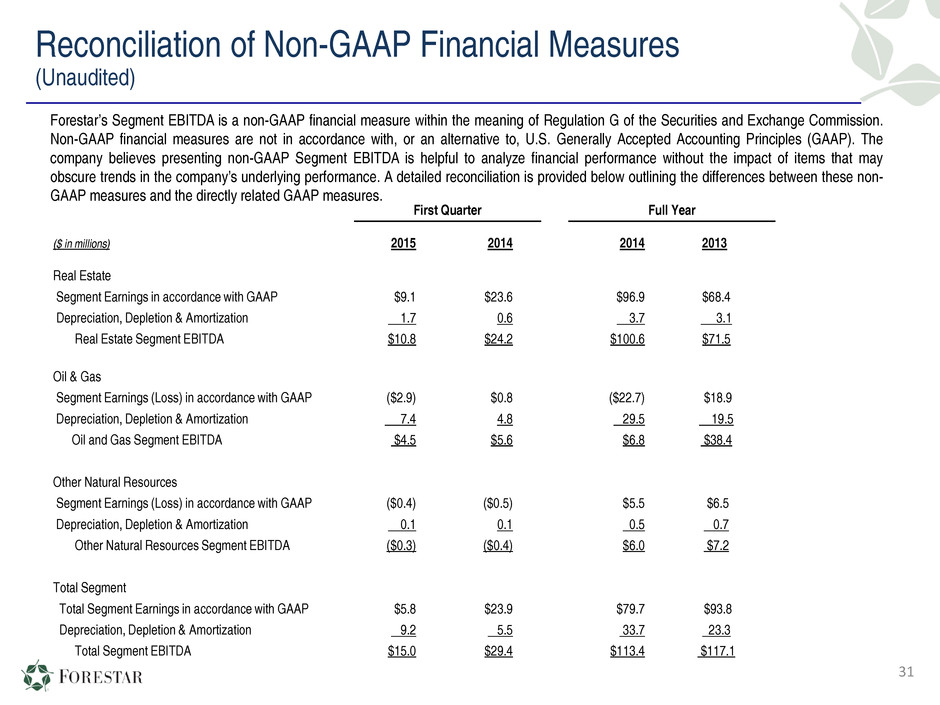
Reconciliation of Non-GAAP Financial Measures (Unaudited) Forestar’s Segment EBITDA is a non-GAAP financial measure within the meaning of Regulation G of the Securities and Exchange Commission. Non-GAAP financial measures are not in accordance with, or an alternative to, U.S. Generally Accepted Accounting Principles (GAAP). The company believes presenting non-GAAP Segment EBITDA is helpful to analyze financial performance without the impact of items that may obscure trends in the company’s underlying performance. A detailed reconciliation is provided below outlining the differences between these non- GAAP measures and the directly related GAAP measures. First Quarter Full Year ($ in millions) 2015 2014 2014 2013 Real Estate Segment Earnings in accordance with GAAP $9.1 $23.6 $96.9 $68.4 Depreciation, Depletion & Amortization 1.7 0.6 3.7 3.1 Real Estate Segment EBITDA $10.8 $24.2 $100.6 $71.5 Oil & Gas Segment Earnings (Loss) in accordance with GAAP ($2.9) $0.8 ($22.7) $18.9 Depreciation, Depletion & Amortization 7.4 4.8 29.5 19.5 Oil and Gas Segment EBITDA $4.5 $5.6 $6.8 $38.4 Other Natural Resources Segment Earnings (Loss) in accordance with GAAP ($0.4) ($0.5) $5.5 $6.5 Depreciation, Depletion & Amortization 0.1 0.1 0.5 0.7 Other Natural Resources Segment EBITDA ($0.3) ($0.4) $6.0 $7.2 Total Segment Total Segment Earnings in accordance with GAAP $5.8 $23.9 $79.7 $93.8 Depreciation, Depletion & Amortization 9.2 5.5 33.7 23.3 Total Segment EBITDA $15.0 $29.4 $113.4 $117.1 31
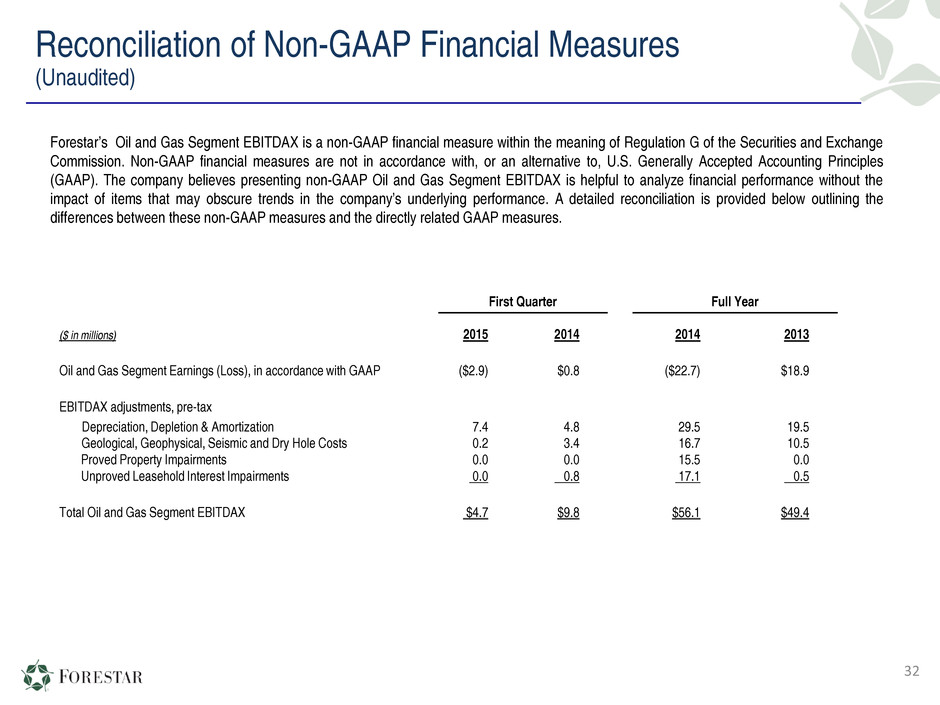
Reconciliation of Non-GAAP Financial Measures (Unaudited) Forestar’s Oil and Gas Segment EBITDAX is a non-GAAP financial measure within the meaning of Regulation G of the Securities and Exchange Commission. Non-GAAP financial measures are not in accordance with, or an alternative to, U.S. Generally Accepted Accounting Principles (GAAP). The company believes presenting non-GAAP Oil and Gas Segment EBITDAX is helpful to analyze financial performance without the impact of items that may obscure trends in the company’s underlying performance. A detailed reconciliation is provided below outlining the differences between these non-GAAP measures and the directly related GAAP measures. First Quarter Full Year ($ in millions) 2015 2014 2014 2013 Oil and Gas Segment Earnings (Loss), in accordance with GAAP ($2.9) $0.8 ($22.7) $18.9 EBITDAX adjustments, pre-tax Depreciation, Depletion & Amortization 7.4 4.8 29.5 19.5 Geological, Geophysical, Seismic and Dry Hole Costs 0.2 3.4 16.7 10.5 Proved Property Impairments 0.0 0.0 15.5 0.0 Unproved Leasehold Interest Impairments 0.0 0.8 17.1 0.5 Total Oil and Gas Segment EBITDAX $4.7 $9.8 $56.1 $49.4 32
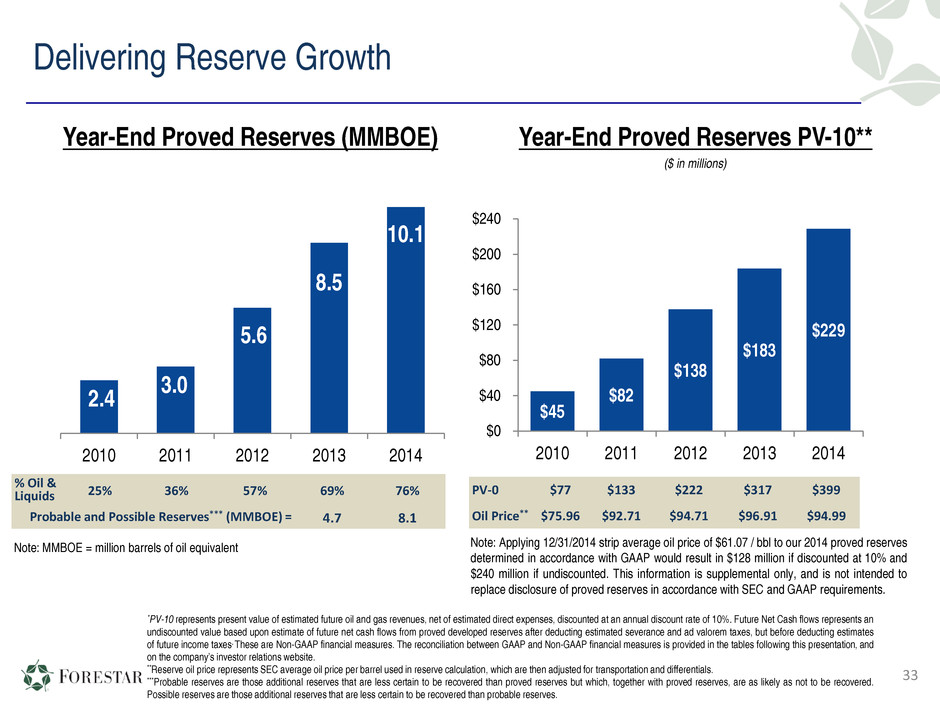
Delivering Reserve Growth 2.4 3.0 5.6 8.5 10.1 2010 2011 2012 2013 2014 Year-End Proved Reserves (MMBOE) Note: MMBOE = million barrels of oil equivalent *PV-10 represents present value of estimated future oil and gas revenues, net of estimated direct expenses, discounted at an annual discount rate of 10%. Future Net Cash flows represents an undiscounted value based upon estimate of future net cash flows from proved developed reserves after deducting estimated severance and ad valorem taxes, but before deducting estimates of future income taxes. These are Non-GAAP financial measures. The reconciliation between GAAP and Non-GAAP financial measures is provided in the tables following this presentation, and on the company’s investor relations website. **Reserve oil price represents SEC average oil price per barrel used in reserve calculation, which are then adjusted for transportation and differentials. ***Probable reserves are those additional reserves that are less certain to be recovered than proved reserves but which, together with proved reserves, are as likely as not to be recovered. Possible reserves are those additional reserves that are less certain to be recovered than probable reserves. Year-End Proved Reserves PV-10** ($ in millions) $45 $82 $138 $183 $229 $0 $40 $80 $120 $160 $200 $240 2010 2011 2012 2013 2014 33 PV-0 $77 $133 $222 $317 $399 Oil Price** $75.96 $92.71 $94.71 $96.91 $94.99 % Oil & Liquids 25% 36% 57% 69% 76% Probable and Possible Reserves*** (MMBOE) = 4.7 8.1 Note: Applying 12/31/2014 strip average oil price of $61.07 / bbl to our 2014 proved reserves determined in accordance with GAAP would result in $128 million if discounted at 10% and $240 million if undiscounted. This information is supplemental only, and is not intended to replace disclosure of proved reserves in accordance with SEC and GAAP requirements.
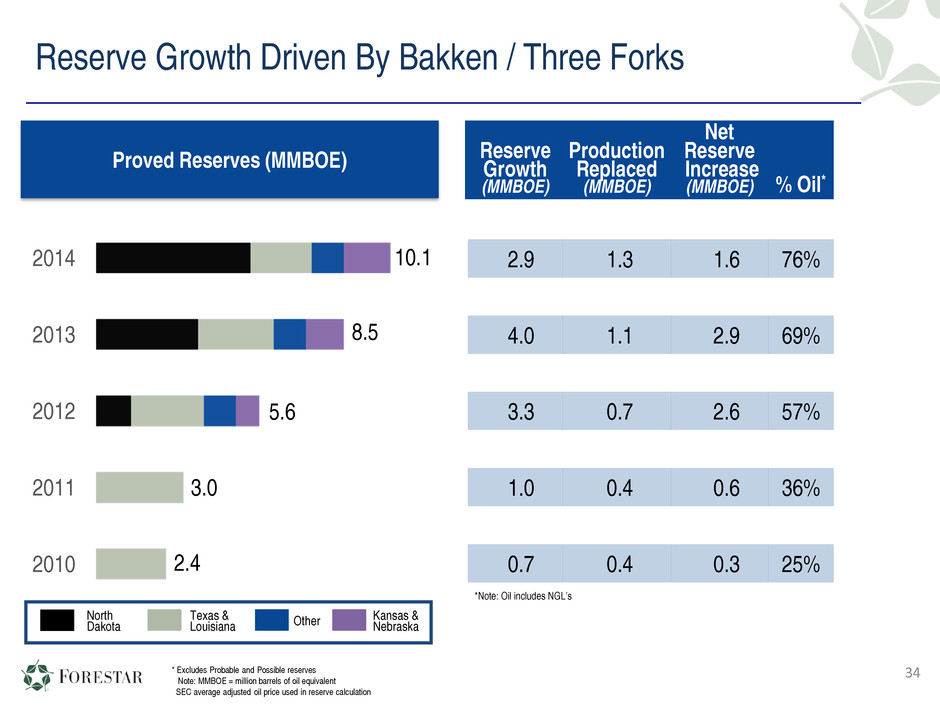
Reserve Growth Driven By Bakken / Three Forks Reserve Growth (MMBOE) Production Replaced (MMBOE) Net Reserve Increase (MMBOE) % Oil* 2.9 1.3 1.6 76% 4.0 1.1 2.9 69% 3.3 0.7 2.6 57% 1.0 0.4 0.6 36% 0.7 0.4 0.3 25% Proved Reserves (MMBOE) 2010 2011 2012 2013 2014 North Dakota Texas & Louisiana Other Kansas & Nebraska 34 10.1 8.5 5.6 3.0 2.4 *Note: Oil includes NGL’s * Excludes Probable and Possible reserves Note: MMBOE = million barrels of oil equivalent SEC average adjusted oil price used in reserve calculation
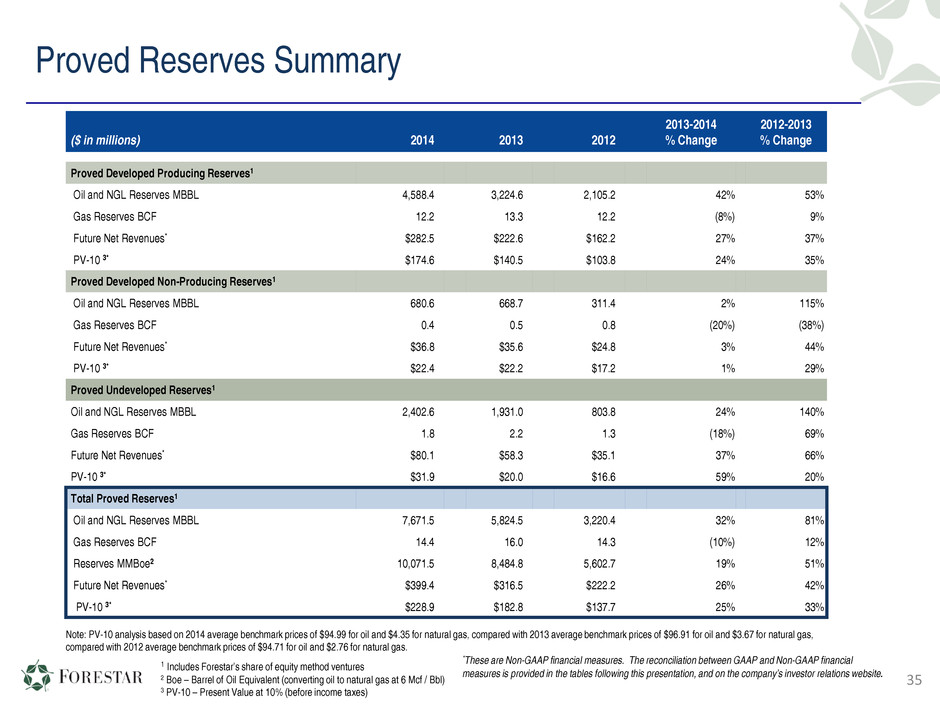
Proved Reserves Summary ($ in millions) 2014 2013 2012 2013-2014 % Change 2012-2013 % Change Proved Developed Producing Reserves1 Oil and NGL Reserves MBBL 4,588.4 3,224.6 2,105.2 42% 53% Gas Reserves BCF 12.2 13.3 12.2 (8%) 9% Future Net Revenues* $282.5 $222.6 $162.2 27% 37% PV-10 3* $174.6 $140.5 $103.8 24% 35% Proved Developed Non-Producing Reserves1 Oil and NGL Reserves MBBL 680.6 668.7 311.4 2% 115% Gas Reserves BCF 0.4 0.5 0.8 (20%) (38%) Future Net Revenues* $36.8 $35.6 $24.8 3% 44% PV-10 3* $22.4 $22.2 $17.2 1% 29% Proved Undeveloped Reserves1 Oil and NGL Reserves MBBL 2,402.6 1,931.0 803.8 24% 140% Gas Reserves BCF 1.8 2.2 1.3 (18%) 69% Future Net Revenues* $80.1 $58.3 $35.1 37% 66% PV-10 3* $31.9 $20.0 $16.6 59% 20% Total Proved Reserves1 Oil and NGL Reserves MBBL 7,671.5 5,824.5 3,220.4 32% 81% Gas Reserves BCF 14.4 16.0 14.3 (10%) 12% Reserves MMBoe2 10,071.5 8,484.8 5,602.7 19% 51% Future Net Revenues* $399.4 $316.5 $222.2 26% 42% PV-10 3* $228.9 $182.8 $137.7 25% 33% Note: PV-10 analysis based on 2014 average benchmark prices of $94.99 for oil and $4.35 for natural gas, compared with 2013 average benchmark prices of $96.91 for oil and $3.67 for natural gas, compared with 2012 average benchmark prices of $94.71 for oil and $2.76 for natural gas. 1 Includes Forestar’s share of equity method ventures 2 Boe – Barrel of Oil Equivalent (converting oil to natural gas at 6 Mcf / Bbl) 3 PV-10 – Present Value at 10% (before income taxes) *These are Non-GAAP financial measures. The reconciliation between GAAP and Non-GAAP financial measures is provided in the tables following this presentation, and on the company’s investor relations website. 35
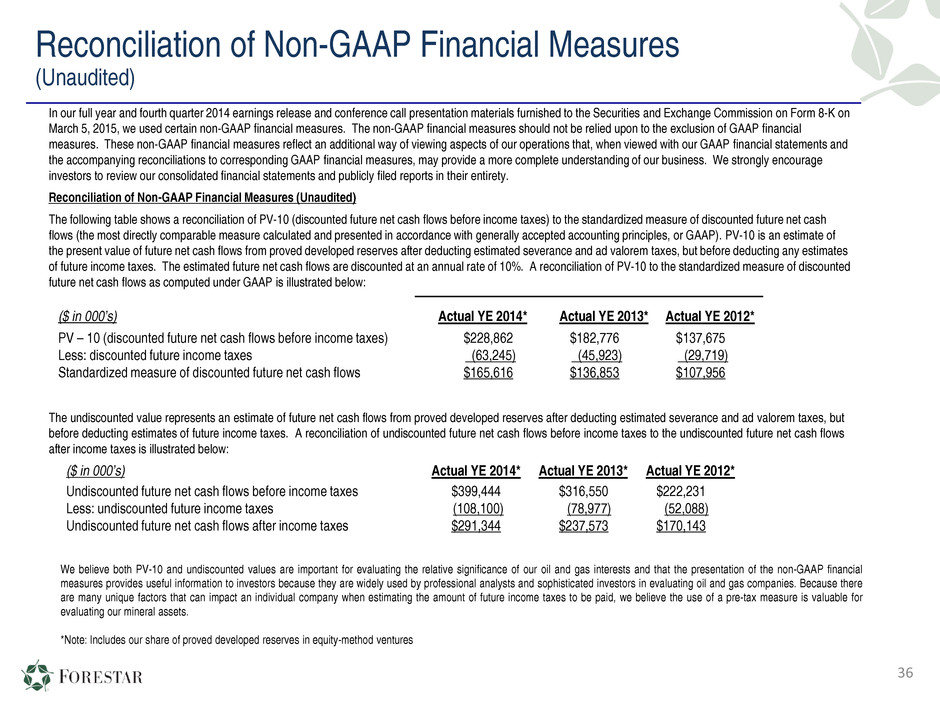
Reconciliation of Non-GAAP Financial Measures (Unaudited) In our full year and fourth quarter 2014 earnings release and conference call presentation materials furnished to the Securities and Exchange Commission on Form 8-K on March 5, 2015, we used certain non-GAAP financial measures. The non-GAAP financial measures should not be relied upon to the exclusion of GAAP financial measures. These non-GAAP financial measures reflect an additional way of viewing aspects of our operations that, when viewed with our GAAP financial statements and the accompanying reconciliations to corresponding GAAP financial measures, may provide a more complete understanding of our business. We strongly encourage investors to review our consolidated financial statements and publicly filed reports in their entirety. Reconciliation of Non-GAAP Financial Measures (Unaudited) The following table shows a reconciliation of PV-10 (discounted future net cash flows before income taxes) to the standardized measure of discounted future net cash flows (the most directly comparable measure calculated and presented in accordance with generally accepted accounting principles, or GAAP). PV-10 is an estimate of the present value of future net cash flows from proved developed reserves after deducting estimated severance and ad valorem taxes, but before deducting any estimates of future income taxes. The estimated future net cash flows are discounted at an annual rate of 10%. A reconciliation of PV-10 to the standardized measure of discounted future net cash flows as computed under GAAP is illustrated below: ($ in 000’s) Actual YE 2014* Actual YE 2013* Actual YE 2012* PV – 10 (discounted future net cash flows before income taxes) $228,862 $182,776 $137,675 Less: discounted future income taxes (63,245) (45,923) (29,719) Standardized measure of discounted future net cash flows $165,616 $136,853 $107,956 The undiscounted value represents an estimate of future net cash flows from proved developed reserves after deducting estimated severance and ad valorem taxes, but before deducting estimates of future income taxes. A reconciliation of undiscounted future net cash flows before income taxes to the undiscounted future net cash flows after income taxes is illustrated below: ($ in 000’s) Actual YE 2014* Actual YE 2013* Actual YE 2012* Undiscounted future net cash flows before income taxes $399,444 $316,550 $222,231 Less: undiscounted future income taxes (108,100) (78,977) (52,088) Undiscounted future net cash flows after income taxes $291,344 $237,573 $170,143 We believe both PV-10 and undiscounted values are important for evaluating the relative significance of our oil and gas interests and that the presentation of the non-GAAP financial measures provides useful information to investors because they are widely used by professional analysts and sophisticated investors in evaluating oil and gas companies. Because there are many unique factors that can impact an individual company when estimating the amount of future income taxes to be paid, we believe the use of a pre-tax measure is valuable for evaluating our mineral assets. *Note: Includes our share of proved developed reserves in equity-method ventures 36

37
