Attached files
| file | filename |
|---|---|
| 8-K - 8-K - MYR GROUP INC. | v411945_8k.htm |
Exhibit 99.1
INVESTOR PRESENTATION 20 15 First Quarter Nasdaq: MYRG

SAFE HARBOR STATEMENT Various statements in this presentation, and any oral statements regarding the subject matter of this presentation, are “forward - looking statements” within the meaning of the Private Securities Litigation Reform Act of 1995, Section 27A of the Securities Act of 1933, and Section 21E of the Securities Exchange Act of 1934. Forward - looking statements include those that express a belief, expectation or intention, as well as those that are not statements of historical fact, and may include projections and estimates concerning the timing and success of specific projects and our future revenue, income, backlog, liquidity, capital spending and investments. The forward - looking statements in this presentation are generally accompanied by words such as “estimate,” “project,” “predict,” “believe,” “expect,” “intend,” “anticipate,” “potential,” “possible,” “plan,” “goal,” “objective,” “outlook,” “see,” “may,” “should,” “could,” “appears” or other words that convey the uncertainty of future events or outcomes. The forward - looking statements speak only as of their date and are based on our current expectations and assumptions about future events, including with respect to expected growth, results of operations, performance, business prospects and opportunities and effective tax rates. These statements do not guarantee future performance and actual results may differ materially from these statements. We disclaim any obligation to update these statements, unless required by securities laws, and we caution you not to rely on them unduly. While our management considers these expectations and assumptions to be reasonable, they are inherently subject to significant business, economic, competitive, regulatory and other risks, contingencies and uncertainties, most of which are difficult to predict and many of which are beyond our control. These and other important factors, including those discussed under the caption “Forward - Looking Statements” and in Item 1A “Risk Factors” in our Annual Report on Form 10 - K for the fiscal year ended December 31, 2014, and in any risk factors or cautionary statements contained in our other filings with the Securities and Exchange Commission, may cause our actual results, performance or achievements to differ materially from any future results, performance or achievements expressed or implied by these forward - looking statements. Company Overview │ Market Overview │ Strategy │ Financial Performance │ Investment Outlook │ Appendix │ Page 2 Investor Presentation │ May │ © 2015MYRGROUPINC .
TABLE OF CONTENTS Company Overview Market Overview Strategy Financial Performance Investment Outlook Appendix Company Overview │ Market Overview │ Strategy │ Financial Performance │ Investment Outlook │ Appendix │ Page 3 Investor Presentation │ May │ © 2015MYRGROUPINC .

ABOUT MYR GROUP • MYR Group is a holding company of specialty electrical contractors – Subsidiaries date back to 1891 – Numerous offices across North America • Transmission and Distribution ( T&D ) customers include: – Investor Owned Utilities – Cooperatives – Municipalities – Independent Transmission Companies • Commercial and Industrial (C&I) services are provided to property owners and general contractors in the W estern and North - Eastern United States • Services include turnkey construction and maintenance of the U.S. electrical infrastructure • Nationwide network of approximately 4,000 employees • Safety performance consistently exceeds industry standards • Large modern fleet including extensive specialized equipment Company Overview │ Market Overview │ Strategy │ Financial Performance │ Investment Outlook │ Appendix │ Page 4 Investor Presentation │ May │ © 2015MYRGROUPINC .
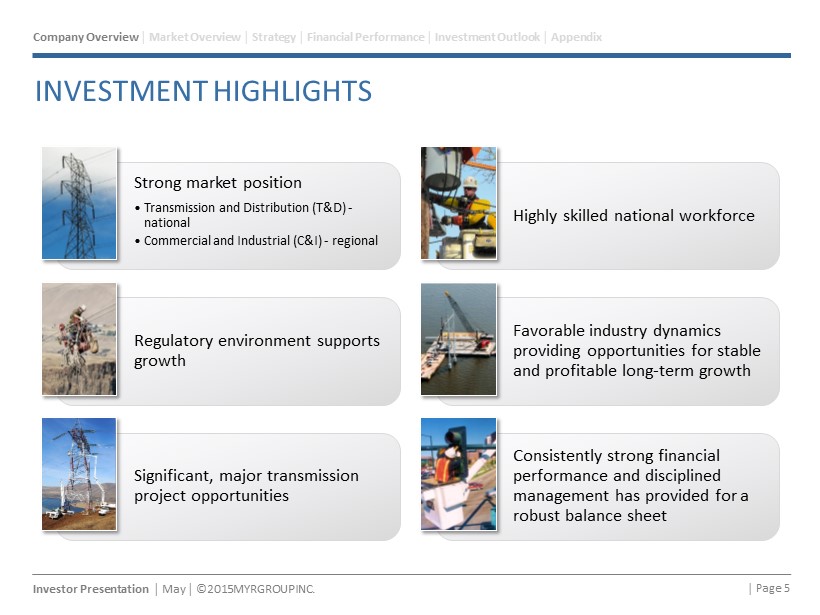
INVESTMENT HIGHLIGHTS Company Overview │ Market Overview │ Strategy │ Financial Performance │ Investment Outlook │ Appendix │ Page 5 Strong market position • Transmission and Distribution (T&D) - national • Commercial and Industrial (C&I) - regional Highly skilled national workforce Regulatory environment supports growth Favorable industry dynamics providing opportunities for stable and profitable long - term growth Significant, major transmission project opportunities Consistently strong financial performance and disciplined management has provided for a robust balance sheet Investor Presentation │ May │ © 2015MYRGROUPINC .

NORTH - AMERICAN SERVICE OFFERINGS Company Overview │ Market Overview │ Strategy │ Financial Performance │ Investment Outlook │ Appendix │ Page 6 Transmission & Distribution T&D Commercial & Industrial C&I • Transmission up to 765kV • Overhead Distribution • Underground Distribution • Foundations & Caissons • Directional Boring • Substation & Collector Systems • EPC Services • PCS / Cellular Towers • Emergency Storm Response • Fiber Optics • Educational / Medical Centers • Airports / Airfield Lighting • Data Centers • Bridge , Roadway, Tunnel Lighting • Government & Office Buildings • Building Automation & Controls • Telecommunications • Transportation / Traffic Signalization • Voice, Data & Video Systems • Industrial Facilities • Water & Wastewater Treatment Plants • Renovations and Major Additions • Technical Services Investor Presentation │ May │ © 2015MYRGROUPINC .

NORTH - AMERICAN COVERAGE Company Overview │ Market Overview │ Strategy │ Financial Performance │ Investment Outlook │ Appendix │ Page 7 Investor Presentation │ May │ ©2015MYRGROUPINC. Office Locations Fleet Locations MYR Group subsidiaries Great Southwestern Construction, Inc. and MYR Transmission Services, Inc. perform work throughout the entire U.S. KEY TO SERVICE TERRITORIES Sturgeon Electric Company, Inc. Sturgeon Electric company, Inc. / The L.E. Myers Co. The L.E. Myers Co Harlan Electric Company The L.E. Myers Co. / Harlan Electric Company Harlan Electric Company / E.S. Boulos Company MYR Group Construction Canada, Ltd. Northern Transmission Services, Ltd. and MYR Transmission Services Canada, Ltd. Centralized Fleet Management Regional Support Facilities

INVESTMENT IN CAPEX SUPPORTED GROWTH INITIATIVES Successful execution of strategy Invested in specialty equipment in 2011 - 2014 to support growth initiatives Grew top - line revenue organically through expansion of T&D capacity Source : S&P Capital IQ | MTZ : 2010 - YTD Q3 2014 │ Page 8 Company Overview │ Market Overview │ Strategy │ Financial Performance │ Investment Outlook │ Appendix $616 $631 $597 $780 $999 $903 $944 $0 $200 $400 $600 $800 $1,000 $1,200 2008 2009 2010 2011 2012 2013 2014 Millions Revenue Revenue 7.4% CAGR 4.3% 3.9% 2.4% 0.8% 0.5% 0.0% 1.0% 2.0% 3.0% 4.0% 5.0% MYRG '10-'14 PWR '10-'14 MTZ '10-'14 WG '10-'14 EME '10-'14 5 - Year CAPEX Investment % of Revenue $28.0 $29.7 $21.9 $42.3 $37.2 $42.7 $39.0 0.0% 1.0% 2.0% 3.0% 4.0% 5.0% 6.0% $0 $10 $20 $30 $40 $50 2008 2009 2010 2011 2012 2013 2014 Millions CAPEX Investment CAPEX Spend CAPEX % of Rev Investor Presentation │ May │ © 2015MYRGROUPINC .
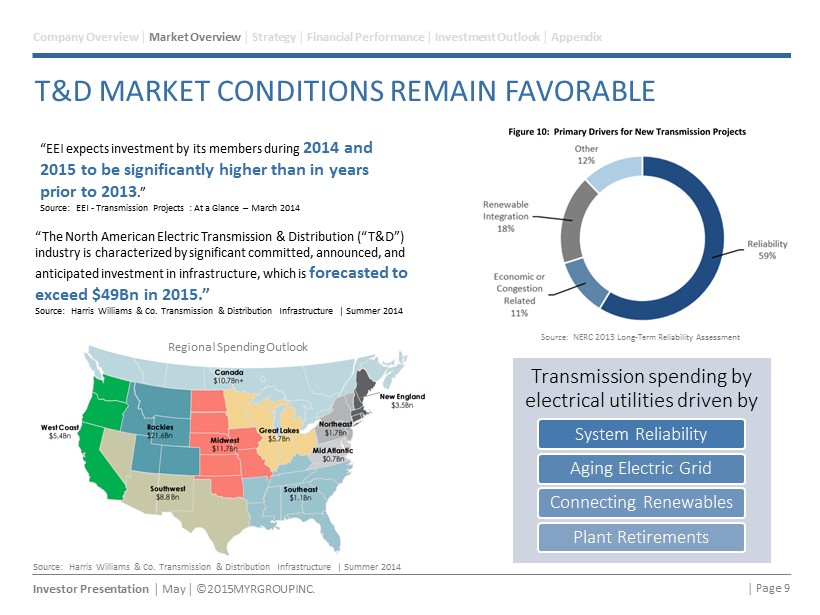
T&D MARKET CONDITIONS REMAIN FAVORABLE Transmission spending by electrical utilities driven by System Reliability Aging Electric Grid Connecting Renewables Plant Retirements Company Overview │ Market Overview │ Strategy │ Financial Performance │ Investment Outlook │ Appendix Source: NERC 2013 Long - Term Reliability Assessment │ Page 9 “EEI expects investment by its members during 2014 and 2015 to be significantly higher than in years prior to 2013 .” Source: EEI - Transmission Projects : At a Glance – March 2014 “The North American Electric Transmission & Distribution (“T&D”) industry is characterized by significant committed, announced, and anticipated investment in infrastructure, which is forecasted to exceed $49Bn in 2015 .” Source: Harris Williams & Co. Transmission & Distribution Infrastructure | Summer 2014 Regional Spending Outlook Source: Harris Williams & Co. Transmission & Distribution Infrastructure | Summer 2014 Investor Presentation │ May │ © 2015MYRGROUPINC .

T&D MARKET CONDITIONS REMAIN FAVORABLE Company Overview │ Market Overview │ Strategy │ Financial Performance │ Investment Outlook │ Appendix │ Page 10 Source: Harris Williams & Co. Transmission & Distribution Infrastructure | Summer 2014 Number of Major U.S. Power Outages Investor Presentation │ May │ © 2015MYRGROUPINC .

C&I MARKET IS GROWING… Company Overview │ Market Overview │ Strategy │ Financial Performance │ Investment Outlook │ Appendix Dodge Momentum Index – by McGraw - Hill Construction - 12 month leading indicator of construction spending for nonresidential building - 91% correlation between construction planning reports and the US Commerce Department’s Put in Place spending over the past 10 years “ Dodge Momentum Index - The Dodge Momentum Index rose 0.8% in April to 122.6 (2000=100) from March’s 121.6, according to Dodge Data & Analytics . April’s slight rise shows planning activity beginning to edge up once again after retreating 2.5% in March, continuing the up - and - down pattern that’s been present so far in 2015... it’s expected that the Momentum Index will see a more sustained upward trend as 2015 progresses . Source : McGraw Hill Construction Press Release May 7, 2015 C&I’s Strong $122.7MM Backlog is Driven by: Hospitals Data Centers Airport Projects Transportation Work Aerospace Water / Waste Water Upgrades │ Page 11 Associated General Contractors of America: “Private nonresidential spending fell 1.6% for the month but rose 4.8% year - over - year . Public construction spending decreased 2.6% from December but increased 5.1% from January 2014 .” Source: AGC’s Data DIGest - Vol. 15, No. 9 • Feb. 24 - Mar. 2, 2015 Investor Presentation │ May │ © 2015MYRGROUPINC .

FUTURE GROWTH OPPORTUNITIES • Invest in additional fleet and labor resources to expand capacity • Leverage extensive bid knowledge and long - term customer relationships to secure future contracts with new and existing customers Organic Growth • Exercise discipline when assessing target companies Strategic Acquisitions • Strategic expansion of MYR Group’s geographic footprint into favorable markets Geographic Expansion • Assess segments of the T&D and C&I markets to bring in - house (e.g., foundation drilling, site clearing, specialty equipment fabrication, environmental controls) Vertical Integration • Evaluate other areas of the energy infrastructure market for possible expansion Horizontal Expansion Company Overview │ Market Overview │ Strategy │ Financial Performance │ Investment Outlook │ Appendix │ Page 12 Investor Presentation │ May │ © 2015MYRGROUPINC .
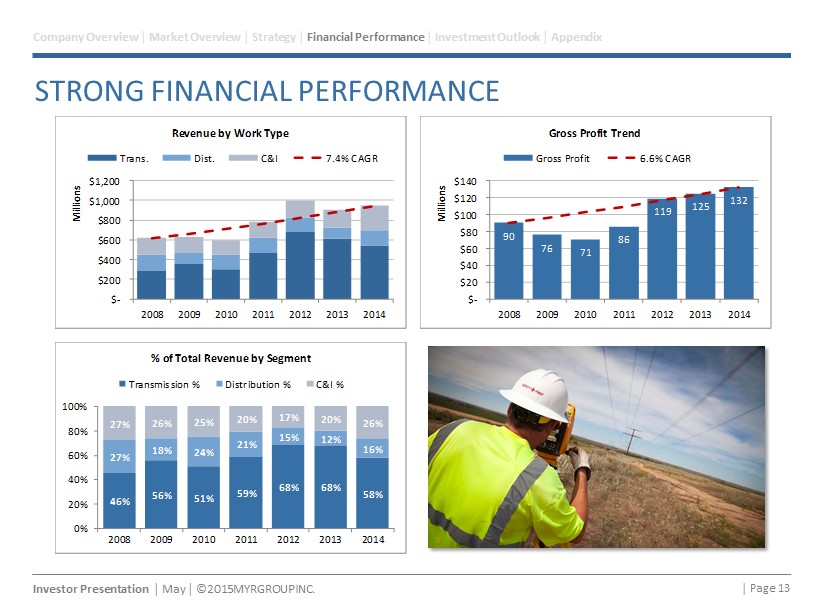
STRONG FINANCIAL PERFORMANCE 46% 56% 51% 59% 68% 68% 58% 27% 18% 24% 21% 15% 12% 16% 27% 26% 25% 20% 17% 20% 26% 0% 20% 40% 60% 80% 100% 2008 2009 2010 2011 2012 2013 2014 % of Total Revenue by Segment Transmission % Distribution % C&I % Company Overview │ Market Overview │ Strategy │ Financial Performance │ Investment Outlook │ Appendix │ Page 13 $- $200 $400 $600 $800 $1,000 $1,200 2008 2009 2010 2011 2012 2013 2014 Millions Revenue by Work Type Trans. Dist. C&I 7.4% CAGR 90 76 71 86 119 125 132 $- $20 $40 $60 $80 $100 $120 $140 2008 2009 2010 2011 2012 2013 2014 Millions Gross Profit Trend Gross Profit 6.6% CAGR Investor Presentation │ May │ © 2015MYRGROUPINC .

STRONG FINANCIAL PERFORMANCE Revenue and backlog growth has been primarily organic Backlog includes signed contracts and 90 days of alliance agreements Not a static business; MYR is constantly marketing to new customers and bidding on new projects Company Overview │ Market Overview │ Strategy │ Financial Performance │ Investment Outlook │ Appendix │ Page 14 $1.14 $0.83 $0.78 $0.87 $1.60 $1.61 $1.69 $0.00 $0.20 $0.40 $0.60 $0.80 $1.00 $1.20 $1.40 $1.60 $1.80 2008 2009 2010 2011 2012 2013 2014 Diluted EPS Diluted EPS 6.8% CAGR $2.46 $1.97 $2.05 $2.34 $3.80 $3.96 $4.29 $- $0.50 $1.00 $1.50 $2.00 $2.50 $3.00 $3.50 $4.00 $4.50 2008 2009 2010 2011 2012 2013 2014 EBITDA / Diluted Share EBITDA / Share 9.7% CAGR Investor Presentation │ May │ © 2015MYRGROUPINC . $316 $204 $521 $693 $498 $326 $434 $0 $100 $200 $300 $400 $500 $600 $700 $800 2008 2009 2010 2011 2012 2013 2014 Millions Backlog Backlog - C&I Backlog - T&D 5.4% CAGR

FINANCIAL PERFORMANCE COMPARISON Source : S&P Capital IQ - NM ( Not Meaningful) reflects negative returns/growth and is ignored for comparison purposes | MTZ #s from Q1 2015 Press Release Company Overview │ Market Overview │ Strategy │ Financial Performance │ Investment Outlook │ Appendix │ Page 15 15.1% 9.8% 7.8% 4.8% NM 0.0% 2.0% 4.0% 6.0% 8.0% 10.0% 12.0% 14.0% 16.0% MYRG EME PWR MTZ WG ROIC 7.2% 5.4% 4.8% 3.1% NM NM 1.0% 2.0% 3.0% 4.0% 5.0% 6.0% 7.0% 8.0% MYRG PWR EME MTZ WG ROA 12.4% 10.8% 8.9% 7.3% NM NM 2.0% 4.0% 6.0% 8.0% 10.0% 12.0% 14.0% MYRG EME MTZ PWR WG ROE 2.04x 1.98x 1.53x 1.37x 1.25x 0.00 0.50 1.00 1.50 2.00 2.50 EME MYRG MTZ PWR WG Market to Book Value Investor Presentation │ May │ © 2015MYRGROUPINC .

BALANCE SHEET STRENGTH Company Overview │ Market Overview │ Strategy │ Financial Performance │ Investment Outlook │ Appendix • No funded debt • Limited goodwill • Steady growth in tangible net worth • Strong liquidity position • Substantial bonding capacity │ Page 16 39 24 45 30 30 95 55 (17) (16) (6) (23) (12) (14) (6) (11) (13) (16) (19) (25) (29) (33) $(50) $- $50 $100 2008 2009 2010 2011 2012 2013 2014 Millions Components of Free Cash Flow Op. Cash Flow Growth Capex Maint. Capex Free Cash Flow $(100) $(50) $- $50 $100 $150 $200 $250 $300 2008 2009 2010 2011 2012 2013 2014 Millions Total Liquidity Credit Facility Cash LOC Bank Debt Total Liquidity $(100) $(50) $- $50 $100 $150 $200 $250 $300 $350 2008 2009 2010 2011 2012 2013 2014 Millions Tangible Net Worth Goodwill & Intangibles Shareholders Equity TNW Investor Presentation │ May │ © 2015MYRGROUPINC .

INVESTMENT OUTLOOK • Solid execution of corporate strategy has solidified MYR Group’s position as a market leader in large transmission line construction Proven Strategy Execution • Executive Management average 30+ years of industry experience Experienced Management • Regulatory environment supports growth and numerous market analysts expect escalated spending through year 2020. Positive Industry Outlook • Opportunities for organic, vertical, horizontal, and geographic growth Favorable Growth Prospects • MYR has substantial tangible net worth and bonding capacity, coupled with a strong liquidity position Strong Financial Position • Centralization allows for greater efficiency and leverage of company resources Centralized Fleet and Corporate Operations Company Overview │ Market Overview │ Strategy │ Financial Performance │ Investment Outlook │ Appendix │ Page 17 Investor Presentation │ May │ © 2015MYRGROUPINC .

Appendix Company Overview │ Market Overview │ Strategy │ Financial Performance │ Investment Outlook │ Appendix │ Page 18 Investor Presentation │ May │ © 2015MYRGROUPINC .
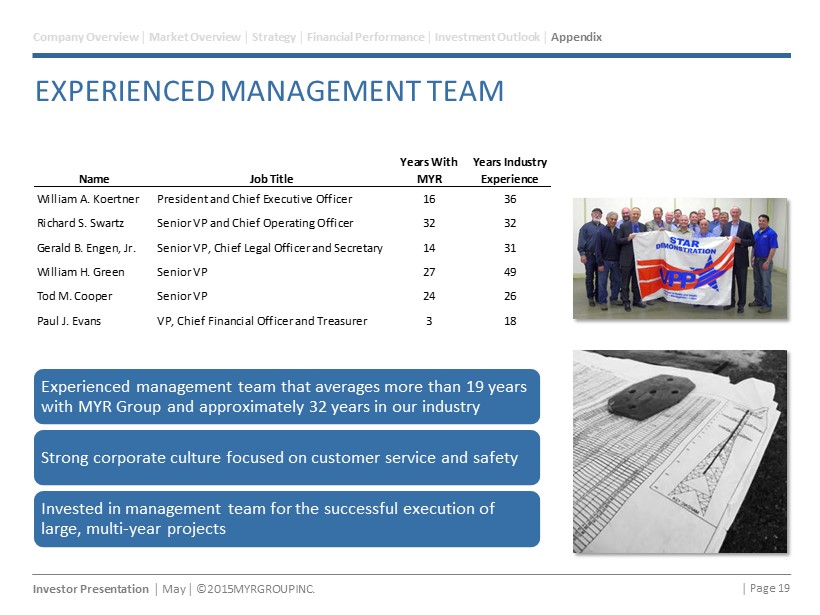
EXPERIENCED MANAGEMENT TEAM Experienced management team that averages more than 19 years with MYR Group and approximately 32 years in our industry Strong corporate culture focused on customer service and safety Invested in management team for the successful execution of large, multi - year projects Company Overview │ Market Overview │ Strategy │ Financial Performance │ Investment Outlook │ Appendix │ Page 19 Name Job Title Years With MYR Years Industry Experience William A. Koertner President and Chief Executive Officer 16 36 Richard S. Swartz Senior VP and Chief Operating Officer 32 32 Gerald B. Engen, Jr. Senior VP, Chief Legal Officer and Secretary 14 31 William H. Green Senior VP 27 49 Tod M. Cooper Senior VP 24 26 Paul J. Evans VP, Chief Financial Officer and Treasurer 3 18 Investor Presentation │ May │ © 2015MYRGROUPINC .
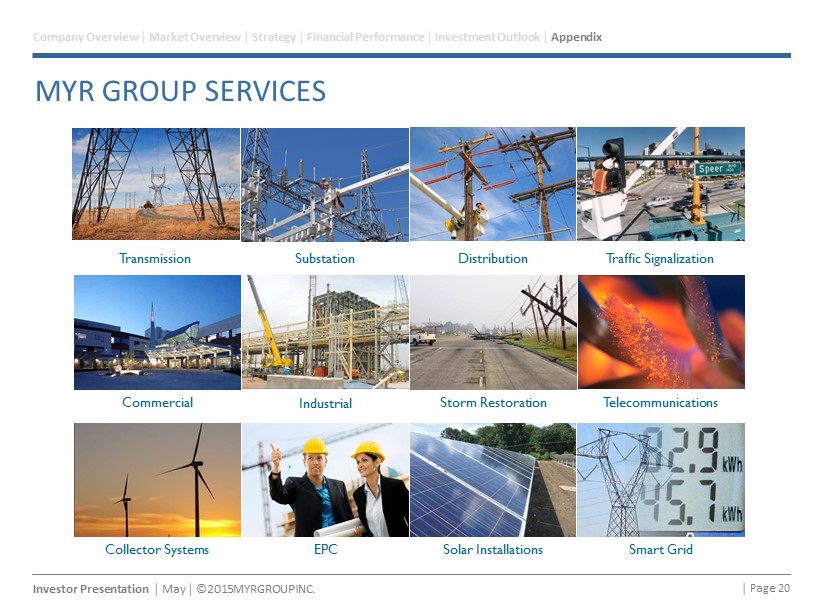
MYR GROUP SERVICES Transmission Collector Systems Distribution Traffic Signalization Telecommunications Substation Solar Installations Industrial Storm Restoration EPC Commercial Smart Grid Company Overview │ Market Overview │ Strategy │ Financial Performance │ Investment Outlook │ Appendix │ Page 20 Investor Presentation │ May │ © 2015MYRGROUPINC .

MYR GROUP CUSTOMER SAMPLE Company Overview │ Market Overview │ Strategy │ Financial Performance │ Investment Outlook │ Appendix │ Page 21 Investor Presentation │ May │ © 2015MYRGROUPINC .
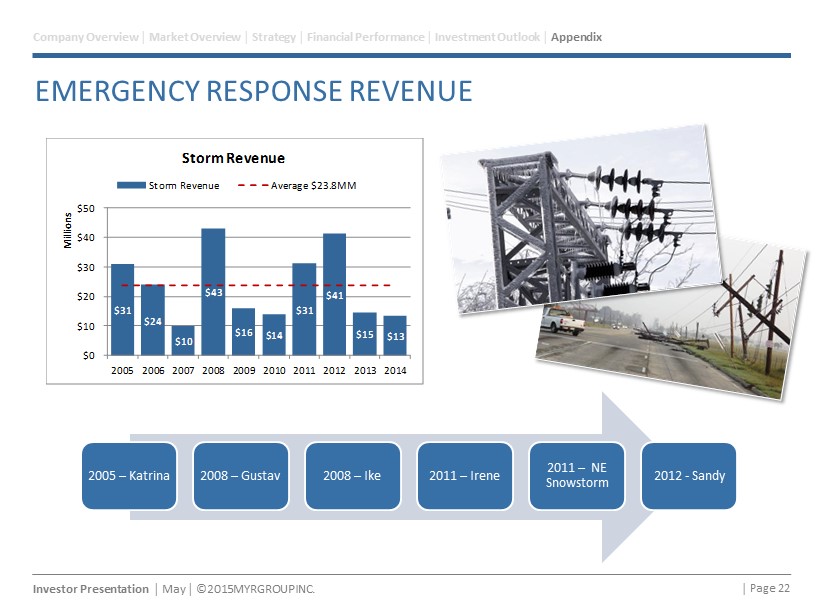
EMERGENCY RESPONSE REVENUE $31 $24 $10 $43 $16 $14 $31 $41 $15 $13 $0 $10 $20 $30 $40 $50 2005 2006 2007 2008 2009 2010 2011 2012 2013 2014 Millions Storm Revenue Storm Revenue Average $23.8MM 2005 – Katrina 2008 – Gustav 2008 – Ike 2011 – Irene 2011 – NE Snowstorm 2012 - Sandy Company Overview │ Market Overview │ Strategy │ Financial Performance │ Investment Outlook │ Appendix │ Page 22 Investor Presentation │ May │ © 2015MYRGROUPINC .
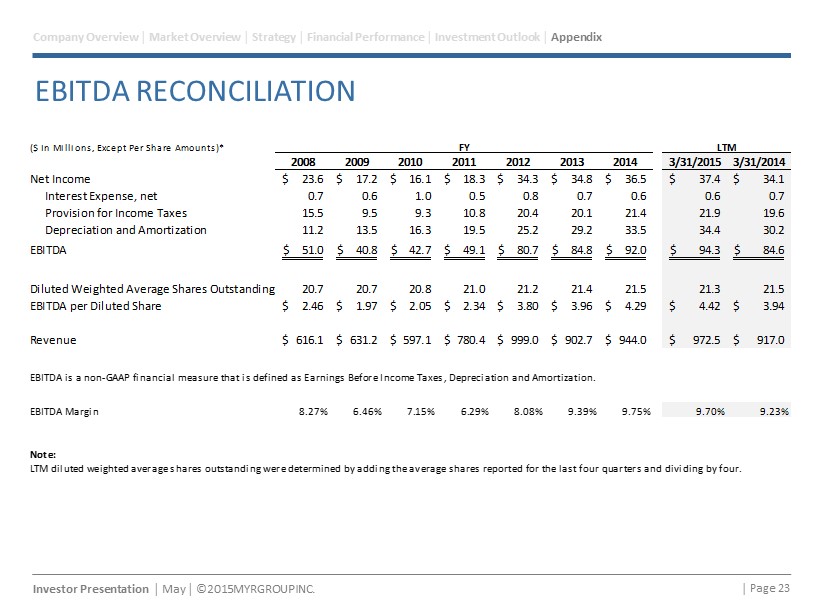
EBITDA RECONCILIATION Company Overview │ Market Overview │ Strategy │ Financial Performance │ Investment Outlook │ Appendix │ Page 23 Investor Presentation │ May │ © 2015MYRGROUPINC . ($ In Millions, Except Per Share Amounts)* FY LTM 2008 2009 2010 2011 2012 2013 2014 3/31/2015 3/31/2014 Net Income 23.6$ 17.2$ 16.1$ 18.3$ 34.3$ 34.8$ 36.5$ 37.4$ 34.1$ Interest Expense, net 0.7 0.6 1.0 0.5 0.8 0.7 0.6 0.6 0.7 Provision for Income Taxes 15.5 9.5 9.3 10.8 20.4 20.1 21.4 21.9 19.6 Depreciation and Amortization 11.2 13.5 16.3 19.5 25.2 29.2 33.5 34.4 30.2 EBITDA 51.0$ 40.8$ 42.7$ 49.1$ 80.7$ 84.8$ 92.0$ 94.3$ 84.6$ Diluted Weighted Average Shares Outstanding 20.7 20.7 20.8 21.0 21.2 21.4 21.5 21.3 21.5 EBITDA per Diluted Share 2.46$ 1.97$ 2.05$ 2.34$ 3.80$ 3.96$ 4.29$ 4.42$ 3.94$ Revenue 616.1$ 631.2$ 597.1$ 780.4$ 999.0$ 902.7$ 944.0$ 972.5$ 917.0$ EBITDA is a non-GAAP financial measure that is defined as Earnings Before Income Taxes, Depreciation and Amortization. EBITDA Margin 8.27% 6.46% 7.15% 6.29% 8.08% 9.39% 9.75% 9.70% 9.23% Note: LTM diluted weighted average shares outstanding were determined by adding the average shares reported for the last four quarters and dividing by four.

FINANCIAL RATIO DEFINITIONS Company Overview │ Market Overview │ Strategy │ Financial Performance │ Investment Outlook │ Appendix │ Page 24 S&P Capital IQ Disclaimer of Liability Notice . This may contain information obtained from third parties, including ratings from credit ratings agencies such as Standard & Poor’s. Reproduction and distribution of third party content in any form is prohibited except with the prior written permission of the related third party. Third party content providers do not guarantee the accuracy, completeness, timeliness or availability of any information, including ratings, and are not responsible for any errors or omissions (negligent or otherwise), regardless of the cause, or for the results obtained from the use of such content. THIRD PARTY CONTENT PROVIDERS GIVE NO EXPRESS OR IMPLIED WARRANTIES, INCLUDING, BUT NOT LIMITED TO, ANY WARRANTIES OF MERCHANTABILITY OR FITNESS FOR A PARTICULAR PURPOSE OR USE. THIRD PARTY CONTENT PROVIDERS SHALL NOT BE LIABLE FOR ANY DIRECT, INDIRECT, INCIDENTAL, EXEMPLARY, COMPENSATORY, PUNITIVE, SPECIAL OR CONSEQUENTIAL DAMAGES, COSTS, EXPENSES, LEGAL FEES, OR LOSSES (INCLUDING LOST INCOME OR PROFITS AND OPPORTUNITY COSTS OR LOSSES CAUSED BY NEGLIGENCE) IN CONNECTION WITH ANY USE OF THEIR CONTENT, INCLUDING RATINGS. Credit ratings are statements of opinions and are not statements of fact or recommendations to purchase, hold or sell securities. They do not address the suitability of securities or the suitability of securities for investment purposes, and should not be relied on as investment advice. LTM Diluted EPS + LTM Interest expense (income), net, per diluted share + LTM Provision for income taxes per diluted share + LTM Depreciation and amortization per diluted share = LTM EBITDA per Diluted Share EBITDA (Earnings before Interest, Taxes, Depreciation, & Amortization) ÷ Revenue = EBITDA Margin Cash used in purchasing property and equipment (5 years) ÷ Revenue (5 years) = 5-Year CAPEX Investment % of Revenue (LTM ATNI) - (Dividends + Special Dividends) ÷ Total Capital @ Beginning of LTM (stockholders' equity + net debt) = Return on Invested Capital LTM Net Income (including discontinued operations & minority interests) ÷ Total Stockholders Equity @ beginning of LTM = Return on Equity LTM Net Income (including discontinued operations & minority interests) ÷ Total Assets @ beginning of LTM = Return on Assets Market Capitalization (S&P Capital IQ as of 03/31) ÷ Book Value (total stockholders' equity) = Market to Book Value Net cash flow from operating activities - Cash used in purchasing property and equipment = Free Cash Flow Investor Presentation │ May │ © 2015MYRGROUPINC .