Attached files
| file | filename |
|---|---|
| 8-K - 8-K - W. P. Carey Inc. | a15-12898_18k.htm |
Exhibit 99.1
|
|
W. P. Carey Investor Day 2015 May 28, 2015 |
|
|
Agenda Investing for the long runTM 2 I. Introduction Trevor Bond – President & Chief Executive Officer II. Investments Jason Fox – Head of Global Investments Arvi Luoma – Executive Director, European Investments III. Asset Management Thomas Zacharias – Chief Operating Officer & Head of Asset Management Brooks Gordon – Managing Director, Asset Management IV. European Operations Greg Butchart – Head of International Asset Management V. Investment Management Mark Goldberg – President of Investment Management VI. Financial Strategy Katy Rice – Chief Financial Officer Appendix |
|
|
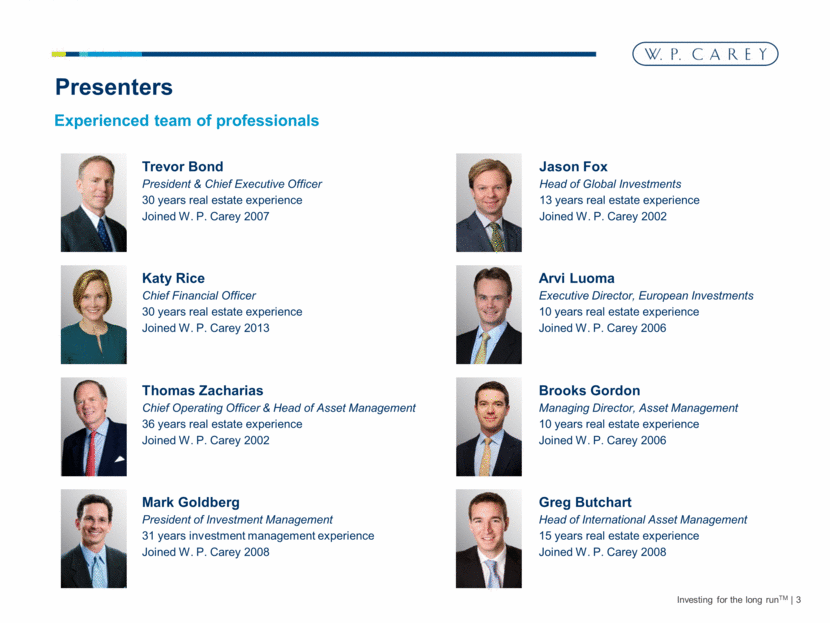
Investing for the long runTM 3 Presenters Trevor Bond President & Chief Executive Officer 30 years real estate experience Joined W. P. Carey 2007 Katy Rice Chief Financial Officer 30 years real estate experience Joined W. P. Carey 2013 Thomas Zacharias Chief Operating Officer & Head of Asset Management 36 years real estate experience Joined W. P. Carey 2002 Mark Goldberg President of Investment Management 31 years investment management experience Joined W. P. Carey 2008 Greg Butchart Head of International Asset Management 15 years real estate experience Joined W. P. Carey 2008 Arvi Luoma Executive Director, European Investments 10 years real estate experience Joined W. P. Carey 2006 Jason Fox Head of Global Investments 13 years real estate experience Joined W. P. Carey 2002 Brooks Gordon Managing Director, Asset Management 10 years real estate experience Joined W. P. Carey 2006 Experienced team of professionals |
|
|
I. Introduction |
|
|
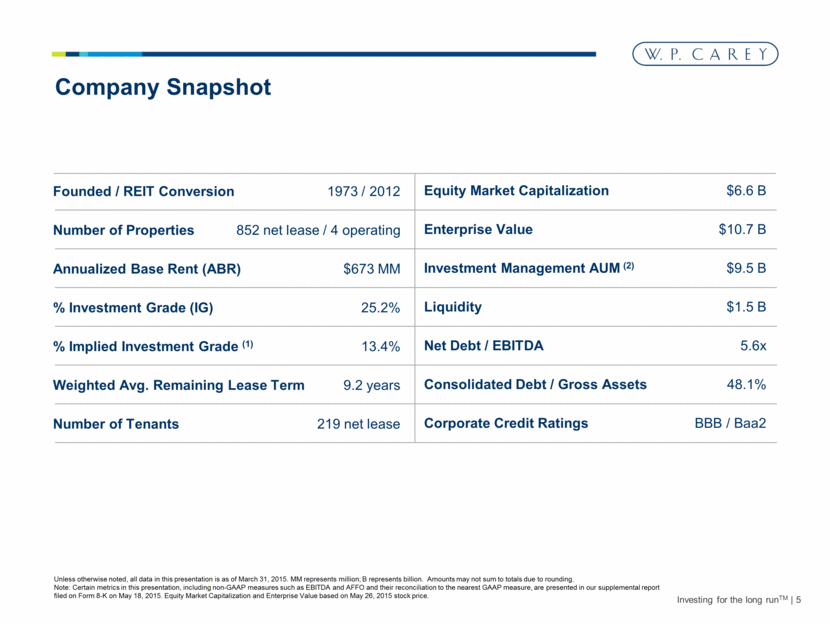
Investing for the long runTM 5 Company Snapshot Equity Market Capitalization Enterprise Value Investment Management AUM (2) Liquidity Net Debt / EBITDA Consolidated Debt / Gross Assets Corporate Credit Ratings Founded / REIT Conversion Number of Properties Annualized Base Rent (ABR) % Investment Grade (IG) % Implied Investment Grade (1) Weighted Avg. Remaining Lease Term Number of Tenants 1973 / 2012 852 net lease / 4 operating $673 MM 25.2% 13.4% 9.2 years 219 net lease $6.6 B $10.7 B $9.5 B $1.5 B 5.6x 48.1% BBB / Baa2 Unless otherwise noted, all data in this presentation is as of March 31, 2015. MM represents million; B represents billion. Amounts may not sum to totals due to rounding. Note: Certain metrics in this presentation, including non-GAAP measures such as EBITDA and AFFO and their reconciliation to the nearest GAAP measure, are presented in our supplemental report filed on Form 8-K on May 18, 2015. Equity Market Capitalization and Enterprise Value based on May 26, 2015 stock price. |
|
|
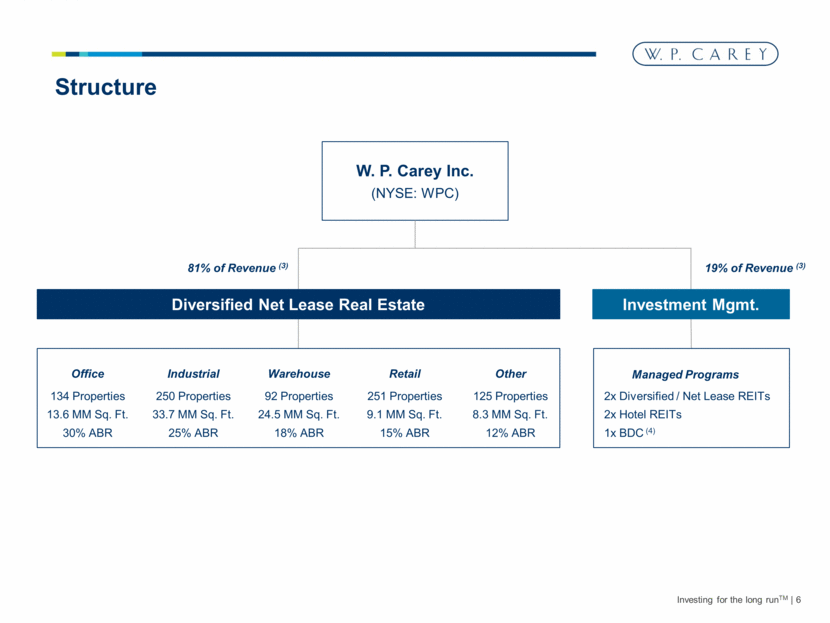
Investing for the long runTM 6 Structure W. P. Carey Inc. (NYSE: WPC) Diversified Net Lease Real Estate Investment Mgmt. Office Managed Programs 81% of Revenue (3) 19% of Revenue (3) 134 Properties 13.6 MM Sq. Ft. 30% ABR 2x Diversified / Net Lease REITs 2x Hotel REITs 1x BDC (4) Other 125 Properties 8.3 MM Sq. Ft. 12% ABR Retail 251 Properties 9.1 MM Sq. Ft. 15% ABR Industrial 250 Properties 33.7 MM Sq. Ft. 25% ABR Warehouse 92 Properties 24.5 MM Sq. Ft. 18% ABR |
|
|
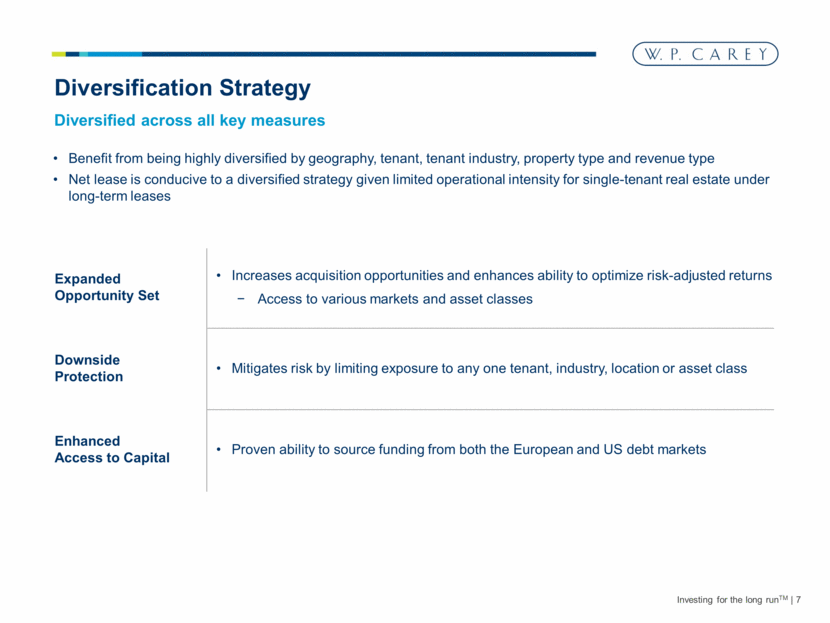
Investing for the long runTM 7 Diversification Strategy Expanded Opportunity Set Downside Protection Enhanced Access to Capital Increases acquisition opportunities and enhances ability to optimize risk-adjusted returns Access to various markets and asset classes Mitigates risk by limiting exposure to any one tenant, industry, location or asset class Proven ability to source funding from both the European and US debt markets Benefit from being highly diversified by geography, tenant, tenant industry, property type and revenue type Net lease is conducive to a diversified strategy given limited operational intensity for single-tenant real estate under long-term leases Diversified across all key measures |
|
|
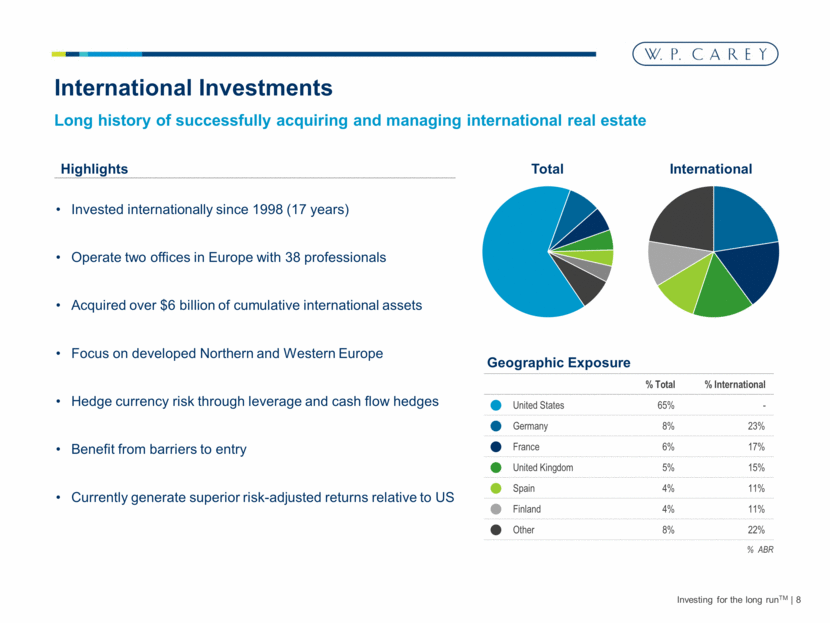
Investing for the long runTM 8 International Investments Long history of successfully acquiring and managing international real estate Highlights Invested internationally since 1998 (17 years) Operate two offices in Europe with 38 professionals Acquired over $6 billion of cumulative international assets Focus on developed Northern and Western Europe Hedge currency risk through leverage and cash flow hedges Benefit from barriers to entry Currently generate superior risk-adjusted returns relative to US % Total % International United States 65% - Germany 8% 23% France 6% 17% United Kingdom 5% 15% Spain 4% 11% Finland 4% 11% Other 8% 22% Geographic Exposure Total International % ABR |
|
|
Investing for the long runTM 9 Investment Environment Nascent economic recovery Initiation of Quantitative Easing program Low interest rate environment expected to persist Rising investor demand for real estate Potential for cap rate compression Domestic Ability to capitalize on superior relative risk-adjusted returns abroad Europe Economic recovery is well underway Quantitative Easing program completed Expectations of rising interest rates Global demand for yield chasing US real estate Cap rates approaching historical lows Spreads typically 50 – 150 bps wider for comparable investments in Europe than the US in the current environment |
|
|
Investing for the long runTM 10 Investment Management Business Strategic Benefits Ability to raise capital and grow earnings throughout economic cycle Leverage investment expertise in sectors beyond net lease Augment and diversify income streams Capitalize on valuable brand built over 40+ years Highlights Objective: Unlocking Shareholder Value Shift net lease focus to balance sheet Continue to grow and diversify AUM Enhance earnings quality Stay ahead of industry evolution |
|
|
Investing for the long runTM 11 Key Takeaways Comprehensive underwriting / approval process for acquisitions Thoughtful approach to diversification and international investment Established European presence provides unique growth opportunities in current environment Global asset management capabilities with a track record of proactively optimizing end-of-lease outcomes Executing strategy to maximize value of investment management business Conservative balance sheet to fund future growth with diversified, unsecured sources of capital |
|
|
II. Investments |
|
|
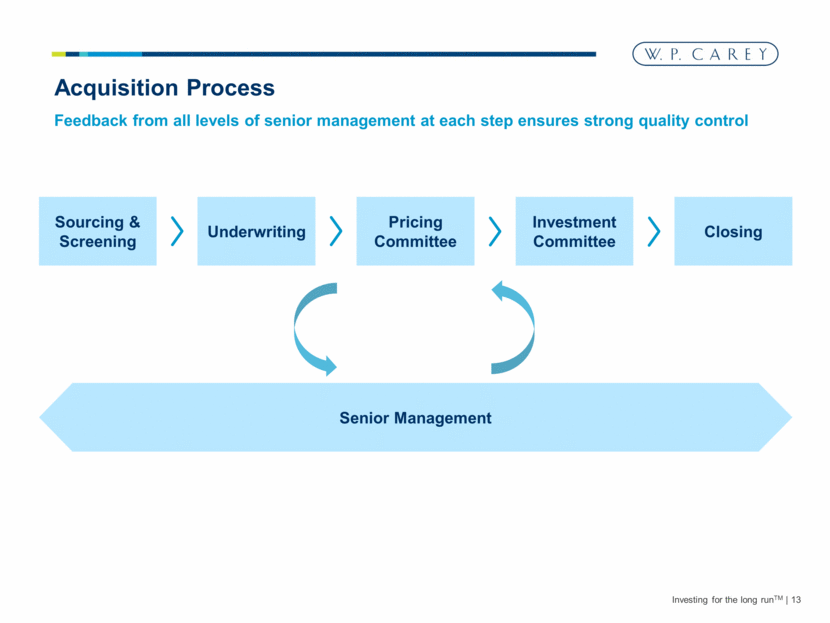
Investing for the long runTM 13 Acquisition Process Feedback from all levels of senior management at each step ensures strong quality control Sourcing & Screening Underwriting Pricing Committee Investment Committee Closing Senior Management |
|
|
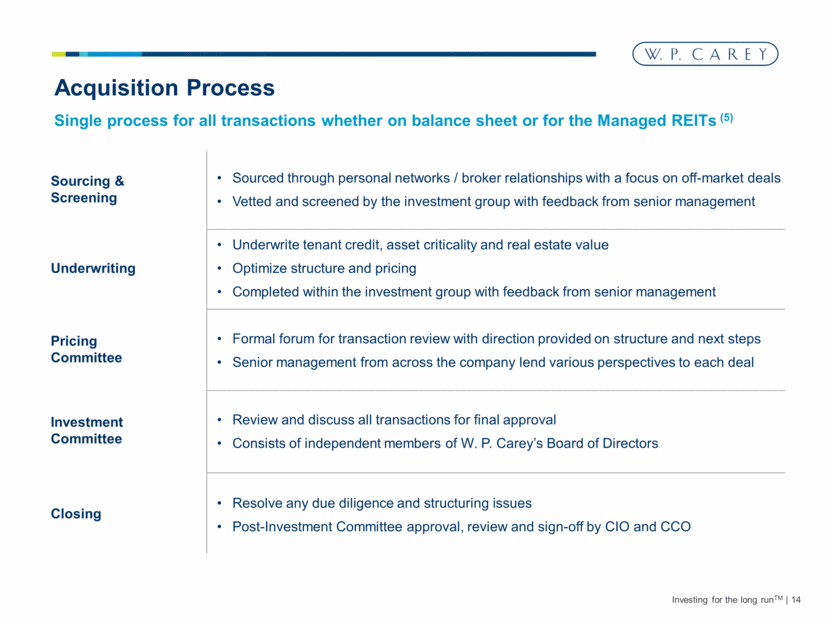
Investing for the long runTM 14 Sourcing & Screening Underwriting Pricing Committee Investment Committee Closing Sourced through personal networks / broker relationships with a focus on off-market deals Vetted and screened by the investment group with feedback from senior management Acquisition Process Underwrite tenant credit, asset criticality and real estate value Optimize structure and pricing Completed within the investment group with feedback from senior management Formal forum for transaction review with direction provided on structure and next steps Senior management from across the company lend various perspectives to each deal Review and discuss all transactions for final approval Consists of independent members of W. P. Carey’s Board of Directors Resolve any due diligence and structuring issues Post-Investment Committee approval, review and sign-off by CIO and CCO Single process for all transactions whether on balance sheet or for the Managed REITs (5) |
|
|
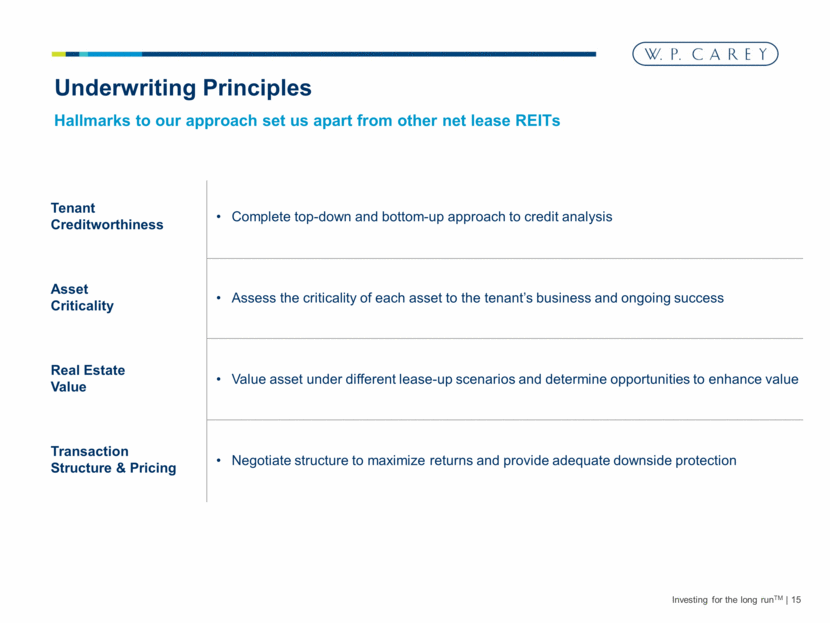
Investing for the long runTM 15 Underwriting Principles Tenant Creditworthiness Asset Criticality Real Estate Value Transaction Structure & Pricing Complete top-down and bottom-up approach to credit analysis Assess the criticality of each asset to the tenant’s business and ongoing success Value asset under different lease-up scenarios and determine opportunities to enhance value Negotiate structure to maximize returns and provide adequate downside protection Hallmarks to our approach set us apart from other net lease REITs |
|
|
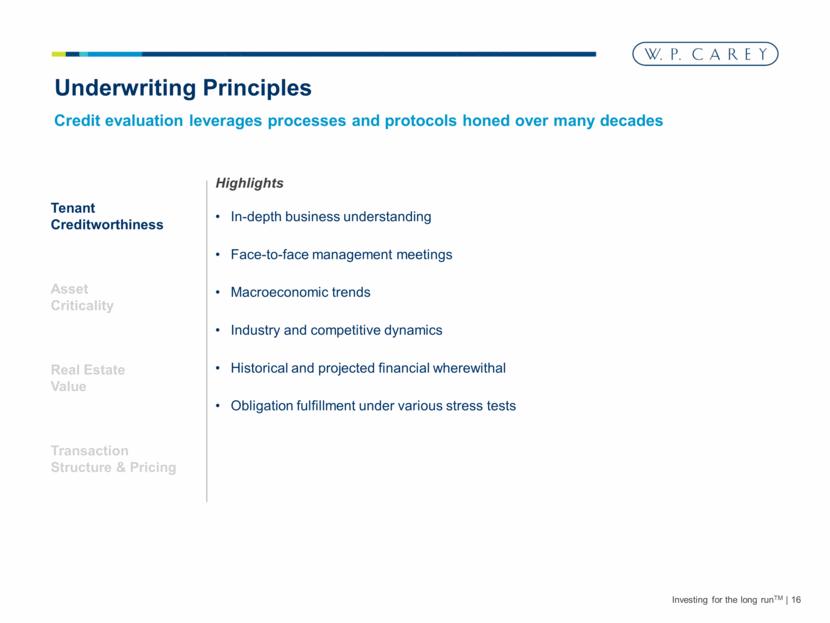
Investing for the long runTM 16 Underwriting Principles Tenant Creditworthiness Asset Criticality Real Estate Value Transaction Structure & Pricing In-depth business understanding Face-to-face management meetings Macroeconomic trends Industry and competitive dynamics Historical and projected financial wherewithal Obligation fulfillment under various stress tests Credit evaluation leverages processes and protocols honed over many decades Highlights |
|
|
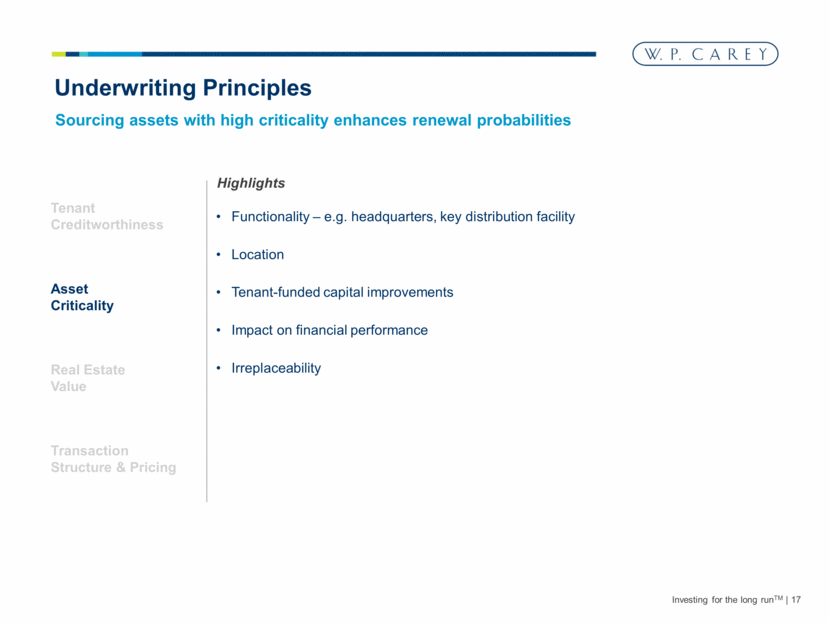
Functionality – e.g. headquarters, key distribution facility Location Tenant-funded capital improvements Impact on financial performance Irreplaceability Investing for the long runTM 17 Tenant Creditworthiness Asset Criticality Real Estate Value Highlights Underwriting Principles Sourcing assets with high criticality enhances renewal probabilities Transaction Structure & Pricing |
|
|
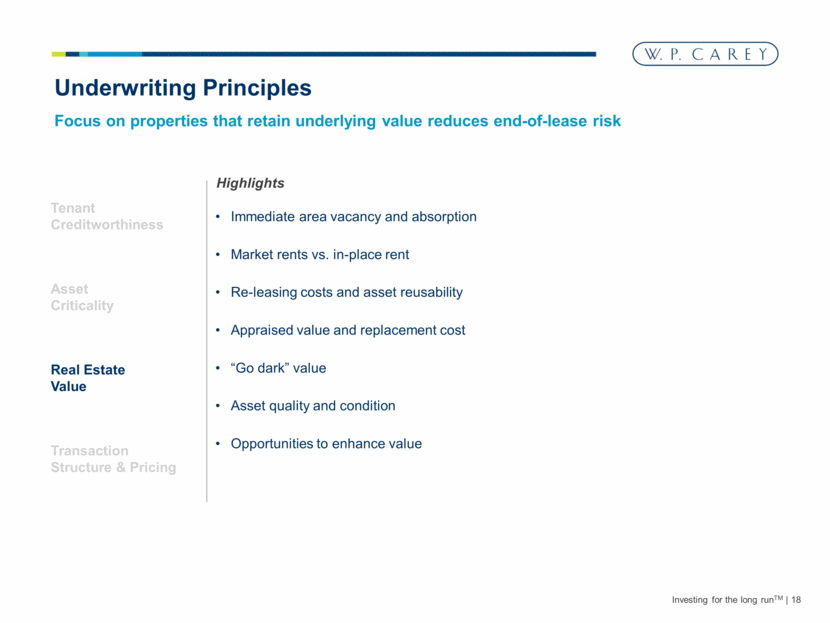
Investing for the long runTM 18 Tenant Creditworthiness Asset Criticality Real Estate Value Immediate area vacancy and absorption Market rents vs. in-place rent Re-leasing costs and asset reusability Appraised value and replacement cost “Go dark” value Asset quality and condition Opportunities to enhance value Highlights Underwriting Principles Focus on properties that retain underlying value reduces end-of-lease risk Transaction Structure & Pricing |
|
|
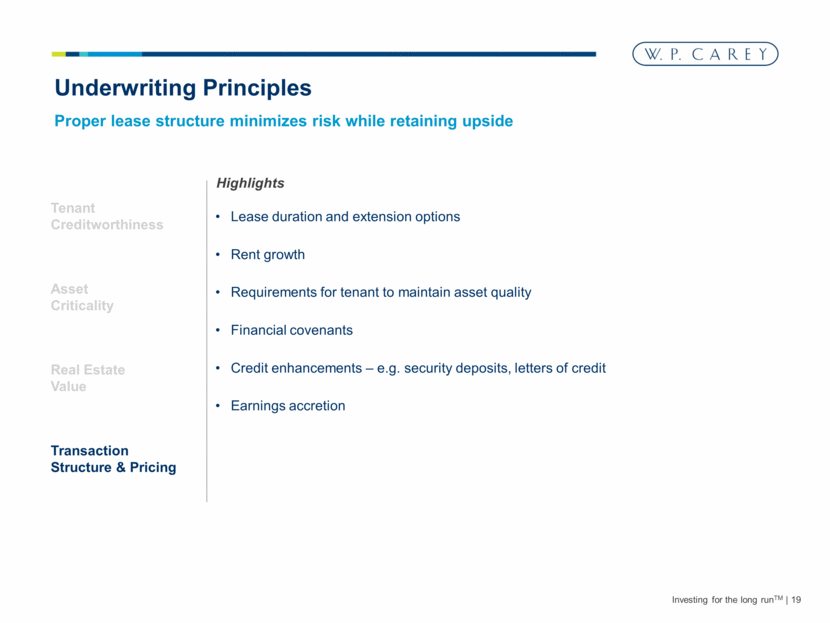
Investing for the long runTM 19 Tenant Creditworthiness Asset Criticality Real Estate Value Transaction Structure & Pricing Lease duration and extension options Rent growth Requirements for tenant to maintain asset quality Financial covenants Credit enhancements – e.g. security deposits, letters of credit Earnings accretion Highlights Underwriting Principles Proper lease structure minimizes risk while retaining upside |
|
|
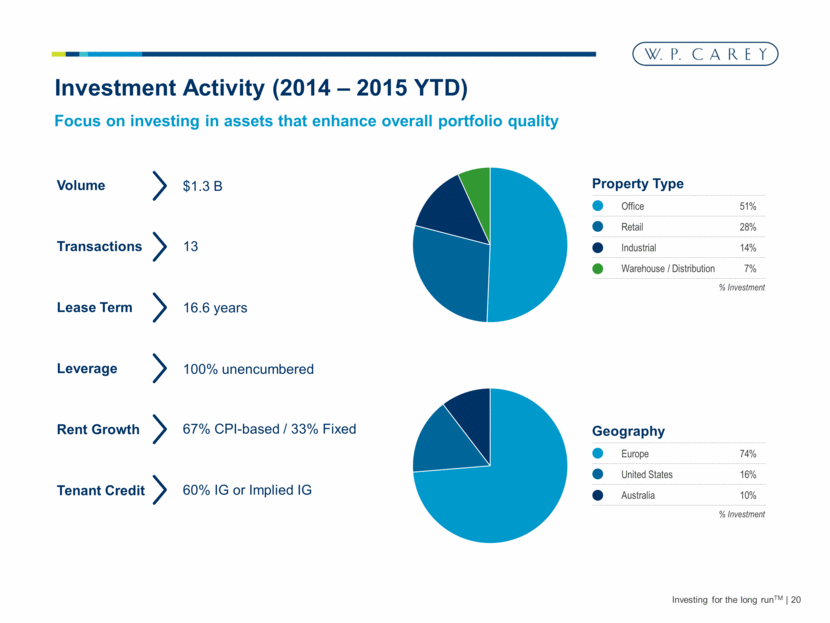
Investment Activity (2014 – 2015 YTD) Investing for the long runTM 20 Focus on investing in assets that enhance overall portfolio quality Lease Term Tenant Credit Leverage Rent Growth 100% unencumbered Volume Office 51% Retail 28% Industrial 14% Warehouse / Distribution 7% Property Type 16.6 years $1.3 B 67% CPI-based / 33% Fixed 60% IG or Implied IG Transactions 13 Europe 74% United States 16% Australia 10% Geography % Investment % Investment |
|
|
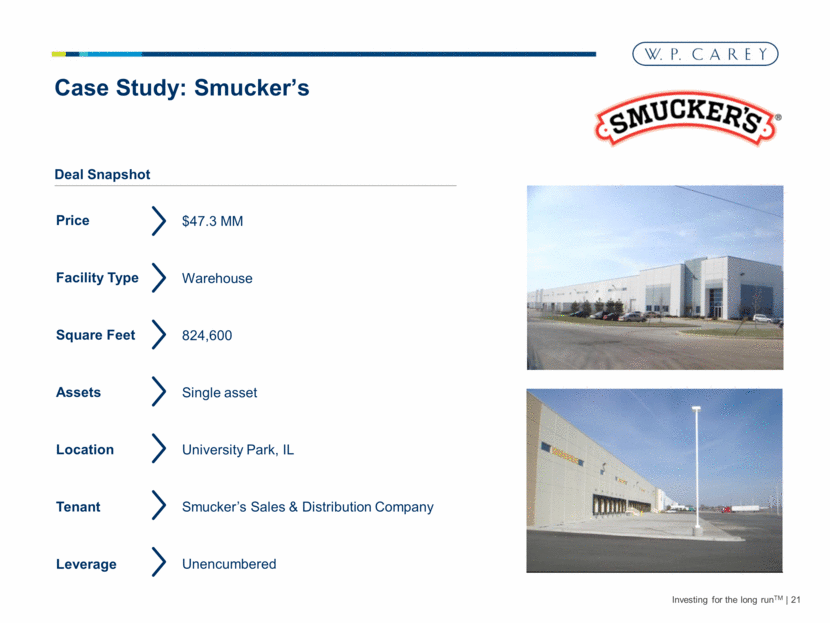
Investing for the long runTM 21 Case Study: Smucker’s 824,600 $47.3 MM University Park, IL Smucker’s Sales & Distribution Company Warehouse Unencumbered Square Feet Tenant Assets Location Price Facility Type Leverage Single asset Deal Snapshot |
|
|
Investing for the long runTM 22 Case Study: Smucker’s Distribution subsidiary of a large manufacturer and marketer of branded food products Lease guaranteed by investment grade parent, The J. M. Smucker Company One of only six US distribution centers for Smucker’s Expanded in 2013 to distribute coffee manufactured by Folgers Modern, easily-demisable and accessible Class-A distribution center Acquired building below replacement cost Lease term of 9.5 years with two three-year extension options Fixed rent escalations Tenant Creditworthiness Asset Criticality Real Estate Value Transaction Structure & Pricing Highlights |
|
|
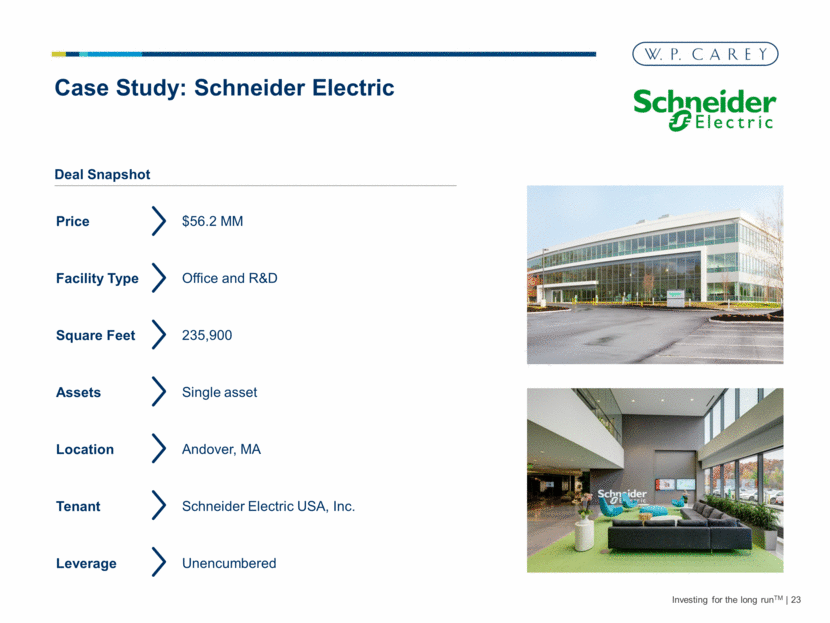
Investing for the long runTM 23 Case Study: Schneider Electric 235,900 $56.2 MM Andover, MA Schneider Electric USA, Inc. Office and R&D Square Feet Tenant Assets Location Price Facility Type Single asset Unencumbered Leverage Deal Snapshot |
|
|
Investing for the long runTM 24 Case Study: Schneider Electric Parent is investment-grade rated with a market capitalization of over $40 billion Guarantor represents substantial portion of parent sales in North America One of five major R&D facilities for the company and the only such facility in the US Company heavily invested in the asset to convert to US corporate headquarters Recently renovated, energy-efficient Class-A office building with new addition Below-market rents with ability to function as multi-tenanted building if vacated Lease term of 15 years with two five-year renewal options Fixed rent escalations Tenant Creditworthiness Asset Criticality Real Estate Value Transaction Structure & Pricing Highlights |
|
|
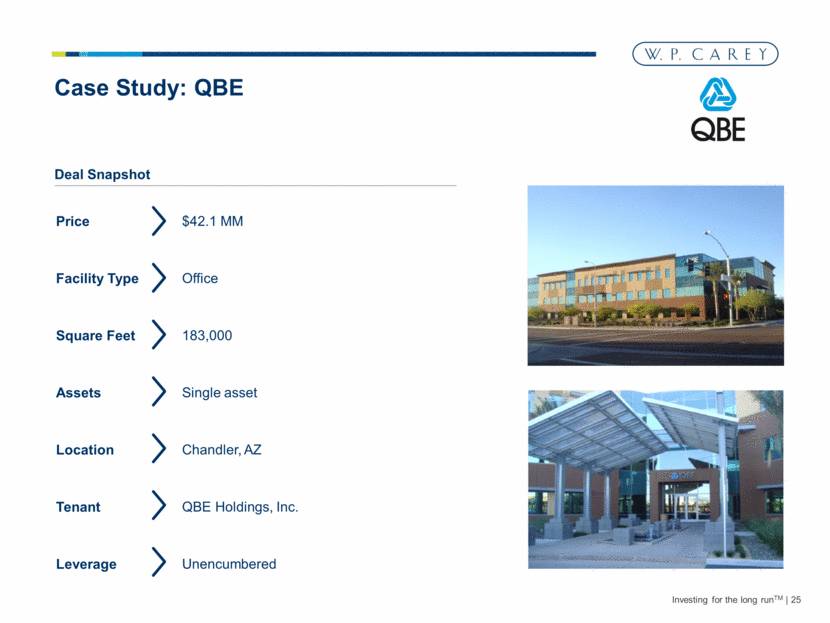
Investing for the long runTM 25 Case Study: QBE Single asset 183,000 Chandler, AZ QBE Holdings, Inc. Office Square Feet Tenant Assets Location Price Facility Type $42.1 MM Unencumbered Leverage Deal Snapshot |
|
|
Investing for the long runTM 26 Case Study: QBE North American subsidiary of a “top five” global insurance company North American segment accounts for significant portion of global revenue for the QBE Group (rated A/A2) Regional headquarters for West Coast operations Proximate to several Southwest and Pacific business lines Newly constructed Class-A office space in the attractive “Price Road Corridor” submarket Below market rents in tight submarket with low vacancy decreases residual risk Lease term of 10 years with two five-year renewal options Retained option to construct comparable sized building on the site at an attractive basis Fixed rent escalations Tenant Creditworthiness Asset Criticality Real Estate Value Transaction Structure & Pricing Highlights |
|
|
Investing for the long runTM 27 European Investment Advantage Competitive Advantages Deep-rooted deal sourcing network that spans Europe Positive track record of deal execution and proven ability to close Multi-jurisdictional transaction and tax capabilities Local presence with offices in London and Amsterdam with multi-lingual staff Flexibility to allocate capital to large portfolio deals or individual assets Highlights Establishing new relationships with sellers, developers, brokers and operating partners Navigating diverse legal systems and tax regimes Developing an understanding of country-specific economic and political considerations Assembling a multi-lingual team that can conduct business in a variety of local markets New Entrant Considerations |
|
|
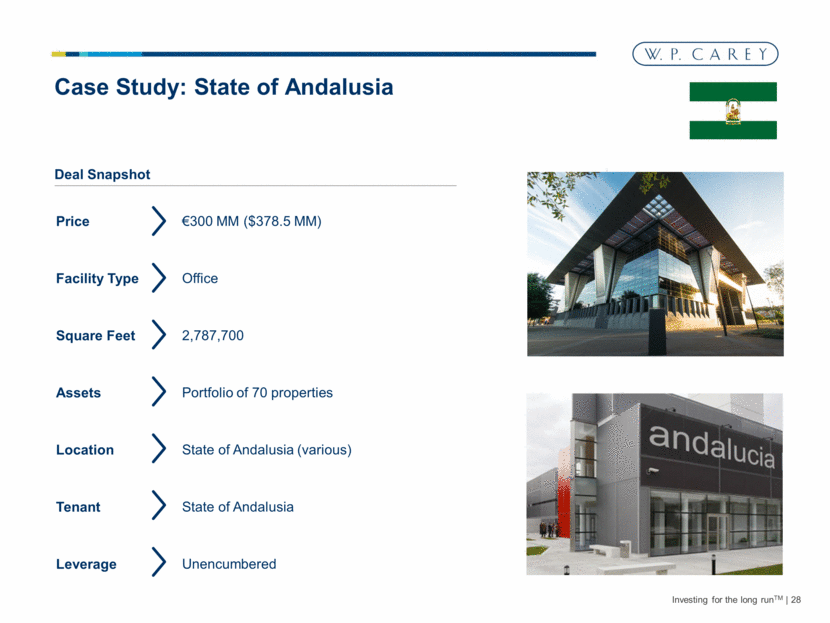
Investing for the long runTM 28 Case Study: State of Andalusia Portfolio of 70 properties 2,787,700 State of Andalusia (various) State of Andalusia Office Square Feet Tenant Assets Location Price Facility Type €300 MM ($378.5 MM) Unencumbered Leverage Deal Snapshot |
|
|
Investing for the long runTM 29 Case Study: State of Andalusia Tenant rated BBB- / Stable (S&P) and Ba1 / Positive (Moody’s) Strong support of Spanish Government and ample ability to meet lease obligations House essential government services – e.g. Ministry of Health Located in the capital and other major cities where extensive barriers to entry exist Diversified office portfolio – no individual asset represents a significant portion of the value Low residual / renewal risk with long-term redevelopment potential Bulk discount on portfolio purchase Weighted average lease term of 20 years Uncapped CPI with a minimum fixed floor Tenant Creditworthiness Asset Criticality Real Estate Value Transaction Structure & Pricing Highlights |
|
|
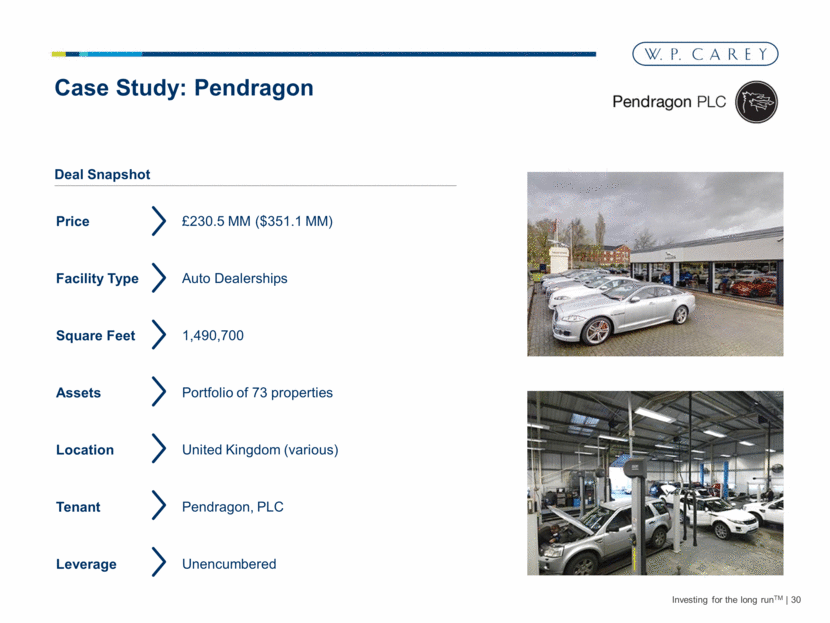
Investing for the long runTM 30 Case Study: Pendragon Square Feet Tenant Assets Location Portfolio of 73 properties Price 1,490,700 £230.5 MM ($351.1 MM) United Kingdom (various) Facility Type Auto Dealerships Unencumbered Leverage Deal Snapshot Pendragon, PLC |
|
|
Investing for the long runTM 31 Case Study: Pendragon Largest automotive retailer in the UK Strong rent coverage from diversified revenue streams (service / new & used car sales) Represents approximately one-third of Pendragon’s UK dealerships Very difficult to obtain permits for new auto dealership sites in the UK Potential to sell individual car dealerships at a premium to allocated purchase price Highly diversified portfolio geographically and by automotive brand / price point Bulk discount on portfolio purchase Weighed average lease term of 15 years 70% UK RPI capped / 30% fixed rent escalations Tenant Creditworthiness Asset Criticality Real Estate Value Transaction Structure & Pricing Highlights |
|
|
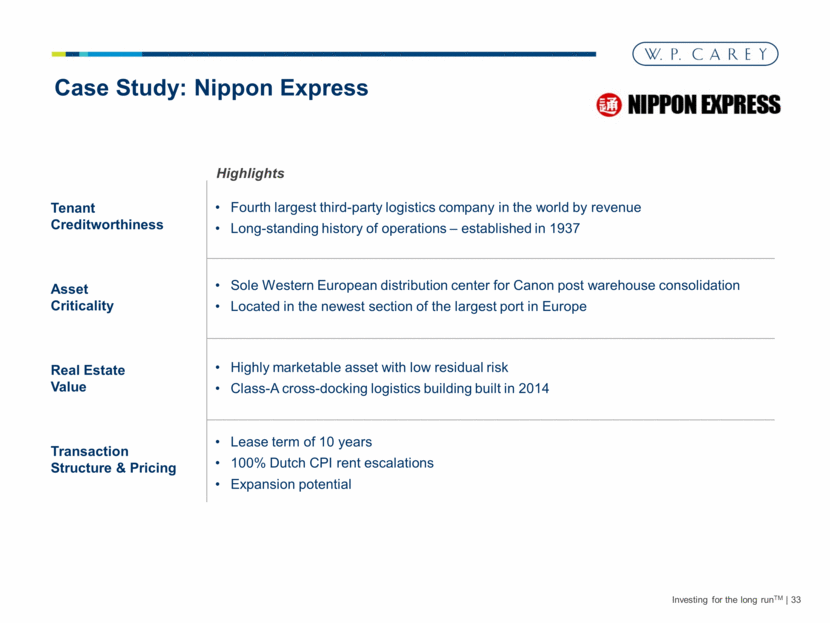
Investing for the long runTM 32 Case Study: Nippon Express Single asset 761,400 Rotterdam, Netherlands Nippon Express (Nederland) B.V. Logistics Square Feet Tenant Assets Location Price Facility Type €38.5 MM ($43.2 MM) Unencumbered Leverage Deal Snapshot |
|
|
Investing for the long runTM 33 Case Study: Nippon Express Fourth largest third-party logistics company in the world by revenue Long-standing history of operations – established in 1937 Sole Western European distribution center for Canon post warehouse consolidation Located in the newest section of the largest port in Europe Highly marketable asset with low residual risk Class-A cross-docking logistics building built in 2014 Lease term of 10 years 100% Dutch CPI rent escalations Expansion potential Tenant Creditworthiness Asset Criticality Real Estate Value Transaction Structure & Pricing Highlights |
|
|
Break |
|
|
III. Asset Management |
|
|
Investing for the long runTM 36 Asset Management Overview Portfolio Analysis Portfolio Detail Representative Outcomes Global Asset Management Platform |
|
|
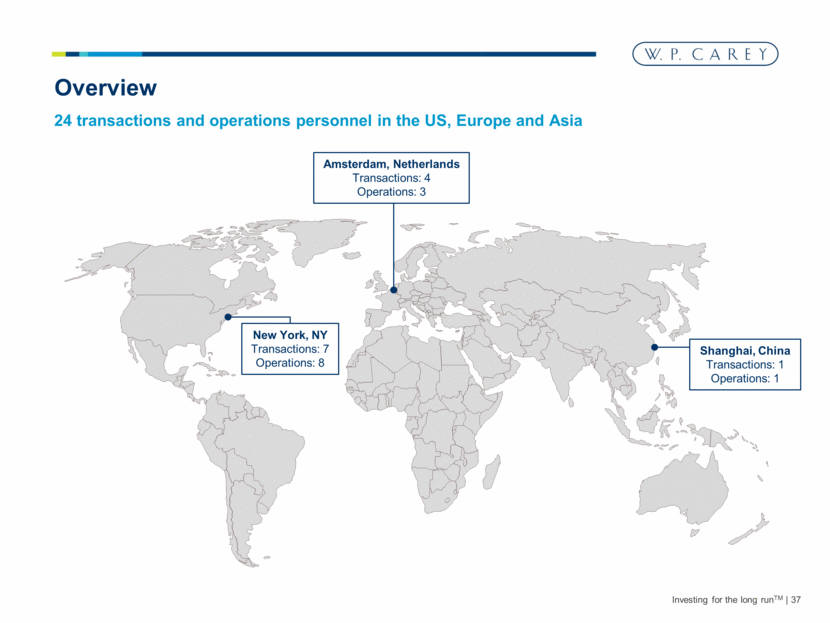
Investing for the long runTM 37 Overview 24 transactions and operations personnel in the US, Europe and Asia New York, NY Transactions: 7 Operations: 8 Amsterdam, Netherlands Transactions: 4 Operations: 3 Shanghai, China Transactions: 1 Operations: 1 |
|
|
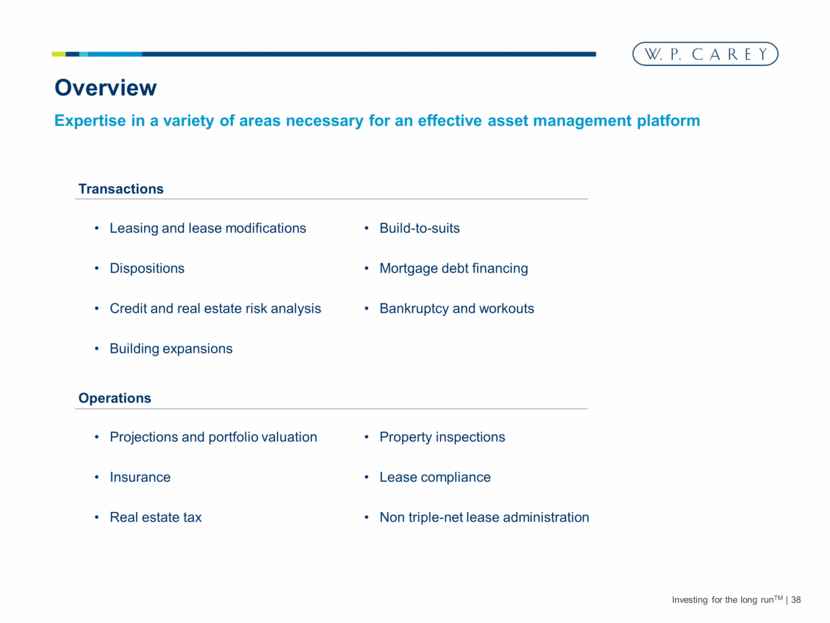
Investing for the long runTM 38 Overview Transactions Leasing and lease modifications Dispositions Credit and real estate risk analysis Building expansions Operations Build-to-suits Mortgage debt financing Bankruptcy and workouts Projections and portfolio valuation Insurance Real estate tax Property inspections Lease compliance Non triple-net lease administration Expertise in a variety of areas necessary for an effective asset management platform |
|
|
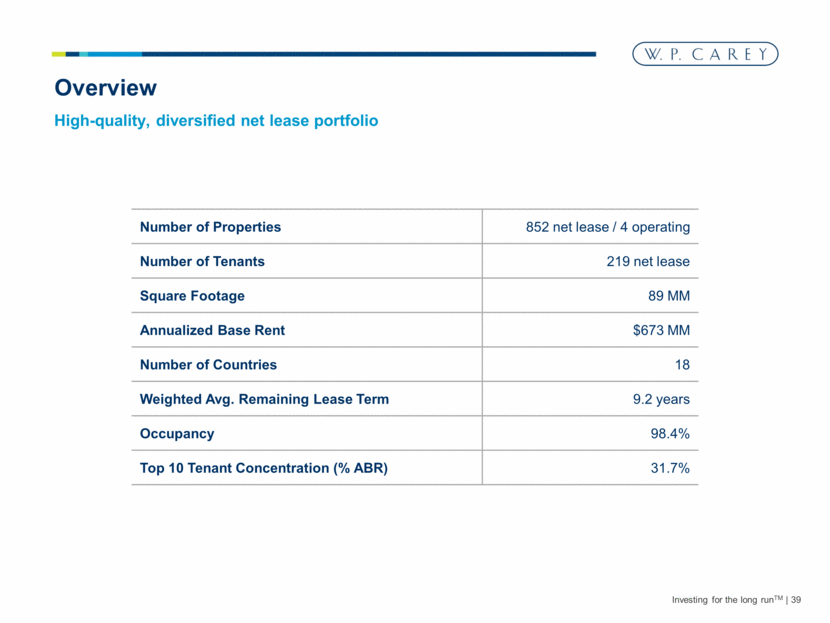
Investing for the long runTM 39 Overview High-quality, diversified net lease portfolio Number of Properties 852 net lease / 4 operating Number of Tenants 219 net lease Square Footage 89 MM Annualized Base Rent $673 MM Number of Countries 18 Weighted Avg. Remaining Lease Term 9.2 years Occupancy 98.4% Top 10 Tenant Concentration (% ABR) 31.7% |
|
|
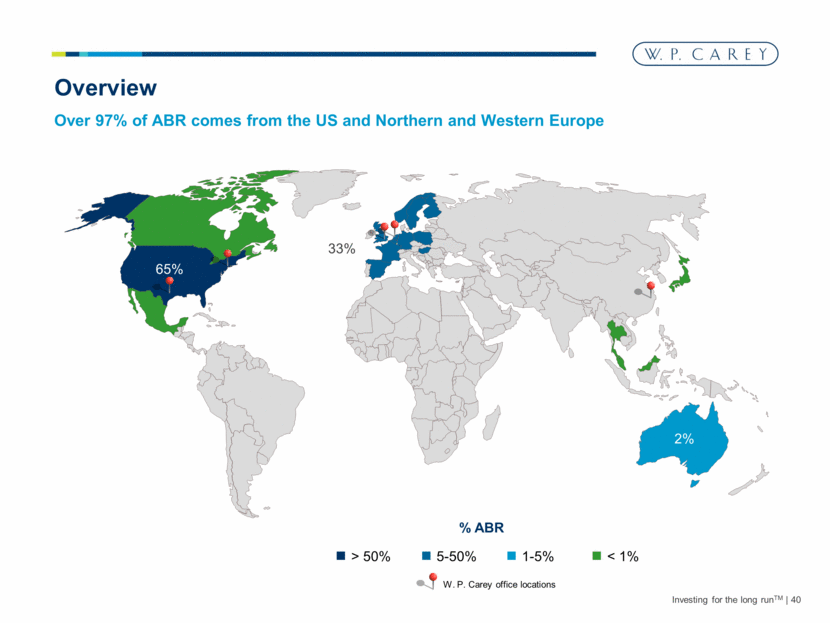
Investing for the long runTM 40 Overview Over 97% of ABR comes from the US and Northern and Western Europe > 50% 5-50% 1-5% % ABR W. P. Carey office locations 65% 33% 2% < 1% |
|
|
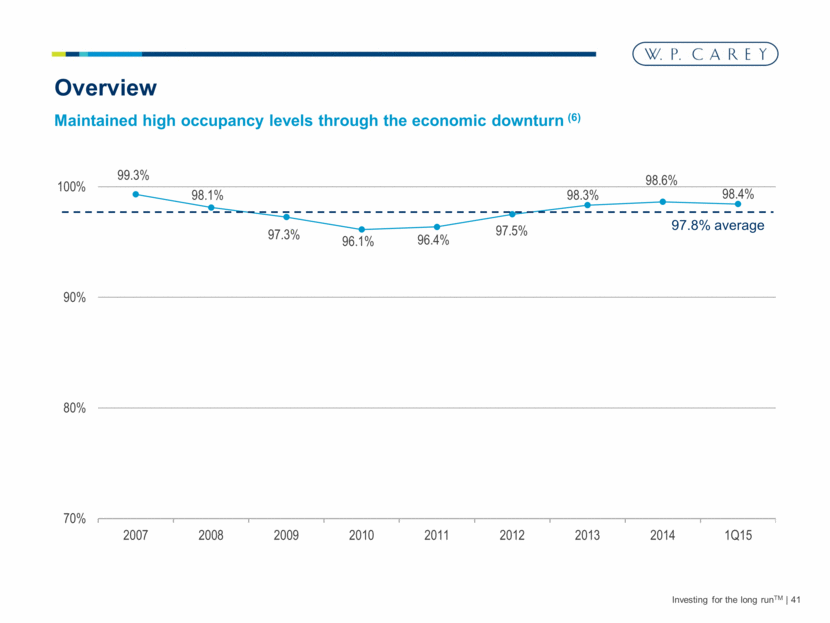
Investing for the long runTM 41 Overview 97.8% average Maintained high occupancy levels through the economic downturn (6) 99.3% 98.1% 97.3% 96.1% 96.4% 97.5% 98.3% 98.6% 98.4% 70% 80% 90% 100% 2007 2008 2009 2010 2011 2012 2013 2014 1Q15 |
|
|
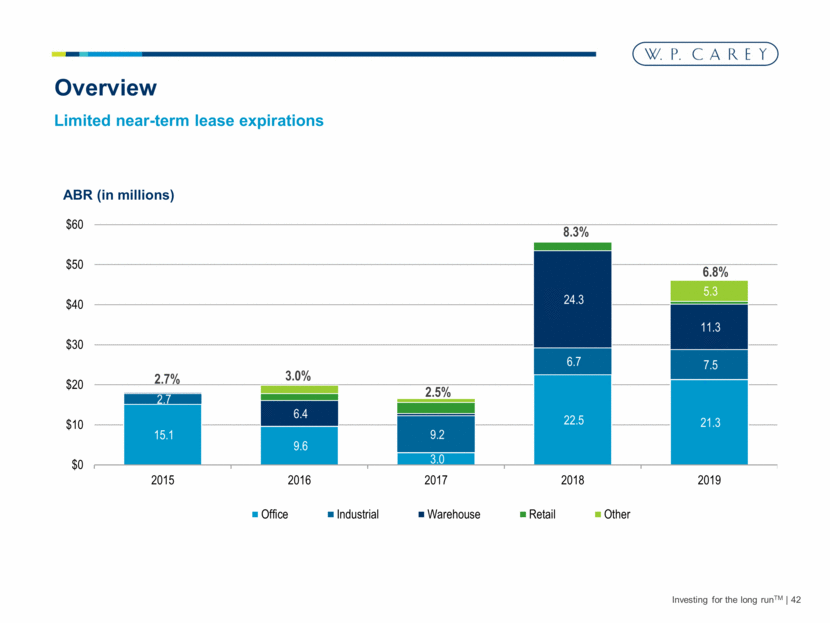
Investing for the long runTM 42 Overview Limited near-term lease expirations 2.7% 3.0% 2.5% 8.3% 6.8% ABR (in millions) 15.1 9.6 3.0 22.5 21.3 2.7 9.2 6.7 7.5 6.4 24.3 11.3 5.3 $0 $10 $20 $30 $40 $50 $60 2015 2016 2017 2018 2019 Office Industrial Warehouse Retail Other |
|
|
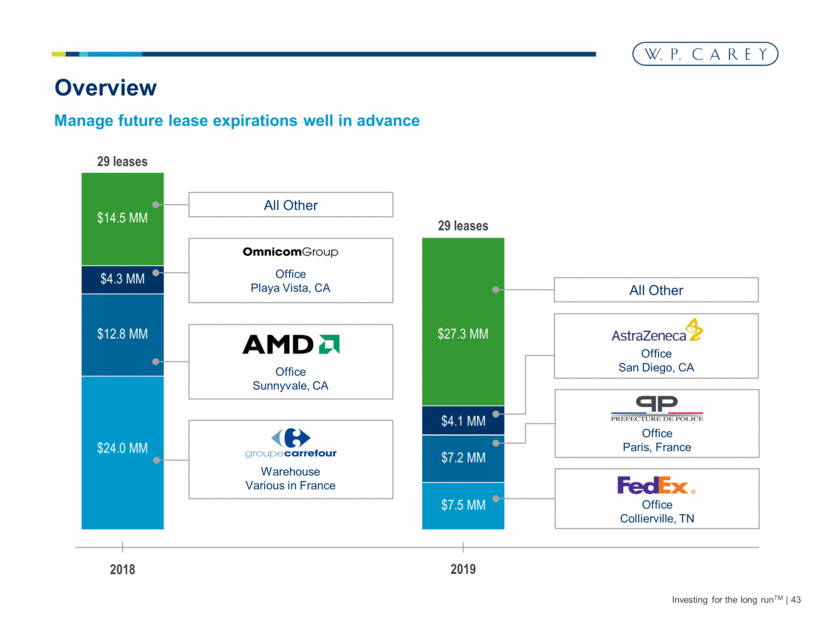
Investing for the long runTM 43 Overview Manage future lease expirations well in advance 2018 $24.0 MM $12.8 MM $14.5 MM 2019 $7.5 MM $27.3 MM $7.2 MM $4.3 MM Warehouse Various in France Office Sunnyvale, CA Office Playa Vista, CA All Other $4.1 MM Office Collierville, TN Office Paris, France Office San Diego, CA 29 leases 29 leases All Other |
|
|
Investing for the long runTM 44 Asset Management Overview Portfolio Analysis Portfolio Detail Representative Outcomes Global Asset Management Platform |
|
|
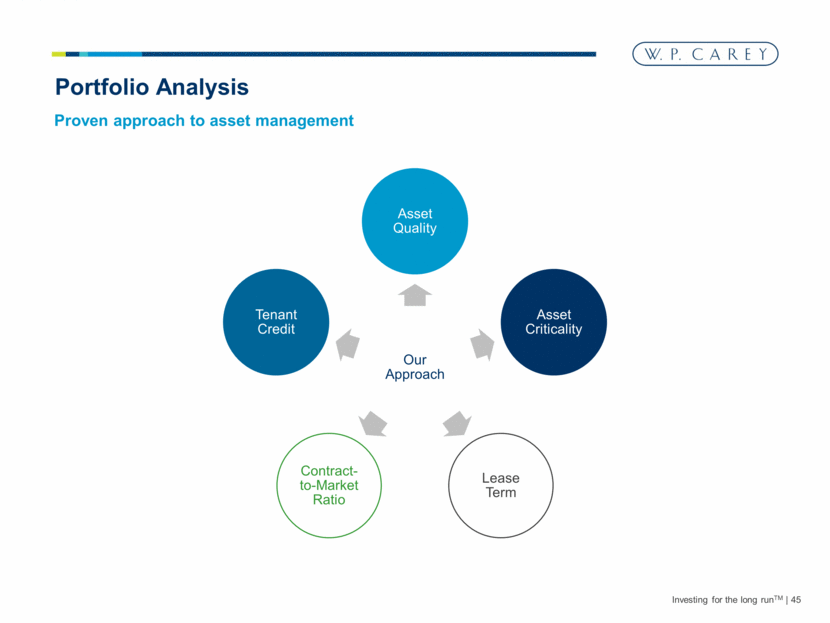
Investing for the long runTM 45 Portfolio Analysis Proven approach to asset management Our Approach Asset Quality Asset Criticality Lease Term Contract-to-Market Ratio Tenant Credit |
|
|
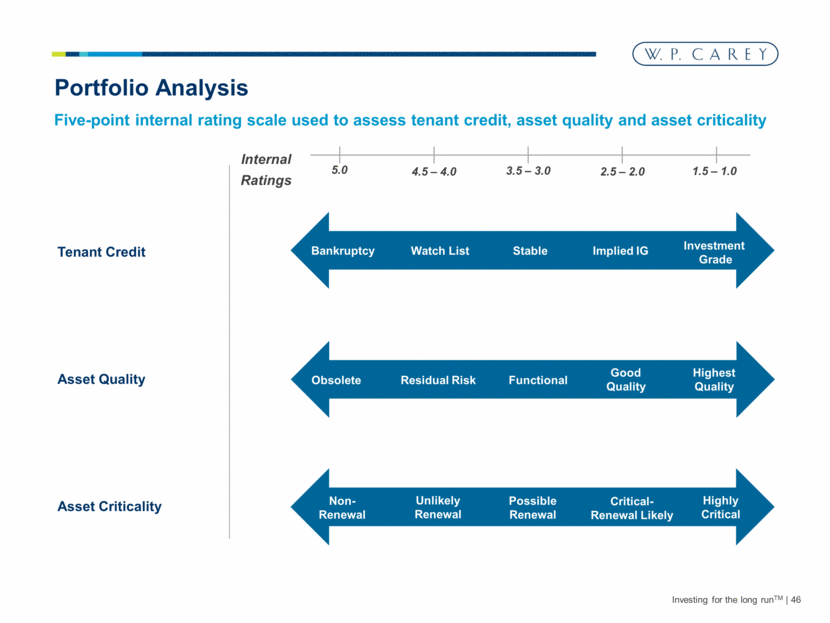
Investing for the long runTM 46 Portfolio Analysis Five-point internal rating scale used to assess tenant credit, asset quality and asset criticality Obsolete Residual Risk Functional Good Quality Highest Quality Bankruptcy Watch List Implied IG Investment Grade Stable Tenant Credit Asset Quality Asset Criticality Non- Renewal Unlikely Renewal Possible Renewal Critical-Renewal Likely Highly Critical Internal Ratings 5.0 4.5 – 4.0 3.5 – 3.0 2.5 – 2.0 1.5 – 1.0 |
|
|
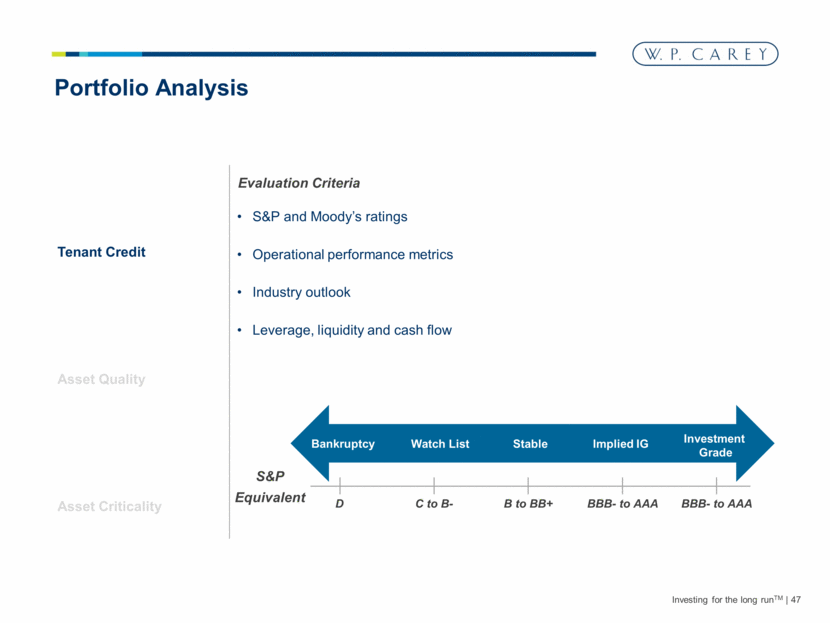
Investing for the long runTM 47 Portfolio Analysis Bankruptcy Watch List Implied IG Investment Grade Stable Tenant Credit Asset Quality Asset Criticality S&P Equivalent D C to B- B to BB+ BBB- to AAA BBB- to AAA Evaluation Criteria S&P and Moody’s ratings Operational performance metrics Industry outlook Leverage, liquidity and cash flow |
|
|
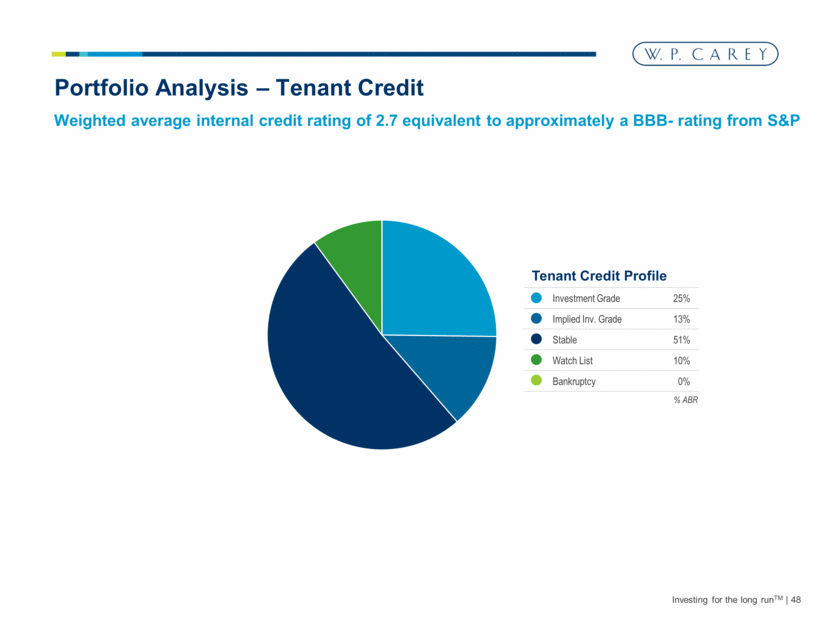
Investing for the long runTM 48 Portfolio Analysis – Tenant Credit Weighted average internal credit rating of 2.7 equivalent to approximately a BBB- rating from S&P Investment Grade 25% Implied Inv. Grade 13% Stable 51% Watch List 10% Bankruptcy 0% % ABR Tenant Credit Profile |
|
|
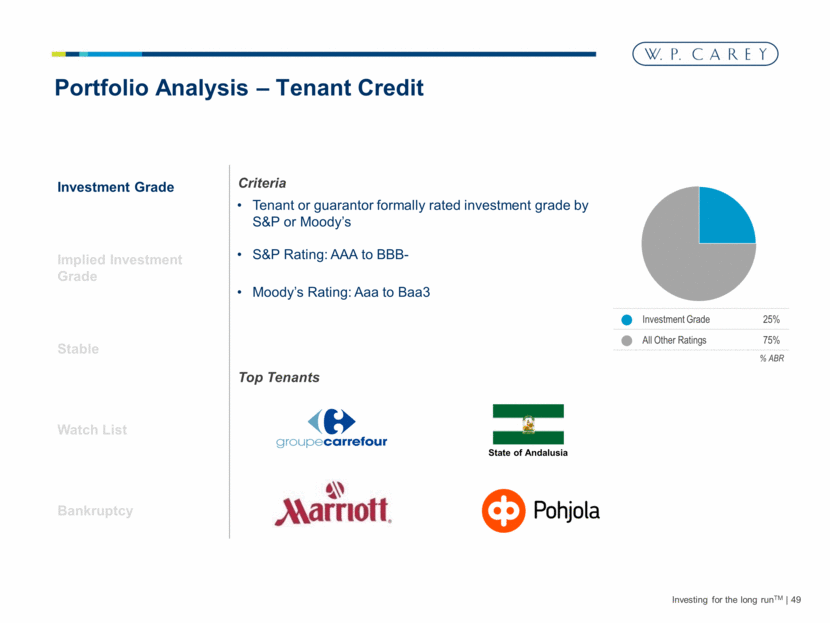
Investing for the long runTM 49 Portfolio Analysis – Tenant Credit Investment Grade Implied Investment Grade Stable Watch List Bankruptcy Tenant or guarantor formally rated investment grade by S&P or Moody’s S&P Rating: AAA to BBB- Moody’s Rating: Aaa to Baa3 Criteria Top Tenants State of Andalusia Investment Grade 25% All Other Ratings 75% % ABR |
|
|
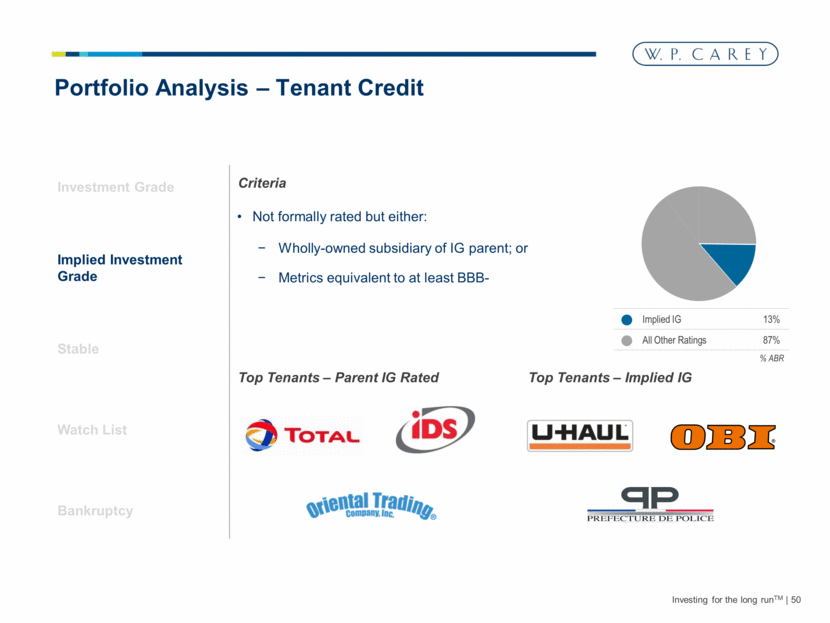
Investing for the long runTM 50 Portfolio Analysis – Tenant Credit Investment Grade Implied Investment Grade Stable Watch List Bankruptcy Not formally rated but either: Wholly-owned subsidiary of IG parent; or Metrics equivalent to at least BBB- Criteria Top Tenants – Parent IG Rated Top Tenants – Implied IG Implied IG 13% All Other Ratings 87% % ABR |
|
|
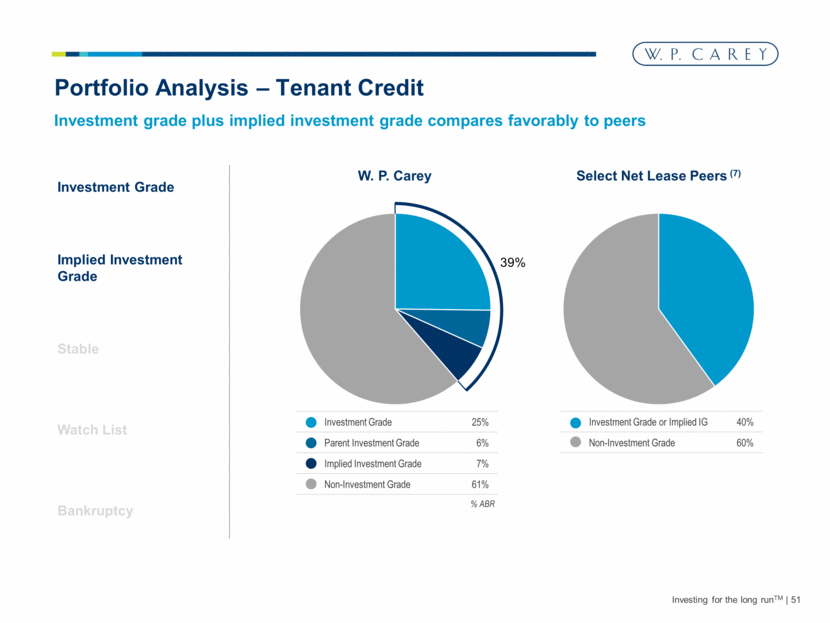
Investing for the long runTM 51 Portfolio Analysis – Tenant Credit Investment Grade Implied Investment Grade Stable Watch List Bankruptcy Investment grade plus implied investment grade compares favorably to peers 39% Investment Grade 25% Parent Investment Grade 6% Implied Investment Grade 7% Non-Investment Grade 61% Investment Grade or Implied IG 40% Non-Investment Grade 60% % ABR W. P. Carey Select Net Lease Peers (7) |
|
|
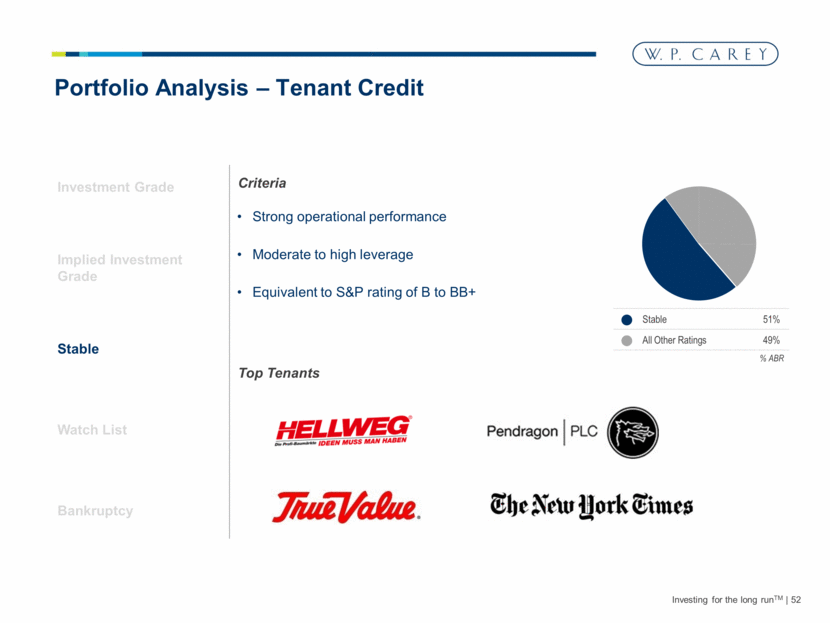
Investing for the long runTM 52 Portfolio Analysis – Tenant Credit Investment Grade Implied Investment Grade Stable Watch List Bankruptcy Strong operational performance Moderate to high leverage Equivalent to S&P rating of B to BB+ Criteria Top Tenants Stable 51% All Other Ratings 49% % ABR |
|
|
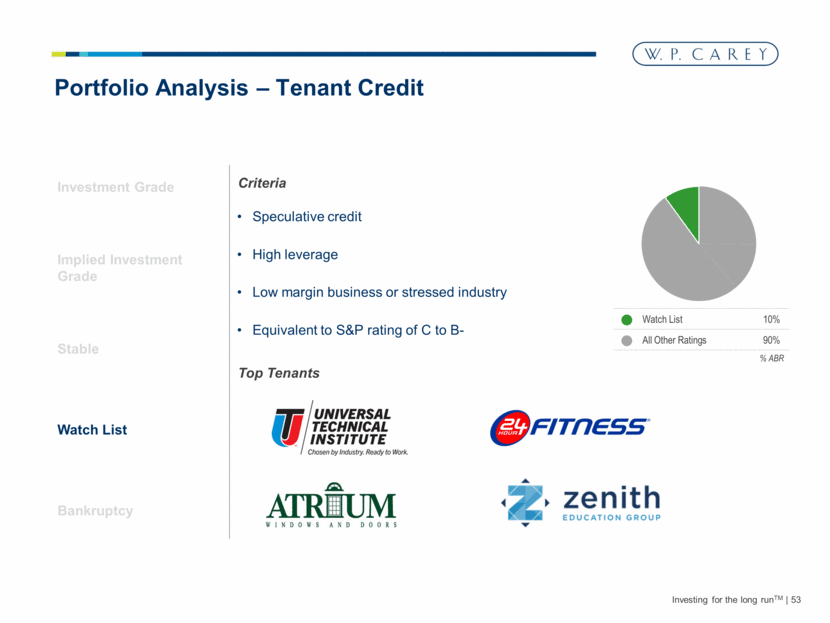
Investing for the long runTM 53 Portfolio Analysis – Tenant Credit Investment Grade Implied Investment Grade Stable Watch List Bankruptcy Speculative credit High leverage Low margin business or stressed industry Equivalent to S&P rating of C to B- Criteria Top Tenants Watch List 10% All Other Ratings 90% % ABR |
|
|
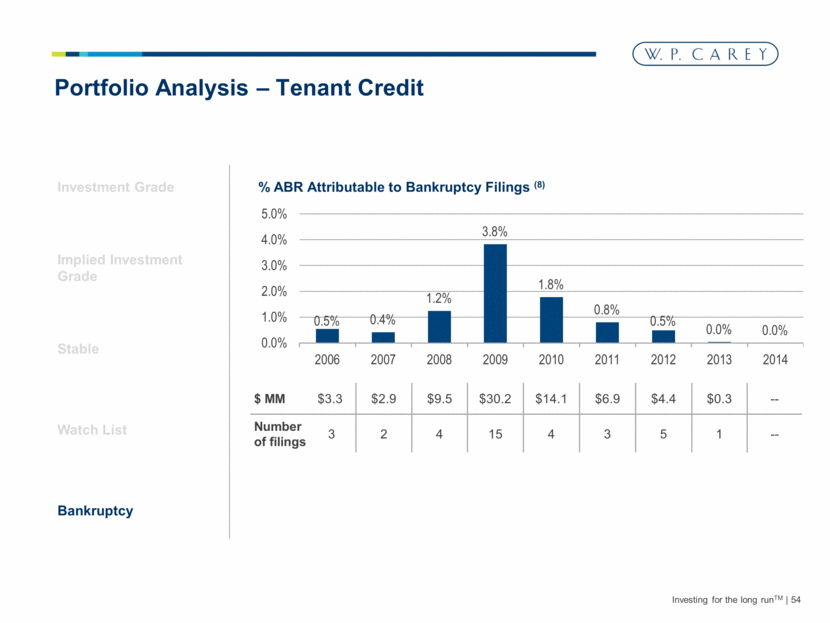
Investing for the long runTM 54 Portfolio Analysis – Tenant Credit Investment Grade Implied Investment Grade Stable Watch List Bankruptcy $ MM $3.3 $2.9 $9.5 $30.2 $14.1 $6.9 $4.4 $0.3 -- Number of filings 3 2 4 15 4 3 5 1 -- % ABR Attributable to Bankruptcy Filings (8) 0.5% 0.4% 1.2% 3.8% 1.8% 0.8% 0.5% 0.0% 0.0% 0.0% 1.0% 2.0% 3.0% 4.0% 5.0% 2006 2007 2008 2009 2010 2011 2012 2013 2014 |
|
|
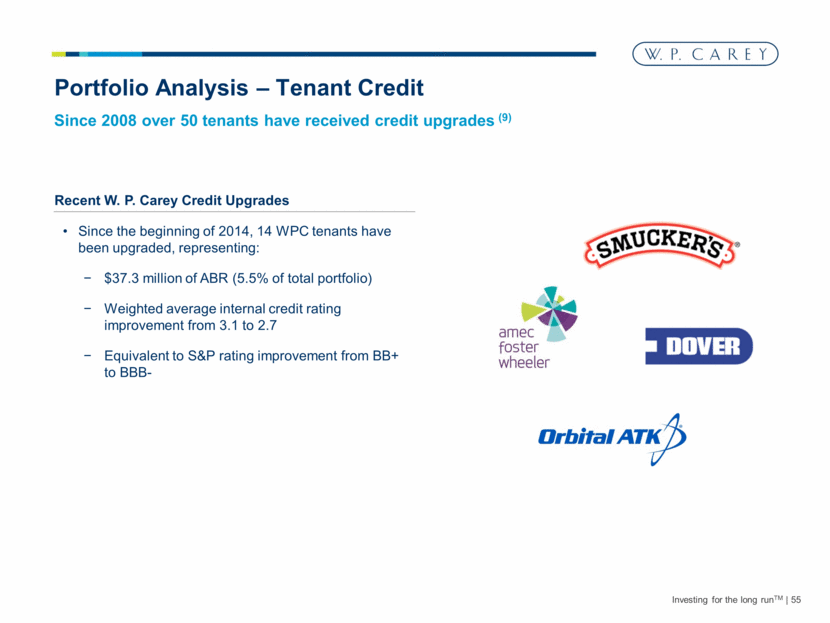
Investing for the long runTM 55 Portfolio Analysis – Tenant Credit Since the beginning of 2014, 14 WPC tenants have been upgraded, representing: $37.3 million of ABR (5.5% of total portfolio) Weighted average internal credit rating improvement from 3.1 to 2.7 Equivalent to S&P rating improvement from BB+ to BBB- Since 2008 over 50 tenants have received credit upgrades (9) Recent W. P. Carey Credit Upgrades |
|
|
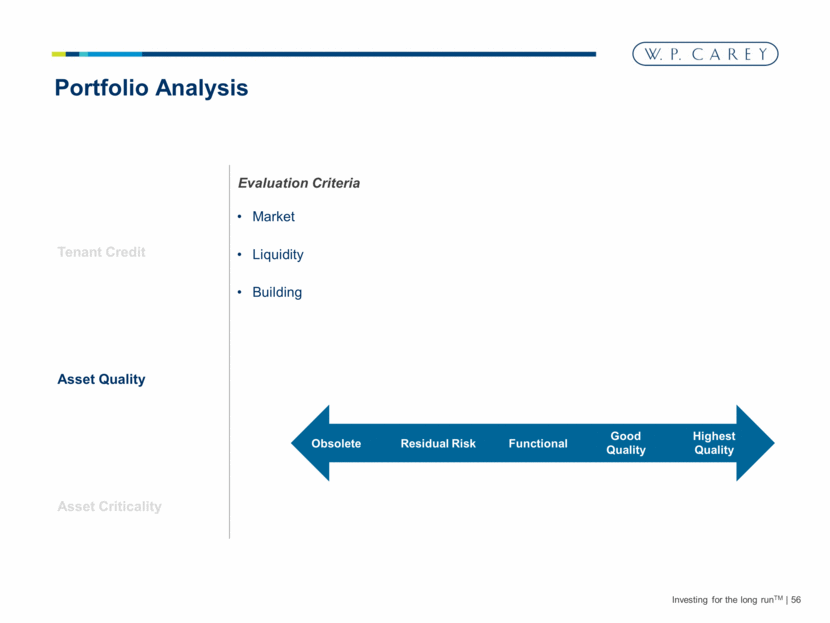
Investing for the long runTM 56 Portfolio Analysis Evaluation Criteria Market Liquidity Building Obsolete Residual Risk Functional Good Quality Highest Quality Tenant Credit Asset Quality Asset Criticality |
|
|
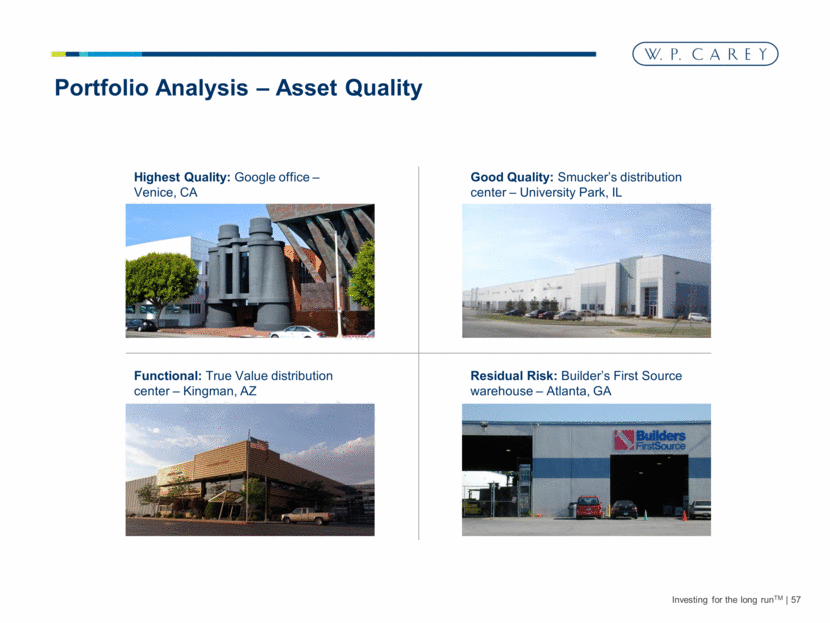
Investing for the long runTM 57 Portfolio Analysis – Asset Quality Highest Quality: Google office – Venice, CA Good Quality: Smucker’s distribution center – University Park, IL Functional: True Value distribution center – Kingman, AZ Residual Risk: Builder’s First Source warehouse – Atlanta, GA |
|
|
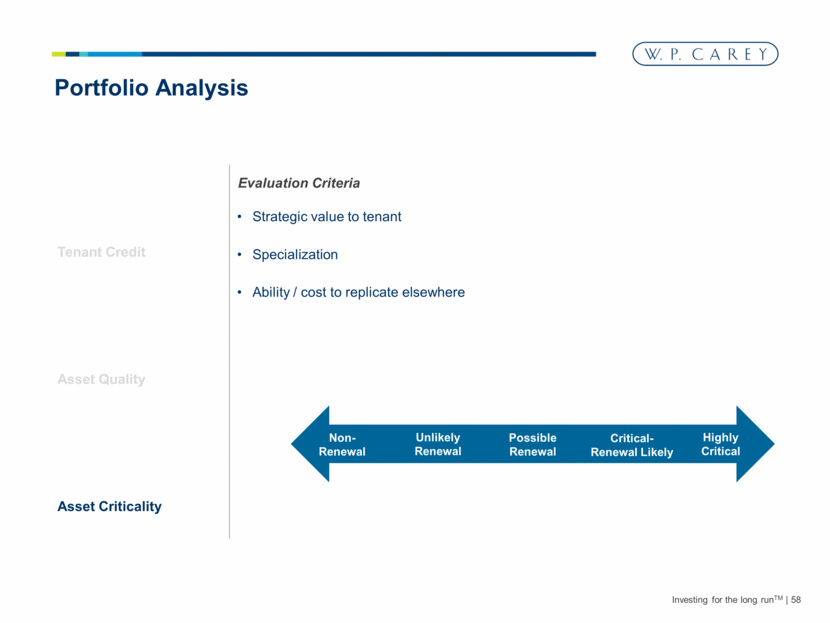
Investing for the long runTM 58 Portfolio Analysis Evaluation Criteria Strategic value to tenant Specialization Ability / cost to replicate elsewhere Non- Renewal Unlikely Renewal Possible Renewal Critical-Renewal Likely Highly Critical Tenant Credit Asset Quality Asset Criticality |
|
|
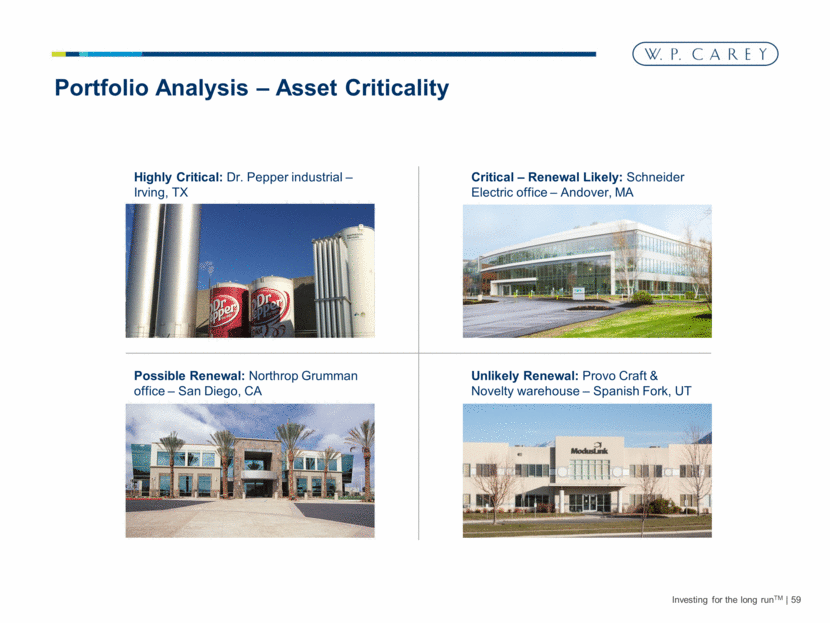
Investing for the long runTM 59 Portfolio Analysis – Asset Criticality Highly Critical: Dr. Pepper industrial – Irving, TX Dr. Pepper – need a photo Critical – Renewal Likely: Schneider Electric office – Andover, MA Possible Renewal: Northrop Grumman office – San Diego, CA Unlikely Renewal: Provo Craft & Novelty warehouse – Spanish Fork, UT |
|
|
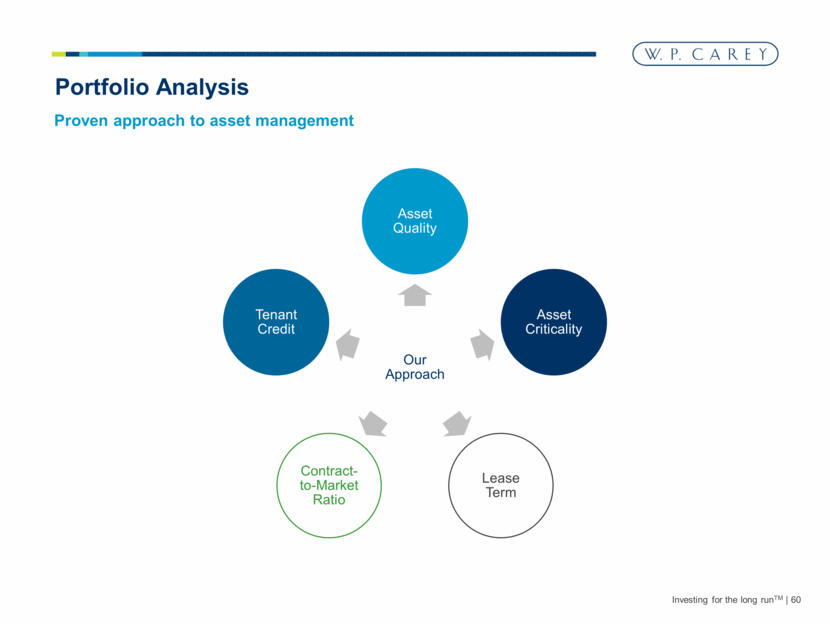
Investing for the long runTM 60 Portfolio Analysis Proven approach to asset management Our Approach Asset Quality Asset Criticality Lease Term Contract-to-Market Ratio Tenant Credit |
|
|
Investing for the long runTM 61 Asset Management Overview Portfolio Analysis Portfolio Detail Representative Outcomes Global Asset Management Platform |
|
|
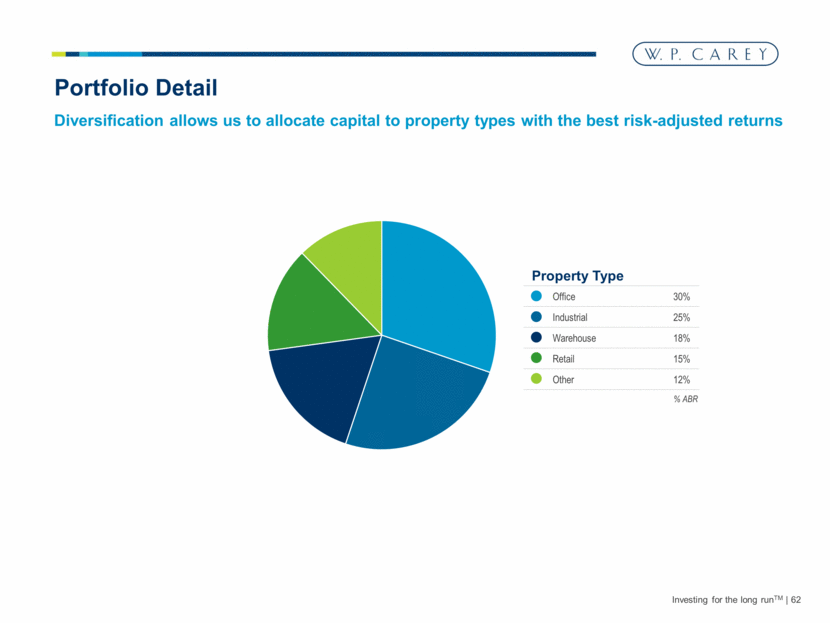
Investing for the long runTM 62 Portfolio Detail Office 30% Industrial 25% Warehouse 18% Retail 15% Other 12% % ABR Property Type Diversification allows us to allocate capital to property types with the best risk-adjusted returns |
|
|
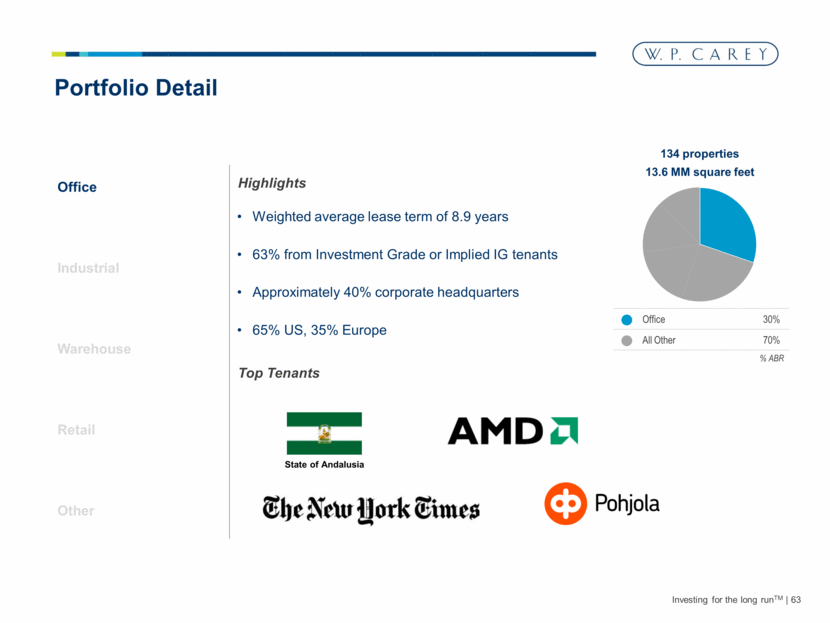
Investing for the long runTM 63 Portfolio Detail Office Industrial Warehouse Retail Other Weighted average lease term of 8.9 years 63% from Investment Grade or Implied IG tenants Approximately 40% corporate headquarters 65% US, 35% Europe Highlights Top Tenants State of Andalusia 134 properties 13.6 MM square feet Office 30% All Other 70% % ABR |
|
|
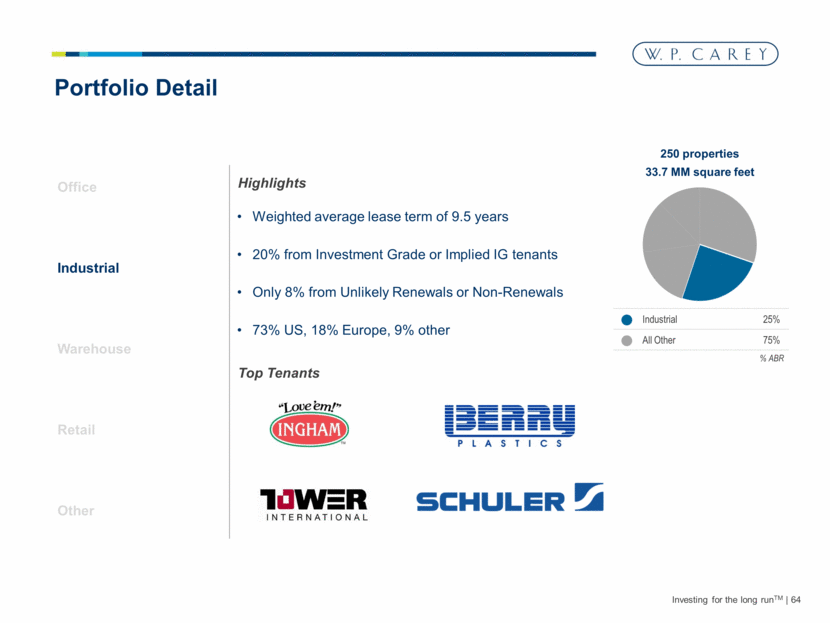
Investing for the long runTM 64 Portfolio Detail Office Industrial Warehouse Retail Other Weighted average lease term of 9.5 years 20% from Investment Grade or Implied IG tenants Only 8% from Unlikely Renewals or Non-Renewals 73% US, 18% Europe, 9% other Highlights Top Tenants 250 properties 33.7 MM square feet Industrial 25% All Other 75% % ABR |
|
|
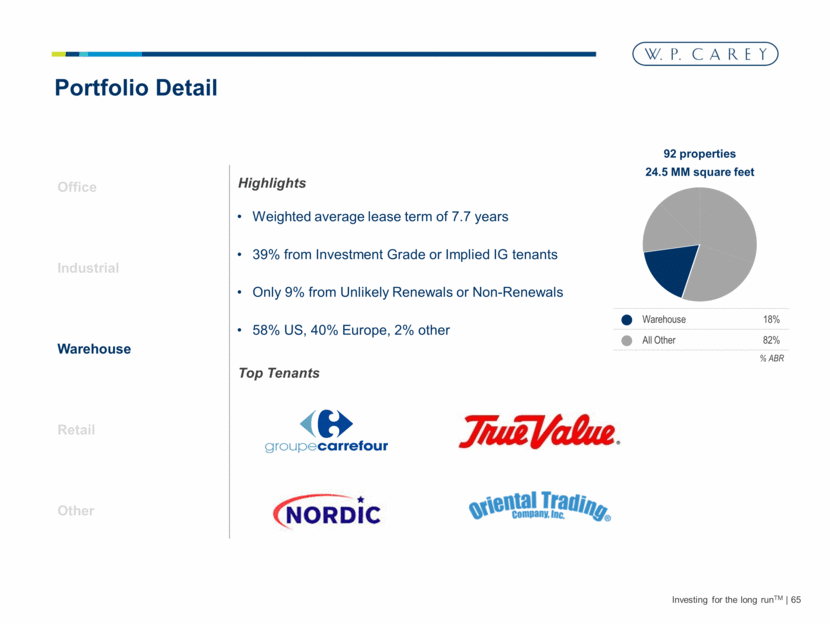
Investing for the long runTM 65 Portfolio Detail Office Industrial Warehouse Retail Other Weighted average lease term of 7.7 years 39% from Investment Grade or Implied IG tenants Only 9% from Unlikely Renewals or Non-Renewals 58% US, 40% Europe, 2% other Highlights Top Tenants 92 properties 24.5 MM square feet Warehouse 18% All Other 82% % ABR |
|
|
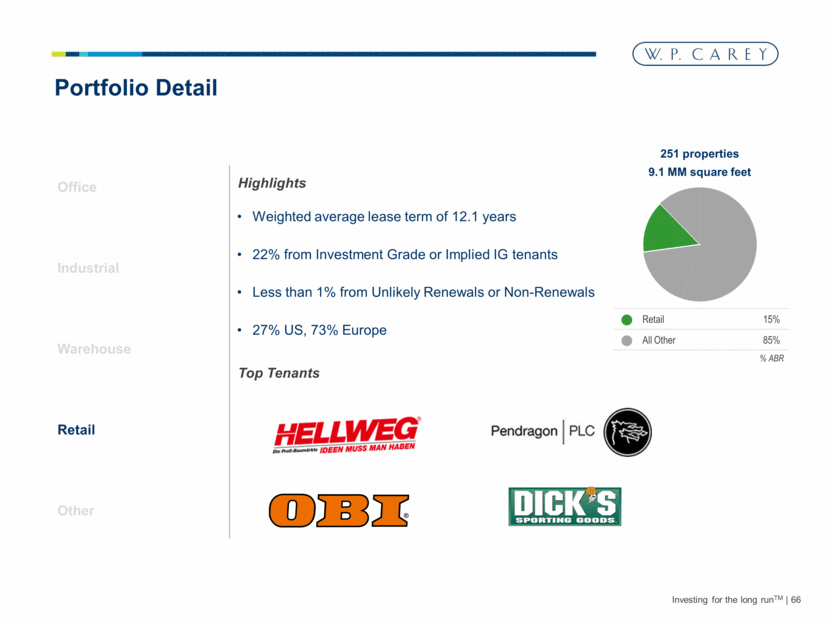
Investing for the long runTM 66 Portfolio Detail Office Industrial Warehouse Retail Other Weighted average lease term of 12.1 years 22% from Investment Grade or Implied IG tenants Less than 1% from Unlikely Renewals or Non-Renewals 27% US, 73% Europe Highlights Top Tenants 251 properties 9.1 MM square feet Retail 15% All Other 85% % ABR |
|
|
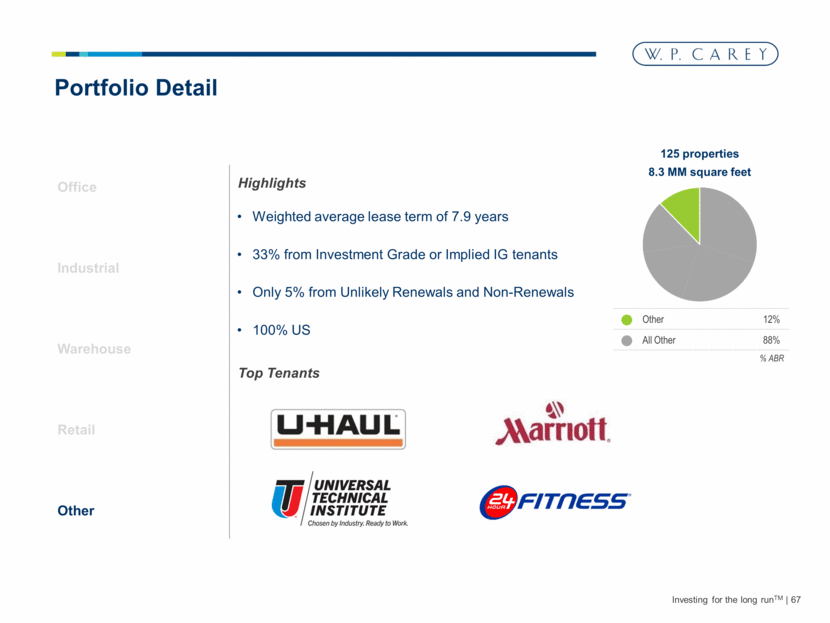
Investing for the long runTM 67 Portfolio Detail Office Industrial Warehouse Retail Other Weighted average lease term of 7.9 years 33% from Investment Grade or Implied IG tenants Only 5% from Unlikely Renewals and Non-Renewals 100% US Highlights Top Tenants 125 properties 8.3 MM square feet Other 12% All Other 88% % ABR |
|
|
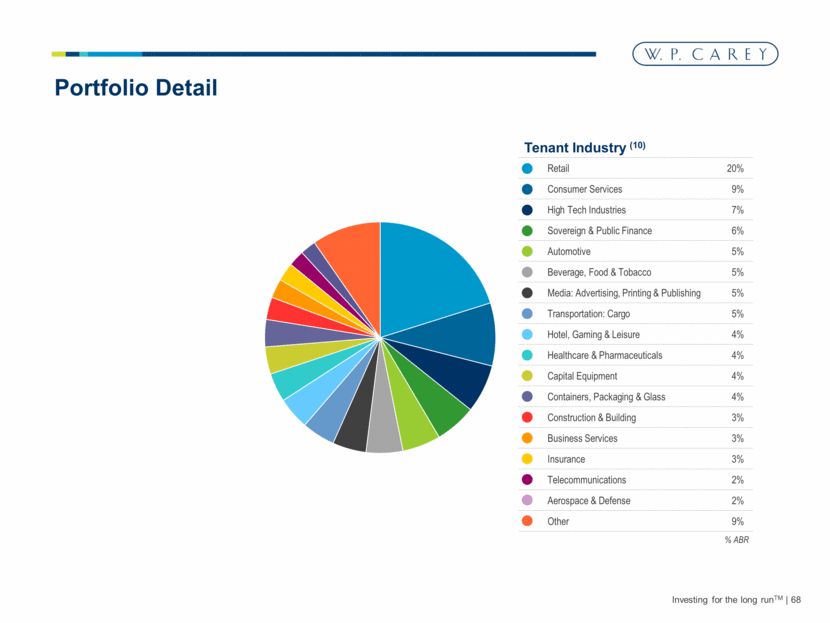
Investing for the long runTM 68 Portfolio Detail Retail 20% Consumer Services 9% High Tech Industries 7% Sovereign & Public Finance 6% Automotive 5% Beverage, Food & Tobacco 5% Media: Advertising, Printing & Publishing 5% Transportation: Cargo 5% Hotel, Gaming & Leisure 4% Healthcare & Pharmaceuticals 4% Capital Equipment 4% Containers, Packaging & Glass 4% Construction & Building 3% Business Services 3% Insurance 3% Telecommunications 2% Aerospace & Defense 2% Other 9% % ABR Tenant Industry (10) |
|
|
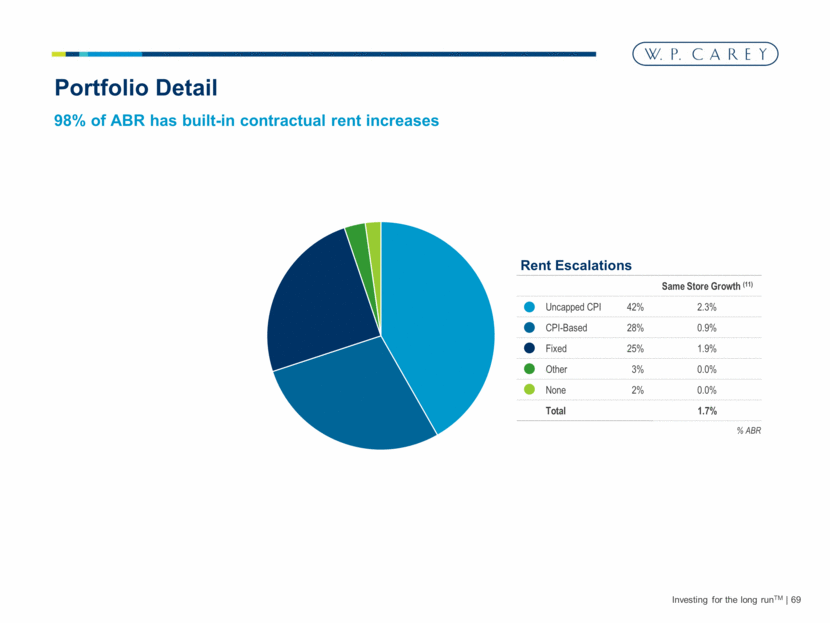
Investing for the long runTM 69 Portfolio Detail 98% of ABR has built-in contractual rent increases Same Store Growth (11) Uncapped CPI 42% 2.3% CPI-Based 28% 0.9% Fixed 25% 1.9% Other 3% 0.0% None 2% 0.0% Total 1.7% % ABR Rent Escalations |
|
|
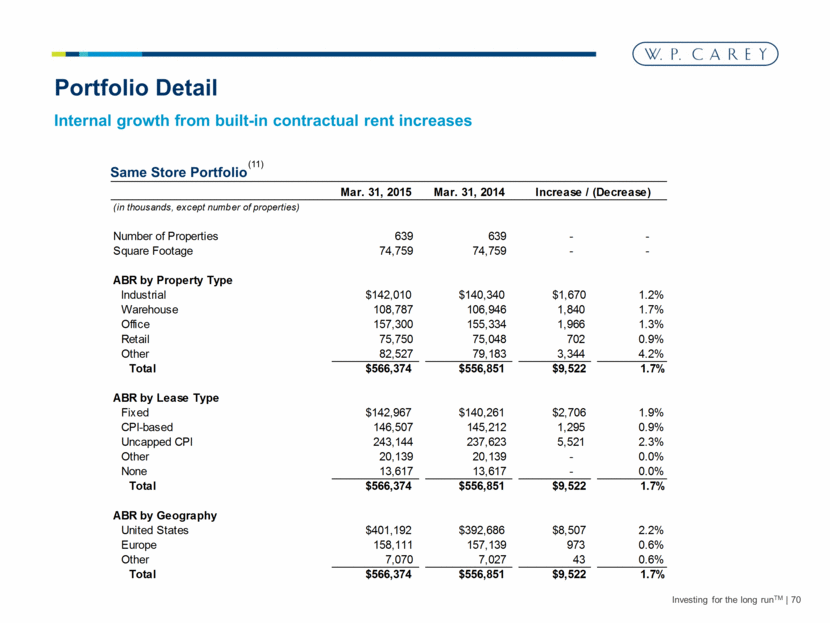
Investing for the long runTM 70 Portfolio Detail Internal growth from built-in contractual rent increases (11) Same Store Portfolio Mar. 31, 2015 Mar. 31, 2014 Increase / (Decrease) (in thousands, except number of properties) Number of Properties 639 639 - - Square Footage 74,759 74,759 - - ABR by Property Type Industrial $142,010 $140,340 $1,670 1.2% Warehouse 108,787 106,946 1,840 1.7% Office 157,300 155,334 1,966 1.3% Retail 75,750 75,048 702 0.9% Other 82,527 79,183 3,344 4.2% Total $566,374 $556,851 $9,522 1.7% ABR by Lease Type Fixed $142,967 $140,261 $2,706 1.9% CPI-based 146,507 145,212 1,295 0.9% Uncapped CPI 243,144 237,623 5,521 2.3% Other 20,139 20,139 - 0.0% None 13,617 13,617 - 0.0% Total $566,374 $556,851 $9,522 1.7% ABR by Geography United States $401,192 $392,686 $8,507 2.2% Europe 158,111 157,139 973 0.6% Other 7,070 7,027 43 0.6% Total $566,374 $556,851 $9,522 1.7% |
|
|
Investing for the long runTM 71 Asset Management Overview Portfolio Analysis Portfolio Detail Representative Outcomes Global Asset Management Platform |
|
|
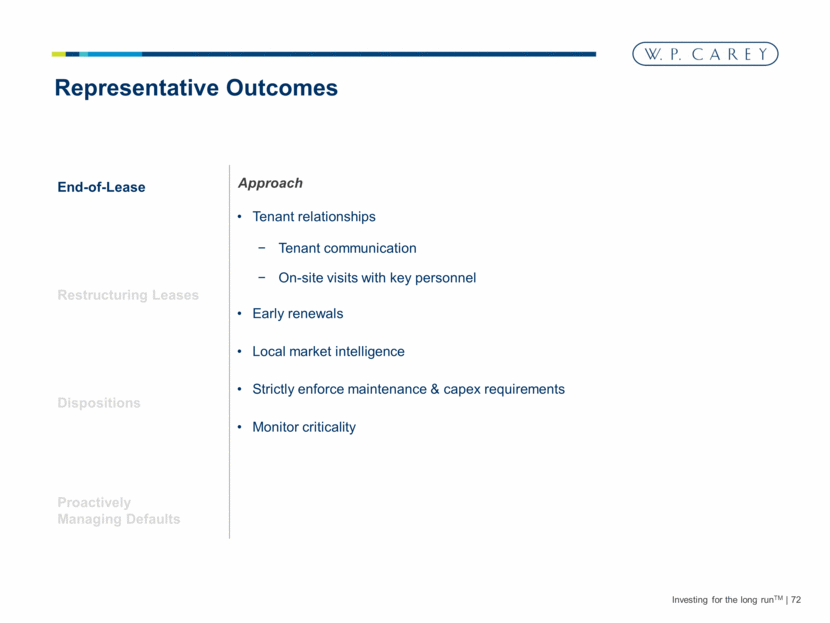
Investing for the long runTM 72 Representative Outcomes End-of-Lease Restructuring Leases Dispositions Proactively Managing Defaults Tenant relationships Tenant communication On-site visits with key personnel Early renewals Local market intelligence Strictly enforce maintenance & capex requirements Monitor criticality Approach |
|
|
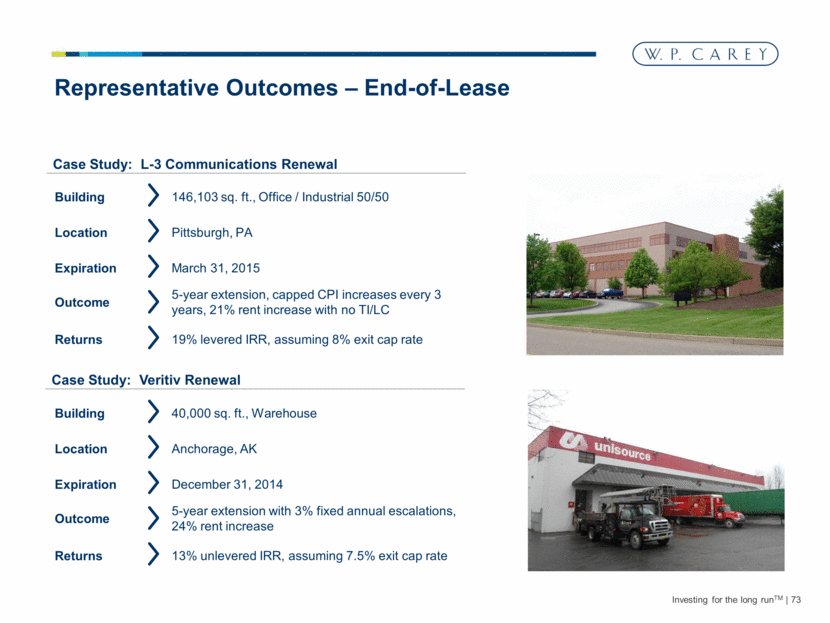
Case Study: Veritiv Renewal Case Study: L-3 Communications Renewal Investing for the long runTM 73 Representative Outcomes – End-of-Lease Building 146,103 sq. ft., Office / Industrial 50/50 Location Pittsburgh, PA Expiration March 31, 2015 Outcome 5-year extension, capped CPI increases every 3 years, 21% rent increase with no TI/LC Returns 19% levered IRR, assuming 8% exit cap rate Building 40,000 sq. ft., Warehouse Location Anchorage, AK Expiration December 31, 2014 Outcome 5-year extension with 3% fixed annual escalations, 24% rent increase Returns 13% unlevered IRR, assuming 7.5% exit cap rate |
|
|
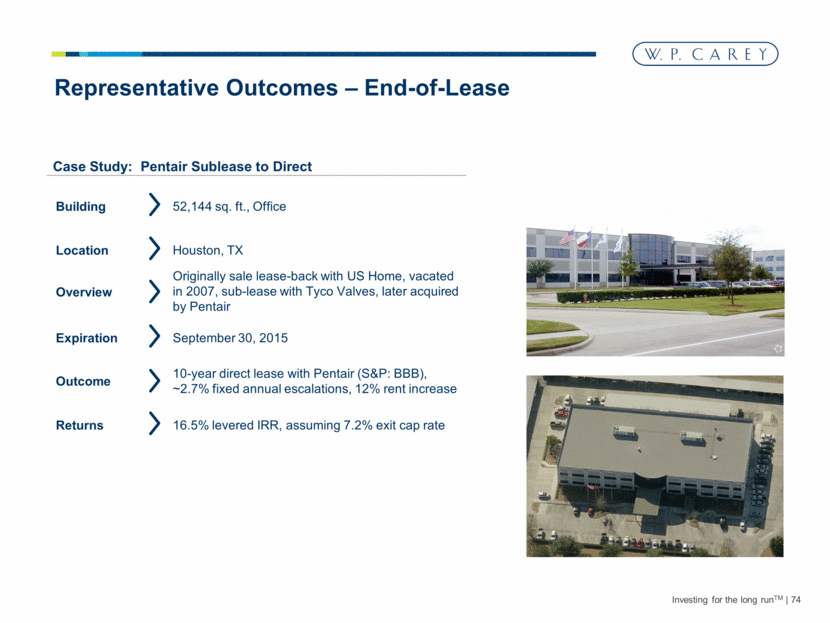
Case Study: Pentair Sublease to Direct Investing for the long runTM 74 Representative Outcomes – End-of-Lease Building 52,144 sq. ft., Office Location Houston, TX Expiration September 30, 2015 Outcome 10-year direct lease with Pentair (S&P: BBB), ~2.7% fixed annual escalations, 12% rent increase Returns 16.5% levered IRR, assuming 7.2% exit cap rate Overview Originally sale lease-back with US Home, vacated in 2007, sub-lease with Tyco Valves, later acquired by Pentair |
|
|
Investing for the long runTM 75 Representative Outcomes End-of-Lease Restructuring Leases Dispositions Proactively Managing Defaults Blend and extend Multi-property lease restructure Expansion Follow-on acquisitions Approach |
|
|
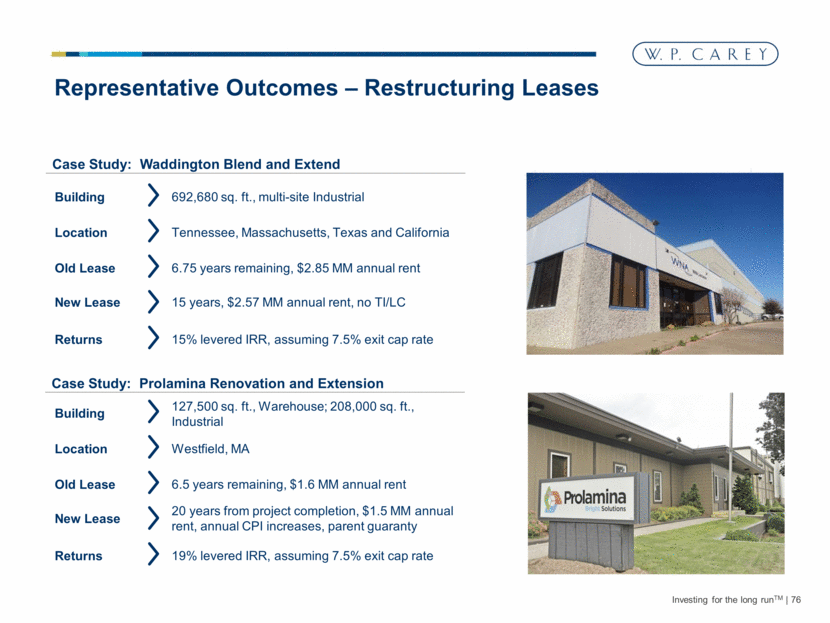
Case Study: Prolamina Renovation and Extension Case Study: Waddington Blend and Extend Investing for the long runTM 76 Representative Outcomes – Restructuring Leases Building 692,680 sq. ft., multi-site Industrial Location Tennessee, Massachusetts, Texas and California Old Lease 6.75 years remaining, $2.85 MM annual rent New Lease 15 years, $2.57 MM annual rent, no TI/LC Returns 15% levered IRR, assuming 7.5% exit cap rate Building 127,500 sq. ft., Warehouse; 208,000 sq. ft., Industrial Location Westfield, MA Old Lease 6.5 years remaining, $1.6 MM annual rent New Lease 20 years from project completion, $1.5 MM annual rent, annual CPI increases, parent guaranty Returns 19% levered IRR, assuming 7.5% exit cap rate |
|
|
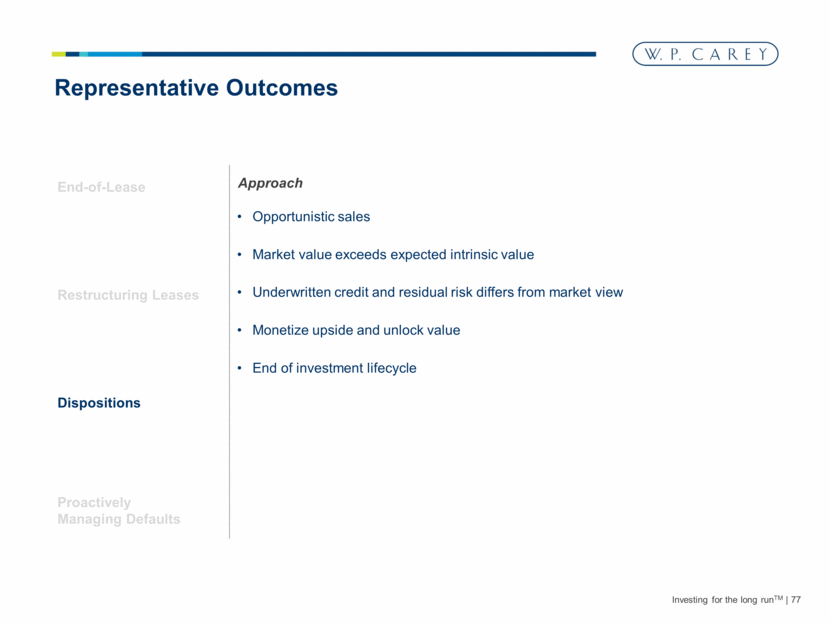
Investing for the long runTM 77 Representative Outcomes End-of-Lease Restructuring Leases Dispositions Proactively Managing Defaults Opportunistic sales Market value exceeds expected intrinsic value Underwritten credit and residual risk differs from market view Monetize upside and unlock value End of investment lifecycle Approach |
|
|
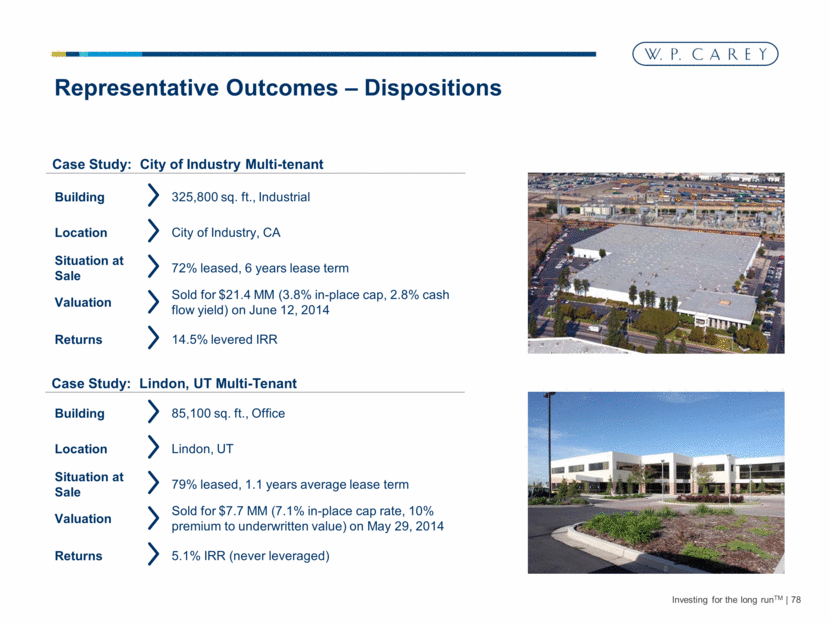
Case Study: Lindon, UT Multi-Tenant Case Study: City of Industry Multi-tenant Investing for the long runTM 78 Representative Outcomes – Dispositions Building 325,800 sq. ft., Industrial Location City of Industry, CA Situation at Sale 72% leased, 6 years lease term Valuation Sold for $21.4 MM (3.8% in-place cap, 2.8% cash flow yield) on June 12, 2014 Returns 14.5% levered IRR Building 85,100 sq. ft., Office Location Lindon, UT Situation at Sale 79% leased, 1.1 years average lease term Valuation Sold for $7.7 MM (7.1% in-place cap rate, 10% premium to underwritten value) on May 29, 2014 Returns 5.1% IRR (never leveraged) |
|
|
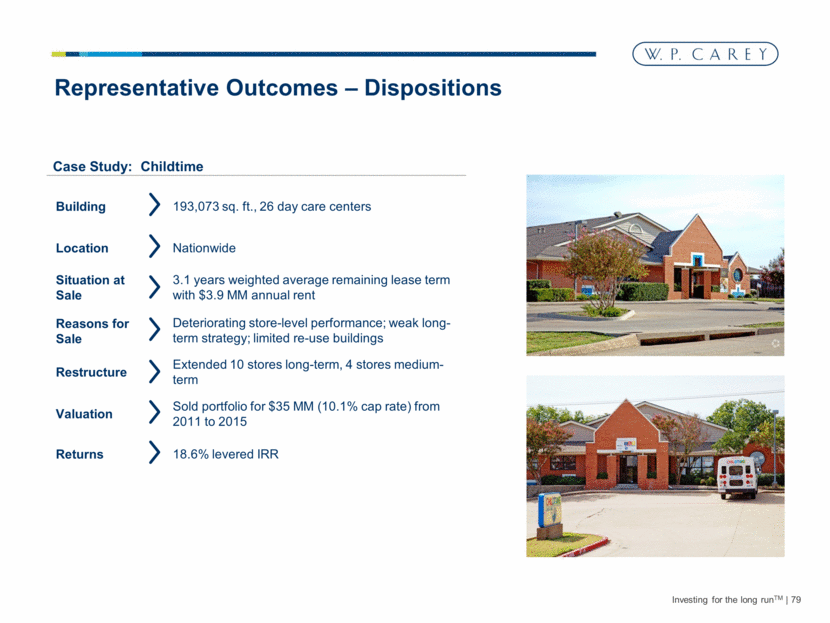
Investing for the long runTM 79 Representative Outcomes – Dispositions Case Study: Childtime Building 193,073 sq. ft., 26 day care centers Location Nationwide Reasons for Sale Deteriorating store-level performance; weak long-term strategy; limited re-use buildings Restructure Extended 10 stores long-term, 4 stores medium-term Valuation Sold portfolio for $35 MM (10.1% cap rate) from 2011 to 2015 Situation at Sale 3.1 years weighted average remaining lease term with $3.9 MM annual rent Returns 18.6% levered IRR |
|
|
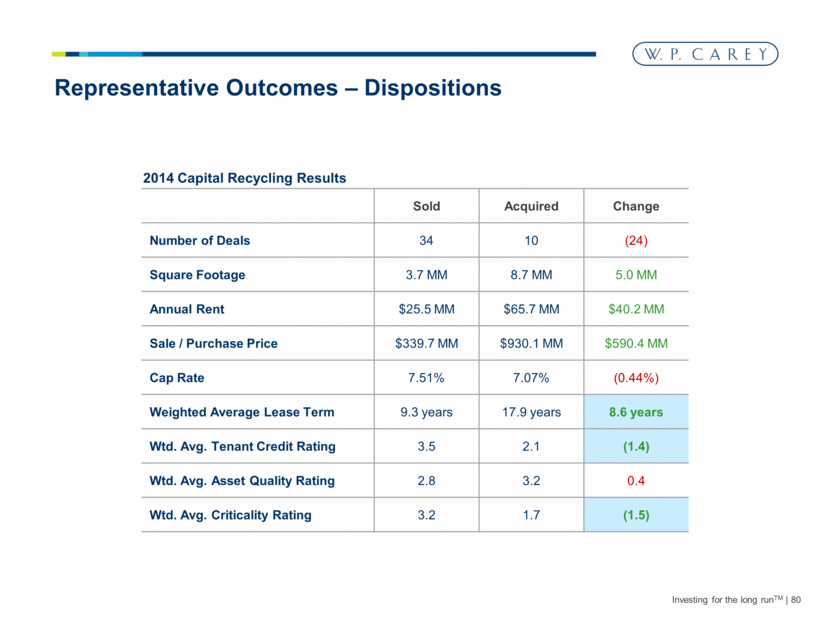
Investing for the long runTM 80 Representative Outcomes – Dispositions 2014 Capital Recycling Results Sold Acquired Change Number of Deals 34 10 (24) Square Footage 3.7 MM 8.7 MM 5.0 MM Annual Rent $25.5 MM $65.7 MM $40.2 MM Sale / Purchase Price $339.7 MM $930.1 MM $590.4 MM Cap Rate 7.51% 7.07% (0.44%) Weighted Average Lease Term 9.3 years 17.9 years 8.6 years Wtd. Avg. Tenant Credit Rating 3.5 2.1 (1.4) Wtd. Avg. Asset Quality Rating 2.8 3.2 0.4 Wtd. Avg. Criticality Rating 3.2 1.7 (1.5) |
|
|
Investing for the long runTM 81 Representative Outcomes End-of-Lease Restructuring Leases Dispositions Proactively Managing Defaults Early visibility Aggressively provide alternatives to default Creative workouts and flexibility Sophisticated bankruptcy expertise Approach |
|
|
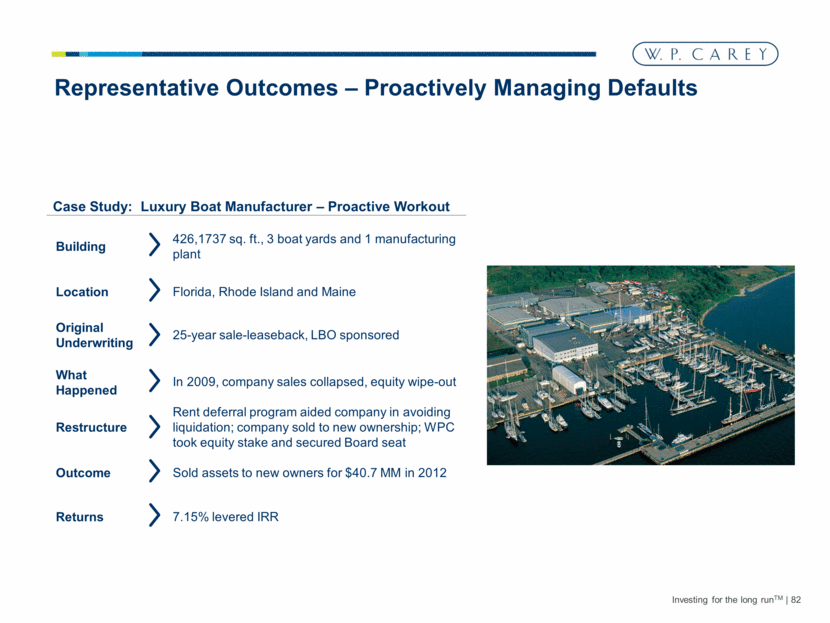
Investing for the long runTM 82 Representative Outcomes – Proactively Managing Defaults Case Study: Luxury Boat Manufacturer – Proactive Workout Building 426,1737 sq. ft., 3 boat yards and 1 manufacturing plant Location Florida, Rhode Island and Maine What Happened In 2009, company sales collapsed, equity wipe-out Restructure Rent deferral program aided company in avoiding liquidation; company sold to new ownership; WPC took equity stake and secured Board seat Outcome Sold assets to new owners for $40.7 MM in 2012 Original Underwriting 25-year sale-leaseback, LBO sponsored Returns 7.15% levered IRR |
|
|
IV. European Operations |
|
|
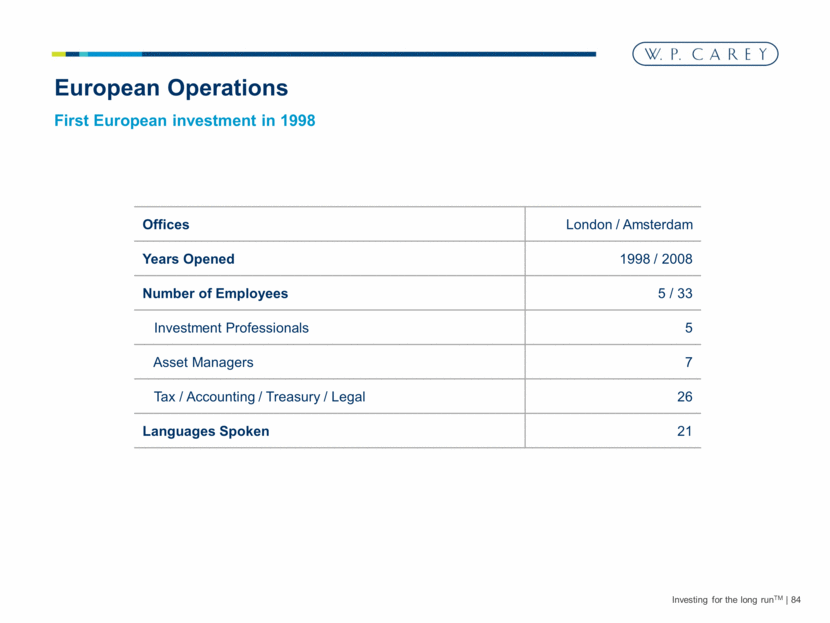
Investing for the long runTM 84 European Operations Offices London / Amsterdam Years Opened 1998 / 2008 Number of Employees 5 / 33 Investment Professionals 5 Asset Managers 7 Tax / Accounting / Treasury / Legal 26 Languages Spoken 21 First European investment in 1998 |
|
|
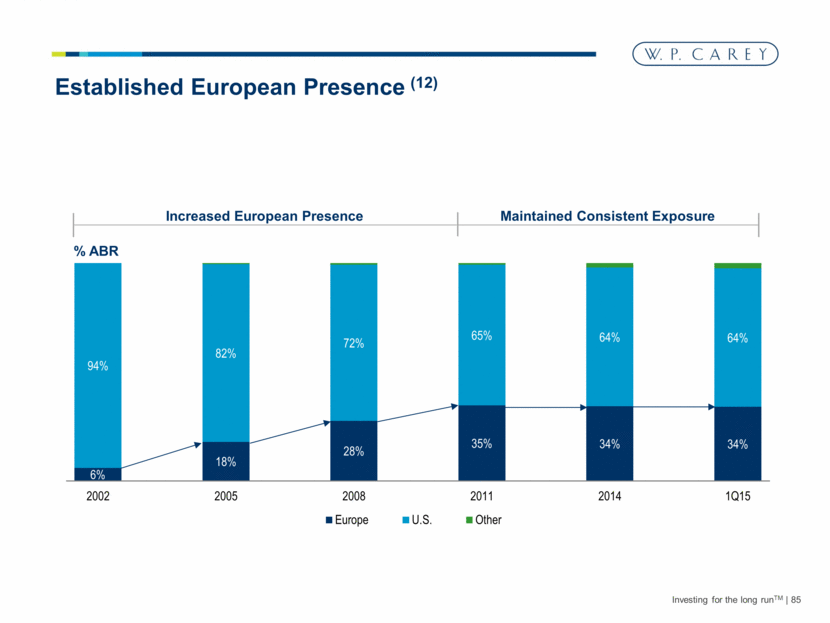
Increased European Presence Investing for the long runTM 85 Established European Presence (12) Maintained Consistent Exposure % ABR 6% 18% 28% 35% 34% 34% 94% 82% 72% 65% 64% 64% 2002 2005 2008 2011 2014 1Q15 Europe U.S. Other |
|
|
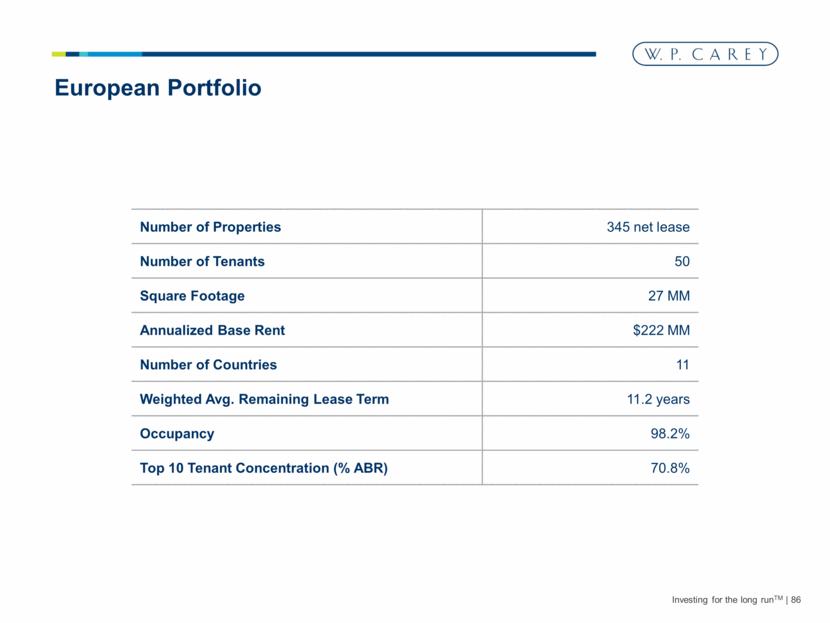
Investing for the long runTM 86 European Portfolio Number of Properties 345 net lease Number of Tenants 50 Square Footage 27 MM Annualized Base Rent $222 MM Number of Countries 11 Weighted Avg. Remaining Lease Term 11.2 years Occupancy 98.2% Top 10 Tenant Concentration (% ABR) 70.8% |
|
|
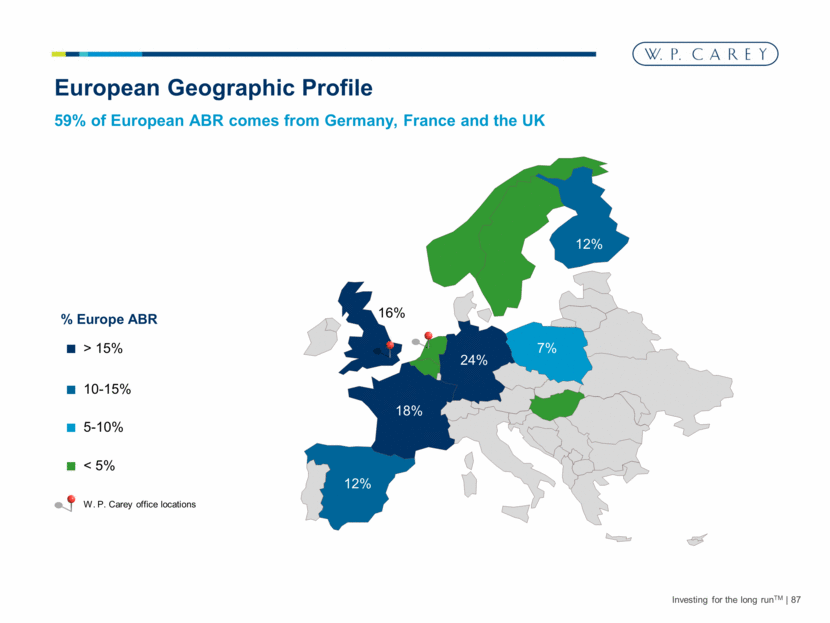
Investing for the long runTM 87 European Geographic Profile 59% of European ABR comes from Germany, France and the UK > 15% 10-15% 5-10% % Europe ABR W. P. Carey office locations < 5% 18% 24% 16% 12% 12% 7% |
|
|
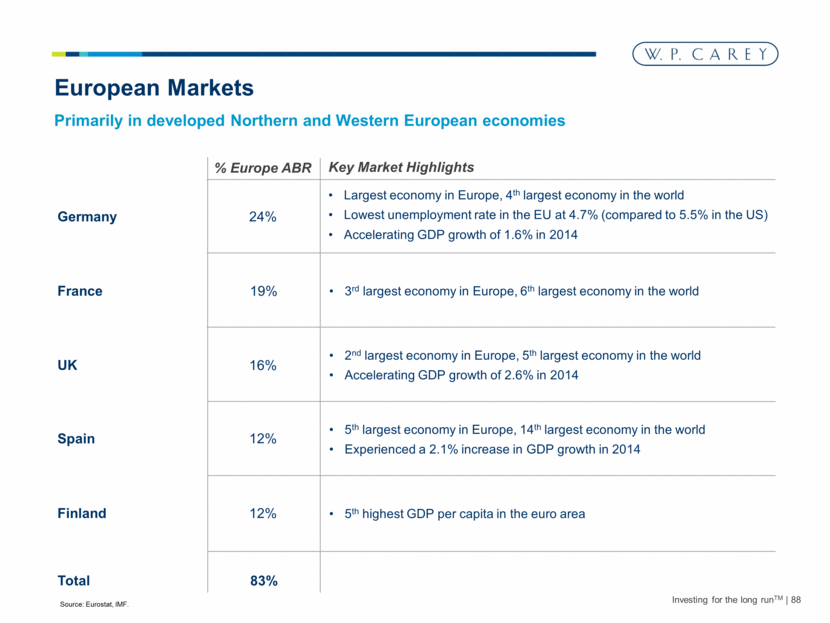
Investing for the long runTM 88 European Markets Germany France UK Spain Finland % Europe ABR Key Market Highlights 24% 12% 19% 16% 12% Largest economy in Europe, 4th largest economy in the world Lowest unemployment rate in the EU at 4.7% (compared to 5.5% in the US) Accelerating GDP growth of 1.6% in 2014 3rd largest economy in Europe, 6th largest economy in the world 2nd largest economy in Europe, 5th largest economy in the world Accelerating GDP growth of 2.6% in 2014 5th largest economy in Europe, 14th largest economy in the world Experienced a 2.1% increase in GDP growth in 2014 5th highest GDP per capita in the euro area 83% Total Primarily in developed Northern and Western European economies Source: Eurostat, IMF. |
|
|
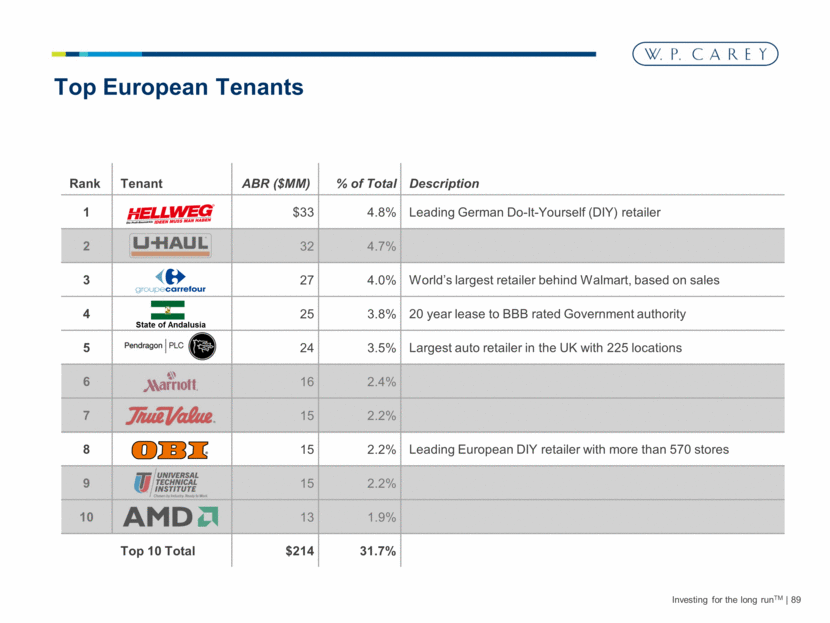
Rank Tenant ABR ($MM) % of Total Description 1 $33 4.8% Leading German Do-It-Yourself (DIY) retailer 2 32 4.7% 3 27 4.0% World’s largest retailer behind Walmart, based on sales 4 25 3.8% 20 year lease to BBB rated Government authority 5 24 3.5% Largest auto retailer in the UK with 225 locations 6 16 2.4% 7 15 2.2% 8 15 2.2% Leading European DIY retailer with more than 570 stores 9 15 2.2% 10 13 1.9% Top 10 Total $214 31.7% State of Andalusia Investing for the long runTM 89 Top European Tenants |
|
|
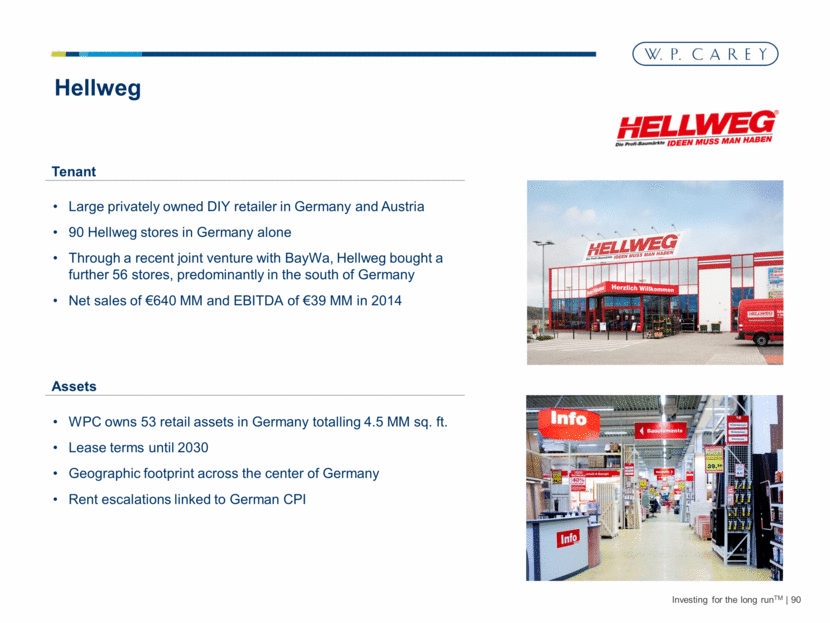
Assets Tenant Investing for the long runTM 90 Hellweg Large privately owned DIY retailer in Germany and Austria 90 Hellweg stores in Germany alone Through a recent joint venture with BayWa, Hellweg bought a further 56 stores, predominantly in the south of Germany Net sales of €640 MM and EBITDA of €39 MM in 2014 WPC owns 53 retail assets in Germany totalling 4.5 MM sq. ft. Lease terms until 2030 Geographic footprint across the center of Germany Rent escalations linked to German CPI |
|
|
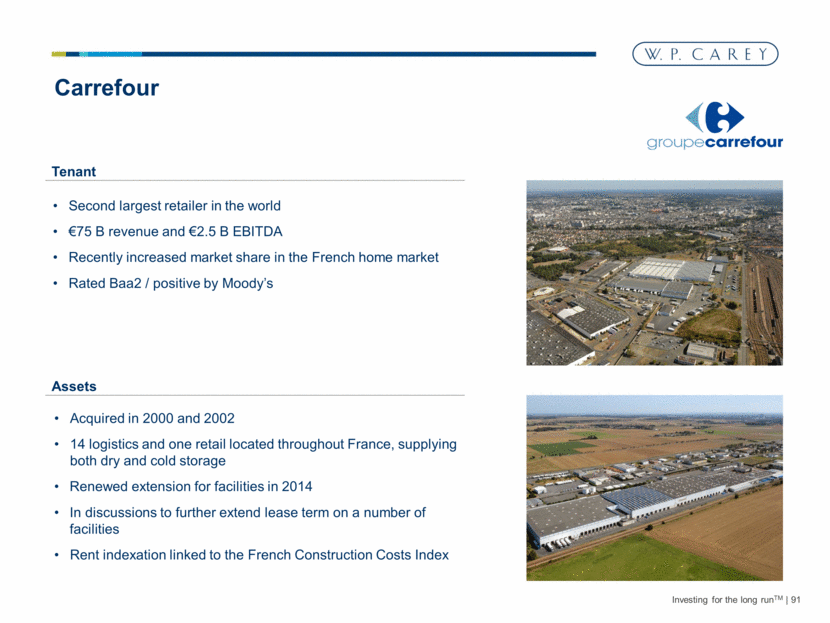
Investing for the long runTM 91 Carrefour Second largest retailer in the world €75 B revenue and €2.5 B EBITDA Recently increased market share in the French home market Rated Baa2 / positive by Moody’s Acquired in 2000 and 2002 14 logistics and one retail located throughout France, supplying both dry and cold storage Renewed extension for facilities in 2014 In discussions to further extend lease term on a number of facilities Rent indexation linked to the French Construction Costs Index Assets Tenant |
|
|
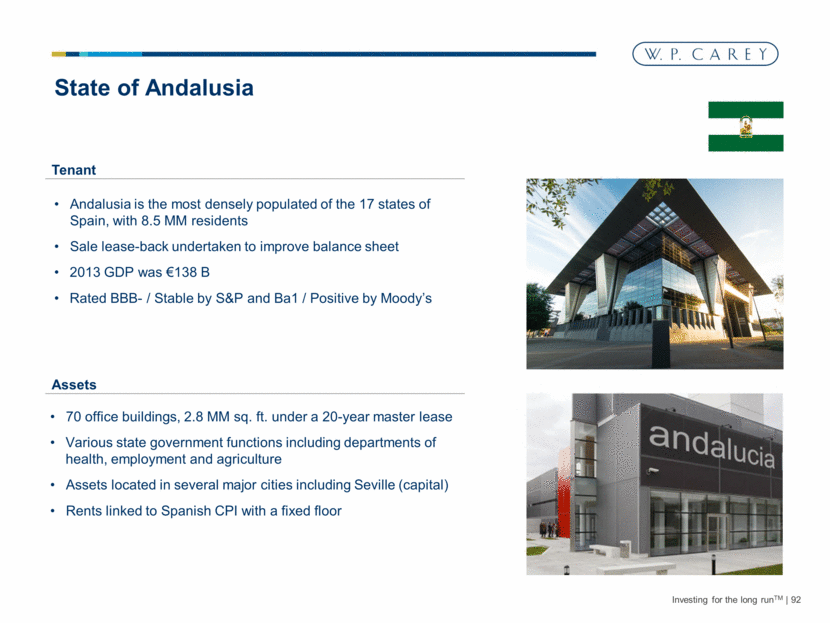
Investing for the long runTM 92 State of Andalusia Andalusia is the most densely populated of the 17 states of Spain, with 8.5 MM residents Sale lease-back undertaken to improve balance sheet 2013 GDP was €138 B Rated BBB- / Stable by S&P and Ba1 / Positive by Moody’s 70 office buildings, 2.8 MM sq. ft. under a 20-year master lease Various state government functions including departments of health, employment and agriculture Assets located in several major cities including Seville (capital) Rents linked to Spanish CPI with a fixed floor Assets Tenant |
|
|
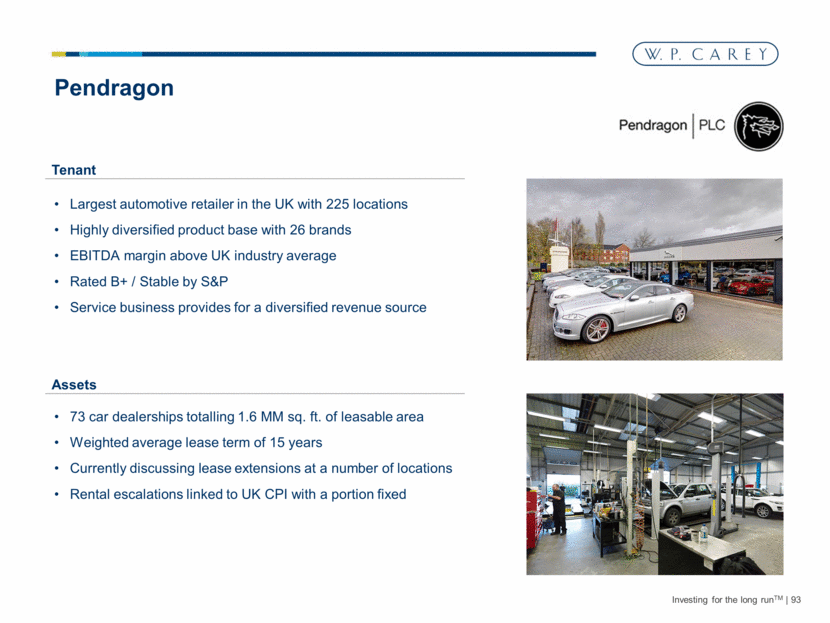
Investing for the long runTM 93 Pendragon Largest automotive retailer in the UK with 225 locations Highly diversified product base with 26 brands EBITDA margin above UK industry average Rated B+ / Stable by S&P Service business provides for a diversified revenue source 73 car dealerships totalling 1.6 MM sq. ft. of leasable area Weighted average lease term of 15 years Currently discussing lease extensions at a number of locations Rental escalations linked to UK CPI with a portion fixed Assets Tenant |
|
|
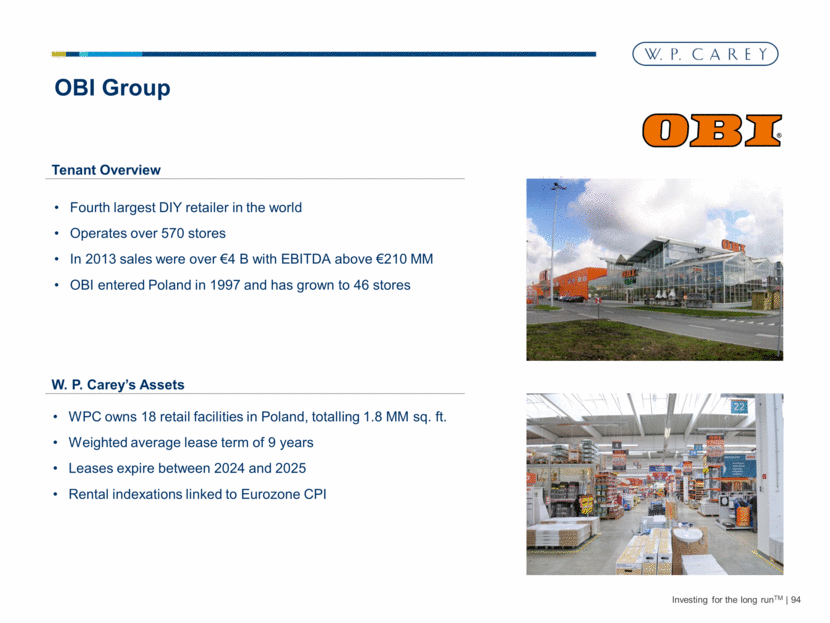
Investing for the long runTM 94 OBI Group Fourth largest DIY retailer in the world Operates over 570 stores In 2013 sales were over €4 B with EBITDA above €210 MM OBI entered Poland in 1997 and has grown to 46 stores WPC owns 18 retail facilities in Poland, totalling 1.8 MM sq. ft. Weighted average lease term of 9 years Leases expire between 2024 and 2025 Rental indexations linked to Eurozone CPI W. P. Carey’s Assets Tenant Overview |
|
|
Break |
|
|
V. Investment Management |
|
|
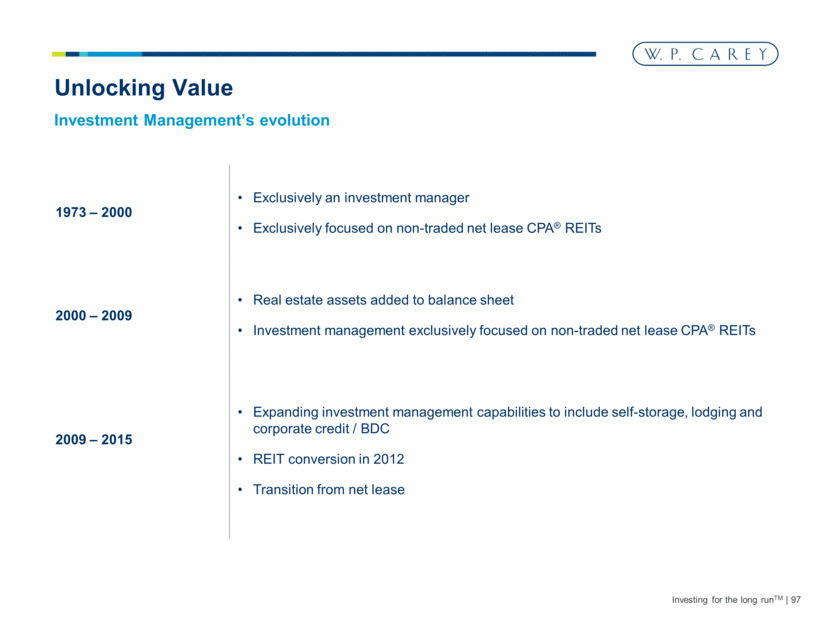
Investing for the long runTM 97 Exclusively an investment manager Exclusively focused on non-traded net lease CPA® REITs Unlocking Value 1973 – 2000 2000 – 2009 2009 – 2015 Investment Management’s evolution Real estate assets added to balance sheet Investment management exclusively focused on non-traded net lease CPA® REITs Expanding investment management capabilities to include self-storage, lodging and corporate credit / BDC REIT conversion in 2012 Transition from net lease |
|
|
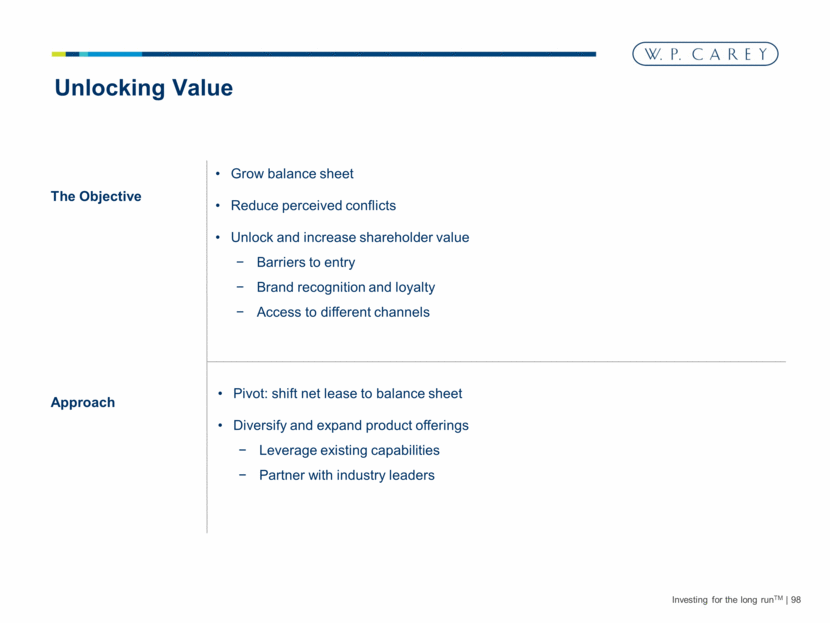
Investing for the long runTM 98 The Objective Approach Grow balance sheet Reduce perceived conflicts Unlock and increase shareholder value Barriers to entry Brand recognition and loyalty Access to different channels Pivot: shift net lease to balance sheet Diversify and expand product offerings Leverage existing capabilities Partner with industry leaders Unlocking Value |
|
|
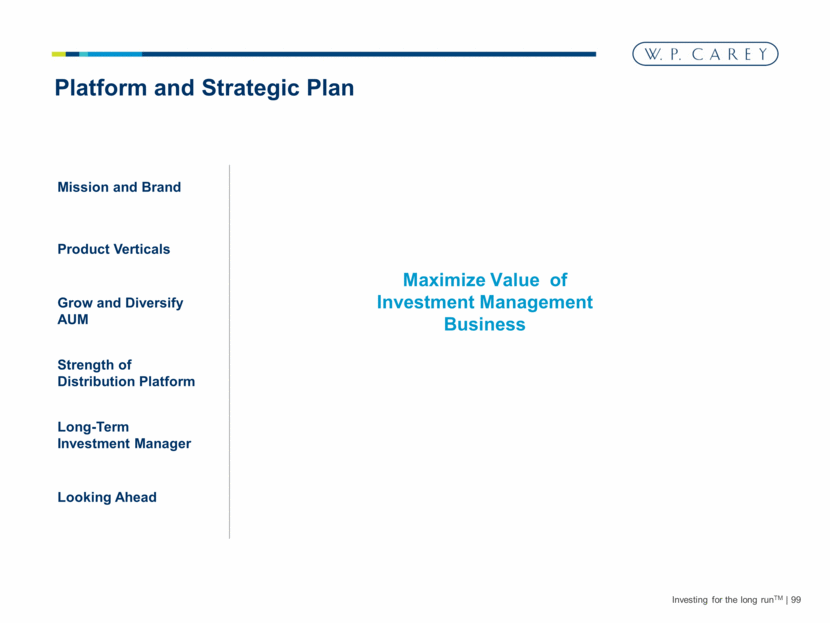
Investing for the long runTM 99 Product Verticals Grow and Diversify AUM Strength of Distribution Platform Maximize Value of Investment Management Business Long-Term Investment Manager Looking Ahead Platform and Strategic Plan Mission and Brand |
|
|
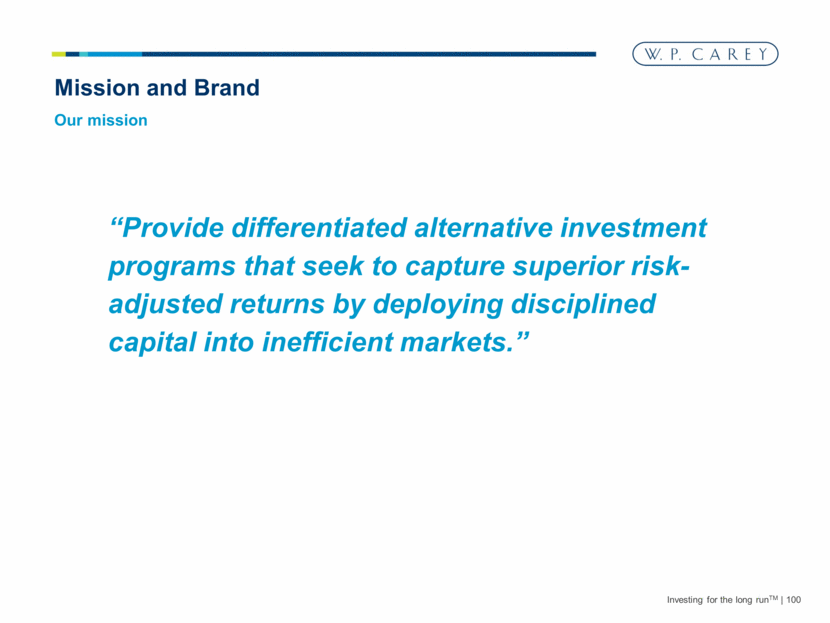
Investing for the long runTM 100 “Provide differentiated alternative investment programs that seek to capture superior risk-adjusted returns by deploying disciplined capital into inefficient markets.” Mission and Brand Our mission |
|
|
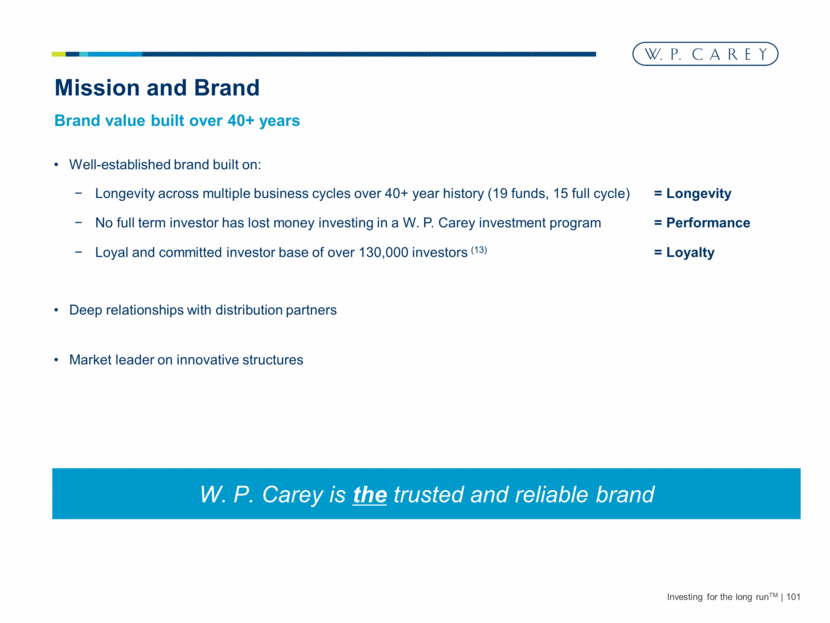
Investing for the long runTM 101 Mission and Brand Brand value built over 40+ years Well-established brand built on: Longevity across multiple business cycles over 40+ year history (19 funds, 15 full cycle) = Longevity No full term investor has lost money investing in a W. P. Carey investment program = Performance Loyal and committed investor base of over 130,000 investors (13) = Loyalty Deep relationships with distribution partners Market leader on innovative structures W. P. Carey is the trusted and reliable brand |
|
|
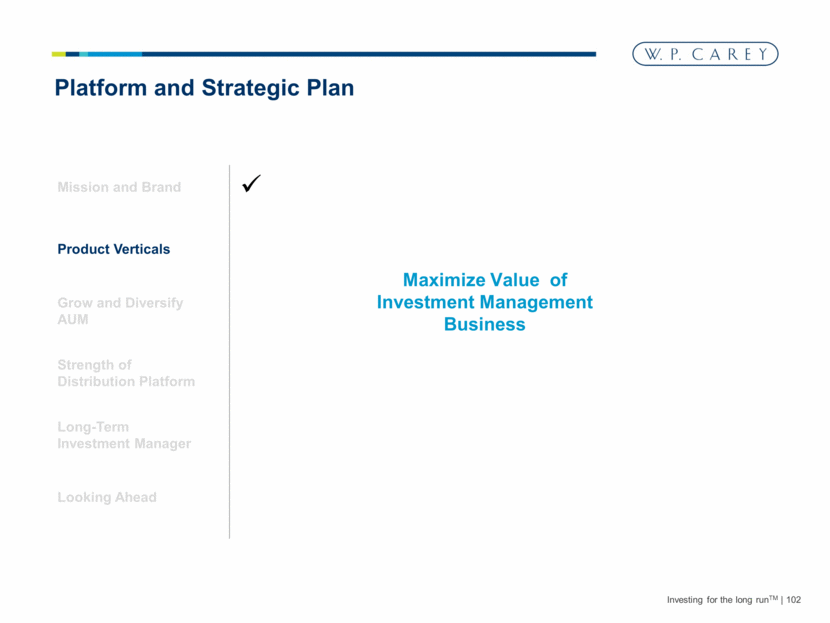
Investing for the long runTM 102 Platform and Strategic Plan Mission and Brand Product Verticals Grow and Diversify AUM Strength of Distribution Platform Long-Term Investment Manager Looking Ahead Maximize Value of Investment Management Business |
|
|
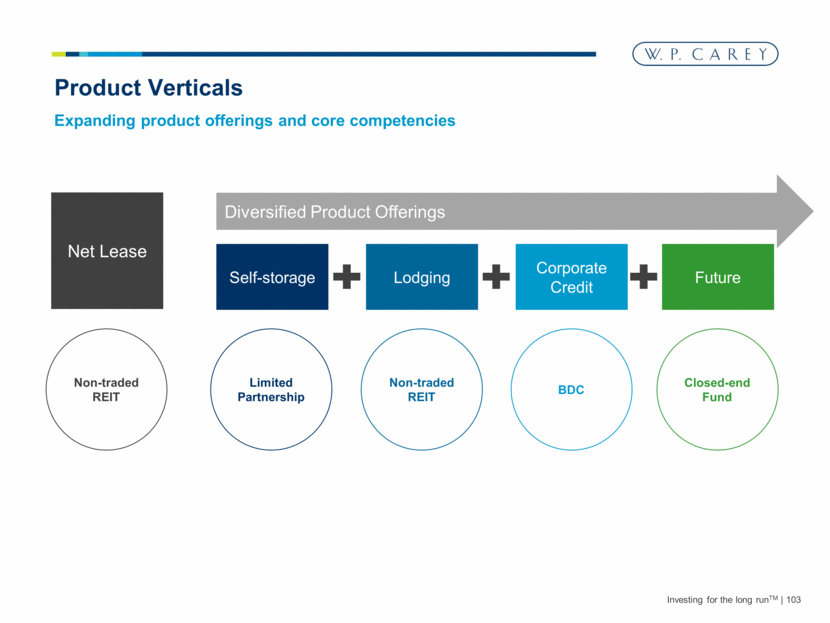
Investing for the long runTM 103 Product Verticals Expanding product offerings and core competencies Net Lease Diversified Product Offerings Self-storage Lodging Corporate Credit Future Limited Partnership BDC Non-traded REIT Closed-end Fund Non-traded REIT |
|
|
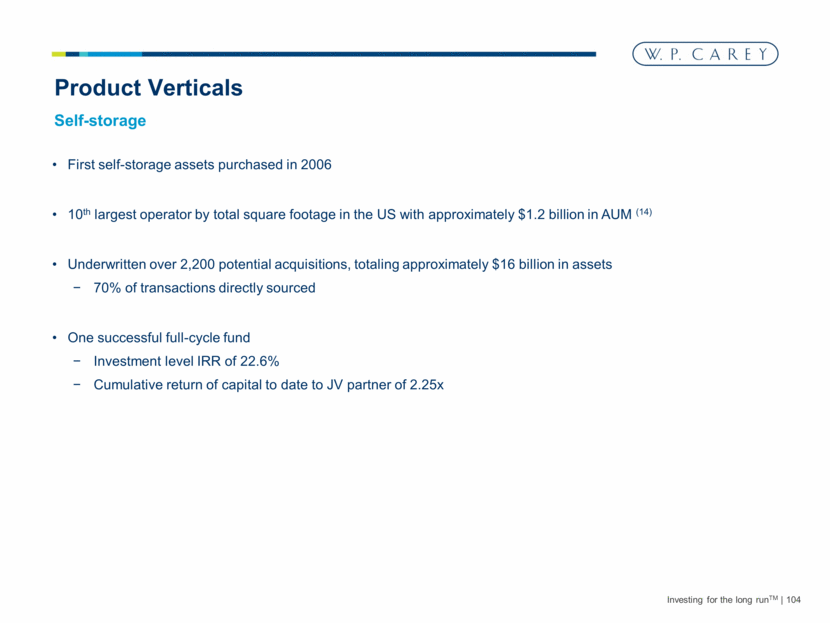
Investing for the long runTM 104 First self-storage assets purchased in 2006 10th largest operator by total square footage in the US with approximately $1.2 billion in AUM (14) Underwritten over 2,200 potential acquisitions, totaling approximately $16 billion in assets 70% of transactions directly sourced One successful full-cycle fund Investment level IRR of 22.6% Cumulative return of capital to date to JV partner of 2.25x Product Verticals Self-storage |
|
|
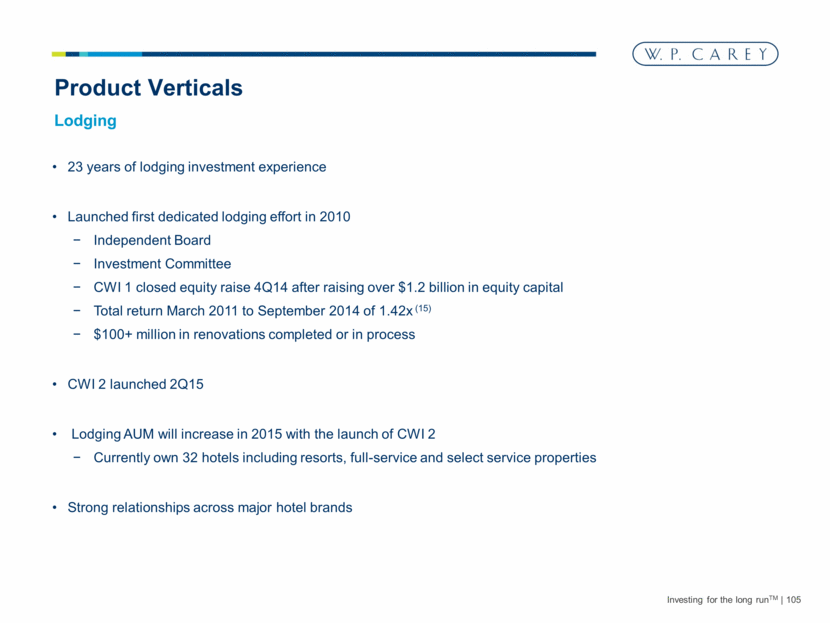
Investing for the long runTM 105 23 years of lodging investment experience Launched first dedicated lodging effort in 2010 Independent Board Investment Committee CWI 1 closed equity raise 4Q14 after raising over $1.2 billion in equity capital Total return March 2011 to September 2014 of 1.42x (15) $100+ million in renovations completed or in process CWI 2 launched 2Q15 Lodging AUM will increase in 2015 with the launch of CWI 2 Currently own 32 hotels including resorts, full-service and select service properties Strong relationships across major hotel brands Product Verticals Lodging |
|
|
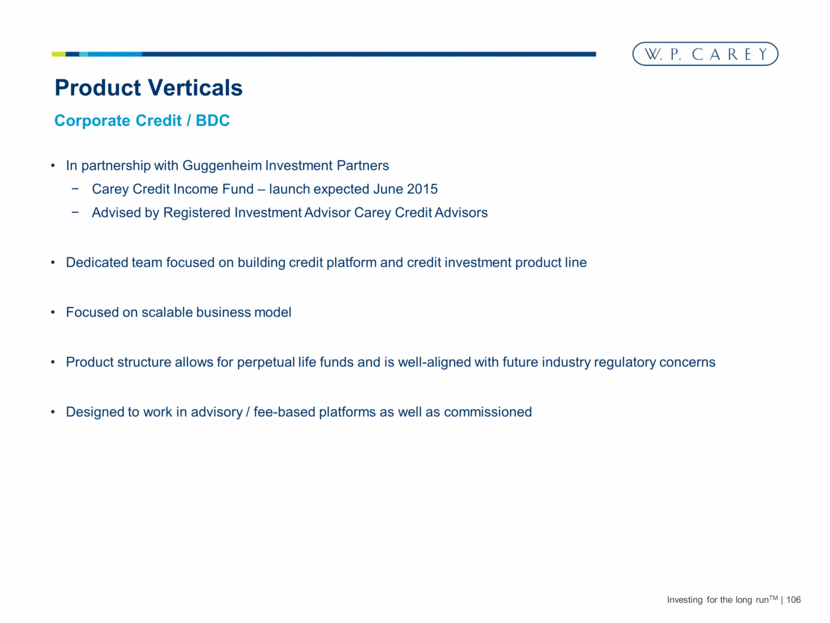
Investing for the long runTM 106 In partnership with Guggenheim Investment Partners Carey Credit Income Fund – launch expected June 2015 Advised by Registered Investment Advisor Carey Credit Advisors Dedicated team focused on building credit platform and credit investment product line Focused on scalable business model Product structure allows for perpetual life funds and is well-aligned with future industry regulatory concerns Designed to work in advisory / fee-based platforms as well as commissioned Product Verticals Corporate Credit / BDC |
|
|
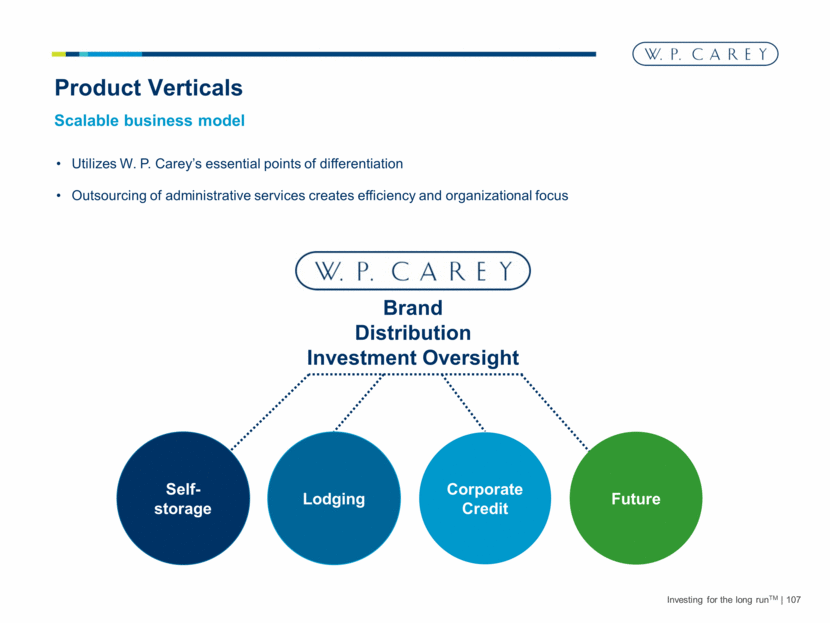
Investing for the long runTM 107 Utilizes W. P. Carey’s essential points of differentiation Outsourcing of administrative services creates efficiency and organizational focus Product Verticals Brand Distribution Investment Oversight Self-storage Scalable business model Corporate Credit Lodging Future |
|
|
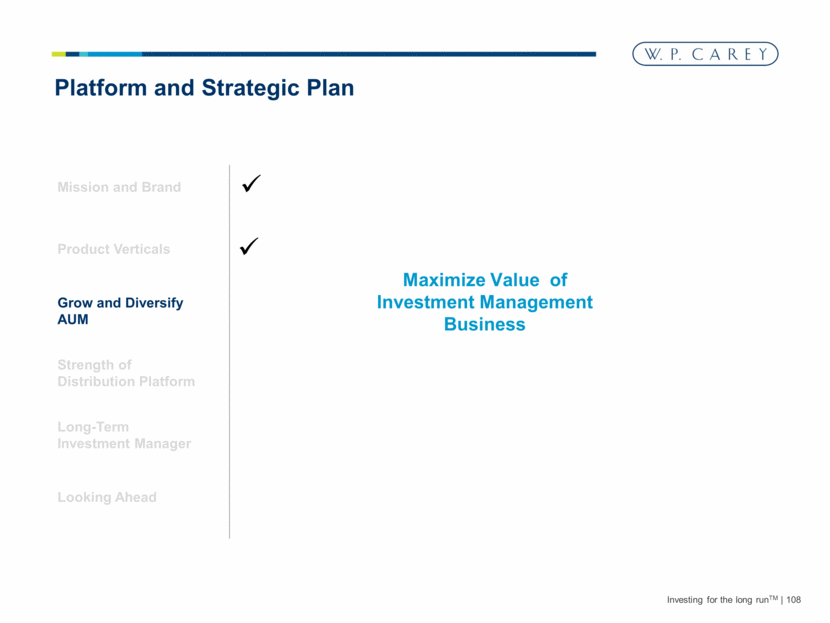
Investing for the long runTM 108 Product Verticals Grow and Diversify AUM Strength of Distribution Platform Long-Term Investment Manager Looking Ahead Platform and Strategic Plan Maximize Value of Investment Management Business Mission and Brand |
|
|
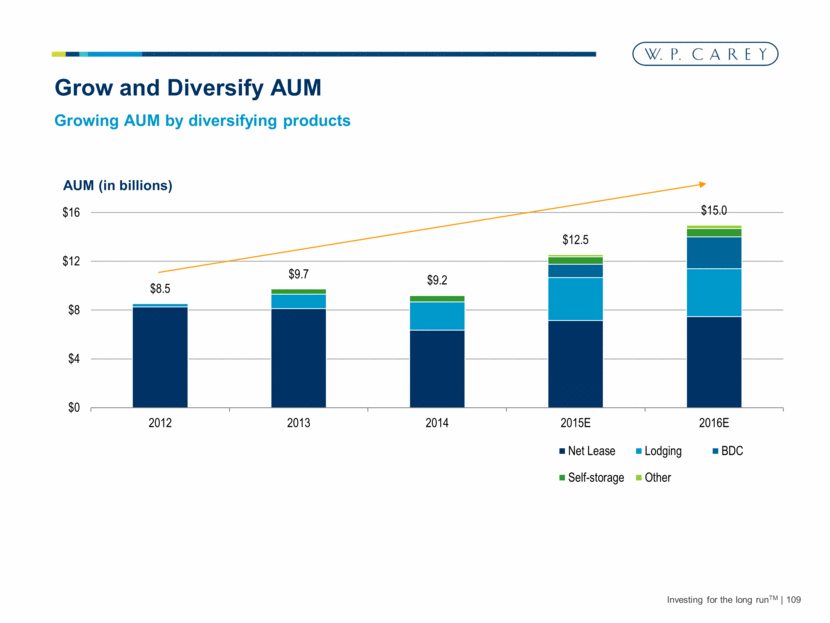
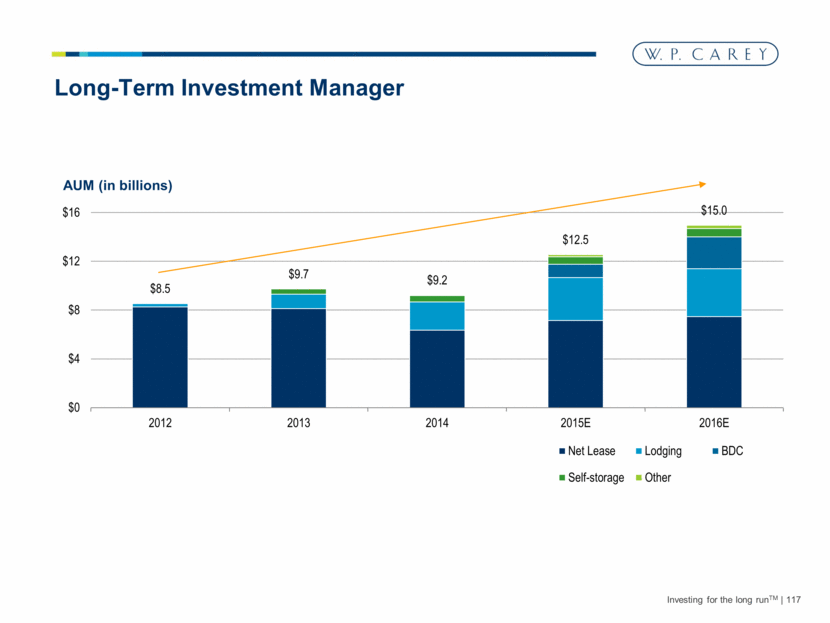
Investing for the long runTM 109 Grow and Diversify AUM Growing AUM by diversifying products AUM (in billions) $8.5 $9.7 $9.2 $12.5 $15.0 $0 $4 $8 $12 $16 2012 2013 2014 2015E 2016E Net Lease Lodging BDC Self-storage Other |
|
|
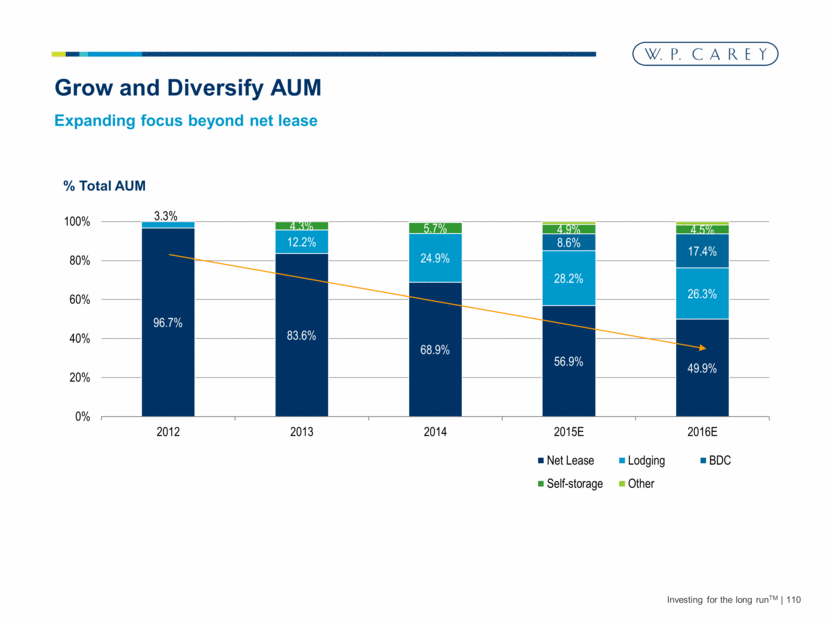
% Total AUM Investing for the long runTM 110 Grow and Diversify AUM Expanding focus beyond net lease 96.7% 83.6% 68.9% 56.9% 49.9% 3.3% 12.2% 24.9% 28.2% 26.3% 8.6% 17.4% 4.3% 5.7% 4.9% 4.5% 0% 20% 40% 60% 80% 100% 2012 2013 2014 2015E 2016E Net Lease Lodging BDC Self-storage Other |
|
|
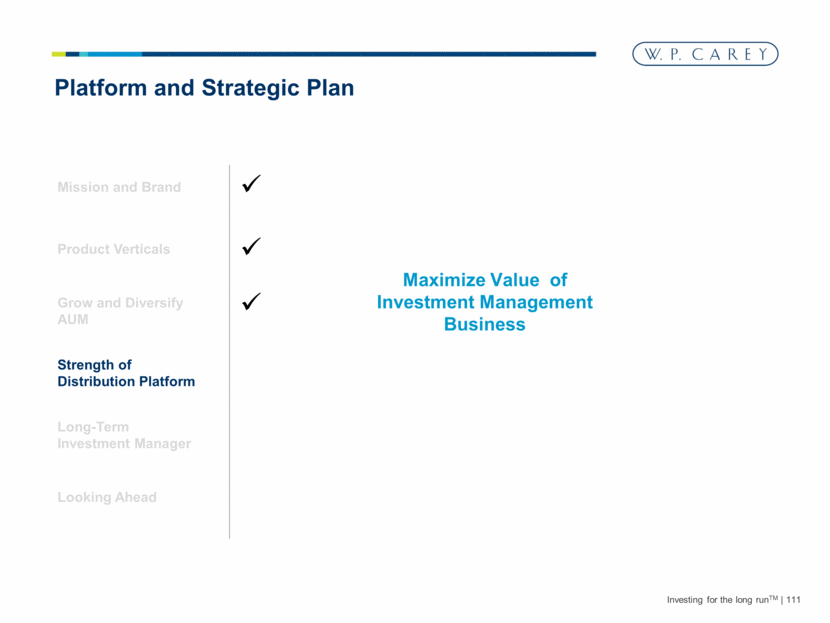
Investing for the long runTM 111 Product Verticals Grow and Diversify AUM Strength of Distribution Platform Long-Term Investment Manager Looking Ahead Platform and Strategic Plan Maximize Value of Investment Management Business Mission and Brand |
|
|
Investing for the long runTM 112 Strength of Distribution Platform Best-in-class distribution partners Selling agreements CPA 17 = 87 CPA 18 = 66 CWI = 56 Reduced commission products Managed to lowest cost / investor capital |
|
|
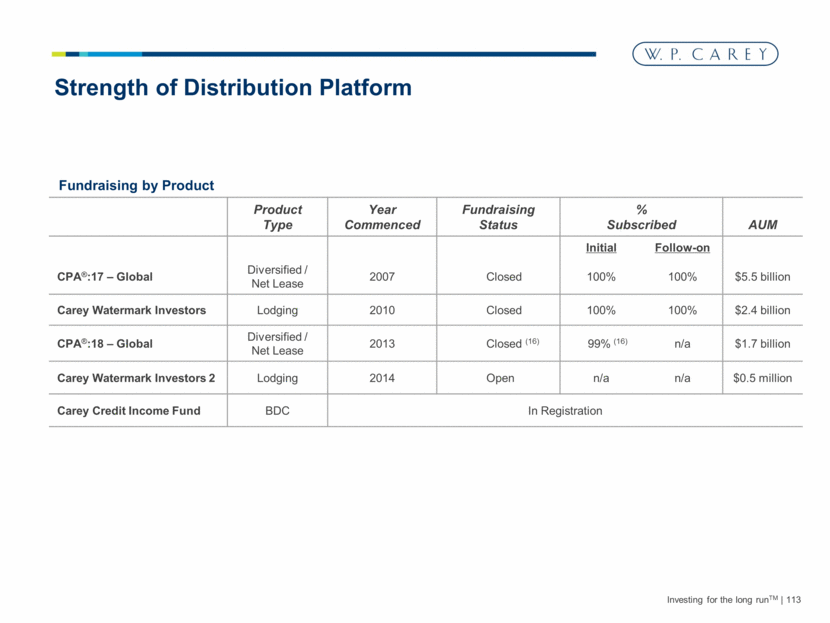
Investing for the long runTM 113 Strength of Distribution Platform Product Type Year Commenced Fundraising Status % Subscribed AUM Initial Follow-on CPA®:17 – Global Diversified / Net Lease 2007 Closed 100% 100% $5.5 billion Carey Watermark Investors Lodging 2010 Closed 100% 100% $2.4 billion CPA®:18 – Global Diversified / Net Lease 2013 Closed (16) 99% (16) n/a $1.7 billion Carey Watermark Investors 2 Lodging 2014 Open n/a n/a $0.5 million Carey Credit Income Fund BDC In Registration Fundraising by Product |
|
|
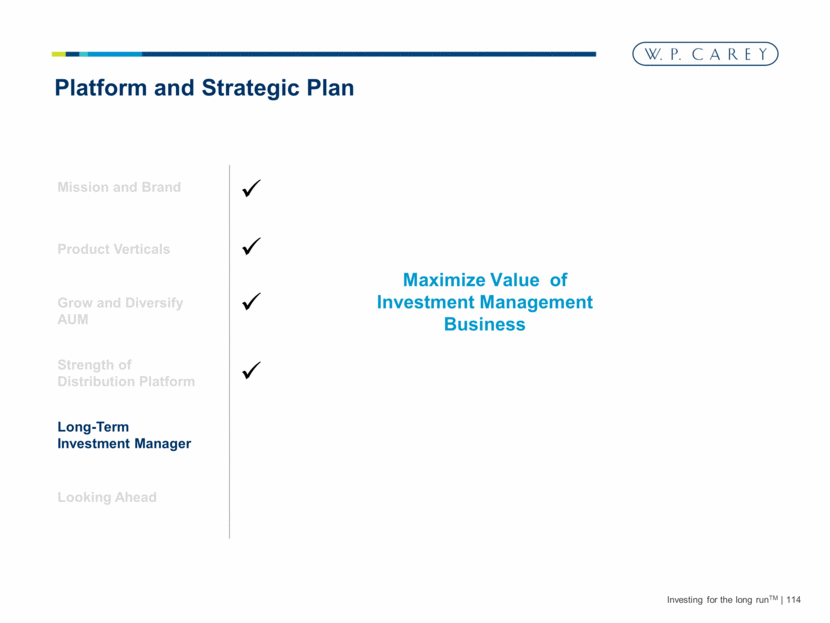
Investing for the long runTM 114 Product Verticals Grow and Diversify AUM Strength of Distribution Platform Long-Term Investment Manager Looking Ahead Platform and Strategic Plan Maximize Value of Investment Management Business Mission and Brand |
|
|
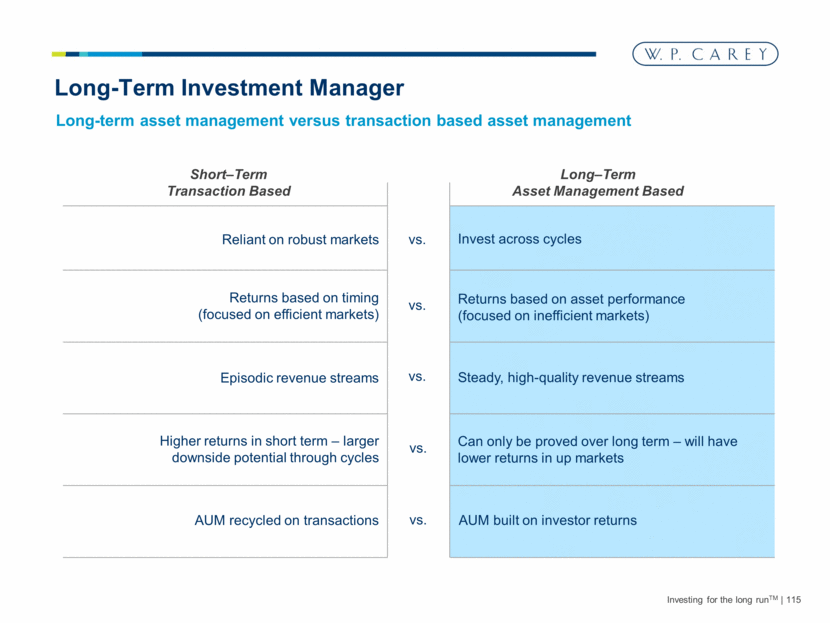
Investing for the long runTM 115 Long-Term Investment Manager Invest across cycles Returns based on asset performance (focused on inefficient markets) Reliant on robust markets Returns based on timing (focused on efficient markets) Episodic revenue streams Higher returns in short term – larger downside potential through cycles Short–Term Transaction Based Long-term asset management versus transaction based asset management Long–Term Asset Management Based Steady, high-quality revenue streams Can only be proved over long term – will have lower returns in up markets AUM recycled on transactions AUM built on investor returns vs. vs. vs. vs. vs. |
|
|
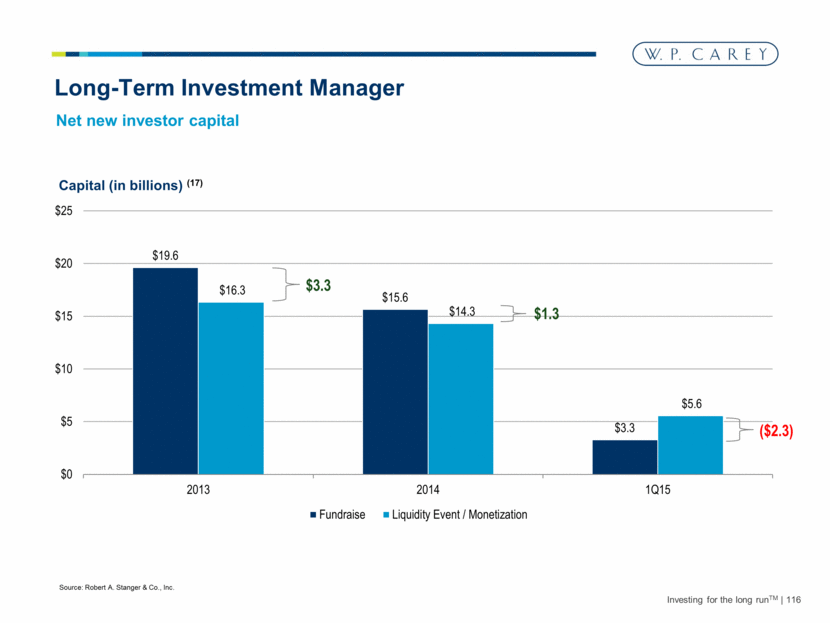
Investing for the long runTM 116 Long-Term Investment Manager Net new investor capital Source: Robert A. Stanger & Co., Inc. $3.3 $1.3 ($2.3) Capital (in billions) (17) $19.6 $15.6 $3.3 $16.3 $14.3 $5.6 $0 $5 $10 $15 $20 $25 2013 2014 1Q15 Fundraise Liquidity Event / Monetization |
|
|
Investing for the long runTM 117 Long-Term Investment Manager AUM (in billions) $8.5 $9.7 $9.2 $12.5 $15.0 $0 $4 $8 $12 $16 2012 2013 2014 2015E 2016E Net Lease Lodging BDC Self-storage Other |
|
|
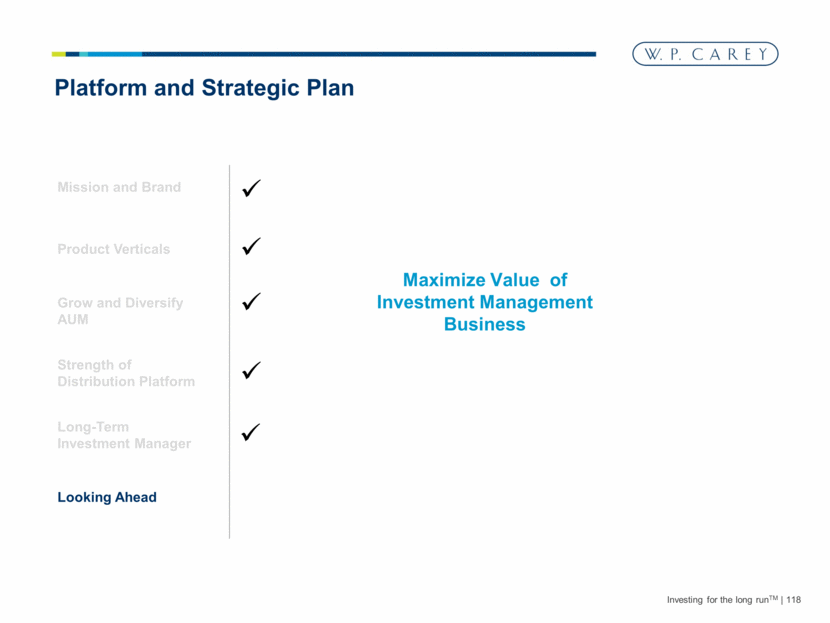
Investing for the long runTM 118 Product Verticals Grow and Diversify AUM Strength of Distribution Platform Long-Term Investment Manager Looking Ahead Platform and Strategic Plan Maximize Value of Investment Management Business Mission and Brand |
|
|
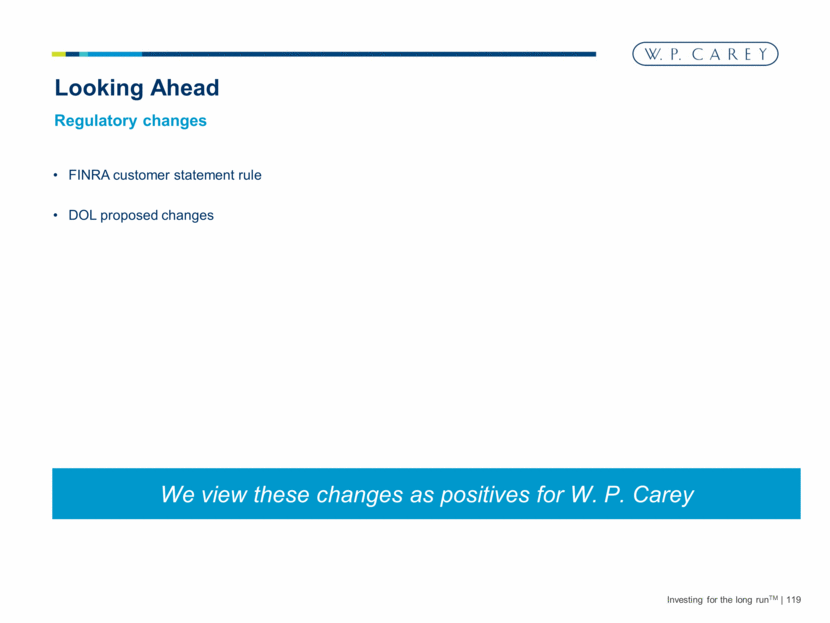
Investing for the long runTM 119 FINRA customer statement rule DOL proposed changes Looking Ahead Regulatory changes We view these changes as positives for W. P. Carey |
|
|
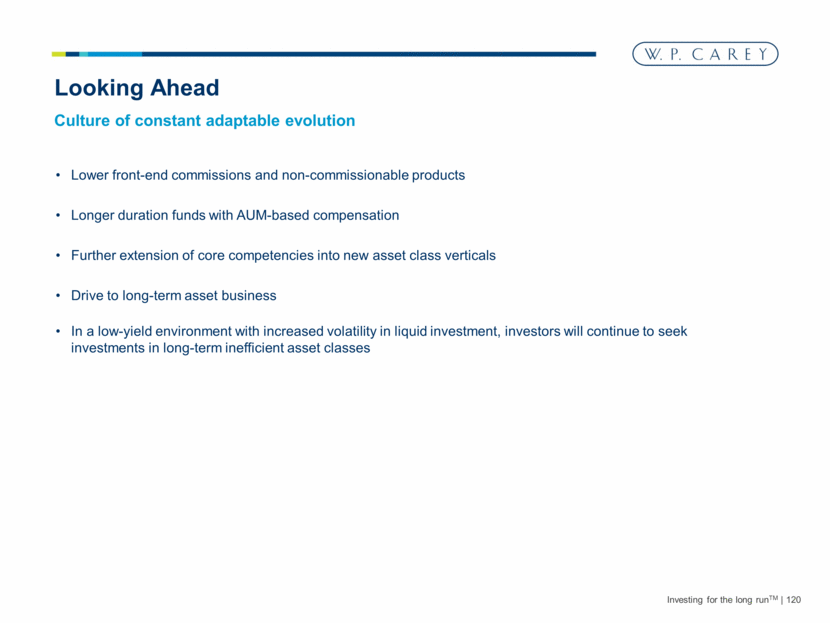
Investing for the long runTM 120 Lower front-end commissions and non-commissionable products Longer duration funds with AUM-based compensation Further extension of core competencies into new asset class verticals Drive to long-term asset business In a low-yield environment with increased volatility in liquid investment, investors will continue to seek investments in long-term inefficient asset classes Looking Ahead Culture of constant adaptable evolution |
|
|
Investing for the long runTM 121 Maximize Value of Investment Management Business “An Investment Manager is only as good as the job it does for its investors” - Bill Carey (Founder W. P. Carey) |
|
|
VI. Financial Strategy |
|
|
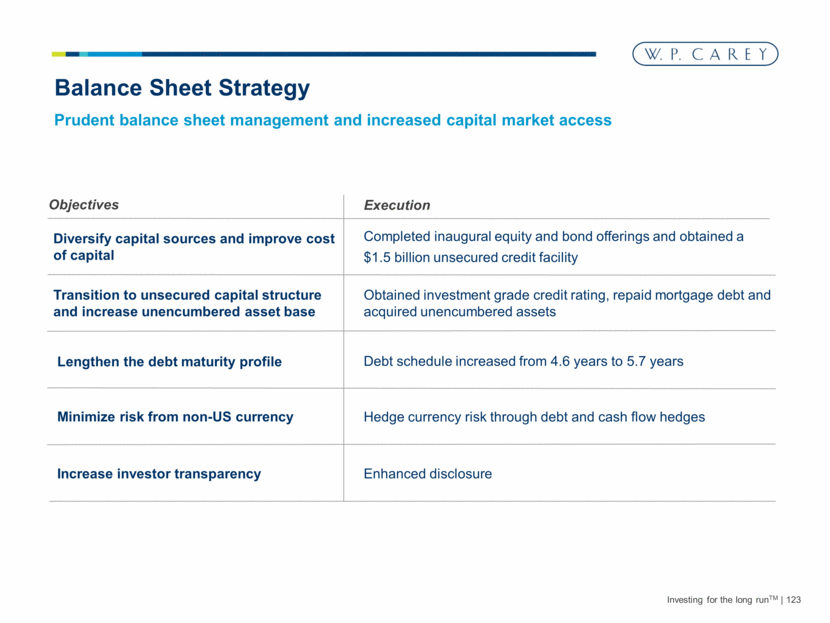
Investing for the long runTM 123 Balance Sheet Strategy Completed inaugural equity and bond offerings and obtained a $1.5 billion unsecured credit facility Diversify capital sources and improve cost of capital Lengthen the debt maturity profile Objectives Prudent balance sheet management and increased capital market access Execution Debt schedule increased from 4.6 years to 5.7 years Transition to unsecured capital structure and increase unencumbered asset base Obtained investment grade credit rating, repaid mortgage debt and acquired unencumbered assets Minimize risk from non-US currency Increase investor transparency Hedge currency risk through debt and cash flow hedges Enhanced disclosure |
|
|
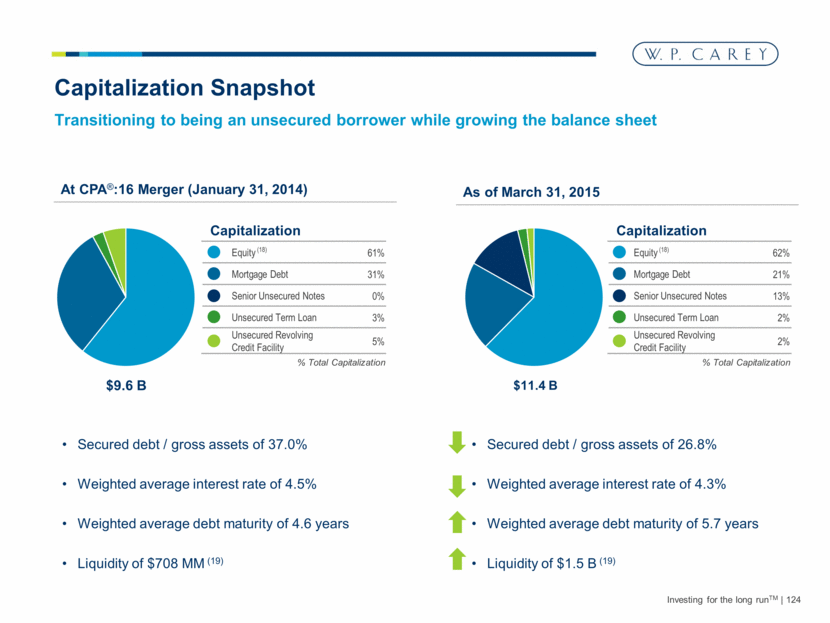
Equity (18) 61% Mortgage Debt 31% Senior Unsecured Notes 0% Unsecured Term Loan 3% Unsecured Revolving Credit Facility 5% Investing for the long runTM 124 Secured debt / gross assets of 37.0% Weighted average interest rate of 4.5% Weighted average debt maturity of 4.6 years Liquidity of $708 MM (19) At CPA®:16 Merger (January 31, 2014) Secured debt / gross assets of 26.8% Weighted average interest rate of 4.3% Weighted average debt maturity of 5.7 years Liquidity of $1.5 B (19) Capitalization $11.4 B Capitalization Snapshot $9.6 B Transitioning to being an unsecured borrower while growing the balance sheet As of March 31, 2015 Equity (18) 62% Mortgage Debt 21% Senior Unsecured Notes 13% Unsecured Term Loan 2% Unsecured Revolving Credit Facility 2% % Total Capitalization Capitalization % Total Capitalization |
|
|
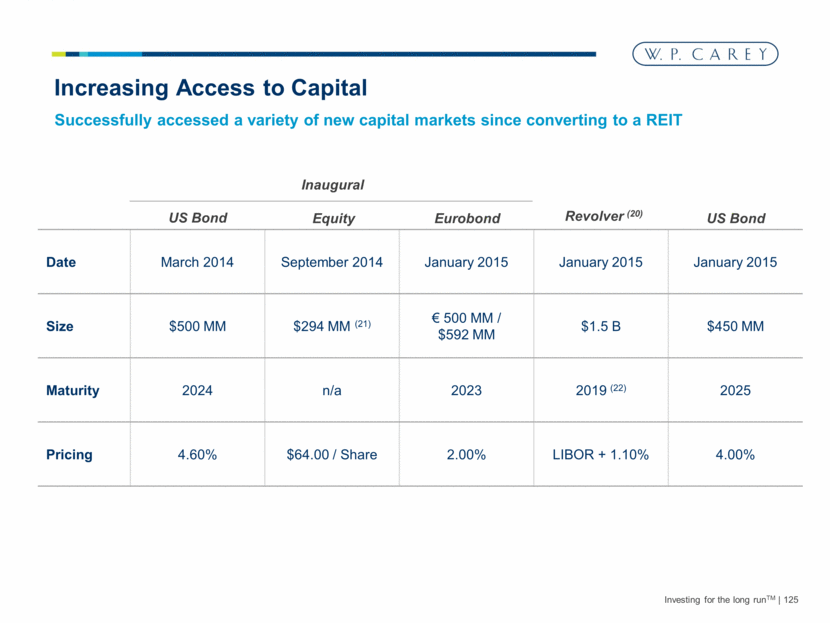
Investing for the long runTM 125 Increasing Access to Capital Date March 2014 September 2014 January 2015 January 2015 January 2015 Size $500 MM $294 MM (21) € 500 MM / $592 MM $1.5 B $450 MM Maturity 2024 n/a 2023 2019 (22) 2025 Pricing 4.60% $64.00 / Share 2.00% LIBOR + 1.10% 4.00% US Bond Equity Eurobond Revolver (20) US Bond Inaugural Successfully accessed a variety of new capital markets since converting to a REIT |
|
|
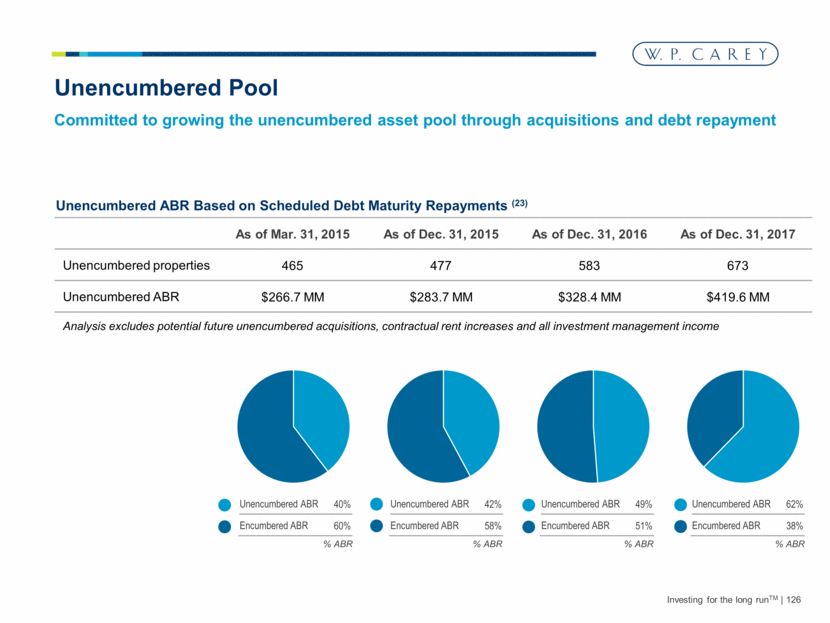
Unencumbered ABR Based on Scheduled Debt Maturity Repayments (23) Investing for the long runTM 126 As of Mar. 31, 2015 As of Dec. 31, 2015 As of Dec. 31, 2016 As of Dec. 31, 2017 Unencumbered properties 465 477 583 673 Unencumbered ABR $266.7 MM $283.7 MM $328.4 MM $419.6 MM Analysis excludes potential future unencumbered acquisitions, contractual rent increases and all investment management income Committed to growing the unencumbered asset pool through acquisitions and debt repayment Unencumbered Pool Unencumbered ABR 40% Encumbered ABR 60% Unencumbered ABR 42% Encumbered ABR 58% Unencumbered ABR 49% Encumbered ABR 51% Unencumbered ABR 62% Encumbered ABR 38% % ABR % ABR % ABR % ABR |
|
|
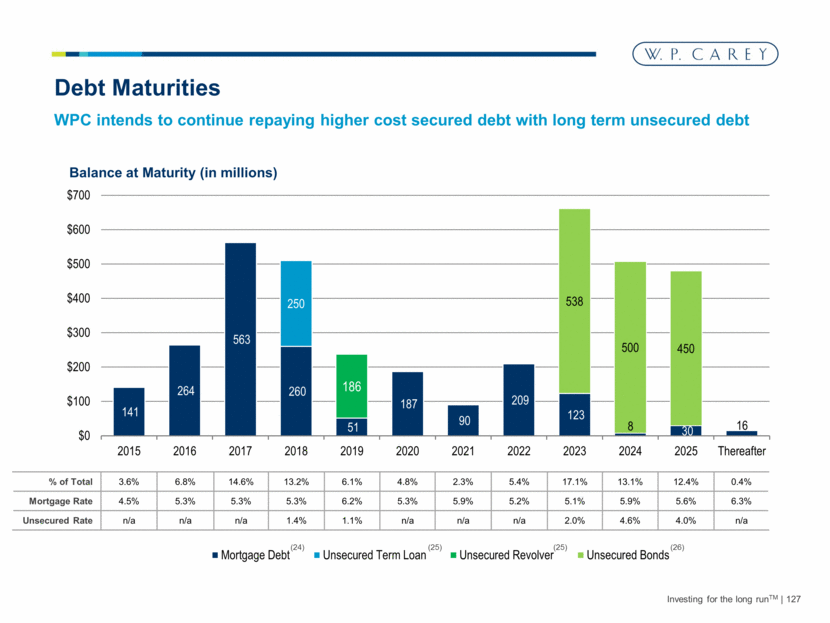
% of Total 3.6% 6.8% 14.6% 13.2% 6.1% 4.8% 2.3% 5.4% 17.1% 13.1% 12.4% 0.4% Mortgage Rate 4.5% 5.3% 5.3% 5.3% 6.2% 5.3% 5.9% 5.2% 5.1% 5.9% 5.6% 6.3% Unsecured Rate n/a n/a n/a 1.4% 1.1% n/a n/a n/a 2.0% 4.6% 4.0% n/a (25) (24) (25) (26) Debt Maturities Balance at Maturity (in millions) Investing for the long runTM 127 WPC intends to continue repaying higher cost secured debt with long term unsecured debt 141 264 563 260 51 187 90 209 123 8 30 16 250 186 538 500 450 $0 $100 $200 $300 $400 $500 $600 $700 2015 2016 2017 2018 2019 2020 2021 2022 2023 2024 2025 Thereafter Mortgage Debt Unsecured Term Loan Unsecured Revolver Unsecured Bonds |
|
|
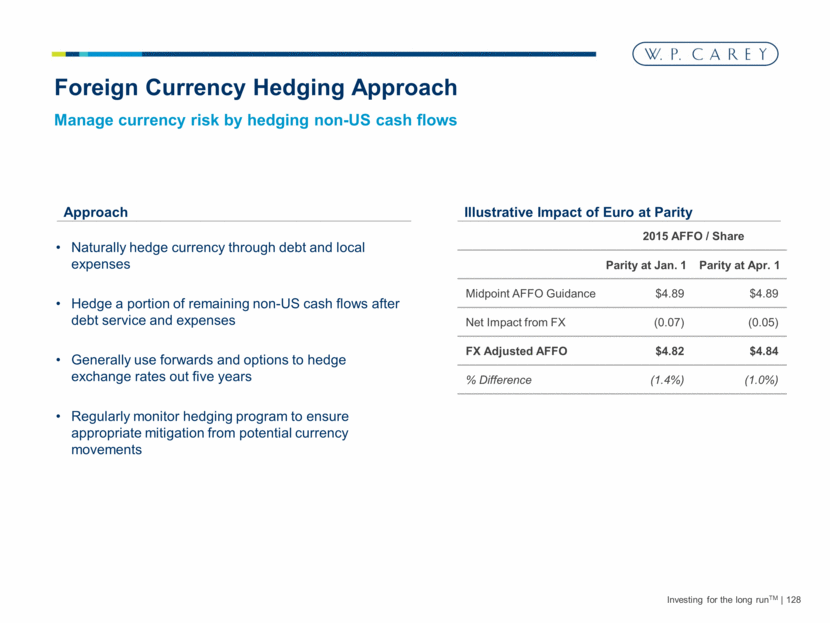
2015 AFFO / Share Parity at Jan. 1 Parity at Apr. 1 Midpoint AFFO Guidance $4.89 $4.89 Net Impact from FX (0.07) (0.05) FX Adjusted AFFO $4.82 $4.84 % Difference (1.4%) (1.0%) Investing for the long runTM 128 Foreign Currency Hedging Approach Manage currency risk by hedging non-US cash flows Approach Naturally hedge currency through debt and local expenses Hedge a portion of remaining non-US cash flows after debt service and expenses Generally use forwards and options to hedge exchange rates out five years Regularly monitor hedging program to ensure appropriate mitigation from potential currency movements Illustrative Impact of Euro at Parity |
|
|
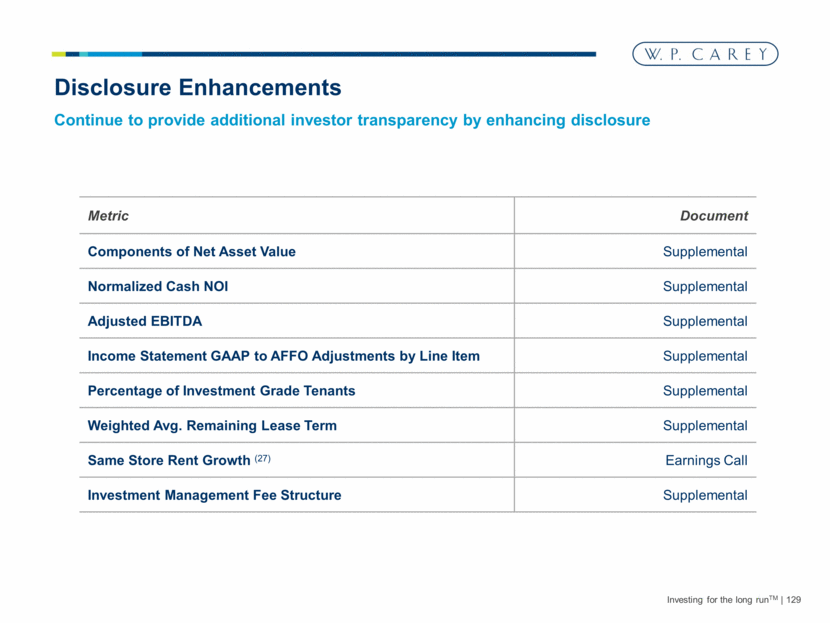
Investing for the long runTM 129 Disclosure Enhancements Metric Document Components of Net Asset Value Supplemental Normalized Cash NOI Supplemental Adjusted EBITDA Supplemental Income Statement GAAP to AFFO Adjustments by Line Item Supplemental Percentage of Investment Grade Tenants Supplemental Weighted Avg. Remaining Lease Term Supplemental Same Store Rent Growth (27) Earnings Call Investment Management Fee Structure Supplemental Continue to provide additional investor transparency by enhancing disclosure |
|
|
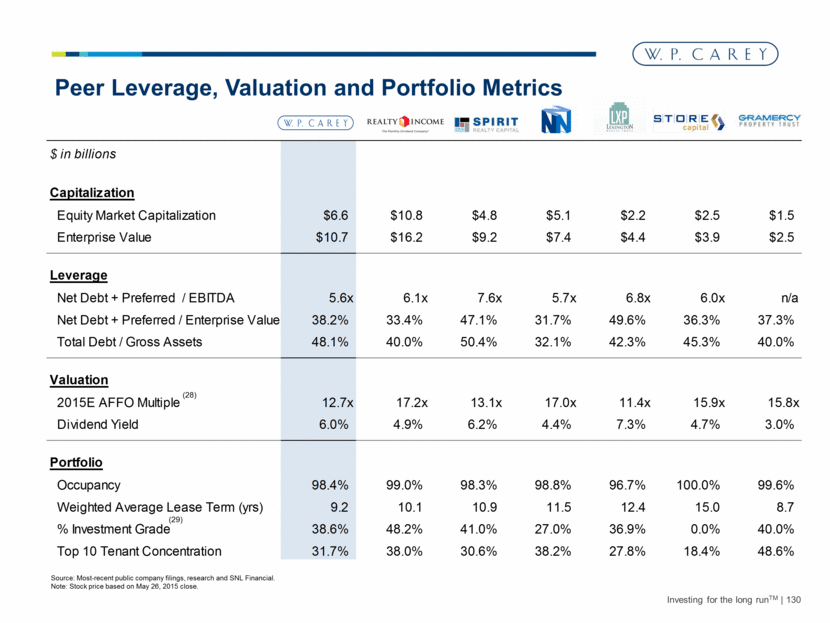
Peer Leverage, Valuation and Portfolio Metrics Investing for the long runTM 130 Source: Most-recent public company filings, research and SNL Financial. Note: Stock price based on May 26, 2015 close. (29) (28) WPC O SRC NNN LXP STOR GPT $ in billions Capitalization Equity Market Capitalization $6.6 $10.8 $4.8 $5.1 $2.2 $2.5 $1.5 Enterprise Value $10.7 $16.2 $9.2 $7.4 $4.4 $3.9 $2.5 Leverage Net Debt + Preferred / EBITDA 5.6x 6.1x 7.6x 5.7x 6.8x 6.0x n/a Net Debt + Preferred / Enterprise Value 38.2% 33.4% 47.1% 31.7% 49.6% 36.3% 37.3% Total Debt / Gross Assets 48.1% 40.0% 50.4% 32.1% 42.3% 45.3% 40.0% Valuation 2015E AFFO Multiple 12.7x 17.2x 13.1x 17.0x 11.4x 15.9x 15.8x Dividend Yield 6.0% 4.9% 6.2% 4.4% 7.3% 4.7% 3.0% Portfolio Occupancy 98.4% 99.0% 98.3% 98.8% 96.7% 100.0% 99.6% Weighted Average Lease Term (yrs) 9.2 10.1 10.9 11.5 12.4 15.0 8.7 % Investment Grade 38.6% 48.2% 41.0% 27.0% 36.9% 0.0% 40.0% Top 10 Tenant Concentration 31.7% 38.0% 30.6% 38.2% 27.8% 18.4% 48.6% |
|
|
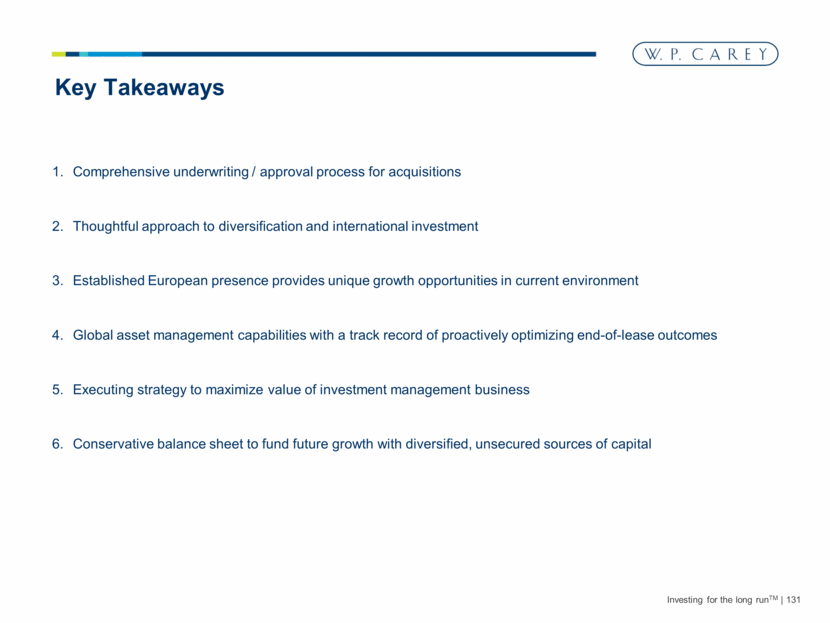
Investing for the long runTM 131 Key Takeaways Comprehensive underwriting / approval process for acquisitions Thoughtful approach to diversification and international investment Established European presence provides unique growth opportunities in current environment Global asset management capabilities with a track record of proactively optimizing end-of-lease outcomes Executing strategy to maximize value of investment management business Conservative balance sheet to fund future growth with diversified, unsecured sources of capital |
|
|
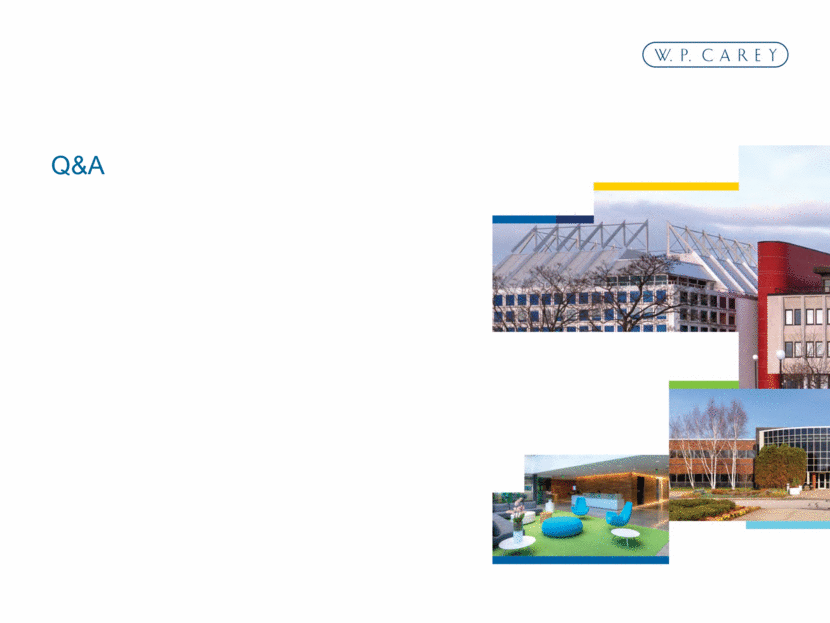
Q&A |
|
|
Appendix |
|
|
Investing for the long runTM 134 Endnotes Includes subsidiaries of non-guarantor investment grade parent companies and non-rated tenants with metrics considered equivalent to investment grade. AUM represents Assets Under Management. Real estate revenue includes Lease revenue and Other real estate revenue and excludes Reimbursable tenant costs. Investment Management revenue includes Structuring revenue, Asset management revenue and Income from general partnership interest and excludes Wholesaling revenue and Reimbursable costs from affiliates. Calculated on a pro rata cash basis for the quarter ended March 31, 2015. Carey Credit Income Fund 2015 A and Carey Credit Income Fund 2015 T each filed a registration statement on Form N-2 with the SEC on September 9, 2014 and September 22, 2014, respectively. Carey Credit Income Fund filed a registration statement on Form 10 with the SEC on November 4, 2014. As of May 28, 2015 none of these registration statements have been declared effective by the SEC and there can be no assurance as to whether or when any offering may be commenced. Managed REITs represents CPA®:17 - Global and CPA®:18 - Global (together the CPA® REITs), along with Carey Watermark Investors Incorporated ("CWI") and Carey Watermark Investors Incorporated 2 ("CWI 2"). Based on square footage for the owned WPC portfolio, including CPA®:12, CPA®:14, CPA®:15 and CPA®:16 prior to merger with WPC. Based on Green Street Q4-2014 Net-Lease Sector Update - simple average of NNN, O and SRC. Based on ABR at the time of bankruptcy filing. Totals and percentages include W. P. Carey and the CPA® REITs. Includes tenants within W. P. Carey and the CPA® REITs. Based on Moody's classification methodology. Calculated on a constant currency basis using exchange rates as of March 31, 2015. Excludes properties acquired, sold or vacated and where leases were extended or modified. Based on ABR for W. P. Carey and the CPA® REITs. Amount as of April 30, 2015. Sourced from Inside Self-Storage. Based on most recent NAV as of December 31, 2014. Initial fundraising closed April 2, 2015. Percentage subscribed is as of March 31, 2015. Fundraising excludes DRIP. KBS REIT II monetization of $859 MM took place on 9/23/14 and was not included in Q3 2014 monetization. Griffin’s $3.4 billion monetization took place in December 2014, above represents 50% of such monetization in December 2014 and 50% in January 2015. Pending 2015 monetizations include: Apple Hospitality, ARC Global Trust, ARC Healthcare Trust II, TIER REIT and ARC V. Equity market capitalization based on stock price of $59.08 as of January 31, 2014 for capitalization at CPA®:16 Merger, and stock price of $68.00 as of March 31, 2015 for capitalization today. Represents cash plus availability under credit facility. Exercised accordion feature to increase revolver capacity to $1.5 billion, and established new $500 million accordion. Includes overallotment option exercised by underwriters. Reflects maturity including extension option. Projection based on unencumbered ABR as of March 31, 2015, assuming all mortgages are paid off at maturity and no properties are acquired or sold. Does not account for contractual rent increases in the future. Reflects amounts due at maturity and excludes principal amortization. Reflects maturity including extension options. Reflects amount due at maturity, excluding unamortized premiums/discounts. To be added to future Supplemental disclosure. AFFO is based on consensus estimates. Includes investment grade and implied investment grade. |
|
|
Disclosures Disclosures This presentation is confidential and private. Distribution of this presentation is restricted. It may not be reproduced, copied or replicated in any form without the express written authorization of W. P. Carey. Cautionary Statement Concerning Forward-Looking Statements Certain of the matters discussed in this communication constitute forward-looking statements within the meaning of the Securities Act of 1933, as amended, and the Securities Exchange Act of 1934, as amended, both as amended by the Private Securities Litigation Reform Act of 1995. The forward-looking statements include, among other things, statements regarding the intent, belief or expectations of W. P. Carey and can be identified by the use of words such as “may,” “will,” “should,” “would,” “assume,” “outlook,” “seek,” “plan,” “believe,” “expect,” “anticipate,” “intend,” “estimate,” “forecast” and other comparable terms. These forward-looking statements include, but are not limited to, statements regarding capital markets; tenant credit quality; our acquisition, underwriting, and asset management processes; general economic outlook; the investment environment; interest rates; currency movements; hedging strategies; our expected range of AFFO; our corporate strategy; our encumbered assets and unencumbered income; our portfolio lease terms; growing our assets under management; acquisitions; our international exposure and acquisition volume; our expectations about tenant bankruptcies and interest coverage; statements regarding estimated or future economic performance and results, including our underlying assumptions; occupancy rate; credit ratings; possible new acquisitions; strategies for our investment management platform; our managed funds, including their earnings; statements that we make regarding our ability to remain qualified for taxation as a real estate investment trust (“REIT”); the amount and timing of any future dividends; our existing or future leverage and debt service obligations; our future prospects for growth; our projected assets under management; our future capital expenditure levels; our future financing transactions; our estimates of growth; our financial targets to be achieved in 2015 and beyond; our financial forecasts; and our plans to fund our future liquidity needs. These statements are based on the current expectations of the management of W. P. Carey. It is important to note that the actual results of W. P. Carey could be materially different from those projected in such forward-looking statements. There are a number of risks and uncertainties that could cause actual results to differ materially from the forward-looking statements. Other unknown or unpredictable factors could also have material adverse effects on our business, financial condition, liquidity, results of operations, AFFO and prospects. Discussions of some of these risk factors and assumptions are contained in W. P. Carey’s filings with the SEC and are available at the SEC’s website at http://www.sec.gov, including “Item 1A. Risk Factors” in W. P. Carey’s Annual Report on Form 10-K for the year ended December 31, 2014, as filed with the SEC on March 2, 2014, as amended by a Form 10-K/A filed with the SEC on March 17, 2015, and our Quarterly Report on Form 10-Q for the quarter ended March 31, 2015 as filed with the SEC on May 18, 2015, and in subsequent reports filed with the SEC. In light of these risks, uncertainties, assumptions and factors, there can be no assurance that the results and events contemplated by the forward-looking statements contained in this communication will in fact transpire. Moreover, because we operate in a very competitive and rapidly changing environment, new risks are likely to emerge from time to time. Given these risks and uncertainties, potential investors are cautioned not to place undue reliance on these forward-looking statements as a prediction of future results, which speak only as of the date of this communication, unless noted otherwise. Except as required under the federal securities laws and the rules and regulations of the SEC, W. P. Carey does not undertake any obligation to release publicly any revisions to the forward-looking statements to reflect events or circumstances after the date of this communication or to reflect the occurrence of unanticipated events. Investing for the long runTM 135 |
|
|
Disclosures (cont’d) Non-GAAP Financial Disclosures Adjusted EBITDA We believe that EBITDA is a useful supplemental measure to investors and analysts for assessing the performance of our business segments because (i) it removes the impact of our capital structure from our operating results; and (ii) because it is helpful when comparing our operating performance to that of companies in our industry without regard to such items, which can vary substantially from company to company. Adjusted EBITDA as disclosed represents EBITDA, modified to include other adjustments to Generally Accepted Accounting Principles (“GAAP”) net income for certain non-cash charges, such as impairments, non-cash rent adjustments, and unrealized gains and losses from our hedging activity. Additionally, we exclude merger expenses related to the CPA®:16 Merger (defined below), which are considered non-core, and gains and losses in real estate as they are not considered fundamental attributes of our business plans and do not affect our overall long-term operating performance. We exclude these items from adjusted EBITDA as they are not considered primary drivers in our decision-making process. Our assessment of our operations is focused on long-term sustainability and not on such non-cash and non-core items, which may cause short-term fluctuations in net income but have no impact on cash flows. We believe that adjusted EBITDA is a useful supplemental measure to investors and analysts, although it does not represent net income that is computed in accordance with GAAP. Accordingly, adjusted EBITDA should not be considered as an alternative to net income or as an indicator of our financial performance. EBITDA and adjusted EBITDA as calculated by us may not be comparable to similarly titled measures of other companies. The term CPA®:16 Merger means our merger with Corporate Properties Associates 16 – Global Incorporated, which was completed on January 31, 2014. AFFO Funds From Operation (“FFO”) is a non-GAAP measure defined by the National Association of Real Estate Investment Trusts® (“NAREIT”). NAREIT defines FFO as net income or loss (as computed in accordance with GAAP) excluding: depreciation and amortization expense from real estate assets, impairment charges on real estate, gains or losses from sales of depreciated real estate assets, and extraordinary items; however, FFO related to assets held for sale, sold, or otherwise transferred and included in the results of discontinued operations are included. These adjustments also incorporate the pro rata (described below) share of unconsolidated subsidiaries. FFO is used by management, investors and analysts to facilitate meaningful comparisons of operating performance between periods and among our peers. Although NAREIT has published this definition of FFO, companies often modify this definition as they seek to provide financial measures that meaningfully reflect their distinctive operations. We modify the NAREIT computation of FFO to include other adjustments to GAAP net income to adjust for certain non-cash charges such as amortization of intangibles, deferred income tax benefits and expenses, straight-line rents, stock compensation, gains or losses from extinguishment of debt and deconsolidation of subsidiaries[, and unrealized foreign currency exchange gains and losses]. Our assessment of our operations is focused on long-term sustainability and not on such non-cash items, which may cause short-term fluctuations in net income but have no impact on cash flows. Additionally, we exclude acquisition expenses and non-core expenses, such as merger and restructuring expenses. Merger expenses are related to the CPA®:16 Merger. We refer to our modified definition of FFO as “AFFO.” We exclude these items from GAAP net income (i) as they are not the primary drivers in our decision-making process and; (ii) excluding these items provides investors with a view of our portfolio performance over time and make it more comparable to other REITs that are currently not engaged in acquisitions, mergers and restructurings, which are not part of our normal business operations. We use AFFO as one measure of our operating performance when we formulate corporate goals, evaluate the effectiveness of our strategies and determine executive compensation. We believe that AFFO is a useful supplemental measure for investors to consider because it will help them to better assess the sustainability of our operating performance without the potentially distorting impact of these short-term fluctuations. However, there are limits on the usefulness of AFFO to investors. For example, impairment charges and unrealized foreign currency losses that we exclude may become actual realized losses upon the ultimate disposition of the properties in the form of lower cash proceeds or other considerations. We use our FFO and AFFO measures as supplemental financial measures of operating performance. We do not use our FFO and AFFO measures as, nor should they be considered to be, alternatives to net earnings computed under GAAP, as alternatives to cash from operating activities computed under GAAP, or as indicators of our ability to fund our cash needs. Investing for the long runTM 136 |
|
|
Disclosures (cont’d) Non-GAAP Financial Disclosures (cont’d) Pro Rata Metrics This presentation contains certain metrics prepared under the pro rata consolidation method. We refer to these metrics as pro rata metrics. We have a number of investments, usually with our affiliates, in which our economic ownership is less than 100%. Under the full consolidation method, we report 100% of the assets, liabilities, revenues, and expenses of those investments that are deemed to be under our control or for which we are deemed to be the primary beneficiary, even if our ownership is less than 100%. Also, for all other jointly-owned investments, we report our net investment and our net income or loss from that investment. Under the pro rata consolidation method, we present our proportionate share, based on our economic ownership of these jointly-owned investments, of the assets, liabilities, revenues and expenses of those investments. ABR ABR represents contractual minimum annualized base rent for our net leased properties. ABR is not applicable to operating properties. All data presented herein is as of March 31, 2015 unless otherwise noted. Amounts may not sum to totals due to rounding. Past performance does not guarantee future results. Investing for the long runTM 137 |

