Attached files
| file | filename |
|---|---|
| 8-K - HOWARD BANCORP, INC. 8-K - Howard Bancorp Inc | a51111112.htm |
Exhibit 99.1
HOWARD BANCORP Annual Shareholder Meeting Presentation May 27, 2015
Forward‐Looking Statements This presentation contains statements that are forward‐looking, as that term is defined by the Private Securities Litigation Reform Act of 1995 or the Securities and Exchange Commission in its rules, regulations and releases. The Company intends that such forward‐looking statements be subject to the safe harbors created thereby. All forward‐looking statements are based on current expectations regarding important risk factors, including but not limited to real estate values, local and national economic conditions, the impact of interest rates on financing and the successful completion and deployment of proceeds from the capital raises as well as the successful completion and integration of mergers and acquisitions. Accordingly, actual results may differ from those expressed in the forward‐looking statements, and the making of such statements should not be regarded as a representation by the Company or any other person that results expressed therein will be achieved. The Company does not undertake, and specifically disclaims any obligation, to publicly release the result of any revisions that may be made to any forward‐looking statements to reflect events or circumstances after the date of such statements or to reflect the occurrence of anticipated or unanticipated events. 1
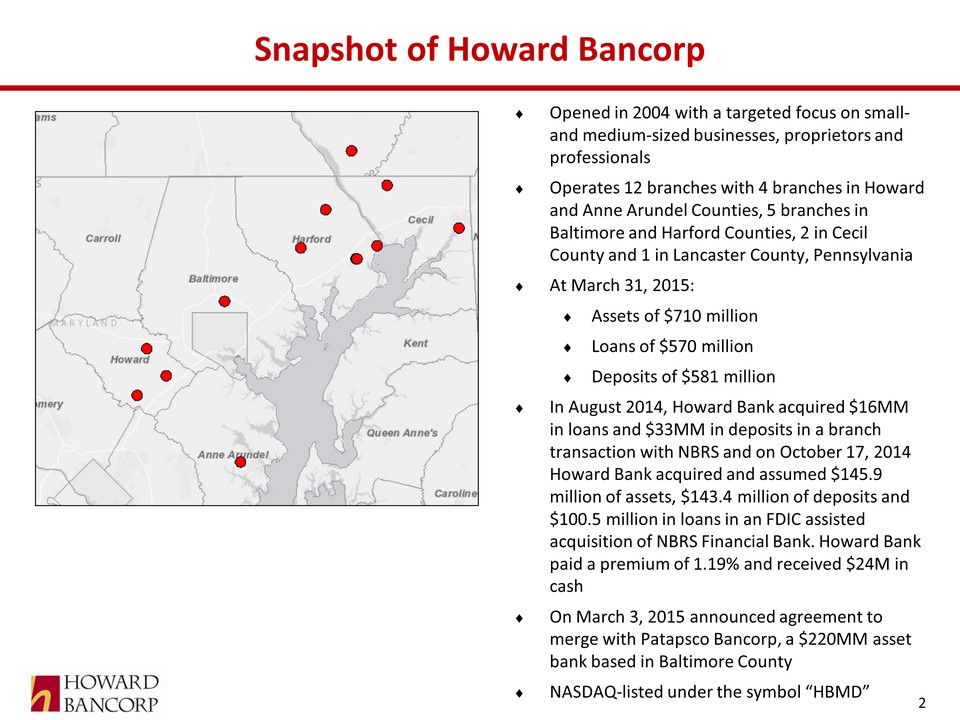
Snapshot of Howard Bancorp Opened in 2004 with a targeted focus on smalland medium‐sized businesses, proprietors and professionals Operates 12 branches with 4 branches in Howard and Anne Arundel Counties, 5 branches in Baltimore and Harford Counties, 2 in Cecil County and 1 in Lancaster County, Pennsylvania At March 31, 2015: Assets of $710 million Loans of $570 million Deposits of $581 million In August 2014, Howard Bank acquired $16MM in loans and $33MM in deposits in a branch transaction with NBRS and on October 17, 2014 Howard Bank acquired and assumed $145.9 million of assets, $143.4 million of deposits and $100.5 million in loans in an FDIC assisted acquisition of NBRS Financial Bank. Howard Bank paid a premium of 1.19% and received $24M in cash On March 3, 2015 announced agreement to merge with Patapsco Bancorp, a $220MM asset bank based in Baltimore County NASDAQ‐listed under the symbol “HBMD” 2
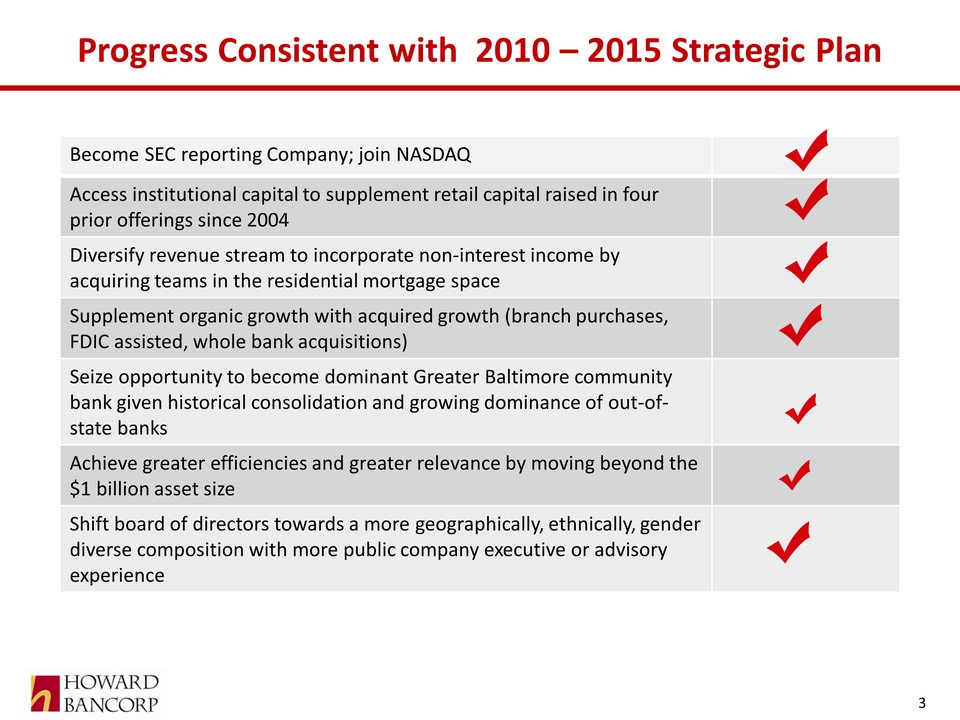
Progress Consistent with 2010 – 2015 Strategic Plan 3 Become SEC reporting Company; join NASDAQ Access institutional capital to supplement retail capital raised in four prior offerings since 2004 Diversify revenue stream to incorporate non‐interest income by acquiring teams in the residential mortgage space Supplement organic growth with acquired growth (branch purchases, FDIC assisted, whole bank acquisitions) Seize opportunity to become dominant Greater Baltimore community bank given historical consolidation and growing dominance of out‐ofstate banks Achieve greater efficiencies and greater relevance by moving beyond the $1 billion asset size Shift board of directors towards a more geographically, ethnically, gender diverse composition with more public company executive or advisory experience
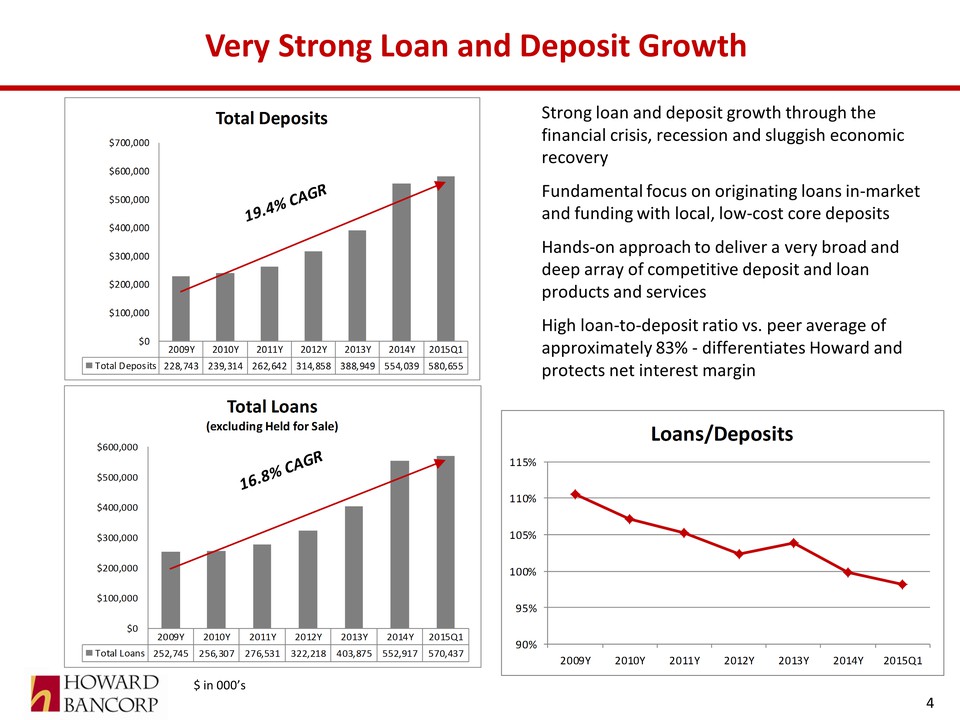
2009Y 2010Y 2011Y 2012Y 2013Y 2014Y 2015Q1 Total Loans 252,745 256,307 276,531 322,218 403,875 552,917 570,437 $0 $100,000 $200,000 $300,000 $400,000 $500,000 $600,000 Total Loans (excluding Held for Sale) Very Strong Loan and Deposit Growth Strong loan and deposit growth through the financial crisis, recession and sluggish economic recovery Fundamental focus on originating loans in‐market and funding with local, low‐cost core deposits Hands‐on approach to deliver a very broad and deep array of competitive deposit and loan products and services High loan‐to‐deposit ratio vs. peer average of approximately 83% ‐ differentiates Howard and protects net interest margin 4 $ in 000’s 2009Y 2010Y 2011Y 2012Y 2013Y 2014Y 2015Q1 Total Deposits 228,743 239,314 262,642 314,858 388,949 554,039 580,655 $0 $100,000 $200,000 $300,000 $400,000 $500,000 $600,000 $700,000 Total Deposits 90% 95% 100% 105% 110% 115% 2009Y 2010Y 2011Y 2012Y 2013Y 2014Y 2015Q1 Loans/Deposits
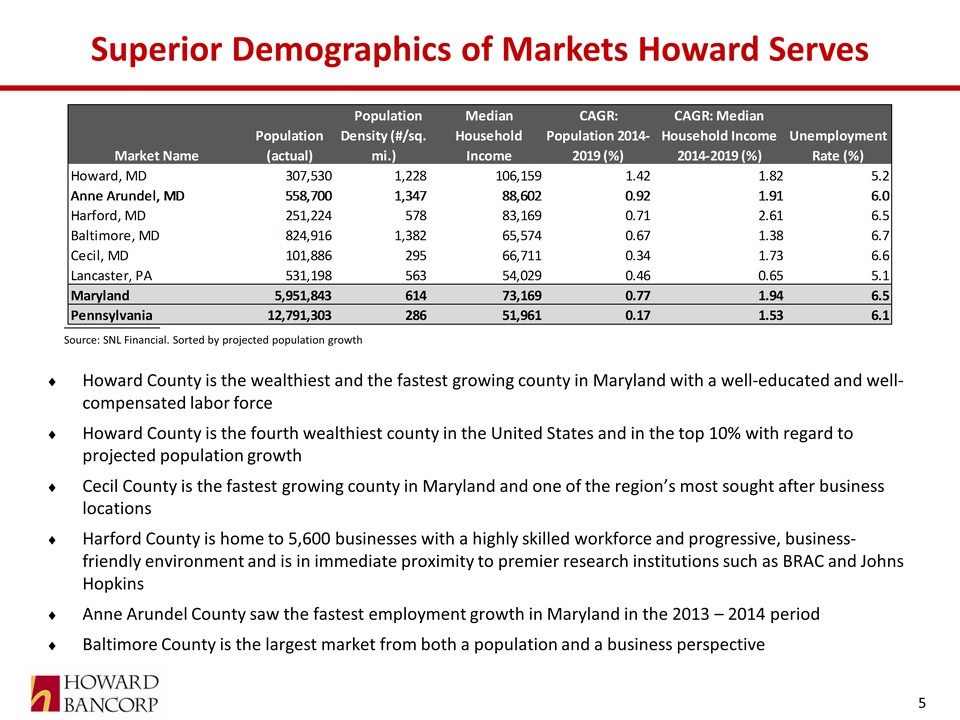
Superior Demographics of Markets Howard Serves Source: SNL Financial. Sorted by projected population growth 5 Howard County is the wealthiest and the fastest growing county in Maryland with a well‐educated and wellcompensated labor force Howard County is the fourth wealthiest county in the United States and in the top 10% with regard to projected population growth Cecil County is the fastest growing county in Maryland and one of the region’s most sought after business locations Harford County is home to 5,600 businesses with a highly skilled workforce and progressive, businessfriendly environment and is in immediate proximity to premier research institutions such as BRAC and Johns Hopkins Anne Arundel County saw the fastest employment growth in Maryland in the 2013 – 2014 period Baltimore County is the largest market from both a population and a business perspective Market Name Population (actual) Population Density (#/sq. mi.) Median Household Income CAGR: Population 2014‐ 2019 (%) CAGR: Median Household Income 2014‐2019 (%) Unemployment Rate (%) Howard, MD 307,530 1,228 106,159 1.42 1.82 5.2 Anne Arundel, MD 558,700 1,347 88,602 0.92 1.91 6.0 Harford, MD 251,224 578 83,169 0.71 2.61 6.5 Baltimore, MD 824,916 1,382 65,574 0.67 1.38 6.7 Cecil, MD 101,886 295 66,711 0.34 1.73 6.6 Lancaster, PA 531,198 563 54,029 0.46 0.65 5.1 Maryland 5,951,843 614 73,169 0.77 1.94 6.5 Pennsylvania 12,791,303 286 51,961 0.17 1.53 6.1
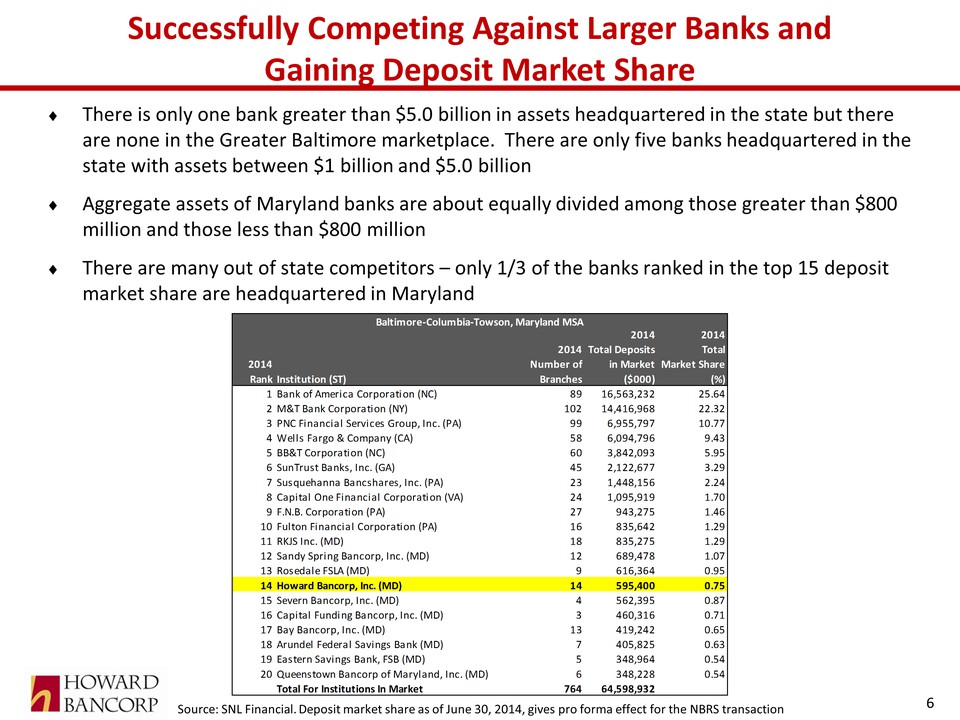
Successfully Competing Against Larger Banks and Gaining Deposit Market Share There is only one bank greater than $5.0 billion in assets headquartered in the state but there are none in the Greater Baltimore marketplace. There are only five banks headquartered in the state with assets between $1 billion and $5.0 billion Aggregate assets of Maryland banks are about equally divided among those greater than $800 million and those less than $800 million There are many out of state competitors – only 1/3 of the banks ranked in the top 15 deposit market share are headquartered in Maryland Source: SNL Financial. Deposit market share as of June 30, 2014, gives pro forma effect for the NBRS transaction 6 Baltimore‐Columbia‐Towson, Maryland MSA 2014 Rank Institution (ST) 2014 Number of Branches 2014 Total Deposits in Market ($000) 2014 Total Market Share (%) 1 Bank of America Corporation (NC) 89 16,563,232 25.64 2 M&T Bank Corporation (NY) 102 14,416,968 22.32 3 PNC Financial Services Group, Inc. (PA) 99 6,955,797 10.77 4 Wells Fargo & Company (CA) 58 6,094,796 9.43 5 BB&T Corporation (NC) 60 3,842,093 5.95 6 SunTrust Banks, Inc. (GA) 45 2,122,677 3.29 7 Susquehanna Bancshares, Inc. (PA) 23 1,448,156 2.24 8 Capital One Financial Corporation (VA) 24 1,095,919 1.70 9 F.N.B. Corporation (PA) 27 943,275 1.46 10 Fulton Financial Corporation (PA) 16 835,642 1.29 11 RKJS Inc. (MD) 18 835,275 1.29 12 Sandy Spring Bancorp, Inc. (MD) 12 689,478 1.07 13 Rosedale FSLA (MD) 9 616,364 0.95 14 Howard Bancorp, Inc. (MD) 14 595,400 0.75 15 Severn Bancorp, Inc. (MD) 4 562,395 0.87 16 Capital Funding Bancorp, Inc. (MD) 3 460,316 0.71 17 Bay Bancorp, Inc. (MD) 13 419,242 0.65 18 Arundel Federal Savings Bank (MD) 7 405,825 0.63 19 Eastern Savings Bank, FSB (MD) 5 348,964 0.54 20 Queenstown Bancorp of Maryland, Inc. (MD) 6 348,228 0.54 Total For Institutions In Market 764 64,598,932
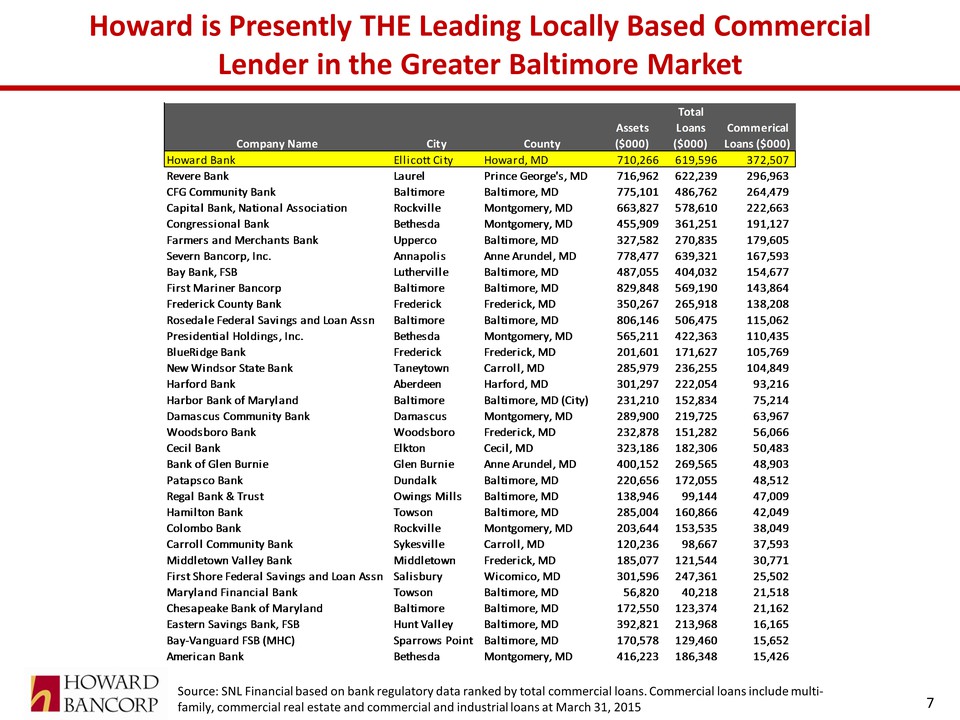
Howard is Presently THE Leading Locally Based Commercial Lender in the Greater Baltimore Market 7 Source: SNL Financial based on bank regulatory data ranked by total commercial loans. Commercial loans include multifamily, commercial real estate and commercial and industrial loans at March 31, 2015 Company Name City County Assets ($000) Total Loans ($000) Commerical Loans ($000) Howard Bank Ellicott City Howard, MD 710,266 619,596 372,507 Revere Bank Laurel Prince George's, MD 716,962 622,239 296,963 CFG Community Bank Baltimore Baltimore, MD 775,101 486,762 264,479 Capital Bank, National Association Rockville Montgomery, MD 663,827 578,610 222,663 Congressional Bank Bethesda Montgomery, MD 455,909 361,251 191,127 Farmers and Merchants Bank Upperco Baltimore, MD 327,582 270,835 179,605 Severn Bancorp, Inc. Annapolis Anne Arundel, MD 778,477 639,321 167,593 Bay Bank, FSB Lutherville Baltimore, MD 487,055 404,032 154,677 First Mariner Bancorp Baltimore Baltimore, MD 829,848 569,190 143,864 Frederick County Bank Frederick Frederick, MD 350,267 265,918 138,208 Rosedale Federal Savings and Loan Assn Baltimore Baltimore, MD 806,146 506,475 115,062 Presidential Holdings, Inc. Bethesda Montgomery, MD 565,211 422,363 110,435 BlueRidge Bank Frederick Frederick, MD 201,601 171,627 105,769 New Windsor State Bank Taneytown Carroll, MD 285,979 236,255 104,849 Harford Bank Aberdeen Harford, MD 301,297 222,054 93,216 Harbor Bank of Maryland Baltimore Baltimore, MD (City) 231,210 152,834 75,214 Damascus Community Bank Damascus Montgomery, MD 289,900 219,725 63,967 Woodsboro Bank Woodsboro Frederick, MD 232,878 151,282 56,066 Cecil Bank Elkton Cecil, MD 323,186 182,306 50,483 Bank of Glen Burnie Glen Burnie Anne Arundel, MD 400,152 269,565 48,903 Patapsco Bank Dundalk Baltimore, MD 220,656 172,055 48,512 Regal Bank & Trust Owings Mills Baltimore, MD 138,946 99,144 47,009 Hamilton Bank Towson Baltimore, MD 285,004 160,866 42,049 Colombo Bank Rockville Montgomery, MD 203,644 153,535 38,049 Carroll Community Bank Sykesville Carroll, MD 120,236 98,667 37,593 Middletown Valley Bank Middletown Frederick, MD 185,077 121,544 30,771 First Shore Federal Savings and Loan Assn Salisbury Wicomico, MD 301,596 247,361 25,502 Maryland Financial Bank Towson Baltimore, MD 56,820 40,218 21,518 Chesapeake Bank of Maryland Baltimore Baltimore, MD 172,550 123,374 21,162 Eastern Savings Bank, FSB Hunt Valley Baltimore, MD 392,821 213,968 16,165 Bay‐Vanguard FSB (MHC) Sparrows Point Baltimore, MD 170,578 129,460 15,652 American Bank Bethesda Montgomery, MD 416,223 186,348 15,426
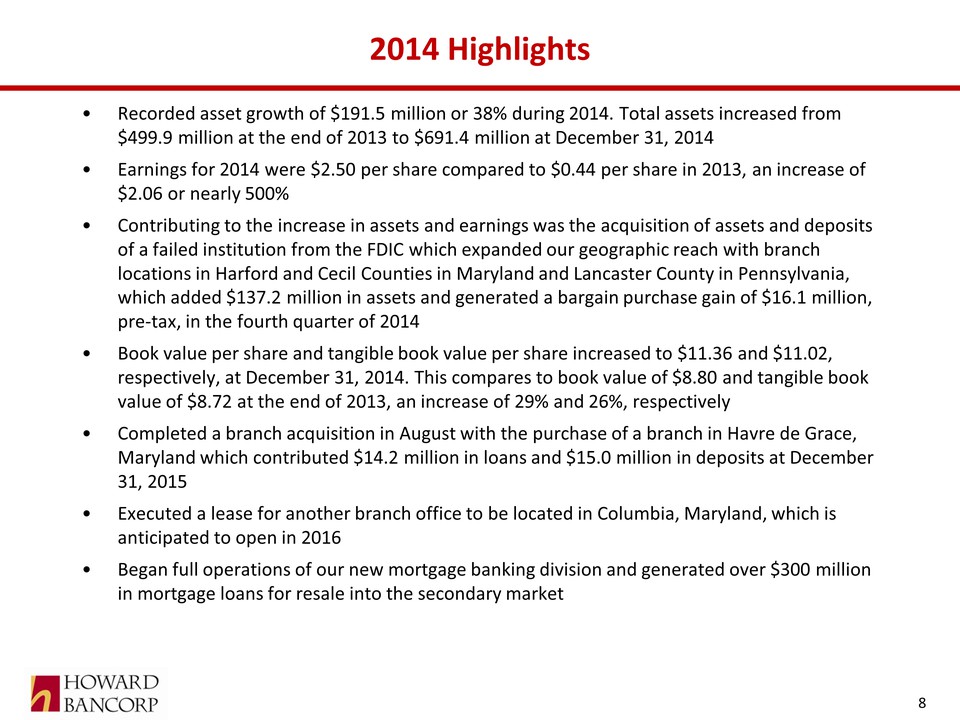
2014 Highlights Recorded asset growth of $191.5 million or 38% during 2014. Total assets increased from $499.9 million at the end of 2013 to $691.4 million at December 31, 2014 Earnings for 2014 were $2.50 per share compared to $0.44 per share in 2013, an increase of $2.06 or nearly 500% Contributing to the increase in assets and earnings was the acquisition of assets and deposits of a failed institution from the FDIC which expanded our geographic reach with branch locations in Harford and Cecil Counties in Maryland and Lancaster County in Pennsylvania, which added $137.2 million in assets and generated a bargain purchase gain of $16.1 million, pre‐tax, in the fourth quarter of 2014 Book value per share and tangible book value per share increased to $11.36 and $11.02, respectively, at December 31, 2014. This compares to book value of $8.80 and tangible book value of $8.72 at the end of 2013, an increase of 29% and 26%, respectively Completed a branch acquisition in August with the purchase of a branch in Havre de Grace, Maryland which contributed $14.2 million in loans and $15.0 million in deposits at December 31, 2015 Executed a lease for another branch office to be located in Columbia, Maryland, which is anticipated to open in 2016 Began full operations of our new mortgage banking division and generated over $300 million in mortgage loans for resale into the secondary market 8
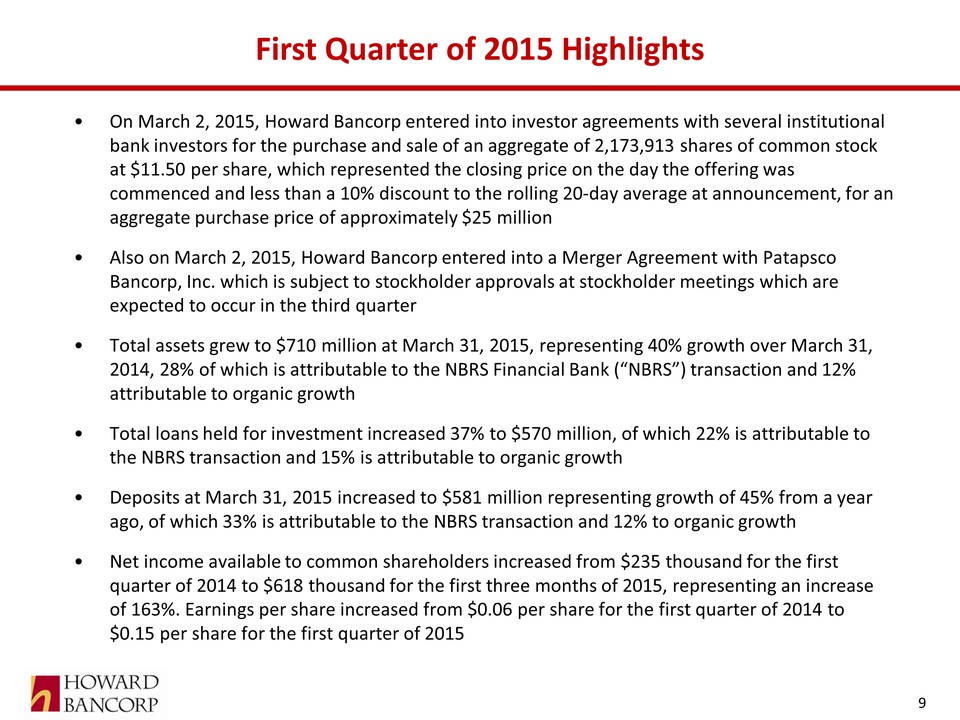
First Quarter of 2015 Highlights On March 2, 2015, Howard Bancorp entered into investor agreements with several institutional bank investors for the purchase and sale of an aggregate of 2,173,913 shares of common stock at $11.50 per share, which represented the closing price on the day the offering was commenced and less than a 10% discount to the rolling 20‐day average at announcement, for an aggregate purchase price of approximately $25 million Also on March 2, 2015, Howard Bancorp entered into a Merger Agreement with Patapsco Bancorp, Inc. which is subject to stockholder approvals at stockholder meetings which are expected to occur in the third quarter Total assets grew to $710 million at March 31, 2015, representing 40% growth over March 31, 2014, 28% of which is attributable to the NBRS Financial Bank (“NBRS”) transaction and 12% attributable to organic growth Total loans held for investment increased 37% to $570 million, of which 22% is attributable to the NBRS transaction and 15% is attributable to organic growth Deposits at March 31, 2015 increased to $581 million representing growth of 45% from a year ago, of which 33% is attributable to the NBRS transaction and 12% to organic growth Net income available to common shareholders increased from $235 thousand for the first quarter of 2014 to $618 thousand for the first three months of 2015, representing an increase of 163%. Earnings per share increased from $0.06 per share for the first quarter of 2014 to $0.15 per share for the first quarter of 2015 9
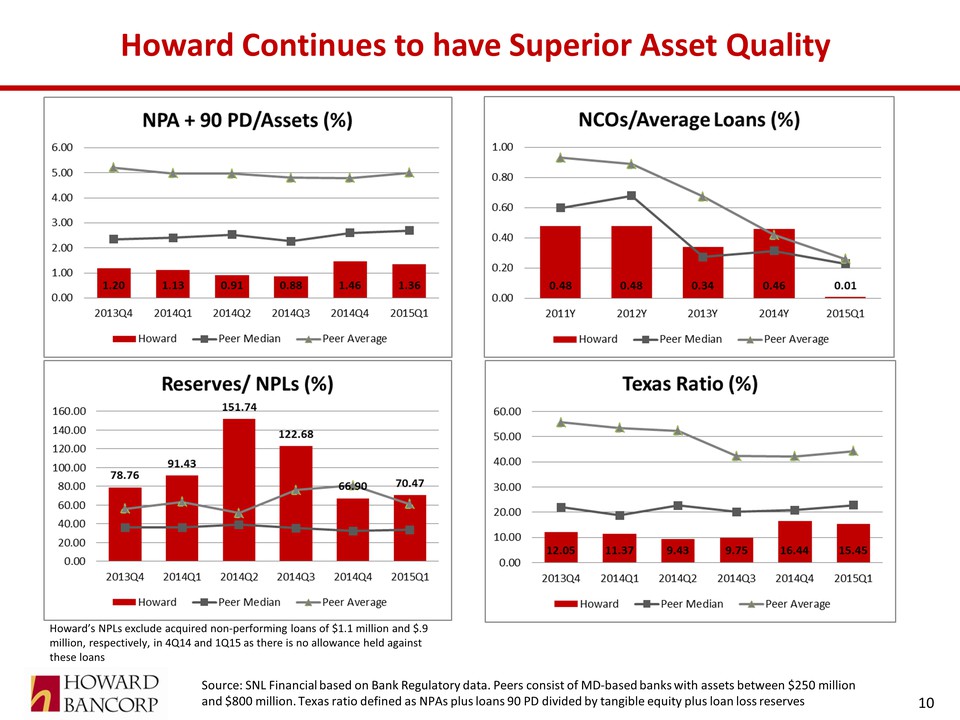
Howard Continues to have Superior Asset Quality 10 Source: SNL Financial based on Bank Regulatory data. Peers consist of MD‐based banks with assets between $250 million and $800 million. Texas ratio defined as NPAs plus loans 90 PD divided by tangible equity plus loan loss reserves Howard’s NPLs exclude acquired non‐performing loans of $1.1 million and $.9 million, respectively, in 4Q14 and 1Q15 as there is no allowance held against these NPA + 90 PDF/Assets NCOs/Average Loans Reserves/NPLs Texas Ratio 1.20 1.13 0.91 0.88 1.46 1.36 78.76 91.43 151.74 122.68 0.48 0.48 0.34 0.46 0.01 loans 12.05 11.37 9.43 9.75 16.44 15.45 2013Q4 2014Q1 2014Q2 2014Q3 2014Q4 2015Q1 Howard Peer Median Peer Average
Howard De Novo Mortgage Bank Continues to Grow Designed initiative to diversify revenue streams, reduce exclusive reliance on balance sheet growth for earnings, and improve ROA and ROE Hired seasoned commercial bank CEO with substantial mortgage banking experience during the second quarter 2013 Strategic focus and initiatives of the mortgage division is to maintain diversity and sustainability during the normal business cycles of the mortgage industry/housing market. This was accomplished by hiring both Retail (purchase money mortgages) and Consumer Direct (nationwide refinances) seasoned mortgage professionals Obtained regulatory and licensing approvals (FHA, VA, USDA) during the second and third quarters of 2013 as well as expanded mortgage investor relationships to add additional products and pricing models Established Retail mortgage office in the forth quarter of 2013, which was designed to focus on purchase money mortgages, in a highly desirable location in Timonium, Maryland Commenced building of operational infrastructure during the fourth quarter of 2013 Added Consumer Direct group in first quarter of 2014 Steadily increased origination and sales volumes each month now averaging $35 million per month in originations Mortgage Banking operation generated $4.3 million in revenue in 2014, compared to only $215 thousand in 2013 Year‐to‐date March 31, 2015, the mortgage banking operation generated $1.8 million in revenue, compared to $292 thousand for the same period in 2014 11
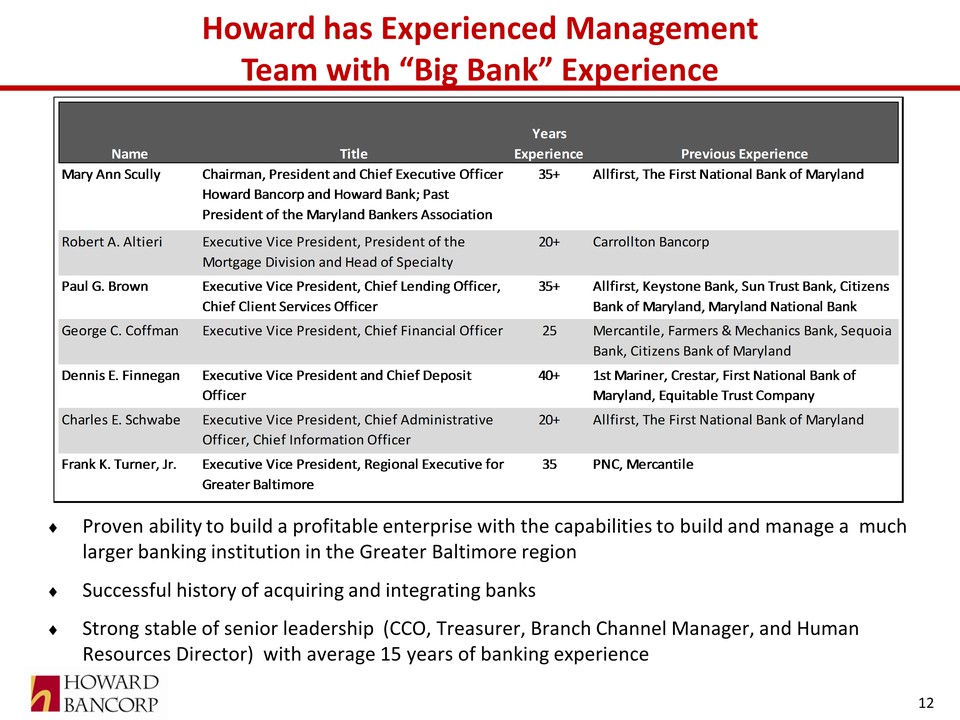
Howard has Experienced Management Team with “Big Bank” Experience Proven ability to build a profitable enterprise with the capabilities to build and manage a much larger banking institution in the Greater Baltimore region Successful history of acquiring and integrating banks Strong stable of senior leadership (CCO, Treasurer, Branch Channel Manager, and Human Resources Director) with average 15 years of banking experience 12 Name Title Years Experience Previous Experience Mary Ann Scully Chairman, President and Chief Executive Officer Howard Bancorp and Howard Bank; Past President of the Maryland Bankers Association 35+ Allfirst, The First National Bank of Maryland Robert A. Altieri Executive Vice President, President of the Mortgage Division and Head of Specialty 20+ Carrollton Bancorp Paul G. Brown Executive Vice President, Chief Lending Officer, Chief Client Services Officer 35+ Allfirst, Keystone Bank, Sun Trust Bank, Citizens Bank of Maryland, Maryland National Bank George C. Coffman Executive Vice President, Chief Financial Officer 25 Mercantile, Farmers & Mechanics Bank, Sequoia Bank, Citizens Bank of Maryland Dennis E. Finnegan Executive Vice President and Chief Deposit Officer 40+ 1st Mariner, Crestar, First National Bank of Maryland, Equitable Trust Company Charles E. Schwabe Executive Vice President, Chief Administrative Officer, Chief Information Officer 20+ Allfirst, The First National Bank of Maryland Frank K. Turner, Jr. Executive Vice President, Regional Executive for Greater Baltimore 35 PNC, Mercantile Howard Average Maryland Banks (70) Constr & Land Dev 10% 6% 1‐4 Fmly Residential 20% 50% Multifamily Loans 2% 2% Non‐Owner Occupied CRE 23% 16% Farm Loans 1% 2% Commercial & Industrial Loans (1) 44% 21% Consumer Loans 1% 2%
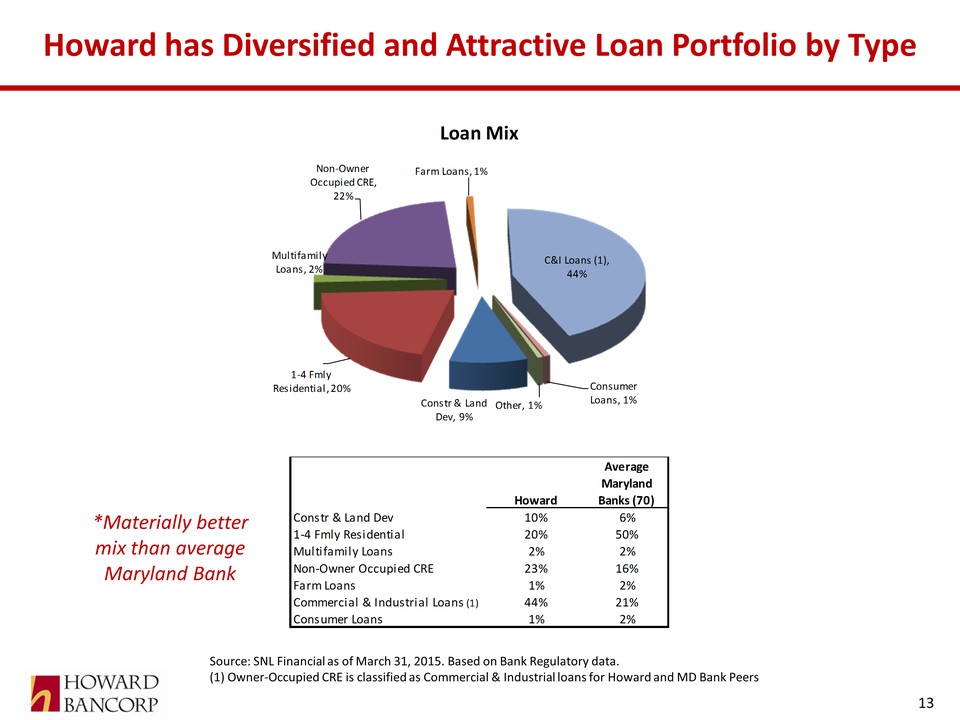
Howard has Diversified and Attractive Loan Portfolio by Type 13 Source: SNL Financial as of March 31, 2015. Based on Bank Regulatory data. (1) Owner‐Occupied CRE is classified as Commercial & Industrial loans for Howard and MD Bank Peers *Materially better mix than average Maryland Bank Loan Mix Non-Owner Occupied CRE 22% Farm Loans 1% C&I Loans (1) 44% Consumer Loans 1% Other 1% Constr & Land Dev 9% 1-4 Fmly Residential 20% Multifamily Loans 2% Howard Average Maryland Banks (70)
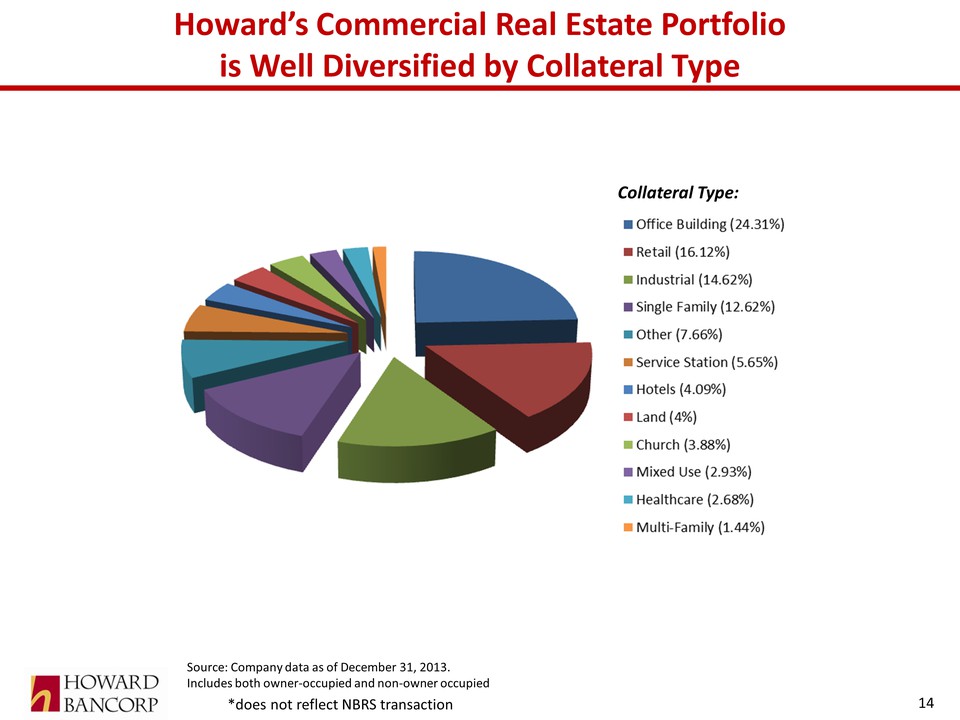
Howard’s Commercial Real Estate Portfolio is Well Diversified by Collateral Type 14 Source: Company data as of December 31, 2013. Includes both owner‐occupied and non‐owner occupied Collateral Type: *does not reflect NBRS transaction Collateral Type: Office Building Retail Industrial Single Family Other Service Station Hotels Land Church Mixed Use Healthcare Multi-Family (24.31%) (16.12%) (14.62%) (12.62%) (7.66%) (5.65%) (4.09%) (4%) (3.88%) (2.93%) (2.68%) (1.44%)
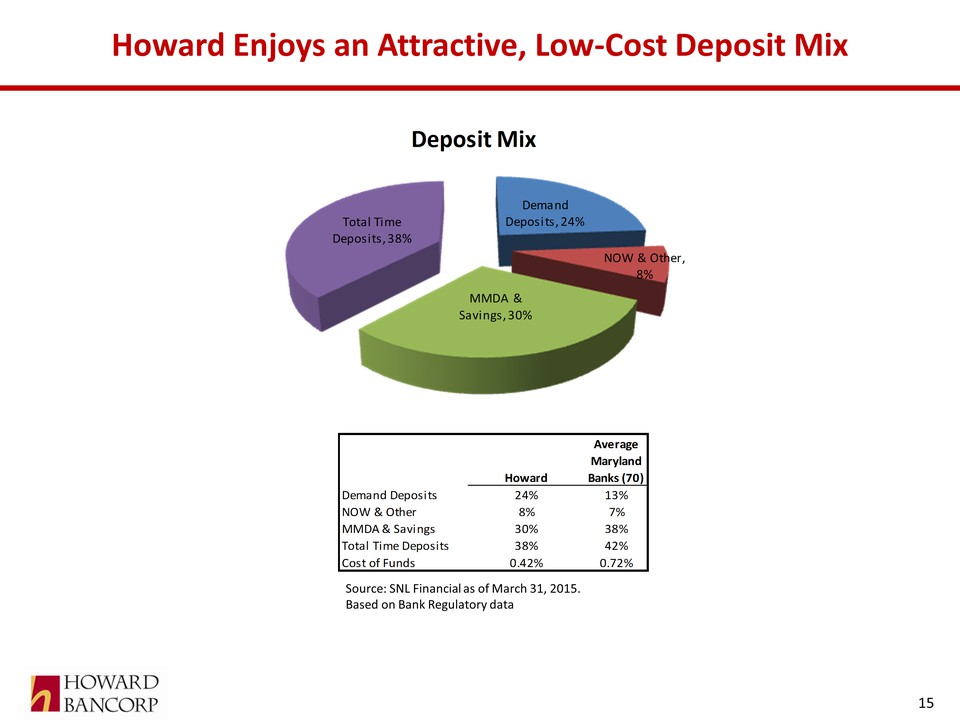
Howard Enjoys an Attractive, Low‐Cost Deposit Mix 15 Howard Average Maryland Banks (70) Demand Deposits 24% 13% NOW & Other 8% 7% MMDA & Savings 30% 38% Total Time Deposits 38% 42% Cost of Funds 0.42% 0.72% Source: SNL Financial as of March 31, 2015. Based on Bank Regulatory data
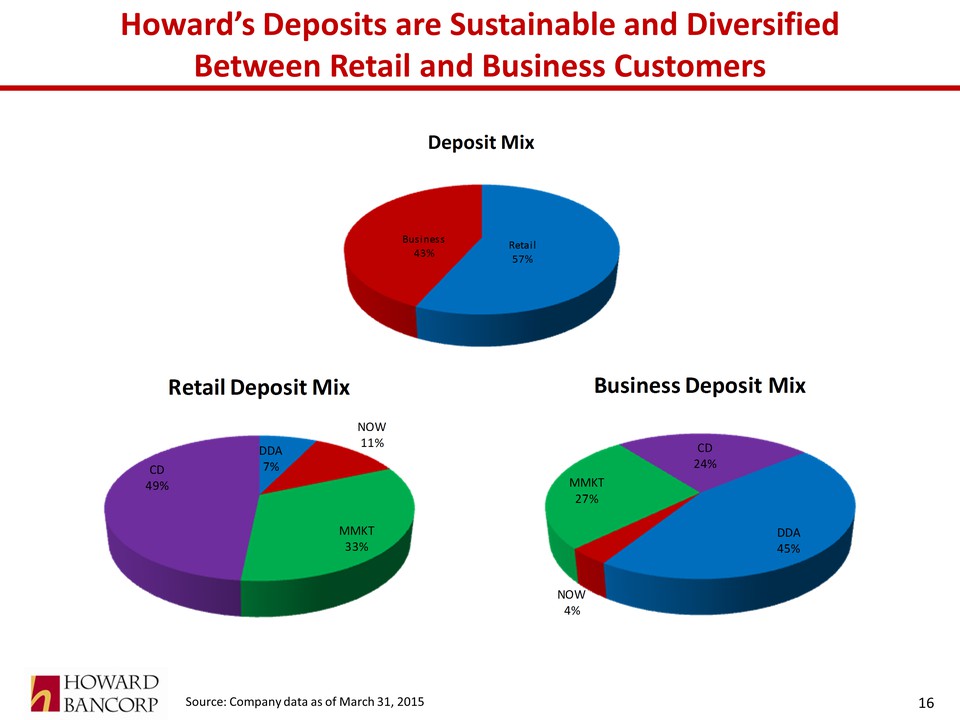
Howard’s Deposits are Sustainable and Diversified Between Retail and Business Customers Source: Company data as of March 31, 2015 16 Deposit Mix Retail Deposit Mix Business Deposit Mix 43% 57% 49% 7% 33% 45% 24% 4% NOW CD MMKT DDA CD MMKT
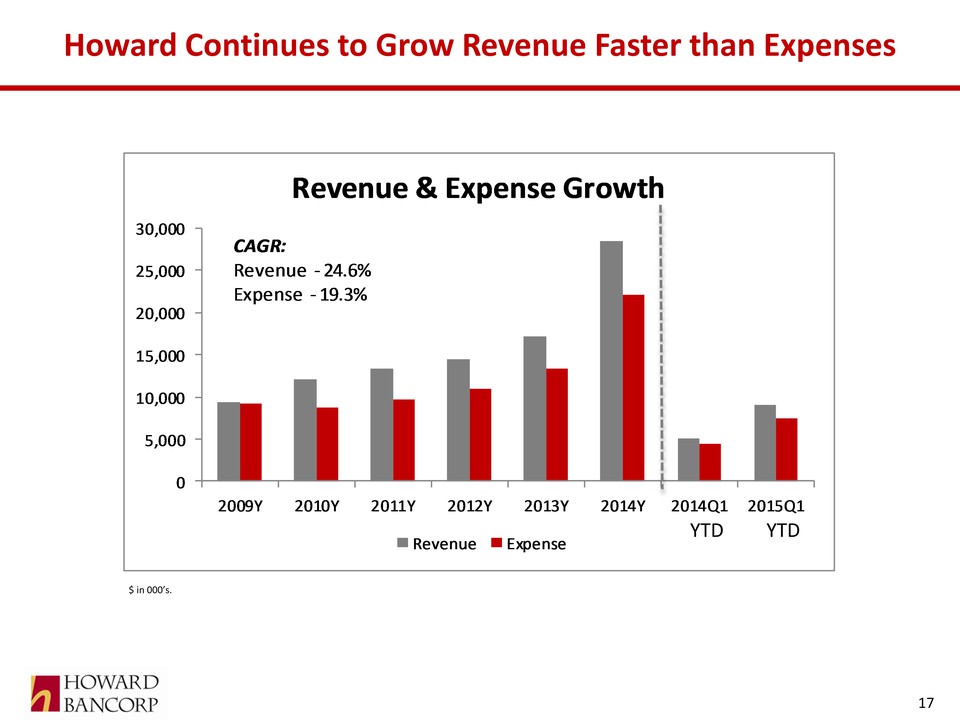
Howard Continues to Grow Revenue Faster than Expenses 17 $ in 000’s. YTD YTD 2009Y 2010Y 2011Y 2012Y 2013Y 2014Y 2014YQ1 2015Q1 Revenue & Expense Growth CAGR Revenue 24.6% 19.3% 30,000 25,000 20,000 15,000 10,000 5,000 0 Revenue Expense 17
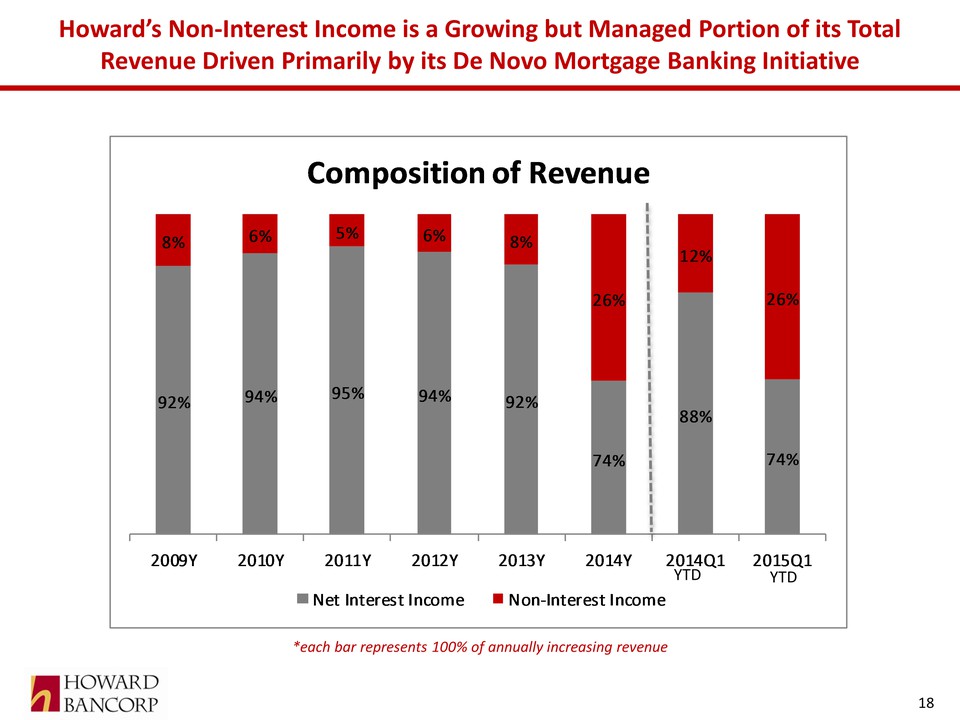
Howard’s Non‐Interest Income is a Growing but Managed Portion of its Total Revenue Driven Primarily by its De Novo Mortgage Banking Initiative 18 YTD YTD *each bar represents 100% of annually increasing revenue 8% 6% 5% 92% 94% 95% 26% 74% 88% 12% 2009Y 2010Y 2011Y 2012Y 2013Y 2014Y 2014YQ1 2015Q1 Net Interest Income Non-Interest Income Composition of Revenue 18
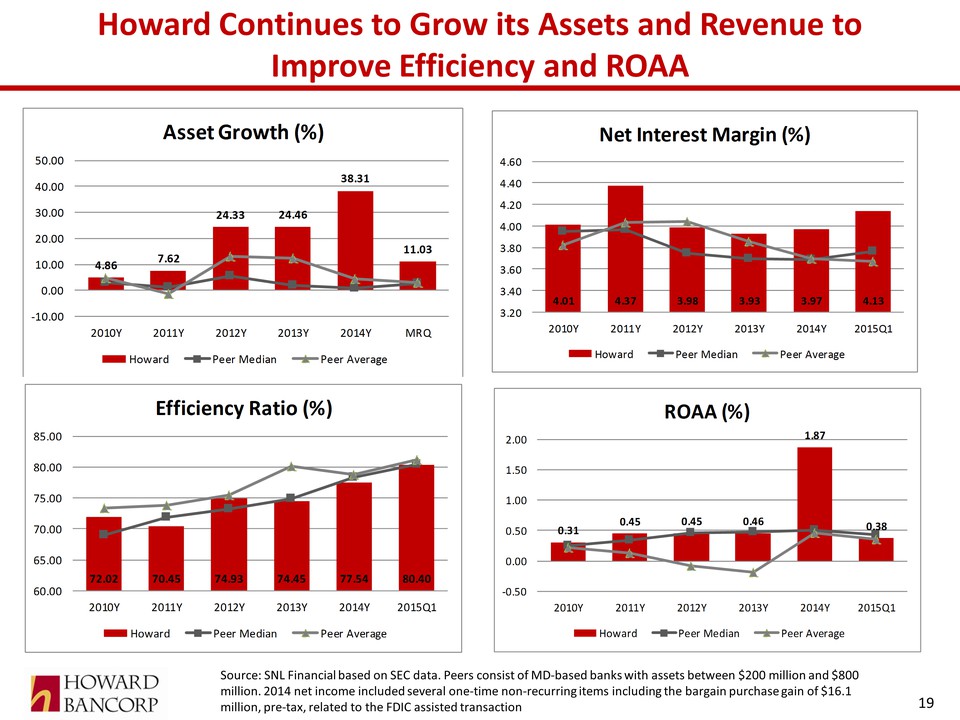
Howard Continues to Grow its Assets and Revenue to Improve Efficiency and ROAA 19 4.86 7.62 24.33 24.46 38.31 11.03 ‐10.00 0.00 10.00 20.00 30.00 40.00 50.00 2010Y 2011Y 2012Y 2013Y 2014Y MRQ Asset Growth (%) Howard Peer Median Peer Average 72.02 70.45 74.93 74.45 77.54 80.40 60.00 65.00 70.00 75.00 80.00 85.00 2010Y 2011Y 2012Y 2013Y 2014Y 2015Q1 Efficiency Ratio (%) Howard Peer Median Peer Average 4.01 4.37 3.98 3.93 3.97 4.13 3.20 3.40 3.60 3.80 4.00 4.20 4.40 4.60 2010Y 2011Y 2012Y 2013Y 2014Y 2015Q1 Net Interest Margin (%) Howard Peer Median Peer Average 0.31 0.45 0.45 0.46 1.87 0.38 ‐0.50 0.00 0.50 1.00 1.50 2.00 2010Y 2011Y 2012Y 2013Y 2014Y 2015Q1 ROAA (%) Howard Peer Median Peer Average Source: SNL Financial based on SEC data. Peers consist of MD‐based banks with assets between $200 million and $800 million. 2014 net income included several one‐time non‐recurring items including the bargain purchase gain of $16.1 million, pre‐tax, related to the FDIC assisted transaction
On March 3, 2015, Howard announced that it entered into an agreement to merge with Patapsco Bancorp, Inc., headquartered in Dundalk, Maryland. Patapsco had approximately $226 million in assets, $171 million in loans, and $184 million in deposits at December 31, 2014 and operates three banking offices in Baltimore County and one in Baltimore City Howard also announced that it received binding commitments to purchase an aggregate of 2,173,913 shares of its common stock at $11.50 per share for $25 million, in a private placement, from a limited number of well regarded institutional bank investors including T. Rowe Price, Alliance Bernstein, EJF Financial Services, Endeavour, Manulife, Siena Capital and Stieven Financial which is scheduled to close on June 2, 2015, subject to shareholder approval The issuance price represents the closing price on the day the offering was commenced and less than a 10% discount 20‐day average at announcement. Howard’s stock price has since increased to $14.00 per share After giving pro forma effect to the Patapsco acquisition and the net proceeds from the $25 million common equity raise, Howard expects at December 31, 2015 total assets of approximately $1 billion, loans of $825 million, deposits of $830 million and tangible common equity of roughly $77 million* In addition, Howard’s legal lending limit will increase $3.5 million following the completion of the common equity raise to near $13 million 20 Capital Raise Funds a Portion of Patapsco Acquisition and Platform for Further Organic and Acquired Growth * See Form 8‐K filed on March 3, 2015
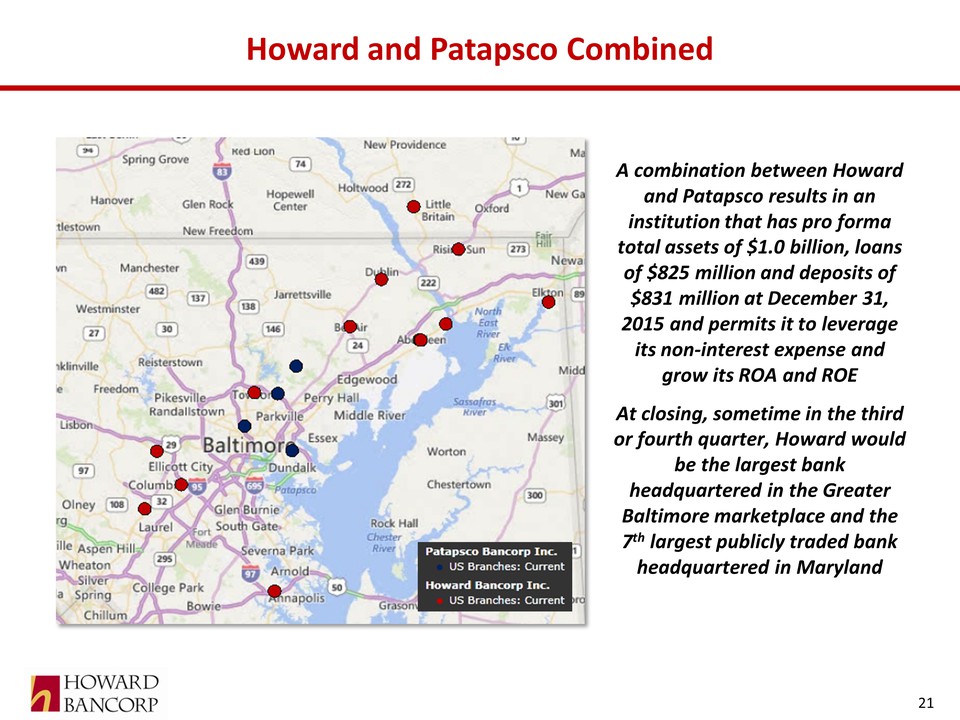
Howard and Patapsco Combined A combination between Howard and Patapsco results in an institution that has pro forma total assets of $1.0 billion, loans of $825 million and deposits of $831 million at December 31, 2015 and permits it to leverage its non‐interest expense and grow its ROA and ROE At closing, sometime in the third or fourth quarter, Howard would be the largest bank headquartered in the Greater Baltimore marketplace and the 7th largest publicly traded bank headquartered in Maryland 21
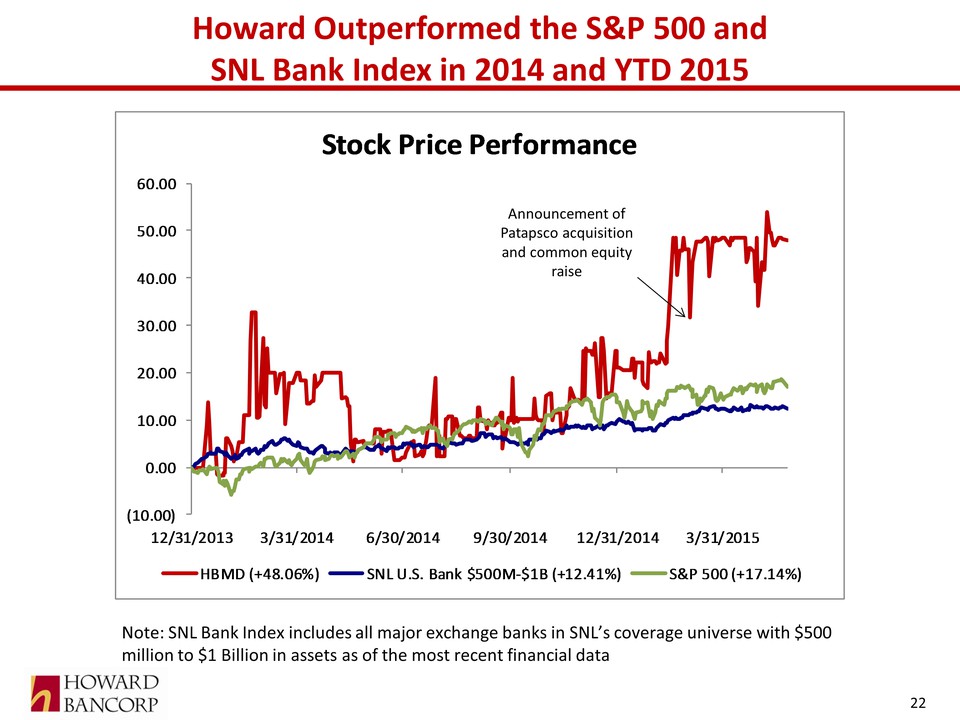
Howard Outperformed the S&P 500 and SNL Bank Index in 2014 and YTD 2015 Note: SNL Bank Index includes all major exchange banks in SNL’s coverage universe with $500 million to $1 Billion in assets as of the most recent financial data 22 (10.00) 0.00 10.00 20.00 30.00 40.00 50.00 60.00 12/31/2013 3/31/2014 6/30/2014 9/30/2014 12/31/2014 3/31/2015 Stock Price Performance HBMD (+48.06%) SNL U.S. Bank $500M‐$1B (+12.41%) S&P 500 (+17.14%) Announcement of Patapsco acquisition and common equity raise
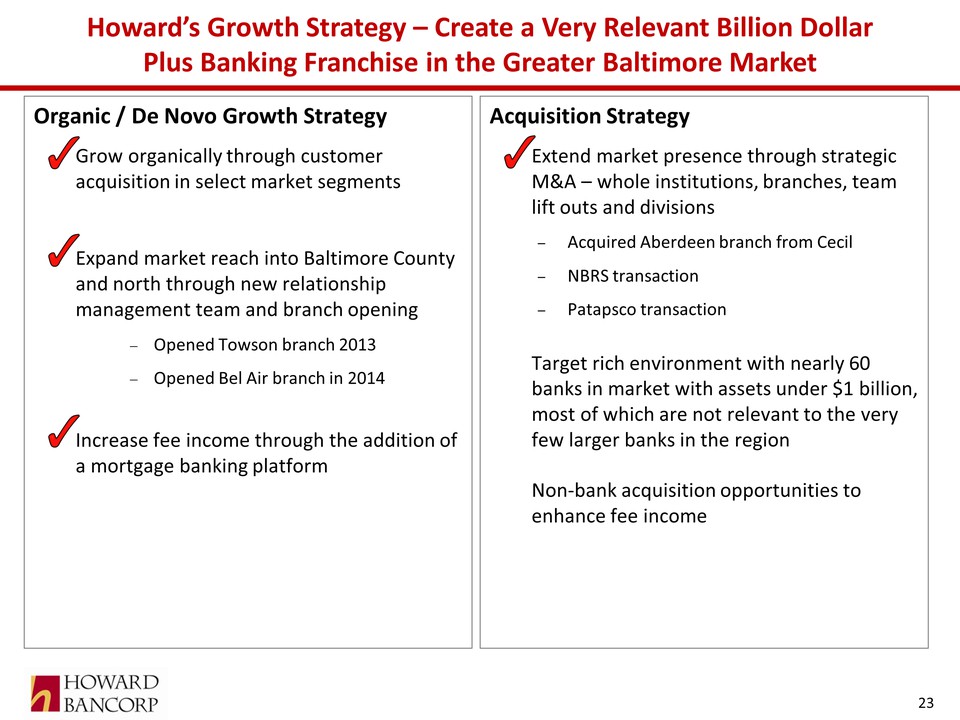
Howard’s Growth Strategy – Create a Very Relevant Billion Dollar Plus Banking Franchise in the Greater Baltimore Market Organic / De Novo Growth Strategy Grow organically through customer acquisition in select market segments Expand market reach into Baltimore County and north through new relationship management team and branch opening Opened Towson branch 2013 Opened Bel Air branch in 2014 Increase fee income through the addition of a mortgage banking platform Acquisition Strategy Extend market presence through strategic M&A – whole institutions, branches, team lift outs and divisions – Acquired Aberdeen branch from Cecil – NBRS transaction – Patapsco transaction Target rich environment with nearly 60 banks in market with assets under $1 billion, most of which are not relevant to the very few larger banks in the region Non‐bank acquisition opportunities to enhance fee income 23
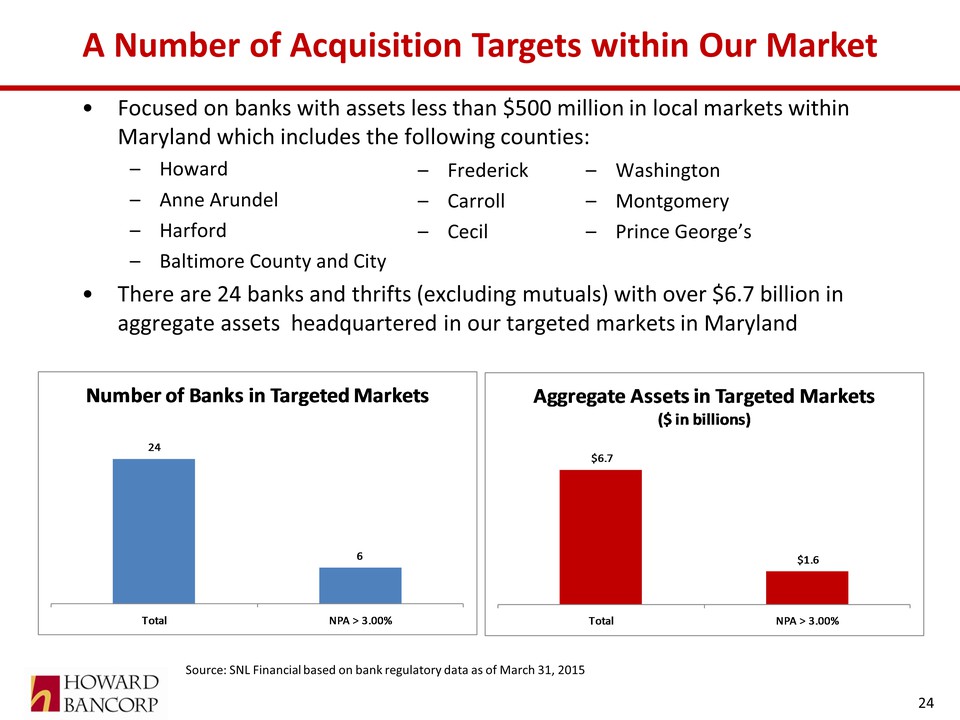
A Number of Acquisition Targets within Our Market 24 Focused on banks with assets less than $500 million in local markets within Maryland which includes the following counties: – Howard – Anne Arundel – Harford – Baltimore County and City There are 24 banks and thrifts (excluding mutuals) with over $6.7 billion in aggregate assets headquartered in our targeted markets in Maryland Source: SNL Financial based on bank regulatory data as of March 31, 2015 – Frederick – Carroll – Cecil – Washington – Montgomery – Prince George’s 24 6 Total NPA > 3.00% Number of Banks in Targeted Markets $6.7 $1.6 Total NPA > 3.00% Aggregate Assets in Targeted Markets ($ in billions)
Summary Howard has focused on sustainable growth – balance sheet, capital, revenue and earnings – since its inception, and has performed well during the financial crisis, and sluggish economic recovery – all without TBV or earnings dilution Competitively advantaged franchise in some of the most attractive markets in the nation with a balanced business mix and a moderate credit risk profile Diversified revenue streams bode well for future returns SEC registration, NASDAQ listing, growing market cap bode well for shareholder returns and eventual liquidity Howard is committed to further growth – organic and acquired – to achieve the size and scale sufficient to continue to generate superior returns for its investors notwithstanding the still sluggish state of the national and regional economies, Dodd Frank, and competitive pressures There are few‐to‐none “Greater Baltimore” based banks with the capital and size and scale as Howard’s There are a number of additional potential partners in the Greater Baltimore‐market Howard is well on its way to fill the current void in the marketplace by building a super regional “Greater Baltimore” bank via both organic growth and acquisition and achieving its strategic objectives 25