Attached files
| file | filename |
|---|---|
| 8-K - FORM 8-K - Commercial Vehicle Group, Inc. | d930582d8k.htm |
 CVG
Investor Presentation
May
2015
We Make Better
Possible.
Richard
Lavin
President
and
CEO
Tim
Trenary
Chief
Financial
Officer
PRESENTERS:
Patrick
Miller
President-
Global
Truck
&
Bus
Exhibit 99.1 |
 Forward
Looking Statement This
presentation
contains
forward-looking
statements
that
are
subject
to
risks
and
uncertainties.
These
statements
often
include
words
such
as
"believe,"
"expect,"
"anticipate,"
"intend,"
"plan,"
"estimate,"
or
similar
expressions.
In
particular,
this
press
release
may
contain
forward-looking
statements
about
Company
expectations
for
future
periods
with
respect
to
its
plans
to
improve
financial
results
and
enhance
the
Company,
the
future
of
the
Company’s
end
markets,
Class
8
North
America
build
rates,
performance
of
the
global
construction
equipment
business,
expected
cost
savings,
enhanced
shareholder
value
and
other
economic
benefits
of
the
consulting
services,
the
Company’s
initiatives
to
address
customer
needs,
organic
growth,
the
Company’s
economic
growth
plans
to
focus
on
certain
segments
and
markets
and
the
Company’s
financial
position
or
other
financial
information.
These
statements
are
based
on
certain
assumptions
that
the
Company
has
made
in
light
of
its
experience
in
the
industry
as
well
as
its
perspective
on
historical
trends,
current
conditions,
expected
future
developments
and
other
factors
it
believes
are
appropriate
under
the
circumstances.
Actual
results
may
differ
materially
from
the
anticipated
results
because
of
certain
risks
and
uncertainties,
including
but
not
limited
to:
(i)
general
economic
or
business
conditions
affecting
the
markets
in
which
the
Company
serves;
(ii)
the
Company's
ability
to
develop
or
successfully
introduce
new
products;
(iii)
risks
associated
with
conducting
business
in
foreign
countries
and
currencies;
(iv)
increased
competition
in
the
medium
and
heavy-duty
truck,
construction,
aftermarket,
military,
bus,
agriculture
and
other
markets;
(v)
the
Company’s
failure
to
complete
or
successfully
integrate
strategic
acquisitions;
(vi)
the
impact
of
changes
in
governmental
regulations
on
the
Company's
customers
or
on
its
business;
(vii)
the
loss
of
business
from
a
major
customer
or
the
discontinuation
of
particular
commercial
vehicle
platforms;
(viii)
the
Company’s
ability
to
obtain
future
financing
due
to
changes
in
the
lending
markets
or
its
financial
position;
(ix)
the
Company’s
ability
to
comply
with
the
financial
covenants
in
its
revolving
credit
facility;
(x)
the
Company’s
ability
to
realize
the
benefits
of
its
cost
reduction
and
strategic
initiatives;
(xi)
a
material
weakness
in
our
internal
control
over
financial
reporting
which
could,
if
not
remediated,
result
in
material
misstatements
in
our
financial
statements;
(xii)
volatility
and
cyclicality
in
the
commercial
vehicle
market
adversely
affecting
us;
and
(xiii)
various
other
risks
as
outlined
under
the
heading
"Risk
Factors"
in
the
Company's
Annual
Report
on
Form
10-K
for
fiscal
year
ending
December
31,
2014.
There
can
be
no
assurance
that
statements
made
in
this
presentation
relating
to
future
events
will
be
achieved.
The
Company
undertakes
no
obligation
to
update
or
revise
forward-looking
statements
to
reflect
changed
assumptions,
the
occurrence
of
unanticipated
events
or
changes
to
future
operating
results
over
time.
All
subsequent
written
and
oral
forward-looking
statements
attributable
to
the
Company
or
persons
acting
on
behalf
of
the
Company
are
expressly
qualified
in
their
entirety
by
such
cautionary
statements. |
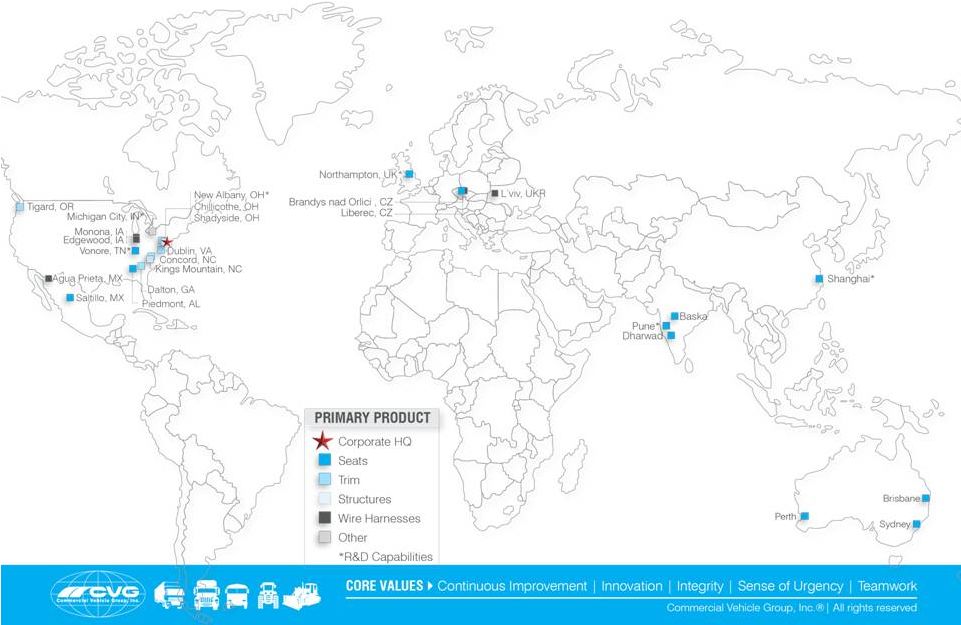 Our
Global Footprint pg | 2 |
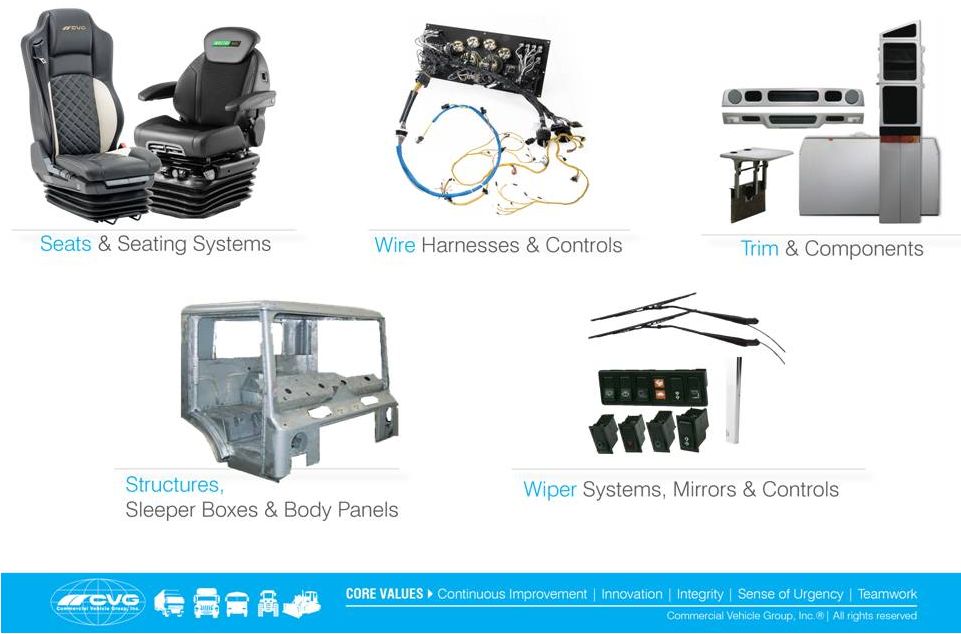 Our
Products pg | 3 |
 2014
Sales pg | 4
Product
End Market
Customer
Region
CVG At a Glance |
 pg
| 5 Vision |
 Drive
Profitable Organic Growth •
We will invest in products and capabilities that will
strengthen our right-to-win with our core products in our
end markets
•
We intend to achieve sales and earnings targets
commensurate with companies delivering top quartile
total shareholder returns
•
We will consider opportunistic acquisitions to address
gaps in our product portfolio and to enhance serving our
end markets & customers
pg | 6
Strategy |
 •
Focus on core, value accretive businesses
•
Prioritize investment in core products
•
Hire and develop difference-making talent
across the product lines
–
Product line management
–
Engineers
–
Sales
–
Manufacturing management
•
Build / enhance our right to win
–
Design and engineer innovative products
–
Next generation product plans
–
Global supply chain management
–
Operational excellence / Lean Six Sigma
•
CVG Sales Playbook
–
OEM coverage / participation / closure
plans at customer product family, product,
and program level
–
“Sell the House”
•
Better support our customers globally
Prioritize Opportunities | Focus on Core Products |
Drive Disciplined Execution
CVG Business Portfolio
Regions, End Markets and Products
Action Plan for Core Products
Strategy
pg | 7
REGIONS
REGIONS
END
MARKETS
CORE PRODUCTS
COMPLEMENTARY
PRODUCTS
NA
NA
Seats
Trim
Wire
Harnesses
Mirrors
Office Seats
Structures
Wipers
Truck
X
X
Construction
X
X
X
Agriculture
X
X
X
Bus
X
X
Aftermarket
X
X
EMEA
EMEA
Truck
X
Construction
X
X
Agriculture
X
X
Bus
X
Aftermarket
X
APAC
APAC
Truck
X
X
Construction
X
X
Agriculture
X
X
Bus
X
X
Aftermarket
X |
 CVG
has about 5% share of the addressable market – significant opportunity
to drive profitable organic growth across our end markets and penetrate our
addressable market with current products
•
Available Market
1
| $27B
•
Addressable Market
2
| $13B
Source:
Company data, LMC + Millmark research reports
1
Available market = Universe of applications / platforms available for product
portfolio 2
Addressable market = Subset of available market for which products are currently
available or product plans are in place 3
Does not include approximately $131M in sales of complementary products
Market Share
Our Opportunity is Significant
pg | 8 |
 Business Segments
•
Global Truck & Bus
–
Strong medium-
and heavy-duty truck production in North
America
o
Manufacturing capacity to meet production levels
–
Revenues in Q1 2015 up 20% over prior year quarter
–
Operating income of $14.1 million in Q1 2015 vs. $8.3 million
in prior year quarter
–
New Business –
Navistar NGV platform ($10 -
$15M per year)
•
Global Construction & Agriculture
–
Markets we serve were flat to down period over period
–
Revenues down 2% -
impacted negatively by Fx translation
–
Operating income was $3.6 million for current and prior year
periods
pg | 9 |
 Sales
and Adjusted Operating Income Margin Selected Financial Results
|
 1
2014 to 2020
2
EBITDA, as may be adjusted from time-to-time for special items (such as
asset impairments, restructuring, etc.) 3
Sample of 360 Fortune 500 companies for some part of the period 2004 to 2014 for
which share prices are available CVG 2020 Financial Objectives
pg | 11
Compound Annual Growth Rate
1
13% –
17%
6% –
8%
Sales
Sales
EBITDA
2
Top Quartile Total Shareholder Return
(Correlation to ~13% EBITDA CAGR
3
)
Financial |
 OPACC
Operating Profit After Capital Charge
•
Positive OPACC = Value Creation
•
Negative OPACC = Value Erosion
•
Higher profit without corresponding
asset growth
•
Reduce assets without
corresponding profit drop
•
Allocate capital investment based
on project OPACC
•
Positive OPACC = Value Creation
•
Negative OPACC = Value Erosion
•
Higher profit without corresponding
asset growth
•
Reduce assets without
corresponding profit drop
•
Allocate capital investment based
on project OPACC
Operating Profit (EBIT)
Less: Capital Charge
Operating Asset
Base
Cost of Capital
x
pg | 12
Financial |
 Managing Through the Cycle
•
Playbook for down and up
cycles
•
Consistent execution lends to
credibility
pg | 13
Financial
What Does
That Mean
Objective |
 Senior Secured Notes
Principal Balance
$ 250
Interest
7.875%
Due
Apr 2019
Asset Based Credit Facility
Commitment
$ 40
Availability
$ 37
Letters of Credit
$ 3
Accordion Option
$ 35
Agency Rating / Outlook
Moodys
B2 | Stable
S&P
B | Stable
LTM
2013
2014
Q1 2015
Cash
$ 73
$ 72
$ 81
Debt
250
250
250
Net Debt
$ 177
$ 178
169
EBITDA
$ 27
$ 52
58
Leverage:
Debt / EBITDA
9.3x
4.8x
4.3x
Net Debt /
EBITDA
6.6x
3.4x
2.9x
Capital Structure / Leverage
($ in millions)
pg | 14
See
appendix
for
reconciliation
of
GAAP
to
non-GAAP
financial
measures
–
EBITDA
reconciliation
Financial |
 Appendix |
 pg | 16
Reconciliation of GAAP To Non-GAAP Financial
Measures
Adjusted Operating Income Reconciliation
TOT_CVG_LOB
Q1 2013
Q2 2013
Q3 2013
Q4 2013
Q1 2014
Q2 2014
Q3 2014
Q4 2014
Q1 2015
(Dollars in thousands, except margin)
Sales
177,822
198,909
187,942
183,045
198,071
215,996
213,802
211,874
220,303
Cost of Sales
159,737
176,035
169,852
162,364
173,767
187,811
185,376
185,101
191,229
Gross Profit
18,085
22,874
18,090
20,681
24,304
28,185
28,426
26,773
29,074
% Sales
10.2%
11.5%
9.6%
11.3%
12.3%
13.0%
13.3%
13.5%
13.5%
SGA
17,949
20,339
21,135
12,288
18,472
18,748
18,333
16,926
17,540
Amortization
409
404
383
384
384
390
388
353
336
Operating Income
(273)
2,131
(3,428)
8,009
5,448
9,047
9,705
9,494
11,198
Operating Income Margin
(0.2)%
1.1%
(1.8)%
4.4%
2.8%
4.2%
4.5%
4.5%
5.1%
2013 Special Items
Reduction in Force
1,800
Third Party Consulting
2,800
Asset Impairment
2,700
CEO Change
2,500
2014 Special Items
Plant Closures
500
100
200
500
Loss on Sale of Building
800
2015 Special Items
Plant Closures
700
Adjusted Operating Income
(273)
4,631
3,872
8,009
6,748
9,147
9,905
9,994
11,898
Adjusted Operating Income
(0.2)%
2.3%
2.1%
4.4%
3.4%
4.2%
4.6%
4.7%
5.4% |
 pg | 17
EBITDA Reconciliation
Reconciliation of GAAP To Non-GAAP Financial
Measures
LTM
2013
2014
Q1 2015
$(000’s)
Operating Income
6,439
33,694
39,444
Depreciation
19,001
16,732
16,835
Amortization
1,580
1,515
1,467
EBITDA
27,020
51,941
57,746 |