Attached files
| file | filename |
|---|---|
| 8-K - TAIWAN FUND INC | fp0014469_8k.htm |

Investment objective
The Fund's investment objective is to seek long-term capital appreciation primarily through investments in equity securities listed in Taiwan.
|
Fund facts
|
(as at 04/30/15)
|
|
Net asset value per share
|
$19.78
|
|
Market price
|
$17.66
|
|
Premium/discount
|
-10.72%
|
|
Total net assets
|
$ 162.71 m
|
|
Market cap
|
$ 145.24 m
|
|
Fund statistics
|
|
|
Investment adviser (date of appointment)
|
JF International Management, Inc. (07/22/14)
|
|
Fund manager
|
Shumin Huang
|
|
Listed
|
NYSE
|
|
Launch date
|
12/23/86
|
|
Shares outstanding
|
8,224,330
|
|
Last dividend (Ex-dividend date)
|
$2.6332 (December 26, 2014)
|
|
Benchmark
|
TAIEX Total Return Index
|
|
Fund codes
|
|
|
Bloomberg
|
TWN
|
|
Sedol
|
286987895
|
|
CUSIP
|
874036106
|
|
ISIN
|
US8740361063
|
|
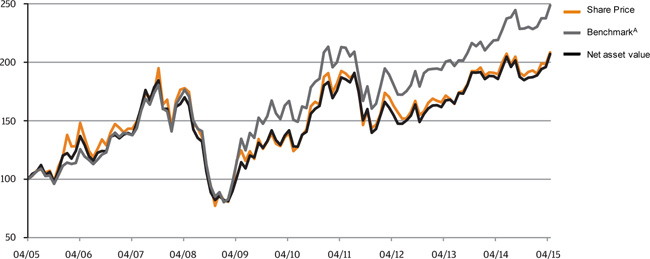
10 year performance data
|
(as at 04/30/15)
|
|
Cumulative performance*
|
(as at 04/30/15)
|
||||||
|
%
|
1m
|
3m
|
YTD
|
1Y
|
3Y
|
5Y
|
10Y
|
|
The Taiwan Fund, Inc.
|
5.7
|
9.6
|
10.6
|
11.5
|
33.6
|
46.1
|
107.2
|
|
Market Price
|
5.1
|
9.6
|
8.0
|
9.8
|
28.0
|
49.7
|
108.6
|
|
TSE Index
|
4.7
|
7.9
|
8.9
|
10.1
|
24.8
|
25.5
|
72.3
|
|
TAIEX Total Return IndexA
|
4.7
|
7.9
|
8.9
|
13.5
|
37.4
|
49.0
|
148.7
|
|
MSCI Taiwan Index
|
4.5
|
7.5
|
8.6
|
16.1
|
37.8
|
47.8
|
102.9
|
|
Rolling 12 month performance*
|
(as at 04/30/15)
|
||||
|
%
|
2015/2014
|
2014/2013
|
2013/2012
|
2012/2011
|
2011/2010
|
|
The Taiwan Fund, Inc.
|
11.5
|
10.9
|
8.0
|
-17.1
|
31.9
|
|
Market Price
|
9.8
|
10.7
|
5.3
|
-15.4
|
38.3
|
|
TSE Index
|
10.1
|
6.2
|
6.8
|
-18.3
|
23.1
|
|
TAIEX Total Return IndexA
|
13.5
|
9.3
|
10.8
|
-15.0
|
27.6
|
|
MSCI Taiwan Index
|
16.1
|
7.5
|
10.4
|
-15.0
|
26.1
|
|
Top 10 holdings
|
(as at 04/30/15)
|
|
Holding
|
Fund %
|
|
Taiwan Semiconductor Manufacturing Co., Ltd.
|
9.3
|
|
Hon Hai Precision Industry Co., Ltd.
|
4.7
|
|
Fubon Financial Holding Co., Ltd.
|
4.1
|
|
Cathay Financial Holding Co., Ltd
|
3.7
|
|
Largan Precision Co., Ltd.
|
3.2
|
|
Nan Ya Pl astics Corp.
|
3.1
|
|
Catcher Technology Co., Ltd.
|
2.8
|
|
Formosa Plastics Corp.
|
2.8
|
|
Advanced Semiconductor Engineering, Inc.
|
2.8
|
|
CTBC Financial Holding Co., Ltd.
|
2.6
|
|
*
|
In US Dollar terms
|
|
A
|
TAIEX Total Return Index (prior to January 1, 2003, TAIEX Index)
|

|
Sector breakdown
|
(as at 04/30/15)
|
||
|
Sector
|
Fund %
|
Benchmark4
|
Deviation
|
|
Automobile
|
0.0%
|
1.8%
|
-1.8%
|
|
Biotechnology & Medical Care
|
0.0%
|
0.8%
|
-0.8%
|
|
Building Material & Construction
|
0.0%
|
1.9%
|
-1.9%
|
|
Cement
|
0.0%
|
1.2%
|
-1.2%
|
|
Chemical
|
0.6%
|
1.0%
|
-0.4%
|
|
Communications & Internet
|
1.7%
|
6.0%
|
-4.3%
|
|
Computer & Peripheral Equipment
|
6.7%
|
6.6%
|
0.1%
|
|
Electric & Machinery
|
7.0%
|
1.8%
|
5.2%
|
|
Electrical & Cable
|
0.0%
|
0.3%
|
-0.3%
|
|
Electronic Parts & Components
|
7.0%
|
4.4%
|
2.6%
|
|
Electronic Products Distribution
|
0.0%
|
0.9%
|
-0.9%
|
|
Financial & Insurance
|
16.8%
|
14.6%
|
2.2%
|
|
Foods
|
1.0%
|
1.7%
|
-0.7%
|
|
Glass & Ceramic
|
0.0%
|
0.2%
|
-0.2%
|
|
Information Service
|
0.0%
|
0.2%
|
-0.2%
|
|
Iron & Steel
|
0.0%
|
2.1%
|
-2.1%
|
|
Oil, Gas & Electricity
|
0.0%
|
2.9%
|
-2.9%
|
|
Optoelectronic
|
6.9%
|
4.5%
|
2.4%
|
|
Other
|
6.2%
|
3.5%
|
2.7%
|
|
Other Electronic
|
7.7%
|
7.0%
|
0.7%
|
|
Paper & Pulp
|
0.0%
|
0.3%
|
-0.3%
|
|
Plastics
|
7.2%
|
6.2%
|
1.0%
|
|
Rubber
|
0.0%
|
1.5%
|
-1.5%
|
|
Semiconductor
|
18.8%
|
22.3%
|
-3.5%
|
|
Shipping & Transportation
|
2.4%
|
2.0%
|
0.4%
|
|
Textiles
|
3.8%
|
2.1%
|
1.7%
|
|
Tourism
|
0.6%
|
0.5%
|
0.1%
|
|
Trading & Consumers' Goods
|
3.2%
|
1.7%
|
1.5%
|
|
Cash
|
2.4%
|
0.0%
|
2.4%
|
|
Overall Total
|
100.0%
|
100.0%
|
0.0%
|
Review
The TAIEX gained 2.4% month on month (MoM) in April to 9,820. For the first time in 15 years the TAIEX broke through the 10,000 mark on the back of strong foreign institutional buying, although the bullishness was not sustained as local institutions and government funds locked in profits. Market sentiment was boosted by speculation of Taipei and Shanghai establishing a stock trading link, which would be similar to Shanghai-Hong Kong Connect. China Securities Finance Corporation announced new Renminbi Foreign Qualified Institutional Investor (RQFII) measures to benefit Taiwan financial institutions investing in Chinese capital markets, which lifted the financial sector amid stronger than expected 1Q15 results. On the other hand, Taiwan Semiconductor Manufacturing Company (TSMC) led the cautious mode in the tech sector by revising down its 2Q15 outlook. The technology sector wrapped up April with a 0.4% MoM decline, with the semiconductor sector being sold-off in particular. The non-technology sector outperformed as plastics continued to spike-up driven by a recovery in crude oil prices. The Fund outperformed in the period.
Outlook
The breaching of the 10,000 psychological barrier level of the TAIEX was driven by the speculation of a Shanghai-Taipei Connect. However, any stock trading link is unlikely to be achieved in the near term given the complexity of the Cross-Strait relationship. For the TAIEX to reclaim the 10,000 level, it would require positive earnings revisions on account of a strong fundamental pickup. While the technology sector has generally expected a cautious 2Q15, it seems to be largely attributed to seasonal effects as most companies are expecting a strong recovery in 2H15. Fundamentals remain healthy and valuations are still relatively modest, which means the TAIEX still looks favorable in terms of risk/reward. TheFund remains overweight in technology, industrial and consumption and underweight in telecommunications and petrochemicals. Meanwhile, the Fund has gone overweight in financials.
|
Full portfolio holdings
|
(as at 04/30/15)
|
|
|
Holding
|
Market Value
USD |
Fund %
|
|
Semiconductor
|
30,638,143
|
18.8%
|
|
Taiwan Semiconductor Manufacturing Co., Ltd.
|
15,114,706
|
9.3%
|
|
Advanced Semiconductor Engineering, Inc.
|
4,502,932
|
2.8%
|
|
CHIPBOND Technology Corp.
|
2,163,750
|
1.3%
|
|
Novatek Microelectronics Corp. Ltd.
|
1,850,454
|
1.1%
|
|
ASPEED Technology, Inc.
|
1,190,613
|
0.7%
|
|
ILI Technology Corp.
|
1,141,775
|
0.7%
|
|
Nanya Technology Corp.
|
1,099,804
|
0.7%
|
|
MediaTek, Inc.
|
980,213
|
0.6%
|
|
Parade Technologies Ltd.
|
975,968
|
0.6%
|
|
Sino-American Silicon Products, Inc.
|
787,509
|
0.5%
|
|
Siliconware Precision Industries Co.
|
551,832
|
0.3%
|
|
Inotera Memories, Inc.
|
278,587
|
0.2%
|
|
Financial & Insurance
|
27,278,786
|
16.8%
|
|
Fubon Financial Holding Co., Ltd.
|
6,608,705
|
4.1%
|
|
Cathay Financial Holding Co., Ltd.
|
6,087,146
|
3.8%
|
|
CTBC Financial Holding Co., Ltd.
|
4,251,329
|
2.6%
|
|
China Development Financial Holding Corp.
|
3,807,066
|
2.3%
|
|
Mega Financial Holding Co., Ltd.
|
2,537,814
|
1.6%
|
|
China Life Insurance Co., Ltd.
|
2,344,381
|
1.4%
|
|
E. Sun Financial Holding Co., Ltd.
|
1,642,345
|
1.0%
|
|
Other Electronic
|
12,464,536
|
7.7%
|
|
Hon Hai Precision Industry Co., Ltd.
|
7,671,093
|
4.7%
|
|
Catcher Technology Co., Ltd.
|
4,537,321
|
2.8%
|
|
Chroma ATE, Inc.
|
256,122
|
0.2%
|
|
Plastics
|
11,641,990
|
7.2%
|
|
Nan Ya Plastics Corp.
|
5,021,665
|
3.1%
|
|
Formosa Plastics Corp.
|
4,536,763
|
2.8%
|
|
Formosa Chemicals & Fibre Corp.
|
2,083,563
|
1.3%
|
|
Electronic Parts & Components
|
11,421,478
|
7.0%
|
|
Delta Electronics, Inc.
|
3,733,103
|
2.3%
|
|
Zhen Ding Technology Holding Ltd.
|
3,235,225
|
2.0%
|
|
Kin g Slide Works Co., Ltd.
|
2,557,533
|
1.6%
|
|
Chen Uei Precision Industry Co., Ltd.
|
1,550,134
|
0.9%
|
|
Compeq Manufacturing Co., Ltd.
|
345,484
|
0.2%
|
|
Electric & Machinery
|
11,419,907
|
7.0%
|
|
Yeong Guan Energy Technology Group Co., Ltd.
|
2,785,649
|
1.7%
|
|
Hota Industrial Manufacturing Co., Ltd.
|
2,396,242
|
1.5%
|
|
Cub Elecparts, Inc.
|
1,742,100
|
1.1%
|
|
Iron Force Industrial Co., Ltd.
|
1,527,036
|
0.9%
|
|
Sumeeko Industries Co., Ltd.
|
1,348,394
|
0.8%
|
|
Yungtay Engineering Co., Ltd.
|
833,312
|
0.5%
|
|
Macauto Industrial Co., Ltd.
|
787,174
|
0.5%
|
|
Optoelectronic
|
11,307,734
|
6.9%
|
|
Largan Precision Co., Ltd.
|
5,229,544
|
3.2%
|
|
Innolux Corp.
|
2,607,2552
|
1.6%
|
|
Au Optronics Corp.
|
1,762,125
|
1.1%
|
|
TPK Holding Co., Ltd.
|
1,708,810
|
1.0%
|
|
Full portfolio holdings (cont'd)
|
||
|
Holding
|
Market Value
USD |
Fund %
|
|
Computer & Peripheral Equipment
|
10,867,398
|
6.7%
|
|
Pegatron Corp.
|
3,961,918
|
2.4%
|
|
Advantech Co., Ltd.
|
2,564,119
|
1.6%
|
|
Ennoconn Corp.
|
1,894,093
|
1.2%
|
|
Posiflex Technology, Inc.
|
1,206,916
|
0.7%
|
|
Axiomtek Co., Ltd.
|
786,946
|
0.5%
|
|
TSC Auto ID Technology Co., Ltd.
|
453,406
|
0.3%
|
|
Other
|
10,061,147
|
6.2%
|
|
Chailease Holding Co., Ltd.
|
2,496,144
|
1.5%
|
|
Pou Chen Corp.
|
2,406,504
|
1.5%
|
|
Ruentex Development Co., Ltd.
|
1,455,659
|
0.9%
|
|
Merida Industry Co., Ltd.
|
1,441,912
|
0.9%
|
|
Green Seal Holding Ltd.
|
1,295,246
|
0.8%
|
|
Sunspring Metal Corp.
|
517,426
|
0.3%
|
|
KMC Kuei Meng International, Inc.
|
448,247
|
0.3%
|
|
Textiles
|
6,198,524
|
3.8%
|
|
Eclat Textile Co., Ltd.
|
3,134,461
|
1.9%
|
|
Makalot Industrial Co., Ltd.
|
3,064,063
|
1.9%
|
|
Trading & Consumers' Goods
|
5,221,823
|
3.2%
|
|
President Chain Store Corp.
|
2,453,373
|
1.5%
|
|
Poya Co., Ltd.
|
2,042,694
|
1.3%
|
|
Taiwan FamilyMart Co., Ltd.
|
725,756
|
0.4%
|
|
Shipping & Transportation
|
3,871,942
|
2.4%
|
|
Eva Airways Corp.
|
1,474,550
|
0.9%
|
|
China Airlines Ltd.
|
1,423,176
|
0.9%
|
|
Evergreen Marine Corp Taiwan Ltd.
|
974,216
|
0.6%
|
|
Communications & Internet
|
2,693,779
|
1.7%
|
|
Wistron NeWeb Corp.
|
1,805,475
|
1.1%
|
|
Sercomm Corp.
|
888,304
|
0.6%
|
|
Foods
|
1,680,795
|
1.0%
|
|
Uni-President Enterprises Corp.
|
1,680,795
|
1.0%
|
|
Chemical
|
1,055,737
|
0.6%
|
|
China Steel Chemical Corp.
|
1,055,7371
|
0.6%
|
|
Tourism
|
983,739
|
0.6%
|
|
TTFB Co., Ltd.
|
983,739
|
0.6%
|
|
Cash
|
3,901,006
|
2.4%
|
|
Grand Total
|
162,708,465
|
100.0%
|
Source: MSCI. Neither MSCI nor any other party involved in or related to compiling, computing or creating the MSCI data makes any express of implied warranties or representations with respect to such data (or the results to be obtained by the use thereof), and all such parties hereby expressly disclaim all warranties of originality, accuracy, completeness, merchantability or fitness for a particular purpose with respect to any of such data. Without limiting any of the foregoing, in no event shall MSCI, any of its affiliates or any third party involved in or related to compiling computing or creating the data have any liability for any direct, indirect, special, punitive, consequential or any other damages (including lost profits) even if notified of the possibility of such damages. No further distribution or dissemination of the MSCI data is permitted without MSCI's express written consent.
Important Information
This document is issued and approved by JF International Management, Inc. ("JFIMI"), as investment advisor of The Taiwan Fund, Inc. (the 'Fund'). JFIMI is an investment advisor registered with the U.S. Securities and Exchange Commission. Certain information herein is believed to be reliable but has not been verified by JFIMI. JFIMI makes no representation or warranty and does not accept any responsibility in relation to such information or for opinion or conclusion which the reader may draw from this newsletter.
The Fund is classified as a diversified investment company under the US Investment Company Act of 1940 as amended. It meets the criteria of a closed end US fund and its shares are listed on the New York Stock Exchange. JFIMI has been appointed investment advisor to the Fund.
This newsletter does not constitute an offer of shares. Closed-end funds, unlike open-end funds, are not continuously offered. After the initial public offering, shares are bought and sold on the open market through a stock exchange. JFIMI, its ultimate and intermediate holding companies, subsidiaries, affiliates, clients, directors or staff may, at any time, have a position in the market referred to herein, and may buy or sell securities, currencies, or any other financial instruments in such markets. The information or opinion expressed in this newsletter should not be construed to be a recommendation to buy or sell any security, including the securities, commodities, currencies or financial instruments referred to herein.
Portfolio holdings are subject to change daily.
It should not be assumed that any of the securities transactions or holdings discussed here were or will prove to be profitable, or that the investment recommendations or decisions we make in the future will be profitable or will equal the investment performance of the securities discussed herein.
Investing in the Fund involves certain considerations in addition to the risks normally associated with making investments in securities. The value of the shares issued by the Fund, and the income from them, may go down as well as up and there can be no assurance that upon sale, or otherwise, investors will receive back the amount originally invested. There can be no assurance that you will receive comparable performance returns. Movements in foreign exchange rates may have a separate effect, unfavorable as well as favorable, on the gain or loss otherwise experienced on an investment. Past performance is not a guide to future returns. Accordingly, the Fund is only suitable for investment by investors who are able and willing to withstand the total loss of their investment. In particular, prospective investors should consider the following risks:
Discretionary investment is not risk-free. The past operating performance does not guarantee a minimum return for the discretionary investment fund. Apart from exercising the duty of care of a prudent adviser, JFIMI will not be responsible for the profit or loss of the discretionary investment fund, nor guarantee a minimum return.
| • | It should be noted that investment in the Fund is only suitable for sophisticated investors who are aware of the risk of investing in Taiwan and should be regarded as long term. Funds which invest in one country carry a higher degree of risk than those with portfolios diversified across a number of markets. |
| • | Investment in the securities of smaller and unquoted companies can involve greater risk than is customarily associated with investment in larger, more established, companies. In particular, smaller companies often have limited product lines, markets or financial resources and their management may be dependent on a smaller number of key individuals. In addition, the market for stock in smaller companies is often less liquid than that for stock in larger companies, bringing with it potential difficulties in acquiring, valuing and disposing of such stock. Proper information for determining their value, or the risks to which they are exposed, may not be available. |
| • | Investments within emerging markets such as Taiwan can be of higher risk. Many emerging markets, and the companies quoted on their stock exchanges, are exposed to the risks of political, social and religious instability, expropriation of assets or nationalization, rapid rates of inflation, high interest rates, currency depreciation and fluctuations and changes in taxation which may affect the Fund's income and the value of its investments. |
| • | The marketability of quoted shares may be limited due to foreign investment restrictions, wide dealing spreads, exchange controls, foreign ownership restrictions, the restricted opening of stock exchanges and a narrow range of investors. Trading volume may be lower than on more developed stock markets, and equities are less liquid. Volatility of prices can also be greater than in more developed stock markets. The infrastructure for clearing, settlement and registration on the primary and secondary markets may be undeveloped. Under certain circumstances, there may be delays in settling transactions in some of the markets. |