Attached files
| file | filename |
|---|---|
| 8-K - 8-K - JUNIATA VALLEY FINANCIAL CORP | v411281_8k.htm |
Exhibit 99.1

Juniata Valley Financial Corp. Annual Shareholders Meeting May 19, 2015
The presentation may contain “forward looking” information as defined by the Private Securities Litigation Reform Act of 1995 . When words such as “believes”, “expects”, “anticipates” or similar expressions are used in this release, Juniata Valley is making forward - looking statements . Such information is based on Juniata Valley’s current expectations, estimates and projections about future events and financial trends affecting the financial condition of its business . These statements are not historical facts or guarantees of future performance, events or results . Such statements involve potential risks and uncertainties and, accordingly, actual results may differ materially from this “forward looking” information . Many factors could affect future financial results . Juniata Valley undertakes no obligation to publicly update or revise forward looking information, whether as a result of new or updated information, future events, or otherwise . For a more complete discussion of certain risks and uncertainties affecting Juniata Valley, please see the sections entitled “Risk Factors” and “Management’s Discussion and Analysis of Financial Condition and Results of Operations – Forward - Looking Statements” set forth in the Juniata Valley’s filings with the Securities and Exchange Commission .

Chairman of the Board of Directors Timothy I. Havice

President and Chief Executive Officer Marcie A. Barber
Banking on the Future


The Future

What Future?
The Future of

Number of Financial Institutions In United States 12,329 10,945 9,510 8,564 7,871 7,510 7,072 6,279 5,865 0 2,000 4,000 6,000 8,000 10,000 12,000 14,000 1990 1993 1996 1999 2002 2005 2008 2011 2013 Source: FDIC
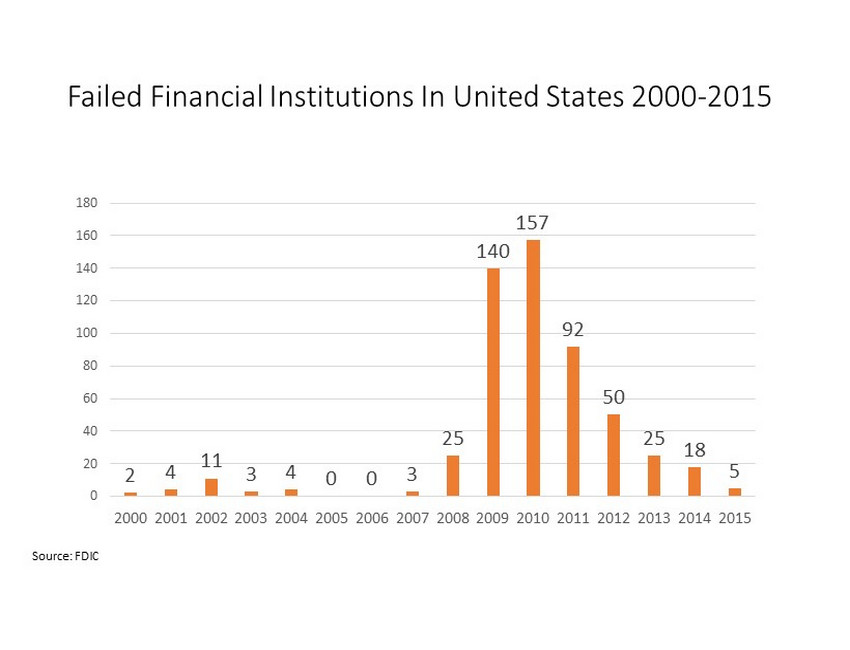
Failed Financial Institutions In United States 2000 - 2015 2 4 11 3 4 0 0 3 25 140 157 92 50 25 18 5 0 20 40 60 80 100 120 140 160 180 2000 2001 2002 2003 2004 2005 2006 2007 2008 2009 2010 2011 2012 2013 2014 2015 Source: FDIC

Executive Vice President and Chief Financial Officer JoAnn N. McMinn
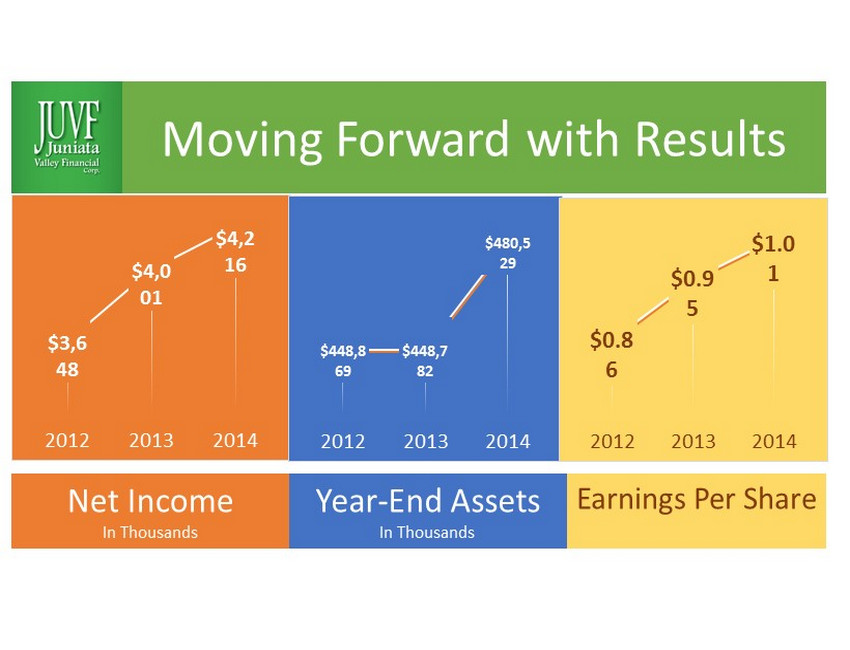
$3,6 48 $4,0 01 $4,2 16 2012 2013 2014 $448,8 69 $448,7 82 $480,5 29 2012 2013 2014 $0.8 6 $0.9 5 $1.0 1 2012 2013 2014 Net Income In Thousands Year - End Assets In Thousands Earnings Per Share Moving Forward with Results

For Year 2013 For Year 2014 Change Return on Average Assets 0.89% 0.90% 1.1% Return on Average Equity 8.07% 8.31% 3.0% Net Interest Margin (fully tax equivalent) 3.53% 3.48% (1.4)% Loan Loss Provision as % of Average Assets 0.09% 0.08% 11.1% Non - Interest Income (excludes securities gains) as % of Average Assets 0.94% 0.92% (2.1)% Non - Interest Expense (net of amortization of Low Income Housing Investment) as % of Average Assets 2.82% 2.78% 1.4% Low Income Housing Investment tax credit, net of after - tax amortization of investment as % of Average Assets 0.05% 0.05% Earnings per Share (Fully Diluted) $0.95 $1.01 6.3% Key Financial Ratios
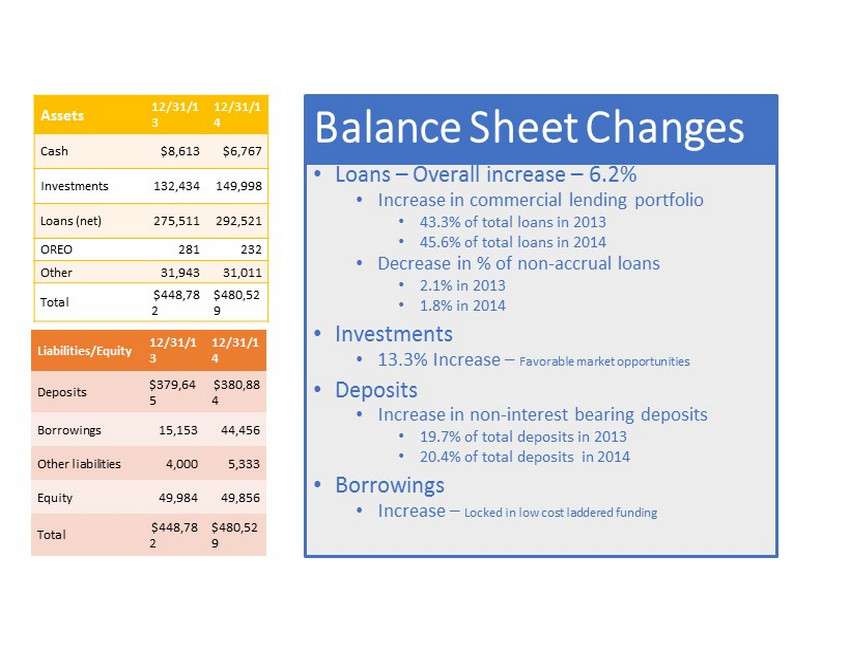
Balance Sheet Changes Assets 12/31/1 3 12/31/1 4 Cash $8,613 $6,767 Investments 132,434 149,998 Loans (net) 275,511 292,521 OREO 281 232 Other 31,943 31,011 Total $448,78 2 $480,52 9 • Loans – Overall increase – 6.2% • Increase in commercial lending portfolio • 43.3% of total loans in 2013 • 45.6% of total loans in 2014 • Decrease in % of non - accrual loans • 2.1% in 2013 • 1.8% in 2014 • Investments • 13.3% Increase – Favorable market opportunities • Deposits • Increase in non - interest bearing deposits • 19.7% of total deposits in 2013 • 20.4% of total deposits in 2014 • Borrowings • Increase – Locked in low cost laddered funding Liabilities/Equity 12/31/1 3 12/31/1 4 Deposits $379,64 5 $380,88 4 Borrowings 15,153 44,456 Other liabilities 4,000 5,333 Equity 49,984 49,856 Total $448,78 2 $480,52 9
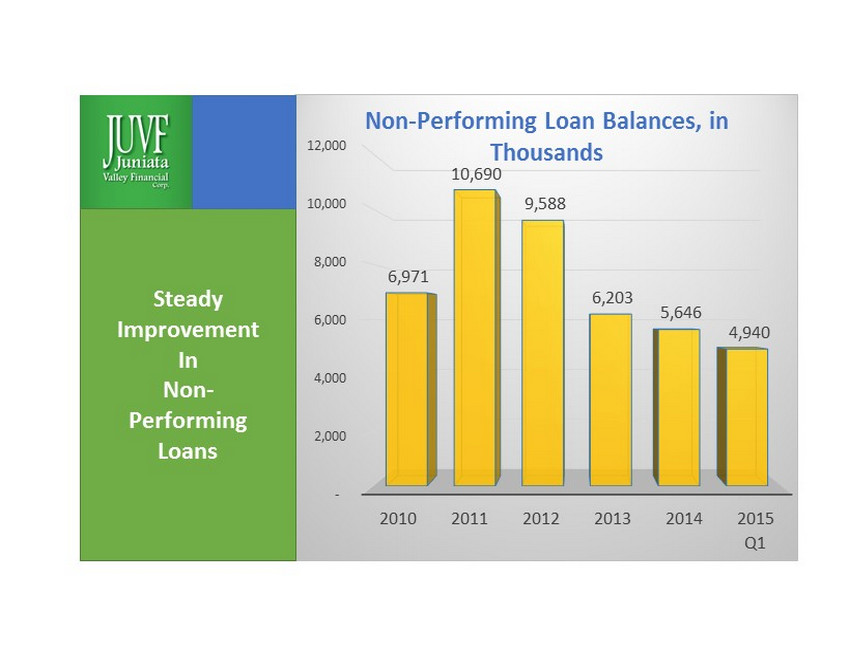
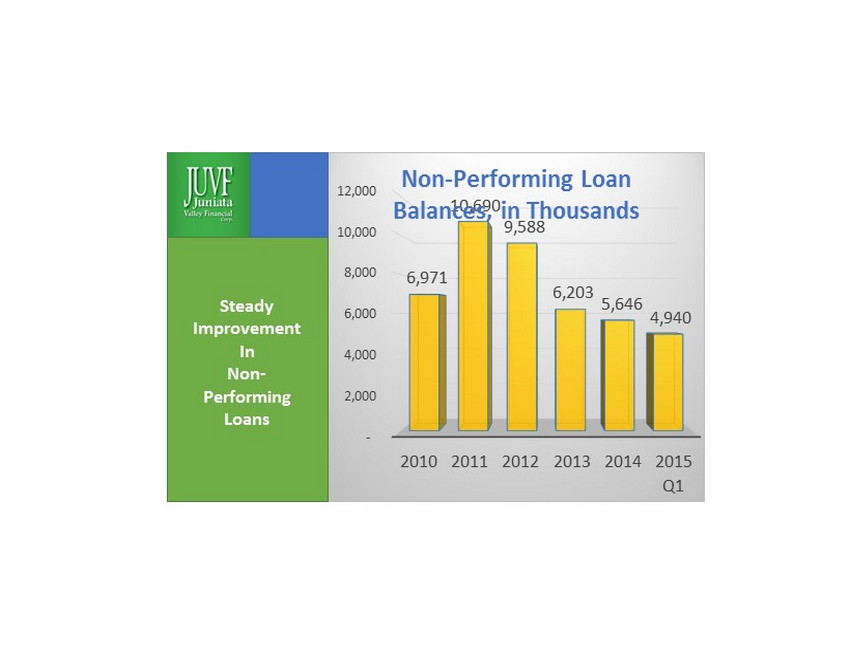
- 2,000 4,000 6,000 8,000 10,000 12,000 2010 2011 2012 2013 2014 2015 Q1 6,971 10,690 9,588 6,203 5,646 4,940 Non - Performing Loan Balances, in Thousands Steady Improvement In Non - Performing Loans

Q1 2014 Q1 2015 Change Return on Average Assets 0.81% 0.78% (3.7)% Return on Average Equity 7.17% 7.36% 2.6% Net Interest Margin (fully tax equivalent) 3.52% 3.50% (0.6)% Loan Loss Provision as % of Average Assets 0.02% 0.01% 50.0% Non - Interest Income (excludes securities gains) as % of Average Assets 0.82% 0.85% 3.7% Non - Interest Expense (net of amortization of Low Income Housing Investment) as % of Average Assets 2.89% 2.93% (1.4)% Low Income Housing Investment tax credit, net of after - tax amortization of investment as % of Average Assets 0.12% 0.05% Earnings per Share (Fully Diluted) $0.22 $0.22 - % Key Financial Ratios

Peer Group Comparison s Important to assess our performance against other financial institutions of our relative size who are experiencing similar regulatory and compliance governance.
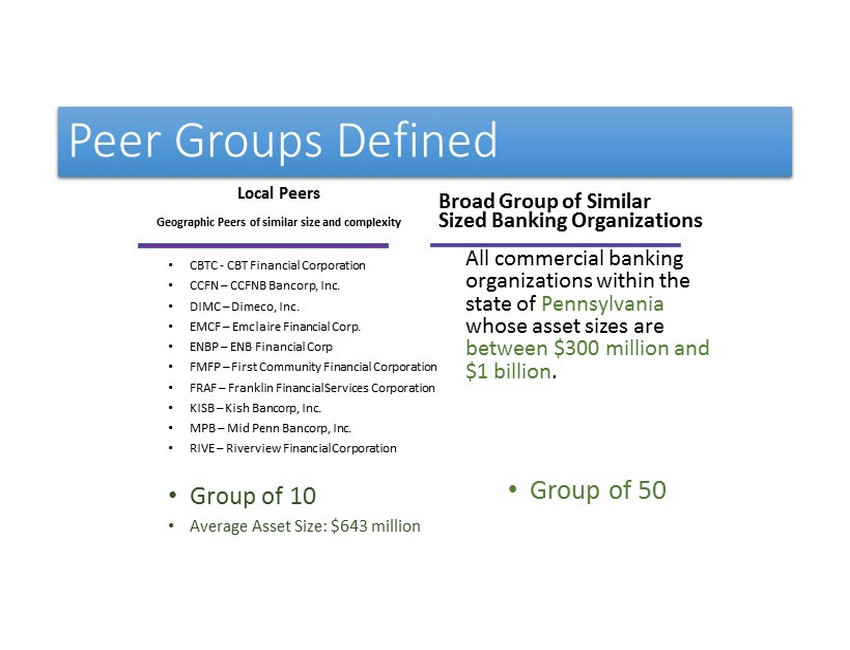
Peer Groups Defined Local Peers Geographic Peers of similar size and complexity • CBTC - CBT Financial Corporation • CCFN – CCFNB Bancorp, Inc. • DIMC – Dimeco, Inc. • EMCF – Emclaire Financial Corp. • ENBP – ENB Financial Corp • FMFP – First Community Financial Corporation • FRAF – Franklin Financial Services Corporation • KISB – Kish Bancorp, Inc. • MPB – Mid Penn Bancorp, Inc. • RIVE – Riverview Financial Corporation • Group of 10 • Average Asset Size: $643 million Broad Group of Similar Sized Banking Organizations All commercial banking organizations within the state of Pennsylvania whose asset sizes are between $300 million and $1 billion . • Group of 50

Performance Comparison Return on Average Assets 0.80% 0.89% 0.90% 0.82% 0.77% 0.81% 0.88% 0.79% 0.89% 2012 2013 2014 JUVF Local Peers PA Banking Corp Return on Average Equity 7.33% 8.07% 8.31% 8.72% 8.30% 8.68% 8.54% 7.86% 8.62% 2012 2013 2014 JUVF Local Peers PA Banking Corp Source: SNL Financial
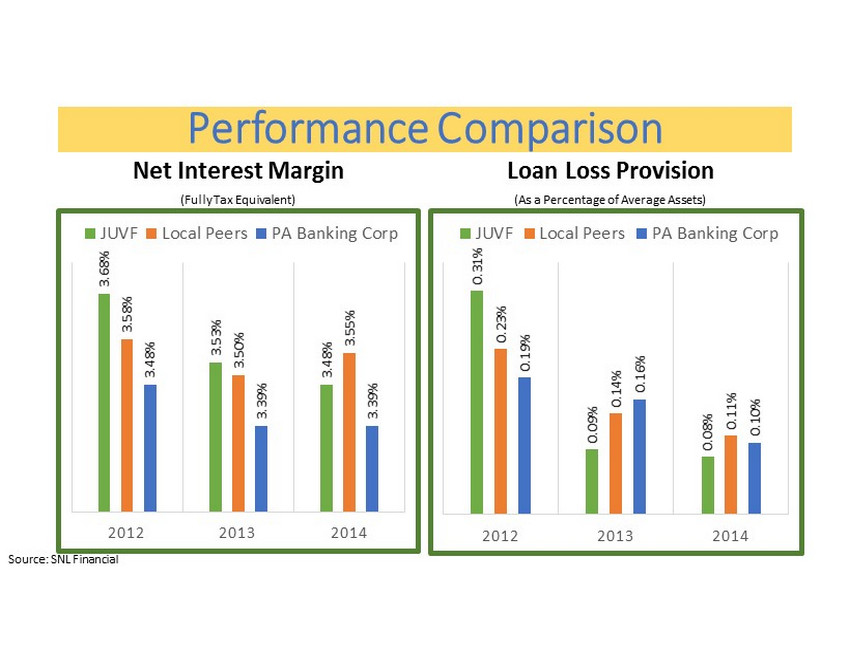
Performance Comparison Net Interest Margin (Fully Tax Equivalent) 3.68% 3.53% 3.48% 3.58% 3.50% 3.55% 3.48% 3.39% 3.39% 2012 2013 2014 JUVF Local Peers PA Banking Corp Loan Loss Provision (As a Percentage of Average Assets) 0.31% 0.09% 0.08% 0.23% 0.14% 0.11% 0.19% 0.16% 0.10% 2012 2013 2014 JUVF Local Peers PA Banking Corp Source: SNL Financial

Performance Comparison Non - Interest Income (As a Percentage of Average Assets) 0.94% 0.89% 0.82% 0.83% 0.78% 0.77% 0.66% 0.67% 0.61% 2012 2013 2014 JUVF Local Peers PA Banking Corp Non - Interest Expense (As a Percentage of Average Assets) 2.88% 2.92% 2.88% 2.84% 2.90% 2.88% 2.59% 2.63% 2.56% 2012 2013 2014 JUVF Local Peers PA Banking Corp Source: SNL Financial

Credit Quality Non - Performing Assets as % of Equity 18.44% 13.90% 11.79% 23.16% 21.69% 17.40% 18.81% 14.83% 13.55% 2012 2013 2014 JUVF Local Peers PA Banking Corp • High Focus on Reduction and Prevention of Non - Performing Assets. • Definition of Non - Performing Asset: • Loan that has been placed in non - accrual status • Accruing loan more than 90 days delinquent in scheduled payments • Troubled - debt restructure (TDR) in default • Value of property owned by the Bank as a result of loan foreclosures (Other Real Estate Owned – OREO) Source: SNL Financial
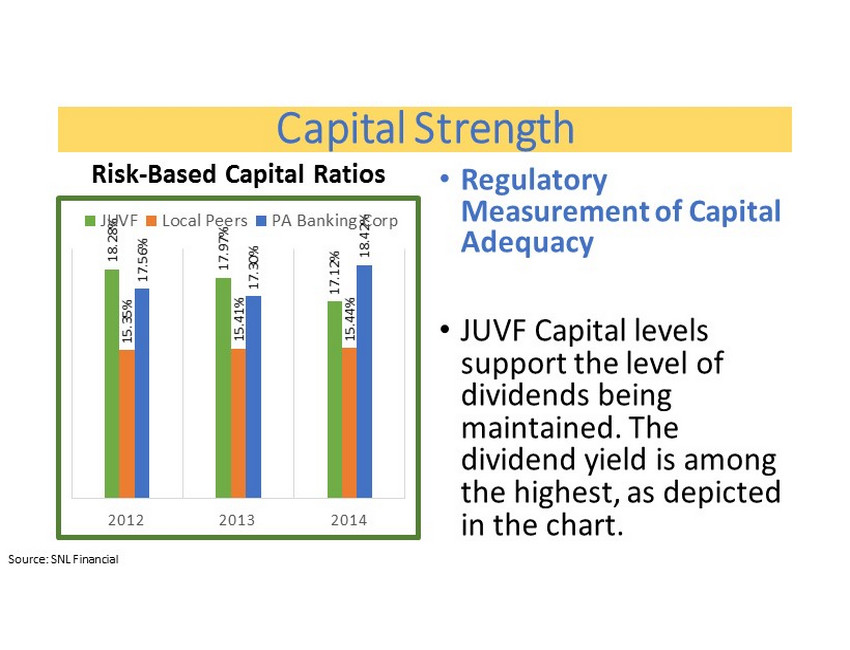
Capital Strength Risk - Based Capital Ratios 18.28% 17.97% 17.12% 15.35% 15.41% 15.44% 17.56% 17.30% 18.42% 2012 2013 2014 JUVF Local Peers PA Banking Corp • Regulatory Measurement of Capital Adequacy • JUVF Capital levels support the level of dividends being maintained. The dividend yield is among the highest, as depicted in the chart. Source: SNL Financial

Healthy Capital Supporting Dividend Level 4.82% 4.96% 4.82% 3.63% 3.51% 3.65% 2.83% 2.79% 2.82% 2012 2013 2014 JUVF Local Peers PA Banking Corp Source: SNL Financial 11.21% 11.14% 10.38% 9.51% 9.14% 9.59% 10.77% 10.71% 9.98% 2012 2013 2014 JUVF Local Peers PA Banking Corp Tangible Equity to Asset Ratio Dividend Yield

President and Chief Executive Officer Marcie A. Barber

Banking on the Future

Redesigning our Branches McAlisterville Office • Audio/Video efficiencies • Dual roles • Consultative sales Port Royal Office Millerstown, PA Port Royal, PA

Redesigning our Product Line • Peace of Mind • Value • Monitor • Detect • Repair
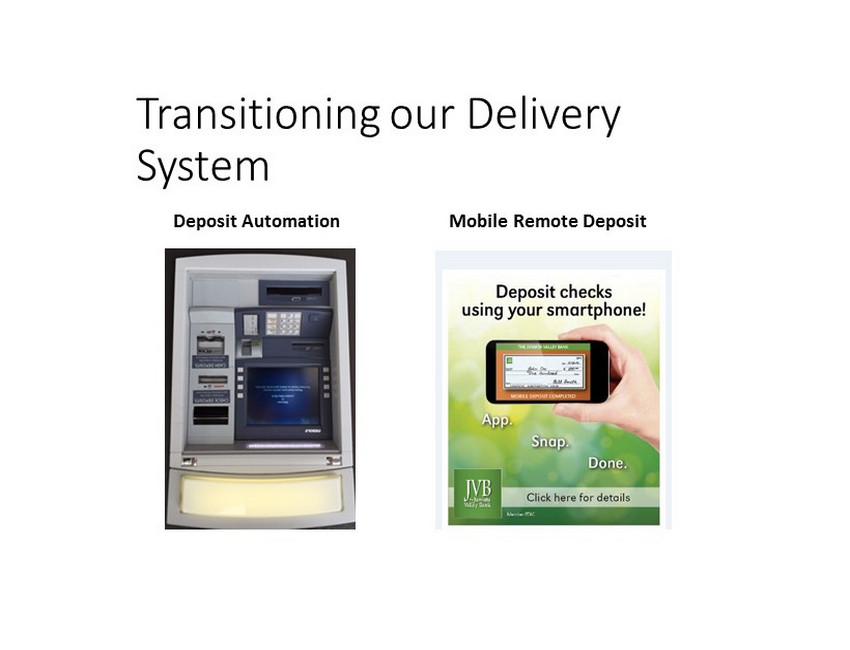
Transitioning our Delivery System Mobile Remote Deposit Deposit Automation

App Snap Done
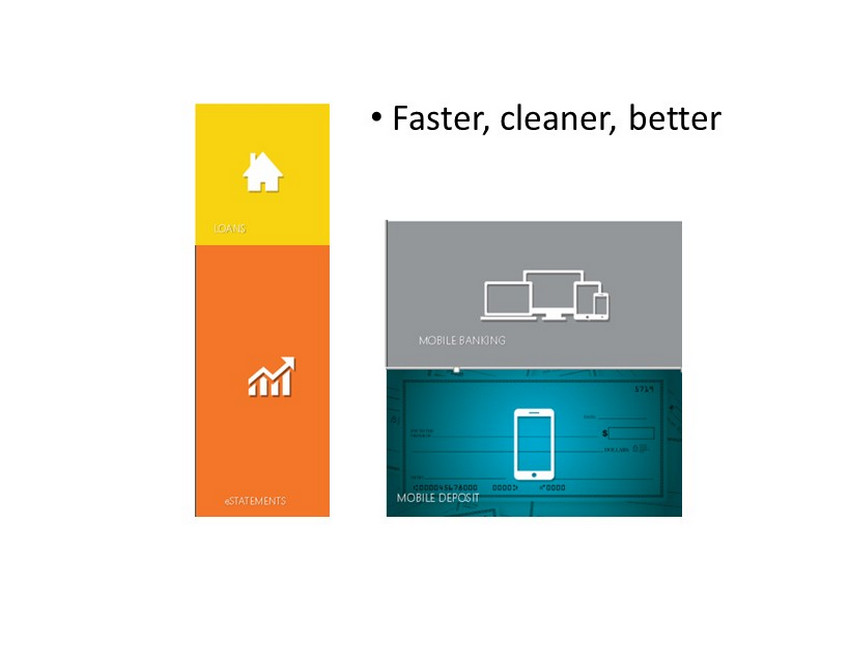
• Faster, cleaner, better

For Customers

Customer Resource Center

Banking on the Future

Failed Financial Institutions In United States 2000 - 2015 2 4 11 3 4 0 0 3 25 140 157 92 50 25 18 5 0 20 40 60 80 100 120 140 160 180 2000 2001 2002 2003 2004 2005 2006 2007 2008 2009 2010 2011 2012 2013 2014 2015 Source: FDIC?
- 2,000 4,000 6,000 8,000 10,000 12,000 2010 2011 2012 2013 2014 2015 Q1 6,971 10,690 9,588 6,203 5,646 4,940 Non - Performing Loan Balances, in Thousands Steady Improvement In Non - Performing Loans

Credit Quality Non - Performing Assets as % of Equity 18.44% 13.90% 11.79% 23.16% 21.69% 17.40% 18.81% 14.83% 13.55% 2012 2013 2014 JUVF Local Peers PA Banking Corp • High Focus on Reduction and Prevention of Non - Performing Assets. • Definition of Non - Performing Asset: • Loan that has been placed in non - accrual status • Loan that is accruing but is more than 90 days delinquent in scheduled payments • Performing loan that is a troubled - debt restructure (TDR) • Value of properties owned by the Bank as a result of loan foreclosures (Other Real Estate Owned – OREO)

Number of Financial Institutions In United States 12,329 10,945 9,510 8,564 7,871 7,510 7,072 6,279 5,865 0 2,000 4,000 6,000 8,000 10,000 12,000 14,000 1990 1993 1996 1999 2002 2005 2008 2011 2013 Source: FDIC

Things were Great 12,329 10,945 9,510 8,564 7,871 7,510 7,072 0 2,000 4,000 6,000 8,000 10,000 12,000 14,000 1990 1993 1996 1999 2002 2005 2008 Source: FDIC

2008 – 2013 --- Not so Great 2 4 11 3 4 0 0 3 25 140 157 92 50 25 18 5 0 20 40 60 80 100 120 140 160 180 2000 2001 2002 2003 2004 2005 2006 2007 2008 2009 2010 2011 2012 2013 2014 2015 Source: FDIC

6,279 – 5,865 = 414 Reduction in financial institutions over this 2 year period. 2011 2013 6,279 5,865

Failed Institutions over that period 2012 2013 50 25

Old Reasons • Succession Management • Liquidity • Regulatory Problems

New Reasons ● COSTS Regulation Security ● Changing Customer Base Technology Non Bank Competition ● Flat Yield Curve ● Slowly recovering economy

Banking on the Future

Performance Comparison Return on Average Assets 0.80% 0.89% 0.90% 0.82% 0.77% 0.81% 0.88% 0.79% 0.89% 2012 2013 2014 JUVF Local Peers PA Banking Corp Return on Average Equity 7.33% 8.07% 8.31% 8.72% 8.30% 8.68% 8.54% 7.86% 8.62% 2012 2013 2014 JUVF Local Peers PA Banking Corp Source: SNL Financial

Capital Strength Risk - Based Capital Ratios 18.28% 17.97% 17.12% 15.35% 15.41% 15.44% 17.56% 17.30% 18.42% 2012 2013 2014 JUVF Local Peers PA Banking Corp • Regulatory Measurement of Capital Adequacy • Capital to Support Growth • Earnings to Attract Investors • Positioned to Acquire • Committed to Community Banking Source: SNL Financial

2015 Community Impact Award Finalist Mann Edge Terrace II

Juniata Valley Financial Corp. Annual Meeting May 19, 2015