Attached files
| file | filename |
|---|---|
| 8-K - 8-K - Nationstar Mortgage Holdings Inc. | a8-kwellsfargoinvestorconf.htm |

Helping You Achieve More Wells Fargo Specialty Finance Conference Investor Presentation May 19, 2015

Disclaimers 1 Forward Looking Statements Any statements in this presentation that are not historical or current facts are forward looking statements. These forward looking statements include, but are not limited to, statements regarding: expected portfolio acquisitions, profitability of servicing segment, second quarter outlook, success of our 2015 key initiatives and focus areas and expectations regarding cash flow. Forward looking statements involve known and unknown risks, uncertainties and other factors that may cause our actual results, performance or achievements to be materially different from any future results, performance or achievements expressed or implied by the forward looking statements. Certain of these risks and uncertainties are described in the “Business” and “Risk Factors” sections of our most recent annual report and other required documents as filed with the SEC, which are available at the SEC’s website at http://www.sec.gov. Nationstar undertakes no obligation to publicly update or revise any forward looking statements or any other information contained herein, and the statements made in this presentation are current as of the date of this presentation only. Non-GAAP measures This presentation contains certain references to non-GAAP measures. Please refer to the Appendix and Endnotes for more information on non-GAAP measures.

Nationstar Overview 2 Nationstar (NYSE:NSM) is a publicly traded residential mortgage services company with a $2.2 billion market capitalization(1) 1) As of 5/15/15 2) Based on Q1’15 annualized originations 3) Based on Q1’15 annualized property sales 44% total share price return since IPO(1) Aim to earn strong consolidated adjusted cash flows Uniquely positioned to benefit from opportunities across the massive U.S. residential market $17B Originations(2) $2.2B Market Cap(1) $390B UPB servicing portfolio 266% UPB growth since IPO 22,000 Annual Property Sales(3) 44% Total share price return since IPO(1)
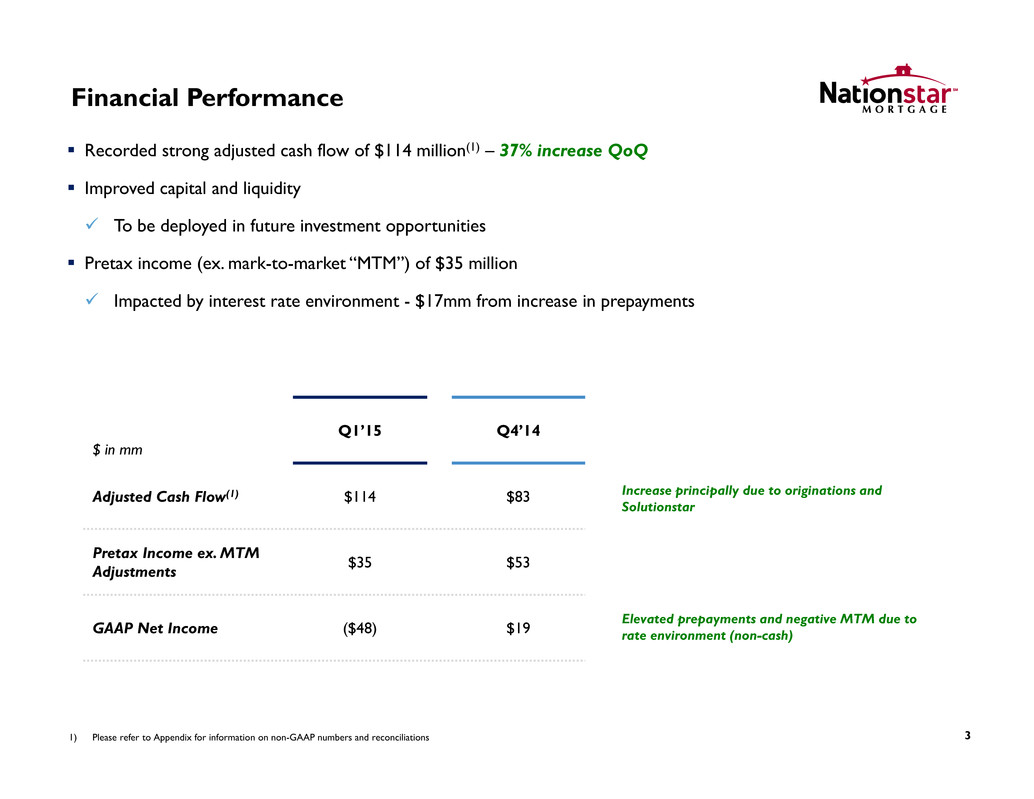
Financial Performance 3 Recorded strong adjusted cash flow of $114 million(1) – 37% increase QoQ Improved capital and liquidity To be deployed in future investment opportunities Pretax income (ex. mark-to-market “MTM”) of $35 million Impacted by interest rate environment - $17mm from increase in prepayments $ in mm Q1’15 Q4’14 Adjusted Cash Flow(1) $114 $83 Pretax Income ex. MTM Adjustments $35 $53 GAAP Net Income ($48) $19 1) Please refer to Appendix for information on non-GAAP numbers and reconciliations Elevated prepayments and negative MTM due to rate environment (non-cash) Increase principally due to originations and Solutionstar
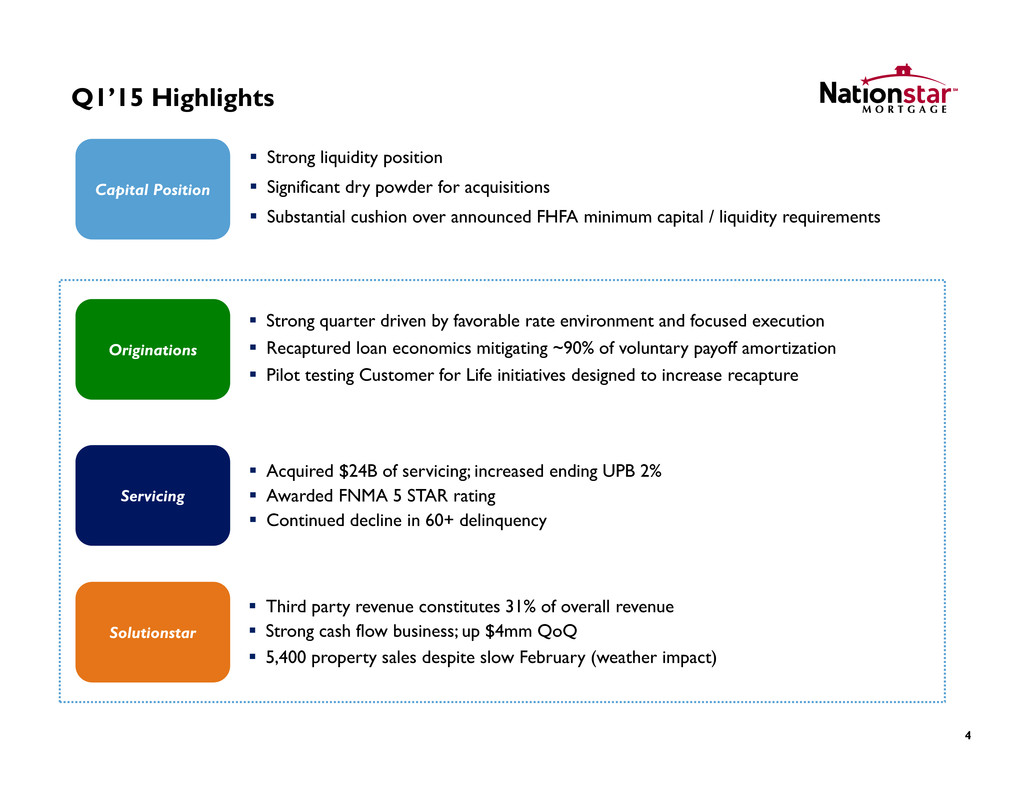
Q1’15 Highlights 4 Strong quarter driven by favorable rate environment and focused execution Recaptured loan economics mitigating ~90% of voluntary payoff amortization Pilot testing Customer for Life initiatives designed to increase recapture Servicing Originations Solutionstar Capital Position Acquired $24B of servicing; increased ending UPB 2% Awarded FNMA 5 STAR rating Continued decline in 60+ delinquency Third party revenue constitutes 31% of overall revenue Strong cash flow business; up $4mm QoQ 5,400 property sales despite slow February (weather impact) Strong liquidity position Significant dry powder for acquisitions Substantial cushion over announced FHFA minimum capital / liquidity requirements

Originations Highlights 5 Strong quarter driven by favorable rate environment and focused execution $4.2B in originations – up 17% QoQ Platform not dependent upon HARP (only 28% of volume) $59 million of pretax income – up 28% QoQ Recapture mitigated 90% of voluntary run-off economics; generated $22mm of cash Focused on increasing retention Key Metrics Q1’15 Q4’14 % QoQ Funded Volume ($B) $4.2 $3.6 +17% Pretax Income $59 $46 +28% Purchase % 24% 28% (14%) HARP % 28% 32% (13%) Customer SelectTM Pilot Focus on long term relationships vs. short term transactions Individualized market / property insights from RED High touch One Call Concierge service to ensure positive phone interactions Build awareness and affinity for the Nationstar brands Launched first test pilot in March; continue to refine the program to engage customers Strong Financial Results

Servicing Highlights Ending UPB of $390B, up 2% QoQ $52B of portfolio acquisition commitments(1) $31B closed QTD in Q2, remaining upon GSE approvals Strong adjusted cash flows of $110mm Rate environment during quarter impacted GAAP earnings, not cash flows Continued decline in 60+ delinquency to 8.8% Received FNMA 5-STAR rating for servicer performance 6 1) Commitments represent a signed LOI or definitive agreement, but the transaction has not yet closed 2) Pro forma for $31B in previously announced acquisitions expected to close in Q2’15; assumes ~14.0% CPR in Q2’15 Positioned to Benefit from Rising Rates $384 $378 $378 $381 $390 $407 Q1'14 Q2'14 Q3'14 Q4'14 Q1'15 Q2'15PF Portfolio Sustainability Demonstrated ability to sustain portfolio during periods of elevated CPR and slowed transfers Slower prepayments Lower DQs Lower cost to service Reduced advance balances Extended duration of cash flows and increased profitability (2) ($ in B)

Estimated MSR MTM & Recapture Sensitivity 1) Assumes parallel interest rate shocks 7 Recapture SensitivityMSR MTM Sensitivity Interest Rates $ in millions 25 bps increase(1) 50 bps increase(1) Mortgage servicing rights $122 $235 Excess spread financing (36) (70) Total, net change $86 $165 Recapture $ in millions 2.5% increase 5.0% increase Annual pretax income $16 $32 Initiatives to increase recapture: Customer for Life / Customer Select Predictive pay algorithm technology RED MLS data Rates have increased ~30 bps since 3/31
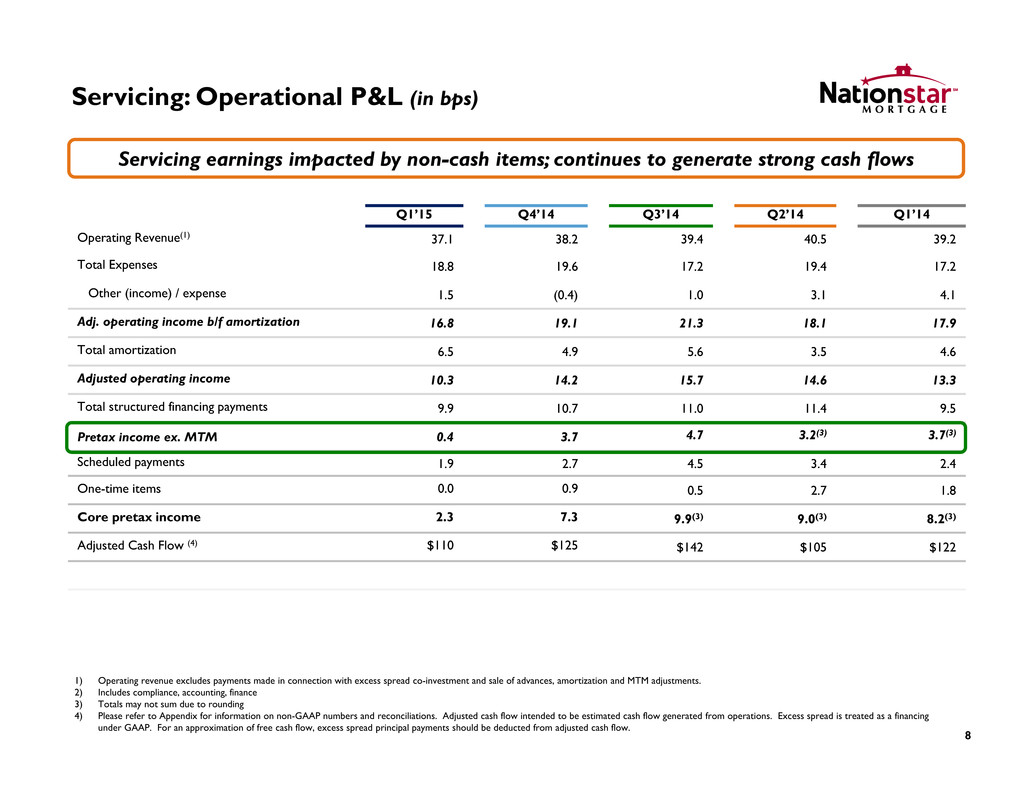
Servicing: Operational P&L (in bps) 8 Q1’15 Q4’14 Q3’14 Q2’14 Q1’14 Operating Revenue(1) 37.1 38.2 39.4 40.5 39.2 Total Expenses 18.8 19.6 17.2 19.4 17.2 Other (income) / expense 1.5 (0.4) 1.0 3.1 4.1 Adj. operating income b/f amortization 16.8 19.1 21.3 18.1 17.9 Total amortization 6.5 4.9 5.6 3.5 4.6 Adjusted operating income 10.3 14.2 15.7 14.6 13.3 Total structured financing payments 9.9 10.7 11.0 11.4 9.5 Pretax income ex. MTM 0.4 3.7 4.7 3.2(3) 3.7(3) Scheduled payments 1.9 2.7 4.5 3.4 2.4 One-time items 0.0 0.9 0.5 2.7 1.8 Core pretax income 2.3 7.3 9.9(3) 9.0(3) 8.2(3) Adjusted Cash Flow (4) $110 $125 $142 $105 $122 1) Operating revenue excludes payments made in connection with excess spread co-investment and sale of advances, amortization and MTM adjustments. 2) Includes compliance, accounting, finance 3) Totals may not sum due to rounding 4) Please refer to Appendix for information on non-GAAP numbers and reconciliations. Adjusted cash flow intended to be estimated cash flow generated from operations. Excess spread is treated as a financing under GAAP. For an approximation of free cash flow, excess spread principal payments should be deducted from adjusted cash flow. Servicing earnings impacted by non-cash items; continues to generate strong cash flows
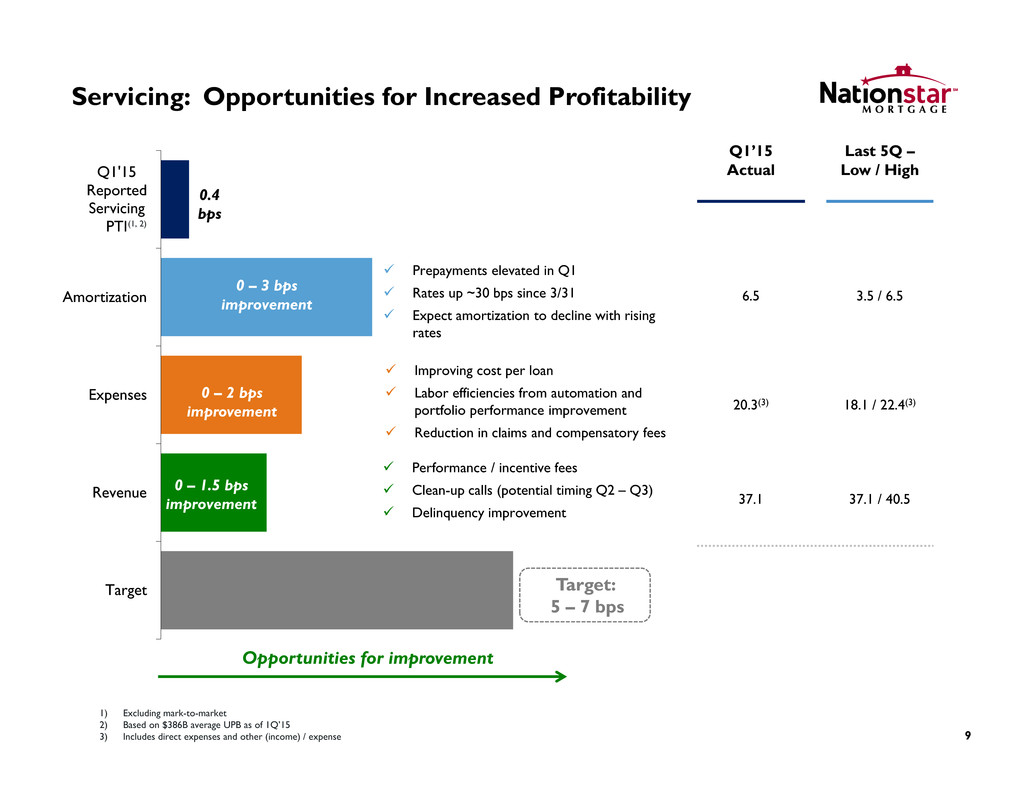
Servicing: Opportunities for Increased Profitability 9 1) Excluding mark-to-market 2) Based on $386B average UPB as of 1Q’15 3) Includes direct expenses and other (income) / expense Target Revenue Expenses Amortization Q1'15 Reported Servicing PTI 0 – 1.5 bps improvement 0 – 3 bps improvement Prepayments elevated in Q1 Rates up ~30 bps since 3/31 Expect amortization to decline with rising rates (1, 2) 0 – 2 bps improvement Improving cost per loan Labor efficiencies from automation and portfolio performance improvement Reduction in claims and compensatory fees Performance / incentive fees Clean-up calls (potential timing Q2 – Q3) Delinquency improvement Opportunities for improvement 0.4 bps Target: 5 – 7 bps Q1’15 Actual Last 5Q – Low / High 6.5 3.5 / 6.5 20.3(3) 18.1 / 22.4(3) 37.1 37.1 / 40.5

Servicing Generates Opportunities for Other Segments 10 Significant recapture opportunity for origination segment Provides Solutionstar with property sales pipeline Servicing segment creates a positive economic impact across other segments $ in mm Origination(1) / Solutionstar Servicing (2) % of Servicing Q1’14 $59 $38 155% Q2’14 104 28 371% Q3’14 78 46 173% Q4’14 82 35 234% Q1’15 91 4 2,275% Last 5 Quarters $415 $150 277% Over last 5 quarters servicing segment helped contribute significant PTI for Originations / Solutionstar: 1) Origination earnings generated from consumer-direct (recapture) channel 2) Excludes mark-to-market adjustment
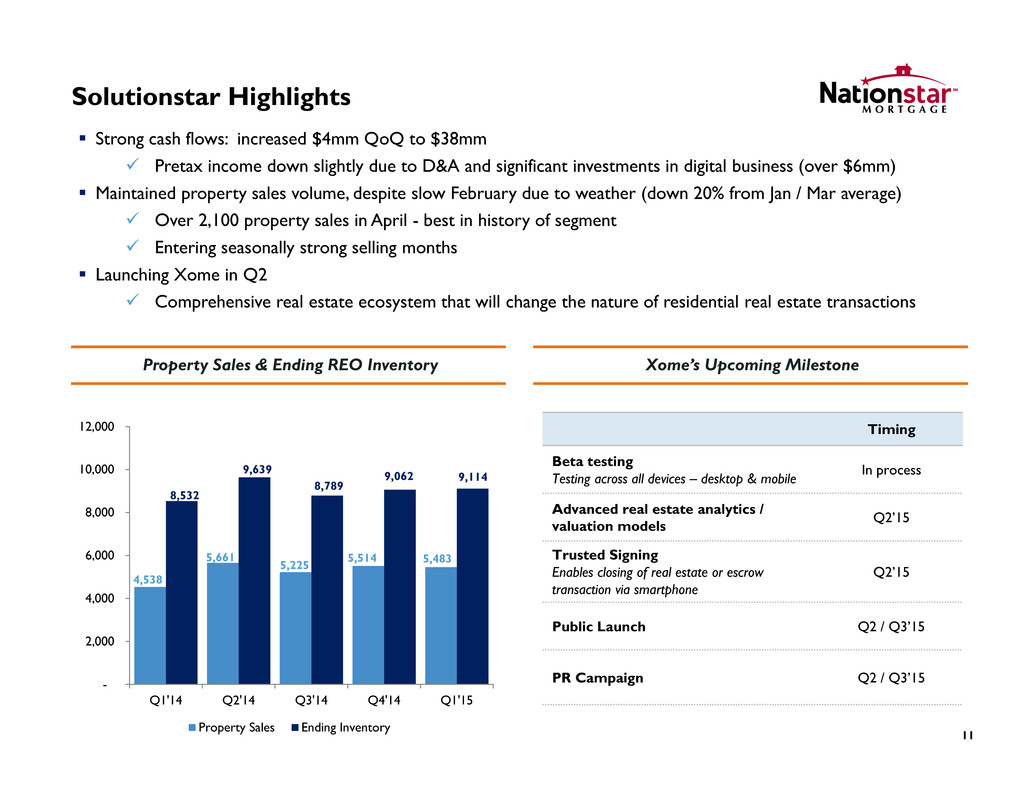
Solutionstar Highlights 11 Strong cash flows: increased $4mm QoQ to $38mm Pretax income down slightly due to D&A and significant investments in digital business (over $6mm) Maintained property sales volume, despite slow February due to weather (down 20% from Jan / Mar average) Over 2,100 property sales in April - best in history of segment Entering seasonally strong selling months Launching Xome in Q2 Comprehensive real estate ecosystem that will change the nature of residential real estate transactions Property Sales & Ending REO Inventory 4,538 5,661 5,225 5,514 5,483 8,532 9,639 8,789 9,062 9,114 - 2,000 4,000 6,000 8,000 10,000 12,000 Q1'14 Q2'14 Q3'14 Q4'14 Q1'15 Property Sales Ending Inventory Timing Beta testing Testing across all devices – desktop & mobile In process Advanced real estate analytics / valuation models Q2’15 Trusted Signing Enables closing of real estate or escrow transaction via smartphone Q2’15 Public Launch Q2 / Q3’15 PR Campaign Q2 / Q3’15 Xome’s Upcoming Milestone
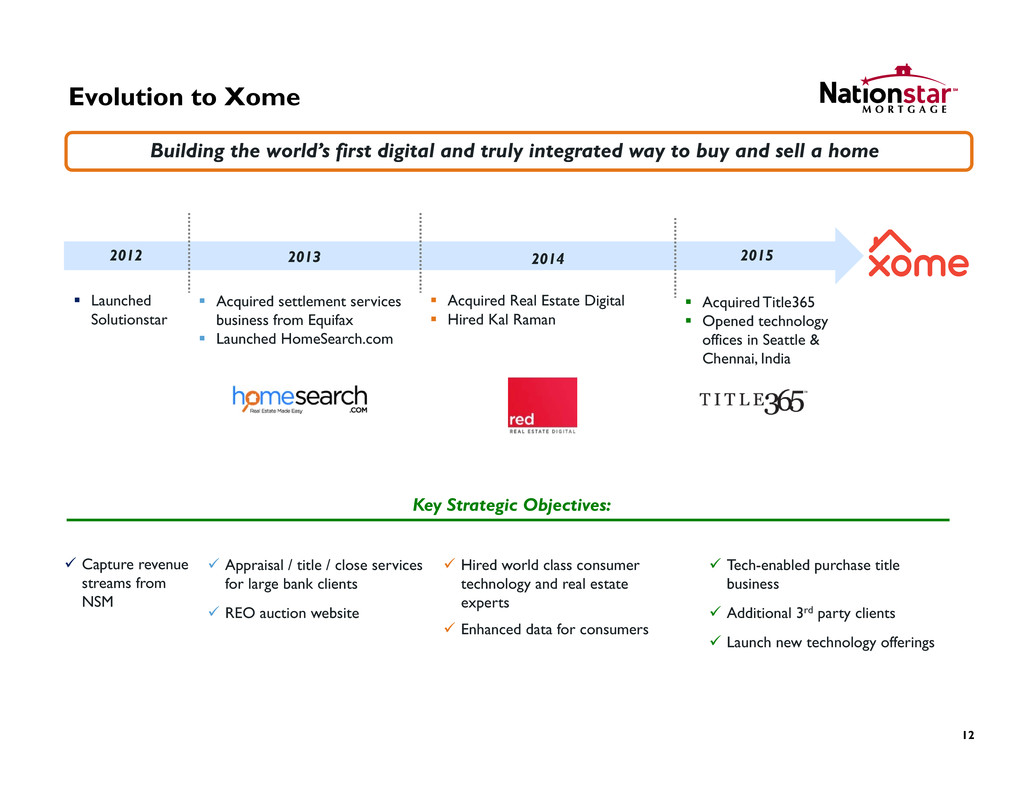
Key Strategic Objectives: 12 Evolution to Xome Building the world’s first digital and truly integrated way to buy and sell a home 2012 2013 2014 2015 Launched Solutionstar Acquired settlement services business from Equifax Launched HomeSearch.com Acquired Real Estate Digital Hired Kal Raman Acquired Title365 Opened technology offices in Seattle & Chennai, India Appraisal / title / close services for large bank clients REO auction website Capture revenue streams from NSM Hired world class consumer technology and real estate experts Enhanced data for consumers Tech-enabled purchase title business Additional 3rd party clients Launch new technology offerings

Xome: Revolutionizing the Way Real Estate Transacts 13 We assist customers through every step of the process from start to finish including: Find a home via dynamic search platform Transact Save money and time THERE’S NO PLACE LIKE XOMESM Making the real estate process easier and more transparent
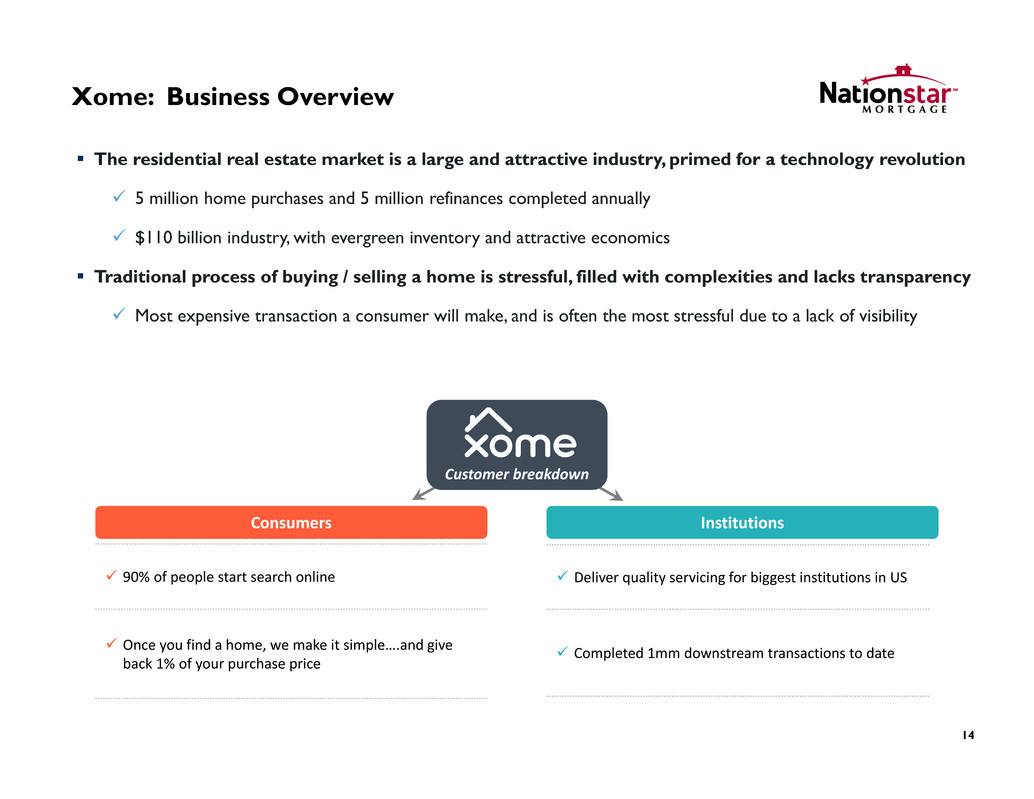
Xome: Business Overview 14 The residential real estate market is a large and attractive industry, primed for a technology revolution 5 million home purchases and 5 million refinances completed annually $110 billion industry, with evergreen inventory and attractive economics Traditional process of buying / selling a home is stressful, filled with complexities and lacks transparency Most expensive transaction a consumer will make, and is often the most stressful due to a lack of visibility Customer breakdown Consumers 90% of people start search online Once you find a home, we make it simple….and give back 1% of your purchase price Institutions Deliver quality servicing for biggest institutions in US Completed 1mm downstream transactions to date

We Believe… 15 Buying a house should be fun. Closing should be simple. The process should be transparent.

Q2’15 Outlook 1) As of 5/18/15 16 Favorable rate environment continued in April $1.6B net lock volume HARP extended through the end of 2016 $38B opportunity April fundings of $1.6B at ~140 bps pretax income margin 10-year treasury yield increased by ~30 bps since 3/31(1) Expect amortization to decline with rising rates Closed $31B of portfolios QTD Potential for HECM securitization and trust collapses in Q2 / Q3 Continue cost reduction initiatives Entering peak summer sales season Sold 2,100 properties in April Xome launch mid-June Originations Servicing Solutionstar
Endnotes Adjusted Cash Flow (“Adjusted Cash Flow”) This disclaimer applies to every usage of in this presentation. Adjusted Cash Flow is a metric that is used by management to provide an estimate of cash flow generated by the operating segments. Adjusted Cash Flow begins with pretax income and makes adjustments for cash and non-cash items including changes in the fair value of MSRs, value of capitalized servicing retained, depreciation and amortization, stock based compensation and cash taxes. Adjusted Operating Income (“Adjusted Operating Income”) This disclaimer applies to every usage of Adjusted Operating Income in this presentation. Adjusted Operating Income is a metric that is used by management to provide a better depiction of the results of servicing operations by excluding changes in fair value of the MSR and payments made to partners in connection with excess spread co-investment and the sale of servicing advances. 17

Appendix 18

$ in mm Q1’15 Q4’14 New Presentation Pretax Income ($106) $14 Mark to Market (“MTM”) 110 21 Pretax Income (ex. MTM) $4 $35 In bps 0.4 3.7 Old Presentation Pretax Income ($106) $14 MTM 110 21 Scheduled payments / excess spread recapture liability & MSR financing liability accretion(1) 19 26 MTM – Old Presentation 128 46 One time items -- 8 Core Pretax Income $23 $69 In bps 2.3 7.3 Servicing: Pretax Income Reconciliations & Cash Flows 19 1) Excess spread recapture liability related to recaptured loans that have refinanced during period. MSR financing liability accretion related to the recovery of advances and related reduction in financing costs 2) Please refer to Appendix for information on non-GAAP numbers and reconciliations. Adjusted cash flow intended to be estimated cash flow generated from operations. Excess spread is treated as a financing under GAAP. For an approximation of free cash flow, excess spread principal payments should be deducted from adjusted cash flow. $ in mm Q1’15 Q4’14 Pretax Income ($106) $14 MTM 110 21 Amortization 63 46 Excess Spread – principal payments 40 39 Other 3 5 Adjusted Cash Flow(2) $110 $125 Pretax Income Adjusted Cash Flow(2)

$ in mm Q1’15 Q4’14 $ bps $ bps Operating Revenue(1) $357.5 37.1 $362.4 38.2 Labor costs 58.4 6.1 65.8 6.9 Direct corporate allocation(2) 39.2 4.1 38.5 4.1 Other direct expenses 83.4 8.7 81.6 8.6 Total Expenses 181.0 18.8 185.9 19.6 Other (income) / expense(3) 14.7 1.5 (4.6) (0.4) Adj. operating income b/f amortization 161.8 16.8 181.1 19.1 Total amortization 62.9 6.5 46.3 4.9 Adjusted operating income 98.9 10.3 134.9 14.2 MSR financing liability payments 34.3 3.6 41.1 4.3 Excess spread payments – principal 40.3 4.2 38.7 4.1 Excess spread payments – interest / other 20.4 2.1 20.3 2.1 Total structured financing payments 95.0 9.9 100.1 10.7 Pretax income ex. MTM 3.9 0.4 34.8 3.7 Financing MTM 4.4 0.5 (5.0) (0.5) MSR MTM (109.7) (11.4) (26.9) (2.8) Excess Spread MTM (4.4) (0.5) 11.2 1.2 Total MTM adjustments (109.7) (11.4) (20.7) (2.2) GAAP Pretax Income (105.8) (11.0) 14.1 1.5 Average UPB ($B) $385.6 -- $379.4 -- Servicing: Operational P&L 20 1) Operating revenue excludes payments made in connection with excess spread co-investment and sale of advances, amortization and MTM adjustments. 2) Direct corporate allocation includes: legal / compliance, accounting and finance involved directly with the segment 3) Other (income) / expense excludes portion of excess spread remittance treated as financing. See appendix for reconciliation Refined presentation provides more insight into servicing’s performance Q4’14 included benefits from reverse HECM securitization, master trust collapse and advance discount accretion MSR financing liability payments will continue to decline as PLS advances are recovered Amortization up due to rate environment Ability to leverage existing employee base Q1 avg UPB includes $9B portfolio closed on 3/31; no earnings received on portfolio in Q1

$ in mm Q4’14 $ Bps MTM Adjustments – Q4 Press Release $ 46.2 4.9 Less: Scheduled principal payments (20.0) (2.1) Moved to amortization Less: Excess spread recapture liability / MSR financing liability accretion(1) (5.5) (0.6) Excess – moved to amortization; MSR financing - moved from amortization MTM Adjustments – Operating P&L Presentation $ 20.7 2.2 Q4 MTM Adjustments and Amortization Reconciliations 21 $ in mm Q4’14 $ Bps Amortization – Q4 Press Release $ 73.3 7.7 Plus: Scheduled principal payments 20.0 2.1 Moved from MTM Plus: Excess spread recapture liability / MSR financing liability accretion(1) 5.5 0.6 Excess - moved from MTM; MSR financing – moved to MTM Less: Reverse / HECM amortization accretion(2) (13.7) (1.4) Reverse MSRs on LoCOM Less: Excess spread payments – principal (38.7) (4.1) Separate line item on Operating P&L Amortization – Operating P&L Presentation $ 46.3 4.9 1) Excess spread recapture liability related to recaptured loans that have refinanced during period. MSR financing liability accretion related to the recovery of advances and related reduction in financing costs 2) Excluded from Q4 press release prior breakout of fair value adjustments because not carried at fair value; During the quarter reverse servicing operations and the HECM securitization resulted in a reduction in the mortgage servicing rights liability and a credit to reverse amortization (increase in reverse revenue).

Servicing: Operational P&L (in bps) 22 Q1’15 Q4’14 Q3’14 Q2’14 Q1’14 Operating Revenue(1) 37.1 38.2 39.4 40.5 39.2 Labor costs 6.1 6.9 6.5 6.8 6.6 Direct corporate allocation(2) 4.1 4.1 3.6 3.5 3.5 Other direct expenses 8.7 8.6 7.1 9.1 7.1 Total Expenses 18.8 19.6 17.2 19.4 17.2 Other (income) / expense 1.5 (0.4) 1.0 3.1 4.1 Adj. operating income b/f amortization 16.8 19.1 21.3 18.1 17.9 Total amortization 6.5 4.9 5.6 3.5 4.6 Adjusted operating income 10.3 14.2 15.7 14.6 13.3 MSR financing liability payments 3.6 4.3 4.4 4.9 3.6 Excess spread payments – principal 4.2 4.1 4.3 4.2 3.7 Excess spread payments – interest / other 2.1 2.1 2.3 2.3 2.2 Total structured financing payments 9.9 10.7 11.0 11.4 9.5 Pretax income ex. MTM 0.4 3.7 4.7 3.2(3) 3.7(3) Financing MTM 0.5 (0.5) (0.7) 4.1 0.7 MSR MTM (11.4) (2.8) 9.5 2.9 (0.3) Excess spread MTM (0.5) 1.2 (4.1) (2.9) 0.9 Total MTM adjustments (11.4) (2.2) 4.6 4.1 1.2 GAAP Pretax Income (11.0) 1.5 9.4 7.1 5.0 Average UPB ($B) $386 $379 $378 $378 $388 1) Operating revenue excludes payments made in connection with excess spread co-investment and sale of advances, amortization and MTM adjustments. 2) Includes compliance, accounting, finance 3) Totals may not sum due to rounding

$ in mm Q1’15 Q4’14 Q3’14 Q2’14 Q1’14 New Presentation Pretax Income ($106) $14 $89 $67 $50 Mark to Market (“MTM”) 110 21 (44) (39) (12) Pretax Income (ex. MTM) $4 $35 $46 $28 $38 In bps 0.4 3.7 4.7 3.2 3.7 Old Presentation Pretax Income ($106) $14 $89 $67 $50 MTM 110 21 (44) (39) (12) Scheduled payments / excess spread & financing liability accretion(1) 19 26 43 32 23 MTM – Old Presentation 128 46 (1) (7) 11 One time items -- 8 4 26 18 Core Pretax Income $23 $69 $93 $86 $79 In bps 2.3 7.3 9.9 9.0 8.2 Servicing: Pretax Income Reconciliation 231) Increases during Q2’14 and Q3’14 principally related to accretion of MSR financing liability related to recovery of advances and excess spread liability related to recaptured loans.

Servicing: Operating P&L Reconciliation 24 $ in MM Q1’15 Q4’14 Q3’14 Q2’14 Q1’14 Operating Revenue $358 $362 $373 $383 $380 Less: MSR Financing Liability (34) (40) (42) (47) (35) Less: Excess Spread - principal (40) (39) (41) (40) (36) Less: Amortization – total (63) (46) (53) (33) (45) MTM Adjustments (110) (21) 44 39 12 Other (1) (1) (1) (1) (1) GAAP Revenue $109 $215 $280 $302 $275 GAAP Revenue Reconciliation $ in MM Q1’15 Q4’14 Q3’14 Q2’14 Q1’14 Other Income / (Expense) ($15) $5 ($9) ($29) ($40) Plus: Excess Spread – Interest (19) (19) (20) (20) (20) GAAP Other Income / (Expense) ($34) ($14) ($30) ($49) ($60) GAAP Other Income / (Expense) Reconciliation
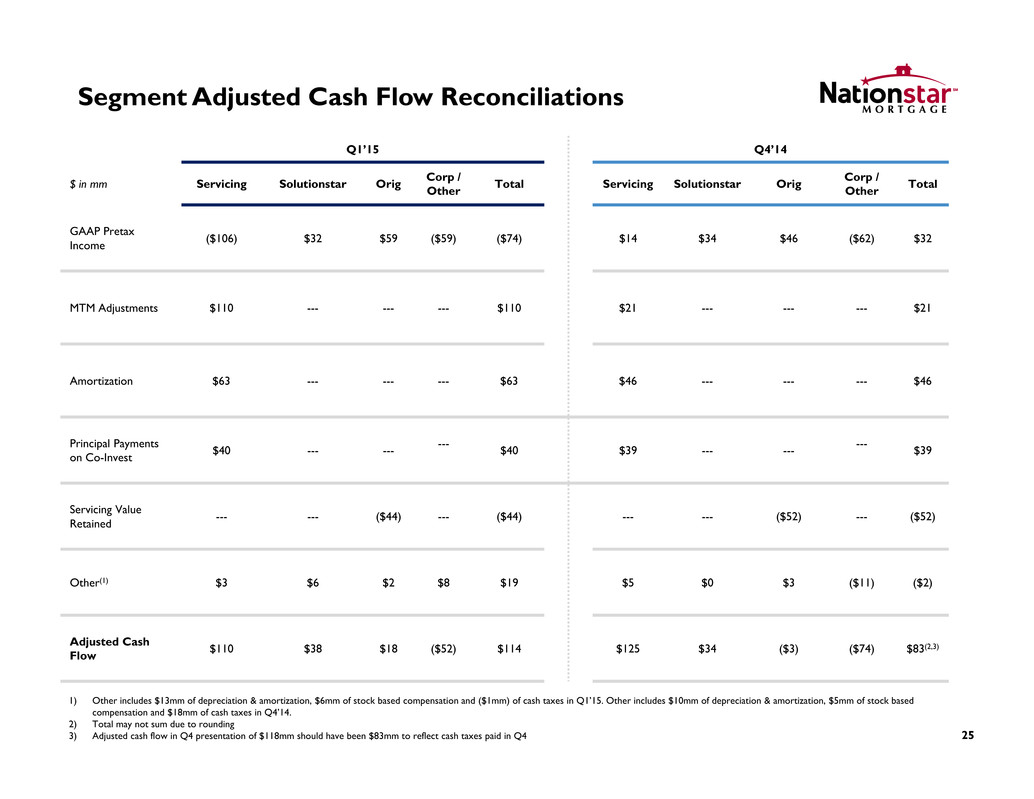
25 1) Other includes $13mm of depreciation & amortization, $6mm of stock based compensation and ($1mm) of cash taxes in Q1’15. Other includes $10mm of depreciation & amortization, $5mm of stock based compensation and $18mm of cash taxes in Q4’14. 2) Total may not sum due to rounding 3) Adjusted cash flow in Q4 presentation of $118mm should have been $83mm to reflect cash taxes paid in Q4 Q1’15 Q4’14 $ in mm Servicing Solutionstar Orig Corp / Other Total Servicing Solutionstar Orig Corp / Other Total GAAP Pretax Income ($106) $32 $59 ($59) ($74) $14 $34 $46 ($62) $32 MTM Adjustments $110 --- --- --- $110 $21 --- --- --- $21 Amortization $63 --- --- --- $63 $46 --- --- --- $46 Principal Payments on Co-Invest $40 --- --- --- $40 $39 --- --- --- $39 Servicing Value Retained --- --- ($44) --- ($44) --- --- ($52) --- ($52) Other(1) $3 $6 $2 $8 $19 $5 $0 $3 ($11) ($2) Adjusted Cash Flow $110 $38 $18 ($52) $114 $125 $34 ($3) ($74) $83(2,3) Segment Adjusted Cash Flow Reconciliations
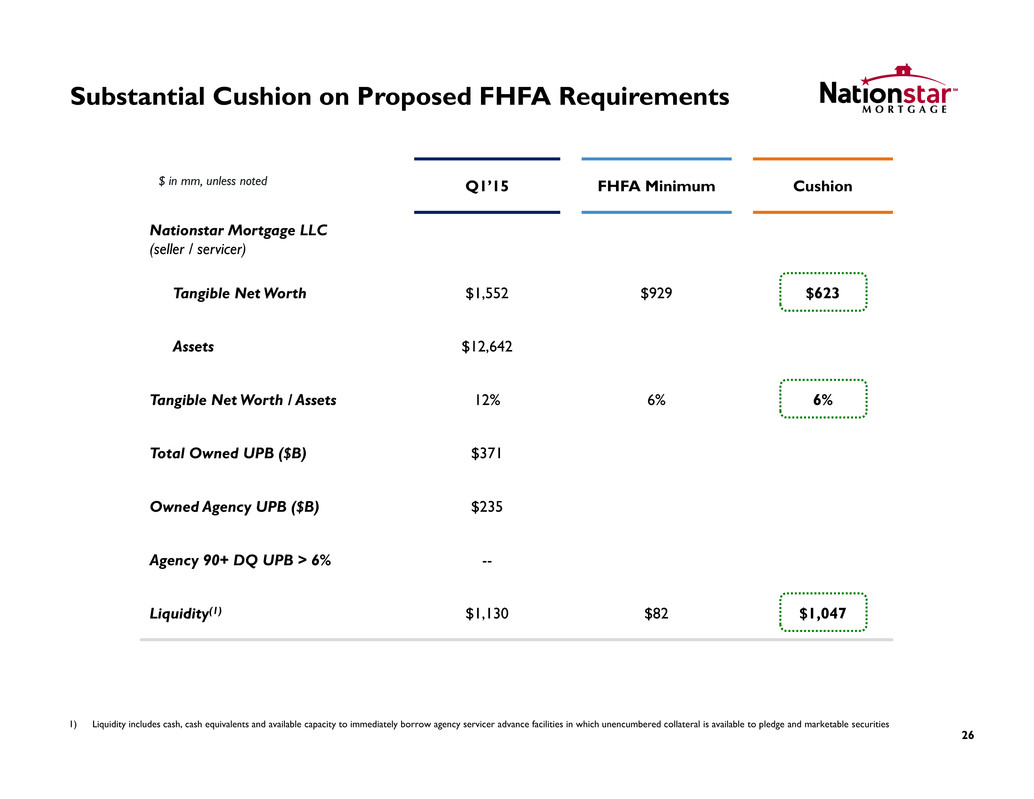
Substantial Cushion on Proposed FHFA Requirements 26 Q1’15 FHFA Minimum Cushion Nationstar Mortgage LLC (seller / servicer) Tangible Net Worth $1,552 $929 $623 Assets $12,642 Tangible Net Worth / Assets 12% 6% 6% Total Owned UPB ($B) $371 Owned Agency UPB ($B) $235 Agency 90+ DQ UPB > 6% -- Liquidity(1) $1,130 $82 $1,047 $ in mm, unless noted 1) Liquidity includes cash, cash equivalents and available capacity to immediately borrow agency servicer advance facilities in which unencumbered collateral is available to pledge and marketable securities

Originations: Recapture Economic Impact 271) Cash from points, fees, secondary gains Q1’15 Total Run-off: ~$15B UPB Q1’15 Voluntary Run-off: $9.9B UPB ($49mm amortization) Q1’15 Involuntary Run-off / Principal Payments : $5B UPB Cash: $22mm(1) New MSR: $23mm Not eligible for origination product Charge-offs Foreclosure REO Lower delinquencies = lower operating structure Recapture of voluntary payoffs mitigated ~90% of run-off economic value Recaptured: $2.3B (24% recapture) Not Recaptured: $7.6B Initiatives to increase retention: Customer for Life / Customer Select Predictive pay algorithm technology RED MLS data $49.0 $45.0 Amortization New MSR / Cash $22.0M Cash $23.0M MSR Value of $10B UPB voluntary run-off Economics Generated ~90% Economic Impact of Retention
