Attached files
| file | filename |
|---|---|
| 8-K - CURRENT REPORT - ICAHN ENTERPRISES L.P. | v411002_8k.htm |
Exhibit 99.1
Icahn Enterprises L.P. Investor Presentation May 2015
Forward - Looking Statements and Non - GAAP Financial Measures Forward - Looking Statements This presentation contains certain statements that are, or may be deemed to be, “forward - looking statements” within the meaning of Section 27 A of the Securities Act of 1933 , as amended, and Section 21 E of the Securities Exchange Act of 1934 , as amended . All statements included herein, other than statements that relate solely to historical fact, are “forward - looking statements . ” Such statements include, but are not limited to, any statement that may predict, forecast, indicate or imply future results, performance, achievements or events, or any statement that may relate to strategies, plans or objectives for, or potential results of, future operations, financial results, financial condition, business prospects, growth strategy or liquidity, and are based upon management’s current plans and beliefs or current estimates of future results or trends . Forward - looking statements can generally be identified by phrases such as “believes,” “expects,” “potential,” “continues,” “may,” “should,” “seeks,” “predicts,” “anticipates,” “intends,” “projects,” “estimates,” “plans,” “could,” “designed,” “should be” and other similar expressions that denote expectations of future or conditional events rather than statements of fact . Our expectations, beliefs and projections are expressed in good faith and we believe that there is a reasonable basis for them . However, there can be no assurance that these expectations, beliefs and projections will result or be achieved . There are a number of risks and uncertainties that could cause our actual results to differ materially from the forward - looking statements contained in this presentation . These risks and uncertainties are described in our Annual Report on Form 10 - K for the year ended December 31 , 2014 and our Quarterly Report on Form 10 - Q for the quarter ended March 31 , 2015 . There may be other factors not presently known to us or which we currently consider to be immaterial that may cause our actual results to differ materially from the forward - looking statements . All forward - looking statements attributable to us or persons acting on our behalf apply only as of the date of this presentation and are expressly qualified in their entirety by the cautionary statements included in this presentation . Except to the extent required by law, we undertake no obligation to update or revise forward - looking statements to reflect events or circumstances after the date such statements are made or to reflect the occurrence of unanticipated events . Non - GAAP Financial Measures This presentation contains certain non - GAAP financial measures, including EBITDA, Adjusted EBITDA, Indicative Net Asset Value and Adjusted Net Income . The non - GAAP financial measures contained herein have limitations as analytical tools and should not be considered in isolation or in lieu of an analysis of our results as reported under U . S . GAAP . These non - GAAP measures should be evaluated only on a supplementary basis in connection with our U . S . GAAP results, including those reported in our consolidated financial statements and the related notes thereto contained in our Annual Report on Form 10 - K for the year ended December 31 , 2014 and our Quarterly Report on Form 10 - Q for the quarter ended March 31 , 2015 .
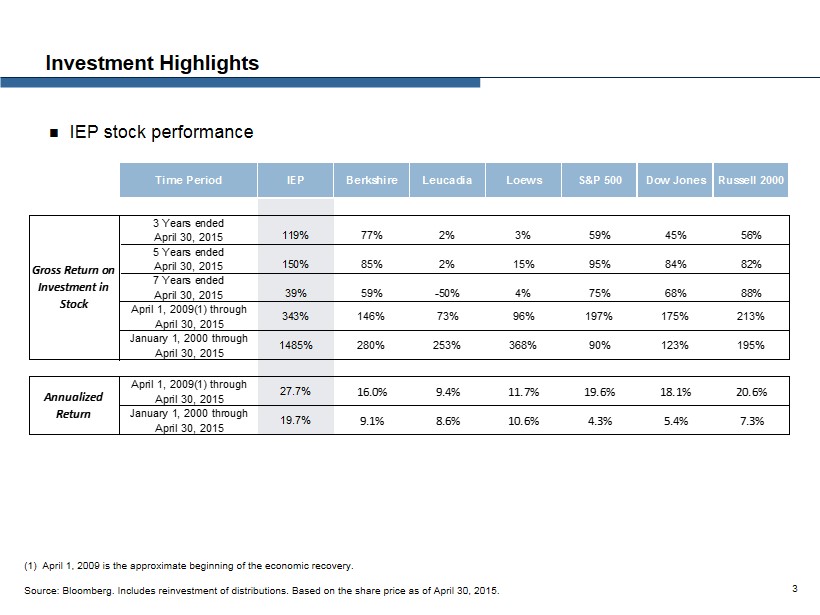
Investment Highlights ; IEP stock performance 3 (1) April 1, 2009 is the approximate beginning of the economic recovery. Source : Bloomberg. Includes reinvestment of distributions. Based on the share price as of April 30, 2015. Time Period IEP Berkshire Leucadia Loews S&P 500 Dow Jones Russell 2000 3 Years ended April 30, 2015 119% 77% 2% 3% 59% 45% 56% 5 Years ended April 30, 2015 150% 85% 2% 15% 95% 84% 82% 7 Years ended April 30, 2015 39% 59% -50% 4% 75% 68% 88% April 1, 2009(1) through April 30, 2015 343% 146% 73% 96% 197% 175% 213% January 1, 2000 through April 30, 2015 1485% 280% 253% 368% 90% 123% 195% April 1, 2009(1) through April 30, 2015 27.7% 16.0% 9.4% 11.7% 19.6% 18.1% 20.6% January 1, 2000 through April 30, 2015 19.7% 9.1% 8.6% 10.6% 4.3% 5.4% 7.3% Gross Return on Investment in Stock Annualized Return
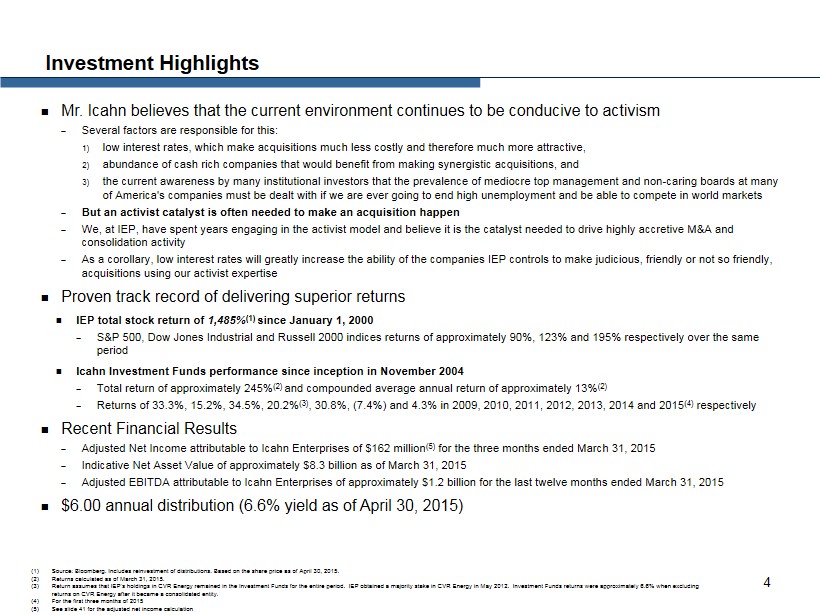
Investment Highlights 4 ; Mr. Icahn believes that the current environment continues to be conducive to activism – Several factors are responsible for this: 1) low interest rates, which make acquisitions much less costly and therefore much more attractive, 2) abundance of cash rich companies that would benefit from making synergistic acquisitions, and 3) the current awareness by many institutional investors that the prevalence of mediocre top management and non - caring boards at ma ny of America's companies must be dealt with if we are ever going to end high unemployment and be able to compete in world marke ts – But an activist catalyst is often needed to make an acquisition happen – We, at IEP, have spent years engaging in the activist model and believe it is the catalyst needed to drive highly accretive M &A and consolidation activity – As a corollary, low interest rates will greatly increase the ability of the companies IEP controls to make judicious, friendl y o r not so friendly, acquisitions using our activist expertise ; Proven track record of delivering superior returns ; IEP total stock return of 1,485% (1) since January 1, 2000 – S&P 500, Dow Jones Industrial and Russell 2000 indices returns of approximately 90%, 123% and 195% respectively over the same period ; Icahn Investment Funds performance since inception in November 2004 – Total return of approximately 245% (2) and compounded average annual return of approximately 13% (2) – Returns of 33.3%, 15.2%, 34.5%, 20.2% (3) , 30.8%, (7.4%) and 4.3% in 2009, 2010, 2011, 2012, 2013, 2014 and 2015 (4) respectively ; Recent Financial Results – Adjusted Net Income attributable to Icahn Enterprises of $162 million (5) for the three months ended March 31, 2015 – Indicative Net Asset Value of approximately $8.3 billion as of March 31, 2015 – Adjusted EBITDA attributable to Icahn Enterprises of approximately $1.2 billion for the last twelve months ended March 31, 20 15 ; $6.00 annual distribution (6.6 % yield as of April 30, 2015) (1) Source: Bloomberg. Includes reinvestment of distributions. Based on the share price as of April 30, 2015. (2) Returns calculated as of March 31, 2015. (3) Return assumes that IEP’s holdings in CVR Energy remained in the Investment Funds for the entire period. IEP obtained a majority stake in CVR Energy in May 2012. Inv est ment Funds returns were approximately 6.6% when excluding returns on CVR Energy after it became a consolidated entity . (4) For the first three months of 2015 (5) See slide 41 for the adjusted net income calculation
The Icahn Strategy Across all of our businesses, our success is based on a simple formula: we seek to find undervalued companies in the Graham & Do dd tradition, a methodology for valuing stocks that primarily looks for deeply depressed prices. However, while the typical Graham & Dodd value investor purc has es undervalued securities and waits for results, we often become actively involved in the companies we target. That activity may involve a broad range of approac hes , from influencing the management of a target to take steps to improve shareholder value, to acquiring a controlling interest or outright ownership of the target com pany in order to implement changes that we believe are required to improve its business, and then operating and expanding that business. This activism has brought ab out very strong returns over the years. Today, we are a diversified holding company owning subsidiaries engaged in the following operating businesses: Investment, Au tom otive, Energy, Metals, Railcar, Gaming, Food Packaging, Real Estate and Home Fashion. Through our Investment segment, as of April 30, 2015, we have significa nt positions in various investments, which include Apple Inc. (AAPL), eBay Inc. (EBAY), Chesapeake Energy (CHK), Hertz Global Holdings, Inc. (HTZ), Hologic Inc. ( HOL X), Nuance Communications, Inc. (NUAN), Herbalife Ltd. (HLF), Talisman Energy Inc. (TLM), Navistar International Corp. (NAV), Netflix (NFLX), Gannett Co., Inc. (GCI), Transoce an Ltd. (RIG), Mentor Graphics Corporation (MENT), Manitowoc Company Inc. (MTW) and Seventy Seven Energy Inc. (SSE). Several of our operating businesses started out as investment positions in debt or equity securities, held either directly by ou r Investment segment or Mr. Icahn. Those positions ultimately resulted in control or complete ownership of the target company. In 2012, we acquired a controlling inte res t in CVR Energy, Inc. (‘‘CVR’’) which started out as a position in our Investment segment and is now an operating subsidiary that comprises our Energy segment. As of April 30, 2015, based on the closing sale price of CVR stock and distributions since we acquired control, we had a gain of approximately $2.1 billion on our purch ase of CVR. The recent acquisition of CVR, like our other operating subsidiaries, reflects our opportunistic approach to value creation, through which returns may be obtained by, among other things, promoting change through minority positions at targeted companies in our Investment segment or by acquiring control of those tar get companies that we believe we could run more profitably ourselves. In 2000, we began to expand our business beyond our traditional real estate activities, and to fully embrace our activist str ate gy. On January 1, 2000, the closing sale price of our depositary units was $7.625 per depositary unit. On April 30, 2015, our depositary units closed at $91.55 per de pos itary unit, representing an increase of approximately 1,485% since January 1, 2000 (including reinvestment of distributions into additional depositary units and taki ng into account in - kind distributions of depositary units). Comparatively, the S&P 500, Dow Jones Industrial and Russell 2000 indices increased approximately 90%, 123 % a nd 195%, respectively, over the same period (including reinvestment of distributions into those indices). During the next several years, we see a favorable opportunity to follow an activist strategy that centers on the purchase of tar get stock and the subsequent removal of any barriers that might interfere with a friendly purchase offer from a strong buyer. Alternatively, in appropriate circumsta nce s, we or our subsidiaries may become the buyer of target companies, adding them to our portfolio of operating subsidiaries, thereby expanding our operations through s uch opportunistic acquisitions. We believe that the companies that we target for our activist activities are undervalued for many reasons, often including inept managem ent . Unfortunately for the individual investor, in particular, and the economy, in general, many poor management teams are often unaccountable and very difficult t o r emove. 5
The Icahn Strategy (continued) Unlike the individual investor, we have the wherewithal to purchase companies that we feel we can operate more effectively th an incumbent management. In addition, through our Investment segment, we are in a position to pursue our activist strategy by purchasing stock or debt positions an d t rying to promulgate change through a variety of activist approaches, ranging from speaking and negotiating with the board and CEO to proxy fights, tender offers a nd taking control. We work diligently to enhance value for all shareholders and we believe that the best way to do this is to make underperforming management teams an d b oards accountable or to replace them. The Chairman of the Board of our general partner, Carl C. Icahn, has been an activist investor since 1980. Mr. Icahn believes th at the current environment continues to be conducive to activism. Many major companies have substantial amounts of cash. We believe that they are hoarding cash, rath er than spending it, because they do not believe investments in their business will translate to earnings. We believe that one of the best ways for many cash - rich companies to achieve increased earnings is to use their large amounts of excess cash, together with advantageous borrowing opportunities, to purchase other companies in their industries and take advantage of the meaningful sy ner gies that could result. In our opinion, the CEOs and Boards of Directors of undervalued companies that would be acquisition targets are the major road blocks to this lo gical use of assets to increase value, because we believe those CEOs and boards are not willing to give up their power and perquisites, even if they have done a poo r j ob in administering the companies they have been running. In addition, acquirers are often unwilling to undertake the arduous task of launching a hostile campa ign . This is precisely the situation in which a strong activist catalyst is necessary. We believe that the activist catalyst adds value because, for companies with strong balance sheets, acquisition of their weak er industry rivals is often extremely compelling financially. We further believe that there are many transactions that make economic sense, even at a large premium ov er market. Acquirers can use their excess cash, that is earning a very low return, and/or borrow at the advantageous interest rates now available, to acquire a tar get company. In either case, an acquirer can add the target company’s earnings and the income from synergies to the acquirer’s bottom line, at a relatively low cost. But for these potential acquirers to act, the target company must be willing to at least entertain an offer. We believe that often the activist can step in and remove the obs tacles that a target may seek to use to prevent an acquisition. It is our belief that our strategy will continue to produce strong results into the future, and that belief is reflected in t he action of the board of directors of our general partner, which announced in March 2014, a decision to modify our distribution policy to increase our annual distribution to $ 6.0 0 per depositary unit. We believe that the strong cash flow and asset coverage from our operating segments will allow us to maintain a strong balance sheet and ample li qui dity. In our view Icahn Enterprises is in a virtuous cycle. We believe that our depositary units will give us another powerful acti vis t tool, allowing us both to use our depositary units as currency for tender offers and acquisitions (both hostile and friendly) where appropriate. All of these factors will , i n our opinion, contribute to making our activism even more efficacious, which we expect to enhance our results and stock value. 6
Company Overview 7
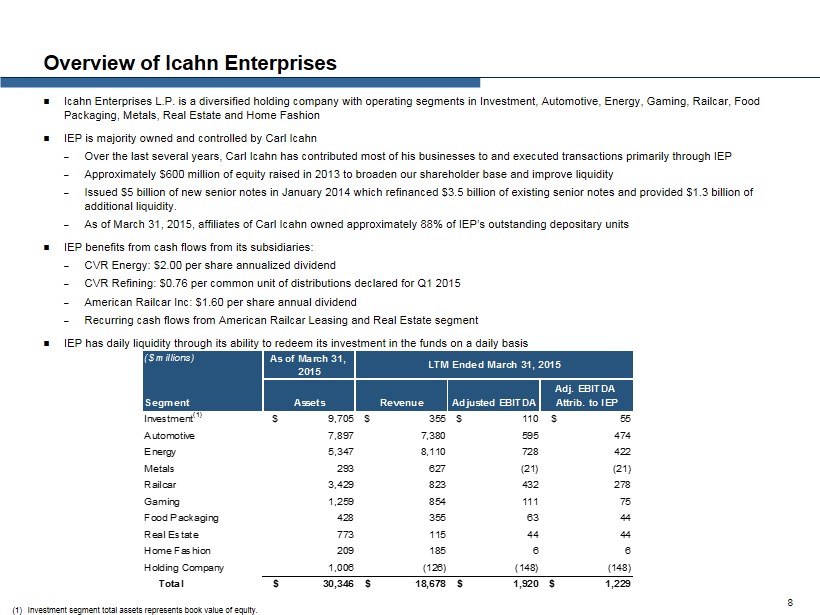
Overview of Icahn Enterprises ; Icahn Enterprises L.P. is a diversified holding company with operating segments in Investment, Automotive, Energy, Gaming, Ra ilc ar, Food Packaging, Metals, Real Estate and Home Fashion ; IEP is majority owned and controlled by Carl Icahn – Over the last several years, Carl Icahn has contributed most of his businesses to and executed transactions primarily through IE P – Approximately $600 million of equity raised in 2013 to broaden our shareholder base and improve liquidity – Issued $5 billion of new senior notes in January 2014 which refinanced $3.5 billion of existing senior notes and provided $1. 3 b illion of additional liquidity. – As of March 31, 2015, affiliates of Carl Icahn owned approximately 88% of IEP’s outstanding depositary units ; IEP benefits from cash flows from its subsidiaries: – CVR Energy: $2.00 per share annualized dividend – CVR Refining: $0.76 per common unit of distributions declared for Q1 2015 – American Railcar Inc: $1.60 per share annual dividend – Recurring cash flows from American Railcar Leasing and Real Estate segment ; IEP has daily liquidity through its ability to redeem its investment in the funds on a daily basis (1) Investment segment total assets represents book value of equity. 8 ($ millions) As of March 31, 2015 Segment Assets Revenue Adjusted EBITDA Adj. EBITDA Attrib. to IEP Investment (1) $ 9,705 $ 355 $ 110 $ 55 Automotive 7,897 7,380 595 474 Energy 5,347 8,110 728 422 Metals 293 627 (21) (21) Railcar 3,429 823 432 278 Gaming 1,259 854 111 75 Food Packaging 428 355 63 44 Real Estate 773 115 44 44 Home Fashion 209 185 6 6 Holding Company 1,006 (126) (148) (148) Total $ 30,346 $ 18,678 $ 1,920 $ 1,229 LTM Ended March 31, 2015
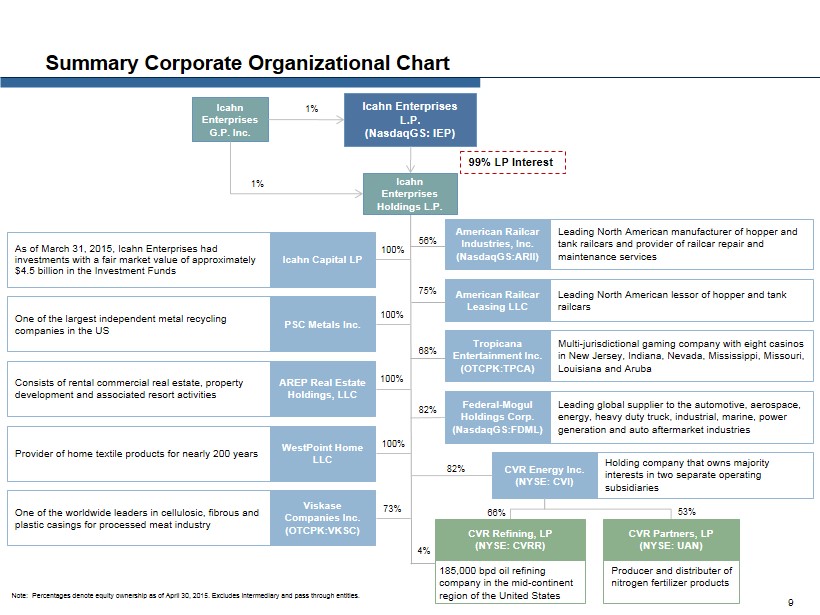
66% CVR Energy Inc. (NYSE: CVI) Summary Corporate Organizational Chart WestPoint Home LLC PSC Metals Inc. AREP Real Estate Holdings, LLC Tropicana Entertainment Inc. (OTCPK:TPCA) Federal - Mogul Holdings Corp. (NasdaqGS:FDML) Icahn Enterprises G.P. Inc. Icahn Enterprises L.P. (NasdaqGS: IEP) Icahn Enterprises Holdings L.P . 1% 1% 99% LP Interest 53% 73% 82% 82% American Railcar Industries, Inc. (NasdaqGS:ARII) Icahn Capital LP Viskase Companies Inc. (OTCPK:VKSC) As of March 31, 2015, Icahn Enterprises had investments with a fair market value of approximately $4.5 billion in the Investment Funds One of the largest independent metal recycling companies in the US Consists of rental commercial real estate, property development and associated resort activities Provider of home textile products for nearly 200 years One of the worldwide leaders in cellulosic, fibrous and plastic casings for processed meat industry Holding company that owns majority interests in two separate operating subsidiaries Multi - jurisdictional gaming company with eight casinos in New Jersey, Indiana, Nevada, Mississippi, Missouri, Louisiana and Aruba Leading North American manufacturer of hopper and tank railcars and provider of railcar repair and maintenance services 68% 100% 100% 56% Producer and distributer of nitrogen fertilizer products CVR Partners, LP (NYSE: UAN) CVR Refining, LP (NYSE: CVRR) 185,000 bpd oil refining company in the mid - continent region of the United States 100% 100% 4% Leading global supplier to the automotive, aerospace, energy, heavy duty truck, industrial, marine, power generation and auto aftermarket industries Note : Percentages denote equity ownership as of April 30, 2015. Excludes intermediary and pass through entities. American Railcar Leasing LLC Leading North American lessor of hopper and tank railcars 75% 9
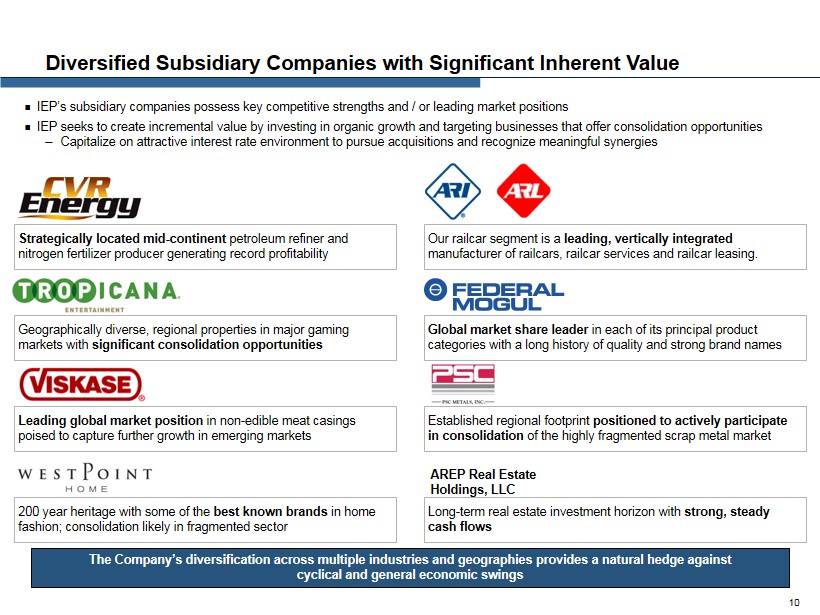
Diversified Subsidiary Companies with Significant Inherent Value The Company’s diversification across multiple industries and geographies provides a natural hedge against cyclical and general economic swings Global market share leader in each of its principal product categories with a long history of quality and strong brand names Geographically diverse, regional properties in major gaming markets with significant consolidation opportunities 200 year heritage with some of the best known brands in home fashion; consolidation likely in fragmented sector Leading global market position in non - edible meat casings poised to capture further growth in emerging markets Established regional footprint positioned to actively participate in consolidation of the highly fragmented scrap metal market Our railcar segment is a leading, vertically integrated manufacturer of railcars, railcar services and railcar leasing. Strategically located mid - continent petroleum refiner and nitrogen fertilizer producer generating record profitability Long - term real estate investment horizon with strong, steady cash flows AREP Real Estate Holdings, LLC ; IEP’s subsidiary companies possess key competitive strengths and / or leading market positions ; IEP seeks to create incremental value by investing in organic growth and targeting businesses that offer consolidation opportunities ─ Capitalize on attractive interest rate environment to pursue acquisitions and recognize meaningful synergies 10
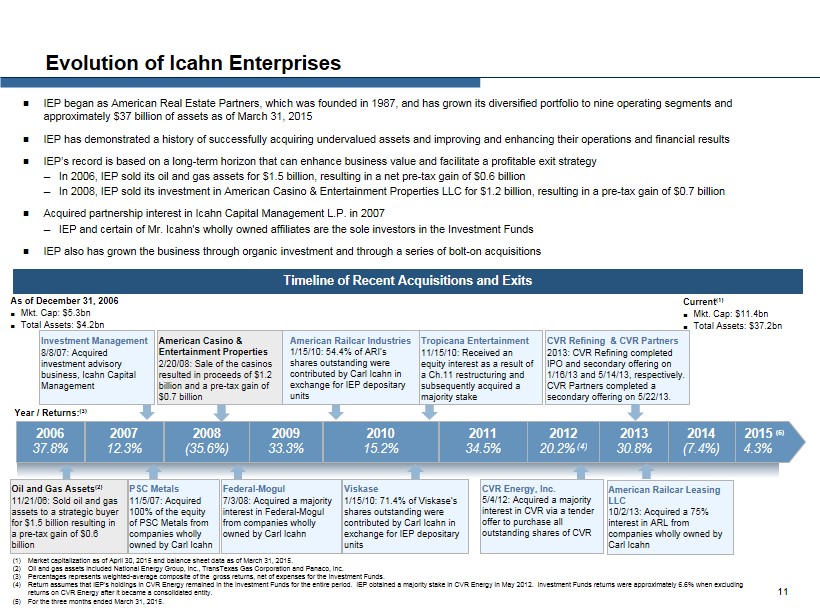
; IEP began as American Real Estate Partners, which was founded in 1987, and has grown its diversified portfolio to nine operating segments and approximately $37 billion of assets as of March 31, 2015 ; IEP has demonstrated a history of successfully acquiring undervalued assets and improving and enhancing their operations and fin ancial results ; IEP’s record is based on a long - term horizon that can enhance business value and facilitate a profitable exit strategy ─ In 2006, IEP sold its oil and gas assets for $1.5 billion, resulting in a net pre - tax gain of $0.6 billion ─ In 2008, IEP sold its investment in American Casino & Entertainment Properties LLC for $1.2 billion, resulting in a pre - tax gain of $0.7 billion ; Acquired partnership interest in Icahn Capital Management L.P . in 2007 ─ IEP and certain of Mr. Icahn's wholly owned affiliates are the sole investors in the Investment Funds ; IEP also has grown the business through organic investment and through a series of bolt - on acquisitions Evolution of Icahn Enterprises Timeline of Recent Acquisitions and Exits (1) Market capitalization as of April 30, 2015 and balance sheet data as of March 31, 2015. (2) Oil and gas assets included National Energy Group, Inc., TransTexas Gas Corporation and Panaco, Inc . (3) Percentages represents weighted - average composite of the gross returns, net of expenses for the Investment Funds. (4) Return assumes that IEP’s holdings in CVR Energy remained in the Investment Funds for the entire period. IEP obtained a majority stake in CVR Energy in May 2012. Investment Fu nds returns were approximately 6.6 % when excluding returns on CVR Energy after it became a consolidated entity . (5) For the three months ended March 31, 2015. As of December 31, 2006 ; Mkt. Cap: $5.3bn ; Total Assets: $4.2bn Current (1) ; Mkt. Cap: $11.4bn ; Total Assets: $37.2bn 2006 37.8% American Casino & Entertainment Properties 2/20/08: Sale of the casinos resulted in proceeds of $1.2 billion and a pre - tax gain of $0.7 b illion American Railcar Industries 1/15/10: 54.4% of ARI’s shares outstanding were contributed by Carl Icahn in exchange for IEP depositary units PSC Metals 11/5/07: Acquired 100% of the equity of PSC Metals from companies wholly owned by Carl Icahn Tropicana Entertainment 11/15/10: Received an equity interest as a result of a Ch.11 restructuring and subsequently acquired a majority stake CVR Energy, Inc. 5/4/12: Acquired a majority interest in CVR via a tender offer to purchase all outstanding shares of CVR Federal - Mogul 7/3/08: Acquired a majority interest in Federal - Mogul from companies wholly owned by Carl Icahn Investment Management 8/8/07: Acquired investment advisory business, Icahn Capital Management Viskase 1/15/10: 71.4 % of Viskase’s shares outstanding were contributed by Carl Icahn in exchange for IEP depositary units Oil and Gas Assets (2) 11/21/06: S old oil and gas assets to a strategic buyer for $1.5 billion resulting in a pre - tax gain of $0.6 billion Year / Returns: (3) 11 CVR Refining & CVR Partners 2013: CVR Refining completed IPO and secondary offering on 1/16/13 and 5/14/13, respectively. CVR Partners completed a secondary offering on 5/22/13. 2015 (5) 4.3% 2007 12.3% 2008 (35.6%) 2009 33.3% 2010 15.2 % 2011 34.5% 2012 20.2% (4) American Railcar Leasing LLC 10/2/13: Acquired a 75% interest in ARL from companies wholly owned by Carl Icahn 2013 30.8 % 2014 (7.4%)
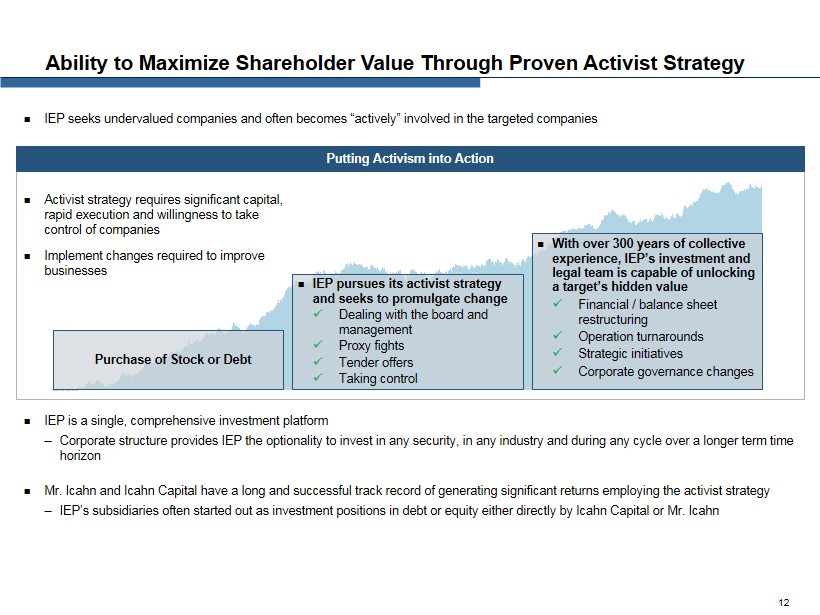
; IEP seeks undervalued companies and often becomes “actively” involved in the targeted companies ; Activist strategy requires significant capital, rapid execution and willingness to take control of companies ; Implement changes required to improve businesses Ability to Maximize Shareholder Value Through Proven Activist Strategy Purchase of Stock or Debt ; IEP pursues its activist strategy and seeks to promulgate change x Dealing with the board and management x Proxy fights x Tender offers x Taking control ; With over 300 years of collective experience, IEP’s investment and legal team is capable of unlocking a target’s hidden value x Financial / balance sheet restructuring x Operation turnarounds x Strategic initiatives x Corporate governance changes ; IEP is a single, comprehensive investment platform ─ Corporate structure provides IEP the optionality to invest in any security, in any industry and during any cycle over a longe r t erm time horizon ; Mr. Icahn and Icahn Capital have a long and successful track record of generating significant returns employing the activist str ategy ─ IEP’s subsidiaries often started out as investment positions in debt or equity either directly by Icahn Capital or Mr. Icahn Putting Activism into Action 12
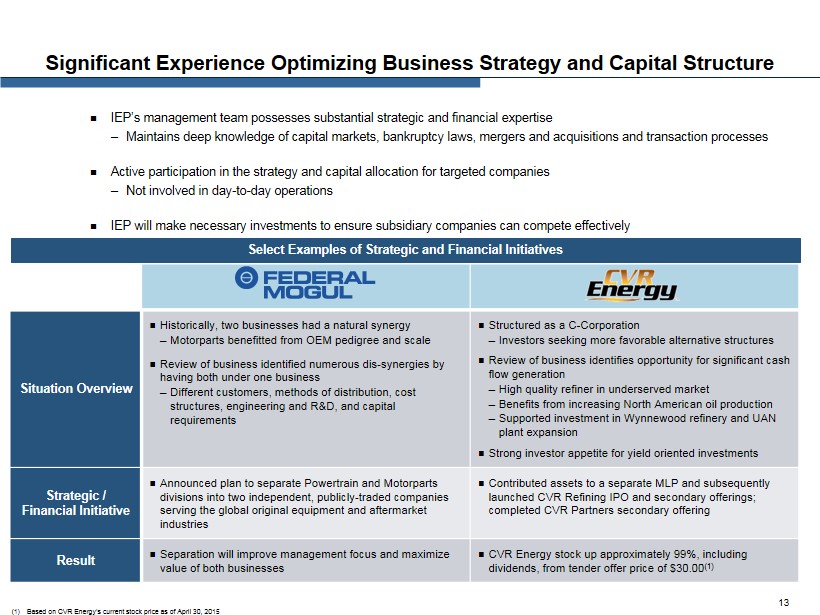
Situation Overview ; Historically, two businesses had a natural synergy ─ Motorparts benefitted from OEM pedigree and scale ; Review of business identified numerous dis - synergies by having both under one business ─ Different customers, methods of distribution, cost structures, engineering and R&D, and capital requirements ; Structured as a C - Corporation ─ Investors seeking more favorable alternative structures ; Review of business identifies opportunity for significant cash flow generation ─ High quality refiner in underserved market ─ Benefits from increasing North American oil production ─ Supported investment in Wynnewood refinery and UAN plant expansion ; Strong investor appetite for yield oriented investments Strategic / Financial Initiative ; Announced plan to separate Powertrain and Motorparts divisions into two independent, publicly - traded companies serving the global original equipment and aftermarket industries ; Contributed assets to a separate MLP and subsequently launched CVR Refining IPO and secondary offerings; completed CVR Partners secondary offering Result ; Separation will improve management focus and maximize value of both businesses ; CVR Energy stock up approximately 99%, including dividends, from tender offer price of $30.00 (1) Significant Experience Optimizing Business Strategy and Capital Structure ; IEP’s management team possesses substantial strategic and financial expertise ─ Maintains deep knowledge of capital markets, bankruptcy laws, mergers and acquisitions and transaction processes ; Active participation in the strategy and capital allocation for targeted companies ─ Not involved in day - to - day operations ; IEP w ill make necessary investments to ensure subsidiary companies can compete effectively Select Examples of Strategic and Financial Initiatives (1) Based on CVR Energy’s current stock price as of April 30, 2015 13
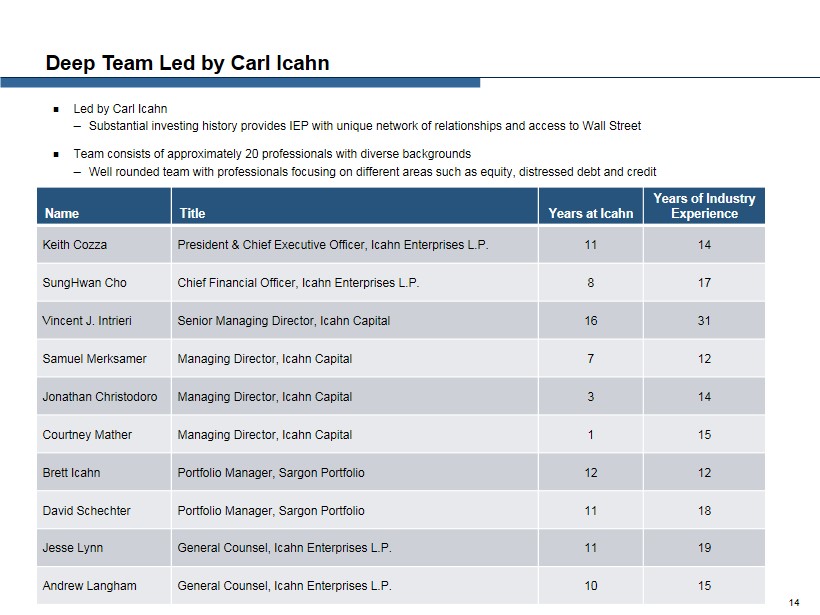
Deep Team Led by Carl Icahn ; Led by Carl Icahn ─ Substantial investing history provides IEP with unique network of relationships and access to Wall Street ; Team consists of approximately 20 professionals with diverse backgrounds ─ Well rounded team with professionals focusing on different areas such as equity, distressed debt and credit Name Title Years at Icahn Years of Industry Experience Keith Cozza President & Chief Executive Officer , Icahn Enterprises L.P. 11 14 SungHwan Cho Chief Financial Officer , Icahn Enterprises L.P. 8 17 Vincent J. Intrieri Senior Managing Director, Icahn Capital 16 31 Samuel Merksamer Managing Director, Icahn Capital 7 12 Jonathan Christodoro Managing Director, Icahn Capital 3 14 Courtney Mather Managing Director, Icahn Capital 1 15 Brett Icahn Portfolio Manager, Sargon Portfolio 12 12 David Schechter Portfolio Manager, Sargon Portfolio 11 18 Jesse Lynn General Counsel, Icahn Enterprises L.P. 11 19 Andrew Langham General Counsel, Icahn Enterprises L.P. 10 15 14
Overview of Operating Segments 15
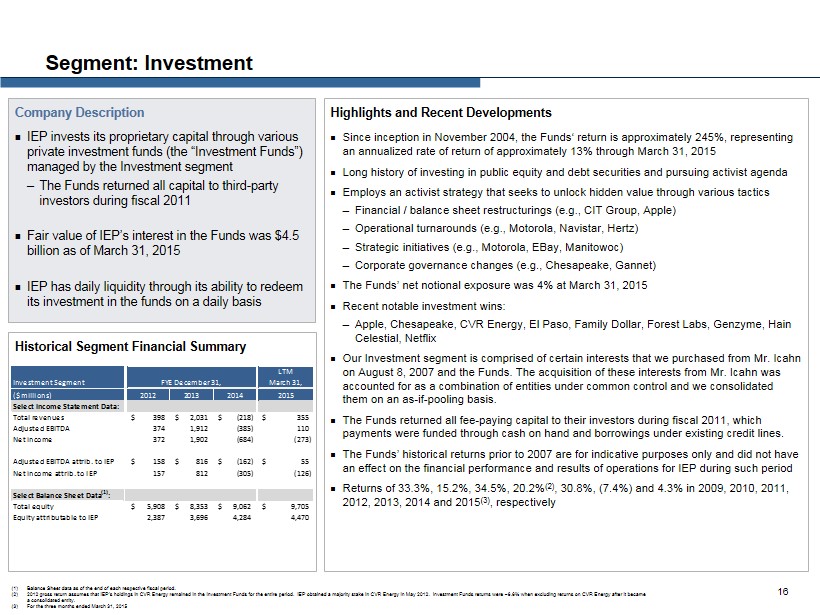
Highlights and Recent Developments ; Since inception in November 2004, the Funds‘ return is approximately 245%, representing an annualized rate of return of approximately 13% through March 31, 2015 ; Long history of investing in public equity and debt securities and pursuing activist agenda ; Employs an activist strategy that seeks to unlock hidden value through various tactics ─ Financial / balance sheet restructurings (e.g., CIT Group, Apple) ─ Operational turnarounds (e.g., Motorola, Navistar, Hertz) ─ Strategic initiatives (e.g., Motorola, EBay, Manitowoc) ─ Corporate governance changes (e.g., Chesapeake, Gannet) ; The Funds’ net notional exposure was 4% at March 31, 2015 ; Recent notable investment wins: ─ Apple, Chesapeake, CVR Energy, El Paso, Family Dollar, Forest Labs, Genzyme , Hain Celestial, Netflix ; Our Investment segment is comprised of certain interests that we purchased from Mr. Icahn on August 8, 2007 and the Funds. The acquisition of these interests from Mr. Icahn was accounted for as a combination of entities under common control and we consolidated them on an as - if - pooling basis. ; The Funds returned all fee - paying capital to their investors during fiscal 2011, which payments were funded through cash on hand and borrowings under existing credit lines. ; The Funds’ historical returns prior to 2007 are for indicative purposes only and did not have an effect on the financial performance and results of operations for IEP during such period ; Returns of 33.3%, 15.2%, 34.5%, 20.2% (2) , 30.8%, (7.4%) and 4.3% in 2009, 2010, 2011, 2012, 2013, 2014 and 2015 (3) , respectively Segment: Investment Company Description ; IEP invests its proprietary capital through various private investment funds (the “Investment Funds”) managed by the Investment segment ─ The Funds returned all capital to third - party investors during fiscal 2011 ; Fair value of IEP’s interest in the Funds was $4.5 billion as of March 31, 2015 ; IEP has daily liquidity through its ability to redeem its investment in the funds on a daily basis Historical Segment Financial Summary 16 (1) Balance Sheet data as of the end of each respective fiscal period. (2) 2012 gross return assumes that IEP’s holdings in CVR Energy remained in the Investment Funds for the entire period. IEP obta ine d a majority stake in CVR Energy in May 2012. Investment Funds returns were ~6.6% when excluding returns on CVR Energy after it became a consolidated entity. (3) For the three months ended March 31, 2015 Investment Segment LTM March 31, ($ millions) 2012 2013 2014 2015 Select Income Statement Data: Total revenues 398$ 2,031$ (218)$ 355$ Adjusted EBITDA 374 1,912 (385) 110 Net income 372 1,902 (684) (273) Adjusted EBITDA attrib. to IEP 158$ 816$ (162)$ 55$ Net income attrib. to IEP 157 812 (305) (126) Select Balance Sheet Data (1) : Total equity 5,908$ 8,353$ 9,062$ 9,705$ Equity attributable to IEP 2,387 3,696 4,284 4,470 FYE December 31,
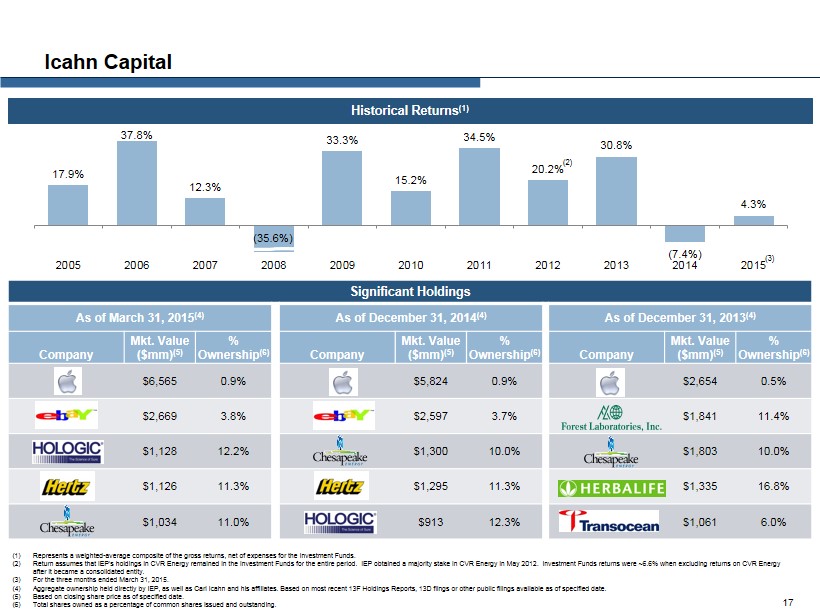
Significant Holdings As of March 31 , 2015 (4) As of December 31, 2014 (4) As of December 31, 2013 (4) Company Mkt. Value ($mm) (5) % Ownership (6) Company Mkt. Value ($mm) (5) % Ownership (6) Company Mkt. Value ($mm) (5) % Ownership (6) $6,565 0.9% $5,824 0.9% $2,654 0.5% $2,669 3.8% $2,597 3.7% $1,841 11.4% $1,128 12.2% $1,300 10.0% $1,803 10.0% $1,126 11.3% $1,295 11.3% $1,335 16.8% $1,034 11.0% $913 12.3% $1,061 6.0% Icahn Capital (1) Represents a weighted - average composite of the gross returns, net of expenses for the Investment Funds. (2) Return assumes that IEP’s holdings in CVR Energy remained in the Investment Funds for the entire period. IEP obtained a majority stake in CVR Energy in May 2012. Inv est ment Funds returns were ~ 6.6% when excluding returns on CVR Energy after it became a consolidated entity . (3) For the three months ended March 31, 2015. (4) Aggregate ownership held directly by IEP, as well as Carl Icahn and his affiliates. Based on most recent 13F Holdings Reports , 1 3D flings or other public filings available as of specified date. (5) Based on closing share price as of specified date. (6) Total shares owned as a percentage of common shares issued and outstanding. 17.9% 37.8% 12.3% 33.3% 15.2% 34.5% 20.2% 30.8% (7.4%) 4.3% 2005 2006 2007 2008 2009 2010 2011 2012 2013 2014 2015 Historical Returns (1) (35.6%) (2) 17 (3)
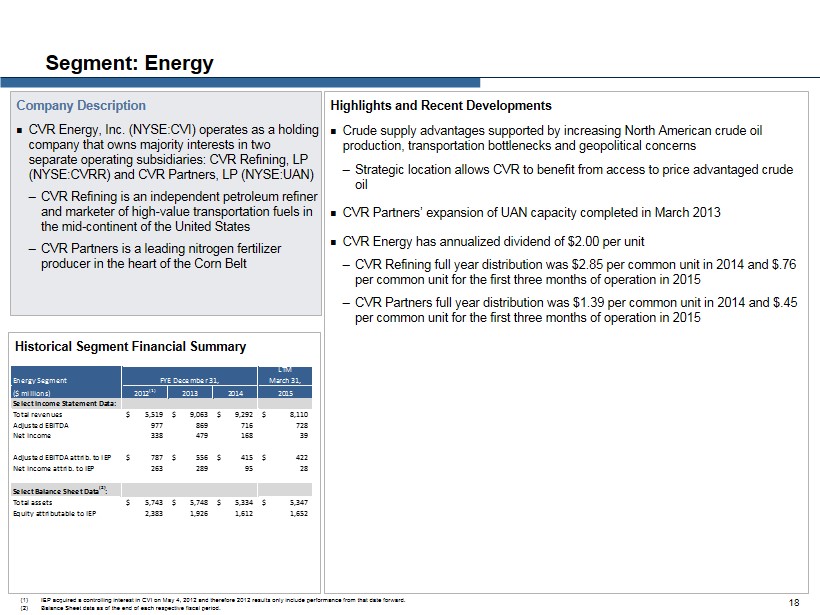
Highlights and Recent Developments ; Crude supply advantages supported by increasing North American crude oil production, transportation bottlenecks and geopolitical concerns ─ Strategic location allows CVR to benefit from access to price advantaged crude oil ; CVR Partners’ expansion of UAN capacity completed in March 2013 ; CVR Energy has annualized dividend of $2.00 per unit ─ CVR Refining full year distribution was $2.85 per common unit in 2014 and $.76 per common unit for the first three months of operation in 2015 ─ CVR Partners full year distribution was $1.39 per common unit in 2014 and $.45 per common unit for the first three months of operation in 2015 Segment: Energy Company Description ; CVR Energy, Inc. (NYSE:CVI) operates as a holding company that owns majority interests in two separate operating subsidiaries: CVR Refining, LP (NYSE:CVRR) and CVR Partners, LP ( NYSE:UAN ) ─ CVR Refining is an independent petroleum refiner and marketer of high - value transportation fuels in the mid - continent of the United States ─ CVR Partners is a leading nitrogen fertilizer producer in the heart of the Corn Belt Historical Segment Financial Summary 18 (1) IEP acquired a controlling interest in CVI on May 4, 2012 and therefore 2012 results only include performance from that date for ward. (2) Balance Sheet data as of the end of each respective fiscal period. Energy Segment LTM March 31, ($ millions) 2012 (1) 2013 2014 2015 Select Income Statement Data: Total revenues 5,519$ 9,063$ 9,292$ 8,110$ Adjusted EBITDA 977 869 716 728 Net income 338 479 168 39 Adjusted EBITDA attrib. to IEP 787$ 556$ 415$ 422$ Net income attrib. to IEP 263 289 95 28 Select Balance Sheet Data (2) : Total assets 5,743$ 5,748$ 5,334$ 5,347$ Equity attributable to IEP 2,383 1,926 1,612 1,652 FYE December 31,
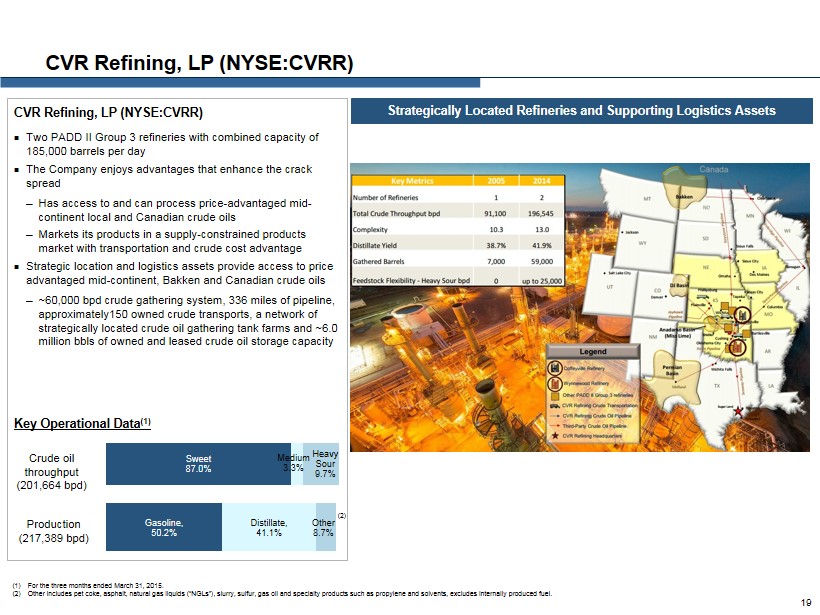
Gasoline , 50.2% Distillate , 41.1% Other 8.7% CVR Refining, LP (NYSE:CVRR ) ; Two PADD II Group 3 refineries with combined capacity of 185,000 barrels per day ; The Company enjoys advantages that enhance the crack spread ─ Has access to and can process price - advantaged mid - continent local and Canadian crude oils ─ Markets its products in a supply - constrained products market with transportation and crude cost advantage ; Strategic location and logistics assets provide access to price advantaged mid - continent , Bakken and Canadian crude oils ─ ~ 6 0,000 bpd crude gathering system, 336 miles of pipeline, approximately150 owned crude transports, a network of strategically located crude oil gathering tank farms and ~ 6.0 million bbls of owned and leased crude oil storage capacity Key Operational Data (1) CVR Refining, LP (NYSE:CVRR) Crude oil throughput (201,664 bpd) Production (217,389 bpd ) (1) For the three months ended March 31, 2015. (2) Other includes pet coke, asphalt, natural gas liquids (“NGLs”), slurry, sulfur, gas oil and specialty products such as propyl ene and solvents, excludes internally produced fuel. Strategically Located Refineries and Supporting Logistics Assets 19 (2) Sweet 87.0% Medium 3.3% Heavy Sour 9.7%
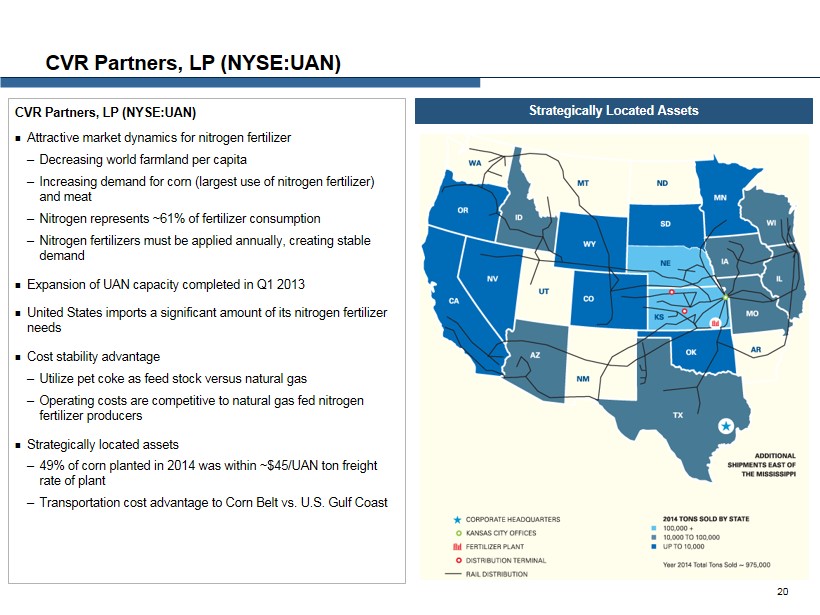
CVR Partners, LP (NYSE:UAN ) ; Attractive market dynamics for nitrogen fertilizer ─ Decreasing world farmland per capita ─ Increasing demand for corn (largest use of nitrogen fertilizer) and meat ─ Nitrogen represents ~61% of fertilizer consumption ─ Nitrogen fertilizers must be applied annually, creating stable demand ; Expansion of UAN capacity completed in Q1 2013 ; United States imports a significant amount of its nitrogen fertilizer needs ; Cost stability advantage ─ Utilize pet coke as feed stock versus natural gas ─ Operating costs are competitive to natural gas fed nitrogen fertilizer producers ; Strategically located assets ─ 49% of corn planted in 2014 was within ~$45/UAN ton freight rate of plant ─ Transportation cost advantage to Corn Belt vs. U.S. Gulf Coast CVR Partners, LP (NYSE:UAN ) Strategically Located Assets 20
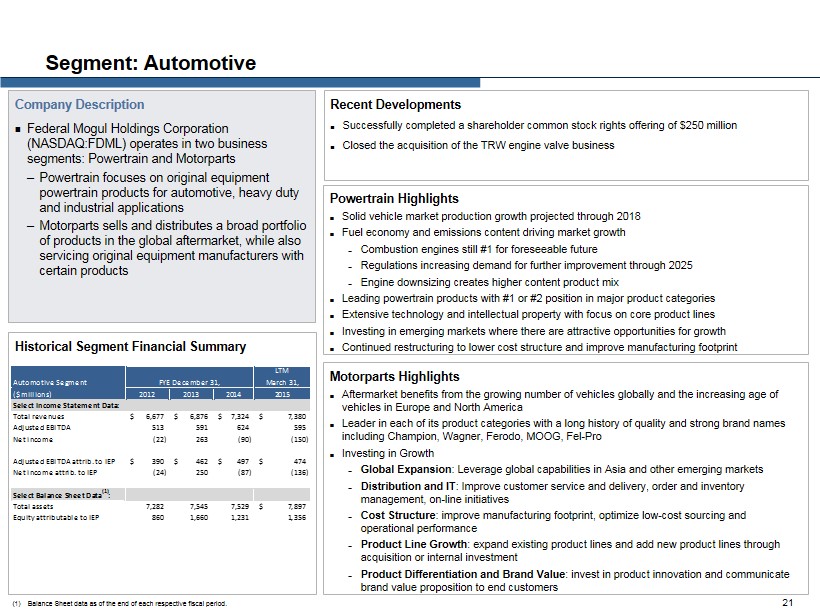
Segment: Automotive Company Description ; Federal Mogul Holdings Corporation (NASDAQ:FDML) operates in two business segments: Powertrain and Motorparts ─ Powertrain focuses on original equipment powertrain products for automotive, heavy duty and industrial applications ─ Motorparts sells and distributes a broad portfolio of products in the global aftermarket, while also servicing original equipment manufacturers with certain products Historical Segment Financial Summary Powertrain Highlights ; Solid vehicle market production growth projected through 2018 ; Fuel economy and emissions content driving market growth – Combustion engines still #1 for foreseeable future – Regulations increasing demand for further improvement through 2025 – Engine downsizing creates higher content product mix ; Leading powertrain products with #1 or #2 position in major product categories ; Extensive technology and intellectual property with focus on core product lines ; Investing in emerging markets where there are attractive opportunities for growth ; Continued restructuring to lower cost structure and improve manufacturing footprint Motorparts Highlights ; Aftermarket benefits from the growing number of vehicles globally and the increasing age of vehicles in Europe and North America ; Leader in each of its product categories with a long history of quality and strong brand names including Champion, Wagner, Ferodo, MOOG, Fel - Pro ; Investing in Growth – Global Expansion : L everage global capabilities in Asia and other emerging markets – Distribution and IT : Improve customer service and delivery, order and inventory management, on - line initiatives – Cost Structure : improve manufacturing footprint, optimize low - cost sourcing and operational performance – Product Line Growth : expand existing product lines and add new product lines through acquisition or internal investment – Product Differentiation and Brand Value : invest in product innovation and communicate brand value proposition to end customers 21 Recent Developments ; Successfully completed a shareholder common stock rights offering of $250 million ; Closed the acquisition of the TRW engine valve business (1) Balance Sheet data as of the end of each respective fiscal period. Automotive Segment LTM March 31, ($ millions) 2012 2013 2014 2015 Select Income Statement Data: Total revenues 6,677$ 6,876$ 7,324$ 7,380$ Adjusted EBITDA 513 591 624 595 Net income (22) 263 (90) (150) Adjusted EBITDA attrib. to IEP 390$ 462$ 497$ 474$ Net income attrib. to IEP (24) 250 (87) (136) Select Balance Sheet Data (1) : Total assets 7,282 7,545 7,529 7,897$ Equity attributable to IEP 860 1,660 1,231 1,356 FYE December 31,
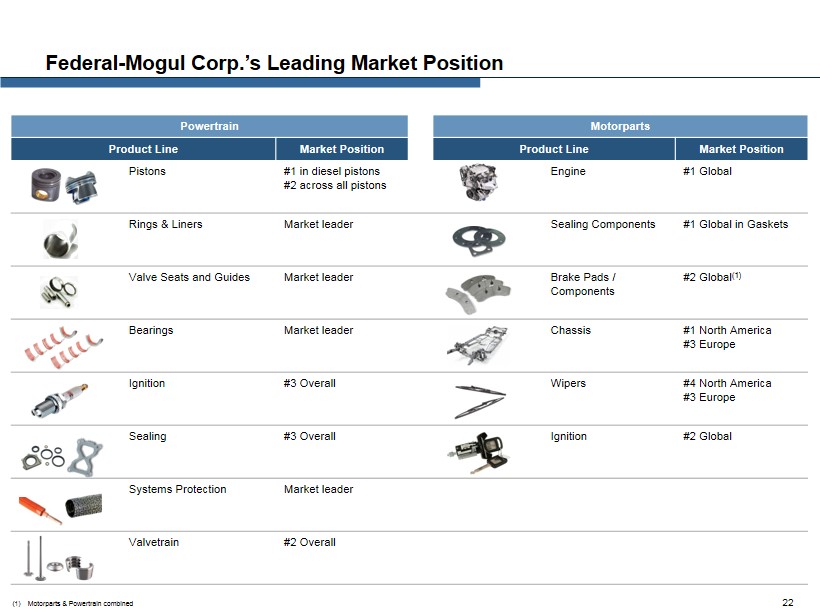
Federal - Mogul Corp.’s Leading Market Position 22 Powertrain Motorparts Product Line Market Position Product Line Market Position Pistons #1 in diesel pistons #2 a cross all pistons Engine #1 Global Rings & Liners Market leader Sealing Components #1 Global in Gaskets Valve Seats and Guides Market leader Brake Pads / Components #2 Global (1) Bearings Market leader Chassis #1 North America #3 Europe Ignition #3 Overall Wipers #4 North America #3 Europe Sealing #3 Overall Ignition #2 Global Systems Protection Market leader Valvetrain #2 Overall (1) Motorparts & Powertrain combined
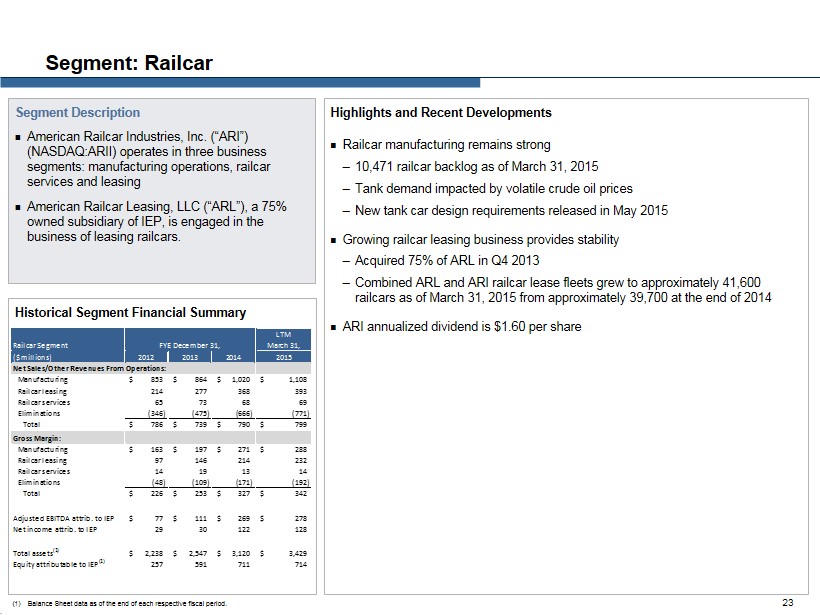
Highlights and Recent Developments ; Railcar manufacturing remains strong ─ 10,471 railcar backlog as of March 31, 2015 ─ Tank demand impacted by volatile crude oil prices ─ New tank car design requirements released in May 2015 ; Growing railcar leasing business provides stability ─ Acquired 75% of ARL in Q4 2013 ─ Combined ARL and ARI railcar lease fleets grew to approximately 41,600 railcars as of March 31, 2015 from approximately 39,700 at the end of 2014 ; ARI annualized dividend is $1.60 per share Segment: Railcar Segment Description ; American Railcar Industries, Inc. (“ARI”) (NASDAQ:ARII ) operates in three business segments: manufacturing operations, railcar services and leasing ; American Railcar Leasing, LLC (“ARL”), a 75% owned subsidiary of IEP, is engaged in the business of leasing railcars. Historical Segment Financial Summary . 23 (1) Balance Sheet data as of the end of each respective fiscal period. Railcar Segment LTM March 31, ($ millions) 2012 2013 2014 2015 Net Sales/Other Revenues From Operations: Manufacturing 853$ 864$ 1,020$ 1,108$ Railcar leasing 214 277 368 393 Railcar services 65 73 68 69 Eliminations (346) (475) (666) (771) Total 786$ 739$ 790$ 799$ Gross Margin: Manufacturing 163$ 197$ 271$ 288$ Railcar leasing 97 146 214 232 Railcar services 14 19 13 14 Eliminations (48) (109) (171) (192) Total 226$ 253$ 327$ 342$ Adjusted EBITDA attrib. to IEP 77$ 111$ 269$ 278$ Net income attrib. to IEP 29 30 122 128 Total assets (1) 2,238$ 2,547$ 3,120$ 3,429$ Equity attributable to IEP (1) 257 591 711 714 FYE December 31,
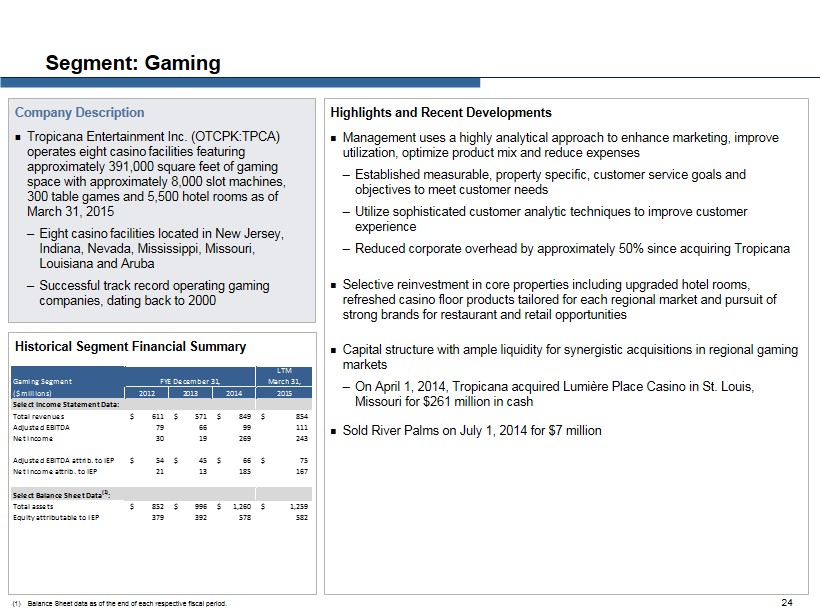
Highlights and Recent Developments ; Management uses a highly analytical approach to enhance marketing, improve utilization, optimize product mix and reduce expenses ─ Established measurable, property specific, customer service goals and objectives to meet customer needs ─ Utilize sophisticated customer analytic techniques to improve customer experience ─ Reduced corporate overhead by approximately 50% since acquiring Tropicana ; Selective reinvestment in core properties including upgraded hotel rooms, refreshed casino floor products tailored for each regional market and pursuit of strong brands for restaurant and retail opportunities ; Capital structure with ample liquidity for synergistic acquisitions in regional gaming markets ─ On April 1, 2014, Tropicana acquired Lumière Place Casino in St. Louis, Missouri for $261 million in cash ; Sold River Palms on July 1, 2014 for $7 million Segment: Gaming Company Description ; Tropicana Entertainment Inc. (OTCPK:TPCA) operates eight casino facilities featuring approximately 391,000 square feet of gaming space with approximately 8,000 slot machines, 300 table games and 5,500 hotel rooms as of March 31, 2015 ─ Eight casino facilities located in New Jersey, Indiana, Nevada, Mississippi, Missouri, Louisiana and Aruba ─ Successful track record operating gaming companies, dating back to 2000 Historical Segment Financial Summary 24 (1) Balance Sheet data as of the end of each respective fiscal period. Gaming Segment LTM March 31, ($ millions) 2012 2013 2014 2015 Select Income Statement Data: Total revenues 611$ 571$ 849$ 854$ Adjusted EBITDA 79 66 99 111 Net income 30 19 269 243 Adjusted EBITDA attrib. to IEP 54$ 45$ 66$ 75$ Net income attrib. to IEP 21 13 185 167 Select Balance Sheet Data (1) : Total assets 852$ 996$ 1,260$ 1,259$ Equity attributable to IEP 379 392 578 582 FYE December 31,
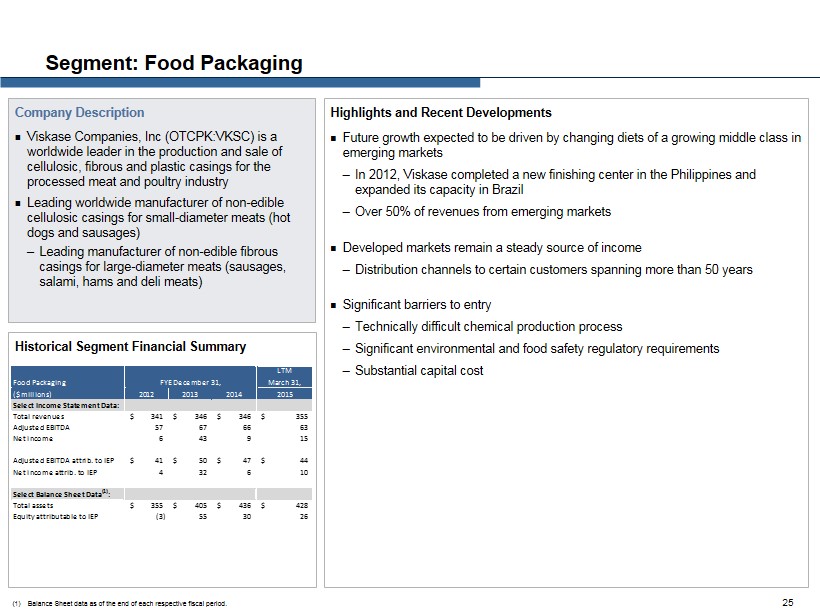
Highlights and Recent Developments ; Future growth expected to be driven by changing diets of a growing middle class in emerging markets ─ In 2012, Viskase completed a new finishing center in the Philippines and expanded its capacity in Brazil ─ Over 50% of revenues from emerging markets ; Developed markets remain a steady source of income ─ Distribution channels to certain customers spanning more than 50 years ; Significant barriers to entry ─ Technically difficult chemical production process ─ Significant environmental and food safety regulatory requirements ─ Substantial capital cost Segment: Food Packaging Company Description ; Viskase Companies, Inc (OTCPK:VKSC) is a worldwide leader in the production and sale of cellulosic, fibrous and plastic casings for the processed meat and poultry industry ; Leading worldwide manufacturer of non - edible cellulosic casings for small - diameter meats (hot dogs and sausages) ─ Leading manufacturer of non - edible fibrous casings for large - diameter meats (sausages, salami, hams and deli meats) Historical Segment Financial Summary 25 (1) Balance Sheet data as of the end of each respective fiscal period. Food Packaging LTM March 31, ($ millions) 2012 2013 2014 2015 Select Income Statement Data: Total revenues 341$ 346$ 346$ 355$ Adjusted EBITDA 57 67 66 63 Net income 6 43 9 15 Adjusted EBITDA attrib. to IEP 41$ 50$ 47$ 44$ Net income attrib. to IEP 4 32 6 10 Select Balance Sheet Data (1) : Total assets 355$ 405$ 436$ 428$ Equity attributable to IEP (3) 55 30 26 FYE December 31,
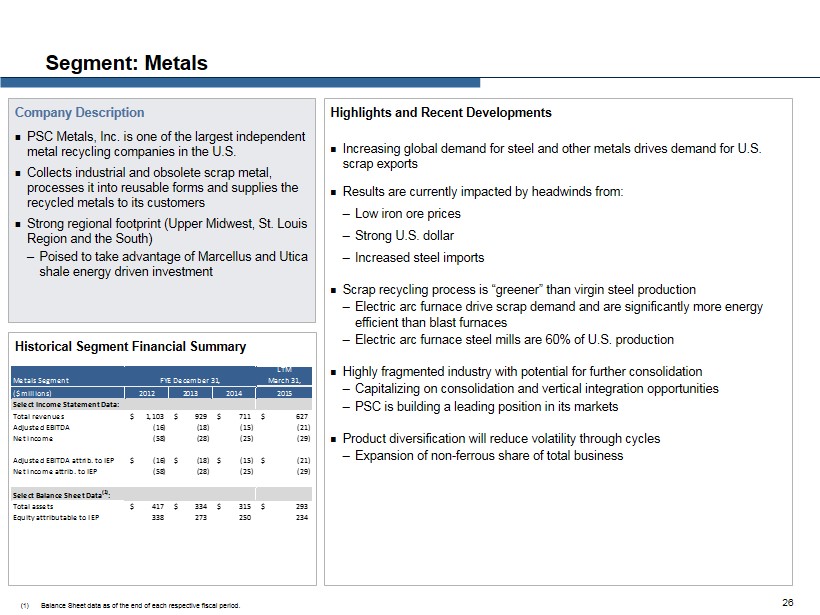
Highlights and Recent Developments ; Increasing global demand for steel and other metals drives demand for U.S. scrap exports ; Results are currently impacted by headwinds from: ─ Low iron ore prices ─ Strong U.S. dollar ─ Increased steel imports ; Scrap recycling process is “greener” than virgin steel production ─ Electric arc furnace drive scrap demand and are significantly more energy efficient than blast furnaces ─ Electric arc furnace steel mills are 60% of U.S. production ; Highly fragmented industry with potential for further consolidation ─ Capitalizing on consolidation and vertical integration opportunities ─ PSC is building a leading position in its markets ; Product diversification will reduce volatility through cycles ─ Expansion of non - ferrous share of total business Segment: Metals Company Description ; PSC Metals, Inc. is one of the largest independent metal recycling companies in the U.S. ; Collects industrial and obsolete scrap metal, processes it into reusable forms and supplies the recycled metals to its customers ; Strong regional footprint (Upper Midwest, St. Louis Region and the South) ─ Poised to take advantage of Marcellus and Utica shale energy driven investment Historical Segment Financial Summary 26 (1) Balance Sheet data as of the end of each respective fiscal period. Metals Segment LTM March 31, ($ millions) 2012 2013 2014 2015 Select Income Statement Data: Total revenues 1,103$ 929$ 711$ 627$ Adjusted EBITDA (16) (18) (15) (21) Net income (58) (28) (25) (29) Adjusted EBITDA attrib. to IEP (16)$ (18)$ (15)$ (21)$ Net income attrib. to IEP (58) (28) (25) (29) Select Balance Sheet Data (1) : Total assets 417$ 334$ 315$ 293$ Equity attributable to IEP 338 273 250 234 FYE December 31,
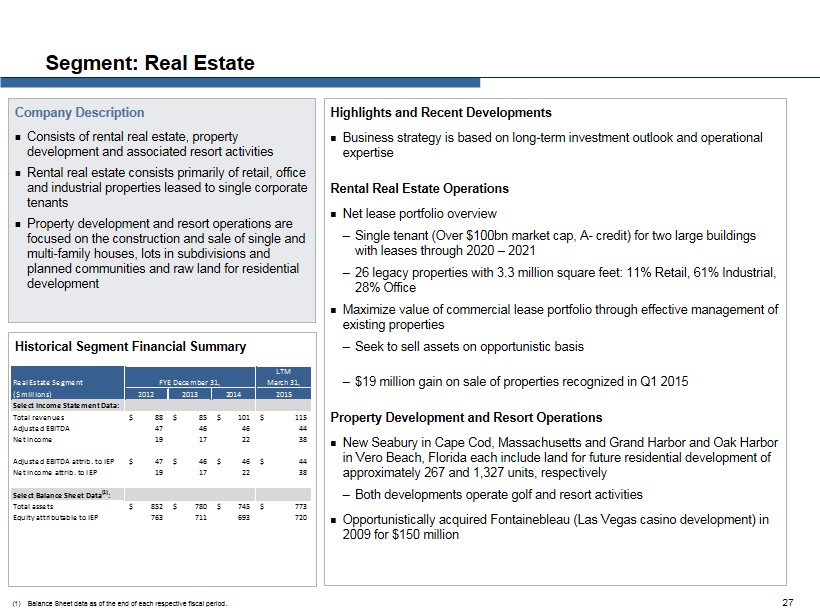
Highlights and Recent Developments ; Business strategy is based on long - term investment outlook and operational expertise Rental Real Estate Operations ; Net lease portfolio overview ─ Single tenant (Over $100bn market cap, A - credit) for two large buildings with leases through 2020 – 2021 ─ 26 legacy properties with 3.3 million square feet: 11% Retail, 61% Industrial, 28% Office ; Maximize value of commercial lease portfolio through effective management of existing properties ─ Seek to sell assets on opportunistic basis ─ $19 million gain on sale of properties recognized in Q1 2015 Property Development and Resort Operations ; New Seabury in Cape Cod, Massachusetts and Grand Harbor and Oak Harbor in Vero Beach, Florida each include land for future residential development of approximately 267 and 1,327 units, respectively ─ Both developments operate golf and resort activities ; Opportunistically acquired Fontainebleau (Las Vegas casino development) in 2009 for $150 million Segment: Real Estate Company Description ; Consists of rental real estate, property development and associated resort activities ; Rental real estate consists primarily of retail, office and industrial properties leased to single corporate tenants ; Property development and resort operations are focused on the construction and sale of single and multi - family houses, lots in subdivisions and planned communities and raw land for residential development Historical Segment Financial Summary 27 (1) Balance Sheet data as of the end of each respective fiscal period. Real Estate Segment LTM March 31, ($ millions) 2012 2013 2014 2015 Select Income Statement Data: Total revenues 88$ 85$ 101$ 115$ Adjusted EBITDA 47 46 46 44 Net income 19 17 22 38 Adjusted EBITDA attrib. to IEP 47$ 46$ 46$ 44$ Net income attrib. to IEP 19 17 22 38 Select Balance Sheet Data (1) : Total assets 852$ 780$ 745$ 773$ Equity attributable to IEP 763 711 693 720 FYE December 31,
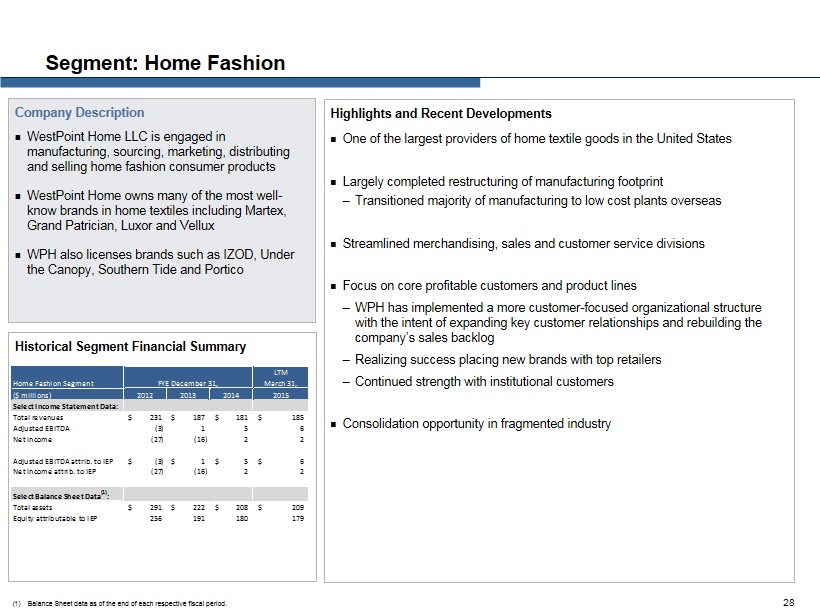
Highlights and Recent Developments ; One of the largest providers of home textile goods in the United States ; Largely completed restructuring of manufacturing footprint ─ Transitioned majority of manufacturing to low cost plants overseas ; Streamlined merchandising, sales and customer service divisions ; Focus on core profitable customers and product lines ─ WPH has implemented a more customer - focused organizational structure with the intent of expanding key customer relationships and rebuilding the company’s sales backlog ─ Realizing success placing new brands with top retailers ─ Continued strength with institutional customers ; Consolidation opportunity in fragmented industry Segment: Home Fashion Company Description ; WestPoint Home LLC is engaged in manufacturing, sourcing, marketing, distributing and selling home fashion consumer products ; WestPoint Home owns many of the most well - know brands in home textiles including Martex, Grand Patrician, Luxor and Vellux ; WPH also licenses brands such as IZOD, Under the Canopy, Southern Tide and Portico Historical Segment Financial Summary 28 (1) Balance Sheet data as of the end of each respective fiscal period. Home Fashion Segment LTM March 31, ($ millions) 2012 2013 2014 2015 Select Income Statement Data: Total revenues 231$ 187$ 181$ 185$ Adjusted EBITDA (3) 1 5 6 Net income (27) (16) 2 2 Adjusted EBITDA attrib. to IEP (3)$ 1$ 5$ 6$ Net income attrib. to IEP (27) (16) 2 2 Select Balance Sheet Data (1) : Total assets 291$ 222$ 208$ 209$ Equity attributable to IEP 256 191 180 179 FYE December 31,
Financial Performance 29
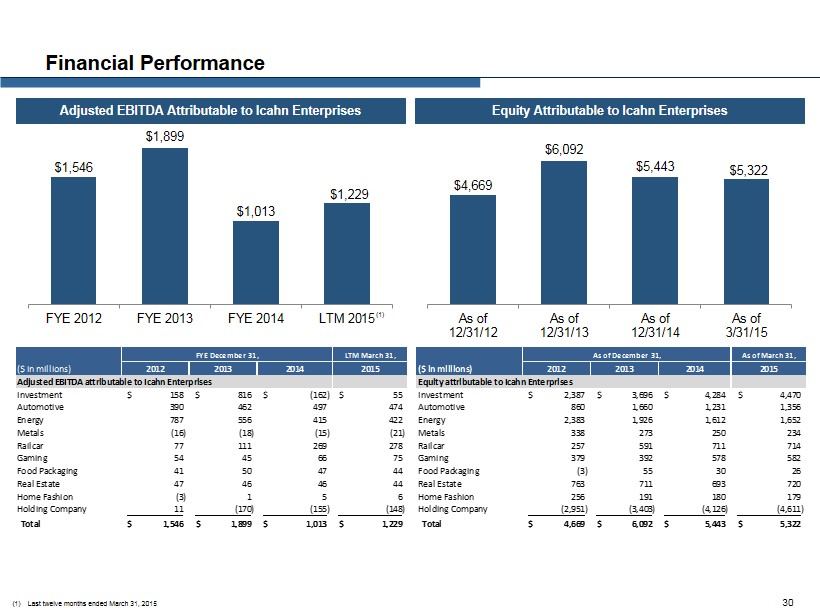
Financial Performance Adjusted EBITDA Attributable to Icahn Enterprises Equity Attributable to Icahn Enterprises 30 $1,546 $1,899 $1,013 $1,229 FYE 2012 FYE 2013 FYE 2014 LTM 2015 $4,669 $6,092 $5,443 $5,322 As of 12/31/12 As of 12/31/13 As of 12/31/14 As of 3/31/15 LTM March 31, As of March 31, ($ in millions) 2012 2013 2014 2015 ($ in millions) 2012 2013 2014 2015 Adjusted EBITDA attributable to Icahn Enterprises Equity attributable to Icahn Enterprises Investment 158$ 816$ (162)$ 55$ Investment 2,387$ 3,696$ 4,284$ 4,470$ Automotive 390 462 497 474 Automotive 860 1,660 1,231 1,356 Energy 787 556 415 422 Energy 2,383 1,926 1,612 1,652 Metals (16) (18) (15) (21) Metals 338 273 250 234 Railcar 77 111 269 278 Railcar 257 591 711 714 Gaming 54 45 66 75 Gaming 379 392 578 582 Food Packaging 41 50 47 44 Food Packaging (3) 55 30 26 Real Estate 47 46 46 44 Real Estate 763 711 693 720 Home Fashion (3) 1 5 6 Home Fashion 256 191 180 179 Holding Company 11 (170) (155) (148) Holding Company (2,951) (3,403) (4,126) (4,611) Total 1,546$ 1,899$ 1,013$ 1,229$ Total 4,669$ 6,092$ 5,443$ 5,322$ FYE December 31, As of December 31, (1) (1) Last twelve months ended March 31, 2015
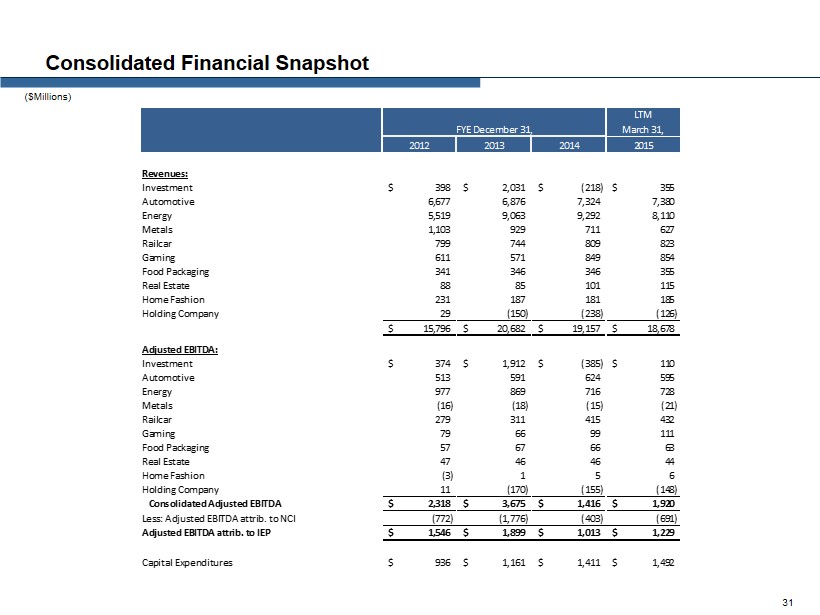
Consolidated Financial Snapshot ($Millions) 31 LTM March 31, 2012 2013 2014 2015 Revenues: Investment 398$ 2,031$ (218)$ 355$ Automotive 6,677 6,876 7,324 7,380 Energy 5,519 9,063 9,292 8,110 Metals 1,103 929 711 627 Railcar 799 744 809 823 Gaming 611 571 849 854 Food Packaging 341 346 346 355 Real Estate 88 85 101 115 Home Fashion 231 187 181 185 Holding Company 29 (150) (238) (126) 15,796$ 20,682$ 19,157$ 18,678$ Adjusted EBITDA: Investment 374$ 1,912$ (385)$ 110$ Automotive 513 591 624 595 Energy 977 869 716 728 Metals (16) (18) (15) (21) Railcar 279 311 415 432 Gaming 79 66 99 111 Food Packaging 57 67 66 63 Real Estate 47 46 46 44 Home Fashion (3) 1 5 6 Holding Company 11 (170) (155) (148) Consolidated Adjusted EBITDA 2,318$ 3,675$ 1,416$ 1,920$ Less: Adjusted EBITDA attrib. to NCI (772) (1,776) (403) (691) Adjusted EBITDA attrib. to IEP 1,546$ 1,899$ 1,013$ 1,229$ Capital Expenditures 936$ 1,161$ 1,411$ 1,492$ FYE December 31,
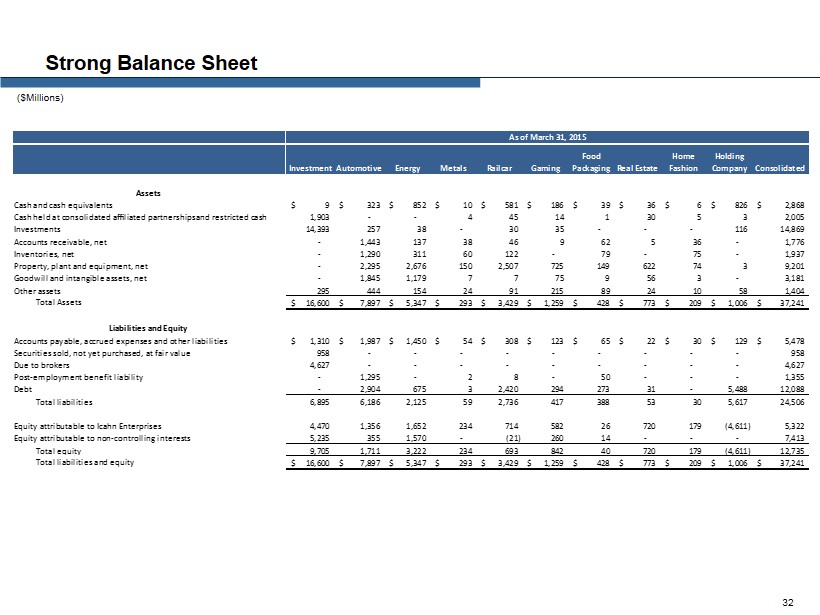
Strong Balance Sheet ($Millions) 32 InvestmentAutomotive Energy Metals Railcar Gaming Food Packaging Real Estate Home Fashion Holding Company Consolidated Assets Cash and cash equivalents 9$ 323$ 852$ 10$ 581$ 186$ 39$ 36$ 6$ 826$ 2,868$ Cash held at consolidated affiliated partnerships;and restricted cash 1,903 - - 4 45 14 1 30 5 3 2,005 Investments 14,393 257 38 - 30 35 - - - 116 14,869 Accounts receivable, net - 1,443 137 38 46 9 62 5 36 - 1,776 Inventories, net - 1,290 311 60 122 - 79 - 75 - 1,937 Property, plant and equipment, net - 2,295 2,676 150 2,507 725 149 622 74 3 9,201 Goodwill and intangible assets, net - 1,845 1,179 7 7 75 9 56 3 - 3,181 Other assets 295 444 154 24 91 215 89 24 10 58 1,404 Total Assets 16,600$ 7,897$ 5,347$ 293$ 3,429$ 1,259$ 428$ 773$ 209$ 1,006$ 37,241$ Liabilities and Equity Accounts payable, accrued expenses and other liabilities 1,310$ 1,987$ 1,450$ 54$ 308$ 123$ 65$ 22$ 30$ 129$ 5,478$ Securities sold, not yet purchased, at fair value 958 - - - - - - - - - 958 Due to brokers 4,627 - - - - - - - - - 4,627 Post-employment benefit liability - 1,295 - 2 8 - 50 - - - 1,355 Debt - 2,904 675 3 2,420 294 273 31 - 5,488 12,088 Total liabilities 6,895 6,186 2,125 59 2,736 417 388 53 30 5,617 24,506 Equity attributable to Icahn Enterprises 4,470 1,356 1,652 234 714 582 26 720 179 (4,611) 5,322 Equity attributable to non-controlling interests 5,235 355 1,570 - (21) 260 14 - - - 7,413 Total equity 9,705 1,711 3,222 234 693 842 40 720 179 (4,611) 12,735 Total liabilities and equity 16,600$ 7,897$ 5,347$ 293$ 3,429$ 1,259$ 428$ 773$ 209$ 1,006$ 37,241$ As of March 31, 2015
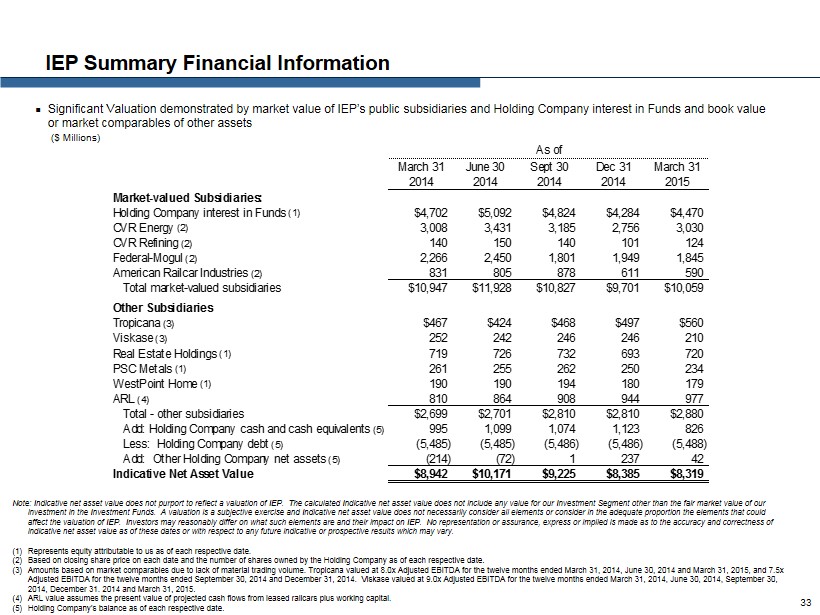
IEP Summary Financial Information ; Significant Valuation demonstrated by market value of IEP’s public subsidiaries and Holding Company interest in Funds and book value or market comparables of other assets 33 ($ Millions) Note: Indicative net asset value does not purport to reflect a valuation of IEP. The calculated Indicative net asset value d oes not include any value for our Investment Segment other than the fair market value of our investment in the Investment Funds. A valuation is a subjective exercise and Indicative net asset value does not necessarily co nsider all elements or consider in the adequate proportion the elements that could affect the valuation of IEP. Investors may reasonably differ on what such elements are and their impact on IEP. No represen tat ion or assurance, express or implied is made as to the accuracy and correctness of indicative net asset value as of these dates or with respect to any future indicative or prospective results which may vary. (1) Represents equity attributable to us as of each respective date. (2) Based on closing share price on each date and the number of shares owned by the Holding Company as of each respective date. (3) Amounts based on market comparables due to lack of material trading volume. Tropicana valued at 8.0x Adjusted EBITDA for the twe lve months ended March 31, 2014, June 30, 2014 and March 31, 2015, and 7.5x Adjusted EBITDA for the twelve months ended September 30, 2014 and December 31, 2014. Viskase valued at 9.0x Adjusted EBITDA fo r the twelve months ended March 31, 2014, June 30, 2014, September 30, 2014, December 31. 2014 and March 31, 2015. (4) ARL value assumes the present value of projected cash flows from leased railcars plus working capital. (5) Holding Company’s balance as of each respective date. March 31 June 30 Sept 30 Dec 31 March 31 2014 2014 2014 2014 2015 Market-valued Subsidiaries: Holding Company interest in Funds (1) $4,702 $5,092 $4,824 $4,284 $4,470 CVR Energy (2) 3,008 3,431 3,185 2,756 3,030 CVR Refining (2) 140 150 140 101 124 Federal-Mogul (2) 2,266 2,450 1,801 1,949 1,845 American Railcar Industries (2) 831 805 878 611 590 Total market-valued subsidiaries $10,947 $11,928 $10,827 $9,701 $10,059 Other Subsidiaries Tropicana (3) $467 $424 $468 $497 $560 Viskase (3) 252 242 246 246 210 Real Estate Holdings (1) 719 726 732 693 720 PSC Metals (1) 261 255 262 250 234 WestPoint Home (1) 190 190 194 180 179 ARL (4) 810 864 908 944 977 Total - other subsidiaries $2,699 $2,701 $2,810 $2,810 $2,880 Add: Holding Company cash and cash equivalents (5) 995 1,099 1,074 1,123 826 Less: Holding Company debt (5) (5,485) (5,485) (5,486) (5,486) (5,488) Add: Other Holding Company net assets (5) (214) (72) 1 237 42 Indicative Net Asset Value $8,942 $10,171 $9,225 $8,385 $8,319 As of
Appendix — Adjusted EBITDA & Adjusted Net Income Reconciliations 34
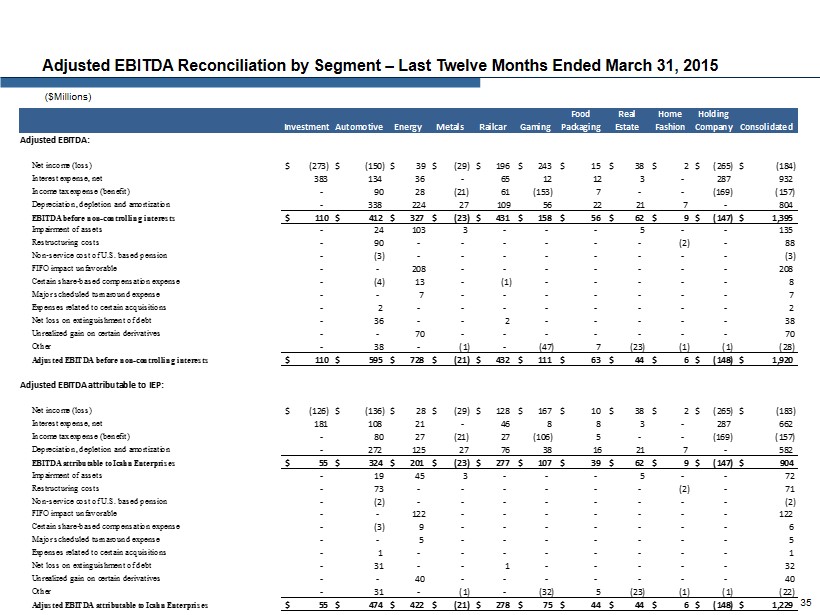
Adjusted EBITDA Reconciliation by Segment – Last Twelve Months Ended March 31, 2015 ($Millions) 35 Investment Automotive Energy Metals Railcar Gaming Food Packaging Real Estate Home Fashion Holding Company Consolidated Adjusted EBITDA: Net income (loss) $ (273) $ (150) $ 39 $ (29) $ 196 $ 243 $ 15 $ 38 $ 2 $ (265) $ (184) Interest expense, net 383 134 36 - 65 12 12 3 - 287 932 Income tax expense (benefit) - 90 28 (21) 61 (153) 7 - - (169) (157) Depreciation, depletion and amortization - 338 224 27 109 56 22 21 7 - 804 EBITDA before non-controlling interests $ 110 $ 412 $ 327 $ (23) $ 431 $ 158 $ 56 $ 62 $ 9 $ (147) $ 1,395 Impairment of assets - 24 103 3 - - - 5 - - 135 Restructuring costs - 90 - - - - - - (2) - 88 Non-service cost of U.S. based pension - (3) - - - - - - - - (3) FIFO impact unfavorable - - 208 - - - - - - - 208 Certain share-based compensation expense - (4) 13 - (1) - - - - - 8 Major scheduled turnaround expense - - 7 - - - - - - - 7 Expenses related to certain acquisitions - 2 - - - - - - - - 2 Net loss on extinguishment of debt - 36 - - 2 - - - - - 38 Unrealized gain on certain derivatives - - 70 - - - - - - - 70 Other - 38 - (1) - (47) 7 (23) (1) (1) (28) Adjusted EBITDA before non-controlling interests $ 110 $ 595 $ 728 $ (21) $ 432 $ 111 $ 63 $ 44 $ 6 $ (148) $ 1,920 Adjusted EBITDA attributable to IEP: Net income (loss) $ (126) $ (136) $ 28 $ (29) $ 128 $ 167 $ 10 $ 38 $ 2 $ (265) $ (183) Interest expense, net 181 108 21 - 46 8 8 3 - 287 662 Income tax expense (benefit) - 80 27 (21) 27 (106) 5 - - (169) (157) Depreciation, depletion and amortization - 272 125 27 76 38 16 21 7 - 582 EBITDA attributable to ;Icahn Enterprises $ 55 $ 324 $ 201 $ (23) $ 277 $ 107 $ 39 $ 62 $ 9 $ (147) $ 904 Impairment of assets - 19 45 3 - - - 5 - - 72 Restructuring costs - 73 - - - - - - (2) - 71 Non-service cost of U.S. based pension - (2) - - - - - - - - (2) FIFO impact unfavorable - - 122 - - - - - - - 122 Certain share-based compensation expense - (3) 9 - - - - - - - 6 Major scheduled turnaround expense - - 5 - - - - - - - 5 Expenses related to certain acquisitions - 1 - - - - - - - - 1 Net loss on extinguishment of debt - 31 - - 1 - - - - - 32 Unrealized gain on certain derivatives - - 40 - - - - - - - 40 Other - 31 - (1) - (32) 5 (23) (1) (1) (22) Adjusted EBITDA attributable ;to Icahn Enterprises $ 55 $ 474 $ 422 $ (21) $ 278 $ 75 $ 44 $ 44 $ 6 $ (148) $ 1,229
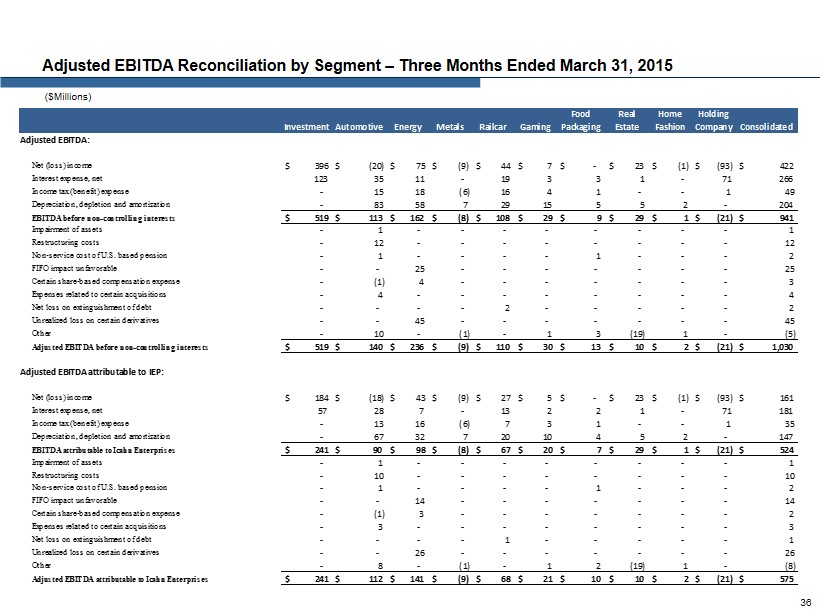
Adjusted EBITDA Reconciliation by Segment – Three Months Ended March 31, 2015 ($Millions) 36 Investment Automotive Energy Metals Railcar Gaming Food Packaging Real Estate Home Fashion Holding Company Consolidated Adjusted EBITDA: Net (loss) income $ 396 $ (20) $ 75 $ (9) $ 44 $ 7 $ - $ 23 $ (1) $ (93) $ 422 Interest expense, net 123 35 11 - 19 3 3 1 - 71 266 Income tax (benefit) expense - 15 18 (6) 16 4 1 - - 1 49 Depreciation, depletion and amortization - 83 58 7 29 15 5 5 2 - 204 EBITDA before non-controlling interests $ 519 $ 113 $ 162 $ (8) $ 108 $ 29 $ 9 $ 29 $ 1 $ (21) $ 941 Impairment of assets - 1 - - - - - - - - 1 Restructuring costs - 12 - - - - - - - - 12 Non-service cost of U.S. based pension - 1 - - - - 1 - - - 2 FIFO impact unfavorable - - 25 - - - - - - - 25 Certain share-based compensation expense - (1) 4 - - - - - - - 3 Expenses related to certain acquisitions - 4 - - - - - - - - 4 Net loss on extinguishment of debt - - - - 2 - - - - - 2 Unrealized loss on certain derivatives - - 45 - - - - - - - 45 Other - 10 - (1) - 1 3 (19) 1 - (5) Adjusted EBITDA before non-controlling interests $ 519 $ 140 $ 236 $ (9) $ 110 $ 30 $ 13 $ 10 $ 2 $ (21) $ 1,030 Adjusted EBITDA attributable to IEP: Net (loss) income $ 184 $ (18) $ 43 $ (9) $ 27 $ 5 $ - $ 23 $ (1) $ (93) $ 161 Interest expense, net 57 28 7 - 13 2 2 1 - 71 181 Income tax (benefit) expense - 13 16 (6) 7 3 1 - - 1 35 Depreciation, depletion and amortization - 67 32 7 20 10 4 5 2 - 147 EBITDA attributable to ;Icahn Enterprises $ 241 $ 90 $ 98 $ (8) $ 67 $ 20 $ 7 $ 29 $ 1 $ (21) $ 524 Impairment of assets - 1 - - - - - - - - 1 Restructuring costs - 10 - - - - - - - - 10 Non-service cost of U.S. based pension - 1 - - - - 1 - - - 2 FIFO impact unfavorable - - 14 - - - - - - - 14 Certain share-based compensation expense - (1) 3 - - - - - - - 2 Expenses related to certain acquisitions - 3 - - - - - - - - 3 Net loss on extinguishment of debt - - - - 1 - - - - - 1 Unrealized loss on certain derivatives - - 26 - - - - - - - 26 Other - 8 - (1) - 1 2 (19) 1 - (8) Adjusted EBITDA attributable ;to Icahn Enterprises $ 241 $ 112 $ 141 $ (9) $ 68 $ 21 $ 10 $ 10 $ 2 $ (21) $ 575
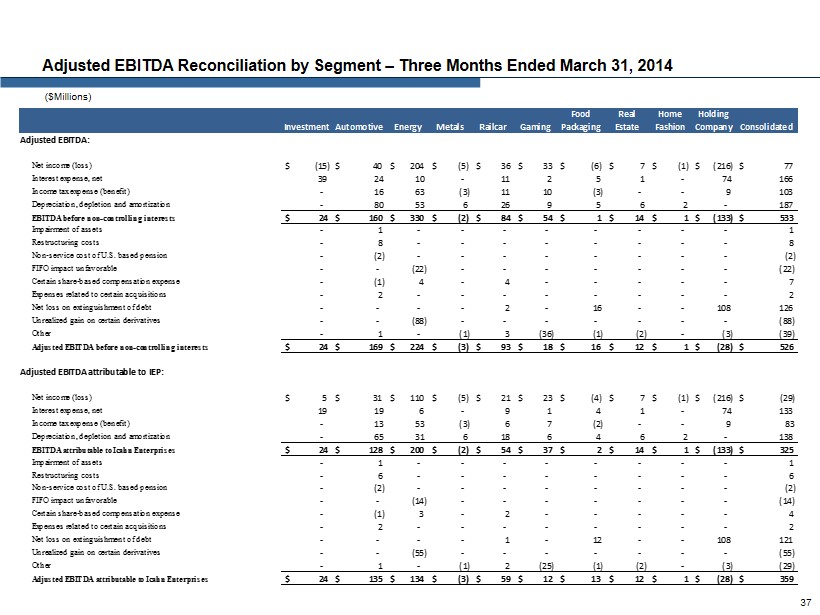
Adjusted EBITDA Reconciliation by Segment – Three Months Ended March 31, 2014 ($Millions) 37 Investment Automotive Energy Metals Railcar Gaming Food Packaging Real Estate Home Fashion Holding Company Consolidated Adjusted EBITDA: Net income (loss) $ (15) $ 40 $ 204 $ (5) $ 36 $ 33 $ (6) $ 7 $ (1) $ (216) $ 77 Interest expense, net 39 24 10 - 11 2 5 1 - 74 166 Income tax expense (benefit) - 16 63 (3) 11 10 (3) - - 9 103 Depreciation, depletion and amortization - 80 53 6 26 9 5 6 2 - 187 EBITDA before non-controlling interests $ 24 $ 160 $ 330 $ (2) $ 84 $ 54 $ 1 $ 14 $ 1 $ (133) $ 533 Impairment of assets - 1 - - - - - - - - 1 Restructuring costs - 8 - - - - - - - - 8 Non-service cost of U.S. based pension - (2) - - - - - - - - (2) FIFO impact unfavorable - - (22) - - - - - - - (22) Certain share-based compensation expense - (1) 4 - 4 - - - - - 7 Expenses related to certain acquisitions - 2 - - - - - - - - 2 Net loss on extinguishment of debt - - - - 2 - 16 - - 108 126 Unrealized gain on certain derivatives - - (88) - - - - - - - (88) Other - 1 - (1) 3 (36) (1) (2) - (3) (39) Adjusted EBITDA before non-controlling interests $ 24 $ 169 $ 224 $ (3) $ 93 $ 18 $ 16 $ 12 $ 1 $ (28) $ 526 Adjusted EBITDA attributable to IEP: Net income (loss) $ 5 $ 31 $ 110 $ (5) $ 21 $ 23 $ (4) $ 7 $ (1) $ (216) $ (29) Interest expense, net 19 19 6 - 9 1 4 1 - 74 133 Income tax expense (benefit) - 13 53 (3) 6 7 (2) - - 9 83 Depreciation, depletion and amortization - 65 31 6 18 6 4 6 2 - 138 EBITDA attributable to ;Icahn Enterprises $ 24 $ 128 $ 200 $ (2) $ 54 $ 37 $ 2 $ 14 $ 1 $ (133) $ 325 Impairment of assets - 1 - - - - - - - - 1 Restructuring costs - 6 - - - - - - - - 6 Non-service cost of U.S. based pension - (2) - - - - - - - - (2) FIFO impact unfavorable - - (14) - - - - - - - (14) Certain share-based compensation expense - (1) 3 - 2 - - - - - 4 Expenses related to certain acquisitions - 2 - - - - - - - - 2 Net loss on extinguishment of debt - - - - 1 - 12 - - 108 121 Unrealized gain on certain derivatives - - (55) - - - - - - - (55) Other - 1 - (1) 2 (25) (1) (2) - (3) (29) Adjusted EBITDA attributable ;to Icahn Enterprises $ 24 $ 135 $ 134 $ (3) $ 59 $ 12 $ 13 $ 12 $ 1 $ (28) $ 359
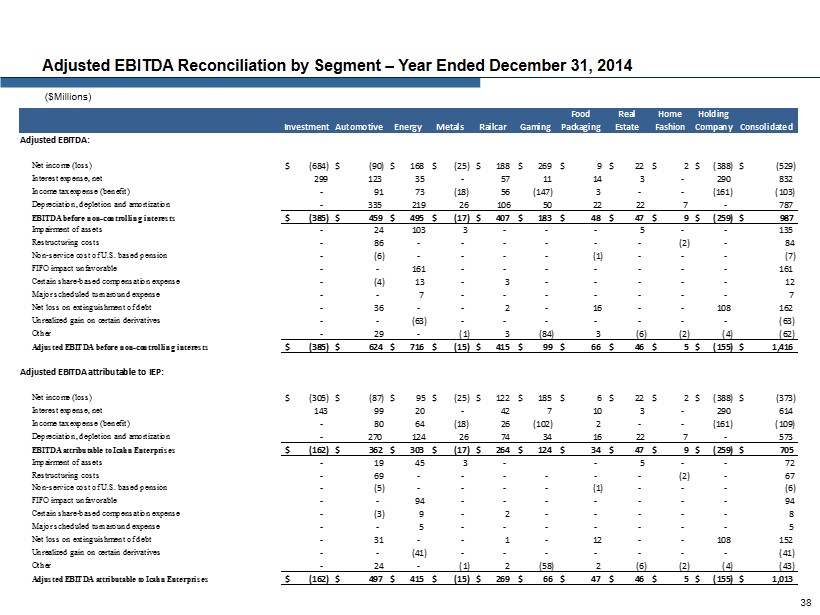
Adjusted EBITDA Reconciliation by Segment – Year Ended December 31, 2014 ($Millions) 38 Investment Automotive Energy Metals Railcar Gaming Food Packaging Real Estate Home Fashion Holding Company Consolidated Adjusted EBITDA: Net income (loss) $ (684) $ (90) $ 168 $ (25) $ 188 $ 269 $ 9 $ 22 $ 2 $ (388) $ (529) Interest expense, net 299 123 35 - 57 11 14 3 - 290 832 Income tax expense (benefit) - 91 73 (18) 56 (147) 3 - - (161) (103) Depreciation, depletion and amortization - 335 219 26 106 50 22 22 7 - 787 EBITDA before non-controlling interests $ (385) $ 459 $ 495 $ (17) $ 407 $ 183 $ 48 $ 47 $ 9 $ (259) $ 987 Impairment of assets - 24 103 3 - - - 5 - - 135 Restructuring costs - 86 - - - - - - (2) - 84 Non-service cost of U.S. based pension - (6) - - - - (1) - - - (7) FIFO impact unfavorable - - 161 - - - - - - - 161 Certain share-based compensation expense - (4) 13 - 3 - - - - - 12 Major scheduled turnaround expense - - 7 - - - - - - - 7 Net loss on extinguishment of debt - 36 - - 2 - 16 - - 108 162 Unrealized gain on certain derivatives - - (63) - - - - - - - (63) Other - 29 - (1) 3 (84) 3 (6) (2) (4) (62) Adjusted EBITDA before non-controlling interests $ (385) $ 624 $ 716 $ (15) $ 415 $ 99 $ 66 $ 46 $ 5 $ (155) $ 1,416 Adjusted EBITDA attributable to IEP: Net income (loss) $ (305) $ (87) $ 95 $ (25) $ 122 $ 185 $ 6 $ 22 $ 2 $ (388) $ (373) Interest expense, net 143 99 20 - 42 7 10 3 - 290 614 Income tax expense (benefit) - 80 64 (18) 26 (102) 2 - - (161) (109) Depreciation, depletion and amortization - 270 124 26 74 34 16 22 7 - 573 EBITDA attributable to ;Icahn Enterprises $ (162) $ 362 $ 303 $ (17) $ 264 $ 124 $ 34 $ 47 $ 9 $ (259) $ 705 Impairment of assets - 19 45 3 - - 5 - - 72 Restructuring costs - 69 - - - - - - (2) - 67 Non-service cost of U.S. based pension - (5) - - - - (1) - - - (6) FIFO impact unfavorable - - 94 - - - - - - - 94 Certain share-based compensation expense - (3) 9 - 2 - - - - - 8 Major scheduled turnaround expense - - 5 - - - - - - - 5 Net loss on extinguishment of debt - 31 - - 1 - 12 - - 108 152 Unrealized gain on certain derivatives - - (41) - - - - - - - (41) Other - 24 - (1) 2 (58) 2 (6) (2) (4) (43) Adjusted EBITDA attributable ;to Icahn Enterprises $ (162) $ 497 $ 415 $ (15) $ 269 $ 66 $ 47 $ 46 $ 5 $ (155) $ 1,013
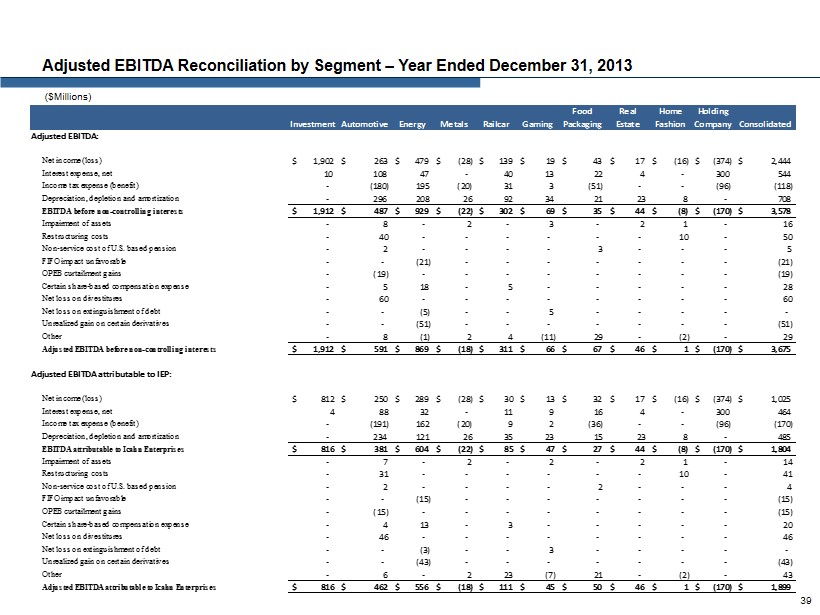
Adjusted EBITDA Reconciliation by Segment – Year Ended December 31, 2013 ($Millions) 39 Investment Automotive Energy Metals Railcar Gaming Food Packaging Real Estate Home Fashion Holding Company Consolidated Adjusted EBITDA: Net income (loss) $ 1,902 $ 263 $ 479 $ (28) $ 139 $ 19 $ 43 $ 17 $ (16) $ (374) $ 2,444 Interest expense, net 10 108 47 - 40 13 22 4 - 300 544 Income tax expense (benefit) - (180) 195 (20) 31 3 (51) - - (96) (118) Depreciation, depletion and amortization - 296 208 26 92 34 21 23 8 - 708 EBITDA before non-controlling interests $ 1,912 $ 487 $ 929 $ (22) $ 302 $ 69 $ 35 $ 44 $ (8) $ (170) $ 3,578 Impairment of assets - 8 - 2 - 3 - 2 1 - 16 Restructuring costs - 40 - - - - - - 10 - 50 Non-service cost of U.S. based pension - 2 - - - - 3 - - - 5 FIFO impact unfavorable - - (21) - - - - - - - (21) OPEB curtailment gains - (19) - - - - - - - - (19) Certain share-based compensation expense - 5 18 - 5 - - - - - 28 Net loss on divestitures - 60 - - - - - - - - 60 Net loss on extinguishment of debt - - (5) - - 5 - - - - - Unrealized gain on certain derivatives - - (51) - - - - - - - (51) Other - 8 (1) 2 4 (11) 29 - (2) - 29 Adjusted EBITDA before non-controlling interests $ 1,912 $ 591 $ 869 $ (18) $ 311 $ 66 $ 67 $ 46 $ 1 $ (170) $ 3,675 Adjusted EBITDA attributable to IEP: Net income (loss) $ 812 $ 250 $ 289 $ (28) $ 30 $ 13 $ 32 $ 17 $ (16) $ (374) $ 1,025 Interest expense, net 4 88 32 - 11 9 16 4 - 300 464 Income tax expense (benefit) - (191) 162 (20) 9 2 (36) - - (96) (170) Depreciation, depletion and amortization - 234 121 26 35 23 15 23 8 - 485 EBITDA attributable to ;Icahn Enterprises $ 816 $ 381 $ 604 $ (22) $ 85 $ 47 $ 27 $ 44 $ (8) $ (170) $ 1,804 Impairment of assets - 7 - 2 - 2 - 2 1 - 14 Restructuring costs - 31 - - - - - - 10 - 41 Non-service cost of U.S. based pension - 2 - - - - 2 - - - 4 FIFO impact unfavorable - - (15) - - - - - - - (15) OPEB curtailment gains - (15) - - - - - - - - (15) Certain share-based compensation expense - 4 13 - 3 - - - - - 20 Net loss on divestitures - 46 - - - - - - - - 46 Net loss on extinguishment of debt - - (3) - - 3 - - - - - Unrealized gain on certain derivatives - - (43) - - - - - - - (43) Other - 6 - 2 23 (7) 21 - (2) - 43 Adjusted EBITDA attributable ;to Icahn Enterprises $ 816 $ 462 $ 556 $ (18) $ 111 $ 45 $ 50 $ 46 $ 1 $ (170) $ 1,899
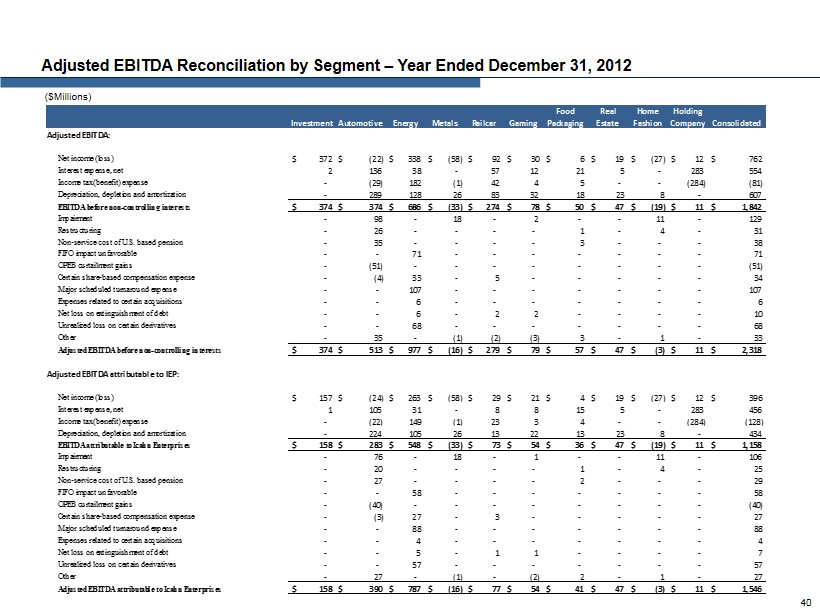
Adjusted EBITDA Reconciliation by Segment – Year Ended December 31, 2012 ($Millions) 40 Investment Automotive Energy Metals Railcar Gaming Food Packaging Real Estate Home Fashion Holding Company Consolidated Adjusted EBITDA: Net income (loss) $ 372 $ (22) $ 338 $ (58) $ 92 $ 30 $ 6 $ 19 $ (27) $ 12 $ 762 Interest expense, net 2 136 38 - 57 12 21 5 - 283 554 Income tax (benefit) expense - (29) 182 (1) 42 4 5 - - (284) (81) Depreciation, depletion and amortization - 289 128 26 83 32 18 23 8 - 607 EBITDA before non-controlling interests $ 374 $ 374 $ 686 $ (33) $ 274 $ 78 $ 50 $ 47 $ (19) $ 11 $ 1,842 Impairment - 98 - 18 - 2 - - 11 - 129 Restructuring - 26 - - - - 1 - 4 - 31 Non-service cost of U.S. based pension - 35 - - - - 3 - - - 38 FIFO impact unfavorable - - 71 - - - - - - - 71 OPEB curtailment gains - (51) - - - - - - - - (51) Certain share-based compensation expense - (4) 33 - 5 - - - - - 34 Major scheduled turnaround expense - - 107 - - - - - - - 107 Expenses related to certain acquisitions - - 6 - - - - - - - 6 Net loss on extinguishment of debt - - 6 - 2 2 - - - - 10 Unrealized loss on certain derivatives - - 68 - - - - - - - 68 Other - 35 - (1) (2) (3) 3 - 1 - 33 Adjusted EBITDA before non-controlling interests $ 374 $ 513 $ 977 $ (16) $ 279 $ 79 $ 57 $ 47 $ (3) $ 11 $ 2,318 Adjusted EBITDA attributable to IEP: Net income (loss) $ 157 $ (24) $ 263 $ (58) $ 29 $ 21 $ 4 $ 19 $ (27) $ 12 $ 396 Interest expense, net 1 105 31 - 8 8 15 5 - 283 456 Income tax (benefit) expense - (22) 149 (1) 23 3 4 - - (284) (128) Depreciation, depletion and amortization - 224 105 26 13 22 13 23 8 - 434 EBITDA attributable to ;Icahn Enterprises $ 158 $ 283 $ 548 $ (33) $ 73 $ 54 $ 36 $ 47 $ (19) $ 11 $ 1,158 Impairment - 76 - 18 - 1 - - 11 - 106 Restructuring - 20 - - - - 1 - 4 - 25 Non-service cost of U.S. based pension - 27 - - - - 2 - - - 29 FIFO impact unfavorable - - 58 - - - - - - - 58 OPEB curtailment gains - (40) - - - - - - - - (40) Certain share-based compensation expense - (3) 27 - 3 - - - - - 27 Major scheduled turnaround expense - - 88 - - - - - - - 88 Expenses related to certain acquisitions - - 4 - - - - - - - 4 Net loss on extinguishment of debt - - 5 - 1 1 - - - - 7 Unrealized loss on certain derivatives - - 57 - - - - - - - 57 Other - 27 - (1) - (2) 2 - 1 - 27 Adjusted EBITDA attributable ;to Icahn Enterprises $ 158 $ 390 $ 787 $ (16) $ 77 $ 54 $ 41 $ 47 $ (3) $ 11 $ 1,546
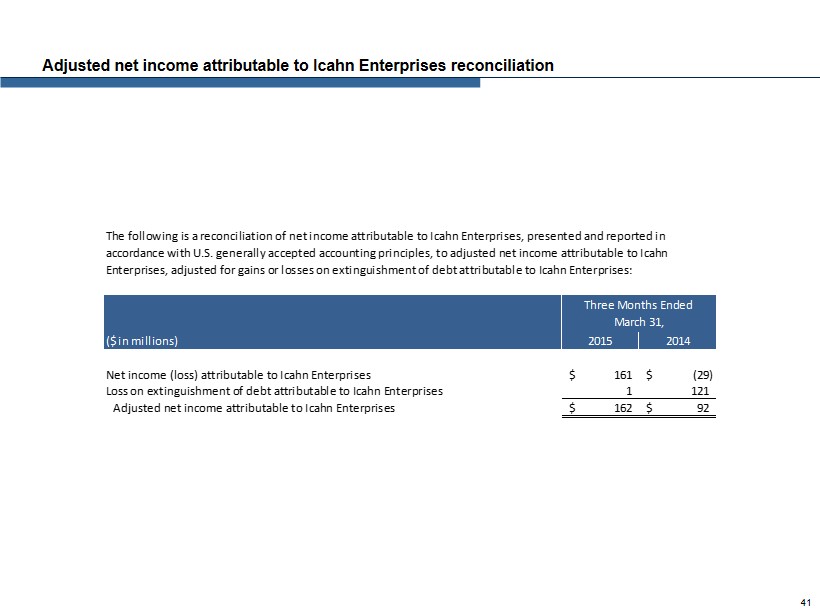
Adjusted net income attributable to Icahn Enterprises reconciliation 41 ($ in millions) 2015 2014 Net income (loss) attributable to Icahn Enterprises 161$ (29)$ Loss on extinguishment of debt attributable to Icahn Enterprises 1 121 Adjusted net income attributable to Icahn Enterprises 162$ 92$ Three Months Ended March 31, The following is a reconciliation of net income attributable to Icahn Enterprises, presented and reported in accordance with U.S. generally accepted accounting principles, to adjusted net income attributable to Icahn Enterprises, adjusted for gains or losses on extinguishment of debt attributable to Icahn Enterprises: