Attached files
| file | filename |
|---|---|
| 8-K - 8-K - W. P. Carey Inc. | wpc2015q18-ksupplemental.htm |
| EX-99.1 - EXHIBIT 99.1 - W. P. Carey Inc. | wpc2015q18-kerexh991.htm |
Exhibit 99.2
W. P. Carey Inc.
Supplemental Information
First Quarter 2015


W. P. Carey Inc. unaudited supplemental financial and operating information.
Important Disclosures About This Supplemental Package
As used in this supplemental package, the terms “W. P. Carey,” “WPC,” “the Company,” “we,” “us,” and “our” include W. P. Carey Inc., its consolidated subsidiaries, and its predecessors, unless otherwise indicated. The “CPA®:16 Merger” means our merger with Corporate Property Associates 16 – Global Incorporated, or CPA®:16 – Global, which was completed on January 31, 2014. “CPA® REITs” means CPA®:16 – Global (through the date of the CPA®:16 Merger), Corporate Property Associates 17 – Global Incorporated, or CPA®:17 – Global, and Corporate Property Associates 18 – Global Incorporated, or CPA®:18 – Global. “Managed REITs” means the CPA® REITs, Carey Watermark Investors Incorporated, or CWI, and Carey Watermark Investors Incorporated 2, or CWI 2. “Managed Programs” means the Managed REITs and Carey Credit Income Fund, or CCIF. "U.S." means United States.
Important Note Regarding Non-GAAP Financial Measures
This supplemental package includes certain “non-GAAP” supplemental measures that are not defined by generally accepted accounting principles, or GAAP, including funds from operations, or FFO; adjusted funds from operations, or AFFO; earnings before interest, taxes, depreciation, and amortization, or EBITDA; adjusted EBITDA; pro rata cash net operating income, or pro rata cash NOI; and normalized pro rata cash NOI. A description of these non-GAAP financial measures and reconciliations to their most directly comparable GAAP measures, as well as a description of other metrics presented, are provided within the Appendix to this supplemental package. FFO is a non-GAAP measure defined by the National Association of Real Estate Investments Trusts, or NAREIT.
W. P. Carey Inc.
Supplemental Information – First Quarter 2015
Table of Contents | |
Overview | |
Financial Results | |
Balance Sheets and Capitalization | |
Owned Real Estate Portfolio | |
Investment Management | |
Appendix | |
W. P. Carey Inc.
Overview – First Quarter 2015
Summary Metrics | |
As of or for the three months ended March 31, 2015.
Financial Results | |||||||||||||||
Real estate revenues, excluding reimbursable tenant costs – consolidated ($'000) | $ | 170,486 | |||||||||||||
Revenues from the Managed REITs, excluding reimbursable costs – consolidated ($'000) | 34,356 | ||||||||||||||
Net income attributable to W. P. Carey ($'000) | 36,116 | ||||||||||||||
Net income attributable to W. P. Carey per diluted share | 0.34 | ||||||||||||||
Normalized pro rata cash NOI ($'000) (a) (e) | 169,068 | ||||||||||||||
Adjusted EBITDA ($'000) (b) | 182,938 | ||||||||||||||
AFFO ($'000) (c) | 129,970 | ||||||||||||||
AFFO per diluted share (c) | 1.22 | ||||||||||||||
Distributions declared per share – first quarter | 0.9525 | ||||||||||||||
Distributions declared per share – first quarter annualized | 3.81 | ||||||||||||||
Dividend yield (annualized, based on quarter end share price) | 5.6 | % | |||||||||||||
Dividend payout ratio – first quarter (d) | 78.1 | % | |||||||||||||
Balance Sheet and Capitalization | |||||||||||||||
Shares outstanding | 104,337,423 | ||||||||||||||
Stock price – at quarter end | $ | 68.00 | |||||||||||||
Equity market capitalization ($'000) | 7,094,945 | ||||||||||||||
Total pro rata debt outstanding ($'000) (e) | 4,280,760 | ||||||||||||||
Consolidated cash and cash equivalents ($'000) | 207,391 | ||||||||||||||
Pro rata net debt ($'000) (f) | 4,073,369 | ||||||||||||||
Enterprise value ($'000) (g) | 11,168,314 | ||||||||||||||
Total consolidated debt ($'000) | 4,336,224 | ||||||||||||||
Gross assets ($'000) (h) | 9,017,483 | ||||||||||||||
Liquidity ($'000) (i) | 1,520,162 | ||||||||||||||
Pro rata net debt to enterprise value (e) | 36.5 | % | |||||||||||||
Pro rata net debt to adjusted EBITDA (annualized) (b) | 5.6x | ||||||||||||||
Total consolidated debt to gross assets | 48.1 | % | |||||||||||||
Weighted-average interest rate (e) | 4.3 | % | |||||||||||||
Weighted-average debt maturity (years) (e) | 5.7 | ||||||||||||||
Standard & Poor's Rating Services - issuer rating (September 2014) | BBB (stable) | ||||||||||||||
Moody's Investors Service - corporate rating (August 2014) | Baa2 (stable) | ||||||||||||||
Owned Real Estate Portfolio (Pro Rata) | |||||||||||||||
Number of net-leased properties | 852 | ||||||||||||||
Number of operating properties | 4 | ||||||||||||||
Number of tenants – net-leased properties | 219 | ||||||||||||||
ABR from Investment Grade tenants as a % of total ABR (net-leased properties) (j) | 25.2 | % | |||||||||||||
Net-leased properties – square feet (millions) | 89.2 | ||||||||||||||
Operating properties – square feet (millions) (k) | 0.3 | ||||||||||||||
Total square feet (millions) | 89.5 | ||||||||||||||
Occupancy – net-leased properties (l) | 98.4 | % | |||||||||||||
Weighted-average remaining lease term (years) | 9.2 | ||||||||||||||
Acquisitions – first quarter ($'000) | $ | 394,234 | |||||||||||||
Dispositions – first quarter ($'000) | 13,765 | ||||||||||||||
Managed REITs | CPA® REITs | CWI | CWI 2 | Total | |||||||||||
AUM ($'000) (m) | $ | 7,194,137 | $ | 2,350,107 | $ | 500 | $ | 9,544,244 | |||||||
Acquisitions – first quarter ($'000) | 338,551 | 227,298 | — | 565,849 | |||||||||||
Dispositions – first quarter ($'000) | — | — | — | — | |||||||||||
 | Investing for the long runTM | 1 | |
W. P. Carey Inc.
Overview – First Quarter 2015
________
(a) | Normalized pro rata cash NOI is a non-GAAP measure. See the Terms and Definitions section in the Appendix for a description of our non-GAAP measures and for details on how normalized pro rata cash NOI is calculated. |
(b) | Adjusted EBITDA is a non-GAAP measure. See the Terms and Definitions section in the Appendix for a description of our non-GAAP measures and for a reconciliation of net income to adjusted EBITDA. |
(c) | AFFO is a non-GAAP measure. See the Terms and Definitions section in the Appendix for a description of our non-GAAP measures and for a reconciliation of net income to AFFO. |
(d) | Represents distributions declared per share divided by annualized diluted AFFO per share. |
(e) | Presented on a pro rata basis. See the Terms and Definitions section in the Appendix for a description of pro rata. |
(f) | Represents total pro rata debt outstanding less consolidated cash and cash equivalents. See the Terms and Definitions section in the Appendix for a description of pro rata. |
(g) | Represents equity market capitalization plus total pro rata debt outstanding, less consolidated cash and cash equivalents. See the Terms and Definitions section in the Appendix for a description of pro rata. |
(h) | Gross assets represent consolidated total assets before accumulated depreciation. |
(i) | Represents availability on our Senior Unsecured Credit Facility revolver plus cash and cash equivalents. |
(j) | Investment Grade tenants are defined as those having a BBB- rating or higher by Standard & Poor’s Rating Services or Baa3 rating or higher by Moody’s Investors Service. Percentage of portfolio is calculated based on contractual minimum annualized base rent, or ABR, as of March 31, 2015. |
(k) | Comprised of our two self-storage properties and two hotel properties. |
(l) | Occupancy for our two self-storage properties was 92.8% as of March 31, 2015. Occupancy for our two hotels was 76.6% for the three months ended March 31, 2015. |
(m) | Represents estimated value of real estate assets plus cash and cash equivalents, less distributions payable. |
| | Investing for the long runTM | 2 | |
W. P. Carey Inc.
Overview – First Quarter 2015
Components of Net Asset Value | |
In thousands, except shares, per share amounts, and percentages.
Real Estate | Three Months Ended Mar. 31, 2015 | Annualized | |||||||
Owned Real Estate: | A | A x 4 | |||||||
Normalized pro rata cash NOI (a) | $ | 169,068 | $ | 676,272 | |||||
Operating Partnership Interests in Real Estate Cash Flow of Managed REITs: (b) | |||||||||
CPA®:17 – Global (10% of Available Cash) | 6,064 | 24,256 | |||||||
CPA®:18 – Global (10% of Available Cash) | 894 | 3,576 | |||||||
CWI (8% of Available Cash) | 1,478 | 5,912 | |||||||
8,436 | 33,744 | ||||||||
Investment Management | |||||||||
Investment Management Revenues | |||||||||
Structuring revenue | 21,720 | 86,880 | |||||||
Asset management revenue | 11,159 | 44,636 | |||||||
32,879 | 131,516 | ||||||||
Balance Sheet - Selected Information (Consolidated Unless Otherwise Stated) | As of Mar. 31, 2015 | ||||||||
Assets | |||||||||
Cash and cash equivalents | $ | 207,391 | |||||||
Due from affiliates | 51,200 | ||||||||
Real estate under construction (c) | 38,026 | ||||||||
Other assets, net: | |||||||||
Restricted cash, including escrow | $ | 101,378 | |||||||
Accounts receivable | 59,450 | ||||||||
Deferred charges | 58,856 | ||||||||
Securities and derivatives | 54,597 | ||||||||
Other intangible assets, net | 43,715 | ||||||||
Prepaid expenses | 13,388 | ||||||||
Note receivable | 10,816 | ||||||||
Leasehold improvements, furniture, and fixtures | 9,486 | ||||||||
Other | 377 | ||||||||
Total other assets, net | $ | 352,063 | |||||||
Liabilities | |||||||||
Total pro rata debt outstanding (d) | $ | 4,280,760 | |||||||
Distributions payable | 101,350 | ||||||||
Deferred income taxes | 95,987 | ||||||||
Accounts payable, accrued expenses and other liabilities: | |||||||||
Accounts payable and accrued expenses | $ | 119,586 | |||||||
Prepaid and deferred rents | 93,044 | ||||||||
Tenant security deposits | 40,078 | ||||||||
Accrued income taxes payable | 24,551 | ||||||||
Other | 20,958 | ||||||||
Total accounts payable, accrued expenses and other liabilities | $ | 298,217 | |||||||
| | Investing for the long runTM | 3 | |
W. P. Carey Inc.
Overview – First Quarter 2015
Other | Number of Shares Owned | NAV / Offering Price Per Share | Implied Value | |||||||
A | B | A x B | ||||||||
Ownership in Managed Programs: (e) | ||||||||||
CPA®:17 – Global (2.8% ownership) | 9,273,355 | $ | 9.72 | (f) | $ | 90,137 | ||||
CPA®:18 – Global (0.3% ownership) | 391,273 | 10.00 | (g) | 3,913 | ||||||
CWI (1.2% ownership) | 1,501,028 | 10.30 | (h) | 15,461 | ||||||
CWI 2 (100.0% ownership) | 22,222 | 10.00 | (i) | 222 | ||||||
CCIF (50.0% ownership) (j) | 2,777,778 | 9.00 | 25,000 | |||||||
$ | 134,733 | |||||||||
________
(a) | Normalized pro rata cash NOI is a non-GAAP measure. See the Terms and Definitions section in the Appendix for a description of our non-GAAP measures and for details on how normalized pro rata cash NOI is calculated. |
(b) | We are entitled to receive distributions of our share of earnings up to 10% of the Available Cash of each of the Managed REITs, as defined in their respective operating partnership agreements. However, 20% of CWI’s special general partnership is owned by an unrelated third-party subadvisor. |
(c) | Represents the book value of Banco Santander build-to-suit costs incurred to date. |
(d) | See the Terms and Definitions section in the Appendix for a description of pro rata. |
(e) | Excludes operating partnership interests. |
(f) | The estimated net asset value per share, or NAV, for CPA®:17 – Global was determined as of December 31, 2014. We calculated CPA®:17 – Global’s NAV by relying in part on an estimate of the fair market value of CPA®:17 – Global’s real estate portfolio and debt provided by third parties, adjusted to give effect to the estimated fair value of mortgage loans encumbering its assets (also provided by a third party) as well as other adjustments. |
(g) | The offering price shown is the initial offering price for shares of CPA®:18 – Global’s Class A common stock, as WPC owns shares of CPA®:18 – Global’s Class A common stock. |
(h) | CWI’s NAV was calculated by WPC, relying in part on appraisals of the fair market value of CWI’s real estate portfolio and mortgage debt provided by third parties. The net amount was then adjusted for estimated disposition costs (including estimates of expenses, commissions, and fees payable to WPC) and CWI’s other net assets and liabilities at the same date. CWI’s NAV was based on shares of common stock outstanding at September 30, 2014. |
(i) | The offering price shown is the initial offering price for shares of CWI 2’s Class A common stock, as WPC owns shares of CWI 2’s Class A common stock. |
(j) | In December 2014, we purchased 2,777,778 shares of CCIF at $9.00 per share for a total purchase price of $25.0 million. We account for our interest in this investment using the equity method of accounting because we share the decision making with the third-party investment partner. As of March 31, 2015, CCIF had not yet admitted any additional shareholders. |
| | Investing for the long runTM | 4 | |
W. P. Carey Inc.
Financial Results
First Quarter 2015

| | Investing for the long runTM | 5 | |
W. P. Carey Inc.
Financial Results – First Quarter 2015
In thousands, except share and per share amounts. Unaudited.
Consolidated Statements of Income – Last Five Quarters | |
Three Months Ended | |||||||||||||||||||
Mar. 31, 2015 | Dec. 31, 2014 | Sep. 30, 2014 | Jun. 30, 2014 | Mar. 31, 2014 | |||||||||||||||
Revenues | |||||||||||||||||||
Real estate revenues: | |||||||||||||||||||
Lease revenues | $ | 160,165 | $ | 153,265 | $ | 149,243 | $ | 148,253 | $ | 123,068 | |||||||||
Operating property revenues (b) | 7,112 | 7,333 | 8,338 | 8,251 | 4,991 | ||||||||||||||
Reimbursable tenant costs | 5,939 | 6,828 | 6,271 | 5,749 | 6,014 | ||||||||||||||
Lease termination income and other | 3,209 | 183 | 1,421 | 14,988 | 1,187 | ||||||||||||||
176,425 | 167,609 | 165,273 | 177,241 | 135,260 | |||||||||||||||
Revenues from the Managed Programs: | |||||||||||||||||||
Structuring revenue | 21,720 | 30,765 | 5,487 | 17,254 | 17,750 | ||||||||||||||
Asset management revenue | 11,159 | 10,154 | 9,088 | 9,045 | 9,777 | ||||||||||||||
Reimbursable costs | 9,607 | 33,833 | 14,722 | 41,925 | 39,732 | ||||||||||||||
Dealer manager fees | 1,274 | 6,470 | 2,436 | 7,949 | 6,676 | ||||||||||||||
Incentive, termination and subordinated disposition revenue | 203 | — | — | — | — | ||||||||||||||
43,963 | 81,222 | 31,733 | 76,173 | 73,935 | |||||||||||||||
220,388 | 248,831 | 197,006 | 253,414 | 209,195 | |||||||||||||||
Operating Expenses | |||||||||||||||||||
Depreciation and amortization | 65,400 | 61,481 | 59,524 | 63,445 | 52,673 | ||||||||||||||
General and administrative | 29,768 | 29,523 | 20,261 | 19,133 | 22,671 | ||||||||||||||
Reimbursable tenant and affiliate costs | 15,546 | 40,661 | 20,993 | 47,674 | 45,746 | ||||||||||||||
Property expenses, excluding reimbursable tenant costs | 9,364 | 7,749 | 10,350 | 11,211 | 8,415 | ||||||||||||||
Stock-based compensation expense | 7,009 | 8,096 | 7,979 | 7,957 | 7,043 | ||||||||||||||
Merger and property acquisition expenses | 5,676 | 3,096 | 618 | 1,137 | 29,614 | ||||||||||||||
Impairment charges | 2,683 | 16,776 | 4,225 | 2,066 | — | ||||||||||||||
Subadvisor fees (c) | 2,661 | 2,651 | 381 | 2,451 | 18 | ||||||||||||||
Dealer manager fees and expenses | 2,372 | 6,203 | 3,847 | 6,285 | 5,425 | ||||||||||||||
140,479 | 176,236 | 128,178 | 161,359 | 171,605 | |||||||||||||||
Other Income and Expenses | |||||||||||||||||||
Interest expense | (47,949 | ) | (44,780 | ) | (46,534 | ) | (47,733 | ) | (39,075 | ) | |||||||||
Other income and (expenses) | (4,306 | ) | (2,073 | ) | (5,138 | ) | (1,379 | ) | (5,640 | ) | |||||||||
Equity in earnings of equity method investments in the Managed Programs and real estate | 11,723 | 8,792 | 11,610 | 9,452 | 14,262 | ||||||||||||||
Gain on change in control of interests (a) | — | — | — | — | 105,947 | ||||||||||||||
(40,532 | ) | (38,061 | ) | (40,062 | ) | (39,660 | ) | 75,494 | |||||||||||
Income from continuing operations before income taxes and gain (loss) on sale of real estate | 39,377 | 34,534 | 28,766 | 52,395 | 113,084 | ||||||||||||||
Provision for income taxes | (1,980 | ) | (6,434 | ) | (901 | ) | (8,021 | ) | (2,253 | ) | |||||||||
Income from continuing operations before gain (loss) on sale of real estate | 37,397 | 28,100 | 27,865 | 44,374 | 110,831 | ||||||||||||||
Income from discontinued operations, net of tax | — | 300 | 191 | 26,421 | 6,406 | ||||||||||||||
Gain (loss) on sale of real estate, net of tax | 1,185 | 5,063 | 260 | (3,823 | ) | 81 | |||||||||||||
Net Income | 38,582 | 33,463 | 28,316 | 66,972 | 117,318 | ||||||||||||||
Net income attributable to noncontrolling interests | (2,466 | ) | (1,470 | ) | (993 | ) | (2,344 | ) | (1,578 | ) | |||||||||
Net loss (income) attributable to redeemable noncontrolling interest | — | 279 | 14 | 111 | (262 | ) | |||||||||||||
Net Income Attributable to W. P. Carey | $ | 36,116 | $ | 32,272 | $ | 27,337 | $ | 64,739 | $ | 115,478 | |||||||||
Basic Earnings Per Share | |||||||||||||||||||
Income from continuing operations attributable to W. P. Carey | $ | 0.34 | $ | 0.31 | $ | 0.27 | $ | 0.38 | $ | 1.21 | |||||||||
Income from discontinued operations attributable to W. P. Carey | — | — | — | 0.26 | 0.08 | ||||||||||||||
Net Income Attributable to W. P. Carey | $ | 0.34 | $ | 0.31 | $ | 0.27 | $ | 0.64 | $ | 1.29 | |||||||||
Diluted Earnings Per Share | |||||||||||||||||||
Income from continuing operations attributable to W. P. Carey | $ | 0.34 | $ | 0.30 | $ | 0.27 | $ | 0.38 | $ | 1.20 | |||||||||
Income from discontinued operations attributable to W. P. Carey | — | — | — | 0.26 | 0.07 | ||||||||||||||
Net Income Attributable to W. P. Carey | $ | 0.34 | $ | 0.30 | $ | 0.27 | $ | 0.64 | $ | 1.27 | |||||||||
Weighted-Average Shares Outstanding | |||||||||||||||||||
Basic | 105,303,679 | 104,894,480 | 100,282,082 | 100,236,362 | 89,366,055 | ||||||||||||||
Diluted | 106,109,877 | 105,794,118 | 101,130,448 | 100,995,225 | 90,375,311 | ||||||||||||||
Amounts Attributable to W. P. Carey | |||||||||||||||||||
Income from continuing operations, net of tax | $ | 36,116 | $ | 31,967 | $ | 27,107 | $ | 38,275 | $ | 108,937 | |||||||||
Income from discontinued operations, net of tax | — | 305 | 230 | 26,464 | 6,541 | ||||||||||||||
Net Income | $ | 36,116 | $ | 32,272 | $ | 27,337 | $ | 64,739 | $ | 115,478 | |||||||||
Distributions Declared Per Share | $ | 0.9525 | $ | 0.9500 | $ | 0.9400 | $ | 0.9000 | $ | 0.8950 | |||||||||
| | Investing for the long runTM | 6 | |
W. P. Carey Inc.
Financial Results – First Quarter 2015
________
(a) | Gain on change in control of interests for the three months ended March 31,2014 represents a gain of $75.7 million recognized on our previously-held interest in shares of CPA®:16 – Global common stock and a gain of $30.2 million recognized on the purchase of the remaining interests in nine investments from CPA®:16 – Global, which we had previously accounted for under the equity method. During the three months ended June 30, 2014, we identified certain measurement period adjustments that increased the fair value of our previously-held interest in shares of CPA®:16 – Global common stock by $1.3 million. During the three months ended December 31, 2014, we identified a second measurement period adjustment that impacted the provisional accounting, which increased the fair value of our previously-held interest in shares of CPA®:16 – Global common stock by $1.3 million. We did not record these adjustments during the quarters they were identified, but rather in the three months ended March 31, 2014. Consequently, amounts presented above for gain on change in control of interests and net income for the three months ended March 31, 2014 differ from amounts presented in the first quarter and subsequent periods. |
(b) | Comprised of revenues of $6.8 million from two hotels and revenues of $0.3 million from two self-storage facilities for the three months ended March 31, 2015. |
(c) | We earn investment management revenue from CWI. Pursuant to the terms of a subadvisory agreement, we generally pay a subadvisory fee to an unrelated third-party subadvisor equal to 20% of the fees we receive from CWI. We also pay to such subadvisor 20% of the net proceeds resulting from any sale, financing, or recapitalization of, or sale of CWI’s securities by us, the advisor. In connection with the acquisitions of multi-family and multi-tenant properties on behalf of CPA®:18 – Global, we entered into agreements with unrelated third-party advisors for the day-to-day management of the properties for a fee. |
| | Investing for the long runTM | 7 | |
W. P. Carey Inc.
Financial Results – First Quarter 2015
Reconciliation of Net Income to AFFO – Last Five Quarters | |
In thousands, except share and per share amounts.
Three Months Ended | |||||||||||||||||||
Mar. 31, 2015 | Dec. 31, 2014 | Sep. 30, 2014 | Jun. 30, 2014 | Mar. 31, 2014 | |||||||||||||||
Net income attributable to W. P. Carey | $ | 36,116 | $ | 32,272 | $ | 27,337 | $ | 64,739 | $ | 115,478 | |||||||||
Adjustments: | |||||||||||||||||||
Depreciation and amortization of real property | 63,891 | 60,363 | 58,355 | 62,354 | 51,620 | ||||||||||||||
Impairment charges | 2,683 | 16,776 | 4,225 | 2,066 | — | ||||||||||||||
Gain on sale of real estate, net | (1,185 | ) | (5,062 | ) | (259 | ) | (25,582 | ) | (3,176 | ) | |||||||||
Proportionate share of adjustments for noncontrolling interests to arrive at FFO | (2,653 | ) | (2,806 | ) | (2,924 | ) | (2,586 | ) | (3,492 | ) | |||||||||
Proportionate share of adjustments to equity in net income of partially-owned entities to arrive at FFO | 1,278 | 3,126 | 457 | 533 | 1,265 | ||||||||||||||
Total adjustments | 64,014 | 72,397 | 59,854 | 36,785 | 46,217 | ||||||||||||||
FFO (as defined by NAREIT) (a) | 100,130 | 104,669 | 87,191 | 101,524 | 161,695 | ||||||||||||||
Adjustments: | |||||||||||||||||||
Above- and below-market rent intangible lease amortization, net | 13,750 | 14,008 | 14,432 | 17,124 | 13,486 | ||||||||||||||
Stock-based compensation | 7,009 | 8,096 | 7,979 | 7,957 | 7,043 | ||||||||||||||
Other amortization and non-cash charges (b) | 6,690 | 2,099 | 5,670 | 1,719 | 855 | ||||||||||||||
Merger and property acquisition expenses (c) | 5,676 | 3,097 | 618 | 1,139 | 43,479 | ||||||||||||||
Straight-line and other rent adjustments | (2,937 | ) | (3,657 | ) | (1,791 | ) | (8,999 | ) | (2,669 | ) | |||||||||
Tax benefit – deferred and other non-cash charges | (1,745 | ) | (8,741 | ) | (1,665 | ) | (1,246 | ) | (10,930 | ) | |||||||||
Amortization of deferred financing costs | 1,165 | 1,046 | 1,007 | 999 | 1,025 | ||||||||||||||
AFFO adjustments to equity earnings from equity investments | 1,137 | 1,225 | 1,094 | 935 | 2,936 | ||||||||||||||
Realized (gains) losses on foreign currency, derivatives, and other (d) | (554 | ) | (643 | ) | (272 | ) | 159 | 661 | |||||||||||
Other, net (e) | — | 5,434 | (86 | ) | (13 | ) | 34 | ||||||||||||
Loss on extinguishment of debt | — | — | 1,122 | 721 | 7,992 | ||||||||||||||
Gain on change in control of interests (f) | — | — | — | — | (105,947 | ) | |||||||||||||
Proportionate share of adjustments for noncontrolling interests to arrive at AFFO | (214 | ) | (930 | ) | (918 | ) | 259 | (1,417 | ) | ||||||||||
Proportionate share of adjustments to equity in net income of partially-owned entities to arrive at AFFO | (137 | ) | (98 | ) | (14 | ) | (32 | ) | 5 | ||||||||||
Total adjustments | 29,840 | 20,936 | 27,176 | 20,722 | (43,447 | ) | |||||||||||||
AFFO (a) | $ | 129,970 | $ | 125,605 | $ | 114,367 | $ | 122,246 | $ | 118,248 | |||||||||
Summary | |||||||||||||||||||
FFO (as defined by NAREIT) (a) | $ | 100,130 | $ | 104,669 | $ | 87,191 | $ | 101,524 | $ | 161,695 | |||||||||
FFO (as defined by NAREIT) per diluted share (a) | $ | 0.94 | $ | 0.99 | $ | 0.86 | $ | 1.01 | $ | 1.79 | |||||||||
AFFO (a) | $ | 129,970 | $ | 125,605 | $ | 114,367 | $ | 122,246 | $ | 118,248 | |||||||||
AFFO per diluted share (a) | $ | 1.22 | $ | 1.19 | $ | 1.13 | $ | 1.21 | $ | 1.31 | |||||||||
Diluted weighted-average shares outstanding | 106,109,877 | 105,794,118 | 101,130,448 | 100,995,225 | 90,375,311 | ||||||||||||||
| | Investing for the long runTM | 8 | |
W. P. Carey Inc.
Financial Results – First Quarter 2015
________
(a) | FFO and AFFO are non-GAAP measures. See the Terms and Definitions section in the Appendix for a description of our non-GAAP measures. |
(b) | Represents primarily unrealized gains and losses from foreign exchange and derivatives, as well as amounts for the amortization of contracts. |
(c) | Amount for the three months ended March 31, 2014 includes reported merger costs as well as income tax expense incurred in connection with the CPA®:16 Merger. Income tax expense incurred in connection with the CPA®:16 Merger represents the current portion of income tax expense, including the permanent difference incurred upon recognition of deferred revenue associated with the accelerated vesting of shares previously issued by CPA®:16 – Global for asset management and performance fees. |
(d) | Effective prospectively on January 1, 2015, we no longer adjust for realized gains or losses on foreign exchange derivatives. Realized gains (losses) on derivatives were $0.8 million, $0.3 million, $(0.4) million, and $(0.4) million for the three months ended December 31, 2014, September 30, 2014, June 30, 2014, and March 31 2014, respectively. |
(e) | Other, net for the three months ended December 31, 2014 primarily consists of proceeds from a bankruptcy settlement claim with U.S. Aluminum of Canada, a former CPA®:16 – Global tenant that was acquired as part of the CPA®:16 Merger on January 31, 2014, which under GAAP was accounted for in purchase accounting. |
(f) | Gain on change in control of interests for the three months ended March 31,2014 represents a gain of $75.7 million recognized on our previously-held interest in shares of CPA®:16 – Global common stock and a gain of $30.2 million recognized on the purchase of the remaining interests in nine investments from CPA®:16 – Global, which we had previously accounted for under the equity method. During the three months ended June 30, 2014, we identified certain measurement period adjustments that increased the fair value of our previously-held interest in shares of CPA®:16 – Global common stock by $1.3 million. During the three months ended December 31, 2014, we identified a second measurement period adjustment that impacted the provisional accounting, which increased the fair value of our previously-held interest in shares of CPA®:16 – Global common stock by $1.3 million. We did not record these adjustments during the quarters they were identified, but rather in the three months ended March 31, 2014. Consequently, amounts presented above for gain on change in control of interests and net income for the three months ended March 31, 2014 differ from amounts presented in the first quarter 2014 and subsequent periods. |
| | Investing for the long runTM | 9 | |
W. P. Carey Inc.
Financial Results – First Quarter 2015
Reconciliation of Consolidated Statement of Income to AFFO | |
In thousands, except per share amounts. Unaudited. Three months ended March 31, 2015.
We believe that the table below is useful for investors to help them better understand our business by illustrating the impact of each of our AFFO adjustments on our GAAP statement of income. This presentation is not an alternative to the GAAP statement of income, nor is AFFO an alternative to net income as determined by GAAP.
GAAP - Basis (a) | Add: Equity Investments (b) | Less: Noncontrolling Interests (c) | WPC's Pro Rata Share (d) | AFFO Adjustments | AFFO | ||||||||||||||||||
Revenues | A | B | C | A + B + C = D | E | D + E | |||||||||||||||||
Real estate revenues: | |||||||||||||||||||||||
Lease revenues (e) | $ | 160,165 | $ | 4,694 | $ | (5,854 | ) | $ | 159,005 | $ | 10,137 | (g) | $ | 169,142 | |||||||||
Operating property revenues: | |||||||||||||||||||||||
Hotel revenues | 6,832 | — | — | 6,832 | — | 6,832 | |||||||||||||||||
Self-storage revenues | 280 | — | — | 280 | — | 280 | |||||||||||||||||
Reimbursable tenant costs | 5,939 | 21 | (210 | ) | 5,750 | — | 5,750 | ||||||||||||||||
Lease termination income and other | 3,209 | — | (1 | ) | 3,208 | 40 | 3,248 | ||||||||||||||||
176,425 | 4,715 | (6,065 | ) | 175,075 | 10,177 | 185,252 | |||||||||||||||||
Revenues from the Managed Programs: | |||||||||||||||||||||||
Structuring revenue | 21,720 | — | — | 21,720 | — | 21,720 | |||||||||||||||||
Asset management revenue | 11,159 | — | (14 | ) | 11,145 | — | 11,145 | ||||||||||||||||
Reimbursable costs | 9,607 | — | — | 9,607 | — | 9,607 | |||||||||||||||||
Dealer manager fees | 1,274 | — | — | 1,274 | — | 1,274 | |||||||||||||||||
Incentive, termination, and disposition revenue | 203 | — | — | 203 | — | 203 | |||||||||||||||||
43,963 | — | (14 | ) | 43,949 | — | 43,949 | |||||||||||||||||
220,388 | 4,715 | (6,079 | ) | 219,024 | 10,177 | 229,201 | |||||||||||||||||
Operating Expenses | |||||||||||||||||||||||
Depreciation and amortization | 65,400 | 359 | (2,660 | ) | 63,099 | (61,629 | ) | (h) | 1,470 | ||||||||||||||
General and administrative | 29,768 | 8 | (36 | ) | 29,740 | — | 29,740 | ||||||||||||||||
Reimbursable tenant and affiliate costs | 15,546 | 22 | (190 | ) | 15,378 | — | 15,378 | ||||||||||||||||
Property expenses, excluding reimbursable tenant costs: | |||||||||||||||||||||||
Hotel expenses | 5,214 | — | — | 5,214 | — | 5,214 | |||||||||||||||||
Self-storage expenses | 157 | — | — | 157 | — | 157 | |||||||||||||||||
Non-reimbursable property expenses | 3,993 | 4 | (62 | ) | 3,935 | (48 | ) | 3,887 | |||||||||||||||
Stock-based compensation expense | 7,009 | — | — | 7,009 | (7,009 | ) | (i) | — | |||||||||||||||
Merger and property acquisition expenses | 5,676 | — | — | 5,676 | (5,676 | ) | (j) | — | |||||||||||||||
Impairment charges | 2,683 | — | — | 2,683 | (2,683 | ) | (i) | — | |||||||||||||||
Subadvisor fees (f) | 2,661 | — | — | 2,661 | — | 2,661 | |||||||||||||||||
Dealer manager fees and expenses | 2,372 | — | — | 2,372 | — | 2,372 | |||||||||||||||||
140,479 | 393 | (2,948 | ) | 137,924 | (77,045 | ) | 60,879 | ||||||||||||||||
Other Income and Expenses | |||||||||||||||||||||||
Equity in earnings if equity method investments in real estate and the Managed Programs: | |||||||||||||||||||||||
Joint ventures | 2,790 | (2,790 | ) | — | — | 918 | (k) | 918 | |||||||||||||||
Income related to our ownership in the Managed Programs | 115 | — | — | 115 | 1,137 | (l) | 1,252 | ||||||||||||||||
Income related to our general partnership interests | 8,818 | — | (369 | ) | 8,449 | — | 8,449 | ||||||||||||||||
Equity in earnings of equity method investments in the Managed Programs and real estate | 11,723 | (2,790 | ) | (369 | ) | 8,564 | 2,055 | 10,619 | |||||||||||||||
Interest expense | (47,949 | ) | (910 | ) | 1,833 | (47,026 | ) | 528 | (m) | (46,498 | ) | ||||||||||||
Other income and (expenses) | (4,306 | ) | (599 | ) | 144 | (4,761 | ) | 6,888 | (n) | 2,127 | |||||||||||||
(40,532 | ) | (4,299 | ) | 1,608 | (43,223 | ) | 9,471 | (33,752 | ) | ||||||||||||||
Income from before income taxes and gain on sale of real estate | 39,377 | 23 | (1,523 | ) | 37,877 | 96,693 | 134,570 | ||||||||||||||||
Provision for income taxes | (1,980 | ) | (23 | ) | (943 | ) | (2,946 | ) | (1,654 | ) | (o) | (4,600 | ) | ||||||||||
Income before gain on sale of real estate | 37,397 | — | (2,466 | ) | 34,931 | 95,039 | 129,970 | ||||||||||||||||
Gain on sale of real estate, net of tax | 1,185 | — | — | 1,185 | (1,185 | ) | — | ||||||||||||||||
Net Income | 38,582 | — | (2,466 | ) | 36,116 | 93,854 | 129,970 | ||||||||||||||||
Net income attributable to noncontrolling interests | (2,466 | ) | — | 2,466 | — | — | — | ||||||||||||||||
Net Income / AFFO Attributable to W. P. Carey | $ | 36,116 | $ | — | $ | — | $ | 36,116 | $ | 93,854 | $ | 129,970 | |||||||||||
Earnings / AFFO Per Diluted Share | $ | 0.34 | $ | 1.22 | |||||||||||||||||||
| | Investing for the long runTM | 10 | |
W. P. Carey Inc.
Financial Results – First Quarter 2015
________
(a) | Consolidated amounts shown represent WPC's Consolidated Statement of Income for the three months ended March 31, 2015. |
(b) | Represents the break-out by line item of amounts recorded in Equity in earnings of equity method investments in real estate and the Managed Programs – Joint ventures. |
(c) | Represents the break-out by line item of amounts recorded in Net income attributable to noncontrolling interests and Net loss attributable to redeemable noncontrolling interest. |
(d) | Represents our share in fully and co-owned entities. See the Terms and Definitions section in the Appendix for a description of pro rata. |
(e) | Lease revenues on a pro rata basis in this schedule reflect only revenues from continuing operations. There were no lease revenues from discontinued operations for the three months ended March 31, 2015. |
(f) | We earn investment management revenue from CWI. Pursuant to the terms of a subadvisory agreement, we generally pay a subadvisory fee to an unrelated third-party subadvisor equal to 20% of the fees we receive from CWI. We also pay to such subadvisor 20% of the net proceeds resulting from any sale, financing, or recapitalization of, or sale of CWI’s securities by us, the advisor. In connection with the acquisitions of multi-family and multi-tenant properties on behalf of CPA®:18 – Global, we entered into agreements with unrelated third-party advisors for the day-to-day management of the properties for a fee. |
(g) | For the three months ended March 31, 2015, represents the reversal of amortization of above- or below-market lease intangibles of $13.4 million and the elimination of non-cash amounts related to straight-line rent of $3.3 million. |
(h) | AFFO adjustment is a non-cash adjustment excluding corporate depreciation and amortization. |
(i) | AFFO adjustment is a non-cash adjustment |
(j) | AFFO adjustment is a non-core adjustment. |
(k) | Represents the amortization of the difference between the cost and underlying value of our equity investments. |
(l) | Adjustments include MFFO from the Managed REITs in place of our pro rata share of net income from our ownership in the Managed REITs. |
(m) | Represents the elimination of non-cash components of interest expense, primarily for fair market value related to mortgage loans. |
(n) | Represents eliminations or (gains) losses related to the extinguishment of debt, foreign currency, derivatives, and other items related to continuing operations. |
(o) | Represents elimination of deferred taxes. |
| | Investing for the long runTM | 11 | |
W. P. Carey Inc.
Balance Sheets and Capitalization
First Quarter 2015

| | Investing for the long runTM | 12 | |
W. P. Carey Inc.
Balance Sheets and Capitalization – First Quarter 2015
Consolidated Balance Sheets | |
In thousands. Unaudited.
Mar. 31, 2015 | Dec. 31, 2014 | ||||||
Assets | |||||||
Investments in real estate: | |||||||
Real estate, at cost | $ | 5,159,139 | $ | 5,006,682 | |||
Operating real estate, at cost | 84,915 | 84,885 | |||||
Accumulated depreciation | (286,953 | ) | (258,493 | ) | |||
Net investments in properties | 4,957,101 | 4,833,074 | |||||
Net investments in direct financing leases | 766,920 | 816,226 | |||||
Assets held for sale | — | 7,255 | |||||
Net investments in real estate | 5,724,021 | 5,656,555 | |||||
Cash and cash equivalents | 207,391 | 198,683 | |||||
Equity investments in the Managed Programs and real estate (a) | 249,088 | 249,403 | |||||
Due from affiliates | 51,200 | 34,477 | |||||
Goodwill | 682,623 | 692,415 | |||||
In-place lease and tenant relationship intangible assets, net | 953,458 | 993,819 | |||||
Above-market rent intangible assets, net | 510,686 | 522,797 | |||||
Other assets, net | 352,063 | 300,330 | |||||
Total Assets | $ | 8,730,530 | $ | 8,648,479 | |||
Liabilities and Equity | |||||||
Liabilities: | |||||||
Non-recourse debt, net | $ | 2,420,620 | $ | 2,532,683 | |||
Senior Unsecured Credit Facility - Revolver | 186,131 | 807,518 | |||||
Senior Unsecured Credit Facility - Term Loan | 250,000 | 250,000 | |||||
Senior Unsecured Notes, net | 1,479,473 | 498,345 | |||||
Below-market rent and other intangible liabilities, net | 174,126 | 175,070 | |||||
Accounts payable, accrued expenses and other liabilities | 298,217 | 293,846 | |||||
Deferred income taxes | 95,987 | 94,133 | |||||
Distributions payable | 101,350 | 100,078 | |||||
Total liabilities | 5,005,904 | 4,751,673 | |||||
Redeemable noncontrolling interest | 13,374 | 6,071 | |||||
Equity: | |||||||
W. P. Carey stockholders' equity: | |||||||
Preferred stock (None issued) | — | — | |||||
Common stock | 105 | 105 | |||||
Additional paid-in capital | 4,292,781 | 4,322,273 | |||||
Distributions in excess of accumulated earnings | (537,525 | ) | (465,606 | ) | |||
Deferred compensation obligation | 56,749 | 30,624 | |||||
Accumulated other comprehensive loss | (174,933 | ) | (75,559 | ) | |||
Less: treasury stock at cost | (60,948 | ) | (60,948 | ) | |||
Total W. P. Carey stockholders' equity | 3,576,229 | 3,750,889 | |||||
Noncontrolling interests | 135,023 | 139,846 | |||||
Total equity | 3,711,252 | 3,890,735 | |||||
Total Liabilities and Equity | $ | 8,730,530 | $ | 8,648,479 | |||
(a) | Our equity investments in real estate joint ventures totaled $124.9 million and $128.0 million as of March 31, 2015 and December 31, 2014, respectively. Our equity investments in the Managed Programs totaled $124.2 million and $121.4 million as of March 31, 2015 and December 31, 2014, respectively. |
| | Investing for the long runTM | 13 | |
W. P. Carey Inc.
Balance Sheets and Capitalization – First Quarter 2015
Debt Overview | |
Dollars in thousands. Pro rata. As of March 31, 2015.
Weighted- Average Debt Maturity (Years) | Weighted- Average Interest Rate | Total Outstanding Balance (a) | Percent | ||||||||||
Non-Recourse Debt | |||||||||||||
Fixed | 4.5 | 5.6 | % | $ | 1,971,422 | 45.9 | % | ||||||
Variable: | |||||||||||||
Swapped | 4.2 | 5.0 | % | 254,707 | 5.9 | % | |||||||
Floating | 2.2 | 2.5 | % | 79,566 | 1.9 | % | |||||||
Capped | 2.1 | 1.0 | % | 46,437 | 1.1 | % | |||||||
Future Rate Reset | 10.0 | 6.1 | % | 13,023 | 0.3 | % | |||||||
Total Pro Rata Non-Recourse Debt | 4.4 | 5.3 | % | $ | 2,365,155 | 55.1 | % | ||||||
Recourse Debt | |||||||||||||
Fixed: | |||||||||||||
Senior Unsecured Notes (due January 20, 2023) | 7.8 | 2.0 | % | 537,950 | |||||||||
Senior Unsecured Notes (due April 1, 2024) | 9.0 | 4.6 | % | 500,000 | |||||||||
Senior Unsecured Notes (due February 3, 2025) | 9.9 | 4.0 | % | 450,000 | |||||||||
Senior Unsecured Notes | 8.8 | 3.5 | % | 1,487,950 | 34.7 | % | |||||||
Variable: | |||||||||||||
Senior Unsecured Credit Facility – Revolver (due January 31, 2018) (b) | 2.8 | 1.1 | % | 186,132 | 4.4 | % | |||||||
Senior Unsecured Credit Facility – Term Loan (due January 31, 2016) | 0.8 | 1.4 | % | 250,000 | 5.8 | % | |||||||
Total Recourse Debt | 7.2 | 3.0 | % | $ | 1,924,082 | 44.9 | % | ||||||
Total Pro Rata Debt Outstanding (a) | 5.7 | 4.3 | % | $ | 4,289,237 | 100.0 | % | ||||||
Unamortized discount on Senior Unsecured Notes | $ | (8,477 | ) | ||||||||||
Total Pro Rata Debt Outstanding, net | $ | 4,280,760 | |||||||||||
________
(a) | Debt data is presented on a pro rata basis. See the Terms and Definitions section in the Appendix for a description of pro rata. |
(b) | We incurred interest at London Interbank Offered Rate, or LIBOR, plus 1.10% on our Senior Unsecured Credit Facility – Revolver. Availability under our Senior Unsecured Credit Facility – Revolver was $1.3 billion as of March 31, 2015. We have an option to extend the maturity date of our Senior Unsecured Credit Facility – Revolver by one year. |
| | Investing for the long runTM | 14 | |
W. P. Carey Inc.
Balance Sheets and Capitalization – First Quarter 2015
Debt Maturity | |
Dollars in thousands. Pro rata. As of March 31, 2015.
Real Estate | Debt | ||||||||||||||||||||
Number of Properties (a) | Weighted- Average Interest Rate | Total Outstanding Balance (b) | |||||||||||||||||||
Year of Maturity | ABR (a) | Balloon | Percent | ||||||||||||||||||
Non-Recourse Debt | |||||||||||||||||||||
Remaining 2015 | 12 | $ | 17,016 | 4.5 | % | $ | 140,623 | $ | 141,856 | 3.3 | % | ||||||||||
2016 | 106 | 44,717 | 5.3 | % | 263,937 | 269,445 | 6.3 | % | |||||||||||||
2017 | 90 | 91,223 | 5.3 | % | 562,643 | 601,988 | 14.0 | % | |||||||||||||
2018 | 34 | 49,891 | 5.3 | % | 260,452 | 289,914 | 6.8 | % | |||||||||||||
2019 | 11 | 16,823 | 6.2 | % | 51,450 | 65,706 | 1.5 | % | |||||||||||||
2020 | 22 | 36,725 | 5.3 | % | 187,260 | 224,997 | 5.2 | % | |||||||||||||
2021 | 11 | 20,462 | 5.9 | % | 89,920 | 119,718 | 2.8 | % | |||||||||||||
2022 | 31 | 42,268 | 5.2 | % | 209,160 | 254,840 | 5.9 | % | |||||||||||||
2023 | 26 | 39,726 | 5.1 | % | 123,300 | 192,657 | 4.5 | % | |||||||||||||
2024 | 23 | 20,883 | 5.9 | % | 7,731 | 76,264 | 1.8 | % | |||||||||||||
2025 | 13 | 10,809 | 5.6 | % | 29,603 | 63,397 | 1.5 | % | |||||||||||||
Thereafter | 11 | 16,151 | 6.3 | % | 15,505 | 64,373 | 1.5 | % | |||||||||||||
Total Pro Rata Non-Recourse Debt | 390 | $ | 406,694 | 5.3 | % | $ | 1,941,584 | $ | 2,365,155 | 55.1 | % | ||||||||||
Recourse Debt | |||||||||||||||||||||
Senior Unsecured Notes (due January 20, 2023) | 2.0 | % | 537,950 | ||||||||||||||||||
Senior Unsecured Notes (due April 1, 2024) | 4.6 | % | 500,000 | ||||||||||||||||||
Senior Unsecured Notes (due February 3, 2025) | 4.0 | % | 450,000 | ||||||||||||||||||
Senior Unsecured Notes | 3.5 | % | 1,487,950 | 34.7 | % | ||||||||||||||||
Senior Unsecured Credit Facility – Revolver (due January 31, 2018) (c) | 1.1 | % | 186,132 | 4.4 | % | ||||||||||||||||
Senior Unsecured Credit Facility – Term Loan (due January 31, 2016) | 1.4 | % | 250,000 | 5.8 | % | ||||||||||||||||
Total Recourse Debt | 3.0 | % | $ | 1,924,082 | 44.9 | % | |||||||||||||||
Total Pro Rata Debt Outstanding (a) | 4.3 | % | $ | 4,289,237 | 100.0 | % | |||||||||||||||
Unamortized discount on Senior Unsecured Notes | $ | (8,477 | ) | ||||||||||||||||||
Total Pro Rata Debt Outstanding, net | $ | 4,280,760 | |||||||||||||||||||
________
(a) | Represents the number of properties and ABR associated with the debt that is maturing in each respective year. |
(b) | Debt maturity data is presented on a pro rata basis. See the Terms and Definitions section in the Appendix for a description of pro rata. Total outstanding balance includes balloon payments, scheduled amortization, and unamortized premium, net. |
(c) | We incurred interest at LIBOR plus 1.10% on our Senior Unsecured Credit Facility – Revolver. Availability under our Senior Unsecured Credit Facility – Revolver was $1.3 billion as of March 31, 2015. We have an option to extend the maturity date of our Senior Unsecured Credit Facility – Revolver by one year. |
| | Investing for the long runTM | 15 | |
W. P. Carey Inc.
Balance Sheets and Capitalization – First Quarter 2015
Senior Unsecured Notes | |
As of March 31, 2015.
Ratings
Issuer / Corporate | Senior Unsecured Notes | |||||||||||
Ratings Agency | Rating | Outlook | Date Issued/ Affirmed | Rating | Outlook | Date Issued/ Affirmed | ||||||
Standard and Poor's | BBB | Stable | September 2014 | BBB- | Stable | January 2015 | ||||||
Moody's | Baa2 | Stable | August 2014 | Baa2 | Stable | January 2015 | ||||||
Senior Unsecured Note Covenants
The following is a summary of the key financial covenants for the Senior Unsecured Notes, along with our estimated calculations of our compliance with those covenants at the end of the period presented. These ratios are not measures of our liquidity or performance and serve only to demonstrate our ability to incur additional debt, as permitted by the covenants for the senior unsecured notes.
Covenant | Metric | Required | As of Mar. 31, 2015 | |||
Limitation on the incurrence of debt | "Total Debt" / "Total Assets" | ≤ 60% | 42.0% | |||
Limitation on the incurrence of secured debt | "Secured Debt" / "Total Assets" | ≤ 40% | 23.4% | |||
Limitation on the incurrence of debt based on consolidated EBITDA to annual debt service charge | "Consolidated EBITDA" / "Annual Debt Service Charge" | ≥ 1.5x | 3.7x | |||
Maintenance of unencumbered asset value | "Unencumbered Assets" / "Total Unsecured Debt" | ≥ 150% | 221.5% | |||
| | Investing for the long runTM | 16 | |
W. P. Carey Inc.
Owned Real Estate Portfolio
First Quarter 2015

| | Investing for the long runTM | 17 | |
W. P. Carey Inc.
Owned Real Estate Portfolio – First Quarter 2015
Investment Activity – Acquisitions and Dispositions | |
Dollars in thousands. Pro rata. For the three months ended March 31, 2015.
Acquisitions Tenant / Lease Guarantor | Property Location(s) | Purchase Price (a) | Closing Date | Property Type(s) | Gross Square Footage | ||||||||
1Q15 | |||||||||||||
Pendragon plc (73 properties) (b) | Various United Kingdom | $ | 351,061 | Jan-15 | Retail | 1,490,688 | |||||||
Nippon Express Co. Ltd. (b) | Rotterdam, Netherlands | 43,173 | Feb-15 | Warehouse | 761,438 | ||||||||
Year-to-Date Total Acquisitions | $ | 394,234 | 2,252,126 | ||||||||||
Dispositions Tenant / Lease Guarantor | Property Location(s) | Gross Sale Price | Closing Date | Property Type(s) | Gross Square Footage | ||||||||
1Q15 | |||||||||||||
Vermont Teddy Bear | Shelburne, VT | $ | 3,500 | Jan-15 | Industrial | 55,446 | |||||||
Vacant (formerly Kenyon International Inc.) | Houston, TX | 1,300 | Jan-15 | Warehouse | 17,725 | ||||||||
Childtime Childcare, Inc. (4 properties) | Alhambra, Garden Grove, and Tustin CA; and Canton, MI | 8,240 | Feb-15; Mar-15 | Learning Center | 28,547 | ||||||||
Builders FirstSource, Inc. | Cincinnati, OH | 725 | Mar-15 | Warehouse | 165,680 | ||||||||
Year-to-Date Total Dispositions | $ | 13,765 | 267,398 | ||||||||||
________
(a) | Acquisition was deemed to be a business combination and purchase price includes acquisition-related costs and fees, which were expensed. |
(b) | Amount reflects the applicable exchange rate on the date of acquisition. |
| | Investing for the long runTM | 18 | |
W. P. Carey Inc.
Owned Real Estate Portfolio – First Quarter 2015
Joint Venture Information | |
Dollars in thousands. As of March 31, 2015.
Joint Venture or JV (Principal Tenant) | WPC % Interest in JV | Total JV | WPC Pro Rata Share of Total JV (a) | ||||||||||||||||||||||||||
JV Partner % | Assets | Liabilities | Equity | Assets | Liabilities | Equity | |||||||||||||||||||||||
Unconsolidated Joint Ventures (Equity Method Investments) | |||||||||||||||||||||||||||||
Wanbishi Archives Co. Ltd. (b) | 3.00% | CPA®:17 – Global - 97.00% | $ | 33,773 | $ | 23,619 | $ | 10,154 | $ | 1,013 | $ | 709 | $ | 304 | |||||||||||||||
C1000 Logistiek Vastgoed B.V. (b) | 15.00% | CPA®:17 – Global - 85.00% | 146,658 | 75,574 | 71,084 | 21,999 | 11,336 | 10,663 | |||||||||||||||||||||
Actebis Peacock GmbH (b) | 30.00% | CPA®:17 – Global - 70.00% | 33,834 | 22,498 | 11,336 | 10,150 | 6,749 | 3,401 | |||||||||||||||||||||
Waldaschaff Automotive GmbH and Wagon Automotive Nagold GmbH (b) | 33.33% | CPA®:17 – Global - 66.67% | 35,426 | 14,175 | 21,251 | 11,807 | 4,725 | 7,082 | |||||||||||||||||||||
Frontier Spinning Mills, Inc. | 40.00% | CPA®:17 – Global - 60.00% | 37,215 | 21,473 | 15,742 | 14,886 | 8,589 | 6,297 | |||||||||||||||||||||
The New York Times Company | 45.00% | CPA®:17 – Global - 55.00% | 251,263 | 114,476 | 136,787 | 113,068 | 51,514 | 61,554 | |||||||||||||||||||||
Total Unconsolidated Joint Ventures | 538,169 | 271,815 | 266,354 | 172,923 | 83,622 | 89,301 | |||||||||||||||||||||||
Consolidated Joint Ventures | |||||||||||||||||||||||||||||
Carey Storage | 38.30% | Third parties - 61.70% | 2,415 | 2,433 | (18 | ) | 925 | 932 | (7 | ) | |||||||||||||||||||
Berry Plastics Corporation | 50.00% | CPA®:17 – Global - 50.00% | 67,474 | 26,500 | 40,974 | 33,737 | 13,250 | 20,487 | |||||||||||||||||||||
Tesco PLC (b) | 51.00% | CPA®:17 – Global - 49.00% | 60,027 | 35,536 | 24,491 | 30,614 | 18,123 | 12,491 | |||||||||||||||||||||
Dick’s Sporting Goods, Inc. | 55.00% | CPA®:17 – Global - 45.00% | 24,860 | 20,857 | 4,003 | 13,673 | 11,471 | 2,202 | |||||||||||||||||||||
Hellweg Die Profi-Baumärkte GmbH & Co. KG (b) | 63.50% | CPA®:17 – Global - 36.50% | 324,860 | 289,728 | 35,132 | 206,286 | 183,977 | 22,309 | |||||||||||||||||||||
Eroski Sociedad Cooperativa (b) | 70.00% | CPA®:17 – Global - 30.00% | 25,816 | 1,390 | 24,426 | 18,071 | 973 | 17,098 | |||||||||||||||||||||
Multi-tenant property in Illkirch-Graffens, France (b) | 75.00% | Third party - 25.00% | 15,494 | 10,554 | 4,940 | 11,621 | 7,916 | 3,705 | |||||||||||||||||||||
U-Haul Moving Partners, Inc. and Mercury Partners, LP | 88.46% | CPA®:17 – Global - 11.54% | 240,227 | 17,279 | 222,948 | 212,505 | 15,285 | 197,220 | |||||||||||||||||||||
Continental Airlines, Inc. | 90.00% | Third party - 10.00% | 5,154 | 3,910 | 1,244 | 4,639 | 3,519 | 1,120 | |||||||||||||||||||||
Total Consolidated Joint Ventures | 766,327 | 408,187 | 358,140 | 532,071 | 255,446 | 276,625 | |||||||||||||||||||||||
Total Unconsolidated and Consolidated Joint Ventures | $ | 1,304,496 | $ | 680,002 | $ | 624,494 | $ | 704,994 | $ | 339,068 | $ | 365,926 | |||||||||||||||||
________
(a) | See the Terms and Definitions section in the Appendix for a description of pro rata. |
(b) | Amounts are based on the applicable exchange rate at the end of the period. |
| | Investing for the long runTM | 19 | |
W. P. Carey Inc.
Owned Real Estate Portfolio – First Quarter 2015
Top Ten Tenants | |
In thousands, except percentages. Pro rata. As of March 31, 2015.
Tenant / Lease Guarantor | Property Type | Tenant Industry | Location | ABR | ABR Percent | ||||||||
Hellweg Die Profi-Baumärkte GmbH & Co. KG (a) | Retail | Retail Stores | Germany | $ | 32,628 | 4.8 | % | ||||||
U-Haul Moving Partners Inc. and Mercury Partners, LP | Self Storage | Transportation - Cargo, Consumer Service | Various U.S. | 31,853 | 4.7 | % | |||||||
Carrefour France SAS (a) | Warehouse | Retail Stores | France | 26,622 | 4.0 | % | |||||||
State of Andalucia (a) | Office | Federal, State, Local, and Foreign Government | Spain | 25,395 | 3.8 | % | |||||||
Pendragon plc (a) | Retail | Retail Stores, Consumer Service | United Kingdom | 24,051 | 3.5 | % | |||||||
Marcourt Investments Inc. (Marriott Corporation) | Hotel | Hotel, Gaming, and Leisure | Various U.S. | 16,100 | 2.4 | % | |||||||
True Value Company | Warehouse | Retail Stores | Various U.S. | 15,071 | 2.2 | % | |||||||
OBI Group (a) | Retail | Retail Stores | Poland | 14,644 | 2.2 | % | |||||||
UTI Holdings, Inc. | Learning Center | Consumer Services | Various U.S. | 14,621 | 2.2 | % | |||||||
Advanced Micro Devices, Inc. | Retail and Warehouse | Retail | Sunnyvale, CA | 12,769 | 1.9 | % | |||||||
Total (c) | $ | 213,754 | 31.7 | % | |||||||||
________
(a) | ABR amounts are subject to fluctuations in foreign currency exchange rates. |
(b) | See the Terms and Definitions section in the Appendix for a description of pro rata. |
| | Investing for the long runTM | 20 | |
W. P. Carey Inc.
Owned Real Estate Portfolio – First Quarter 2015
Diversification by Property Type | |
In thousands, except percentages. Pro rata. As of March 31, 2015.
Total Net-Lease Portfolio | Unencumbered Net-Lease Portfolio (a) | ||||||||||||||||||||||||||
Property Type | ABR | ABR Percent | Square Footage | Sq. ft. Percent | ABR | ABR Percent | Square Footage | Sq. ft. Percent | |||||||||||||||||||
Office | $ | 203,827 | 30.3 | % | 13,617 | 15.3 | % | $ | 76,579 | 28.7 | % | 6,338 | 16.9 | % | |||||||||||||
Industrial | 167,409 | 24.9 | % | 34,137 | 38.3 | % | 68,874 | 25.8 | % | 14,203 | 37.9 | % | |||||||||||||||
Warehouse | 119,262 | 17.7 | % | 25,434 | 28.5 | % | 40,064 | 15.1 | % | 8,538 | 22.8 | % | |||||||||||||||
Retail | 100,233 | 14.9 | % | 9,096 | 10.2 | % | 45,098 | 16.9 | % | 3,917 | 10.5 | % | |||||||||||||||
Self Storage | 31,853 | 4.7 | % | 3,535 | 4.0 | % | 31,853 | 11.9 | % | 3,535 | 9.4 | % | |||||||||||||||
Other Properties (b) | 50,770 | 7.5 | % | 3,405 | 3.7 | % | 4,192 | 1.6 | % | 951 | 2.5 | % | |||||||||||||||
Total (c) | $ | 673,354 | 100.0 | % | 89,224 | 100.0 | % | $ | 266,660 | 100.0 | % | 37,482 | 100.0 | % | |||||||||||||
________
(a) | Represents properties unencumbered by non-recourse mortgage debt. |
(b) | Includes ABR from tenants with the following property types: learning center, sports facility, theater, and residential. |
(c) | See the Terms and Definitions section in the Appendix for a description of pro rata. |
| | Investing for the long runTM | 21 | |
W. P. Carey Inc.
Owned Real Estate Portfolio – First Quarter 2015
Diversification by Tenant Industry | |
In thousands, except percentages. Pro rata. As of March 31, 2015.
Total Net-Lease Portfolio | Unencumbered Net-Lease Portfolio (a) | ||||||||||||||||||||||||||
Industry Type | ABR | ABR Percent | Square Footage | Sq. ft. Percent | ABR | ABR Percent | Square Footage | Sq. ft. Percent | |||||||||||||||||||
Retail Store | $ | 132,756 | 19.7 | % | 20,308 | 22.8 | % | $ | 48,350 | 18.1 | % | 6,907 | 18.4 | % | |||||||||||||
Consumer Services | 58,057 | 8.6 | % | 5,058 | 5.7 | % | 38,260 | 14.4 | % | 3,524 | 9.4 | % | |||||||||||||||
High Tech Industries | 44,444 | 6.6 | % | 3,168 | 3.5 | % | 12,709 | 4.8 | % | 1,107 | 3.0 | % | |||||||||||||||
Sovereign and Public Finance | 38,042 | 5.6 | % | 3,364 | 3.8 | % | 29,433 | 11.0 | % | 3,000 | 8.0 | % | |||||||||||||||
Automotive | 35,282 | 5.3 | % | 6,308 | 7.1 | % | 15,705 | 5.9 | % | 2,530 | 6.7 | % | |||||||||||||||
Beverage, Food, and Tobacco | 33,882 | 5.1 | % | 7,370 | 8.2 | % | 14,115 | 5.3 | % | 4,181 | 11.2 | % | |||||||||||||||
Media: Advertising, Printing and Publishing | 31,032 | 4.6 | % | 2,327 | 2.6 | % | 7,912 | 3.0 | % | 855 | 2.3 | % | |||||||||||||||
Transportation - Cargo | 30,645 | 4.6 | % | 3,989 | 4.5 | % | 16,049 | 6.0 | % | 2,373 | 6.3 | % | |||||||||||||||
Hotel, Gaming, and Leisure | 29,809 | 4.4 | % | 1,806 | 2.0 | % | 3,165 | 1.2 | % | 222 | 0.6 | % | |||||||||||||||
Healthcare and Pharmaceuticals | 26,614 | 4.0 | % | 1,945 | 2.2 | % | 3,792 | 1.4 | % | 498 | 1.3 | % | |||||||||||||||
Capital Equipment | 25,142 | 3.7 | % | 4,851 | 5.4 | % | 15,984 | 6.0 | % | 2,731 | 7.3 | % | |||||||||||||||
Containers, Packaging, and Glass | 25,112 | 3.7 | % | 4,935 | 5.5 | % | 6,265 | 2.4 | % | 1,200 | 3.2 | % | |||||||||||||||
Construction and Building | 20,597 | 3.1 | % | 4,276 | 4.8 | % | 9,359 | 3.5 | % | 2,304 | 6.1 | % | |||||||||||||||
Business Services | 17,790 | 2.7 | % | 1,849 | 2.1 | % | 561 | 0.2 | % | 67 | 0.2 | % | |||||||||||||||
Insurance | 16,878 | 2.5 | % | 1,053 | 1.2 | % | 9,099 | 3.4 | % | 473 | 1.3 | % | |||||||||||||||
Telecommunications | 14,743 | 2.2 | % | 1,188 | 1.3 | % | 7,858 | 2.9 | % | 653 | 1.7 | % | |||||||||||||||
Aerospace and Defense | 14,487 | 2.2 | % | 1,572 | 1.8 | % | 5,610 | 2.1 | % | 738 | 2.0 | % | |||||||||||||||
Wholesale | 14,471 | 2.1 | % | 2,806 | 3.1 | % | 4,277 | 1.6 | % | 741 | 2.0 | % | |||||||||||||||
Consumer Goods - Durable | 10,844 | 1.6 | % | 2,485 | 2.8 | % | 1,269 | 0.5 | % | 369 | 1.0 | % | |||||||||||||||
Grocery | 10,238 | 1.5 | % | 1,218 | 1.4 | % | 1,840 | 0.7 | % | 278 | 0.7 | % | |||||||||||||||
Chemicals, Plastics, and Rubber | 9,756 | 1.4 | % | 1,088 | 1.2 | % | 1,879 | 0.7 | % | 245 | 0.7 | % | |||||||||||||||
Oil and Gas | 8,225 | 1.2 | % | 368 | 0.4 | % | 5,733 | 2.1 | % | 276 | 0.7 | % | |||||||||||||||
Consumer Goods Non-Durable Goods | 6,854 | 1.0 | % | 1,848 | 2.1 | % | 2,698 | 1.0 | % | 549 | 1.5 | % | |||||||||||||||
Other (b) | 17,654 | 2.6 | % | 4,044 | 4.5 | % | 4,738 | 1.8 | % | 1,661 | 4.4 | % | |||||||||||||||
Total (c) | $ | 673,354 | 100.0 | % | 89,224 | 100.0 | % | $ | 266,660 | 100.0 | % | 37,482 | 100.0 | % | |||||||||||||
________
(a) | Represents properties unencumbered by non-recourse mortgage debt. |
(b) | Includes ABR from tenants in the following industries: banking; mining, metals, and primary metal industries; media: broadcasting and subscription; environmental industries; finance; transportation - consumer; and forest products and paper. |
(c) | See the Terms and Definitions section in the Appendix for a description of pro rata. |
| | Investing for the long runTM | 22 | |
W. P. Carey Inc.
Owned Real Estate Portfolio – First Quarter 2015
Diversification by Geography | |
In thousands, except percentages. Pro rata. As of March 31, 2015.
Total Net-Lease Portfolio | Unencumbered Net-Lease Portfolio (a) | ||||||||||||||||||||||||||
Region | ABR | ABR Percent | Square Footage | Sq. ft. Percent | ABR | ABR Percent | Square Footage | Sq. ft. Percent | |||||||||||||||||||
U.S. | |||||||||||||||||||||||||||
East | |||||||||||||||||||||||||||
New Jersey | $ | 25,220 | 3.7 | % | 1,694 | 1.9 | % | $ | 9,552 | 3.6 | % | 815 | 2.2 | % | |||||||||||||
North Carolina | 18,687 | 2.8 | % | 4,435 | 5.0 | % | 7,387 | 2.8 | % | 1,413 | 3.8 | % | |||||||||||||||
Pennsylvania | 18,023 | 2.7 | % | 2,526 | 2.8 | % | 7,024 | 2.5 | % | 1,477 | 3.9 | % | |||||||||||||||
New York | 17,565 | 2.6 | % | 1,178 | 1.3 | % | 758 | 0.3 | % | 66 | 0.2 | % | |||||||||||||||
Massachusetts | 14,481 | 2.2 | % | 1,390 | 1.6 | % | 10,577 | 4.0 | % | 1,163 | 3.1 | % | |||||||||||||||
Virginia | 7,780 | 1.2 | % | 1,089 | 1.2 | % | 2,853 | 1.1 | % | 332 | 0.9 | % | |||||||||||||||
Other (b) | 22,540 | 3.3 | % | 4,702 | 5.3 | % | 3,084 | 1.2 | % | 586 | 1.6 | % | |||||||||||||||
Total East | 124,296 | 18.5 | % | 17,014 | 19.1 | % | 41,235 | 15.5 | % | 5,852 | 15.7 | % | |||||||||||||||
West | |||||||||||||||||||||||||||
California | 54,668 | 8.1 | % | 3,518 | 3.9 | % | 6,930 | 2.6 | % | 944 | 2.5 | % | |||||||||||||||
Arizona | 25,682 | 3.8 | % | 2,934 | 3.3 | % | 7,556 | 2.7 | % | 566 | 1.5 | % | |||||||||||||||
Colorado | 8,293 | 1.2 | % | 1,340 | 1.5 | % | 2,722 | 1.0 | % | 515 | 1.4 | % | |||||||||||||||
Utah | 7,052 | 1.0 | % | 960 | 1.1 | % | 2,039 | 0.8 | % | 397 | 1.1 | % | |||||||||||||||
Other (b) | 20,050 | 3.0 | % | 2,336 | 2.6 | % | 8,715 | 3.3 | % | 876 | 2.3 | % | |||||||||||||||
Total West | 115,745 | 17.1 | % | 11,088 | 12.4 | % | 27,962 | 10.4 | % | 3,298 | 8.8 | % | |||||||||||||||
South | |||||||||||||||||||||||||||
Texas | 46,650 | 6.9 | % | 6,740 | 7.6 | % | 13,992 | 5.2 | % | 2,429 | 6.5 | % | |||||||||||||||
Georgia | 26,637 | 4.0 | % | 3,497 | 3.9 | % | 2,669 | 1.0 | % | 331 | 0.9 | % | |||||||||||||||
Florida | 17,794 | 2.6 | % | 1,855 | 2.1 | % | 12,358 | 4.6 | % | 1,472 | 3.9 | % | |||||||||||||||
Tennessee | 14,338 | 2.1 | % | 1,804 | 2.0 | % | 2,184 | 0.8 | % | 558 | 1.5 | % | |||||||||||||||
Other (b) | 7,524 | 1.1 | % | 1,767 | 2.0 | % | 4,279 | 1.6 | % | 1,421 | 3.8 | % | |||||||||||||||
Total South | 112,943 | 16.7 | % | 15,663 | 17.6 | % | 35,482 | 13.2 | % | 6,211 | 16.6 | % | |||||||||||||||
Midwest | |||||||||||||||||||||||||||
Illinois | 25,979 | 3.9 | % | 3,741 | 4.2 | % | 6,333 | 2.4 | % | 1,254 | 3.3 | % | |||||||||||||||
Michigan | 11,594 | 1.7 | % | 1,380 | 1.5 | % | 3,975 | 1.5 | % | 708 | 1.9 | % | |||||||||||||||
Indiana | 9,134 | 1.4 | % | 1,418 | 1.6 | % | 3,141 | 1.2 | % | 433 | 1.1 | % | |||||||||||||||
Ohio | 7,163 | 1.1 | % | 1,647 | 1.8 | % | 3,225 | 1.2 | % | 671 | 1.8 | % | |||||||||||||||
Other (b) | 27,490 | 4.1 | % | 4,923 | 5.5 | % | 9,583 | 3.6 | % | 1,494 | 4.0 | % | |||||||||||||||
Total Midwest | 81,360 | 12.2 | % | 13,109 | 14.6 | % | 26,257 | 9.9 | % | 4,560 | 12.1 | % | |||||||||||||||
U.S. Total | 434,344 | 64.5 | % | 56,874 | 63.7 | % | 130,936 | 49.0 | % | 19,921 | 53.2 | % | |||||||||||||||
International | |||||||||||||||||||||||||||
Germany | 53,854 | 8.0 | % | 6,898 | 7.7 | % | 28,730 | 10.8 | % | 3,414 | 9.1 | % | |||||||||||||||
France | 41,580 | 6.2 | % | 8,166 | 9.2 | % | 15,425 | 5.8 | % | 3,182 | 8.5 | % | |||||||||||||||
United Kingdom | 36,314 | 5.4 | % | 2,464 | 2.8 | % | 32,179 | 12.1 | % | 1,982 | 5.3 | % | |||||||||||||||
Spain | 26,880 | 4.0 | % | 2,927 | 3.3 | % | 26,880 | 10.1 | % | 2,927 | 7.8 | % | |||||||||||||||
Finland | 26,779 | 4.0 | % | 2,133 | 2.4 | % | 5,885 | 2.2 | % | 418 | 1.1 | % | |||||||||||||||
Poland | 16,463 | 2.4 | % | 2,189 | 2.4 | % | 1,819 | 0.7 | % | 362 | 1.0 | % | |||||||||||||||
Australia | 10,162 | 1.5 | % | 3,160 | 3.5 | % | 10,162 | 3.8 | % | 3,160 | 8.4 | % | |||||||||||||||
The Netherlands | 9,139 | 1.4 | % | 1,676 | 1.9 | % | 6,241 | 2.3 | % | 1,235 | 3.3 | % | |||||||||||||||
Other (c) | 17,839 | 2.6 | % | 2,737 | 3.1 | % | 8,403 | 3.2 | % | 881 | 2.3 | % | |||||||||||||||
International Total | 239,010 | 35.5 | % | 32,350 | 36.3 | % | 135,724 | 51.0 | % | 17,561 | 46.8 | % | |||||||||||||||
Total (d) | $ | 673,354 | 100.0 | % | 89,224 | 100.0 | % | $ | 266,660 | 100.0 | % | 37,482 | 100.0 | % | |||||||||||||
| | Investing for the long runTM | 23 | |
W. P. Carey Inc.
Owned Real Estate Portfolio – First Quarter 2015
________
(a) | Represents properties unencumbered by non-recourse mortgage debt. |
(b) | Other properties in the East include assets in Connecticut, South Carolina, Kentucky, Maryland, New Hampshire, and West Virginia. Other properties in the West include assets in Washington, New Mexico, Nevada, Oregon, Wyoming, and Alaska. Other properties in the South include assets in Alabama, Louisiana, Arkansas, Mississippi, and Oklahoma. Other properties in the Midwest include assets in Missouri, Minnesota, Kansas, Wisconsin, Nebraska, and Iowa. |
(c) | Includes assets in Norway, Hungary, Belgium, Sweden, Canada, Mexico, Thailand, Malaysia, and Japan. |
(d) | See the Terms and Definitions section in the Appendix for a description of pro rata. |
| | Investing for the long runTM | 24 | |
W. P. Carey Inc.
Owned Real Estate Portfolio – First Quarter 2015
Contractual Rent Increases | |
In thousands, except percentages. Pro rata. As of March 31, 2015.
Total Net-Lease Portfolio | Unencumbered Net-Lease Portfolio (a) | ||||||||||||||||||||||||||
Rent Adjustment Measure | ABR | ABR Percent | Square Footage | Sq. ft. Percent | ABR | ABR Percent | Square Footage | Sq. ft. Percent | |||||||||||||||||||
(Uncapped) CPI | $ | 281,122 | 41.7 | % | 36,803 | 41.2 | % | $ | 117,235 | 44.0 | % | 14,508 | 38.6 | % | |||||||||||||
CPI - based | 189,841 | 28.2 | % | 24,049 | 27.0 | % | 77,256 | 29.0 | % | 11,452 | 30.6 | % | |||||||||||||||
Fixed | 167,350 | 24.9 | % | 23,781 | 26.7 | % | 65,094 | 24.4 | % | 9,996 | 26.7 | % | |||||||||||||||
Other | 20,138 | 3.0 | % | 1,248 | 1.4 | % | 4,039 | 1.5 | % | 211 | 0.6 | % | |||||||||||||||
None | 14,903 | 2.2 | % | 3,343 | 3.7 | % | 3,036 | 1.1 | % | 1,315 | 3.5 | % | |||||||||||||||
Total (b) | $ | 673,354 | 100.0 | % | 89,224 | 100.0 | % | $ | 266,660 | 100.0 | % | 37,482 | 100.0 | % | |||||||||||||
________
(a) | Represents properties unencumbered by non-recourse mortgage debt. |
(b) | See the Terms and Definitions section in the Appendix for a description of pro rata. |
| | Investing for the long runTM | 25 | |
W. P. Carey Inc.
Owned Real Estate Portfolio – First Quarter 2015
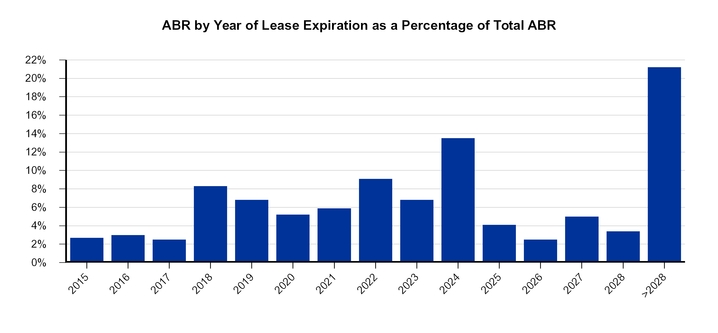
Lease Expirations – Total Net-Lease Portfolio | |
In thousands, except percentages and number of leases. Pro rata. As of March 31, 2015.
Year of Lease Expiration (a) | Number of Leases Expiring | ABR | ABR Percent | Square Footage | Sq. ft. Percent | |||||||||||
Remaining 2015 (b) | 12 | $ | 18,167 | 2.7 | % | 1,806 | 2.0 | % | ||||||||
2016 | 18 | 19,905 | 3.0 | % | 2,616 | 2.9 | % | |||||||||
2017 | 19 | 16,571 | 2.5 | % | 2,711 | 3.0 | % | |||||||||
2018 | 29 | 55,627 | 8.3 | % | 8,106 | 9.1 | % | |||||||||
2019 | 29 | 46,069 | 6.8 | % | 4,751 | 5.3 | % | |||||||||
2020 | 24 | 34,776 | 5.2 | % | 3,533 | 4.0 | % | |||||||||
2021 | 76 | 39,909 | 5.9 | % | 6,665 | 7.5 | % | |||||||||
2022 | 37 | 61,561 | 9.1 | % | 8,551 | 9.6 | % | |||||||||
2023 | 14 | 45,584 | 6.8 | % | 5,550 | 6.2 | % | |||||||||
2024 | 42 | 91,104 | 13.5 | % | 11,905 | 13.3 | % | |||||||||
2025 | 40 | 27,765 | 4.1 | % | 3,001 | 3.4 | % | |||||||||
2026 | 21 | 17,205 | 2.5 | % | 2,524 | 2.8 | % | |||||||||
2027 | 16 | 33,535 | 5.0 | % | 5,380 | 6.0 | % | |||||||||
2028 | 10 | 23,055 | 3.4 | % | 2,987 | 3.4 | % | |||||||||
Thereafter (>2028) | 86 | 142,521 | 21.2 | % | 17,746 | 19.9 | % | |||||||||
Vacant | — | — | — | % | 1,392 | 1.6 | % | |||||||||
Total (c) | 473 | $ | 673,354 | 100.0 | % | 89,224 | 100.0 | % | ||||||||
________
(a) | Assumes tenant does not exercise renewal option. |
(b) | Month-to-month leases are counted in 2015 ABR. |
(c) | See the Terms and Definitions section in the Appendix for a description of pro rata. |
| | Investing for the long runTM | 26 | |
W. P. Carey Inc.
Owned Real Estate Portfolio – First Quarter 2015
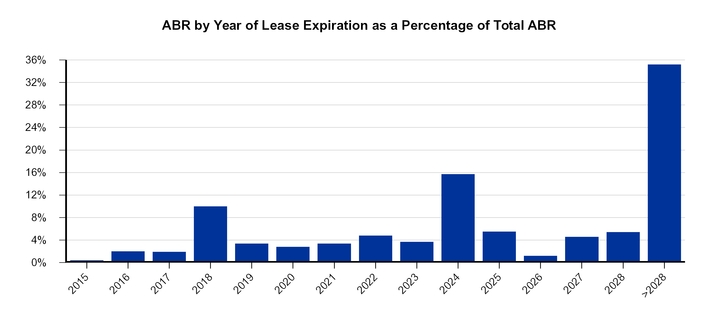
Lease Expirations – Unencumbered Net-Lease Portfolio | |
In thousands, except percentages and number of leases. Pro rata. As of March 31, 2015.
Year of Lease Expiration (a) | Number of Leases Expiring | ABR | ABR Percent | Square Footage | Sq. ft. Percent | |||||||||||
Remaining 2015 (b) | 3 | $ | 1,033 | 0.4 | % | 106 | 0.3 | % | ||||||||
2016 | 9 | 5,336 | 2.0 | % | 822 | 2.2 | % | |||||||||
2017 | 7 | 4,954 | 1.9 | % | 1,028 | 2.8 | % | |||||||||
2018 | 17 | 26,779 | 10.0 | % | 4,759 | 12.7 | % | |||||||||
2019 | 11 | 8,964 | 3.4 | % | 1,584 | 4.2 | % | |||||||||
2020 | 9 | 7,516 | 2.8 | % | 1,178 | 3.2 | % | |||||||||
2021 | 5 | 9,088 | 3.4 | % | 1,663 | 4.4 | % | |||||||||
2022 | 10 | 12,719 | 4.8 | % | 2,447 | 6.5 | % | |||||||||
2023 | 5 | 9,912 | 3.7 | % | 1,393 | 3.7 | % | |||||||||
2024 | 10 | 41,904 | 15.7 | % | 5,707 | 15.2 | % | |||||||||
2025 | 7 | 14,760 | 5.5 | % | 1,255 | 3.3 | % | |||||||||
2026 | 2 | 3,190 | 1.2 | % | 359 | 1.0 | % | |||||||||
2027 | 4 | 12,345 | 4.6 | % | 1,595 | 4.3 | % | |||||||||
2028 | 6 | 14,366 | 5.4 | % | 1,425 | 3.8 | % | |||||||||
Thereafter (>2028) | 16 | 93,794 | 35.2 | % | 11,506 | 30.7 | % | |||||||||
Vacant | — | — | — | % | 655 | 1.7 | % | |||||||||
Total (c) (d) | 121 | $ | 266,660 | 100.0 | % | 37,482 | 100.0 | % | ||||||||
________
(a) | Assumes tenant does not exercise renewal option. |
(b) | Month-to-month leases are counted in 2015 ABR. |
(c) | See the Terms and Definitions section in the Appendix for a description of pro rata. |
(d) | Represents properties unencumbered by non-recourse mortgage debt. |
| | Investing for the long runTM | 27 | |
W. P. Carey Inc.
Investment Management
First Quarter 2015

| | Investing for the long runTM | 28 | |
W. P. Carey Inc.
Investment Management – First Quarter 2015
Selected Information – Managed REITs | |
Dollars and square footage in thousands. As of or for the three months ended March 31, 2015.
Managed REITs | |||||||||||||||
CPA®:17 – Global | CPA®:18 – Global | CWI | CWI 2 | ||||||||||||
General | |||||||||||||||
Year established | 2007 | 2013 | 2010 | 2014 | |||||||||||
Total AUM (a) | $ | 5,496,293 | $ | 1,697,844 | $ | 2,350,107 | $ | 500 | |||||||
Portfolio | |||||||||||||||
Property type | Net lease / Diversified | Net lease / Diversified | Lodging | Lodging | |||||||||||
Number of net-leased properties | 368 | 49 | N/A | N/A | |||||||||||
Number of operating properties | 72 | 25 | 29 | N/A | |||||||||||
Number of tenants – net-leased properties (b) | 113 | 77 | N/A | N/A | |||||||||||
Square footage (b) | 37,690 | 7,834 | 5,626 | N/A | |||||||||||
Occupancy (c) | 100.0 | % | 100.0 | % | 72.5 | % | N/A | ||||||||
Acquisitions – first quarter | $ | 138,140 | $ | 200,411 | $ | 227,298 | $ | — | |||||||
Dispositions – first quarter | — | — | — | — | |||||||||||
Balance Sheet | |||||||||||||||
Total assets | $ | 4,479,340 | $ | 1,806,833 | $ | 2,047,501 | $ | 2,246 | |||||||
Total debt | 1,849,317 | 663,085 | 1,014,717 | — | |||||||||||
Total debt / total assets | 41.3 | % | 36.7 | % | 49.6 | % | N/A | ||||||||
Investor Capital Inflow | |||||||||||||||
Gross offering proceeds – first quarter (d) (e) | N/A | $ | 99,177 | (d) | N/A | N/A | |||||||||
Status (f) | Closed | Open | Closed | Open | |||||||||||
% subscribed | |||||||||||||||
Initial offering (e) | 100 | % | 99 | % | 100 | % | N/A | ||||||||
Follow-on offering (e) | 100 | % | N/A | 100 | % | N/A | |||||||||
________
(a) | Represents estimated value of real estate assets plus cash and cash equivalents, less distributions payable. |
(b) | For CPA®:17 – Global and CPA®:18 – Global, excludes operating properties. |
(c) | Represents occupancy for net-leased properties for CPA®:17 – Global and CPA®:18 – Global. Represents occupancy for hotels owned by CWI for the three months ended March 31, 2015. Occupancy for CPA®:17 – Global's 71 self-storage properties was 87.0% as of March 31, 2015. Occupancy for CPA®:18 – Global's 20 self-storage properties and five multi-family properties was 87.5% and 98.5%, respectively, as of March 31, 2015. |
(d) | For CPA®:18 – Global, total gross offering proceeds is solely comprised of Class C common stock. CPA®:18 – Global completed sales of its Class A common stock in June 2014. CPA®:18 – Global ceased accepting new orders for shares of its Class C common stock on March 27, 2015. |
(e) | Excludes distribution reinvestment plan, or DRIP proceeds. |
(f) | For CPA®:18 – Global, offering was for up to $1.4 billion of common stock, including $150.0 million for the DRIP. CPA®:18 – Global’s offering closed on April 2, 2015. CWI 2’s initial public offering commenced on February 9, 2015 for up to $1.4 billion of common stock, including $600.0 million for the DRIP. In August 2014, CWI allocated $200.0 million of common stock from its DRIP to the follow-on offering, and in December 2014 CWI allocated an additional $60.0 million of common stock to the follow on offering from its DRIP. On December 31, 2014, the follow-on offering for CWI was closed. |
| | Investing for the long runTM | 29 | |
W. P. Carey Inc.
Investment Management – First Quarter 2015
Summary of Selected Revenue Sources from Managed REITs | |
Managed REITs | |||||||
CPA®:17 – Global | CPA®:18 – Global | CWI | CWI 2 | ||||
Status | Closed | Open (through April 2, 2015) | Closed | Open | |||
Profits Interests | |||||||
Special general partnership profits interest (% of Available Cash) (a) (b) | 10.00% | 10.00% | 8.00% (c) | 10.00% | |||
Asset Management and Structuring Revenues | |||||||
Asset management fees (% of average market value) (b) (d) | 0.50% | 0.50% | 0.40% (e) | 0.4125% (f) | |||
Acquisition / structuring fees (% of total aggregate cost) (b) (g) | 4.50% (h) | 4.50% (h) (i) | 2.00% (j) | 1.875% (k) | |||
Dealer Manager Related Revenues | |||||||
Selling commissions | We receive selling commissions for the sale of shares in the Managed REITs, which are re-allowed to selected broker dealers. | ||||||
Dealer manager fees | We receive a dealer manager fee for the sale of shares in the Managed REITs, a portion of which is re-allowed to selected broker dealers. | ||||||
Distribution and shareholder servicing fees | For CPA®:18 – Global and CWI 2, we receive an annual distribution and shareholder servicing fee in connection with sales of shares of Class C common stock and Class T common stock respectively, which may be re-allowed to selected broker dealers. | ||||||
________
(a) | Available Cash means cash generated by operating partnership operations and investments, excluding cash from sales and refinancings, after the payment of debt service and other operating expenses, but before distributions to partners. Recorded in Equity in earnings of equity method investments in real estate and the Managed REITs in our consolidated financial statements. |
(b) | Fees are subject to certain regulatory limitations and restrictions, as described in the applicable Managed REIT prospectus. |
(c) | Special general partnership receives 10% of Available Cash; however, 20% of the special general partnership is owned by an unrelated third-party subadvisor. |
(d) | Generally 0.50%; however, asset management fees may vary according to the type of asset as described in the prospectus of each Managed REIT. Under the terms of the respective advisory agreements of the Managed REITs, we may elect to receive cash or shares of CWI and CWI2’s stock for asset management fees due, the CPA REIT’s have an option to pay asset management fees in cash or shares upon our recommendation. Asset management fees are recorded in Asset management revenue in our consolidated financial statements. |
(e) | 20% of CWI’s 0.50% asset management fee is paid to an unrelated third-party subadvisor. |
(f) | 25% of CWI 2’s 0.55% asset management fee is paid to an unrelated third-party subadvisor. |
(g) | Recorded in Structuring revenue in our consolidated financial statements. |
(h) | Comprised of an initial acquisition fee (generally 2.50% of the total aggregate cost of net-leased properties) paid when the transaction is completed and a subordinated acquisition fee (generally 2.00% of the total aggregate cost of net-leased properties) paid in annual installments over three years, provided certain performance criterion are met. The acquisition fee for other properties is generally 1.75% of the total aggregate cost. |
(i) | In connection with the acquisitions of multi-family and multi-tenant properties on behalf of CPA®:18 – Global, we entered into agreements with unrelated third-party advisors for the day-to-day management of the properties for a fee. |
(j) | 20% of CWI’s 2.50% acquisition fee is paid to an unrelated third-party subadvisor. Applied to the total investment cost and loans originated. A loan refinancing fee of up to 1.0% of the principal amount of a refinanced loan secured by property applies to loan refinancings that meet certain criteria, as described in the prospectus for CWI. 20% of the loan refinancing fee is paid to the subadvisor. |
(k) | 25% of CWI 2’s 2.50% acquisition fee is paid to an unrelated third-party subadvisor. Applied to the total investment cost and loans originated. A loan refinancing fee of up to 1.0% of the principal amount of a refinanced loan secured by property applies to loan refinancings that meet certain criteria, as described in the prospectus for CWI 2. 25% of the loan refinancing fee is paid to the subadvisor. |
| | Investing for the long runTM | 30 | |
W. P. Carey Inc.
Investment Management – First Quarter 2015
Investment Activity – Managed REITs | |
Dollars in thousands. Pro rata. For the three months ended March 31, 2015.
Acquisitions – Net-Leased Properties | Gross Square Footage | ||||||||||||||
Portfolio(s) | Tenant / Lease Guarantor | Property Location(s) | Purchase Price | Closing Date | Property Type(s) | ||||||||||
1Q15 | |||||||||||||||
CPA®:17 – Global | iHeartCommunications, Inc. | San Antonio, TX | $ | 22,170 | Jan-15 | Office | 120,147 | ||||||||
CPA®:17 – Global | FM Polska s.p. z oo (2 properties) (a) | Tomaszow Mazowiecki and Mszczonow, Poland | 63,849 | Feb-15 | Warehouse | 1,277,184 | |||||||||
CPA®:18 – Global | Rabobank (a) (b) | Eindhoven, Netherlands | 36,453 | Mar-15 | Office | BTS | |||||||||
CPA®:18 – Global | Broadfold (Truffle) (a) (c) | Aberdeen, United Kingdom | 7,552 | Mar-15 | Industrial | 55,247 | |||||||||
Year-to-Date Total Acquisitions – Net-Leased Properties | 130,024 | 1,452,578 | |||||||||||||
Acquisitions – Self-Storage | |||||||
Portfolio(s) | Property Location(s) | Purchase Price (c) | Closing Date | ||||
1Q15 | |||||||
CPA®:18 – Global | Naples, FL | 16,458 | Jan-15 | ||||
CPA®:18 – Global | Valrico, FL | 9,746 | Jan-15 | ||||
CPA®:18 – Global | Tallahassee, FL | 7,919 | Feb-15 | ||||
CPA®:18 – Global | Lady Lake, FL | 6,357 | Feb-15 | ||||
CPA®:18 – Global | Sebastian, FL | 3,168 | Feb-15 | ||||
CPA®:18 – Global | Panama City, FL | 4,224 | Mar-15 | ||||
Year-to-Date Total Acquisitions – Self-Storage Properties | 47,872 | ||||||
Acquisitions – Hotels | |||||||
Portfolio(s) | Property Location(s) | Purchase Price (d) | Closing Date | ||||
1Q15 | |||||||
CWI | Minneapolis, MN | 69,339 | Feb-15 | ||||
CWI | Pasadena, CA | 157,959 | Mar-15 | ||||
Year-to-Date Total Acquisitions – Hotels | 227,298 | ||||||
Acquisitions – Multi-Family | |||||||
Portfolio(s) | Property Location(s) | Purchase Price (d) | Closing Date | ||||
1Q15 | |||||||
CPA®:18 – Global | Durham, NC | 34,707 | Jan-15 | ||||
CPA®:18 – Global | Fort Myers, FL | 28,190 | Jan-15 | ||||
CPA®:18 – Global (a) | Reading, United Kingdom | 45,637 | Feb-15 | ||||
Year-to-Date Total Acquisitions – Multi-Family Properties | 108,534 | ||||||
Acquisitions – Other | ||||||||||
Portfolio(s) | Security Type | Company | Purchase Price | Closing Date | ||||||
1Q15 | ||||||||||
CPA®:17 – Global | Notes Receivable | 1185 Broadway LLC (d) | 30,303 | Jan-15 | ||||||
CPA®:17 – Global | Notes Receivable | 127 West 23rd Manager, LLC (d) | 12,727 | Feb-15 | ||||||
CPA®:17 – Global | Equity Securities | BPS Nevada, LLC | 9,091 | Feb-15 | ||||||
Year-to-Date Total Acquisitions – Other | 52,121 | |||||||||
Year-to-Date Total Acquisitions | $ | 565,849 | ||||||||
| | Investing for the long runTM | 31 | |
W. P. Carey Inc.
Investment Management – First Quarter 2015
________
(a) | Amount reflects the applicable exchange rate on the date of acquisition. |
(b) | Acquisition includes a build-to-suit transaction. Purchase price represents total commitment for build-to-suit funding. Gross square footage cannot be determined at this time. |
(c) | Acquisition was deemed to be a business combination and purchase price includes acquisition-related costs and fees, which were expensed |
(d) | Purchase price includes acquisition-related costs and fees, which were expensed. |
| | Investing for the long runTM | 32 | |
W. P. Carey Inc.
Appendix
First Quarter 2015
| | Investing for the long runTM | 33 | |
W. P. Carey Inc.
Appendix – First Quarter 2015
Normalized Pro Rata Cash Net Operating Income (NOI) | |
In thousands. From real estate.
Three Months Ended Mar. 31, 2015 | ||||
Consolidated Lease Revenues | ||||
Total lease revenues – as reported | 160,165 | |||
Less: Consolidated Non-Reimbursable Property Expenses | ||||
Non-reimbursable property expenses – as reported | 3,993 | |||
156,172 | ||||
Plus: NOI from Operating Properties | ||||
Hotels NOI | 1,618 | |||
Self-storage properties NOI | 95 | |||
1,713 | ||||
157,885 | ||||
Adjustments for Pro Rata Ownership of Real Estate Joint Ventures: | ||||
Add: Pro rata share of NOI from equity investments | 4,691 | |||
Less: Pro rata share of NOI attributable to noncontrolling interests | (5,792 | ) | ||
(1,101 | ) | |||
156,784 | ||||
Adjustments for Pro Rata Non-Cash Items: | ||||
Add: Above- and below-market rent intangible lease amortization | 13,168 | |||
Less: Straight-line rent amortization | (3,032 | ) | ||
Add: Other non-cash items | 178 | |||
10,314 | ||||
Pro Rata Cash NOI (a) | $ | 167,098 | ||
Adjustment to normalize for intra-period acquisitions and dispositions (b) | 1,970 | |||
Normalized Pro Rata Cash NOI (a) | $ | 169,068 | ||
________
(a) | Pro rata cash NOI and normalized pro rata cash NOI are non-GAAP measures. See the Terms and Definitions section that follows for a description of our non-GAAP measures and for details on how pro rata cash NOI and normalized pro rata cash NOI are calculated. |
(b) | For properties acquired during the three months ended March 31, 2015, the adjustment replaces our pro rata share of cash NOI for the partial period with an amount estimated to be equivalent to our pro rata share of cash NOI for the full period. For properties disposed of during the three months ended March 31, 2015, the adjustment eliminates our pro rata share of cash NOI for the period. |
| | Investing for the long runTM | 34 | |
W. P. Carey Inc.
Appendix – First Quarter 2015
Reconciliation of Net Income to Adjusted EBITDA – Last Five Quarters | |
In thousands.
Three Months Ended | |||||||||||||||||||
Mar. 31, 2015 | Dec. 31, 2014 | Sep. 30, 2014 | Jun. 30, 2014 | Mar. 31, 2014 | |||||||||||||||
Net income attributable to W. P. Carey | $ | 36,116 | $ | 32,272 | $ | 27,337 | $ | 64,739 | $ | 115,478 | |||||||||
Adjustments to Derive Consolidated EBITDA | |||||||||||||||||||
Depreciation and amortization (a) | 65,400 | 61,478 | 59,524 | 63,555 | 53,244 | ||||||||||||||
Interest expense (a) | 47,949 | 44,799 | 46,588 | 47,826 | 39,248 | ||||||||||||||
Provision for income taxes (a) | 1,980 | 6,172 | 945 | 8,340 | 2,308 | ||||||||||||||
EBITDA (b) | 151,445 | 144,721 | 134,394 | 184,460 | 210,278 | ||||||||||||||
Adjustments to Derive Adjusted EBITDA | |||||||||||||||||||
Adjustments for Non-Cash Items: | |||||||||||||||||||
Above- and below-market rent intangible and straight-line rent adjustments | 10,813 | 10,350 | 12,642 | 8,125 | 10,817 | ||||||||||||||
Unrealized losses (gains) on hedging activity (c) | 7,425 | 1,293 | 4,806 | 403 | (1,179 | ) | |||||||||||||
Stock-based compensation expense | 7,009 | 8,095 | 7,979 | 7,957 | 6,826 | ||||||||||||||
Impairment charges | 2,683 | 16,776 | 4,225 | 2,066 | — | ||||||||||||||
27,930 | 36,514 | 29,652 | 18,551 | 16,464 | |||||||||||||||
Adjustments for Non-Core Items (d) | |||||||||||||||||||
Property acquisition expenses | 6,321 | 3,060 | 609 | 224 | 100 | ||||||||||||||
Gain on sale of real estate, net | (1,185 | ) | (5,062 | ) | (259 | ) | (25,582 | ) | (3,176 | ) | |||||||||
Merger expenses (e) | (645 | ) | 37 | 9 | 915 | 29,511 | |||||||||||||
Loss on extinguishment of debt | — | — | 1,122 | 721 | 7,992 | ||||||||||||||
Gain on change in control of interests (f) | — | — | — | — | (105,947 | ) | |||||||||||||
Other (g) (h) | (382 | ) | 2,893 | (272 | ) | 158 | 662 | ||||||||||||
4,109 | 928 | 1,209 | (23,564 | ) | (70,858 | ) | |||||||||||||
Adjustments for Pro Rata Ownership | |||||||||||||||||||
Real Estate Joint Ventures: (i) | |||||||||||||||||||
Add: Pro rata share of adjustments for equity investments | 2,001 | 4,369 | 1,487 | 1,725 | 3,048 | ||||||||||||||
Less: Pro rata share of adjustments for amounts attributable to noncontrolling interests | (4,012 | ) | (4,550 | ) | (6,354 | ) | (5,330 | ) | (6,896 | ) | |||||||||
(2,011 | ) | (181 | ) | (4,867 | ) | (3,605 | ) | (3,848 | ) | ||||||||||
Equity Investments in the Managed Programs (j) | |||||||||||||||||||
Add: Distributions received from equity investments in the Managed Programs | 1,580 | 1,447 | 1,298 | 1,245 | 7,431 | ||||||||||||||
Less: Income from equity investments in the Managed Programs | (115 | ) | (333 | ) | (241 | ) | (650 | ) | (470 | ) | |||||||||
1,465 | 1,114 | 1,057 | 595 | 6,961 | |||||||||||||||
Adjusted EBITDA (b) | $ | 182,938 | $ | 183,096 | $ | 161,445 | $ | 176,437 | $ | 158,997 | |||||||||
________
(a) | Includes amounts related to discontinued operations. |
(b) | EBITDA and adjusted EBITDA are non-GAAP measures. See the Terms and Definitions section that follows for a description of our non-GAAP measures. |
(c) | Comprised of gains and losses on derivatives and gains and losses on foreign currency hedges. |
(d) | Comprised of items that we do not consider to be part of our core operating business plan or representative of our overall long-term operating performance, based on a number of factors, including the nature of the item and/or the frequency with which it occurs. We believe that these adjustments provide a more representative view of EBITDA from our core operating business and allow for more meaningful comparisons. |
(e) | Amount for the three months ended March 31, 2014 includes reported merger costs as well as income tax expense incurred in connection with the CPA®:16 Merger. Income tax expense incurred in connection with the CPA®:16 Merger represents the current portion of income tax expense, including the permanent difference incurred upon recognition of deferred revenue associated with the accelerated vesting of shares previously issued by CPA®:16 – Global for asset management and performance fees. |
| | Investing for the long runTM | 35 | |
W. P. Carey Inc.
Appendix – First Quarter 2015
(f) | For the three months ended March 31, 2014, represents a gain of $75.7 million recognized on our previously-held interest in shares of CPA®:16 – Global common stock and a gain of $30.2 million recognized on the purchase of the remaining interests in nine investments from CPA®:16 – Global, which we had previously accounted for under the equity method. During the three months ended June 30, 2014, we identified certain measurement period adjustments that increased the fair value of our previously-held interest in shares of CPA®:16 – Global common stock by $1.3 million. During the three months ended December 31, 2014, we identified a second measurement period adjustment that impacted the provisional accounting, which increased the fair value of our previously-held interest in shares of CPA®:16 – Global common stock by $1.3 million. We did not record these adjustments during the quarters they were identified, but rather in the three months ended March 31, 2014. Consequently, amounts presented above for gain on change in control of interests and net income for the three months ended March 31, 2014 differ from amounts presented in the first quarter and subsequent periods. |
(g) | Other, net for the three months ended December 31, 2014 primarily consists of proceeds from a bankruptcy settlement claim with U.S. Aluminum of Canada, a former CPA®:16 – Global tenant that was acquired as part of the CPA®:16 Merger on January 31, 2014, and under GAAP was accounted for in purchase accounting. |
(h) | Effective prospectively on January 1, 2015, we no longer adjust for realized gains or losses on foreign exchange derivatives. Realized gains (losses) on derivatives were $0.8 million, $0.3 million, $(0.4) million, and $(0.4) million for the three months ended December 31, 2014, September 30, 2014, June 30, 2014, and March 31 2014, respectively. |
(i) | Adjustments to include our pro rata share of depreciation and amortization, interest expense, provision for income taxes, non-cash items, and non-core items from joint ventures. |
(j) | Adjustments to include cash distributions received from the Managed REITs in place of our pro rata share of net income from our ownership in the Managed REITs. |
| | Investing for the long runTM | 36 | |
W. P. Carey Inc.
Appendix – First Quarter 2015
Terms and Definitions | |
Non-GAAP Financial Disclosures
AFFO
FFO is a non-GAAP measure defined by NAREIT. NAREIT defines FFO as net income or loss (as computed in accordance with GAAP) excluding: depreciation and amortization expense from real estate assets, impairment charges on real estate, gains or losses from sales of depreciated real estate assets, and extraordinary items; however, FFO related to assets held for sale, sold, or otherwise transferred and included in the results of discontinued operations are included. These adjustments also incorporate the pro rata (described below) share of unconsolidated subsidiaries. FFO is used by management, investors, and analysts to facilitate meaningful comparisons of operating performance between periods and among our peers. Although NAREIT has published this definition of FFO, companies often modify this definition as they seek to provide financial measures that meaningfully reflect their distinctive operations.
We modify the NAREIT computation of FFO to include other adjustments to GAAP net income to adjust for certain non-cash charges such as amortization of intangibles, deferred income tax benefits and expenses, straight-line rents, stock compensation, gains or losses from extinguishment of debt and deconsolidation of subsidiaries, and unrealized foreign currency exchange gains and losses. Our assessment of our operations is focused on long-term sustainability and not on such non-cash items, which may cause short-term fluctuations in net income but have no impact on cash flows. Additionally, we exclude acquisition expenses and non-core expenses, such as merger and restructuring expenses. Merger expenses are related to the CPA®:16 Merger. We also exclude realized gains/losses on foreign exchange derivatives, which are not considered fundamental attributes of our business plan and do not affect our overall long-term operating performance. We refer to our modified definition of FFO as AFFO. We exclude these items from GAAP net income as (i) they are not the primary drivers in our decision-making process and (ii) excluding these items provides investors with a view of our portfolio performance over time and make it more comparable to other REITs that are currently not engaged in acquisitions, mergers, and restructurings, which are not part of our normal business operations. We use AFFO as one measure of our operating performance when we formulate corporate goals, evaluate the effectiveness of our strategies, and determine executive compensation.
We believe that AFFO is a useful supplemental measure for investors to consider because it will help them to better assess the sustainability of our operating performance without the potentially distorting impact of these short-term fluctuations. However, there are limits on the usefulness of AFFO to investors. For example, impairment charges and unrealized foreign currency losses that we exclude may become actual realized losses upon the ultimate disposition of the properties in the form of lower cash proceeds or other considerations. We use our FFO and AFFO measures as supplemental financial measures of operating performance. We do not use our FFO and AFFO measures as, nor should they be considered to be, alternatives to net earnings computed under GAAP, as alternatives to cash from operating activities computed under GAAP, or as indicators of our ability to fund our cash needs.
Pro Rata Cash NOI
Cash net operating income, or cash NOI, is a non-GAAP financial measure that is intended to reflect the performance of our net leased and operating properties. We define cash NOI as cash rents from our leased and operating properties less non-reimbursable property expenses. Cash NOI excludes amortization of intangibles and straight-line rent adjustments that are included in GAAP lease revenues. We present cash NOI on a pro rata basis, referred to as pro rata cash NOI, to account for our share of income related to unconsolidated joint ventures and noncontrolling interests. We believe that pro rata cash NOI is a helpful measure that both investors and management can use to evaluate the financial performance of our leased and operating properties and it allows for comparison of our operating performance between periods and to other REITs. Pro rata cash NOI should not be considered as an alternative to net income as an indication of our financial performance or to cash flows as a measure of liquidity or our ability to fund all needs. The method by which we calculate and present cash NOI and/or pro rata cash NOI, may not be directly comparable to the way other REITs present cash NOI.
Normalized Pro Rata Cash NOI
Normalized pro rata cash NOI is pro rata cash NOI as defined above adjusted primarily to exclude our pro rata share of cash NOI from properties disposed of during the most recent quarter and to include a full quarter’s pro rata cash NOI related to acquisitions purchased during the period. We believe this measure provides a helpful representation of our net operating income from our in-place leased and operating properties.
| | Investing for the long runTM | 37 | |
W. P. Carey Inc.
Appendix – First Quarter 2015
Adjusted EBITDA
We believe that EBITDA is a useful supplemental measure to investors and analysts for assessing the performance of our business segments because (i) it removes the impact of our capital structure from our operating results and (ii) because it is helpful when comparing our operating performance to that of companies in our industry without regard to such items, which can vary substantially from company to company. Adjusted EBITDA as disclosed represents EBITDA, modified to include other adjustments to GAAP net income for certain non-cash charges, such as impairments, non-cash rent adjustments, and unrealized gains and losses from our hedging activity. Additionally, we exclude merger expenses related to the CPA®:16 Merger, which are considered non-core, and gains and losses in real estate, which are not considered fundamental attributes of our business plans and do not affect our overall long-term operating performance. We exclude these items from adjusted EBITDA as they are not the primary drivers in our decision-making process. Our assessment of our operations is focused on long-term sustainability and not on such non-cash and non-core items, which may cause short-term fluctuations in net income but have no impact on cash flows. We believe that adjusted EBITDA is a useful supplemental measure to investors and analysts, although it does not represent net income that is computed in accordance with GAAP. Accordingly, adjusted EBITDA should not be considered as an alternative to net income or as an indicator of our financial performance. EBITDA and adjusted EBITDA as calculated by us may not be comparable to similarly titled measures of other companies.
Other Metrics
Pro Rata Metrics
This supplemental package contains certain metrics prepared under the pro rata consolidation method. We refer to these metrics as pro rata metrics. We have a number of investments, usually with our affiliates, in which our economic ownership is less than 100%. Under the full consolidation method, we report 100% of the assets, liabilities, revenues, and expenses of those investments that are deemed to be under our control or for which we are deemed to be the primary beneficiary, even if our ownership is less than 100%. Also, for all other jointly-owned investments, we report our net investment and our net income or loss from that investment. Under the pro rata consolidation method, we present our proportionate share, based on our economic ownership of these jointly-owned investments, of the assets, liabilities, revenues, and expenses of those investments.
ABR
ABR represents contractual minimum annualized base rent for our net-leased properties. ABR is not applicable to operating properties.
| | Investing for the long runTM | 38 | |