UNITED STATES
SECURITIES AND EXCHANGE COMMISSION
Washington, D.C. 20549
FORM 8-K
CURRENT REPORT
Pursuant to Section 13 or 15(d) of the Securities Exchange Act of 1934
Date of Report: May 18, 2015
(Date of earliest event reported)
EXPEDITORS INTERNATIONAL OF WASHINGTON, INC.
(Exact name of registrant as specified in its charter)
Washington | 000-13468 | 91-1069248 | ||
(State or other jurisdiction of | (Commission File No.) | (IRS Employer Identification Number) | ||
incorporation or organization) | ||||
1015 Third Avenue, 12th Floor, Seattle, Washington | 98104 | |||
(Address of principal executive offices) | (Zip Code) | |||
(206) 674-3400 | ||||
(Registrant's telephone number, including area code) | ||||
N/A | ||||
(Former name or former address, if changed since last report) | ||||
Check the appropriate box below if the Form 8-K filing is intended to simultaneously satisfy the filing obligation of the registrant under any of the following provisions:
o | Written communications pursuant to Rule 425 under the Securities Act (17 CFR 230.425) | |
o | Soliciting material pursuant to Rule 14a-12 under the Exchange Act (17 CFR 240.14a-12) | |
o | Pre-commencement communications pursuant to Rule 14d-2(b) under the Exchange Act (17 CFR 240.14d-2(b)) | |
o | Pre-commencement communications pursuant to Rule 13e-4(c) under the Exchange Act (17 CFR 240.13e-4(c)) | |
Item 7.01. Regulation FD Disclosure.
The following information is included in this document as a result of Expeditors' policy regarding public disclosure of corporate information.
SAFE HARBOR FOR FORWARD-LOOKING STATEMENTS UNDER SECURITIES LITIGATION REFORM ACT OF 1995; CERTAIN CAUTIONARY STATEMENTS
Certain portions of this document, including the answers to questions 1, 2, 3, 4, 5, 6, 7, 8, 9, 10, 12, 13, 14, 15, 16, 17, 18, 19, 20, 22, 23 and 24 contain forward-looking statements which are based on certain assumptions and expectations of future events that are subject to risks and uncertainties. Actual future results and trends may differ materially from historical results or those projected in any forward-looking statements depending on a variety of factors including, but not limited to, changes in customer demand for Expeditors' services caused by a general economic slow-down, inventory build-up, decreased consumer confidence, volatility in equity markets, changes in energy prices, liquidity constraints, political changes, changes in foreign currency rates, or the creditworthiness of our customers.
SELECTED INQUIRIES RECEIVED THROUGH FEBRUARY 27, 2015
1. You delivered high teens operating income growth in Asia during 4Q after several quarters of Y/Y declines. What is driving the improved profitability in this region? Please comment on market conditions and your progress on strategic goals in this region.
There are several things we can point to that explain our improved profitability in Asia.
I. Increased focus on productivity. Historically Asia has enjoyed a very favorable labor differential. As wages have risen, particularly in China, there has been an increased incentive for our Asian group to reach out to our Americas team to incorporate more of the productivity measures that have been developed and put in place in those markets.
II. Being more discerning in how we strategically say yes and how we say no. Building and maintaining volume is an important part of developing international freight lanes, particularly airfreight lanes. Increasing the efficiency with mix-and-match of freight and optimizing routings with rationalized carrier bases helps drive profitability from the overall consolidation efforts.
III. A strong US dollar and a more stable and strengthening US economy. Historically Asian exports have responded more to stronger currency and strong economic growth, which are usually correlated. In the United States and in Europe, than they have been influenced by a strong local economy. While Europe remains somewhat subdued from an economic health standpoint, the US dollar has progressively strengthened through 2014. This created more US imports. Since China is by far the largest exporter of goods to the United States (with three other Asian countries in the top ten), this translated into more Asian exports.
2. How much of the impressive airfreight volume growth you saw in 4Q14 do you think can be attributed to modal shift as a result of the US West Coast port situation? Your ocean volumes were also strong though, even against a tough comp, so should we assume they would have been even stronger if not for the port disruptions? And how should we think about the impact on both air and ocean volume expectations for 1Q15? We’re trying to get a sense for how sustainable the volume strength you experienced in 4Q is.
It’s very difficult for us to quantify what the actual impact on our airfreight volume growth in the fourth quarter could be attributed to the US West Coast port situation. Our internal feedback, and the perceptions of our managers, is that there really wasn’t all that much of an impact in the fourth quarter. In reality, we have no reliable way of measuring what, if any, impact there may have been. This is particularly true since we saw strong gains in both our air and ocean products during the fourth quarter.
It is in situations like this, however, that the supposedly generic status of freight forwarders is actually put to the test. These kinds of market conditions provide an opportunity for the true capabilities of skilled logistics professionals to differentiate themselves on how they can make a difference in a very difficult and disrupted supply chain. We hasten to point out that the West Coast situation involved a slowdown, but not a stoppage. Different carriers and
different terminals located in various ports along the West Coast varied in their abilities to offer services. Our ocean team worked tirelessly and put in many long hours crafting alternative routing solutions and locating hard-to-find equipment to meet our customers’ needs. We can take a great deal of satisfaction realizing that our activity on the ocean side grew while the throughputs on the ocean terminals' side seem to diminish. That didn’t occur by chance.
Air and ocean volumes for January 2015 and the first part of February 2015 were also influenced by the timing of Chinese New Year in February. All in all, we actually felt pretty good about how things have shaken out so far in 2015.
3. How, and to what extent, do you foresee your customers changing their supply chains after the latest round of delays on the USWC (more of a sustained move to diversify their port exposure)?
The move to diversify port selection has been ongoing for quite some time, independent of the more recent US West Coast port situation. With the widening of the Panama Canal, scheduled to go into operation sometime in 2016, it is anticipated that there will be more all-water sailings through the canal to the US East Coast. In anticipation of this event, the East Coast ports have been much more active in investing in infrastructure to expand their capabilities. Given that the population distribution in the United States is much more dense east of the Mississippi, increasing US East Coast access by all-water solutions probably creates a more reliable, easier to manage supply chain, albeit one with slower transit times which is in turn more expensive. Where speed to market is the major consideration, it will be very difficult to have all-water service from Asia via an expanded Panama Canal supersede the conventional West Coast port land bridge IPI (Inland Point Intact…ocean freight terminology for services offered by steamship lines where the rate includes moving the container, intact, typically by rail, from the actual port of discharge on the coast to a designated inland destination) service currently offered by the ocean carriers.
We’ve talked with a number of the logistics professionals working for our customers who are particularly involved in ocean imports to the West Coast about this subject over the last several months. The interesting consensus that has emerged from these conversations is that while people are certainly frustrated by what has gone on with the West Coast port situation over the last nine months, given that there is now an agreement currently in place, they don’t expect to see big shifts to the East Coast in the foreseeable future. This is particularly true where there is a favorable West Coast cost advantage.
We also believe that many of our customers understand that shifting to an all water service via the East Coast can present problems if there is a work slow-down when East Coast contracts are negotiated. It is our opinion that the best supply chain uses both coasts, allows for speed to market when necessary, and provides options when labor disruptions or natural disasters occur.
4. K+N believes volume in the air and ocean markets will grow 4-5% in 2015 (and they will grow 1.5x the market). IATA is looking for about the same rate of market growth. Maersk is looking for 3-5% ocean volume growth in 2015. Can you please give us a sense for your market volume expectations for 2015 and how you think EXPD’s volumes will trend relative to those?
We’ve long stated that we are not in the habit of making or endorsing forecasts. When we look at the ranges included in your question, it would seem to us that were one to create a Venn diagram of these prognostications, a convergence seems to us to emerge somewhere in the 4 to 5% range. While three participants probably doesn’t constitute a critical mass large enough to attribute the outcome to “the wisdom of crowds,” it’s certainly better than a crowd of one. We’ve always prided ourselves in understanding our limitations and that’s why we’ve always left forecasting to the really smart people who devote more resources to it than we do. We would not, however, take umbrage at any of these aforementioned forecasts…particularly given the range of convergence we seem to see.
While we are very interested in what people think of growth in the global economy over the next year, we’re more concerned with implementing our own strategic initiatives. The first point of our strategic initiative, as we noted in our response to Question 24 of our 8-K filed on October 24, 2014, is to ensure every operating unit’s baseline growth strategies for the air, ocean and customs products is to grow at that unit’s (i.e. district or region) relevant market growth rate. That’s the baseline…and we will expect all of our offices, at a minimum, to grow at the pace of their relevant market segment before growth from any of the other strategic growth initiatives start to kick in.
5. You’ve previously referenced plans to shift your geographic focus a bit. From what trade lanes do you expect the most growth in 2015 (both air and ocean)? And how does that compare to your expectations for market growth in those lanes? Are you focusing primarily on lanes with a more robust volume outlook or ones that offer more attractive profitability opportunities?
We would refer you to our response to Question 24 on our 8-K filed on October 24, 2014 wherein we discuss the focus and direction of our strategic initiatives. We would add here that we’re not so much shifting our geographic focus as we are shifting our emphasis on how we focus on our geographies. Case in point, we have always had a very strong export share of the Asia to North America trade lanes. The same carriers that we’ve used to cultivate relationships to develop our strength on these lanes obviously have capabilities moving from North America to Asia. As the Asian economies continue to become more affluent, there are increasing opportunities for us to grow our import business in those markets. It’s not difficult to visualize why a developing China, with 1.4 billion people and an emerging middle class with serious buying power, offers a tremendous potential.
6. What, if any, impact do you expect from the 2M once it’s fully operational in March? Has there been an impact since its recent launch? Do you expect to see more such alliances going forward?
We’re not sure, given that we are only one month into its operation, it is far too soon to actually draw any conclusions. The 2M alliance, according to some industry information we’ve seen, will have just over 20% of the current global ocean capacity.
They say that opposites attract. While MSC and Maersk lines could not exactly be called opposites, they certainly have had diverse operating philosophies over the years. Whether those differences create synergies or create obstacles has yet to be seen. It’s difficult for us to imagine however that anyone in our industry would be able to offer serious comprehensive ocean solutions without having a good working relationship with the 2M alliance.
It is only our opinion, but we do believe that there will be more alliances in the future. Some have already emerged. It would be difficult to believe that those alliances could reach the size and stature of the 2M alliance.
7. Do you expect to maintain the recent pace of share repurchases in 2015? Do you have any targets you can share to give us a sense for how much capital you’d like to return to shareholders or what percent of free cash generation you want to return or any other such metrics?
We do not have any targets per se. The Board of Directors recently authorized repurchases down to a level of 188 million shares. That’s roughly $175 million dollars at today’s prices.
Philosophically, since our inception, we have always made investing in our own business a priority. That has proven to provide the highest returns to our shareholders and our employees and enhances our service capacity to our customers. In 2015 we anticipate our capital expenditures to be $85 million. We expect dividends and continued stock repurchases to make up the lion’s share of how we use our excess free cash flow.
8. Can you give an update on the status of your strategic assessment? How far along are you in the process and when will it be complete? Are there any specific targets (cost savings, margin goals, etc) that you can share and what are the milestones we can track to map your progress?
We were recently asked to compare our progress in our strategic assessment to the innings of a baseball game. The best analogy of where we are is that we’ve completed our assessment and are in the early innings of the game where we are focusing on the implementation of our strategy. We’ve spent a lot of time communicating our strategy throughout our organization and will continue to do so. We have just finished the beginning roll-out of the communication and execution phase. Again we’d refer you to our response to Question 24 on the 8-K filed on October 24, 2014.
We are now focused on the implementation of our strategy, and that will run through 2020. We will continue to assess and make changes to our strategy based on market changes and opportunities. We’re very mindful of Winston Churchill’s admonition and will be regularly taking his advice:
“However beautiful the strategy, you should occasionally look at the results.”
Our strategic initiatives are a means to a well-defined end, not an end in and of themselves. While we can understand that people are interested in a high level of detail regarding our strategy, it would not be in the best interest of our shareholders and employees to provide detail beyond the degree which we’ve already shared it.
9. Congratulations on a good quarter. The report was wonderful to read as a shareholder.
Buying Stock, Paying Dividends, shrinking Equity, good margins, solid revenue growth in every Business Segment. Thank you. My concern and question relates to Revenues.
• | In 2007 revenues were: Airfreight 697 million; Ocean 475 million; Customs 275 million |
• | In 2014 revenues were: Air 780 million; Ocean 568 million; Customs 421million |
• | Growth since 2007 in percent: Air 12%; Ocean 19.5%; Customs 53% |
Wonderful job on Customs, but what is the problem in Air? Historically, EXPD crushed it in Air. Pre-2007 Air was the driving force in performance. How do we get that Air revenue to grow, and grow consistently?
Thank you for your observations. Before we respond, let us share with you our own way of looking at growth over that same period of time, and also over an alternative period of time that we think might be equally, if not more, meaningful.
Gross revenues are one way to look at growth. However, as we’ve stated in the MD&A sections of our 10-K’s and 10-Q’s since becoming a public company, we don’t feel it is necessarily the most indicative measure of progress in our particularly industry. In our opinion, there is probably no greater opportunity in our business to ignore Alfred Montapert’s warning: “Do not confuse motion and progress.” With its bon mot codicil: “A rocking horse keeps moving but does not make any progress.” than to base assessments of growth solely on Gross Revenues.
Other measures of growth are growth in tonnage and growth in shipments. A growth focused exclusively on either of these two measures, like a unilateral focus on gross revenues, absent a way of measuring the financial ramifications, lacks the critical ability to differentiate between profitable growth (good market share) and unprofitable growth (undesirable market share).
We have always said that net revenues (total revenue less total direct transportation costs) are a more representative way of measuring growth than are gross revenues. We should add here that the Securities and Exchange Commission in the past several years has determined that net revenue is to be considered a non-GAAP measure. Since that pronouncement, we are trying to be particularly careful to show how the net revenue number is actually determined via a separate and compliant calculation, even though it can be calculated directly from numbers shown on the face of our earnings statements. So, for the net revenue calculations in this response, we would refer you to the fourth quarter comparative results below.
Fourth quarter comparative results: | ||||||||||||||
2007 | 2009 | 2014 | 2007-2014 % ∆ | 2007-2014 GAGR | 2009-2014 % ∆ | 2009-2014 GAGR | ||||||||
Gross revenue | ||||||||||||||
Airfreight | $696,835 | $628,097 | $780,011 | 12% | 1.6% | 24% | 4.4% | |||||||
Ocean freight | 474,613 | 348,305 | 568,249 | 20% | 2.6% | 63% | 10.3% | |||||||
CHB/Other | 275,134 | 270,509 | 420,570 | 53% | 6.2% | 55% | 9.2% | |||||||
$ | 1,446,582 | $ | 1,246,911 | $ | 1,768,830 | 22% | 2.9% | 42% | 7.2% | |||||
Gross costs | ||||||||||||||
Airfreight | $561,464 | $493,711 | $600,713 | 7% | 1.0% | 22% | 4.0% | |||||||
Ocean freight | 385,751 | 268,612 | 446,244 | 16% | 2.1% | 66% | 10.7% | |||||||
CHB/Other | 119,926 | 114,876 | 203,022 | 69% | 7.8% | 77% | 12.1% | |||||||
$ | 1,067,141 | $ | 877,199 | $ | 1,249,979 | 17% | 2.3% | 42% | 7.3% | |||||
Net revenues | ||||||||||||||
Airfreight | $135,371 | $134,386 | $179,298 | 32% | 4.1% | 33% | 5.9% | |||||||
Ocean freight | 88,862 | 79,693 | 122,005 | 37% | 4.6% | 53% | 8.9% | |||||||
CHB/Other | 155,208 | 155,633 | 217,548 | 40% | 4.9% | 40% | 6.9% | |||||||
$ | 379,441 | $ | 369,712 | $ | 518,851 | 37% | 4.6% | 40% | 7.0% | |||||
The reason we prefer to use net revenue in our growth assessment is twofold:
1. | That’s the way we have always managed our business. It is very important for us to segregate, and have clear transparency between the direct transportation services that we purchase to craft our logistics solutions we subsequently bill to our customers, and the overhead costs (salaries, rents, etc.) we incur to deliver the services. Nearly all expense decisions, from staffing, to travel, to facilities, are made after evaluating net revenue contributions in light of committed overhead costs. |
2. | Both gross revenues and direct transportation costs, particularly over the last ten years, contain elements of “pass through” costs. The largest of these recently has been fuel surcharges, which change in reaction to fuel surcharges levied by the transportation providers from whom we purchase services. During the years that oil spiked and then receded and then increased again, the carriers’ adjustment of the fuel surcharge based on the increases or decreases in fuel costs created increases and decreases in our gross revenues that could be disproportionate to the actual increase or decrease in our underlying activity. Accordingly a focus on gross revenues can seriously distort the meaning of growth rates. Case in point, when one looks at the changes in net revenues over the same period of time you chose to analyze, 2007 through 2014, the result looks somewhat (if not drastically) different. We also included the Compound Annual Growth Rate (or CAGR, pronounced like, but distinctly different from, that old college term for the well-practiced convivial quasi-social event…“kegger”) for comparison purposes. |
QTD Net Revenues (in Millions) | 2014 | 2007 | Net Rev. % ∆ | Gross Rev. % ∆ | Net Rev. GAGR | Gross Rev. GAGR | |||||||||
Airfreight | 179.3 | 135.4 | 32.4 | % | 11.9 | % | 4.1 | % | 1.6 | % | |||||
Ocean Freight | 122.0 | 88.9 | 37.3 | % | 19.7 | % | 4.6 | % | 2.6 | % | |||||
Customs Brokerage and Other Services | 217.6 | 155.2 | 40.2 | % | 52.9 | % | 4.9 | % | 6.2 | % | |||||
What looking at this 2007-2014 time period, without context, ignores, and what we would postulate needs to be factored into this analysis, is the events that occurred beginning in fall of 2008 and hit full pitch during 2009, a time now commonly referred to as “the Great Recession.” It was no small feat to recapture all that business that disappeared in 2009. We did that in 2010 and 2011. In our minds, to look at a linear comparison between 2007 and 2014, ignoring the depth of what occurred between the last quarter of 2008 and 2009, doesn’t tell the full growth story in its proper frame of reference.
If one were to compare the growth in net revenues from the fourth quarter of 2009 with the fourth quarter of 2014, again, a somewhat different growth story scenario emerges…one that we’re actually quite proud of given the severity of what occurred in 2009 and subsequent market conditions that followed, which we’ll address below.
QTD Net Revenues (in Millions) | 2014 | 2009 | % ∆ | GAGR | |||||
Airfreight | 179.3 | 134.4 | 33.4 | % | 5.9 | % | |||
Ocean Freight | 122.0 | 79.7 | 53.1 | % | 8.9 | % | |||
Customs Brokerage and Other Services | 217.6 | 155.6 | 39.8 | % | 6.9 | % | |||
In closing the loop on different types of growth, which included growth in airfreight tonnage and airfreight shipment count, the gross changes and CAGR for those measurements were as follows.
% ∆ 2007 thru 2014 | CAGR | % ∆ 2009 thru 2014 | CAGR | ||||||||
Tonnage | 15.9 | % | 2.1 | % | 24.1 | % | 4.4 | % | |||
Within the context of these numbers let us address your question about why airfreight was in the proverbial doldrums in recent years, not just for us, but for most of our industry. We would first refer you to three graphs courtesy of the International Air Transport Authority (IATA) and a fourth graph courtesy of The Economist magazine, which follow.
The first two charts (Air FTK’s and World Trade Volumes and Total Air Freight and Passenger Volumes) chronicle the graphical relationship between “airfreight ton kilometers” with associated world trade volumes with Revenue Passenger Kilometers from 2008 through 2014 for the first chart and 2007 through 2014 for the second. In looking at these two charts, the precipitous drop in both airfreight (the RED line in the first chart and the BLUE line in the second chart), as well as world trade volumes (the RED line in the first chart), is plainly noticeable. That drop, which began the last quarter of 2008, began to rebound also just as precipitously, in the opposite direction, almost immediately, throughout 2009. By the fourth quarter of 2009, the market airfreight volumes had more or less recovered back to pre-2008 levels, and continued to expand, very intensely throughout 2010, before falling in stages through 2011 and 2012. The more gradual decline bottomed out towards the end of 2012 and started to very gradually move back upward in 2013, a rise which accelerated in 2014. In broad terms, it looks to us that the CAGR for airfreight during the 2010 through 2014 time period was approximately 2.5%.

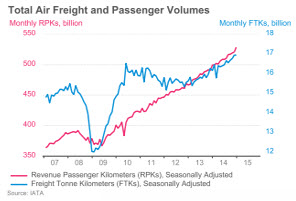
Comparing the growth in Freight Ton Kilos (FTK) CAGR per the IATA Air FTK’s and World Trade Volumes chart, with Expeditors’ growth in gross revenue as a proxy for how well we grew against the global market, misguided as we believe using gross revenue as a straight proxy for growth might be, you see that our GAGR on airfreight gross revenues was 4.4%, or 76% higher than the market GAGR in FTK implied from the chart above.
On the other hand, were one to use our airfreight net revenue GAGR over the same period of time, a value we think is much more meaningful for our own internal purposes, one would see that our airfreight net revenue GAGR from 2009 through 2014, 5.9% was nearly 150% higher than the market growth rate, based on our approximate calculations, of 2.5%. That is something we would point to as significant.
Now to the last part of your question…”How do we get that Air revenue to grow, and grow consistently?” To give an answer that does justice to the intent of your question, we think it's important to provide some historical context as to what has actually occurred in the airfreight markets over that last several years. Mark Twain once wrote that “History does not repeat itself, but it does rhyme.” We believe that thought also applies to what we’ll call the “evolutionary cyclicality” of the airfreight markets. Trying to understand where we think airfreight is going without understanding where we think airfreight has been, and why it was there, would be kind of pointless and a waste of time.
For several years preceding 2013, there was a decline in the global airfreight markets. We attribute the cause for the dip in global airfreight to several factors:
1. | A less-than-lackluster global economy; |
2. | A change in the characteristics of many of the key high-tech/electronics products that are typically sent by airfreight; and |
3. | The air carriers’ processes for adapting their fleets to the changes in the airfreight markets. |
To back up our points, we’ll incorporate the two additional charts, which follow. The first chart, the IATA chart titled Freight Load Factor on Total Market, shows how much freight capacity available was actually utilized globally over the period 2007-2014.
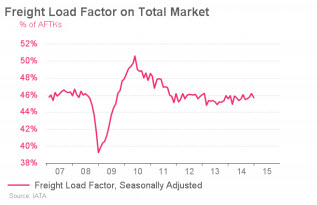
Let’s look more closely at the Freight Load Factor on Total Market graph. We should probably explain that Freight Load Factors are basically the amount of cargo actually carried divided by actual cargo capacity deployed by the airlines, and that actually includes cargo space on a lot of narrow body aircraft that for all practical purposes, is not “usable” cargo capacity for mass-market cargo consideration. In fact, our cargo managers tell us that anytime this chart approaches 50%, the “usable” cargo capacity is in fact pretty much saturated. We can see from the first two charts we looked at, above (Air FTK’s and World Trade Volumes and Total Air Freight and Passenger Volumes) that freight ton kilometers have increased, albeit gradually, since 2013. That was after having declined from a peak in 2010 through the first part of 2013. When we look at the Freight Load Factor on Total Market chart, we see that freight capacity plunged during “the Great Recession,” as carriers prudently parked planes in response to a cratering of demand. As the economy recovered demand also increased. To handle that 2009 demand, capacity also spiked in 2010, but declined to pre “Great Recession” levels by the beginning of 2011. Capacity Load Factors, with the odd zig and zag here and there, have remained more or less constant ever since. Given those more or less constant load factors amid growing freight volumes that are exhibited in the first two IATA graphs, (Air FTK’s and World Trade Volumes and Total Air Freight and Passenger Volumes), one could logically deduce that airlines are adding capacity…a sensible thing to do when faced with increasing demand. How the air carriers are adding that capacity is perhaps more meaningful at this point of the discussion than is trying to assess how much they’ve actually added.
Over the past several years, as passenger demand has continued to increase, (as shown in the Total Air Freight and Passenger Volumes chart), airlines began a process to put more environmentally-friendly, fuel-efficient wide-body aircraft into the air. This has given rise to more Boeing 777-type aircraft, or their Airbus competitor, A-330-A-350 types aircraft being flown…twin-engine fuel efficient, with both passenger capability and belly-space freight capacity. The more wide-spread deployment of these planes has changed how scheduled carriers manage their airfreight business. Prior to 2010, again in our opinion, airlines undervalued the asset that properly managed belly-space on passenger carriers could be…when properly managed. Airlines are looking to use “their metal” more comprehensively, thereby optimizing asset utilization. As passenger demand has expanded, so has belly-space freight capacity. The carriers have been increasingly focused on reducing dedicated freighters as typically the dedicated freighters were older, less fuel efficient aircraft. Dedicated freighters are increasingly being “mothballed” as the scheduled carriers are compensating for that reduction in dedicated freighter cargo capacity through more efficiently and deliberately managing the increasingly available lower-deck belly space to fulfill freight demand. The Freight Load Factor on Total Market graph, with a more or less constant load factor also illustrates that the increase of belly space capacity on passenger aircraft placed into service to accommodate rising passenger demand, has more than compensated for the drop in cargo capacity that resulted from steadily removing dedicated freighter capacity from the market since the last part of 2008.
Ultimately, this is a much more efficient and economical way to manage freight capacity and we’ve adapted well to that new development in the airfreight markets. In fact, our #5 carrier partner in March has no dedicated freighter capacity at all, not reduced, not rationalized…they have none. They’ve handled all the business we have given them (not an insubstantial amount of freight) and done it well, solely by strategically managing the belly space they have in their passenger airplanes. Another example is an Asian-based carrier making multiple flights (as in five) from an Asian location to a European location. They’ve historically also run a dedicated 100 metric ton freighter once a day on that lane. By reserving 20 tons for cargo on each passenger flight, they are moving that same 100
metric tons of freight with almost identical service, in a much less expensive, much more efficient manner. It’s often said that necessity is the mother of invention, and the necessity to become more efficient on Asian-American and Asian-European lanes has resulted in airlines upgrading their fleets and managing their cargo belly space capacity more strategically. This has allowed them to weather a rather large storm during a very difficult time and increase the profitability of both their cargo operations and their entire airline. We’re told by several of our carrier partners that they are still in the process of reconfiguring their fleets, but enough has been accomplished that it has added some much needed stability to the air cargo markets that has been in a state of flux for a long time.
Which brings us to the last chart, below, which provides some very important backdrop to answer the last part of your question. From the mid-1980’s when PC’s and other hi-tech products first started being assembled in Asia, in places like Taiwan, Hong Kong, Singapore, Thailand and Malaysia, through 2010, after China had achieved the dominant manufacturing position it holds, the airfreight markets became increasingly reliant on the market for getting hi-tech goods built and assembled in Asia to North America and also to Europe. The explosion of the internet and the constant enhancements in technology drove the number of PC’s being produced and shipped higher and higher each year. As the need for greater computing mobility skyrocketed, and the concurrent need for increased access to ever-improving and sophisticated internet applications expanded, desktop PC’s became progressively smaller laptops, which gave way to even smaller notebooks, which ultimately gave rise to the smart phones and tablets everyone uses today. The airfreight markets in particular and the freight markets in general became a very visible example of what ripple-on effects subsidiary industries can experience when the dominant industry they support fall victim to Harvard Business professor Clayton Christensen’s disruption theories. While the size of the computers started to shrink, other products, enabled by the intense R&D the tech market was driving, began to show up in alternative devices such as the smartphones and smaller and thinner tablets we referenced above. These devices were themselves drastically different in character from notebooks, laptops and desktops and other items the carriers have come very used to carrying. The iPads and other Android-based and Windows-devices both usurped and combined many of the functions previously reserved for the PC platform or other dedicated electronic devices.

From: The Economist January 3-9th 2015
BRIEFING: The Future of Work - There's an app for that
Emerging from the Great Recession, these increasingly smaller, more powerful, alternative devices with their myriads of “apps” began to offer multiple capabilities on one platform that delivered capabilities which had previously taken multiple devices to deliver. This factor also significantly changed the dynamics of the airfreight markets. For example, the iPhone is a phone; a calculator; a stereo; and boom box; an alarm clock; a wristwatch; a radio; a book; a web-browser, a planner, an e-mail platform formally requiring a desktop or a laptop, and…an ever expanding list as new "apps" are developed and deployed. The kinds of hi-tech freight being moved by air, shifted faster than the airfreight industry (both carriers and forwarders) was actually prepared for. This change continued and as the graph from The Economist shows, by 2011, the number of PC’s shipped actually declined as the shipments of the alternative devices “went vertical.” An interesting side note is that beginning in January of 2014, for the first time, there were more connections to the internet made by alternative devices, than by PC’s, further evidence of both the scale and scope of the change in the kinds of products being built and shipped by the hi-tech manufacturing market. Going back to the "Great Recession" “hangover” period of 2011-2013, which was
characterized by very weak and uncertain global economic conditions and analyzing the impact on the airfreight markets from a 2015 perspective, all of these statistics and charts reveal the degree to which the airfreight markets were impacted.
With the heavier dense freight (like the bigger PC’s, laptops, etc.) not as plentiful, the mix and max capabilities that efficient consolidation relies on were challenged from the traditional models all the industry players had become accustomed to. With freight being in lesser demand, the larger OEM producers and importers extracted increasingly stringent terms and conditions from forwarders, requiring previously unthinkable terms and conditions (like extended payments term, cargo liability concessions where the customers were requiring values far in excess of the standard industry liability terms offered by the asset-based providers, creating unacceptable liability gaps for Expeditors and other extreme performance and indemnity criteria, etc.), all the while pressing for more aggressive pricing commitments. This was all further exacerbated by higher fuel costs and increasing regulation. The air carriers were struggling amid higher, unprecedented operating costs, mainly fuel, to the point that there were limited abilities for forwarders to pass on these extreme terms of the aggressive purchasing practices being foisted on the industry by the shippers, who themselves were under extreme pressure because of lukewarm consumer demand and cutthroat competition to satisfy the demand that was there. We’d remind everyone that prior to the fall 2014, airfreight had not had what we would consider to be a real peak season since 2010.
In that environment, there were ample opportunities to pick up airfreight business by quoting aggressively to the point that there was not enough profit being generated at the net revenue level to sufficiently cover our operating overhead costs, to the point that you could easily diminish operating profits by adding more business. This created a situation where market share had to be very closely scrutinized between profitable business, which was worth doing, and non-profitable business, which wasn’t. To the uninitiated, this seemed somewhat counter-intuitive. To the experienced, it was a time to hold to our principles and “take the beating” until market forces equilibrated. Paying customers to move their freight never seemed to make a lot of sense to us and to our people. Our focus has always been on retaining and expanding operating income. That is how our model works. That’s how we all get paid. More importantly, because those things re-enforce our culture, we had the discipline to continue profitable operations when the market was demanding commitments that would allow the top-line to grow at the expense of the bottom line. Given those options, our people focused on the kinds of good business opportunities where we could maintain our tried and proven long-term business model and that allowed us to take care of our people and generate solid cash flow for our shareholders. To us this is an example of going through the tough times without tough times going through you. We’re stronger for what we went through, we’ve bent but not broken, and we’re tempered but not changed.
In the face of these described developments in the market, the airlines took several years to right-size and adjust their fleets, as we’ve discussed earlier. Some obviously did a better job than others, but as a whole, by 2014, there was more stability in the airfreight markets and some improvement in consumer demand. The airfreight carriers in general are much more strategic about their cargo operations, understanding better than ever that maximizing the utilization of their cargo assets (be it belly or dedicated freighter capacity) maximizes their profitability. They recognize that despite generating a smaller amount of airline revenue, cargo, managed correctly, contributes a disproportionate part of the operating income.
In summary, while we grew more slowly than we would have liked during this period, taking into account our analysis on net revenue, we think we grew better than people may have perceived. More importantly, we grew wisely and consistently with our philosophy of increasing cash flow and operating income. The airfreight industry went through a difficult adjustment weaning itself away from the market requirements of an era where more heavy and dense hi-tech equipment was being produced and shipped. They have, by and large, successfully rationalized their carrier fleets and adjusted their offerings to support to the newer kinds of hi-tech airfreight being moved. It took about three years for the air carrier fleets to properly re-configure their equipment and reallocate their capital to deploy more fuel efficient planes. As the global economy languished in 2012 and part of 2013 and then started to pick up somewhat throughout 2014, the market dynamics responded to increased industry freight volumes, to the point that we actually enjoyed a peak season of sorts. We think the peak season would have occurred anyway, regardless of the West Coast port slowdown situation, the impact of which, as we’ve noted earlier in our response to Question 2, is difficult to quantify. We recognize more of the dynamics in our carrier partners cargo operations at this stage, while not a repeat of their pre-2008 strength, at least “rhyme” in a more usual manner.
10. You’ve stated that long-term EPS growth should be 10-15%. EXPD’s 10-year EPS CAGR is 11%, toward the bottom end of the range. What are the drivers of a comparable level of EPS growth in the coming years, in your view, considering your net revenue base is 100% larger than a decade ago?
We think the drivers at this stage are still the drivers that existed a decade ago, the magnitude of the influence may be a little differently dispersed, but the fundamental components remain the same: bringing technology to process. We think that we have more opportunities to drive efficiencies through our global operations and implementation of system enhancements than we ever had before. Our current size may inhibit our ability to grow at the 40%+ uber rates we occasionally experienced prior to 2008, and briefly in 2010, but we certainly feel it should be possible for us to consistently achieve annual double digit growth.
11. What percent of the Customs Brokerage & Other Services’ net revenue is directly generated from ‘freight under management’ fee-based arrangements?
We’re not exactly sure what you mean by “freight under management fee-based arrangements.” Typically, almost always in fact, the customs brokerage entries are quoted on a transactional basis according to relative complexity of the entry. Our customers typically will look to Expeditors to provide brokerage services in a manner that turns what is a fixed cost to them, in to a variable cost. Given our economies of scale and broad expertise, it is, in most cases, very difficult for a customer to be able to provide a more cost-effective internal solution than an external solution we could provide. While the brokerage function can all be described in generic, rather bland terms, the true fact of the matter is that it is anything but. Just like any professional service, expertise, attitude and technological capabilities as well as proper relationships and trust with governments and other government agencies that can be integral to the customs clearance process are critical. We like to point out that the person you trust to do your taxes, or even to cut your hair, enjoy a very special position in the hierarchy of people from whom you purchase personal services. We go on to say that looking from a business perspective, your customer broker, in a relationship that works properly should and usually does, have a hierarchal position that is even more elevated in criticality.
Within the Customs Brokerage and Other Services, we also include our Transcon product, which is a time-definite, domestic/intra-continental service and our distributions services. The Transcon product’s revenue model is very much like the other air and ocean forwarding products, which also offers some very special, valued-added services, typically billed for at the conveyance level. Distribution, on the other hand is much more diverse, by the nature of the product and the specific customer requirements for what is required to distribute their goods to their end users.
12. What is the gross/net capital expenditure budget for 2015?
We’re not sure what you mean by “net” capital expenditures, but according our 2014 10-K, capital expenditures in 2015 are expected to be approximately $85 million at this point in time.
13. Considering high-quality, publicly traded “Information Solutions” models generally possess a net debt/EBITDA ratio greater than 1.0x, what is the rational for continuing to carry a 1.5x net cash/EBITDA ratio?
We could debate the degree to which applying a blanket “information solutions” model threshold to Expeditors is warranted, and could go even further wanting to understand which companies were included in that “sample.” We suspect that Apple, the most valuable company of all time with a market value of over $700 billion, and considerable cash balances, was not included in that “sample.” While information solutions is a prerequisite of our being able to provide the services we offer…logistics solutions, maintaining a global network by coupling “boots on the ground,” consistent technology and efficient, compliant knowledge-based processes, is much more expansive and much more valuable than straight forward information solutions…and take more capital. However, we digress.
We are reminded somewhat of our response to a similar question many years ago, when we had significantly less cash, where we referred to a comment made by the infamous Tevye of Fiddler on the Roof fame. Tevye, was once overheard murmuring about the poverty of his situation by one of his daughters. The young girl promptly admonished her father by reminding him of their Rabbi’s declaration that “money was a curse.” Tevye responded by intoning one of his almost classic lines “May the Lord smite me with it! And may I never recover!”
With the strong operational cash flow we have had, and given the uncertainties so prevalent in the global economy, we focused on maximizing our after-tax cash position. We should remind everyone at this point that we accrue a full tax rate in anticipation of repatriating all overseas earnings, which will become very relevant to this discussion as
part of the next sentence. Through mid-2013, we had built-up quite a war chest of cash. We need to be clear here that our cash balances did not increase because they were “trapped by taxes overseas.” Thanks to our policy of accruing a full tax rate and repatriating our overseas earnings to pay those already accrued taxes in the United States, our capital is deployed geographically according to corporate needs. As our friend Tevye would attest, there are definitely greater problems than being “cursed” with too much cash. On the other hand, a tradition of carrying lots of cash for which no immediate purpose is evident can prove out that old maxim that any virtue (having lots of cash) carried to an extreme (having too much cash with no evident business purpose) can, at a minimum, become perceived to be a vice. On the other hand, of the two choices of having too much or not enough, having too much is better. Just because you have it, though, doesn’t mean you should irresponsibly “rid” yourself of the “curse” in an ideological quest for recovery.
Given the cash balances we had accumulated by the middle of 2013, we began a concerted effort to return more capital to our shareholders during the last quarter of 2013, primarily through buying back stock. Since that time, we have returned over $900 million of capital to our shareholders, net of the proceeds from stock option exercises and including dividends. We consider that to be a significant amount of capital returned to shareholders in a relatively short period of time.
Wherever Expeditors may actually fall in whatever relevant capital grouping that may or may not exist, we think the direction we have been moving this last year and a half is much more meaningful than is a one-off measure against a debatable standard.
14. How has employee turnover trended over the past two years, relative to EXPD’s historical experience (say, compared to the decade prior)?
We don’t believe we’ve seen any significant changes in our turnover rates from a decade ago. Turnover in our business is higher in the first several years…and quite frankly some of that turnover is expected and acceptable. Our business is highly dependent on the kind of people who will accept and adapt to our unique culture and learn to thrive and excel. We know that this business isn’t for everyone and that not everyone adapts well to our culture. It also isn’t the kind of business that people can take a class on in school and learn all the ins and outs. It has to be experienced.
We also believe that since it is an experiential kind of job, it’s OK when we bring good, ambitious success-oriented people and give them an opportunity. If they decide after a year or so that this job doesn’t meet their career expectations, or that the culture we rely on to drive world-class customer service is not something they can accept and thrive in, then it’s fine that they move on and find a place more to their liking.
15. What are credible 5-year targets or objectives for your European strategy? What would you estimate your current market share in Europe (or, specifically, the Asia-Europe lane) to be, and where do you expect it to be in 2020?
We think our plans for Europe are quite simple and highly credible. As we stated in our response to question 24 of our 8-K filed on the 24th of October, 2014, our objective in Europe is to extend all the same synergies that we have enjoyed and benefit from that have developed between the Asia and North America regions to encompass the strategic Asia-Europe and America-Europe lanes. We don’t tend to look at Europe as a single measurable market. Rather, we view our European position as a number of separate and distinctive but inter-related lanes. We have the same comparable share as the Asia-America lane on several critical lanes to key European cities, but on several very important lanes, we find ourselves far behind where we feel we should be with a company of our size and scope. In any event, we expect that these synergies will expand our market share on certain lanes, and in fact an important part of our strategic initiatives are focused on making that happen.
16. What is the impact to you and to forwarders’ broadly from the trend among air carriers to commingle air freight base rates with fuel surcharges?
This is certainly topical at this point in time. Over the relatively long time that the fuel surcharge regimen has been with us (for more than a dozen years now), more and more customers have focused on reducing their “all in” costs and in many cases the line between what is base and what is surcharge has become hopelessly blurred at worst and mildly subjective at best.
Many of us who spend the majority of their careers in this industry before the most recent fuel surcharge regime was instituted can remember when freight rates were freight rates and the airlines moved them up and down as needed and things seem to actually work just fine. Should fuel continue to hover at current ranges for a long period of time, it seems to us that there needs to be a “resetting” of the entire system to recognize the new substance of the pricing environment…over the form of what could be easily argued is an old, or at least tired, pricing form.
The underlying incontrovertible truth is that carriers set rates, regardless of how they may describe them. Forwarders then negotiate, based on their relative position in the market what customers are willing to accept in a form that makes sense to them. The most important thing to customers though, at the end of the day is what the total transportation costs is. The amount that is split between base rate and surcharge is a secondary concern.
What we would hasten to add here is that while several carriers have announced they will be moving to an “all-in” pricing model, as of right now, there are no carriers’ current pricing which works on an “all-in” model. A lot of carriers have been very up front with the fact that they had hedged at least some portion of their fuel well into 2015, and accordingly, are not offering rate or fuel surcharge reductions commensurate with the decline in oil prices, because, simply put, their fuel costs reflect the expense of their hedging strategy, which is reality, not an ethereal quotation. The operative point being here is the price of oil as quoted on the open markets, is not instantaneously reflected in the fuel costs carriers actually pay and pass on to their customers…like Expeditors.
17. EXPD’s share position over the past 5 years appears to be unchanged, despite the relative decline of some sizeable forwarders since the mid-2000s. Will you offer perspective on why your share position is seemingly unchanged? Are you confident that over the next 5 years your share position in the forwarding market (broadly defined) will be larger than it is today? And, if so, why?
We’re not sure we agree with your opening thesis that Expeditors’ share position appears to be unchanged since the mid-2000. What we do think, as we’ve already described in our response to Question 9 in this 8-K, is that since 2009 there have been more situations where it was possible to show top-line growth, particularly in airfreight, by capturing unprofitable or at least marginally profitable market share. Grabbing market share that doesn’t contribute to profitability in a service industry seems kind of pointless. To the extent that we didn’t listen to the luring call of the freight sirens and head toward the rocks and shoals of business where the cost of service threatened to eat up most of the net revenue that the business would generate, we undoubtedly passed on what would technically qualify as market share, hollow as that kind of unprofitable market share is. Instead, we stayed true to our model, focusing on expanding profitable market share, albeit at a slower pace than we experienced in the past. It’s better to grow more surely in tough times than it is to grow faster with no meaningful incremental growth in operating income. Moving freight solely for the practice has never been something we’ve ever thought made a lot of sense.
18. Historical data suggest Asian outbound AF volume growth accelerates as jet fuel prices decline. Is there credible evidence from speaking with shippers that such a relationship still holds true? In other words, given the roughly 40% yoy decline in jet fuel prices, do you or your shippers expect an incremental improvement in airfreight demand in 2015?
While there has been a well-documented shift from air to ocean freight over the past ten years, there are other factors besides fuel prices that drove, and continues to drive, this shift…for instance, the falling cost of hi-tech products…printers and PCs. Regardless of what fuel costs are now or how low they may go in the future, there are some items which ten years ago cost of lot of money that, because of advances in technology and production capabilities, today cost a lot less money. Where the value/transportation cost ratio could justify airfreight ten years ago, even with the 40% reduction in fuel prices you assume (which isn’t consistent with how carriers are pricing airfreight, from our experience anyway), they no longer do today.
Accordingly, while the demand for airfreight may be stimulated by eventual lower fuel costs, we think airfreight demand will actually be driven more by consumer demand for high-value, time definite products that seem to be in higher demand when the economy is strong and there is more disposable income to pay for them. Simply put, the demand to get high value goods, which are typically time-definite, to the destination securely and quickly is the prime driver of airfreight demand. If the demand for the product, either as a stand-alone product or as necessary component of another product which shares that value doesn’t justify the expenditure for airfreight it will typically go by ocean.
19. I found that some public transportation companies provide a list of sell-side analysts that cover their firm (see CH Robinson at http://phx.corporate-ir.net/phoenix.zhtml?c=97366&p=irol-analysts). Do you provide a similar list of all analysts (or firms) that cover EXPD?
We are aware there are companies who do that. We have never provided names of analyst coverage. There are some analysts, primarily on the sell-side who publish their work and estimates and a part of what is published by Thomson/Reuters to form the “analysts’ consensus.” In the old days, no one covered us that didn’t actually talk with us. These days, that is not always the case. There are other analysts who don’t publicly distribute their research, but sell that research to investors. Accordingly, we’re never 100% sure that we’re aware of everyone providing coverage. We always felt that people wishing to learn what analysts think of us, do so because they wanted a degree of independence to either confirm or refute what we said about us. Maintaining an analyst list runs this risk, in our opinion, of looking like we selectively endorse or don’t endorse an analyst or two whom we might not even be aware are following us. Accordingly, we would offer up the idea that there are better places to learn of which analysts follow us, than us.
20. I was reading your recent proxy statements and have a few questions about your company’s policy on insiders’ ability to hedge their ownership of your company’ s stock. I hope you can kindly help me with the following questions. 1. Did your company have a formal anti-hedging policy that limit employees’ and/or directors’ ability to enter into transactions which “hedge” the value of your company’s stock? 2. When did your company adopt the anti-hedging policy? 3. May I have a copy of your company’s anti-hedging policy?
As disclosed in our Def. 14A Proxy Statement, Expeditors policy prohibits hedging. This policy has been in place for many years.
21. Could you provide some additional commentary around why airfreight net revenue margins were so strong in 4Q given expectations for a squeeze due to fuel surcharges?
Sequentially our fourth quarter net revenue yields (23.0%) were down from the 24.7%, experienced in the 2014 third quarter, reflecting pretty much what we would regard as a usual trend. The magnitude of that trend, varies from year to year. Accordingly, we’re not sure that in retrospect, despite the West Coast ports situation, we think the 2014 net revenue airfreight yields were all that unusual.
22. What are the long-term implications of the West Coast port congestion and the new labor contract? Do you expect them to affect shipper behavior and/or supply chains going forward?
We think the new labor contract is a good thing and will provide some stability for the length of time the contract is in place…after it is officially signed. We think our response to Question 2 pretty much addresses this.
23. Given that your U.S. cash holdings have declined significantly relative to a peak in 3Q:13 and that you have been authorized to repurchase shares down to 188M common shares (versus ~192M as of 12/31/14), should we expect slower share repurchases in upcoming years? Do you have any plans for the $565M held by non-U.S. subsidiaries?
We don’t think the Board having authorized a buy-back threshold of 188 million should be viewed as a signal of any kind as to what our future share buy-backs might be. As we have done in the past, we would point people back to the words of the father of psychoanalysis Sigmund Freud, who once was purported to have said…“Sometimes a cigar is only a cigar.” Ergo, sometimes a threshold is only a threshold.
Our reasons for how we deploy our currencies globally are a reflection of our own economic requirements and are not dictated by tax policy, as we’ve already touched upon. Our practice of accruing taxes on world-wide income provides us with the ability to freely deploy currencies globally where they are needed and shift them around as needed, wherever it may be needed.
24. How were ocean and airfreight volumes in January and February? Do you expect volumes y/y to change significantly as congestion at the West Coast ports eases?
Our January and February volumes came in pretty well where we thought they would.
SIGNATURES
Pursuant to the requirements of the Securities Exchange Act of 1934, the Registrant has duly caused this report to be signed on its behalf by the undersigned thereunto duly authorized.
EXPEDITORS INTERNATIONAL OF WASHINGTON, INC.
May 18, 2015 | /s/ JEFFREY S. MUSSER | |
Jeffrey S. Musser, President, Chief Executive Officer and Director | ||
May 18, 2015 | /s/ R. JORDAN GATES | |
R. Jordan Gates, President and Chief Operating Officer | ||