Attached files
| file | filename |
|---|---|
| 8-K - 8-K - UNITY BANCORP INC /NJ/ | unty-20150515x8k.htm |
3/31/15 NASDAQ: UNTY 
This presentation may contain forward-looking statements with respect to Unity Bancorp’s financial condition, results of operations and business. Do not unduly rely on forward-looking statements. Forward-looking statements can be identified by the use of words such as “may,” “should,” “will,” “could,” “estimates,” “predicts,” “potential,” “continue,” “anticipates,” “believes,” “plans,” “expects,” “future,” “intends,” and similar expressions which are intended to identify forward-looking statements. .Forward-looking statements are not guarantees of future performance and are subject to risks and uncertainties, some of which are beyond the Corporation’s control and ability to predict, that could cause actual results to differ materially from those expressed in the forward-looking statements. The Corporation undertakes no obligation, other than as required by law, to update or revise any forward-looking statements, whether as a result of new information, future events or otherwise. .A discussion of certain risks and uncertainties affecting the Corporation, and some of the factors that could cause the Corporation’s actual results to differ materially from those described in the forward-looking statements, can be found in the sections entitled “Risk Factors” and “Management’s Discussion and Analysis of Financial Condition and Results of Operations” in the Corporation’s Annual Report on Form 10-K for the year ended December 31, 2014, and the Quarterly Report on Form 10-Q for the quarter ended March 31, 2015, which have been filed with Securities and Exchange Commission and are available in the Investor Relations section of the Corporation’s website (www.unitybank.com) and on the Securities and Exchange Commission’s website (www.sec.gov). 1 Forward-Looking Statements Forward-Looking Statements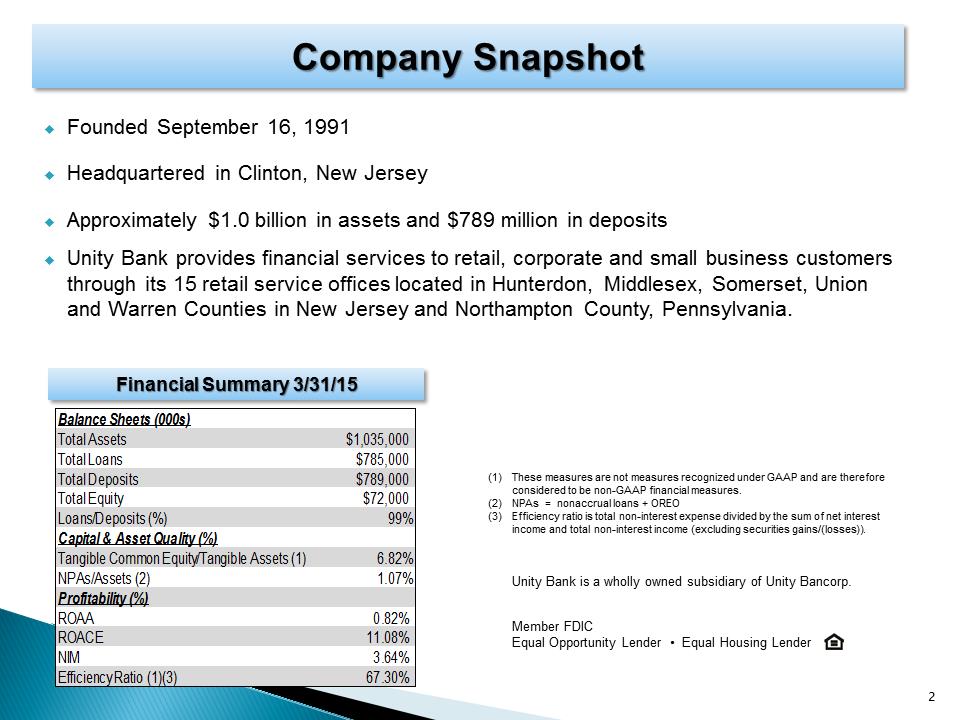
Founded September 16, 1991 .Headquartered in Clinton, New Jersey .Approximately $1.0 billion in assets and $789 million in deposits .Unity Bank provides financial services to retail, corporate and small business customers through its 15 retail service offices located in Hunterdon, Middlesex, Somerset, Union and Warren Counties in New Jersey and Northampton County, Pennsylvania. Company Snapshot Company Snapshot Financial Summary 3/31/15 Financial Summary 3/31/15 2 (1)These measures are not measures recognized under GAAP and are therefore considered to be non-GAAP financial measures. (2)NPAs = nonaccrual loans + OREO (3)Efficiency ratio is total non-interest expense divided by the sum of net interest income and total non-interest income (excluding securities gains/(losses)). Unity Bank is a wholly owned subsidiary of Unity Bancorp. Member FDIC Equal Opportunity Lender • Equal Housing Lender Balance Sheets (000s)Total Assets$1,035,000Total Loans$785,000Total Deposits$789,000Total Equity $72,000Loans/Deposits (%)99%Capital & Asset Quality (%)Tangible Common Equity/Tangible Assets (1)6.82%NPAs/Assets (2)1.07%Profitability (%)ROAA0.82%ROACE11.08%NIM3.64%Efficiency Ratio (1)(3)67.30%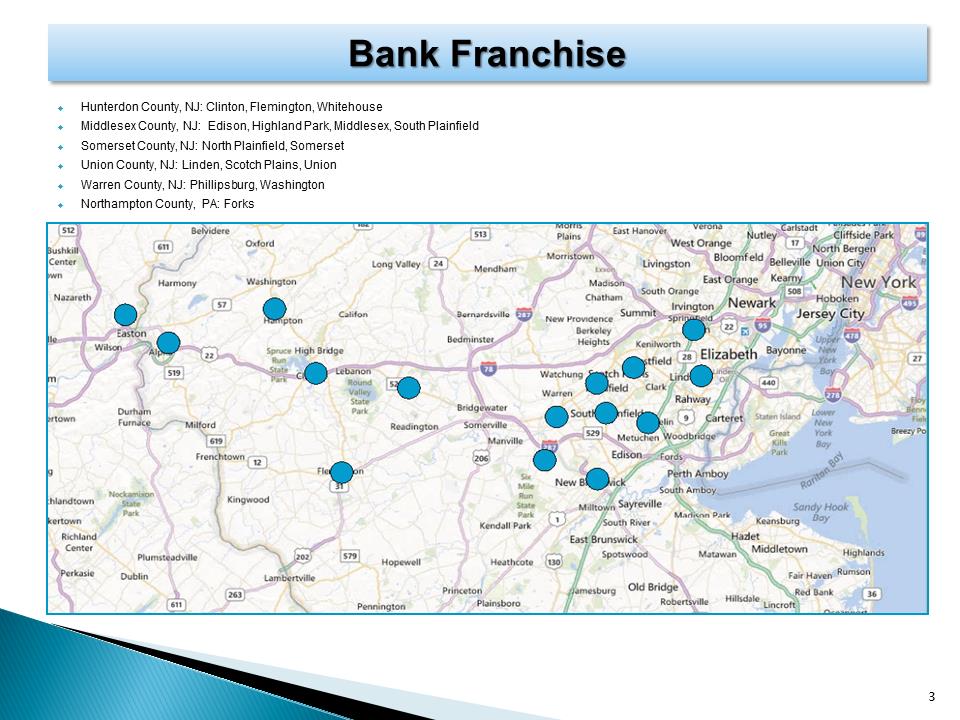
Bank Franchise Bank Franchise .Hunterdon County, NJ: Clinton, Flemington, Whitehouse .Middlesex County, NJ: Edison, Highland Park, Middlesex, South Plainfield .Somerset County, NJ: North Plainfield, Somerset .Union County, NJ: Linden, Scotch Plains, Union .Warren County, NJ: Phillipsburg, Washington .Northampton County, PA: Forks
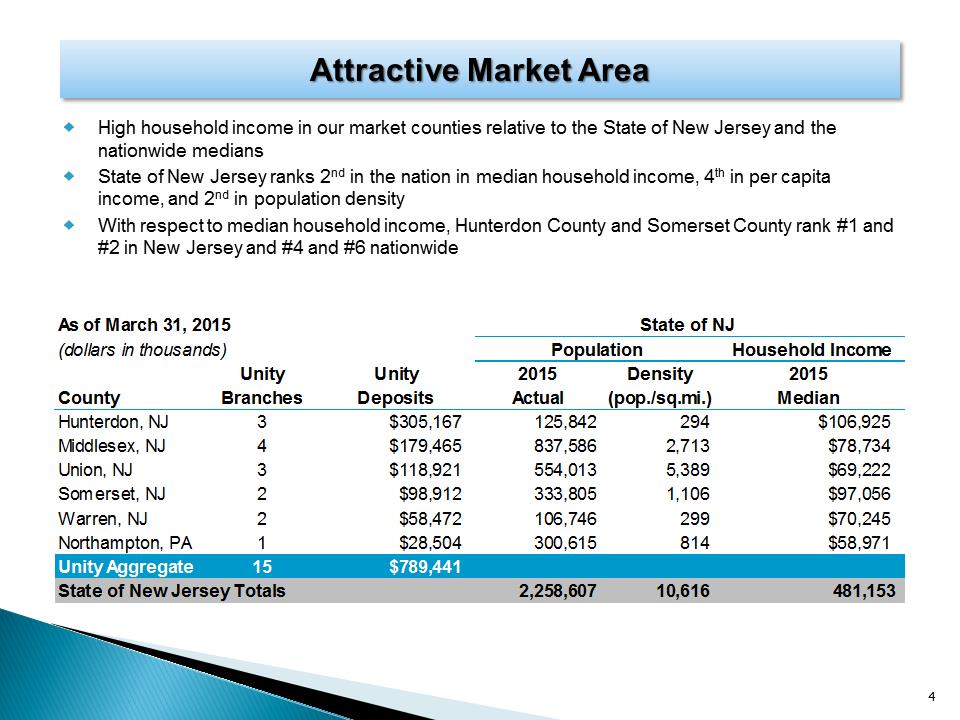
Attractive Market Area Attractive Market Area .High household income in our market counties relative to the State of New Jersey and the nationwide medians .State of New Jersey ranks 2nd in the nation in median household income, 4th in per capita income, and 2nd in population density .With respect to median household income, Hunterdon County and Somerset County rank #1 and #2 in New Jersey and #4 and #6 nationwide 4 As of March 31, 2015State of NJ (dollars in thousands)PopulationHousehold IncomeUnityUnity2015Density2015CountyBranchesDepositsActual(pop./sq.mi.)MedianHunterdon, NJ3$305,167125,842 294 $106,925Middlesex, NJ4$179,465837,586 2,713 $78,734Union, NJ3$118,921554,013 5,389 $69,222Somerset, NJ2$98,912333,805 1,106 $97,056Warren, NJ2$58,472106,746 299 $70,245Northampton, PA1$28,504300,615 814 $58,971Unity Aggregate15$789,441State of New Jersey Totals2,258,60710,616481,153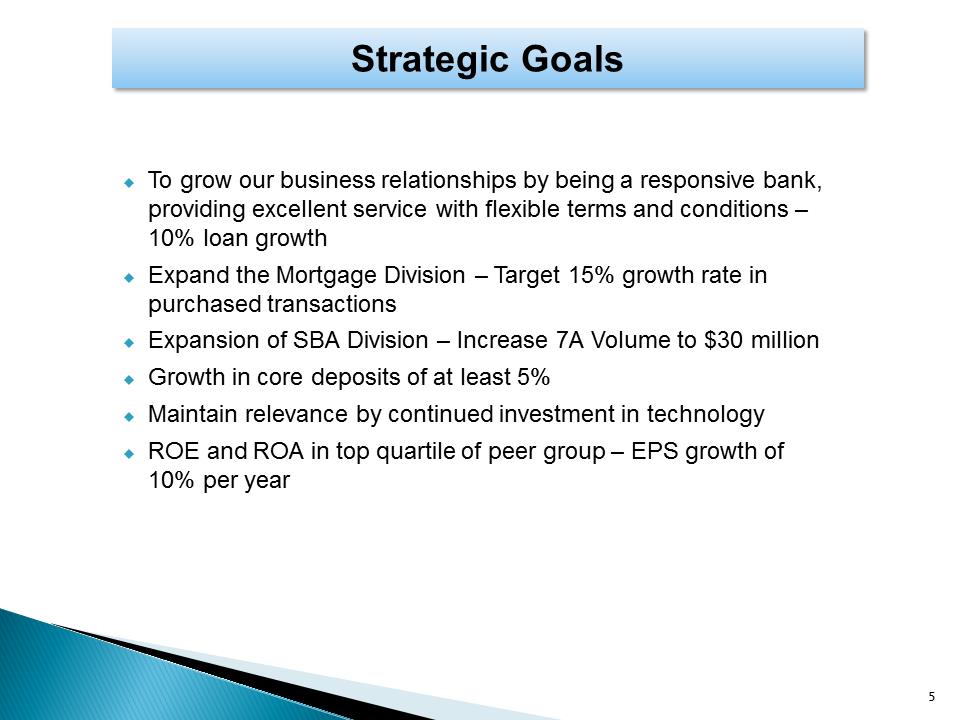
To grow our business relationships by being a responsive bank, providing excellent service with flexible terms and conditions – 10% loan growth .Expand the Mortgage Division – Target 15% growth rate in purchased transactions .Expansion of SBA Division – Increase 7A Volume to $30 million .Growth in core deposits of at least 5% .Maintain relevance by continued investment in technology .ROE and ROA in top quartile of peer group – EPS growth of 10% per year Strategic Goals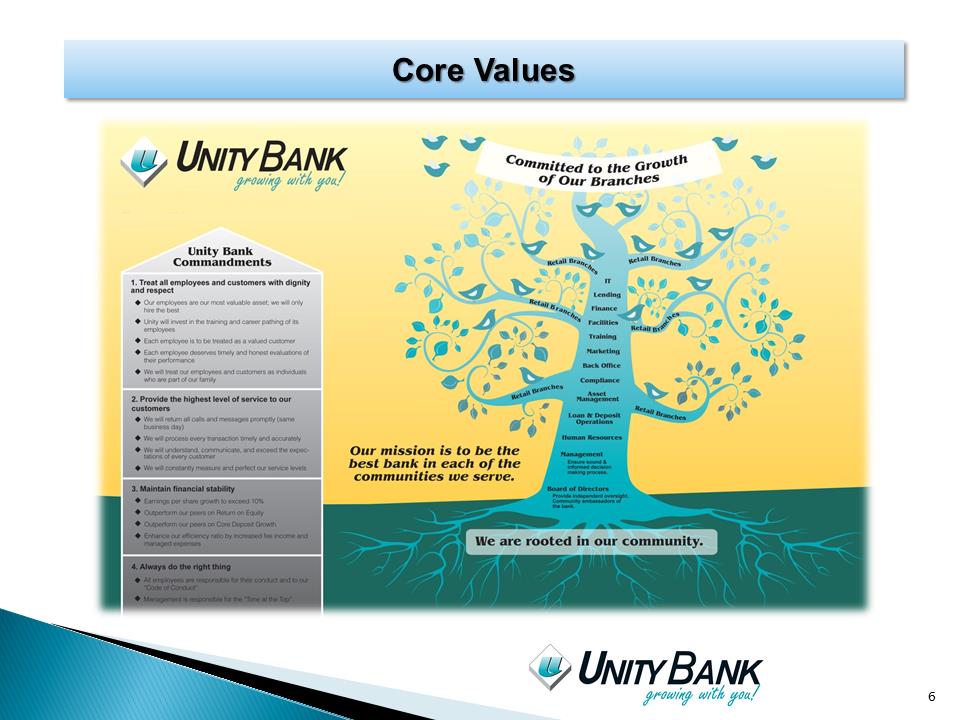
Core Values
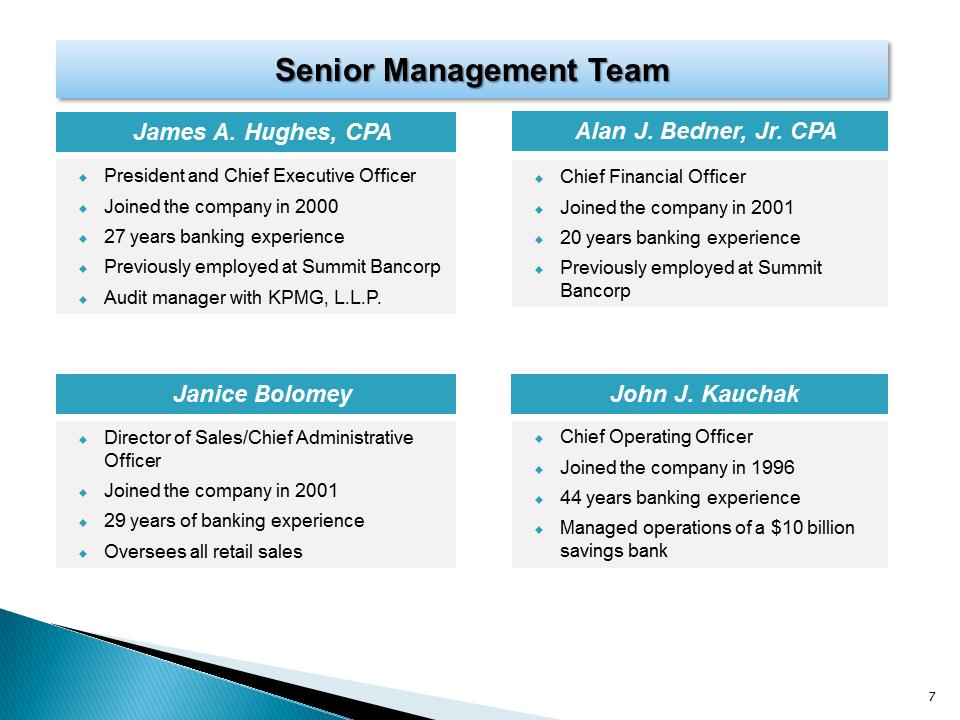
Senior Management Team Senior Management Team James A. Hughes, CPA .President and Chief Executive Officer .Joined the company in 2000 .27 years banking experience .Previously employed at Summit Bancorp .Audit manager with KPMG, L.L.P. John J. Kauchak .Chief Operating Officer .Joined the company in 1996 .44 years banking experience .Managed operations of a $10 billion savings bank 7 Janice Bolomey .Director of Sales/Chief Administrative Officer .Joined the company in 2001 .29 years of banking experience .Oversees all retail sales Alan J. Bedner, Jr. CPA .Chief Financial Officer .Joined the company in 2001 .20 years banking experience .Previously employed at Summit Bancorp 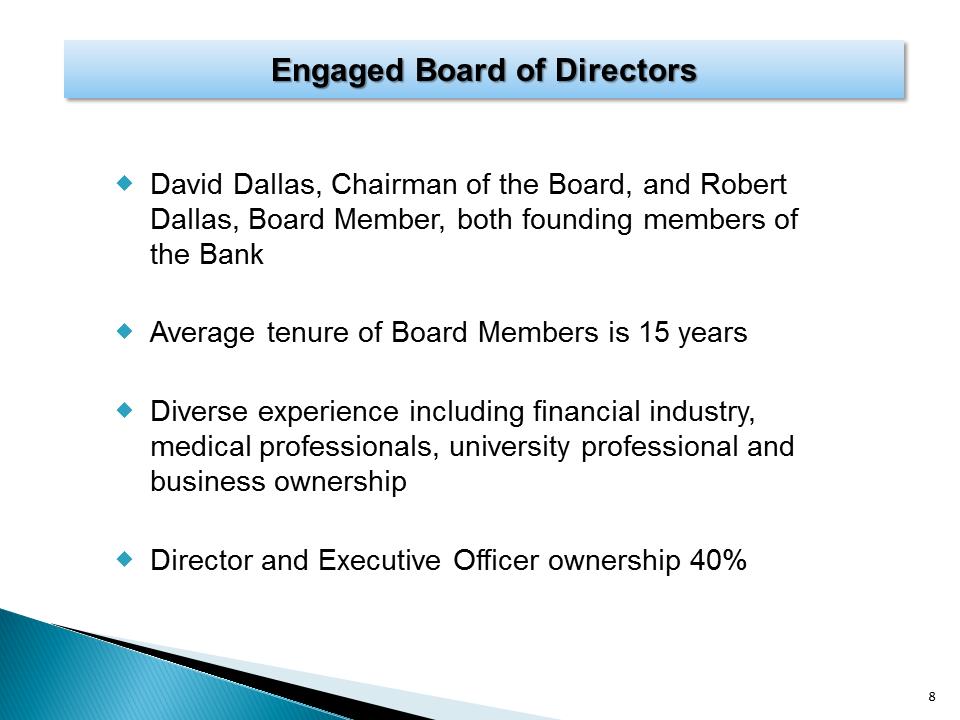 Engaged Board of Directors Engaged Board of Directors .David Dallas, Chairman of the Board, and Robert Dallas, Board Member, both founding members of the Bank .Average tenure of Board Members is 15 years .Diverse experience including financial industry, medical professionals, university professional and business ownership .Director and Executive Officer ownership 40%
  Recent Financial Performance
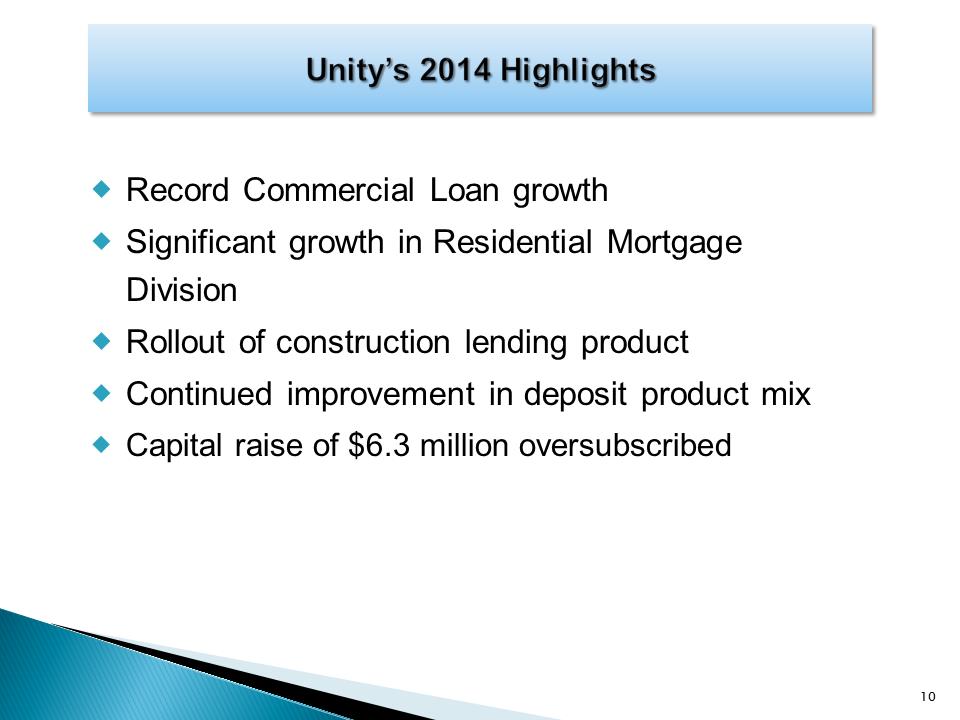
Unity’s 2014 Highlights10 .Record Commercial Loan growth .Significant growth in Residential Mortgage Division .Rollout of construction lending product .Continued improvement in deposit product mix .Capital raise of $6.3 million oversubscribed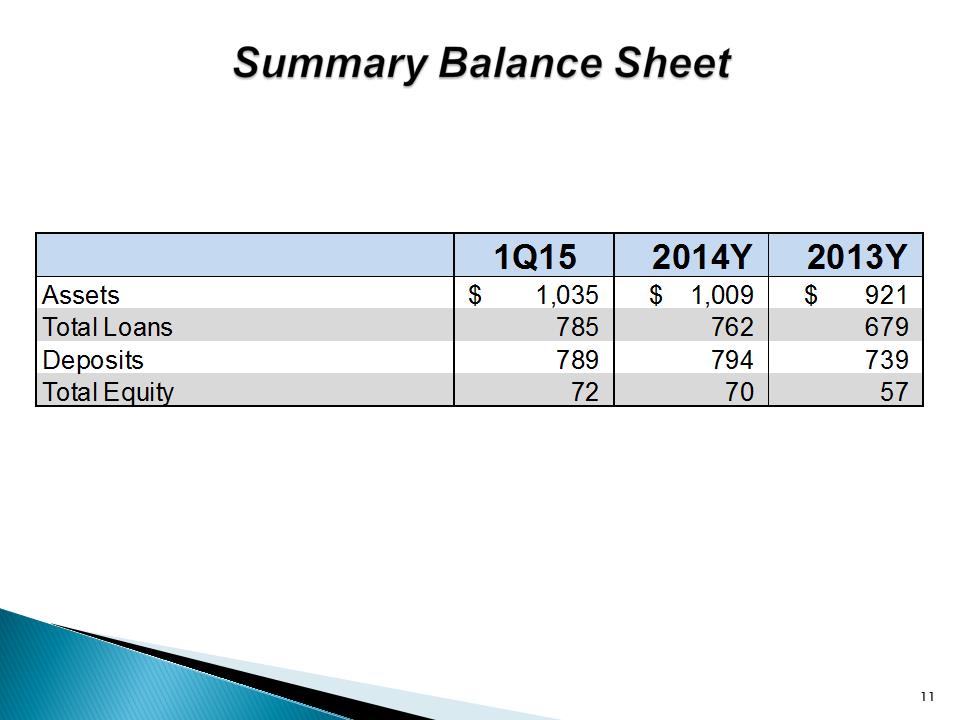 Summary Balance Sheet11 1Q152014Y2013YAssets1,035$ 1,009$ 921$ Total Loans785 762 679 Deposits789 794 739 Total Equity72 70 57
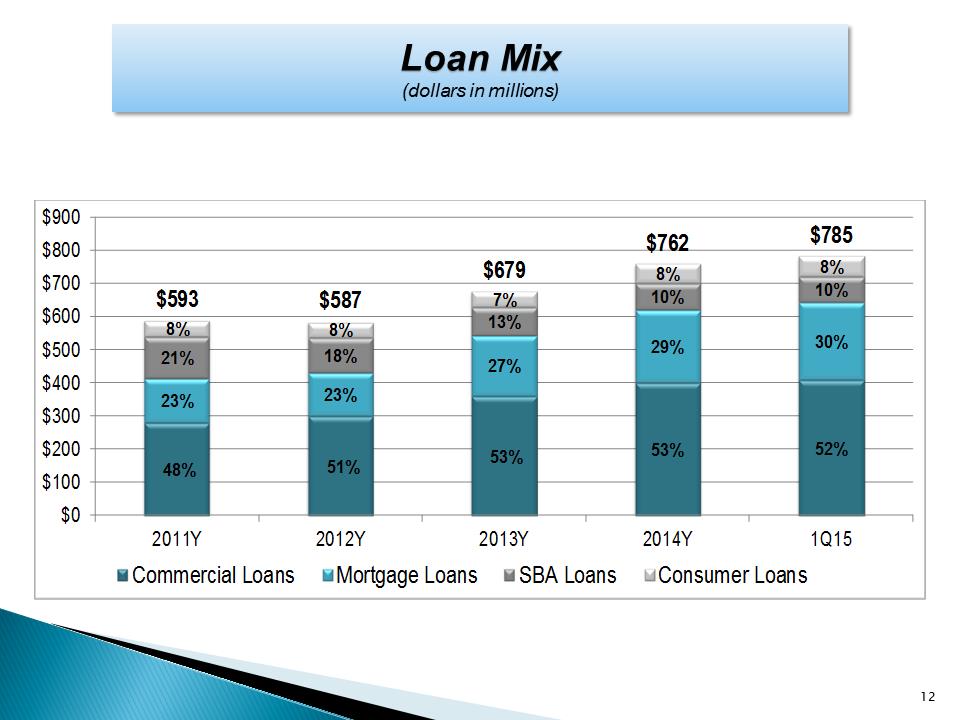 Loan MixLoan Mix (dollars in millions) 48% 51%53%53%52%23%23%27%29%30%21%18%13%10%10%8%8%7%8%8%$593$587$679$762$785$0$100$200$300$400$500$600$700$800$9002011Y2012Y2013Y2014Y1Q15Commercial LoansMortgage LoansSBA LoansConsumer Loans
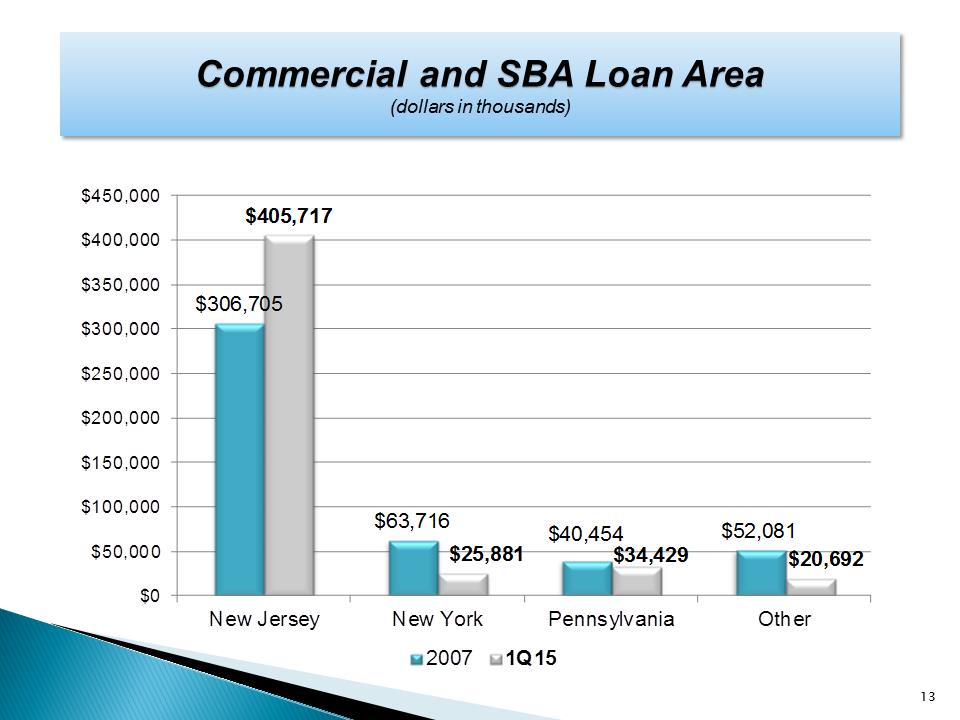 Commercial and SBA Loan AreaCommercial and SBA Loan Area (dollars in thousands) 13 $306,705$63,716$40,454$52,081$405,717$25,881$34,429$20,692$0$50,000$100,000$150,000$200,000$250,000$300,000$350,000$400,000$450,000New JerseyNew YorkPennsylvaniaOther20071Q15
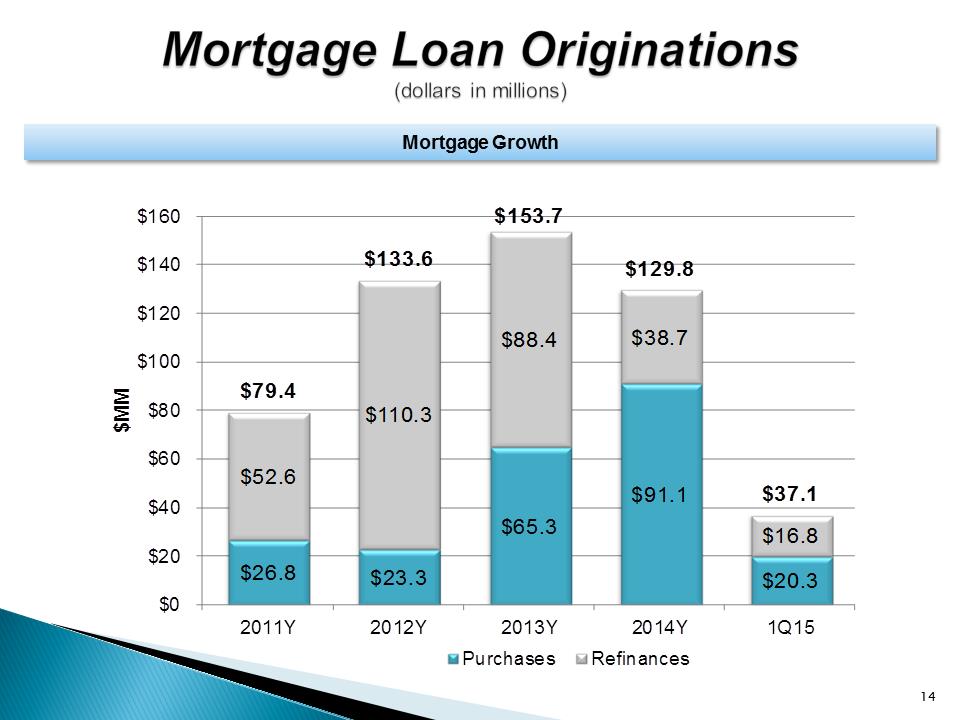 Mortgage Loan Originations (dollars in millions)Mortgage Growth 14 $26.8 $23.3 $65.3 $91.1 $20.3 $52.6 $110.3 $88.4 $38.7 $16.8 $79.4 $133.6 $153.7 $129.8 $37.1 $0$20$40$60$80$100$120$140$1602011Y2012Y2013Y2014Y1Q15$MMPurchasesRefinances
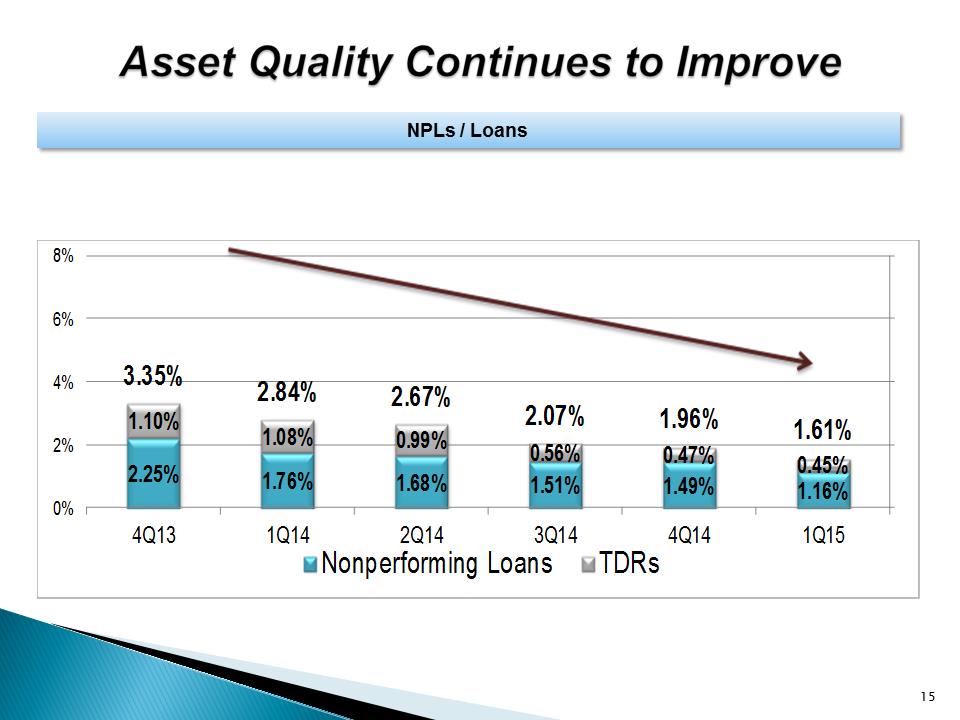 Asset Quality Continues to ImproveNPLs / Loans 15 2.25%1.76%1.68%1.51%1.49%1.16%1.10%1.08%0.99%0.56%0.47%0.45%3.35%2.84%2.67%2.07%1.96%1.61%0%2%4%6%8%4Q131Q142Q143Q144Q141Q15Nonperforming LoansTDRs
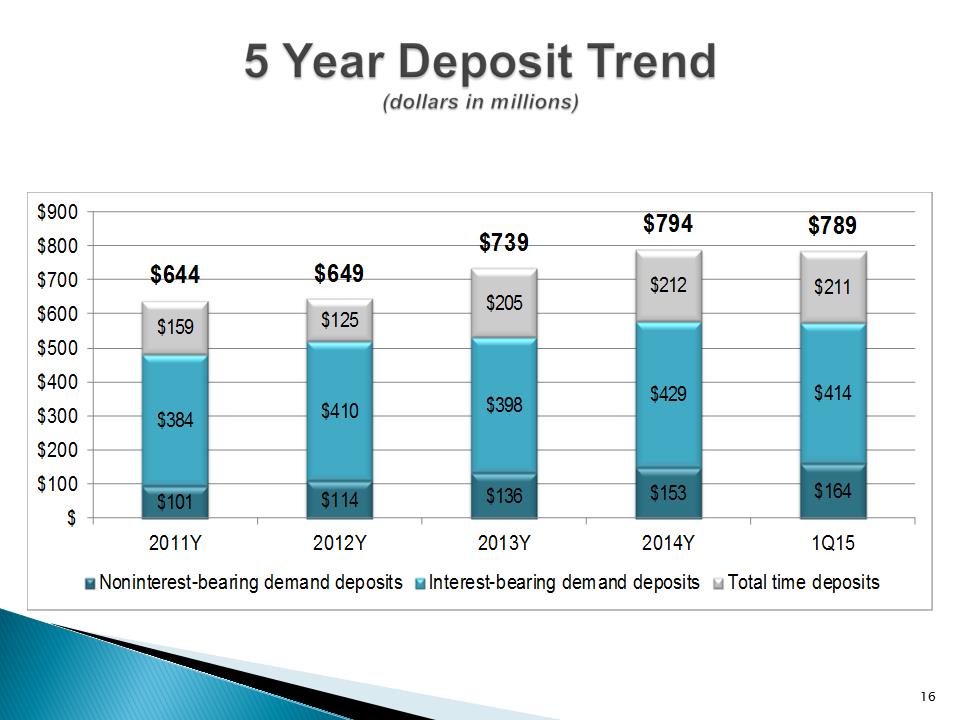 5 Year Deposit Trend (dollars in millions) 16 $101$114$136$153$164$384$410$398$429$414$159$125$205$212$211$644$649$739$794$789$$100$200$300$400$500$600$700$800$9002011Y2012Y2013Y2014Y1Q15Noninterest-bearing demand depositsInterest-bearing demand depositsTotal time deposits
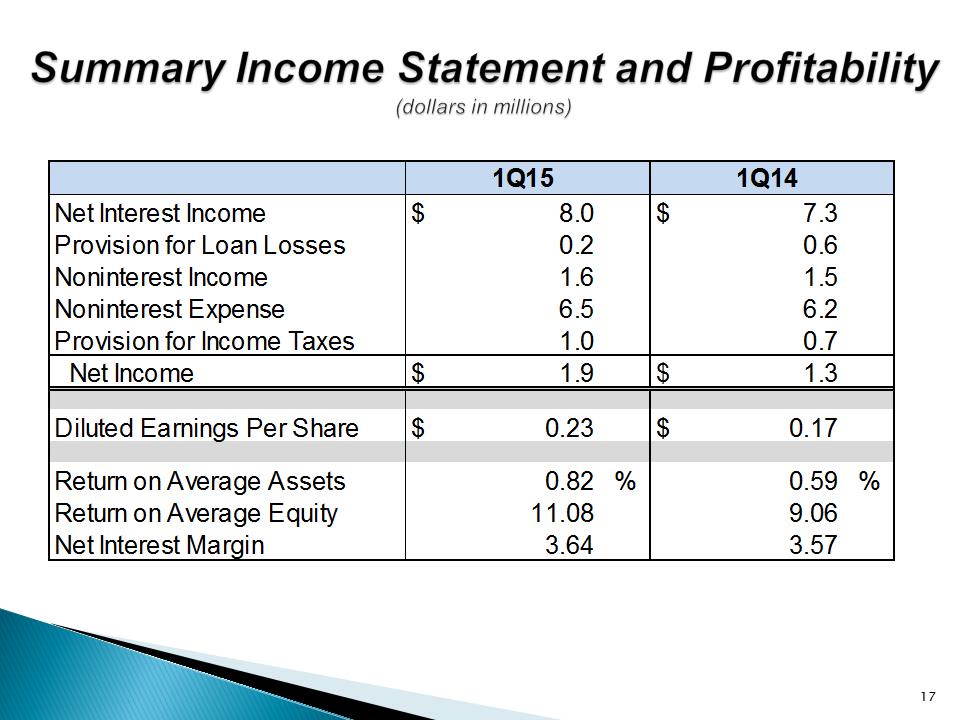 Summary Income Statement and Profitability (dollars in millions) 17 1Q151Q14Net Interest Income$8.0 $7.3 Provision for Loan Losses0.2 0.6 Noninterest Income 1.6 1.5 Noninterest Expense 6.5 6.2 Provision for Income Taxes1.0 0.7 Net Income$1.9 $1.3 Diluted Earnings Per Share$0.23 $0.17 Return on Average Assets0.82 %0.59 %Return on Average Equity11.08 9.06 Net Interest Margin3.64 3.57
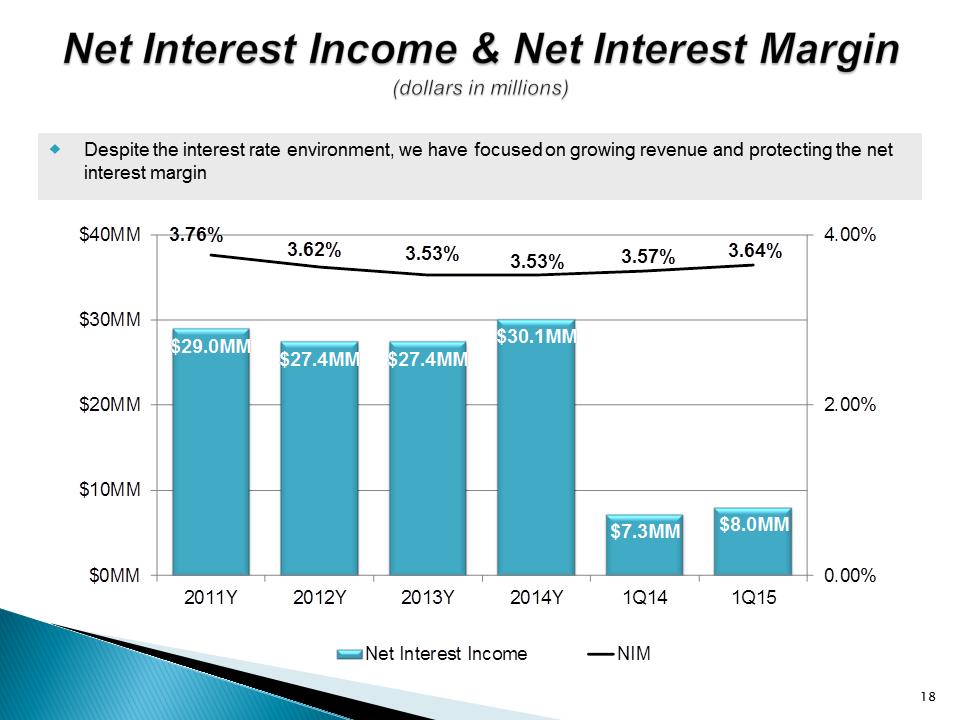 Net Interest Income & Net Interest Margin (dollars in millions).Despite the interest rate environment, we have focused on growing revenue and protecting the net interest margin 18 $29.0MM$27.4MM$27.4MM$30.1MM$7.3MM$8.0MM3.76%3.62%3.53%3.53%3.57%3.64%0.00%2.00%4.00%$0MM$10MM$20MM$30MM$40MM2011Y2012Y2013Y2014Y1Q141Q15Net Interest IncomeNIM
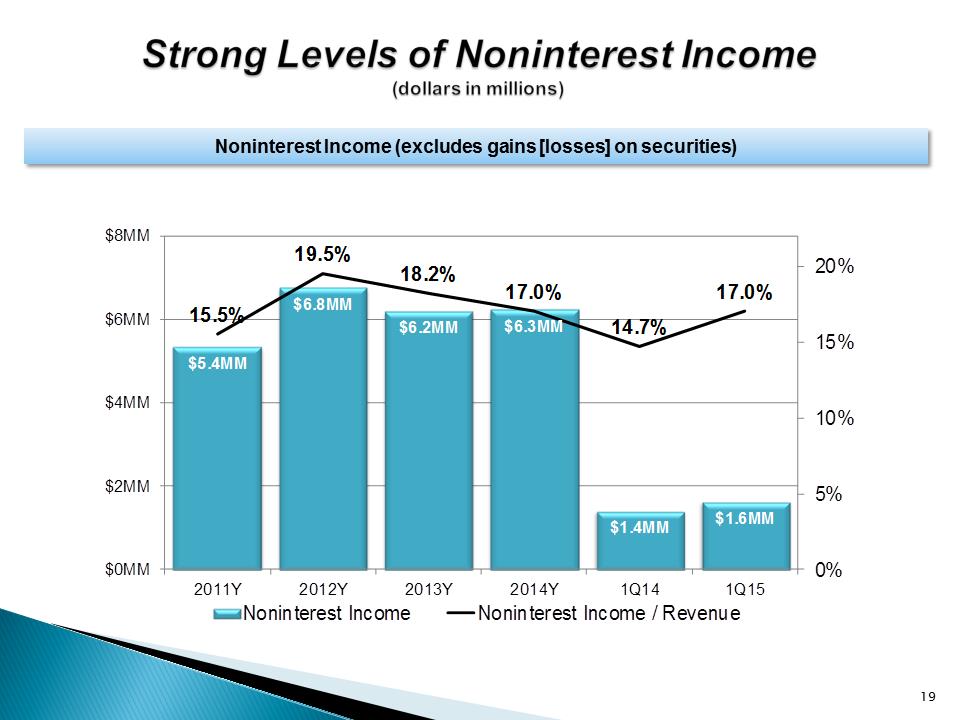 Strong Levels of Noninterest Income (dollars in millions) Noninterest Income (excludes gains [losses] on securities) 19 $5.4MM$6.8MM$6.2MM$6.3MM$1.4MM$1.6MM15.5%19.5%18.2%17.0%14.7%17.0%0%5%10%15%20%$0MM$2MM$4MM$6MM$8MM2011Y2012Y2013Y2014Y1Q141Q15Noninterest IncomeNoninterest Income / Revenue
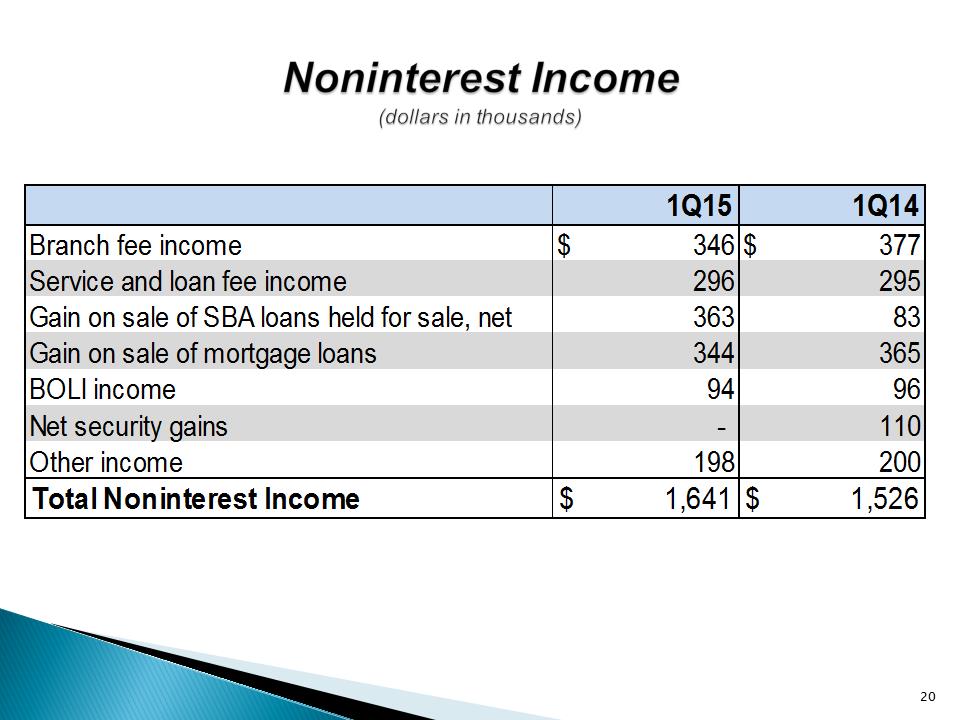 Noninterest Income (dollars in thousands)1Q151Q14Branch fee income$346$377Service and loan fee income296295Gain on sale of SBA loans held for sale, net36383Gain on sale of mortgage loans344365BOLI income9496Net security gains- 110Other income198200Total Noninterest Income$1,641$1,526
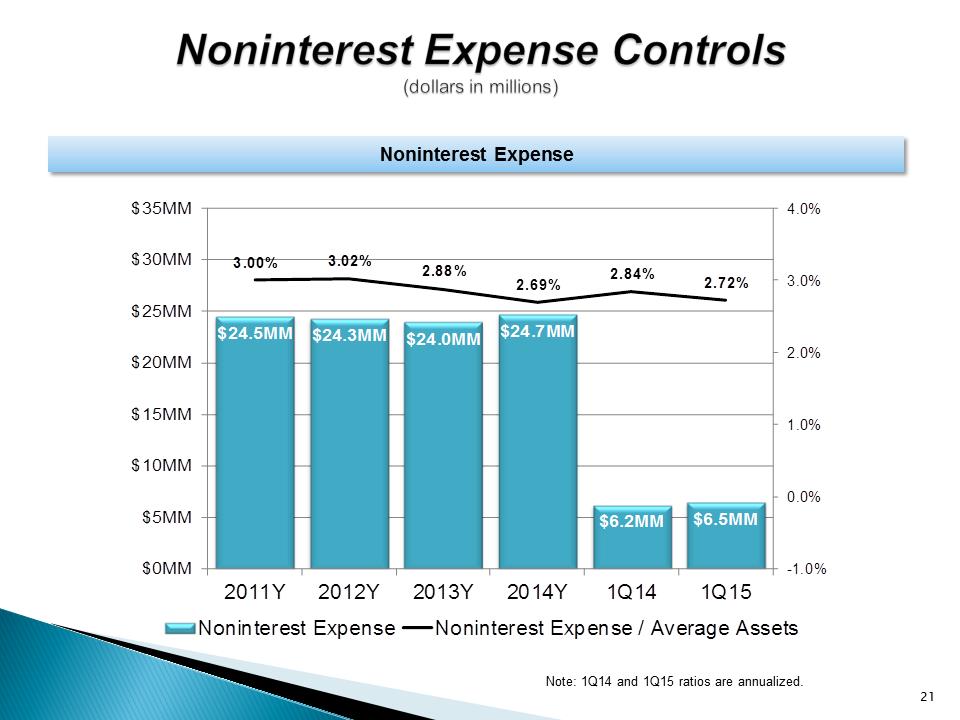 Noninterest Expense Controls (dollars in millions)Noninterest Expense 21 $24.5MM$24.3MM$24.0MM$24.7MM$6.2MM$6.5MM3.00%3.02%2.88%2.69%2.84%2.72%-1.0%0.0%1.0%2.0%3.0%4.0%$0MM$5MM$10MM$15MM$20MM$25MM$30MM$35MM2011Y2012Y2013Y2014Y1Q141Q15Noninterest ExpenseNoninterest Expense / Average AssetsNote: 1Q14 and 1Q15 ratios are annualized.
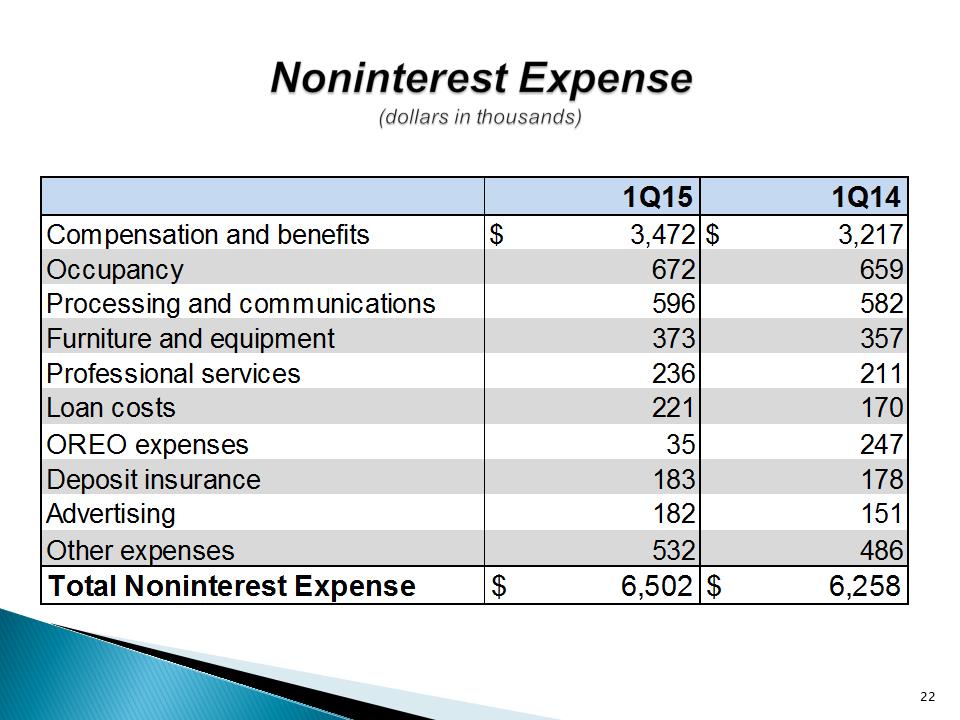 Noninterest Expense (dollars in thousands)1Q151Q14Compensation and benefits$3,472$3,217Occupancy672659Processing and communications596582Furniture and equipment373357Professional services236211Loan costs221170OREO expenses35247Deposit insurance183178Advertising182151Other expenses532486Total Noninterest Expense$6,502$6,258
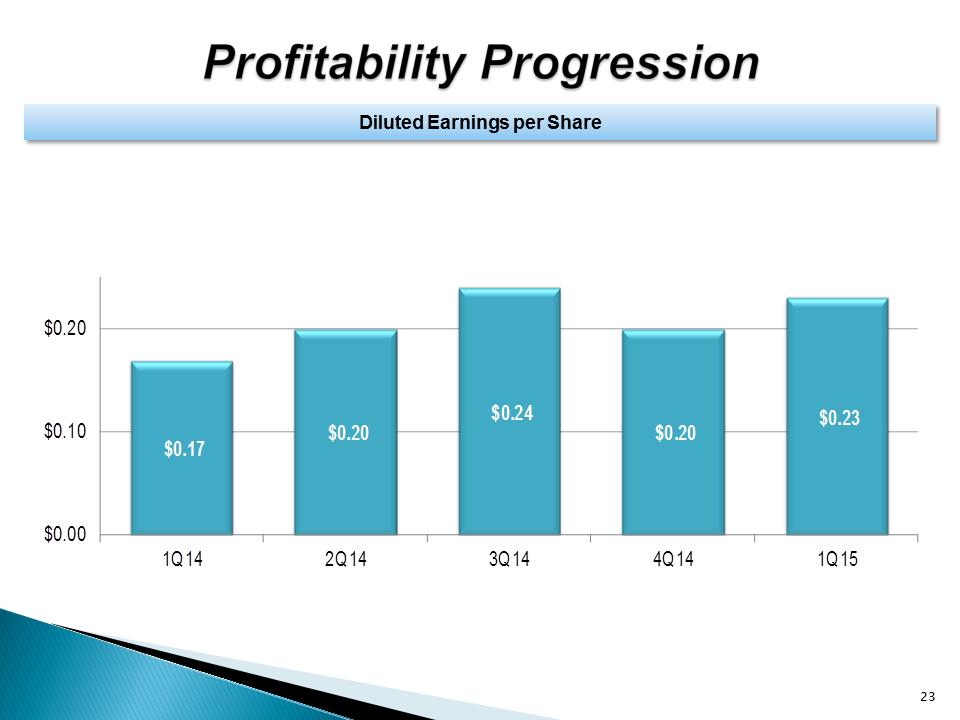 Profitability ProgressionDiluted Earnings per Share 23 $0.17 $0.20 $0.24 $0.20 $0.23 $0.00$0.10$0.201Q142Q143Q144Q141Q15
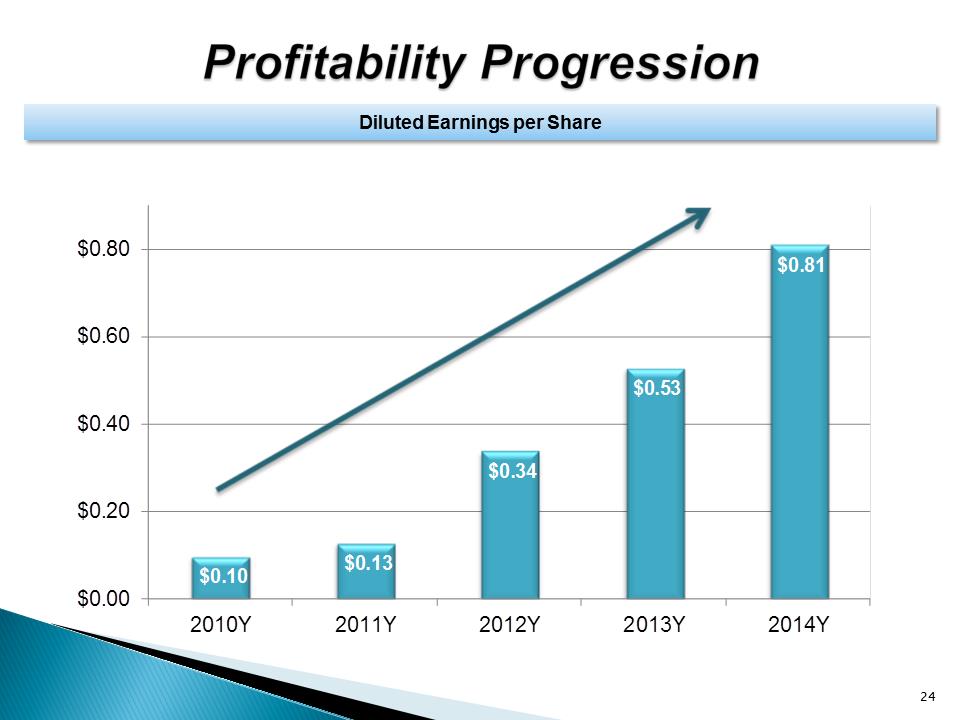 Profitability ProgressionDiluted Earnings per Share 24 $0.10 $0.13 $0.34 $0.53 $0.81 $0.00$0.20$0.40$0.60$0.802010Y2011Y2012Y2013Y2014Y
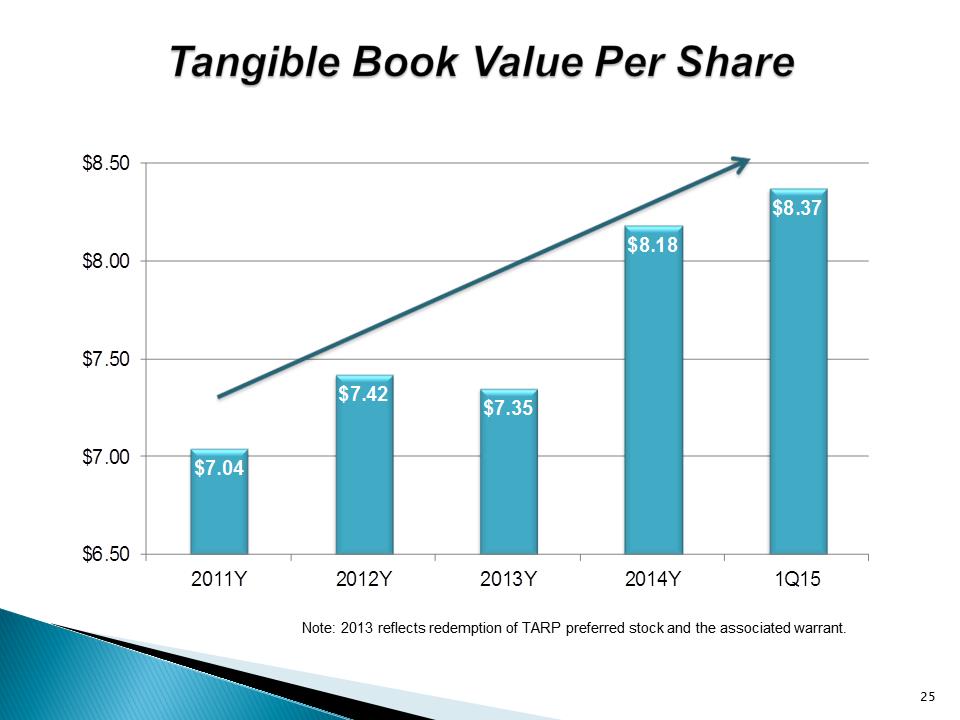 Tangible Book Value Per Share25 Note: 2013 reflects redemption of TARP preferred stock and the associated warrant. $7.04$7.42$7.35$8.18$8.37$6.50$7.00$7.50$8.00$8.502011Y2012Y2013Y2014Y1Q15
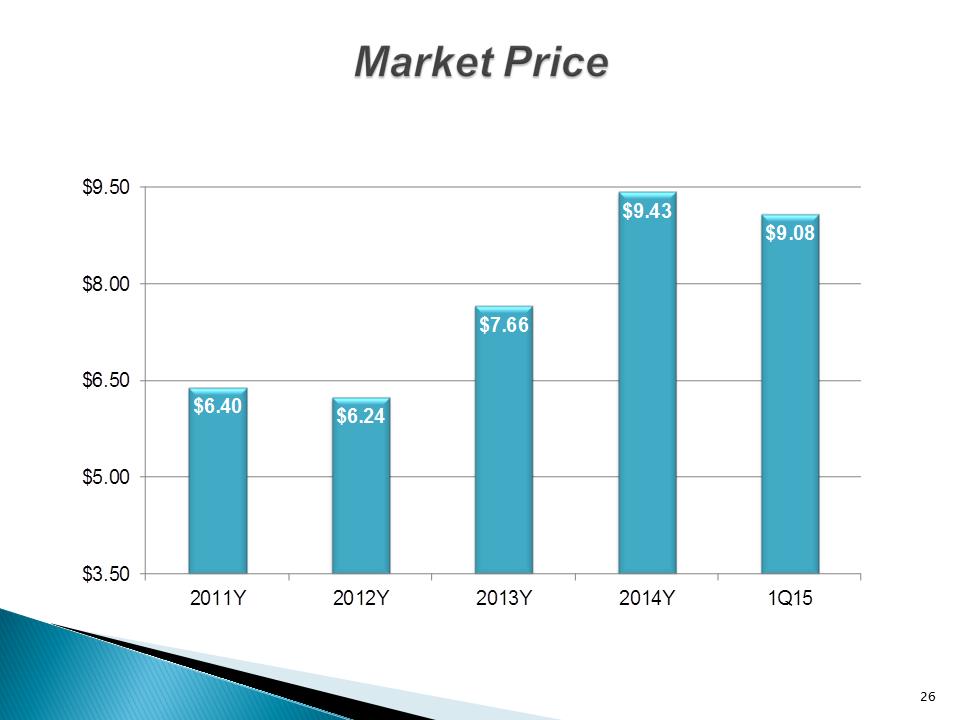 Market Price$6.40$6.24$7.66$9.43$9.08$3.50$5.00$6.50$8.00$9.502011Y2012Y2013Y2014Y1Q15
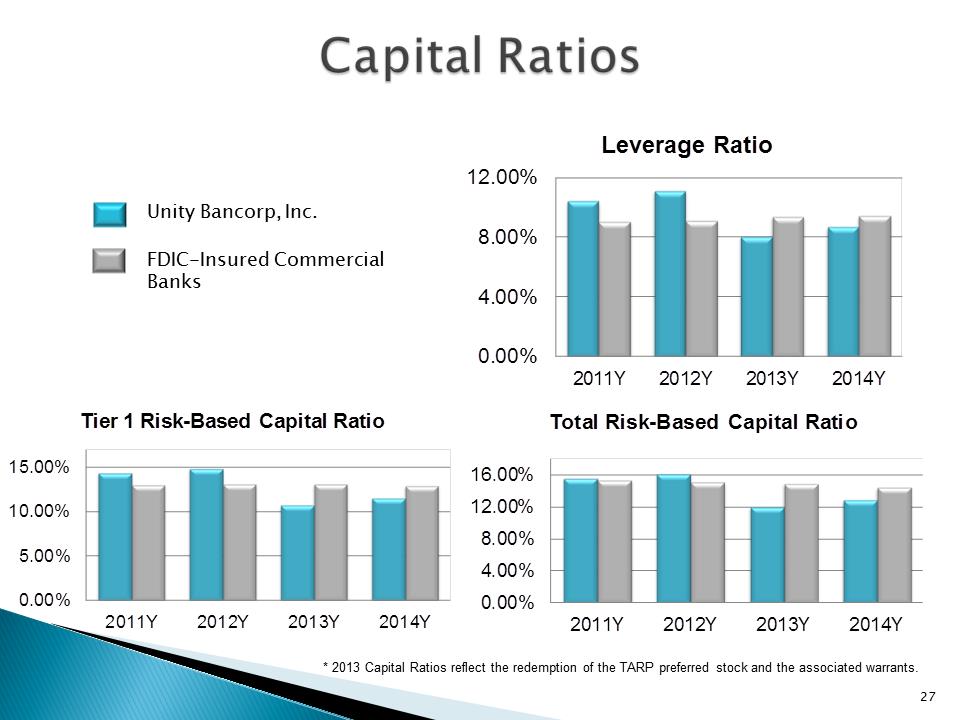 Capital RatiosUnity Bancorp, Inc. FDIC-Insured Commercial Banks * 2013 Capital Ratios reflect the redemption of the TARP preferred stock and the associated warrants. 0.00%4.00%8.00%12.00%2011Y2012Y2013Y2014YLeverage Ratio0.00%4.00%8.00%12.00%16.00%2011Y2012Y2013Y2014YTotal Risk-Based Capital Ratio0.00%5.00%10.00%15.00%2011Y2012Y2013Y2014YTier 1 Risk-Based Capital Ratio
 Knowledgeable and experienced management team Attractive branch franchise . Improving bank fundamentals Positioned for economic rebound Insider ownership . Compelling Investment HighlightsConsolidation of NJ Community Banks
 The previous slides contained data from the following sources: . FDIC-Insured Commercial Banks: . Obtained from FDIC.gov Quarterly Banking Profile . SNL