Attached files
| file | filename |
|---|---|
| 8-K - FORM 8-K - Samson Resources Corp | d926482d8k.htm |
 1
st
Quarter 2015 Conference Call
May 20, 2015
Supplemental Materials
Exhibit 99.1 |
 2
Cautionary Statement Regarding Forward-Looking Statements
Forward-Looking & Other Cautionary Statements
The information in this presentation by Samson Resources Corporation (the “Company,”
“we” or “our”) includes “forward-looking statements” within
the meaning of Section 27A of the Securities Act of 1933, as amended, and Section 21E of the
Securities Exchange Act of 1934, as amended. All statements included in this
presentation, other than statements of historical fact, may constitute forward-looking statements, including, but not limited
to, statements or information regarding our future growth, results of operations, operational
and financial performance, business prospects and opportunities and future events.
Words such as, but not limited to, “anticipate,” “continue,” “estimate,” “expect,” “may,” “might,” “will,” “project,”
“should,” “believe,” “intend,” “continue,”
“could,” “plan,” “predict,” “potential,” “goal,” “foresee” and negatives of these words and similar expressions
are intended to identify forward-looking statements. In particular, statements about our
expectations, beliefs, plans, objectives, assumptions or future events or performance
contained in this presentation are forward-looking statements.
All forward-looking statements involve risks and uncertainties. The occurrence of the
events described and the achievement of the expected results depend on many events and
assumptions, some or all of which are not predictable or within our control. Factors that may cause actual results to differ
from expected results include, but are not limited to: (i) our substantial indebtedness; (ii)
our ability to refinance, restructure or amend our indebtedness or otherwise improve
our capital structure and liquidity; (iii) fluctuations in oil and natural gas prices; (iv) the uncertainty inherent in
estimating our reserves, future net revenues and PV-10; (v) the timing and amount of
future production of oil and natural gas; (vi) cash flow and changes in the
availability and cost of capital; (vii) environmental, drilling and other operating risks, including liability claims as a result of our oil and
natural gas operations; (viii) proved and unproved drilling locations and future drilling
plans; (ix) the effects of existing and future laws and governmental regulations,
including environmental, hydraulic fracturing and climate change regulation; (x) restrictions contained in our debt
agreements; (xi) our ability to generate sufficient cash to service our indebtedness; (xii)
our ability to make acquisitions and divestitures on favorable terms or at all; and
(xiii) any of the risk factors and other cautionary statements, including under the heading “Risk Factors,” described in the Company’s
Annual Report on form 10-K for the year ended December 31, 2014, and in the other
documents and reports we file from time to time with the Securities and Exchange
Commission.
Readers are cautioned not to place undue reliance on forward-looking statements. Should
one or more of the risks or uncertainties referenced above occur, or should underlying
assumptions prove incorrect, our actual results and plans could differ materially from those expressed in any forward-
looking statements. Further, new factors that could cause actual results to differ materially
from those described in forward-looking statements emerge from time to time, and it
is not possible to predict all such factors, or the extent to which any such factor or combination of factors may cause actual
results to differ from those contained in any forward-looking statement.
Each forward-looking statement speaks only as of the date of this presentation, and,
except as otherwise required by applicable law, we disclaim any duty to update any
forward-looking statements, all of which are expressly qualified by the statements in this section, to reflect events or circumstances
after the date of this presentation.
Non-GAAP Disclosures
This presentation refers to certain non-GAAP financial measures. Definitions of these
measures and reconciliation between U.S. GAAP and non-GAAP financial measures are
included at the end of this presentation. |
 3
Q1’15 Financial & Operating Metrics
(1)
Including realized derivatives.
(2)
Income Statement G&A excluding stock-based G&A compensation expenses of $0.29 and
$0.21 per Mcfe for quarter ended March 31, 2015 and March 31, 2014, respectively. Note: Q1’15 Cash G&A
(3)
Cash operating margin is a non-GAAP financial measure. A description of cash
operating margin is included at the end of this presentation and the calculation of the measure is provided above.
(4)
Adjusted EBITDA is a non-GAAP financial measure. A reconciliation to its nearest
GAAP financial measure is included at the end of this presentation. (2)
(3)
(4)
(1)
Q1'15
Q1'14
Difference
Production (MMcfe/d)
518
529
(11)
Realized Price ($/Mcfe)
$3.93
$5.67
($1.74)
Operating Expenses ($/Mcfe)
LOE
$1.16
$0.95
$0.21
Production Tax
$0.26
$0.43
($0.17)
Cash G&A
$0.71
$0.65
$0.06
Total
$2.13
$2.03
$0.10
Cash Operating Margin ($/Mcfe)
$1.80
$3.64
($1.84)
Adjusted EBITDA ($MM)
$92
$179
($87)
excludes approximately $0.16 per Mcfe related to officer retention awards and also excludes
approximately $0.10 per Mcfe related to professional fees associated with debt restructuring. |
 4
Q1’15 Free Cash Flow & Net Debt
($MM)
(1)
Q1’15 inclusive of Arkoma divestiture proceeds of $48 million.
(2)
(3)
Long-term debt (including debt classified as current) of approximately $4.2 billion less
cash and cash equivalents of approximately $194 million. Note: Totals may not sum
due to independent rounding. (2)
(3)
(1)
Q1'15
Q1'14
Difference
Cash Flow From Operations
$20
$103
($83)
Divestiture Proceeds
$61
$6
$55
Total
$81
$109
($28)
Cash Capital Expenditures:
Drilling and Completion
$106
$131
($25)
LGG, Facility & Other
$11
$7
$4
Capitalized Cash Interest & Internal Costs
$86
$131
($45)
Total
$203
$269
($66)
Free Cash Flow Before Financing Activities
($122)
($160)
$38
Net Debt
$4,003
Reflects net cash provided by operating activities plus net cash used in investing
activities. |
 Current Hedge
Position Year
Bbls/d
(1)
Swap Price
2015
3,500
$90.91
Year
Bbls/d
(1)
Swap Price
2015
750
$37.07
Year
MMBtu/d
(1)
Wtd Avg
Floor
2015
(2)
186,000
$4.04
2016
(3)
161,000
$4.04
2017
40,000
$3.92
NGL Swaps
Oil Swaps
Natural Gas Swaps & Collars
(1)
Volumes are rounded.
(2)
2015 includes 20,000 MMBtu/d of CY 2015 collars.
(3)
2016 includes 30,000 MMBtu/d of natural gas collars to the extent our counterparty elects to
exercise their collar options. Note: 2015 includes balance of the year only.
As of April 30, 2015
Mark to Market Value of Approximately $125 MM (~$75 MM associated with 2015)
5 |
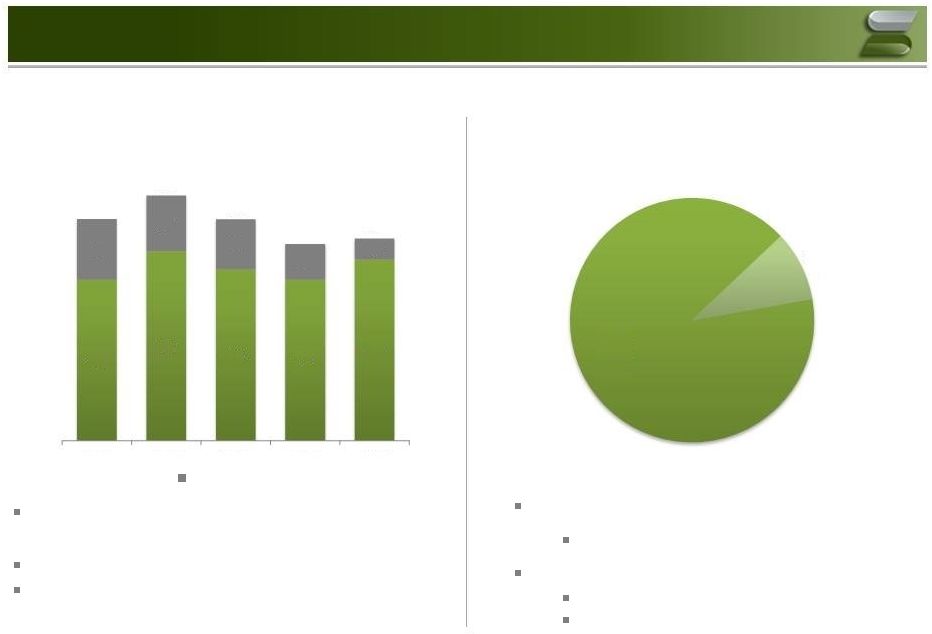 Q1’15
Production and Capital Summary Q1’15
Oil
and
Gas
Capital
by
Type
(2)
($MM)
6
Q1’15
Pro
Forma
Production
(1)
up
12
MMcfe/d
sequentially from Q4’14
27 wells turned to sales in Q1’15
Maintaining CY 2015 Guidance of 435 to 460
MMcfe/d
Total Oil and Gas Capital Spend of $116 MM
91% D&C
Non-D&C Oil and Gas Capital of $11 MM
$8 MM Facilities / Other
$3 MM LG&G
Production By Quarter
(MMcfe/d)
(1)
Q1’15 Pro Forma production of 506 MMcfe/d includes 11 MMcfe/d associated with the GDP
acquisition which closed December 22, 2014. (2)
Cash capital expenditures.
Note: Totals may not sum due to independent rounding.
Divested Production
494
511
500
494
506
35
33
29
21
12
529
543
530
515
518
Q1'14
Q2'14
Q3'14
Q4'14
Q1'15
D&C
$106
Non-D&C
$11 |
 7
Non-GAAP Disclosures
Cash operating margin, EBITDA, Adjusted EBITDA and Covenant Adjusted EBITDA are non-GAAP
financial measures. We believe that the presentation of these non-GAAP
financial measures will provide useful information to investors in assessing our financial condition and results of operations.
Cash operating margin represents our average realized sales price per Mcfe, including the
effect of realized derivatives, less (i) lease operating expenses per Mcfe,
(ii) production and ad valorem taxes per Mcfe and (iii) general and administrative expenses
per Mcfe, excluding stock based compensation expenses. The per unit components of
cash operating margin are determined by dividing the applicable component by our total production on a natural gas equivalent basis. We believe that
cash operating margin is an important measure that can facilitate comparisons of our
performance between periods and to the performance of our peer companies.
EBITDA is defined as net income (loss) before interest expense, income tax expense (benefit),
depreciation and amortization. Adjusted EBITDA represents EBITDA adjusted as applicable
in the relevant period for select items specified in the credit agreement governing our revolving credit facility, including unrealized hedging
losses (gains), non-cash stock compensation expenses, management and similar fees paid to
our sponsors, costs associated with the preparation and implementation of certain
public company compliance obligations, losses (gains) on non-ordinary course asset dispositions, ceiling test charges and certain unusual and non-recurring
charges. We define Covenant Adjusted EBITDA as total Adjusted EBITDA less the Adjusted EBITDA
attributable to any assets or businesses disposed of during the relevant period. We
believe that the presentation of EBITDA, Adjusted EBITDA and Covenant Adjusted EBITDA is important to provide management and investors with
(i) additional information to evaluate our ability to service and comply with our debt
obligations, adjusting for certain items required or permitted in calculating covenant
compliance under the credit agreement governing our revolving credit facility, (ii) a supplemental indicator of the operational performance and value of our
business, (iii) an additional criterion for evaluating our performance relative to peer
companies and (iv) supplemental information about certain material non-cash and
other items that may not continue at the same level in the future.
We refer to PV-10 as the present value of estimated future net cash flows of estimated
proved reserves as calculated in the respective reserve report using a discount rate of
10%. This amount includes projected revenues, estimated production costs and estimated future development costs and excludes the estimated cash flows
related to future asset retirement obligations (“ARO”) and future income taxes. We
have also included PV-10 after ARO below. PV-10 after ARO includes the present
value of ARO related to proved reserves using a 10% discount rate and no inflation of current
costs. We believe that the non-GAAP financial measures of PV-10 and
PV-10 after ARO are relevant and useful for evaluating the relative monetary significance
of our proved oil and natural gas reserves. We believe the use of pre-tax measures
is valuable because there are many unique factors that can impact an individual company when estimating the amount of future income taxes to be paid.
Management believes that the presentation of these measures provides useful information to
investors because they are widely used by investors in evaluating oil and natural gas
companies. Net income (loss) is the GAAP financial measure most directly comparable to each of EBITDA,
Adjusted EBITDA and Covenant Adjusted EBITDA. Our non-GAAP financial measures
should not be considered as alternatives to the most directly comparable GAAP financial measures. Each of these non-GAAP financial measures has
important limitations as an analytical tool because it excludes some, but not all, items that
affect the most directly comparable GAAP financial measure. You should not consider
these non-GAAP financial measures in isolation or as a substitute for analysis of our results as reported under GAAP. Because cash operating margin, EBITDA,
Adjusted EBITDA and Covenant Adjusted EBITDA may be defined differently by other companies in
our industry, our definitions of these non-GAAP financial measures may not be
comparable to similarly titled measures of other companies, thereby diminishing their utility.
Management compensates for the limitations of these non-GAAP financial measures as an
analytical tool by reviewing the comparable GAAP financial measures, understanding the
difference between the non-GAAP financial measures, on the one hand, and each of their respective most directly comparable GAAP financial
measures, on the other hand, and incorporating this knowledge into its decision-making
processes. We believe that investors benefit from having access to the same financial
measures that our management uses in evaluating our financial condition and results of operations.
The following table presents reconciliations of EBITDA, Adjusted EBITDA and Covenant Adjusted
EBITDA to net income (loss) for each of the periods indicated. |
 8
Q1’15 Adjusted EBITDA Reconciliation
(1)
(2)
Stock compensation expense recognized in earnings, net of capitalization.
(3)
Quarterly management fee.
(4)
Incorporates net adjustment of approximately ($16) MM to account for acquired and divested
EBITDA, as per the credit agreement governing our revolving credit facility. Covenant Adjusted EBITDA
measured on a rolling four-quarters basis is used to determine our compliance with the
financial performance covenant in the credit agreement governing our revolving credit facility.
Three Months
Twelve Months
Ended
Ended
March 31, 2015
March 31, 2015
Net income (loss)
(490,331)
$
(1,909,890)
$
Interest expense, net
64,127
135,559
Provision (benefit) for income taxes
(271,559)
(1,060,629)
Depreciation, depletion and amortization
(1)
105,372
469,520
EBITDA
(592,391)
$
(2,365,440)
$
Adjustment for unrealized hedging losses (gains)
(22,956)
(170,631)
Adjustment for non-cash stock compensation expense
(2)
14,601
52,882
Adjustment for fees paid to co-investors
(3)
5,788
22,326
Adjustment for fees paid for public company compliance
277
3,150
(Gain) loss on sale of other property and equipment
3,784
4,833
Provision to reduce carrying value of oil and gas properties
629,517
2,954,863
Unusual or non-recurring charges described in credit agreement
53,376
74,336
Adjusted EBITDA
91,996
$
576,319
$
Covenant Adjusted EBITDA
(4)
560,274
$
Includes depreciation, depletion and amortization of oil and
gas properties and depreciation and amortization of other property and equipment and accretion of ARO.
Note: Calculated as of 3/31/15 with respect to Samson Resources Corporation and its
consolidated subsidiaries by reference to the applicable terms of the credit agreement governing our revolving
credit facility. |