Attached files
| file | filename |
|---|---|
| 8-K - FORM 8-K - FIFTH THIRD BANCORP | d927055d8k.htm |
 Barclays
2015 Americas Select Franchise Conference
Tayfun Tuzun
Executive Vice President & Chief Financial Officer
May 19, 2015
Please refer to earnings release dated April 21, 2015 (as amended) and
10-Q dated May 11, 2015 for further information
Exhibit 99.1
Fifth Third Bank | All Rights Reserved |
 2
Business composition at Fifth Third
Consumer
Lending
Branch
Banking
Wealth
Management
Commercial
Banking
Retail Bank
Cards
Home Equity
Mortgage
Auto
Private Bank
Retail Brokerage
Institutional Services
Commercial Bank
Footprint
Business
Lines
In footprint markets
National consumer lending
In footprint markets
National commercial banking
37% of
Bancorp net
revenue
10% of
Bancorp net
revenue
9% of
Bancorp net
revenue
42% of
Bancorp net
revenue
1
For
the
year
ended
December
31,
2014.
Net
revenue
represents
net
interest
income
plus
noninterest
income.
General
Corporate
and
Other
segment
not
included
in
above
disclosure
and
represents
remaining
2%
of
net
revenue.
1
1
1
1
Fifth Third Bank | All Rights Reserved |
 3
Fifth Third Bank | All Rights Reserved
Changing profile of commercial lending
Commercial Loan Portfolio
1
5 year BB spread at quarter end.
2
Includes FTE Adjustment
3
2010, 2011, and 2012 have not been restated for changes in the structure of
reporting units that occurred in 1Q14. Changing credit profile post-crisis
directly linked to change in our risk appetite, indirectly a result of
increased focus on mid-
and large-corporate
relationships
Combination of lower credit spreads and higher
capital ratios require significantly higher
contribution from non-credit business fees to
meet target returns
Although fee income streams may result in higher
potential volatility in revenues compared to pure
interest income, lower credit volatility should
preserve stable earnings
Commercial
Banking
Net
Revenue
2,3 |
 4
Fifth Third Bank | All Rights Reserved
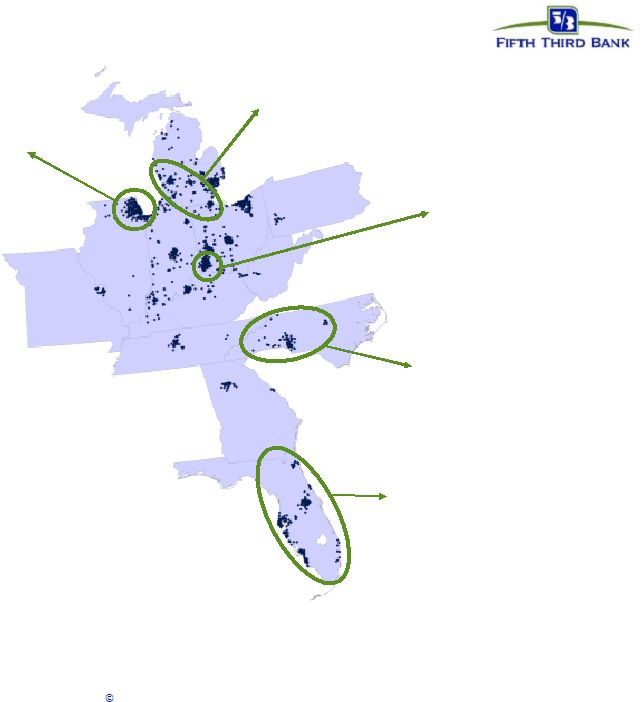
Deposit momentum delivering franchise value
Naples
Source: FDIC, SNL Financial.
Note: Branches included are full service retail / brick and mortar; data excludes
headquarters branches with over $250 million in deposits ($500MM for Chicago CBSA).
Cincinnati affiliate
#1 market share (23% or $11.0B
of FITB footprint deposits) and
Fifth Third’s largest affiliate
market; home of Fifth Third’s
corporate headquarters
Western Michigan and Northwestern Ohio affiliates
#1 market shares (17% and 19% of FITB footprint deposits,
respectively); incl. Grand Rapids, MI and Toledo, OH
Chicago affiliate
Fifth Third’s second largest affiliate market;
6.9% increase in deposits vs. 2013
•
Deposit growth in all 15
affiliates
•
Deposit market share
growth in 13 of 15 affiliates
–
Top 3 deposit share in 7
affiliates
–
Deposit growth
outperforming market in
13 affiliates
Strong market share in mature Midwest markets;
Southeast markets remain key focus area and source of growth
North Carolina affiliate
#4 market share in Charlotte;
8.0% increase in deposits vs.
2013
Florida region
10.3% increase in deposits vs. 2013;
one of the strongest regional growth
markets |
 5
Enhancing retail bank platform
Consumer Deposit Activity
Transaction volume by ATM and mobile channels
•
Remote deposit capture launched in 2012, now
36% of all consumer deposits
•
2,200 ATMs image-enabled broadens reach and
effective footprint
•
Testing technology-focused, smaller branch
formats with lower staffing requirements
•
Redefining roles of branch personnel and testing
hybrid roles in response to change in traffic
patterns
•
3
rd
generation mobile banking platform
•
Actively pursing digital sales capabilities to
compensate for decline in branch traffic
Branch Transactions
Average monthly teller transaction in millions
Fifth Third Bank | All Rights Reserved |
 6
Consumer lending-stable source of earning
assets
Mortgage
Auto
Home Equity
Card
–
Primarily in footprint lender
–
Flexible business model,
quickly scalable in
response to change in
environment
–
Important cornerstone
product key to strong
relationships
–
Stable portfolio balances
–
National lender; in 46
states
–
Super-prime focus with
750 plus average FICO
score; 90% or less average
advance rates
–
18,000 dealer customers
–
Valuable source of credit to
home owning customers
–
Slightly downward trends in
balances due to low demand
–
Credit trends in line with
industry, 1/3 1
st
lien; 1/3
behind Fifth Third 1
st
lien
–
In footprint card portfolio
sold to current customers
–
Stable portfolio yield
–
Focused on card activity
and utilization with current
holders
Mortgage Banking Net Revenue ($MM)
Average Auto Loans ($MM)
Average Card Loans ($MM)
Fifth Third Bank | All Rights Reserved |
 7
Consumer
Wholesale
Retail Brokerage
Private Bank
Institutional Services
ClearArc Capital
Mass market and mass
affluent clients
–
Retirement, investment and
education planning,
managed money, annuities
and transactional
brokerage services
Financial elite clients
–
Teams of professionals
dedicated to helping
clients achieve their
financial goals
Consulting, investment and
record-keeping services for
corporations, financial
institutions, foundations,
endowments and not-for-profit
organizations
–
Retirement plans, endowment
management, planned giving
and custody services
Provides asset management
services to institutional
clients
–
Divested all proprietary
mutual funds in 2012 to
complete transition to open
architecture
Investment Advisors serves individual and institutional clients with all levels of
wealth; provides for significant cross-sell opportunity
Wealth management increasing contribution to
earnings
Noninterest Expense ($MM)
Fifth Third Bank | All Rights Reserved |
 8
2014 performance at a glance
Diluted earnings per share
Strong long-term earnings growth
Nonperforming asset ratio
Problem assets at lowest
levels since before crisis
Tier I common ratio
2
ALLL / NPLs
Maintaining prudent reserve stance
Solid capital ratios;
above targets and requirements
Includes dividends declared and share repurchases. 2013 is net of the issuance of
shares valued at $398MM related to the Series G preferred stock conversion on July 1, 2013. 2012,
2013, and 2014 also include repurchases of shares in the amount of after-tax
gains on the sale of Vantiv shares. Non-GAAP measure; see Reg. G
reconciliation in appendix. Book value per share
Creating value and sustaining
momentum in results
Total payout ratio
1
~$1.1B
payout to common
shareholders in 2014
1
2
1
Fifth Third Bank | All Rights Reserved |
 9
Earnings per diluted share of $0.42; significant pre-tax items in 1Q15 results
included a $70MM pre-tax positive valuation adjustment on the warrant
Fifth Third holds in Vantiv, $37MM pre-tax gain on the sale of TDRs, a
$17MM pre-tax charge related to the valuation of the Visa total return
swap and a $30MM operating lease impairment charge recognized as a
post-quarter adjustment (resulting in a total net ~$0.05 positive after-tax
impact on EPS) Solid operating results despite continued low interest rate
environment; reflected typical 1Q seasonality in fee income and benefits
expense Credit quality continues to improve; NCO ratio 41 bps of loans and NPA
ratio 76 bps First quarter 2015 earnings highlights
1
Common equity tier 1 capital ratio on a Basel III transitional basis. Under banking
agencies Basel III Final Rule, assets and credit equivalent amounts of off-balance sheet exposures are
calculated based upon the standardized approach for risk-weighted assets. The
resulting values are added together resulting in the Bancorp’s total risk-weighted assets.
•
Traditional commercial banking franchise utilizing an affiliate-based model
supported with strong national businesses
—
Segment and industry specialization in mid-corporate, energy, and
healthcare •
Top 3 deposit market share in key markets with focus on further improving share of
wallet •
Redesigning retail distribution strategy and prioritizing key segments in consumer
bank •
Growing regional wealth management and brokerage services
•
Common equity tier 1 capital ratio of 9.5%¹
•
Repurchased 9MM common shares in 1Q15
•
2015 CCAR plan not objected to by Federal Reserve Board, includes the potential
increase in the quarterly common stock dividend and potential repurchase of
common shares
—
$180MM share repurchase agreement announced in 1Q15
—
$155MM share repurchase agreement announced in 2Q15
Fifth Third Bank | All Rights Reserved |
 10
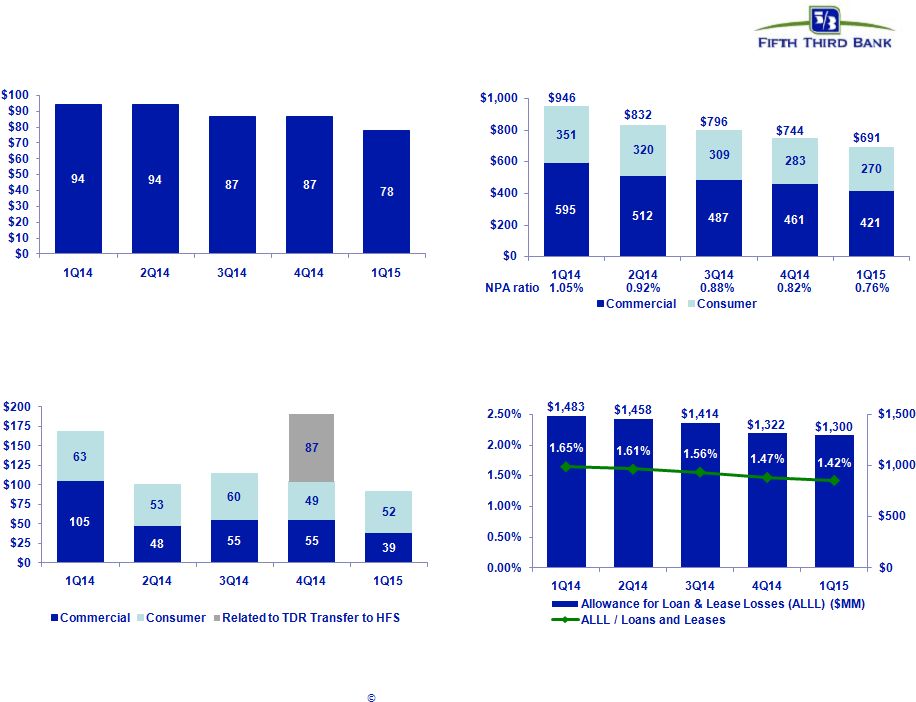
Credit quality overview
Net Charge-offs ($MM)
$91
$101
NCO ratio
0.76%
0.45%
0.50%
0.83%
0.41%
$168
HFI Nonperforming Assets ($MM)
NPAs down 7% sequentially and 27% from 1Q14;
lowest level since 2007
Reserve Coverage
Accruing 90+ Days Past Due ($MM)
Includes 1Q15 provision expense of $69MM,
reserve coverage levels remain solid
90 + delinquencies declined 17% from 1Q14
Net charge-offs down 52% sequentially and 46% year-over-year; 4Q14
included $87MM related to TDR transfer to held-for-sale
$115
$191
Fifth Third Bank | All Rights Reserved |
 11
Fifth Third Bank | All Rights Reserved
1Q12-1Q15 Common Equity Repurchased /
2011 Total Common Equity
Strong capital position
1
Non-GAAP measure; See Reg. G reconciliation in appendix.
2
2013 is net of the issuance of shares valued at $398MM related to the Series G
preferred stock conversion on July 1, 2013 Peer average includes: BBT, CMA,
HBAN, KEY, MTB, PNC, RF, STI, USB, and WFC. Tier I common equity
1
Capital generation and overall capital position, sufficient to
support balance sheet growth and continued prudent capital return to
shareholders Total
Payout
Ratio
(ex.
Vantiv)
2 |
 12
Investment thesis
Fifth Third Bank | All Rights Reserved |
 13
Cautionary statement
This report contains statements that we believe are “forward-looking statements” within
the meaning of Section 27A of the Securities Act of 1933, as amended, and Rule 175 promulgated
thereunder, and Section 21E of the Securities Exchange Act of 1934, as amended, and Rule
3b-6 promulgated thereunder. These statements relate to our financial condition, results of
operations, plans, objectives, future performance or business. They usually can be identified
by the use of forward-looking language such as “will likely result,” “may,” “are expected to,” “is
anticipated,” “estimate,” “forecast,” “projected,” “intends
to,” or may include other similar words or phrases such as “believes,” “plans,” “trend,”
“objective,” “continue,” “remain,” or similar expressions, or future or
conditional verbs such as “will,” “would,” “should,” “could,” “might,” “can,”
or similar verbs. You should not place undue reliance on these statements, as they are subject to
risks and uncertainties, including but not limited to the risk factors set forth in our most
recent Annual Report on Form 10-K. When considering these forward-looking statements, you
should keep in mind these risks and uncertainties, as well as any cautionary statements we may make.
Moreover, you should treat these statements as speaking only as of the date they are made and
based only on information then actually known to us. There are a number of important factors that could cause future results to differ materially from
historical performance and these forward- looking statements. Factors that might cause such
a difference include, but are not limited to: (1) general economic conditions and weakening in
the economy, specifically the real estate market, either nationally or in the states in which Fifth Third, one or more acquired
entities and/or the combined company do business, are less favorable than expected; (2) deteriorating
credit quality; (3) political developments, wars or other hostilities may disrupt or increase
volatility in securities markets or other economic conditions; (4) changes in the interest rate
environment reduce interest margins; (5) prepayment speeds, loan origination and sale volumes, charge-offs and loan loss
provisions; (6) Fifth Third’s ability to maintain required capital levels and adequate sources of
funding and liquidity; (7) maintaining capital requirements and adequate sources of funding and
liquidity may limit Fifth Third’s operations and potential growth; (8) changes and trends in
capital markets; (9) problems encountered by larger or similar financial institutions may adversely
affect the banking industry and/or Fifth Third; (10) competitive pressures among depository
institutions increase significantly; (11) effects of critical accounting policies and
judgments; (12) changes in accounting policies or procedures as may be required by the Financial
Accounting Standards Board (FASB) or other regulatory agencies; (13) legislative or regulatory
changes or actions, or significant litigation, adversely affect Fifth Third, one or more
acquired entities and/or the combined company or the businesses in which Fifth Third, one or more
acquired entities and/or the combined company are engaged, including the Dodd-Frank Wall
Street Reform and Consumer Protection Act; (14) ability to maintain favorable ratings from
rating agencies; (15) fluctuation of Fifth Third’s stock price; (16) ability to attract and retain key personnel; (17) ability to receive
dividends from its subsidiaries; (18) potentially dilutive effect of future acquisitions on current
shareholders’ ownership of Fifth Third; (19) effects of accounting or financial results of
one or more acquired entities; (20) difficulties from Fifth Third’s investment in, relationship with,
and nature of the operations of Vantiv, LLC; (21) loss of income from any sale or potential sale of
businesses that could have an adverse effect on Fifth Third’s earnings and future growth;
(22) ability to secure confidential information and deliver products and services through the
use of computer systems and telecommunications networks; and (23) the impact of reputational risk
created by these developments on such matters as business generation and retention, funding and
liquidity. You should refer to our periodic and current reports filed with the Securities and Exchange
Commission, or “SEC,” for further information on other factors, which could cause
actual results to be significantly different from those expressed or implied by these forward-looking
statements.
Fifth Third Bank | All Rights Reserved |
 14
Appendix
Fifth Third Bank | All Rights Reserved |
 15
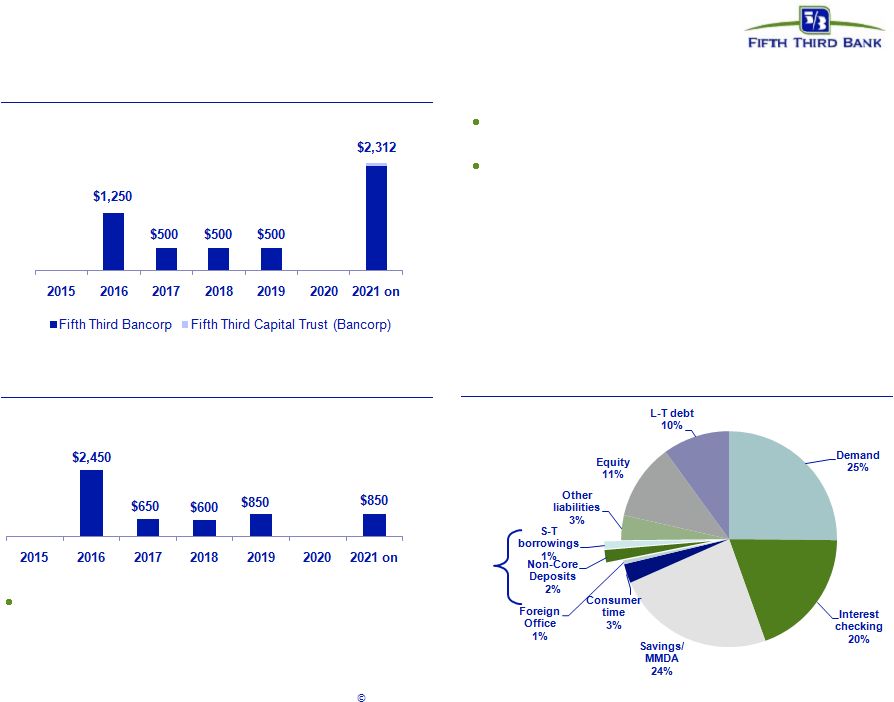
Available and contingent borrowing capacity
(1Q15):
–
FHLB ~$14.2B available, ~$16.0B total
–
Federal Reserve ~$26.6B
Holding Company cash at 3/31/15: $2.5B
Cash currently sufficient to satisfy all fixed
obligations in a stressed environment for
more than 18 months (debt maturities,
common and preferred dividends, interest and
other expenses) without accessing capital
markets, relying on future dividends from
subsidiaries, or any other discretionary
actions
Holding company unsecured debt maturities ($MM)
Bank
unsecured
debt
maturities
($MM
–
excl.
Brokered
CDs)
Heavily core funded
Strong liquidity profile
S-T
wholesale
3%
Fifth Third Bank | All Rights Reserved |
 16
Interest rate risk management
Well-positioned for rising rates
•
NII benefits from asset re-pricings in a rising rate environment
–
64% of total loans are floating rate (81% of commercial and 39% of consumer)
–
Investment portfolio duration of approximately 4.3 years
–
Short-term wholesale funding represents only about 1.5% of total funding
–
Approximately $12B in non-core funding re-prices beyond one year
•
Interest rate sensitivities are based on conservative deposit assumptions
–
70%
beta
on
all
interest-bearing
deposit
and
sweep
balances
(~50%
betas
experienced
in
2004
–
2006
Fed
tightening
cycle)
–
No modeled re-pricing lag
–
Modeled non-interest bearing commercial DDA runoff of approximately $2.5B (about
10%) for each 100 bps increase in rates
–
DDA runoff rolls into an interest bearing product with a 100% beta
Change in Interest Rates
+200
bps Shock
Change in Interest Rates
+100
bps Shock
+200
bps Ramp
1.54%
6.80%
(4.00%)
+25 bps Shock
+100
bps Ramp
0.83%
4.26%
-
-25 bps Shock
Betas 25% Higher
Betas 25% Lower
Change in Interest Rates
12
Months
13 to 24
Months
12
Months
Change in Interest Rates
12
Months
13 to 24
Months
12
Months
13 to 24
Months
+200
bps Ramp
1.26%
6.23%
1.82%
+200
bps Ramp
(1.54%)
0.47%
4.62%
13.12%
+100
bps Ramp
0.69%
3.98%
0.97%
+100
bps Ramp
(0.67%)
1.29%
2.32%
7.24%
ALCO Policy Limits
13 to 24 Months
(6.00%)
-
ALCO Policy Limit
(12.00%)
Change in EVE
(3.85%)
(1.33%)
(0.20%)
ESTIMATED NII SENSITIVITY PROFILE
ESTIMATED EVE SENSITIVITY PROFILE
Percent Change in
NII (FTE)
12
Months
13 to 24
Months
12
Months
ESTIMATED NII SENSITIVITY with DEPOSIT BETA ASSUMPTION CHANGES
4.55%
0.11%
$1B Balance Increase
13 to 24 Months
7.36%
ESTIMATED
NII
SENSITIVITY
with
DEMAND
DEPOSIT
BALANCE
RUN-OFF
ASSUMPTION
CHANGES
Percent Change in NII (FTE)
$1B Balance Decrease
Percent Change in NII (FTE)
Note: In ramp scenarios, rate changes occur evenly over the first four quarters. Estimated
results as of 1Q15, actual results may vary from these simulated results due to
differences between forecasted and actual balance sheet composition, timing, magnitude, and frequency
of interest rate changes, as well as changes in market conditions and management strategies.
Repricing percentage or “beta” is the estimated change in yield over 12 months as a result of a shock or ramp 100 bps parallel shift in the yield curve.
Fifth Third Bank | All Rights Reserved |
 17
Regulation G Non-GAAP reconciliation
Fifth Third Bancorp and Subsidiaries
Regulation G Non-GAAP Reconcilation
$ and shares in millions
(unaudited)
March
December
September
June
March
2015
2014
2014
2014
2014
Income before income taxes (U.S. GAAP)
485
519
464
606
438
Add:
Provision expense (U.S. GAAP)
69
99
71
76
69
Pre-provision net revenue
554
618
535
682
507
Net income available to common shareholders (U.S. GAAP)
346
362
328
416
309
Add:
Intangible amortization, net of tax
-
1
1
1
1
Tangible net income available to common shareholders
346
363
329
417
310
Tangible net income available to common shareholders (annualized) (a)
1,403
1,440
1,305
1,673
1,257
Average Bancorp shareholders' equity (U.S. GAAP)
15,820
15,644
15,486
15,157
14,862
Less:
Average preferred stock
(1,331)
(1,331)
(1,331)
(1,119)
(1,034)
Average goodwill
(2,416)
(2,416)
(2,416)
(2,416)
(2,416)
Average intangible assets and other servicing rights
(15)
(17)
(16)
(17)
(19)
Average tangible common equity
(b) 12,058
11,880
11,723
11,605
11,393
Total Bancorp shareholders' equity (U.S. GAAP)
15,864
15,626
15,404
15,469
14,826
Less:
Preferred stock
(1,331)
(1,331)
(1,331)
(1,331)
(1,034)
Goodwill
(2,416)
(2,416)
(2,416)
(2,416)
(2,416)
Intangible assets and other servicing rights
(15)
(16)
(16)
(17)
(18)
Tangible common equity, including
unrealized gains / losses (c) 12,102
11,863
11,641
11,705
11,358
Less: Accumulated other comprehensive income
(588)
(429)
(301)
(382)
(196)
Tangible common equity, excluding unrealized gains /
losses (d) 11,514
11,434
11,340
11,323
11,162
Total assets (U.S. GAAP)
140,470
138,706
134,188
132,562
129,654
Less:
Goodwill
(2,416)
(2,416)
(2,416)
(2,416)
(2,416)
Intangible assets and other servicing rights
(15)
(16)
(16)
(17)
(18)
Tangible assets, including
unrealized gains / losses (e) 138,039
136,274
131,756
130,129
127,220
Less: Accumulated other comprehensive income / loss, before tax
(905)
(660)
(463)
(588)
(302)
Tangible assets, excluding unrealized gains / losses
(f) 137,134
135,614
131,293
129,541
126,918
Common shares outstanding (g)
815
824
834
844
848
Ratios:
Return on average tangible common equity (a) / (b)
11.6%
12.1%
11.1%
14.4%
11.0%
Tangible common equity (excluding unrealized gains/losses) (d) / (f)
8.40%
8.43%
8.64%
8.74%
8.79%
Tangible common equity (including unrealized gains/losses) (c) / (e)
8.77%
8.71%
8.84%
9.00%
8.93%
Tangible book value per share (c) / (g)
$14.85
$14.40
$13.95
$13.86
$13.40
For the Three Months Ended
Fifth Third Bank | All Rights Reserved |
 18
Regulation G Non-GAAP reconciliation
Fifth Third Bancorp and Subsidiaries
Regulation G Non-GAAP Reconcilation
$ and shares in millions
(unaudited)
March
December
September
June
March
2015
2014
2014
2014
2014
Total Bancorp shareholders' equity (U.S. GAAP)
N/A
15,626
15,404
15,469
14,826
Goodwill and certain other intangibles
N/A
(2,476)
(2,484)
(2,484)
(2,490)
Unrealized gains
N/A
(429)
(301)
(382)
(196)
Qualifying trust preferred securities
N/A
60
60
60
60
Other
N/A
(17)
(18)
(19)
(18)
Tier I capital
N/A
12,764
12,661
12,644
12,182
Less:
Preferred stock
N/A
(1,331)
(1,331)
(1,331)
(1,034)
Qualifying trust preferred securities
N/A
(60)
(60)
(60)
(60)
Qualifying noncontrolling interest in
consolidated subsidiaries N/A
(1)
(1)
(1)
(1)
Tier I common equity
(a) N/A
11,372
11,269
11,252
11,087
Risk-weighted assets, determined in accordance with
Basel III
prescribed regulatory requirements (b)
121,310
117,878
116,917
117,117
116,622
Ratio:
Tier I common equity (a) / (b)
N/A
9.65%
9.64%
9.61%
9.51%
Basel III Final Rule - Transitional to fully phased-in
Common equity tier 1 capital (transitional)
11,543
Less: Adjustments to common equity tier 1 capital from transitional to fully
phased-in (1) (13)
Common equity tier 1 capital (fully
phased-in) (c) 11,530
Risk-weighted assets (transitional)
121,310
Add: Adjustments to risk-weighted assets from transitional to fully phased-in (2)
1,182
Risk-weighted assets (fully phased-in) (d)
122,492
Estimated common equity tier 1 capital ratio under Basel III Final Rule (fully phased-in)
(c) / (d) 9.41%
(1)
(2)
Primarily relates to disallowed intangible assets (other than goodwill and MSRs, net of associated
deferred tax liabilities) Primarily relates to higher risk weighting for MSRs.
For the Three Months Ended
Basel I
Fifth Third Bank | All Rights Reserved |
 19
Regulation G Non-GAAP reconciliation
Fifth Third Bancorp and Subsidiaries
Regulation G Non-GAAP Reconcilation
$ and shares in millions
(unaudited)
2014
2013
2012
2011
2010
Total Bancorp shareholders' equity (U.S. GAAP)
$15,626
$14,589
$13,716
$13,201
$14,051
Goodwill and certain other intangibles
(2,476)
(2,492)
(2,499)
(2,514)
(2,546)
Unrealized gains
(429)
(82)
(375)
(470)
(314)
Qualifying trust preferred securities
60
60
810
2,248
2,763
Other
(17)
19
33
38
11
Tier I capital
12,764
12,094
11,685
12,503
13,965
Less:
Preferred stock
1,331
(1,034)
(398)
(398)
(3,654)
Qualifying trust preferred securities
(60)
(60)
(810)
(2,248)
(2,763)
Qualifying noncontrolling interest in consolidated subsidiaries
(1)
(37)
(48)
(50)
(30)
Tier I common equity (a)
11,372
10,963
10,429
9,807
7,518
Risk-weighted assets, determined in accordance with
prescribed regulatory requirements (b)
117,878
115,969
109,301
104,219
100,561
Ratio:
Tier I common equity (a) / (b)
9.65%
9.45%
9.54%
9.41%
7.48%
For the Year Ended
Fifth Third Bank | All Rights Reserved |