Attached files
| file | filename |
|---|---|
| EXCEL - IDEA: XBRL DOCUMENT - BLUE DOLPHIN ENERGY CO | Financial_Report.xls |
| EX-32.1 - CERTIFICATION - BLUE DOLPHIN ENERGY CO | bdco_ex321.htm |
| EX-31.1 - CERTIFICATION - BLUE DOLPHIN ENERGY CO | bdco_ex311.htm |
| EX-31.2 - CERTIFICATION - BLUE DOLPHIN ENERGY CO | bdco_ex312.htm |
| EX-32.2 - CERTIFICATION - BLUE DOLPHIN ENERGY CO | bdco_ex322.htm |
UNITED STATES
SECURITIES AND EXCHANGE COMMISSION
Washington, D.C. 20549
FORM 10-Q
(Mark One)
þ Quarterly Report Pursuant to Section 13 or 15(d) of the Securities Exchange Act of 1934
For the quarterly period ended: March 31, 2015
o Transition Report Pursuant to Section 13 or 15(d) of the Securities Exchange Act of 1934
For the transition period from _____________ to_____________
Commission File Number: 0-15905
BLUE DOLPHIN ENERGY COMPANY
(Exact name of registrant as specified in its charter)
|
Delaware
|
73-1268729
|
|
|
(State or other jurisdiction of incorporation or organization)
|
(I.R.S. Employer Identification No.)
|
801 Travis Street, Suite 2100, Houston, Texas 77002
(Address of principal executive offices)
(713) 568-4725
(Registrant’s telephone number, including area code)
Indicate by check mark whether the registrant (1) filed all reports required to be filed by Section 13 or 15(d) of the Securities Exchange Act of 1934 during the preceding 12 months (or for such shorter period that the registrant was required to file such reports), and (2) has been subject to such filing requirements for the past 90 days. Yes þ No o
Indicate by check mark whether the registrant has submitted electronically and posted on its corporate Web site, if any, every Interactive Data File required to be submitted and posted pursuant to Rule 405 of Regulation S-T (§232.405 of this chapter) during the preceding 12 months (or for such shorter period that the registrant was required to submit and post such files). Yes þ No o
Indicate by check mark whether the registrant is a large accelerated filer, an accelerated filer, a non-accelerated filer, or a smaller reporting company. See the definitions of “large accelerated filer,” “accelerated filer” and “smaller reporting company” in Rule 12b-2 of the Exchange Act.
|
Large accelerated filer
|
o
|
Accelerated filer
|
o
|
|
Non-accelerated filer
|
o
|
Smaller reporting company
|
þ
|
|
(Do not check if a smaller reporting company)
|
|||
Indicate by check mark whether the registrant is a shell company (as defined in Rule 12b-2 of the Exchange Act). Yes o No þ
Number of shares of common stock, par value $0.01 per share outstanding as of May 15, 2015: 10,449,444
FORM 10-Q REPORT INDEX
| Page | ||||
| PART I FINANCIAL INFORMATION | ||||
| ITEM 1. FINANCIAL STATEMENTS | 3 | |||
| Consolidated Balance Sheets (Unaudited) | 3 | |||
| Consolidated Statements of Operations (Unaudited) | 4 | |||
| Consolidated Statements of Cash Flows (Unaudited) | 5 | |||
| Notes to Consolidated Financial Statements (Unaudited) | 6 | |||
| ITEM 2. MANAGEMENT'S DISCUSSION AND ANALYSIS OF FINANCIAL CONDITION AND RESULTS OF OPERATIONS | 25 | |||
| ITEM 3. QUANTITATIVE AND QUALITATIVE DISCLOSURES ABOUT MARKET RISK | 38 | |||
| ITEM 4. CONTROLS AND PROCEDURES | 38 | |||
| PART II OTHER INFORMATION | ||||
| ITEM 1. LEGAL PROCEEDINGS | 39 | |||
| ITEM 1A. RISK FACTORS | 39 | |||
| ITEM 2. UNREGISTERED SALES OF EQUITY SECURITIES AND USE OF PROCEEDS | 39 | |||
| ITEM 3. DEFAULTS UPON SENIOR SECURITIES | 39 | |||
| ITEM 4. MINE SAFETY DISCLOSURES | 39 | |||
| ITEM 5. OTHER INFORMATION | 39 | |||
| ITEM 6. EXHIBITS | 39 | |||
| SIGNATURES | 40 | |||
2
PART I FINANCIAL INFORMATION
ITEM 1. FINANCIAL STATEMENTS
Blue Dolphin Energy Company & Subsidiaries
Consolidated Balance Sheets (Unaudited)
|
March 31,
|
December 31,
|
|||||||
|
2015
|
2014
|
|||||||
|
ASSETS
|
||||||||
|
CURRENT ASSETS
|
||||||||
|
Cash and cash equivalents
|
$ | 2,279,206 | $ | 1,293,233 | ||||
|
Restricted cash
|
1,011,112 | 1,008,514 | ||||||
|
Accounts receivable
|
9,876,395 | 8,340,303 | ||||||
|
Prepaid expenses and other current assets
|
120,764 | 771,458 | ||||||
|
Deposits
|
120,176 | 68,498 | ||||||
|
Inventory
|
3,070,710 | 3,200,651 | ||||||
|
Deferred tax assets, current portion, net
|
17,779 | - | ||||||
|
Total current assets
|
16,496,142 | 14,682,657 | ||||||
|
Total property and equipment, net
|
38,263,759 | 37,371,075 | ||||||
|
Surety bonds
|
1,642,000 | 1,642,000 | ||||||
|
Debt issue costs, net
|
500,122 | 479,737 | ||||||
|
Trade name
|
303,346 | 303,346 | ||||||
|
Deferred tax assets, net
|
3,934,843 | 5,928,342 | ||||||
|
TOTAL ASSETS
|
$ | 61,140,212 | $ | 60,407,157 | ||||
|
LIABILITIES AND STOCKHOLDERS' EQUITY
|
||||||||
|
CURRENT LIABILITIES
|
||||||||
|
Accounts payable
|
$ | 9,882,225 | $ | 12,370,179 | ||||
|
Accounts payable, related party
|
119,645 | 1,174,168 | ||||||
|
Asset retirement obligations, current portion
|
86,341 | 85,846 | ||||||
|
Accrued expenses and other current liabilities
|
3,773,607 | 2,783,704 | ||||||
|
Interest payable, current portion
|
47,310 | 56,039 | ||||||
|
Long-term debt, current portion
|
1,263,057 | 1,245,476 | ||||||
|
Deferred tax liabilities, net
|
- | 168,236 | ||||||
|
Total current liabilities
|
15,172,185 | 17,883,648 | ||||||
|
LONG-TERM LIABILIES
|
||||||||
|
Asset retirement obligations, net of current portion
|
1,833,693 | 1,780,924 | ||||||
|
Deferred revenues and expenses
|
648,305 | 691,525 | ||||||
|
Long-term debt, net of current portion
|
10,491,117 | 10,808,803 | ||||||
|
Long-term interest payable, net of current portion
|
1,326,080 | 1,274,789 | ||||||
|
Total long-term liabilities
|
14,299,195 | 14,556,041 | ||||||
|
TOTAL LIABILITIES
|
29,471,380 | 32,439,689 | ||||||
|
Commitments and contingencies (Note 20)
|
||||||||
|
STOCKHOLDERS' EQUITY
|
||||||||
|
Common stock ($0.01 par value, 20,000,000 shares authorized;10,599,444 shares issued at March 31, 2015 and December 31, 2014)
|
105,995 | 105,995 | ||||||
|
Additional paid-in capital
|
36,718,781 | 36,718,781 | ||||||
|
Accumulated deficit
|
(4,355,944 | ) | (8,057,308 | ) | ||||
|
Treasury stock, 150,000 shares at cost
|
(800,000 | ) | (800,000 | ) | ||||
|
Total stockholders' equity
|
31,668,832 | 27,967,468 | ||||||
|
TOTAL LIABILITIES AND STOCKHOLDERS' EQUITY
|
$ | 61,140,212 | $ | 60,407,157 | ||||
See accompanying notes to consolidated financial statements.
3
Blue Dolphin Energy Company & Subsidiaries
Consolidated Statements of Operations (Unaudited)
| Three Months Ended March 31, | ||||||||
|
2015
|
2014
|
|||||||
|
REVENUE FROM OPERATIONS
|
||||||||
|
Refined product sales
|
$ | 61,067,062 | $ | 120,376,151 | ||||
|
Tank rental revenue
|
286,892 | 282,516 | ||||||
|
Pipeline operations
|
38,395 | 54,031 | ||||||
|
Total revenue from operations
|
61,392,349 | 120,712,698 | ||||||
|
COST OF OPERATIONS
|
||||||||
|
Cost of refined products sold
|
49,387,449 | 110,415,607 | ||||||
|
Refinery operating expenses
|
2,880,971 | 2,955,019 | ||||||
|
Joint Marketing Agreement profit share
|
2,438,637 | - | ||||||
|
Pipeline operating expenses
|
46,596 | 27,729 | ||||||
|
Lease operating expenses
|
7,316 | 7,176 | ||||||
|
General and administrative expenses
|
345,884 | 369,484 | ||||||
|
Depletion, depreciation and amortization
|
399,231 | 390,605 | ||||||
|
Accretion expense
|
53,215 | 50,802 | ||||||
|
Total cost of operations
|
55,559,299 | 114,216,422 | ||||||
|
Income from operations
|
5,833,050 | 6,496,276 | ||||||
|
OTHER INCOME (EXPENSE)
|
||||||||
|
Easement, interest and other income
|
66,007 | 154,220 | ||||||
|
Interest expense
|
(208,075 | ) | (253,800 | ) | ||||
|
Total other income (expense)
|
(142,068 | ) | (99,580 | ) | ||||
|
Income before income taxes
|
5,690,982 | 6,396,696 | ||||||
|
Income tax expense
|
(1,989,618 | ) | (202,423 | ) | ||||
|
Net income
|
$ | 3,701,364 | $ | 6,194,273 | ||||
|
Income per common share
|
||||||||
|
Basic
|
$ | 0.35 | $ | 0.59 | ||||
|
Diluted
|
$ | 0.35 | $ | 0.59 | ||||
|
Weighted average number of common shares outstanding:
|
||||||||
|
Basic
|
10,449,444 | 10,430,973 | ||||||
|
Diluted
|
10,449,444 | 10,430,973 | ||||||
See accompanying notes to consolidated financial statements.
4
Blue Dolphin Energy Company & Subsidiaries
Consolidated Statements of Cash Flows (Unaudited)
|
Three Months Ended March 31,
|
||||||||
|
2015
|
2014
|
|||||||
|
OPERATING ACTIVITIES
|
||||||||
|
Net income
|
$ | 3,701,364 | $ | 6,194,273 | ||||
|
Adjustments to reconcile net income to net cash
|
||||||||
|
provided by operating activities:
|
||||||||
|
Depletion, depreciation and amortization
|
399,231 | 390,605 | ||||||
|
Unrealized gain on derivatives
|
548,190 | 127,100 | ||||||
|
Deferred taxes
|
1,807,484 | - | ||||||
|
Amortization of debt issue costs
|
8,450 | 8,450 | ||||||
|
Accretion expense
|
53,215 | 50,802 | ||||||
|
Changes in operating assets and liabilities
|
||||||||
|
Restricted cash
|
(2,598 | ) | (675,736 | ) | ||||
|
Accounts receivable
|
(1,536,092 | ) | 3,738,092 | |||||
|
Prepaid expenses and other current assets
|
650,694 | 70,655 | ||||||
|
Deposits and other assets
|
(80,513 | ) | (449,553 | ) | ||||
|
Inventory
|
129,941 | 289,506 | ||||||
|
Accounts payable, accrued expenses and other liabilities
|
(2,046,849 | ) | (4,506,163 | ) | ||||
|
Accounts payable, related party
|
(1,054,523 | ) | (38,693 | ) | ||||
|
Net cash provided by operating activities
|
2,577,994 | 5,199,338 | ||||||
|
INVESTING ACTIVITIES
|
||||||||
|
Capital expenditures
|
(1,291,915 | ) | (59,178 | ) | ||||
|
Net cash used in investing activities
|
(1,291,915 | ) | (59,178 | ) | ||||
|
FINANCING ACTIVITIES
|
||||||||
|
Payments on long-term debt
|
(300,106 | ) | (5,267,116 | ) | ||||
|
Payments on notes payable
|
- | (11,884 | ) | |||||
|
Net cash used in financing activities
|
(300,106 | ) | (5,279,000 | ) | ||||
|
Net increase (decrease) in cash and cash equivalents
|
985,973 | (138,840 | ) | |||||
|
CASH AND CASH EQUIVALENTS AT BEGINNING OF PERIOD
|
1,293,233 | 434,717 | ||||||
|
CASH AND CASH EQUIVALENTS AT END OF PERIOD
|
$ | 2,279,206 | $ | 295,877 | ||||
|
Supplemental Information:
|
||||||||
|
Non-cash operating activities
|
||||||||
|
Surety bond funded by seller of pipeline interest
|
$ | - | $ | 850,000 | ||||
|
Non-cash investing and financing activities:
|
||||||||
|
New asset retirement obligations
|
$ | - | $ | 300,980 | ||||
|
Interest paid
|
$ | 165,513 | $ | 902,176 | ||||
| Income taxes paid | $ | - | $ | - | ||||
See accompanying notes to consolidated financial statements.
5
Blue Dolphin Energy Company & Subsidiaries
Notes to Consolidated Financial Statements (Unaudited)
(1) Organization
Nature of Operations
Blue Dolphin Energy Company (http://www.blue-dolphin-energy.com, referred to herein, with its predecessors and subsidiaries, as “Blue Dolphin,” “BDEC,” “we,” “us” and “our”) is primarily an independent refiner and marketer of petroleum products. Our primary asset is a 15,000 bpd crude oil and condensate processing facility that is located in Nixon, Wilson County, Texas (the “Nixon Facility”). As part of our refinery business segment, we also conduct petroleum storage and terminaling operations under third-party lease agreements at the Nixon Facility. We also own and operate pipeline assets and have leasehold interests in oil and gas properties, which are considered non-core to our business. See “Note (4) Business Segment Information” of this report for further discussion of our business segments.
Structure and Management
We were formed as a Delaware corporation in 1986. We are controlled by Lazarus Energy Holdings, LLC (“LEH”), which owns approximately 81% of our common stock, par value $0.01 per share (the “Common Stock). Jonathan P. Carroll, Chairman of the Board of Directors (the “Board”), Chief Executive Officer, and President of Blue Dolphin, is the majority owner of LEH. LEH also manages and operates our property and the property of our subsidiaries, including the Nixon Facility, in the ordinary course of business pursuant to an Operating Agreement (the “Operating Agreement”).
Our operations are conducted directly and indirectly through our primary operating subsidiaries, as follows:
|
●
|
Lazarus Energy, LLC, a Delaware limited liability company (petroleum processing assets) (“LE”);
|
|
●
|
Lazarus Refining & Marketing, LLC, a Delaware limited liability company (petroleum storage and terminaling) (“LRM”);
|
|
●
|
Blue Dolphin Pipe Line Company, a Delaware corporation (pipeline operations) (“BDPL”);
|
|
●
|
Blue Dolphin Petroleum Company, a Delaware corporation (exploration and production activities); and
|
|
●
|
Blue Dolphin Services Co., a Texas corporation (administrative services).
|
(2) Basis of Presentation
We have prepared our unaudited consolidated financial statements in accordance with U.S. generally accepted accounting principles (“GAAP”), as codified by the Financial Accounting Standards Board (the “FASB”) in its Accounting Standards Codification (“ASC”), and pursuant to the rules and regulations of the Securities and Exchange Commission (the “SEC”). Our consolidated financial statements include Blue Dolphin and its subsidiaries. Significant intercompany transactions have been eliminated in the consolidation. In the opinion of management, such consolidated financial statements reflect all adjustments necessary to present fair consolidated statements of operations, financial position and cash flows. We believe that the disclosures are adequate and the presented information is not misleading. This report has been prepared in accordance with the SEC’s Form 10-Q instructions and therefore, certain information and footnote disclosures normally included in our annual audited financial statements prepared in accordance with GAAP have been condensed or omitted pursuant to the SEC’s rules and regulations.
(3) Significant Accounting Policies
The summary of significant accounting policies of Blue Dolphin is presented to assist in understanding our consolidated financial statements. Our consolidated financial statements and notes are representations of management who is responsible for its integrity and objectivity. These accounting policies conform to GAAP and have been consistently applied in the preparation of our consolidated financial statements.
Use of Estimates
We have made a number of estimates and assumptions related to the reporting of our consolidated assets and liabilities and to the disclosure of contingent assets and liabilities to prepare these consolidated financial statements in conformity with GAAP. While we believe our current estimates are reasonable and appropriate, actual results could differ from those estimated.
6
Blue Dolphin Energy Company & Subsidiaries
Notes to Consolidated Financial Statements (Unaudited) - continued
Cash and Cash Equivalents
Cash and cash equivalents represent liquid investments with an original maturity of three months or less. Cash balances are maintained in depository and overnight investment accounts with financial institutions that, at times, may exceed insured deposit limits. We monitor the financial condition of the financial institutions and have experienced no losses associated with these accounts. Cash and cash equivalents amounted to $2,279,206 and $1,293,233 at March 31, 2015 and December 31, 2014, respectively.
Restricted Cash
Restricted cash represents a payment reserve account held by American First National Bank as security for payments under a 2008 loan agreement (the “Refinery Note”). Restricted cash was $1,011,112 and $1,008,514 at March 31, 2015 and December 31, 2014, respectively.
Accounts Receivable, Allowance for Doubtful Accounts and Concentration of Credit Risk
Accounts receivable are customer obligations due under normal trade terms. The allowance for doubtful accounts represents our estimate of the amount of probable credit losses existing in our accounts receivable. We have a limited number of customers with individually large amounts due on any given date. Any unanticipated change in any one of these customers’ credit worthiness or other matters affecting the collectability of amounts due from such customers could have a material adverse effect on our results of operations in the period in which such changes or events occur. We regularly review all of our aged accounts receivable for collectability and establish an allowance for individual customer balances as necessary.
Concentration of Risk
Bank Accounts
Financial instruments that potentially subject us to concentrations of risk consist primarily of cash, trade receivables and payables. We maintain our cash balances at financial institutions located in Houston, Texas. In the United States, the Federal Deposit Insurance Corporation (the “FDIC”) insures certain financial products up to a maximum of $250,000 per depositor. We had cash balances in excess of the FDIC insurance limit per depositor in the amount of $2,263,113 and $1,113,977 at March 31, 2015 and December 31, 2014, respectively.
Significant Customers
Customers of our refined petroleum products include distributors, wholesalers, and refineries primarily in the lower portion of the Texas Triangle (the Houston - San Antonio - Dallas/Fort Worth area). We have bulk term contracts, including month-to-month, six months, and up to five year terms in place with most of our customers. Certain of our contracts require us to sell fixed quantities and/or minimum quantities of intermediate and finished petroleum products and many of these arrangements are subject to periodic renegotiation, which could result in us receiving higher or lower relative prices for our refined petroleum products. See “Note (14) Concentration of Risk” of this report for additional disclosures related to significant customers.
Inventory
The nature of our business requires us to maintain inventory, which primarily consists of refined petroleum products. Inventory reflected for crude oil and condensate is nominal and represents line fill. Because refined petroleum products are commodities, we have no control over the changing market value of these inventories. Our overall inventory is valued at lower of cost or market with costs being determined by the average cost method. If the market value of our refined petroleum product inventories declines to an amount less than our average cost, we record a write-down of inventory and an associated impairment expense. See “Note (7) Inventory” of this report for additional disclosures related to our inventory.
Derivatives
We are exposed to commodity prices and other market risks including gains and losses on certain financial assets as a result of our inventory risk management policy. Under our inventory risk management policy, Genesis may, but is not required to, use commodity futures contracts to mitigate the change in value for certain of our refined petroleum product inventories subject to market price fluctuations. The physical inventory volumes are not exchanged and these contracts are net settled with cash.
7
Blue Dolphin Energy Company & Subsidiaries
Notes to Consolidated Financial Statements (Unaudited) - continued
Although these commodity futures contracts are not subject to hedge accounting treatment under FASB ASC guidance, we record the fair value of these Genesis hedges in our consolidated balance sheet each financial reporting period because of contractual arrangements with Genesis under which we are effectively exposed to the potential gains or losses. We recognize all commodity hedge positions as either current assets or current liabilities in our consolidated balance sheets and those instruments are measured at fair value. Changes in the fair value from financial reporting period to financial reporting period are recognized in our consolidated statement of operations. Net gains or losses associated with these transactions are recognized within cost of refined products sold in our consolidated statements of operations using mark-to-market accounting.
See “Note (18) Fair Value Measurement” and “Note (19) Refined Petroleum Products Inventory Risk Management” of this report for additional disclosures related to derivatives.
Property and Equipment
Refinery and Facilities
Additions to refinery and facilities are capitalized. Expenditures for repairs and maintenance, including maintenance turnarounds, are expensed as incurred and are included as operating expenses under the Operating Agreement (see “Note (9) Accounts Payable Related Party” of this report for additional disclosures related to the Operating Agreement). Management expects to continue making improvements to the Nixon Facility based on technological advances.
Refinery and facilities are carried at cost. Adjustment of the asset and the related accumulated depreciation accounts are made for refinery and facilities’ retirements and disposals, with the resulting gain or loss included in the statements of operations. For financial reporting purposes, depreciation of refinery and facilities is computed using the straight-line method using an estimated useful life of 25 years beginning when the refinery and facilities are placed in service. We did not record any impairment of our refinery and facilities for the three months ended March 31, 2015 and 2014.
Oil and Gas Properties
We account for our oil and gas properties using the full-cost method of accounting, whereby all costs associated with acquisition, exploration and development of oil and gas properties, including directly related internal costs, are capitalized on a cost center basis. Amortization of such costs and estimated future development costs are determined using the unit-of-production method. Our oil and gas properties had no production during the three months ended March 31, 2015 and 2014. All leases associated with our oil and gas properties have expired.
Pipelines and Facilities
We record pipelines and facilities at the lower of cost or net realizable value. Depreciation is computed using the straight-line method over estimated useful lives ranging from 10 to 22 years. In accordance with FASB ASC guidance on accounting for the impairment or disposal of long-lived assets, assets are grouped and evaluated for impairment based on the ability to identify separate cash flows generated therefrom.
Construction in Progress
Construction in progress expenditures related to refurbishment activities at the Nixon Facility are capitalized as incurred. Depreciation begins once the asset is placed in service.
See “Note (8) Property, Plant and Equipment, Net” of this report for additional disclosures related to our refinery and facilities, oil and gas properties, pipelines and facilities, and construction in progress.
Intangibles – Other
We have an acquisition-related intangible asset consisting of the Blue Dolphin trade name in the amount of $303,346. We have determined our trade name to have an indefinite useful life. We account for other intangible assets under FASB ASC guidance related to intangibles, goodwill and other. Under the guidance, we test intangible assets with indefinite lives annually for impairment. Management performed its regular annual impairment testing of trade name in the fourth quarter of 2014. Upon completion of that testing, we determined that no impairment was necessary as of December 31, 2014.
8
Blue Dolphin Energy Company & Subsidiaries
Notes to Consolidated Financial Statements (Unaudited) - continued
Debt Issue Costs
We have debt issue costs related to certain facilities debt. Debt issue costs are capitalized and amortized over the term of the related debt using the straight-line method, which approximates the effective interest method. When a loan is paid in full, any unamortized financing costs are removed from the related accounts and charged to operations. Debt issue costs, net of accumulated amortization, totaled $500,122 and $479,737 at March 31, 2015 and December 31, 2014, respectively. Accumulated amortization was $219,693 and $211,244 at March 31, 2015 and December 31, 2014, respectively. Amortization expense, which is included in interest expense, was $8,450 for the three months ended March 31, 2015 and 2014. See “Note (12) Long-Term Debt” of this report for additional disclosures related to the Refinery Note.
Revenue Recognition
Refined Petroleum Products Revenue
We sell various refined petroleum products including jet fuel, naphtha, distillates and atmospheric gas oil (“AGO”). Revenue from refined petroleum products sales is recognized when title passes. Title passage occurs when refined petroleum products are sold or delivered in accordance with the terms of the respective sales agreements. Revenue is recognized when sales prices are fixed or determinable and collectability is reasonably assured.
Customers assume the risk of loss when title is transferred. Transportation, shipping and handling costs incurred are included in cost of refined products sold. Excise and other taxes that are collected from customers and remitted to governmental authorities are not included in revenue.
Tank Rental Revenue
Tank rental fees are invoiced monthly in accordance with the terms of the related lease agreement and recognized in revenue as earned.
Easement Revenue
Land easement revenue is recognized monthly as earned and is included in other income.
Pipeline Transportation Revenue
Revenue from our pipeline operations is derived from fee-based contracts and is typically based on transportation fees per unit of volume transported multiplied by the volume delivered. Revenue is recognized when volumes have been physically delivered for the customer through the pipeline.
Deferred Revenue
On February 5, 2014, WBI Energy Midstream, LLC , a Colorado limited liability company (“WBI”), and BDPL entered into an Asset Sale Agreement (the “Purchase Agreement”) whereby BDPL reacquired WBI’s 1/6th interest in the Blue Dolphin Pipeline System, the Galveston Area Block 350 Pipeline and the Omega Pipeline (the “Pipeline Assets”) effective October 31, 2013. Pursuant to the Purchase Agreement, WBI paid BDPL $100,000 in cash, and a surety company $850,000 in cash as collateral for supplemental pipeline bonds for the benefit of BDPL in exchange for the payment and discharge of any and all payables, claims, and obligations related to the Pipeline Assets. We recorded the amount received for BDPL’s benefit for the supplemental pipeline bonds as deferred revenue. The deferred revenue is being recognized on a straight-line basis through December 31, 2018, the expected retirement date of the assets that the supplemental pipeline bonds secure.
Income Taxes
We account for income taxes under FASB ASC guidance related to income taxes, which requires recognition of income taxes based on amounts payable with respect to the current year and the effects of deferred taxes for the expected future tax consequences of events that have been included in our financial statements or tax returns. Under this method, deferred tax assets and liabilities are determined based on the differences between the financial accounting and tax basis of assets and liabilities, as well as for operating losses and tax credit carryforwards using enacted tax rates in effect for the year in which the differences are expected to reverse.
As of each reporting date, management considers new evidence, both positive and negative, to determine the realizability of deferred tax assets. Management considers whether it is more likely than not that some portion or all of the deferred tax assets will be realized, which is dependent upon the generation of future taxable income prior to the expiration of any net operating loss (“NOL”) carryforwards. When management determines that it is more likely than not that a tax benefit will not be realized, a valuation allowance is recorded to reduce deferred tax assets.
9
Blue Dolphin Energy Company & Subsidiaries
Notes to Consolidated Financial Statements (Unaudited) - continued
The guidance also prescribes a recognition threshold and measurement attribute for the financial statement recognition and measurement of a tax position taken or expected to be taken in a tax return, as well as guidance on derecognition, classification, interest and penalties, accounting in interim periods, disclosures and transition.
See “Note (16) Income Taxes” of this report for further information related to income taxes.
Impairment or Disposal of Long-Lived Assets
In accordance with FASB ASC guidance on accounting for the impairment or disposal of long-lived assets, we initiate a review of our long-lived assets for impairment whenever events or changes in circumstances indicate that the carrying amount of a long-lived asset may not be recoverable. Recoverability of an asset is measured by comparing its carrying amount to the expected future undiscounted cash flows expected to result from the use and eventual disposition of that asset, excluding future interest costs that would be recognized as an expense when incurred. Any impairment to be recognized is measured by the amount by which the carrying amount of the asset exceeds its fair market value. Significant management judgment is required in the forecasting of future operating results that are used in the preparation of projected cash flows and, should different conditions prevail or judgments be made, material impairment charges could be necessary.
Asset Retirement Obligations
FASB ASC guidance related to asset retirement obligations (“AROs”) requires that a liability for the discounted fair value of an ARO be recorded in the period in which it is incurred and the corresponding cost capitalized by increasing the carrying amount of the related long-lived asset. The liability is accreted towards its future value each period, and the capitalized cost is depreciated over the useful life of the related asset. If the liability is settled for an amount other than the recorded amount, a gain or loss is recognized.
Management has concluded that there is no legal or contractual obligation to dismantle or remove the refinery and facilities. Further, management believes that these assets have indeterminate lives under FASB ASC guidance for estimating AROs because dates or ranges of dates upon which we would retire these assets cannot reasonably be estimated at this time. When a date or range of dates can reasonably be estimated for the retirement of these assets, we will estimate the cost of performing the retirement activities and record a liability for the fair value of that cost using present value techniques.
We recorded an ARO liability related to future asset retirement costs associated with dismantling, relocating or disposing of our offshore platform, pipeline systems and related onshore facilities, as well as plugging and abandonment of wells and land and sea bed restoration costs. We developed these cost estimates for each of our assets based upon regulatory requirements, platform structure, water depth, reservoir characteristics, reservoir depth, equipment market demand, current procedures and construction and engineering consultations. Because these costs typically extend many years into the future, estimating future costs are difficult and require management to make judgments that are subject to future revisions based upon numerous factors, including changing technology, political and regulatory environments. We review our assumptions and estimates of future abandonment costs on an annual basis.
See “Note (11) Asset Retirement Obligations” of this report for additional information related to our AROs.
Computation of Earnings Per Share
We apply the provisions of FASB ASC guidance for computing earnings per share (“EPS”). The guidance requires the presentation of basic EPS, which excludes dilution and is computed by dividing net income available to common stockholders by the weighted-average number of shares of common stock outstanding for the period. The guidance requires dual presentation of basic EPS and diluted EPS on the face of our audited consolidated statements of operations and requires a reconciliation of the numerators and denominators of basic EPS and diluted EPS. Diluted EPS is computed by dividing net income available to common stockholders by the diluted weighted average number of common shares outstanding, which includes the potential dilution that could occur if securities or other contracts to issue shares of common stock were converted to common stock that then shared in the earnings of the entity.
10
Blue Dolphin Energy Company & Subsidiaries
Notes to Consolidated Financial Statements (Unaudited) - continued
The number of shares related to options, warrants, restricted stock and similar instruments included in diluted EPS is based on the “Treasury Stock Method” prescribed in FASB ASC guidance for computation of EPS. This method assumes theoretical repurchase of shares using proceeds of the respective stock option or warrant exercised, and for restricted stock the amount of compensation cost attributed to future services which has not yet been recognized and the amount of current and deferred tax benefit, if any, that would be credited to additional paid-in-capital upon the vesting of the restricted stock, at a price equal to the issuer’s average stock price during the related earnings period. Accordingly, the number of shares includable in the calculation of EPS in respect of the stock options, warrants, restricted stock and similar instruments is dependent on this average stock price and will increase as the average stock price increases. See “Note (17) Earnings Per Share” for additional information related to EPS.
Stock-Based Compensation
In accordance with FASB ASC guidance for stock-based compensation, share-based payments to personnel, including grants of restricted stock units, are measured at fair value as of the date of grant and are expensed in our consolidated statements of operations over the service period (generally the vesting period).
Treasury Stock
We account for treasury stock under the cost method. When treasury stock is re-issued, the net change in share price subsequent to acquisition of the treasury stock is recognized as a component of additional paid-in-capital in our consolidated balance sheets. See “Note (13) Treasury Stock” for additional disclosures related to treasury stock.
Reclassification
We have reclassified certain insignificant prior period amounts related to our tank rental revenue to conform to our 2015 presentation.
New Pronouncements Issued but Not Yet Effective
In May 2014, FASB issued Accounting Standards Update (“ASU”) 2014-09, Revenue from Contracts with Customers (“ASU 2014-09”). ASU 2014-09 outlines a new, single comprehensive model for entities to use in accounting for revenue arising from contracts with customers and supersedes most current revenue recognition guidance, including industry-specific guidance. This new revenue recognition model provides a five-step analysis in determining when and how revenue is recognized. The new model will require revenue recognition to depict the transfer of promised goods or services to customers in an amount that reflects the consideration a company expects to receive in exchange for those goods or services. ASU 2014-09 is currently effective for reporting periods beginning after December 15, 2016, and early adoption is not permitted.
On April 1, 2015, FASB voted to propose a delay in the effective date of ASU 2014-09. As proposed, the new effective date would be annual reporting periods beginning after December 15, 2017, and the interim periods within that year. As such, for a public business entity with a calendar year-end, ASU 2014-09 would be effective on January 1, 2018, for both its interim and annual reporting periods. This proposal represents a one-year deferral from the original effective date. The proposed new effective date guidance would allow early adoption for all entities as of the original effective date (December 15, 2016). We are evaluating the impact that adoption of this guidance will have on the determination or reporting of our financial results.
In April 2015, FASB issued ASU 2015-03, Interest - Imputation of Interest: Simplifying the Presentation of Debt Issuance Costs ("ASU 2015-03"). ASU 2015-03 requires debt issuance costs related to a recognized debt liability to be presented in the balance sheet as a direct deduction from the carrying value of that debt liability, consistent with debt discounts. The recognition and measurement guidance for debt issuance costs are not affected by ASU 2015-03. The amendments in this ASU are effective retrospectively for fiscal years, and interim periods within those years, beginning after December 15, 2015. Early adoption is permitted. We are evaluating the impact that adoption of this guidance will have on our consolidated balance sheets.
11
Blue Dolphin Energy Company & Subsidiaries
Notes to Consolidated Financial Statements (Unaudited) - continued
(4) Business Segment Information
We have two reportable business segments: (i) “Refinery Operations” and (ii) “Pipeline Transportation.” Business activities related to our “Refinery Operations” business segment are conducted at the Nixon Facility. Business activities related to our “Pipeline Transportation” business segment are primarily conducted in the Gulf of Mexico through our Pipeline Assets and leasehold interests in oil and gas properties. Our “Pipeline Transportation” business segment is considered non-core to our business.
Business segment information for the three months ended March 31, 2015 and 2014 (and at March 31, 2015 and 2014), was as follows:
|
Three Months Ended March 31, 2015
|
Three Months Ended March 31, 2014
|
|||||||||||||||||||||||||||||||
|
Segment
|
Segment
|
|||||||||||||||||||||||||||||||
|
Refinery
|
Pipeline
|
Corporate &
|
Refinery
|
Pipeline
|
Corporate &
|
|||||||||||||||||||||||||||
|
Operations
|
Transportation
|
Other
|
Total
|
Operations
|
Transportation
|
Other
|
Total
|
|||||||||||||||||||||||||
|
Revenue from operations
|
$ | 61,353,954 | $ | 38,395 | $ | - | $ | 61,392,349 | $ | 120,658,667 | $ | 54,031 | $ | - | $ | 120,712,698 | ||||||||||||||||
|
Less: cost of operations(1)
|
(52,259,470 | ) | (53,912 | ) | (408,048 | ) | (52,721,430 | ) | (113,368,578 | ) | (122,510 | ) | (334,729 | ) | (113,825,817 | ) | ||||||||||||||||
|
Other non-interest income
|
- | 62,500 | - | 62,500 | - | 125,000 | - | 125,000 | ||||||||||||||||||||||||
|
Adjusted EBITDA
|
9,094,484 | 46,983 | (408,048 | ) | 8,733,419 | 7,290,089 | 56,521 | (334,729 | ) | 7,011,881 | ||||||||||||||||||||||
|
Less: JMA Profit Share(2)
|
(2,438,637 | ) | - | - | (2,438,637 | ) | - | - | - | - | ||||||||||||||||||||||
|
EBITDA
|
$ | 6,655,847 | $ | 46,983 | $ | (408,048 | ) | $ | 7,290,089 | $ | 56,521 | $ | (334,729 | ) | ||||||||||||||||||
|
Depletion, depreciation and amortization
|
(399,231 | ) | (390,605 | ) | ||||||||||||||||||||||||||||
|
Interest expense, net
|
(204,569 | ) | (224,580 | ) | ||||||||||||||||||||||||||||
|
Income before income taxes
|
$ | 5,690,982 | $ | 6,396,696 | ||||||||||||||||||||||||||||
|
Capital expenditures
|
$ | 1,291,915 | $ | - | $ | - | $ | 1,291,915 | $ | 59,178 | $ | - | $ | - | $ | 59,178 | ||||||||||||||||
|
Identifiable assets(3)
|
$ | 53,861,592 | $ | 2,923,368 | $ | 4,355,252 | $ | 61,140,212 | $ | 50,797,212 | $ | 3,201,220 | $ | 530,368 | $ | 54,528,800 | ||||||||||||||||
|
(1)
|
Operation cost within the “Refinery Operations” and “Pipeline Transportation” segments includes related general, administrative, and accretion expenses. Operation cost within “Corporate and Other” includes general and administrative expenses associated with corporate maintenance costs, such as accounting fees, director fees and legal expense.
|
|
(2)
|
The Joint Marketing Agreement profit share (the “JMA Profit Share”) represents the GEL Profit Share plus the Performance Fee for the period pursuant to the Joint Marketing Agreement. See “Part 1, Item 1 - Note (20) Commitments and Contingencies” and “Part 1, Item 2. Management’s Discussion and Analysis and Results of Operations – Relationship with Genesis” of this report for further discussion of the Joint Marketing Agreement.
|
|
(3)
|
Identifiable assets contain related legal obligations of each business segment including cash, accounts receivable and recorded net assets.
|
(5) Prepaid Expenses and Other Current Assets
Prepaid expenses and other current assets consisted of the following:
|
March 31,
|
December 31,
|
|||||||
|
2015
|
2014
|
|||||||
|
Prepaid insurance
|
$ | 109,514 | $ | 156,558 | ||||
|
Prepaid listing fees
|
11,250 | 15,000 | ||||||
|
Prepaid professional fees
|
- | 104,000 | ||||||
|
Unrealized hedging gains
|
- | 495,900 | ||||||
| $ | 120,764 | $ | 771,458 | |||||
12
Blue Dolphin Energy Company & Subsidiaries
Notes to Consolidated Financial Statements (Unaudited) - continued
(6) Deposits
Deposits consisted of the following:
|
March 31,
|
December 31,
|
|||||||
|
2015
|
2014
|
|||||||
|
Equipment deposits
|
$ | 100,463 | $ | 48,785 | ||||
|
Utility deposits
|
10,250 | 10,250 | ||||||
|
Rent deposits
|
9,463 | 9,463 | ||||||
| $ | 120,176 | $ | 68,498 | |||||
(7) Inventory
Inventory consisted of the following:
|
March 31,
|
December 31,
|
|||||||
|
2015
|
2014
|
|||||||
|
Jet fuel
|
$ | 1,859,729 | $ | 2,631,546 | ||||
|
Naphtha
|
476,767 | 194,688 | ||||||
|
AGO
|
453,098 | 224,007 | ||||||
|
HOBM
|
252,657 | 124,176 | ||||||
|
Crude
|
19,041 | 19,041 | ||||||
|
LPG mix
|
9,418 | 7,193 | ||||||
| $ | 3,070,710 | $ | 3,200,651 | |||||
(8) Property, Plant and Equipment, Net
Property, plant and equipment, net, consisted of the following:
|
March 31,
|
December 31,
|
|||||||
|
2015
|
2014
|
|||||||
|
Refinery and facilities
|
$ | 36,547,078 | $ | 36,462,451 | ||||
|
Pipelines and facilities
|
2,127,207 | 2,127,207 | ||||||
|
Onshore separation and handling facilities
|
325,435 | 325,435 | ||||||
|
Land
|
602,938 | 602,938 | ||||||
|
Other property and equipment
|
627,479 | 597,064 | ||||||
| 40,230,137 | 40,115,095 | |||||||
|
Less: Accumulated depletion, depreciation and amortization
|
(4,985,806 | ) | (4,586,575 | ) | ||||
| 35,244,331 | 35,528,520 | |||||||
|
Construction in progress
|
3,019,428 | 1,842,555 | ||||||
| $ | 38,263,759 | $ | 37,371,075 | |||||
13
Blue Dolphin Energy Company & Subsidiaries
Notes to Consolidated Financial Statements (Unaudited) - continued
(9) Accounts Payable, Related Party
LEH, our controlling shareholder, owns approximately 81% of Common Stock. Jonathan P. Carroll, Chairman of the Board, Chief Executive Officer, and President of Blue Dolphin, is the majority owner of LEH. LEH manages and operates all of our subsidiaries and all of our assets, including the Nixon Facility, (the “Services”) pursuant to the Operating Agreement.
With respect to the Nixon Facility, the Operating Agreement covers all refinery operating expenses with the exception of capital expenditures. Pursuant to the Operating Agreement, for management and operation of the Nixon Facility LEH receives as compensation: (i) weekly payments from GEL TEX Marketing, LLC (“GEL”) not to exceed $750,000 per month, (ii) reimbursement for certain accounting costs related to the preparation of financial statements of LE not to exceed $50,000 per month, (iii) $0.25 for each barrel processed at the Nixon Facility during the term of the Operating Agreement, up to a maximum quantity of 10,000 barrels per day determined on a monthly basis, and (iv) $2.50 for each barrel processed at the Nixon Facility in excess of 10,000 barrels per day during the term of the Operating Agreement, determined on a monthly basis. For all other assets, LEH is reimbursed at cost for all reasonable expenses incurred while performing the Services. All compensation owed to LEH under the Operating Agreement is to be paid at the end of each calendar month.
Aggregate amounts expensed for Services at the Nixon Facility for the three months ended March 31, 2015 and 2014 were $2,880,971 (approximately $2.71 per barrel of throughput) and $2,955,019 (approximately $2.71 per barrel of throughput), respectively.
The amounts outstanding to LEH to fund our working capital requirements were $119,645 and $1,174,168 at March 31, 2015 and December 31, 2014, respectively, and are reflected in accounts payable, related party in our consolidated balance sheets.
The Operating Agreement expires upon the earliest to occur of: (a) the date of the termination of the Joint Marketing Agreement pursuant to its terms, (b) August 12, 2015, or (c) upon written notice of either party to the Operating Agreement of a material breach of the Operating Agreement by the other party.
(10) Accrued Expenses and Other Current Liabilities
Accrued expenses and other current liabilities consisted of the following:
|
March 31,
|
December 31,
|
|||||||
|
2015
|
2014
|
|||||||
|
Excise and income taxes payable
|
$ | 1,384,689 | $ | 1,228,411 | ||||
|
Genesis JMA Profit Share payable
|
1,149,605 | 521,739 | ||||||
|
Transportation and inspection
|
430,000 | 190,000 | ||||||
|
Board of director fees payable
|
368,750 | 345,000 | ||||||
|
Unearned revenue
|
220,631 | 252,500 | ||||||
|
Other payable
|
103,580 | 149,962 | ||||||
|
Insurance
|
64,062 | 96,092 | ||||||
|
Unrealized hedging loss
|
52,290 | - | ||||||
| $ | 3,773,607 | $ | 2,783,704 | |||||
(11) Asset Retirement Obligations
Refinery and Facilities
Management has concluded that there is no legal or contractual obligation to dismantle or remove the refinery and facilities. Management believes that the refinery and facilities have indeterminate lives under FASB ASC guidance for estimating AROs because dates or ranges of dates upon which we would retire these assets cannot reasonably be estimated at this time. When a date or range of dates can reasonably be estimated for the retirement of these assets, we will estimate the cost of performing the retirement activities and record a liability for the fair value of that cost using present value techniques.
14
Blue Dolphin Energy Company & Subsidiaries
Notes to Consolidated Financial Statements (Unaudited) - continued
Pipelines and Facilities and Oil and Gas Properties
We have AROs associated with the dismantlement and abandonment in place of our pipelines and facilities, as well as the plugging and abandonment of our oil and gas properties. We recorded a discounted liability for the fair value an ARO with a corresponding increase to the carrying value of the related long-lived asset at the time the asset was installed or placed in service. We amortize the amount added to property and equipment and recognize accretion expense in connection with the discounted liability over the remaining life of the asset.
For the three months ended March 31, 2015 and 2014, we did not incur any abandonment expense related to our oil and gas properties. Plugging and abandonment costs for oil and gas properties and pipelines are recorded as information becomes available from operators to substantiate actual and/or probable costs.
AROs on a roll-forward basis were as follows:
|
March 31,
|
December 31,
|
|||||||
|
2015
|
2014
|
|||||||
|
Asset retirement obligations, at the beginning of the period
|
$ | 1,866,770 | $ | 1,597,661 | ||||
|
New asset retirement obligations and adjustments
|
49 | 300,980 | ||||||
|
Liabilities settled
|
- | (243,866 | ) | |||||
|
Accretion expense
|
53,215 | 211,995 | ||||||
| 1,920,034 | 1,866,770 | |||||||
|
Less: current portion of asset retirement obligations
|
(86,341 | ) | (85,846 | ) | ||||
|
Long-term asset retirement obligations, at the end of the period
|
$ | 1,833,693 | $ | 1,780,924 | ||||
The WBI transaction resulted in a $300,980 increase in our AROs related to the Pipeline Assets, which represents the fair value of the liability, and increased accretion expense throughout the remaining useful life of certain of the Pipeline Assets. For additional information related to the WBI Transaction, see “Note (3) Significant Accounting Policies – Revenue Recognition – Deferred Revenue” and “Note (20) Commitments and Contingencies – Supplemental Pipeline Bonds” of this report.
(12) Long-Term Debt
Long-term debt consisted of the following:
|
March 31,
|
December 31,
|
|||||||
|
2015
|
2014
|
|||||||
|
Refinery Note
|
$ | 8,545,466 | $ | 8,648,980 | ||||
|
Sovereign Loan
|
1,479,949 | 1,638,898 | ||||||
|
Notre Dame Debt
|
1,300,000 | 1,300,000 | ||||||
|
Capital Leases
|
428,759 | 466,401 | ||||||
| 11,754,174 | 12,054,279 | |||||||
|
Less: current portion of long-term debt
|
(1,263,057 | ) | (1,245,476 | ) | ||||
| $ | 10,491,117 | $ | 10,808,803 | |||||
15
Blue Dolphin Energy Company & Subsidiaries
Notes to Consolidated Financial Statements (Unaudited) - continued
Refinery Note
The Refinery Note accrues interest at a rate of U.S. Prime Rate plus 2.25% (effective rate of 5.50% at March 31, 2015) and has a maturity date of October 1, 2028 (the “Maturity Date”). LE’s obligations under the Refinery Note are secured by a Deed of Trust (“Deed of Trust”) of even date with the Refinery Note. The Refinery Note is further secured by a Security Agreement (the “Security Agreement” and, together with the Refinery Note and Deed of Trust, the “Refinery Loan Documents”) also of even date with the Refinery Note, which Security Agreement covers various items of collateral including a first lien on the Nixon Facility and general assets of LE. The principal balance outstanding on the Refinery Note was $8,545,466 and $8,648,980 at March 31, 2015 and December 31, 2014, respectively. Interest was accrued on the Refinery Note in the amount of $35,997 and $47,569 at March 31, 2015 and December 31, 2014, respectively.
The Refinery Note has debt-to-worth and current ratio financial maintenance covenants (the “Financial Maintenance Covenants”). As of March 31, 2015 and the date of filing this report, we were in compliance with the Financial Maintenance Covenants in the Refinery Note. As of March 31, 2014, we were in violation of the current ratio covenant in the Refinery Note. However, AFNB agreed to waive certain of the Financial Maintenance Covenants under the Refinery Note in a letter agreement effective December 31, 2013.
On September 1, 2013, AFNB and LE amended the Refinery Note (the “Note Modification Agreement”). Pursuant to the Note Modification Agreement, the monthly principal and interest payment due under the Refinery Note is $75,310. Other than modification of the payment terms under the Refinery Note, the terms of the Refinery Note remain the same through the Maturity Date and the Refinery Loan Documents remain in full force and effect.
Sovereign Loan
LRM entered into a loan and security agreement with Sovereign Bank, a Texas state bank (“Sovereign”), on May 2, 2014, for a term loan facility in the principal amount of $2.0 million (the “Sovereign Loan”). The proceeds of the Sovereign Loan are being used primarily to finance costs associated with refurbishment of the Nixon Facility’s naphtha stabilizer and depropanizer units. The Sovereign Loan is: (i) subject to a financial maintenance covenant pertaining to debt service coverage ratio, (ii) secured by the assignment of certain leases of LRM, certain assets of LEH, our controlling shareholder and an affiliated entity, and (iii) guaranteed by Jonathan P. Carroll, Chairman of the Board, Chief Executive Officer, and President of Blue Dolphin and majority owner of LEH and an affiliated entity. The principal balance outstanding on the Sovereign Loan was $1,479,949 and $1,638,898 at March 31, 2015 and December 31, 2014, respectively. Interest was accrued on the Sovereign Loan in the amount of $7,649 and $8,470 at March 31, 2015 and December 31, 2014, respectively.
On March 25, 2015, Sovereign and LRM amended the Sovereign Loan pursuant to a Loan Modification Agreement (the “Loan Modification Agreement”). Under the Loan Modification Agreement, the interest rate on the Sovereign Loan was modified to be the greater of the U.S. Prime Rate plus 2.75% or 6.00%. In addition, the maturity date of the Sovereign Loan was extended to March 25, 2017. Pursuant to the Loan Modification Agreement, the monthly payment due under the Sovereign Loan is $61,665 plus interest.
Notre Dame Debt
LE entered into a loan with Notre Dame Investors, Inc. as evidenced by that certain promissory note in the original principal amount of $8.0 million, which is currently held by John Kissick (the “Notre Dame Debt”). The Notre Dame Debt accrues interest at a rate of 16.00% and is secured by a Deed of Trust, Security Agreement and Financing Statements (the “Subordinated Deed of Trust”), which encumbers the Nixon Facility and general assets of LE. The principal balance outstanding on the Notre Dame Debt was $1,300,000 at March 31, 2015 and December 31, 2014. Interest was accrued on the Notre Dame Debt in the amount of $1,326,080 and $1,274,789 at March 31, 2015 and December 31, 2014, respectively. There are no financial maintenance covenants associated with the Notre Dame Debt. The maturity date of the Notre Dame Debt is July 1, 2016.
Pursuant to Intercreditor and Subordination Agreements dated September 29, 2008 and August 12, 2011, the holder of the Notre Dame Debt and Subordinated Deed of Trust agreed to subordinate its interest and liens on the Nixon Facility and general assets of LE in favor of the holder of the Refinery Note, the Deed of Trust and Security Agreement and Milam Services, Inc. (“Milam”), an affiliate of Genesis, under the Construction and Funding Agreement, respectively.
16
Blue Dolphin Energy Company & Subsidiaries
Notes to Consolidated Financial Statements (Unaudited) - continued
Capital Leases
Long-term capital lease obligations totaled $428,759 and $466,401 at March 31, 2015 and December 31, 2014, respectively. The following is a summary of equipment held under long-term capital leases:
|
March 31,
|
December 31,
|
|||||||
|
2015
|
2014
|
|||||||
|
Cost
|
$ | 538,598 | $ | 538,598 | ||||
|
Less: accumulated depreciation
|
- | - | ||||||
| $ | 538,598 | $ | 538,598 | |||||
On August 7, 2014, we entered into a 36 month “build-to-suit” capital lease for the purchase of new boiler equipment for the Nixon Facility. The cost of the equipment was added to construction in progress. Once the equipment is placed in service, it will be reclassified to refinery and facilities and depreciation will begin. The equipment was delivered in December 2014. The long-term capital lease obligation requires a quarterly payment in the amount of $42,996.
(13) Treasury Stock
At March 31, 2015 and December 31, 2014, we had 150,000 shares of treasury stock.
(14) Concentration of Risk
Key Supplier
Under the Crude Oil and Supply Throughput Services Agreement by and between LE and GEL dated August 12, 2011 (the “Crude Supply Agreement”), GEL is the exclusive supplier of crude oil and condensate to the Nixon Facility. We have the ability to purchase crude oil and condensate from other suppliers with the prior consent of GEL. The initial term was to expire on August 12, 2014. However, on October 30, 2013, LE entered into a Letter Agreement Regarding Certain Advances and Related Agreements with GEL and Milam (the “October 2013 Letter Agreement”), effective October 24, 2013. In accordance with the terms of the October 2013 Letter Agreement, LE agreed not to terminate the Crude Supply Agreement and GEL agreed to automatically renew the Crude Supply Agreement at the end of the initial term for successive one year periods until August 12, 2019, unless sooner terminated by GEL with 180 days prior written notice.
Significant Customers
For the three months ended March 31, 2015, we had 3 customers that accounted for approximately 67% of our refined petroleum products sales. These 3 customers represented approximately $4.1 million in accounts receivable at March 31, 2015. For the three months ended March 31, 2014, we had 4 customers that accounted for approximately 87% of our refined petroleum products sales. These 4 customers represented approximately $7.4 million in accounts receivable at March 31, 2014.
Remainder of Page Intentionally Left Blank
17
Blue Dolphin Energy Company & Subsidiaries
Notes to Consolidated Financial Statements (Unaudited) - continued
Refined Petroleum Product Sales
All of our refined petroleum products are currently sold in the United States. The following table summarizes total refined petroleum product sales by distillation (from light to heavy):
|
Three Months Ended March 31,
|
||||||||||||||||
|
2015
|
2014
|
|||||||||||||||
|
LPG mix
|
$ | 57,308 | 0.0 | % | $ | 156,525 | 0.1 | % | ||||||||
|
Naphtha
|
13,416,199 | 22.0 | % | 28,770,998 | 23.9 | % | ||||||||||
|
Jet fuel
|
16,519,503 | 27.1 | % | 20,034,991 | 16.7 | % | ||||||||||
|
NRLM
|
- | 0.0 | % | 38,767,393 | 32.2 | % | ||||||||||
|
HOBM
|
17,409,079 | 28.5 | % | - | 0.0 | % | ||||||||||
|
AGO
|
13,664,973 | 22.4 | % | 32,646,244 | 27.1 | % | ||||||||||
| $ | 61,067,062 | 100.0 | % | $ | 120,376,151 | 100.0 | % | |||||||||
On May 31, 2014, the Nixon Facility ceased production of NRLM, a transportation-related diesel fuel product. On June 1, 2014, the Nixon Facility began producing heavy oil-based mud blendstock (“HOBM”), a non-transportation lubricant blend product. The shift in product slate from NRLM to HOBM was the result of the Environmental Protection Agency’s (the “EPA’s”) phased-in requirements for small refineries to reduce the sulfur content in transportation-related diesel fuel, such as NRLM, to a maximum of 15 ppm sulfur by June 1, 2014. “Topping units,” like the Nixon Facility, typically lack a desulfurization process unit to lower sulfur content levels within the range required by the EPA’s recently implemented fuel quality standards, and integration of such a unit generally requires additional permitting and significant capital upgrades. The Nixon Facility can produce and sell higher ppm sulfur diesel as a feedstock to other refineries and blenders in the United States and as a finished petroleum product to other countries.
(15) Leases
Our company headquarters is located in downtown Houston, Harris County, Texas. We lease 13,878 square feet of office space, 7,389 square feet of which is used and paid for by LEH. The office lease has a 10 year term expiring in 2017, includes free rent periods and escalating rent payment provisions, and requires payment of a portion of related actual operating expenses. Rent expense is recognized on a straight-line basis. For the three months ended March 31, 2015 and 2014, rent expense totaled $25,829.
(16) Income Taxes
Income Tax Expense
Our income tax expense consisted of the following:
|
Three Months Ended March 31,
|
||||||||
|
2015
|
2014
|
|||||||
|
Current:
|
||||||||
|
Federal
|
$ | (99,281 | ) | $ | (120,552 | ) | ||
|
State
|
(82,853 | ) | (81,871 | ) | ||||
|
Deferred:
|
||||||||
|
Federal
|
(1,807,484 | ) | - | |||||
|
State
|
- | - | ||||||
| $ | (1,989,618 | ) | $ | (202,423 | ) | |||
The state of Texas has a Texas margins tax (“TMT”), which is a form of business tax imposed on gross margin to replace the state’s prior franchise tax structure. Although TMT is imposed on an entity’s gross margin rather than on its net income, certain aspects of TMT make it similar to an income tax.
18
Blue Dolphin Energy Company & Subsidiaries
Notes to Consolidated Financial Statements (Unaudited) - continued
Deferred Income Taxes
Blue Dolphin acquired 100% of the issued and outstanding membership interests of LE in 2012. As a limited liability company, LE’s taxable income or loss flowed through to its sole member for federal and state income tax purposes prior to the transaction. However, because Blue Dolphin is a “C” corporation, LE’s taxable income or loss now flows through to Blue Dolphin for federal and state income tax purposes.
Under Section 382 of the Internal Revenue Code of 1986, as amended (“IRC Section 382”), a corporation that undergoes an “ownership change” is subject to limitations on its use of pre-change NOL carryforwards to offset future taxable income. Within the meaning of IRC Section 382, an “ownership change” occurs when the aggregate stock ownership of certain stockholders (generally 5% shareholders, applying certain look-through rules) increases by more than 50 percentage points over such stockholders' lowest percentage ownership during the testing period (generally three years). In general, the annual use limitation equals the aggregate value of common stock at the time of the ownership change multiplied by a specified tax-exempt interest rate. Blue Dolphin experienced ownership changes in 2005 in connection with a series of private placements, and in 2012 as a result of the LE transaction. The 2012 ownership change will subject NOL carryforwards to an annual use limitation, which will significantly reduce Blue Dolphin’s ability to use them to offset taxable income in periods following the 2012 ownership change. The amount of NOLs subject to such limitations is approximately $18.7 million. As a result of the limitation under IRC Section 382, the annual use limitation is $638,196 per year, the effect of which will result in approximately $6.7 million in NOL carryforwards expiring unused.
At March 31, 2015, approximately $4.0 million of net deferred tax asset remains available for future use, reflecting use of approximately $5.4 million of net operationg loss carryforwards through the period. At March 31, 2015, approximately $10.1 million of NOLs generated prior to the 2012 ownership change remain available for future use. At March 31, 2015, approximately $7.4 million of NOLs generated subsequent to the 2012 ownership change remain available for future use and are not subject to an annual use limitation under IRC Section 382.
Deferred income taxes reflect the net tax effect of temporary differences between the carrying amounts of assets and liabilities for financial reporting and income tax purposes. The following table shows significant components of our deferred tax assets and liabilities:
|
March 31,
|
December 31,
|
|||||||
|
2015
|
2014
|
|||||||
|
Deferred tax assets:
|
||||||||
|
Net operating loss and capital loss carryforwards
|
$ | 8,243,342 | $ | 10,067,144 | ||||
|
Start-up costs (Nixon Facility)
|
1,613,702 | 1,648,036 | ||||||
|
Asset retirement obligations liability/deferred revenue
|
873,236 | 869,821 | ||||||
|
AMT credit and other
|
202,282 | 85,098 | ||||||
|
Total deferred tax assets
|
10,932,562 | 12,670,468 | ||||||
|
Deferred tax liabilities:
|
||||||||
|
Fair market value adjustments
|
(46,116 | ) | (46,116 | ) | ||||
|
Unrealized hedges
|
- | (168,606 | ) | |||||
|
Basis differences in property and equipment
|
(4,663,502 | ) | (4,425,318 | ) | ||||
|
Total deferred tax liabilities
|
(4,709,618 | ) | (4,640,040 | ) | ||||
|
Deferred tax assets, net
|
6,222,944 | 8,030,428 | ||||||
|
Valuation allowance
|
(2,270,322 | ) | (2,270,322 | ) | ||||
| $ | 3,952,622 | $ | 5,760,106 | |||||
19
Blue Dolphin Energy Company & Subsidiaries
Notes to Consolidated Financial Statements (Unaudited) - continued
The following table shows our current and noncurrent deferred tax assets (liabilities):
|
March 31,
|
December 31,
|
|||||||
|
2015
|
2014
|
|||||||
|
Current deferred tax assets (liabilities)
|
$ | 17,779 | $ | (168,237 | ) | |||
|
Noncurrent deferred tax assets, net
|
6,205,165 | 8,198,665 | ||||||
|
Deferred tax assets, net
|
6,222,944 | 8,030,428 | ||||||
|
Valuation allowance
|
(2,270,322 | ) | (2,270,322 | ) | ||||
| $ | 3,952,622 | $ | 5,760,106 | |||||
Valuation Allowance
As of each reporting date, management considers new evidence, both positive and negative, that could impact management’s view with regard to future realization of deferred tax assets. As of March 31, 2015 and December 31, 2014, management determined that sufficient positive evidence existed to conclude that it was more likely than not that net deferred tax assets of approximately $3.8 million and $5.7 million, respectively, were realizable, and as a result, reflected a valuation allowance accordingly.
Uncertain Tax Positions
We have adopted the provisions of the ASC guidance on accounting for uncertainty in income taxes. The guidance clarifies the accounting for uncertainty in income taxes recognized in an enterprise’s financial statements. The guidance also prescribes a recognition threshold and measurement attribute for the financial statement recognition and measurement of a tax position taken or expected to be taken in a tax return. The standard also provides guidance on de-recognition, classification, interest and penalties, accounting in interim periods, disclosure and transition.
As part of this guidance, we record income tax related interest and penalties, if applicable, as a component of the provision for income tax expense. However, there were no amounts recognized relating to interest and penalties in the consolidated statements of operations for the three months ended March 31, 2015 and 2014. Furthermore, none of our federal and state income tax returns are currently under examination by the Internal Revenue Service (“IRS”) or state authorities. As of March 31, 2015, fiscal years 2011 and later remain subject to examination by the IRS and fiscal years 2009 and later remain subject to examination by the state of Texas. We believe there are no uncertain tax positions for both federal and state income taxes.
(17) Earnings Per Share
The following table provides reconciliation between basic and diluted income per share:
|
Three Months Ended March 31,
|
||||||||
|
2015
|
2014
|
|||||||
|
Net income
|
$ | 3,701,364 | $ | 6,194,273 | ||||
|
Basic and diluted income per share
|
$ | 0.35 | $ | 0.59 | ||||
|
Basic and Diluted
|
||||||||
|
Weighted average number of shares of common stock
|
||||||||
|
outstanding and potential dilutive shares of common stock
|
10,449,444 | 10,430,973 | ||||||
Diluted EPS is computed by dividing net income available to common stockholders by the weighted average number of shares of common stock outstanding. Diluted EPS for the three months ended March 31, 2015 and 2014 was the same as basic EPS as there were no stock options or other dilutive instruments outstanding.
20
Blue Dolphin Energy Company & Subsidiaries
Notes to Consolidated Financial Statements (Unaudited) - continued
(18) Fair Value Measurement
We are subject to gains or losses on certain financial assets based on our various agreements and understandings with Genesis. Pursuant to these agreements and understandings, Genesis may execute the purchase and sale of certain financial instruments for the purpose of economically hedging certain commodity price risks associated with our refined petroleum products and, over time, this program may also include mitigating certain risks associated with the purchase of crude oil and condensate. These financial instruments are direct contractual obligations of Genesis and not us. However, under our agreement with Genesis, we financially benefit from any gains and financially bear any losses associated with the purchase and/or sale of such financial instruments by Genesis. Because such instruments represent embedded derivatives for the purpose of financial reporting, we account for such embedded derivatives in our financial records by utilizing the market approach when measuring fair value of our financial instruments (typically in current assets and/or liabilities, as discussed below). The market approach uses prices and other relevant information generated by such market transactions executed on our behalf involving identical or comparable assets or liabilities.
The fair value hierarchy consists of the following three levels:
|
Level 1
|
Inputs are quoted prices (unadjusted) in active markets for identical assets or liabilities.
|
|
Level 2
|
Inputs are quoted prices for similar assets or liabilities in an active market, quoted prices for identical or similar assets or liabilities in markets that are not active, inputs other than quoted prices that are observable and market-corroborated inputs, which are derived principally from or corroborated by observable market data.
|
|
Level 3
|
Inputs are derived from valuation techniques in which one or more significant inputs or value drivers are unobservable and cannot be corroborated by market data or other entity-specific inputs.
|
The carrying amounts of accounts receivable, accounts payable and accrued liabilities approximated their fair values at March 31, 2015 and December 31, 2014 due to their short-term maturities. The fair value of our long-term debt and short-term notes payable at March 31, 2015 and December 31, 2014 was $11,754,174 and $12,054,279, respectively. The fair value of our debt was determined using a Level 3 hierarchy.
The following table represents our assets and liabilities measured at fair value on a recurring basis as of March 31, 2015 and December 31, 2014 and the basis for the measurement:
|
Fair Value Measurement at March 31, 2015 Using
|
||||||||||||||||
|
Financial assets (liabilities):
|
Carrying Value at March 31, 2015
|
Quoted Prices in Active Markets for Identical Assets or Liabilities (Level 1) |
Significant Other Observable Inputs (Level 2)
|
Significant Unobservable Inputs (Level 3)
|
||||||||||||
|
Commodity contracts
|
$ | (52,290 | ) | $ | (52,290 | ) | $ | - | $ | - | ||||||
|
Fair Value Measurement at December 31, 2014 Using
|
||||||||||||||||
|
Financial assets (liabilities):
|
Carrying Value at December 31,
2014
|
Quoted Prices in Active Markets for Identical Assets or Liabilities (Level 1) |
Significant Other Observable Inputs (Level 2)
|
Significant Unobservable Inputs (Level 3)
|
||||||||||||
|
Commodity contracts
|
$ | 495,900 | $ | 495,900 | $ | - | $ | - | ||||||||
Carrying amounts of commodity contracts executed by Genesis are reflected as other current assets or other current liabilities in our consolidated balance sheets.
21
Blue Dolphin Energy Company & Subsidiaries
Notes to Consolidated Financial Statements (Unaudited) - continued
(19) Refined Petroleum Products Inventory Risk Management
Under our inventory risk management policy, Genesis may, but is not required to, use commodity futures contracts to mitigate the change in value for certain of our refined petroleum product inventories subject to market price fluctuations in our inventory. The physical inventory volumes are not exchanged, and these contracts are net settled by Genesis with cash.
The fair value of these contracts is reflected in our consolidated balance sheets and the related net gain or loss is recorded within cost of refined products sold in our consolidated statements of operations. Quoted prices for identical assets or liabilities in active markets (Level 1) are considered to determine the fair values for the purpose of marking to market the financial instruments at each period end.
Commodity transactions are executed by Genesis to minimize transaction costs, monitor consolidated net exposures and allow for increased responsiveness to changes in market factors. Genesis may, but is not required to, initiate an economic hedge on our refined petroleum products when our inventory levels exceed targeted levels (currently 1.5 days production). Although the decision to enter into a futures contract is made solely by Genesis, Genesis typically confers with management as part of Genesis’ decision making process.
Due to mark-to-market accounting during the term of the commodity contracts, significant unrealized non-cash net gains and losses could be recorded in our results of operations. Additionally, Genesis may be required to collateralize any mark-to-market losses on outstanding commodity contracts.
As of March 31, 2015, we had the following obligations based on futures contracts of refined petroleum products and crude oil that were entered into as economic hedges through Genesis. The information presents the notional volume of open commodity instruments by type and year of maturity (volumes in barrels):
| Notional Contract Volumes by Year of Maturity | ||||||||||||
|
Inventory positions (futures):
|
2015
|
2016
|
2017
|
|||||||||
|
Refined petroleum products and crude oil - net short positions
|
145,000 | - | - | |||||||||
The following table provides the location and fair value amounts of derivative instruments that are reported in our consolidated balance sheets at March 31, 2015 and December 31, 2014:
|
Fair Value
|
||||||||||
|
March 31,
|
December 31,
|
|||||||||
|
Asset Derivatives
|
Balance Sheets Location
|
2015
|
2014
|
|||||||
|
Commodity contracts
|
Prepaid expenses and other current assets (accrued expenses and other current liabilities)
|
$ | (52,290 | ) | $ | 495,900 | ||||
The following table provides the effect of derivative instruments in our consolidated statements of operations for the three months ended March 31, 2015 and 2014:
|
Gain (Loss) Recognized
|
||||||||||
|
Three Months Ended March 31,
|
||||||||||
|
Derivatives
|
Statements of Operations Location
|
2015 | 2014 | |||||||
|
Commodity contracts
|
Cost of refined petroleum products sold
|
$ | 927,584 | $ | (181,569 | ) | ||||
22
Blue Dolphin Energy Company & Subsidiaries
Notes to Consolidated Financial Statements (Unaudited) - continued
(20) Commitments and Contingencies
Operating Agreement
See “Note (9) Accounts Payable, Related Party” of this report for additional disclosures related to the Operating Agreement.
Genesis Agreements
LE was previously subject to three agreements with Genesis and its affiliates. Under the Construction and Funding Agreement, Milam committed funding for the completion of the Nixon Facility’s refurbishment and start-up operations. Payments under the Construction and Funding Agreement began in the first quarter of 2012, when the Nixon Facility was placed in service. As a result of LE’s repayment of the full amount due to Milam under the Construction and Funding Agreement in May of 2014, LE now receives up to 80% of the Gross Profits as LE’s Profit Share under the Joint Marketing Agreement.
Our relationship with Genesis and its affiliates is currently governed by two agreements, as follows:
| ● | Joint Marketing Agreement – Under the Joint Marketing Agreement, LE and GEL jointly market and sell the output produced at the Nixon Facility and share the Gross Profits (as defined below) from such sales. GEL is responsible for all product transportation scheduling; LE is responsible for entering into contracts with customers for the purchase and sale of output produced at the Nixon Facility and handling all billing and invoicing relating to the same. All payments for the sale of output produced at the Nixon Facility are made directly to GEL as collection agent and all customers must satisfy GEL’s customer credit approval process. Subject to certain amendments and clarifications (as described below), the Joint Marketing Agreement also provides for the sharing of “Gross Profits” (defined as the total revenue from the sale of output from the Nixon Facility minus the cost of crude oil and condensate pursuant to the Crude Supply Agreement). As a result of LE’s repayment of the full amount due and owing to Milam under the Construction and Funding Agreement, certain aspects related to the distribution of Gross Profits under the Joint Marketing Agreement no longer apply. Key applicable provisions are as follows: |
| - | LE is entitled to receive weekly payments to cover direct expenses in operating the Nixon Facility (the “Operations Payments”) in an amount not to exceed $750,000 per month plus the amount of any accounting fees. If Gross Profits are insufficient to cover Operations Payments, then GEL may: (i) reduce Operations Payments by an amount representing the difference between the Operations Payments and the Gross Profits for such monthly period, or (ii) provide the Operations Payments with such Operations Payments being considered deficit amounts owing to GEL. If Gross Profits are negative, then LE is not entitled to receive Operations Payments and GEL may recoup any losses sustained by a special allocation of 80% of Gross Profits until such losses are covered in full, after which the prevailing Gross Profits allocation shall be reinstated; and | |
| - | GEL is entitled to receive an administrative fee in the amount of $150,000 per month relating to the performance of its obligations under the Joint Marketing Agreement (the “Performance Fee”). GEL shall be paid 30% of the remaining Gross Profit up to $600,000 (the “Threshold Amount”) as the GEL Profit Share and LE shall be paid 70% of the remaining Gross Profit as the LE Profit Share. Any amount of remaining Gross Profit that exceeds the Threshold Amount for such calendar month shall be paid to GEL and LE in the following manner: (i) GEL shall be paid 20% of the remaining Gross Profits over the Threshold Amount as the GEL Profit Share and (ii) LE shall be paid 80% of the remaining Gross Profits over the Threshold Amount as the LE Profit Share. |
The Joint Marketing Agreement contains negative covenants that restrict LE’s actions under certain circumstances. For example, LE is prohibited from making any modifications to the Nixon Facility or entering into any contracts with third-parties that would materially affect or impair GEL’s or its affiliates’ rights under the agreements set forth above. The Joint Marketing Agreement had an initial term of three years expiring on August 12, 2014. In accordance with the terms of the October 2013 Letter Agreement, LE agreed not to terminate the Joint Marketing Agreement and GEL agreed to automatically renew the Joint Marketing Agreement at the end of the initial term for successive one year periods until August 12, 2019, unless sooner terminated by GEL with 180 days prior written notice; and
23
Blue Dolphin Energy Company & Subsidiaries
Notes to Consolidated Financial Statements (Unaudited) - continued
| ● |
Crude Supply Agreement – Under the Crude Supply Agreement, GEL is the exclusive supplier of crude oil and condensate to the Nixon Facility. We have the ability to purchase crude oil and condensate from other suppliers with the prior consent of GEL. GEL supplies crude oil and condensate to LE at cost plus freight expense and any costs associated with GEL’s hedging. All crude oil and condensate supplied to LE pursuant to the Crude Supply Agreement is paid for pursuant to the terms of the Joint Marketing Agreement as described above. In addition, GEL has a first right of refusal to use three storage tanks at the Nixon Facility during the term of the Crude Supply Agreement. Subject to certain termination rights, the Crude Supply Agreement had an initial term of three years expiring on August 12, 2014. In accordance with the terms of the October 2013 Letter Agreement, LE agreed not to terminate the Crude Supply Agreement and GEL agreed to automatically renew the Crude Supply Agreement at the end of the initial term for successive one year periods until August 12, 2019, unless sooner terminated by GEL with 180 days prior written notice.
|
Master Easement Agreement - BDPL and FLNG
Pursuant to a Master Easement Agreement dated December 11, 2013, BDPL provides FLNG Land, II, Inc., a Delaware corporation (“FLNG”) with: (i) uninterrupted pedestrian and vehicular ingress and egress to and from State Highway 332, across the certain property of BDPL to certain property of FLNG (the “Access Easement”) and (ii) a pipeline easement and right of way across certain property of BDPL to certain property owned by FLNG (the “Pipeline Easement” and together with the Access Easement, the “Easements”). Under the agreement, FLNG will make payments in the amount of $500,000 to BDPL in October of each year through 2019. Thereafter, FLNG will make payments in the amount of $10,000 to BDPL in October of each year for so long as FLNG desires to use the Access Easement.
Supplemental Pipeline Bonds
We are required to satisfy supplemental pipeline bonding requirements of the Bureau of Ocean Energy Management (“BOEM”) with regard to certain pipelines that we operate in federal waters of the Gulf of Mexico. These supplemental pipeline bonding requirements are intended to secure our performance of plugging and abandonment obligations with respect to these pipelines. Once plugging and abandonment work has been completed, the collateral backing the supplemental pipeline bonds will be released.
In August 2006, BDPL secured a $700,000 supplemental pipeline bond for Right-of-Way Number OCS-G 01381. On February 5, 2014, WBI and BDPL entered into a Purchase Agreement whereby BDPL reacquired WBI’s 1/6th interest in the Pipeline Assets effective October 31, 2013. Pursuant to the Purchase Agreement, WBI paid BDPL $100,000 in cash, and a surety company $850,000 in cash as collateral for supplemental pipeline bonds for the benefit of BDPL in exchange for the payment and discharge of any and all payables, claims, and obligations related to the Pipeline Assets. The $850,000 in cash was used to: (i) increase the supplemental pipeline bond for Right-of-Way Number OCS-G 01381 by $205,000, and (ii) secure a $645,000 supplemental pipeline bond for Right-of-Way Number OCS-G 08606.
In December 2014, BDPL completed plugging and abandonment work for Right-of-Way Number OCS-G 08606. As a result, BDPL anticipates release of the cash-backed collateral for this supplemental pipeline bond by BOEM in the first half of 2015. There can be no assurance that BOEM will not require additional supplemental pipeline bonds related to other BDPL pipeline right-of-ways.
Legal Matters
From time to time we are subject to various lawsuits, claims, mechanics liens and administrative proceedings that arise out of the normal course of business. Management does not believe that liens, if any, will have a material adverse effect on our results of operations.
Health, Safety and Environmental Matters
All of our operations and properties are subject to extensive federal, state, and local environmental, health, and safety regulations governing, among other things, the generation, storage, handling, use and transportation of petroleum and hazardous substances; the emission and discharge of materials into the environment; waste management; characteristics and composition of jet fuel and other products; and the monitoring, reporting and control of greenhouse gas emissions. Our operations also require numerous permits and authorizations under various environmental, health and safety laws and regulations. Failure to obtain and comply with these permits or environmental, health or safety laws generally could result in fines, penalties or other sanctions, or a revocation of our permits.
24
|
ITEM 2.
|
MANAGEMENT'S DISCUSSION AND ANALYSIS OF FINANCIAL CONDITION AND RESULTS OF OPERATIONS
|
The following discussion of our financial condition and results of operations should be read in conjunction with the risk factors, unaudited consolidated financial statements and notes included hereto, as well as the audited consolidated financial statements and notes thereto included in our previously filed Annual Report on Form 10-K for the year ended December 31, 2014. In this report, the words “Blue Dolphin,” “we,” “us” and “our” refer to Blue Dolphin Energy Company and its subsidiaries.
Forward Looking Statements
As provided by the safe harbor provisions of the Private Securities Litigation Reform Act of 1995, certain statements included throughout this Quarterly Report on Form 10-Q for the three months ended March 31, 2015, and in particular under the sections entitled “Part I, Item 2. Management’s Discussion and Analysis of Financial Condition and Results of Operations” and “Part II, Item 1A. Risk Factors” are forward-looking statements that represent management’s beliefs and assumptions based on currently available information. Forward-looking statements relate to matters such as our industry, business strategy, goals and expectations concerning our market position, future operations, margins, profitability, capital expenditures, liquidity and capital resources and other financial and operating information. We have used the words “anticipate,” “assume,” “believe,” “budget,” “continue,” “could,” “estimate,” “expect,” “intend,” “may,” “plan,” “potential,” “predict,” “project,” “will,” “future” and similar terms and phrases to identify forward-looking statements.
Forward-looking statements reflect our current expectations regarding future events, results or outcomes. These expectations may or may not be realized. Some of these expectations may be based upon assumptions or judgments that prove to be incorrect. In addition, our business and operations involve numerous risks and uncertainties, many of which are beyond our control, which could result in our expectations not being realized, or materially affect our financial condition, results of operations and cash flows.
Actual events, results and outcomes may differ materially from our expectations due to a variety of factors. Although it is not possible to identify all of these factors, they include, among others, the following:
Risks Related to Our Business and Industry
|
●
|
dangers inherent in oil and gas operations that could cause disruptions and expose us to potentially significant losses, costs or liabilities and reduce our liquidity;
|
|
●
|
geographic concentration of our assets, which creates a significant exposure to the risks of the regional economy;
|
|
●
|
competition from companies having greater financial and other resources;
|
|
●
|
laws and regulations regarding personnel and process safety, as well as environmental, health and safety, for which failure to comply may result in substantial fines, criminal sanctions, permit revocations, injunctions, facility shutdowns and/or significant capital expenditures;
|
|
●
|
insurance coverage that may be inadequate or expensive;
|
|
●
|
related party transactions with LEH and its affiliates, which may cause conflicts of interest;
|
|
●
|
loss of executive officers or key employees, as well as a shortage of skilled labor or disruptions in our labor force, which may make it difficult to maintain productivity;
|
|
●
|
our dependence on Lazarus Energy Holdings, LLC (“LEH”) for financing and management of our property and the property of our subsidiaries;
|
|
●
|
capital needs for which our internally generated cash flows and other sources of liquidity may not be adequate; and
|
|
●
|
our ability to use net operating loss (“NOL”) carryforwards to offset future taxable income for U.S. federal income tax purposes, which are subject to limitation.
|
Risks Related to Our Refinery Operations Business Segment
|
●
|
volatility of refining margins;
|
|
●
|
volatility of crude oil, other feedstocks, refined petroleum products, and fuel and utility services;
|
|
●
|
potential downtime at the Nixon Facility, which could result in lost margin opportunity, increased maintenance expense, increased inventory, and a reduction in cash available for payment of our obligations;
|
|
●
|
loss of market share by a key customer or consolidation among our customer base;
|
|
●
|
failure to grow or maintain the market share for our refined petroleum products;
|
|
●
|
our reliance on third-parties for the transportation of crude oil and condensate into and refined petroleum products out of the Nixon Facility;
|
25
|
●
|
interruptions in the supply of crude oil and condensate sourced in the Eagle Ford Shale;
|
|
●
|
changes in the supply/demand balance in the Eagle Ford Shale that could result in lower refining margins;
|
|
●
|
hedging of our refined petroleum products and crude oil and condensate inventory, which may limit our gains and expose us to other risks;
|
|
●
|
our dependence on Genesis Energy, LLC (“Genesis”) and its affiliates for crude oil and condensate sourcing, inventory risk management, hedging, and refined petroleum product marketing; and
|
|
●
|
regulation of greenhouse gas emissions, which could increase our operational costs and reduce demand for our products.
|
Risks Related to Our Pipelines and Oil and Gas Properties
|
●
|
asset retirement obligations for our pipelines and facilities assets and oil and gas properties.
|
Any one of these factors or a combination of these factors could materially affect our future results of operations and could influence whether any forward-looking statements ultimately prove to be accurate. Our forward-looking statements are not guarantees of future performance, and actual results and future performance may differ materially from those suggested in any forward-looking statements. We do not intend to update these statements unless we are required to do so.
Overview
Blue Dolphin Energy Company (http://www.blue-dolphin-energy.com) is primarily an independent refiner and marketer of petroleum products. Our primary asset is a 15,000 barrels per day ("bpd") crude oil and condensate processing facility that is located in Nixon, Wilson County, Texas (the “Nixon Facility”). As part of our refinery business segment, we also conduct petroleum storage and terminaling operations under third-party lease agreements at the Nixon Facility. We also own and operate pipeline assets and have leasehold interests in oil and gas properties, which are considered non-core to our business.
Structure and Management
We were formed as a Delaware corporation in 1986. We are controlled by Lazarus Energy Holdings, LLC (“LEH”), which owns approximately 81% of our common stock, par value $0.01 per share (the “Common Stock). Jonathan P. Carroll, Chairman of the Board of Directors (the “Board”), Chief Executive Officer, and President of Blue Dolphin, is the majority owner of LEH. LEH also manages and operates our property and the property of our subsidiaries, including the Nixon Facility, in the ordinary course of business pursuant to an Operating Agreement (the “Operating Agreement”).
Our operations are conducted directly and indirectly through our primary operating subsidiaries, as follows:
|
●
|
Lazarus Energy, LLC, a Delaware limited liability company (petroleum processing assets) (“LE”);
|
|
●
|
Lazarus Refining & Marketing, LLC, a Delaware limited liability company (petroleum storage and terminaling) (“LRM”);
|
|
●
|
Blue Dolphin Pipe Line Company, a Delaware corporation (pipeline operations) (“BDPL”);
|
|
●
|
Blue Dolphin Petroleum Company, a Delaware corporation (exploration and production activities); and
|
|
●
|
Blue Dolphin Services Co., a Texas corporation (administrative services).
|
Refinery Operations
The Nixon Facility occupies approximately 56 acres in Nixon, Wilson County, Texas and consists of a distillation unit, naphtha stabilizer unit, depropanizer unit, approximately 120,000 barrels (“bbls”) of crude oil and condensate storage capacity, approximately 178,000 bbls of refined petroleum product storage capacity, and related loading and unloading facilities and utilities.
With a capacity of 15,000 bpd, the Nixon Facility is considered a “topping unit” because it is primarily comprised of a crude distillation unit, the first stage of the crude oil refining process. The Nixon Facility’s level of complexity allows us to refine crude oil and condensate into finished and intermediate petroleum products. Our jet fuel is sold in nearby markets, and our intermediate products, including naphtha, liquefied petroleum gas (“LPG”), atmospheric gas oil (“AGO”), and heavy oil-based mud blendstock ("HOBM"), are sold to wholesalers and nearby refineries for further blending and processing. The Nixon Facility uses light crude oil and condensate sourced in the Eagle Ford Shale as feedstock.
26
We continue to refurbish key components of the Nixon Facility, including the naphtha stabilizer and depropanizer units. Once operational, the naphtha stabilizer and depropanizer units will improve the overall quality of the naphtha that we produce, allow higher recovery of lighter products that can be sold as LPG mix, and increase the amount of throughput that can be processed by the Nixon Facility. The below diagram represents a high level overview of the current crude oil and condensate refining process at the Nixon Facility.
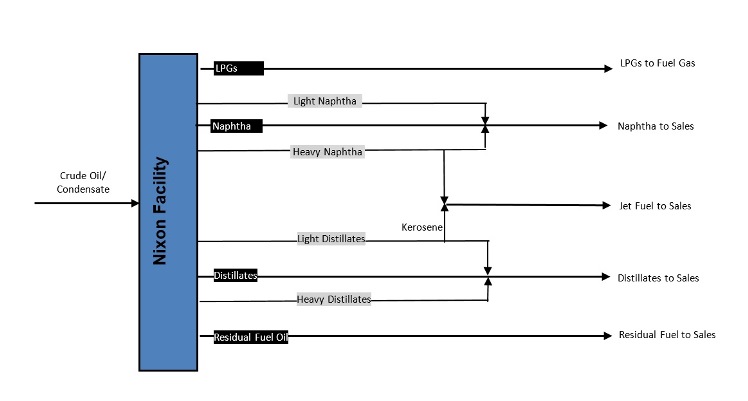
Pipeline Transportation
Our pipeline transportation operations involve the gathering and transportation of oil and natural gas for producers/shippers operating offshore in the vicinity of our pipelines, as well as leasehold interests in oil and natural gas properties, in the Gulf of Mexico.
Owned and Leased Assets
We own, lease, and have leasehold interests in the properties listed below:
|
Property
|
Business Segments
|
Acres
|
Owned / Leased
|
Location
|
||||
|
Nixon facility
|
Refinery Operations
|
56
|
Owned
|
Nixon, Wilson County, Texas
|
||||
|
Freeport facility
|
Pipeline Transportation
|
193
|
Owned
|
Freeport, Brazoria County, Texas | ||||
|
Pipelines and oil and gas properties
|
Pipeline Transportation |
--
|
Owned/Leasehold Interests
|
Gulf of Mexico
|
||||
|
Corporate headquarters
|
Corporate and Other
|
--
|
Lease
|
Houston, Harris County, Texas
|
LEH manages and operates all of our properties and is reimbursed for their management and operation under the Operating Agreement. We believe that our properties are generally adequate for our operations and are maintained in a good state of repair in the ordinary course of business.
27
Major Influences on Results of Operations
Our earnings and cash flows from our refinery operations business segment are primarily affected by the relationship between refined petroleum product prices and the prices for crude oil and other feedstocks. Crude oil refining is primarily a margin-based business, and in order to increase profitability, it is important for the refinery to maximize the yields of high value finished products and to minimize the costs of feedstock and operating expenses. Our cost to acquire crude oil and condensate and the price for which our refined petroleum products are ultimately sold depend on several factors, many of which are beyond our control, including the supply of, and demand for, crude oil and refined petroleum products, which depend on changes in domestic and foreign economies, weather conditions, domestic and foreign political affairs, production levels, availability of and access to transportation infrastructure, the availability of imports, the marketing of competitive fuel, and governmental regulations, among other factors.
Crude oil and refined petroleum product prices are also affected by other factors, such as product pipeline capacity, local market conditions and the operating levels of competing refineries. Crude oil costs and the prices of refined petroleum products have historically been subject to wide fluctuations. An expansion or upgrade of our competitors’ facilities, price volatility, international political and economic developments and other factors beyond our control are likely to continue to play an important role in crude oil refining industry economics. Moreover, the refining industry typically experiences seasonal fluctuations in demand for refined petroleum products, such as increases in the demand for gasoline during the summer driving season and for home heating oil during the winter. These factors can impact, among other things, the level of inventories in the market, resulting in price volatility and a negative impact on product margins. In addition to current market conditions, there are long-term factors that may impact the demand for refined petroleum products. These factors include mandated renewable fuels standards, proposed climate change laws and regulations, and increased mileage standards for vehicles.
Relationship with LEH
Pursuant to the Operating Agreement, LEH manages and operates our property and the property of our subsidiaries, including the Nixon Facility, in the ordinary course of business. LEH is also our controlling shareholder, owning approximately 81% of our Common Stock. Jonathan P. Carroll, Chairman of the Board, Chief Executive Officer, and President of Blue Dolphin, is the majority owner of LEH. We currently rely on our profit share and LEH to fund our working capital requirements. During months in which we receive no profit share distribution, LEH may, but is not required to, fund our operating losses.
Relationship with Genesis
LE was previously subject to three agreements with Genesis and its affiliates. Under the Construction and Funding Agreement, Milam committed funding for the completion of the Nixon Facility’s refurbishment and start-up operations. Payments under the Construction and Funding Agreement began in the first quarter of 2012, when the Nixon Facility was placed in service. As a result of LE’s repayment of the full amount due to Milam under the Construction and Funding Agreement in May of 2014, LE now receives up to 80% of the Gross Profits as LE’s Profit Share under the Joint Marketing Agreement. In addition, Milam is obligated to release all liens on the Nixon Facility.
Our relationship with Genesis and its affiliates is currently governed by two agreements, as follows:
| ● |
Joint Marketing Agreement – Under the Joint Marketing Agreement, LE and GEL jointly market and sell the output produced at the Nixon Facility and share the Gross Profits (as defined below) from such sales. GEL is responsible for all product transportation scheduling; LE is responsible for entering into contracts with customers for the purchase and sale of output produced at the Nixon Facility and handling all billing and invoicing relating to the same. All payments for the sale of output produced at the Nixon Facility are made directly to GEL as collection agent and all customers must satisfy GEL’s customer credit approval process. Subject to certain amendments and clarifications (as described below), the Joint Marketing Agreement also provides for the sharing of “Gross Profits” (defined as the total revenue from the sale of output from the Nixon Facility minus the cost of crude oil and condensate pursuant to the Crude Supply Agreement). As a result of LE’s repayment of the full amount due and owing to Milam under the Construction and Funding Agreement, certain aspects related to the distribution of Gross Profits under the Joint Marketing Agreement no longer apply. Key applicable provisions are as follows:
|
| - | LE is entitled to receive weekly payments to cover direct expenses in operating the Nixon Facility (the “Operations Payments”) in an amount not to exceed $750,000 per month plus the amount of any accounting fees. If Gross Profits are insufficient to cover Operations Payments, then GEL may: (i) reduce Operations Payments by an amount representing the difference between the Operations Payments and the Gross Profits for such monthly period, or (ii) provide the Operations Payments with such Operations Payments being considered deficit amounts owing to GEL. If Gross Profits are negative, then LE is not entitled to receive Operations Payments and GEL may recoup any losses sustained by a special allocation of 80% of Gross Profits until such losses are covered in full, after which the prevailing Gross Profits allocation shall be reinstated; and | ||
28
| - | GEL is entitled to receive an administrative fee in the amount of $150,000 per month relating to the performance of its obligations under the Joint Marketing Agreement (the “Performance Fee”). GEL shall be paid 30% of the remaining Gross Profit up to $600,000 (the “Threshold Amount”) as the GEL Profit Share and LE shall be paid 70% of the remaining Gross Profit as the LE Profit Share. Any amount of remaining Gross Profit that exceeds the Threshold Amount for such calendar month shall be paid to GEL and LE in the following manner: (i) GEL shall be paid 20% of the remaining Gross Profits over the Threshold Amount as the GEL Profit Share and (ii) LE shall be paid 80% of the remaining Gross Profits over the Threshold Amount as the LE Profit Share. | ||
The Joint Marketing Agreement contains negative covenants that restrict LE’s actions under certain circumstances. For example, LE is prohibited from making any modifications to the Nixon Facility or entering into any contracts with third-parties that would materially affect or impair GEL’s or its affiliates’ rights under the agreements set forth above. The Joint Marketing Agreement had an initial term of three years expiring on August 12, 2014. In accordance with the terms of the October 2013 Letter Agreement, LE agreed not to terminate the Joint Marketing Agreement and GEL agreed to automatically renew the Joint Marketing Agreement at the end of the initial term for successive one year periods until August 12, 2019, unless sooner terminated by GEL with 180 days prior written notice; and
| ● |
Crude Supply Agreement – Under the Crude Supply Agreement, GEL is the exclusive supplier of crude oil and condensate to the Nixon Facility. We have the ability to purchase crude oil and condensate from other suppliers with the prior consent of GEL. GEL supplies crude oil and condensate to LE at cost plus freight expense and any costs associated with GEL’s hedging. All crude oil and condensate supplied to LE pursuant to the Crude Supply Agreement is paid for pursuant to the terms of the Joint Marketing Agreement as described above. In addition, GEL has a first right of refusal to use three storage tanks at the Nixon Facility during the term of the Crude Supply Agreement. Subject to certain termination rights, the Crude Supply Agreement had an initial term of three years expiring on August 12, 2014. In accordance with the terms of the October 2013 Letter Agreement, LE agreed not to terminate the Crude Supply Agreement and GEL agreed to automatically renew the Crude Supply Agreement at the end of the initial term for successive one year periods until August 12, 2019, unless sooner terminated by GEL with 180 days prior written notice.
|
Results of Operations
We have two reportable business segments: (i) “Refinery Operations” and (ii) “Pipeline Transportation.” Business activities related to our “Refinery Operations” business segment are conducted at the Nixon Facility and represent approximately 99% of our operations. Business activities related to our “Pipeline Transportation” business segment are primarily conducted in the Gulf of Mexico through our pipeline assets and leasehold interests in oil and gas properties. Our “Pipeline Transportation” operations are non-core to our business and represent less than 1% of our operations. In this “Results of Operations” section, we first review our business on a consolidated basis, and then separately review our “Refinery Operations” business segment.
Consolidated Results
Definitions
For our consolidated results, we refer to our consolidated statements of operations in the explanation of our period over period changes in results of operations. We have reclassified certain prior period amounts to conform to our 2015 presentation. Below are general definitions of what those line items include and represent:
|
●
|
Revenue from Operations – Primarily consists of refined petroleum product sales, but also includes tank rental and pipeline transportation revenue. Excise and other taxes that are collected from customers and remitted to governmental authorities are not included in revenue.
|
|
●
|
Cost of Refined Products Sold – Primarily includes purchased crude oil and condensate costs, as well as transportation, freight and storage costs.
|
|
●
|
Refinery Operating Expenses – The direct operating expenses of the Nixon Facility, including direct costs of labor, maintenance materials and services, chemicals, catalysts and utilities. Refinery operating expenses are considered services under the Operating Agreement.
|
|
●
|
Joint Marketing Agreement Profit Share (the “JMA Profit Share) – Represents the GEL Profit Share plus the Performance Fee for the period pursuant to the Joint Marketing Agreement.
|
29
|
●
|
General and Administrative Expense – Primarily include corporate costs, such as accounting and legal fees, office lease expenses and administrative expenses.
|
|
●
|
Depletion, Depreciation and Amortization – Represent an allocation to expense within the statement of operations of the carrying value of capital and intangible assets. The value is allocated based on the straight-line method over the estimated useful life of the related asset.
|
|
●
|
Income Tax Expense – Includes federal and state taxes currently payable and deferred taxes arising from temporary differences between income for financial reporting and income tax purposes.
|
|
●
|
Net Income – Represents total revenue from operations less total cost of operations, total other income (expense) and income tax expense, current.
|
Three Months Ended March 31, 2015 Compared to Three Months Ended March 31, 2014
Total Revenue from Operations. For the three months ended March 31, 2015 (the “Current Period”), we had total revenue from operations of $61,392,349 compared to total revenue from operations of $120,712,698 for the three months ended March 31, 2014 (the “Prior Period”). The 49% decrease in total revenue from operations was primarily the result of a significant decrease in refined petroleum product prices in the Current Period compared to the Prior Period. The majority of our revenue in the Current Period came from refined petroleum product sales, which generated revenue of $61,067,062, or more than 99% of total revenue from operations, compared to $120,376,151, or more than 99% of total revenue from operations, in the Prior Period. We recognized $286,892 in tank rental revenue in the Current Period compared to $282,516 in the Prior Period. Tank rental revenue was relatively flat between the Current Period and Prior Period.
Cost of Refined Products Sold. Cost of refined products sold was $49,387,449 for the Current Period compared to $110,415,607 for the Prior Period. The approximate 55% decrease in cost of refined products sold was primarily the result of a significant decrease in the average price of crude oil and condensate in the Current Period compared to the Prior Period.
Refinery Operating Expenses. We recorded refinery operating expenses of $2,880,971 in the Current Period compared to $2,955,019 in the Prior Period, a decrease of nearly 3%. Refinery operating expenses per barrel of throughput was $2.71 in both the Current Period and Prior Period. Refinery operating expenses represent services provided by LEH pursuant to the Operating Agreement. See “Part I, Item 1. Financial Statements - Note (9), Accounts Payable, Related Party” of this report for additional disclosures related to the Operating Agreement.
JMA Profit Share. GEL was entitled to receive $2,438,637, or 28% of refined product sales less cost of refined products sold and refinery operating expenses as the JMA Profit Share for the Current Period. Under the Joint Marketing Agreement, GEL was not entitled to receive the JMA Profit Share in the Prior Period.
General and Administrative Expenses. We incurred general and administrative expenses of $345,884 in the Current Period compared to $369,484 in the Prior Period. The approximate 6% decrease in general and administrative expenses in the Current Period compared to the Prior Period was primarily related to a reduction in costs.
Depletion, Depreciation and Amortization. We recorded depletion, depreciation and amortization expenses of $399,231 in the Current Period compared to $390,605 in the Prior Period. The approximate 2% increase in depletion, depreciation and amortization expenses for the Current Period compared to the Prior Period primarily related to additional depreciable refinery assets that were placed in service.
Income Tax Expense. We recognized income tax expense of $1,989,618 in the Current Period, which primarily related to deferred federal income taxes, compared to income tax expense of $202,423 in the Prior Period. For the Current Period, we had a net deferred tax asset of $3,934,843. The net deferred tax asset was primarily the result of net operating losses (“NOLs”). See “Part I, Item 1. Financial Statements – Note (16) Income Taxes” for additional disclosures related to income taxes and our net deferred tax asset.
Net Income. For the Current Period, we reported net income of $3,701,364, or income of $0.35 per share, compared to net income of $6,194,273, or income of $0.59 per share, for the Prior Period. The $0.24 per share decrease in net income between the periods was primarily related to the JMA Profit Share of $2,438,637 and income tax expense of $1,989,618 in the Current Period.
30
Refinery Operations Business Segment Results
Definitions
For our refinery operations business segment results, we refer to key operational data in the explanation of our period over period changes in results of operations. Below are general definitions of what those items include and represent:
|
●
|
Operating Days – The number of days in a calendar period in which the Nixon Facility operated. Downtime is excluded from operating days.
|
|
●
|
Downtime – Scheduled or unscheduled periods in which the Nixon Facility is not operable. Downtime may be required for a variety of reasons, including maintenance, inspection and equipment repair, voluntary regulatory compliance measures, and cessation or suspension by regulatory authorities.
|
|
●
|
Total Refinery Throughput – Refers to the volume processed as input through the Nixon Facility. Refinery throughput includes crude oil and condensate and other feedstocks.
|
|
●
|
Total Refinery Production – Refers to the volume processed as output through the Nixon Facility. Refinery production includes finished petroleum products, such as jet fuel, and intermediate petroleum products, such as naphtha, LPG and AGO.
|
|
●
|
Fuel and Energy Losses – Represents crude oil and condensate volumes used to power the Nixon Facility and energy losses that occur as part of normal refinery operations, such as evaporation from oil-water separators.
|
|
●
|
Capacity Utilization Rate –A percentage measure that indicates the amount of available capacity that is being used at the Nixon Facility. The rate is calculated by dividing total refinery throughput on a bpd basis or total refinery production on a bpd basis by the total capacity of the Nixon Facility, which is currently 15,000 bpd.
|
Key Operational Metrics
Following are key operational metrics for the Nixon Facility:
|
Three Months Ended March 31,
|
||||||||
|
2015
|
2014
|
|||||||
|
Operating Days
|
90 | 90 | ||||||
|
Downtime
|
- | - | ||||||
|
Total refinery throughput
|
||||||||
|
bbls
|
1,062,388 | 1,092,007 | ||||||
|
bpd
|
11,804 | 12,133 | ||||||
|
Total refinery production
|
||||||||
|
bbls
|
1,044,210 | 1,073,638 | ||||||
|
bpd
|
11,602 | 11,929 | ||||||
|
Total refined petroleum product sales
|
||||||||
|
bbls
|
1,026,884 | 1,076,764 | ||||||
|
Fuel and losses
|
||||||||
|
bbls
|
18,178 | 18,369 | ||||||
|
bpd
|
202 | 204 | ||||||
|
Capacity utilization rate
|
||||||||
|
refinery throughput
|
78.7 | % | 80.9 | % | ||||
|
refinery production
|
77.3 | % | 79.5 | % | ||||
31
Three Months Ended March 31, 2015 Compared to Three Months Ended March 31, 2014
Operating Days. The Nixon Facility operated for a total of 90 days in both the Current Period and the Prior Period.
Downtime. The safe and reliable operation of the Nixon Facility is key to our financial performance and results of operations. Downtime may result in lost margin opportunity, increased maintenance expense, and a reduction in cash available for payment of our obligations. The Nixon Facility experienced no days of downtime in the Current Period or in the Prior Period.
Total Refinery Throughput. For the Current Period, the Nixon Facility processed 1,062,388 bbls, or 11,804 bpd, of crude oil and condensate compared to 1,092,007 bbls, or 12,133 bpd, of crude oil and condensate for the Prior Period. Total refinery throughput remained relatively stable for the Current Period compared to the Prior Period.
Total Refinery Production. For the Current Period, the Nixon Facility produced 1,044,210 bbls, or 11,602 bpd, of refined petroleum products compared to 1,073,638 bbls, or 11,929 bpd, of refined petroleum products for the Prior Period. Total refinery production remained relatively stable for the Current Period compared to the Prior Period
Fuel and Energy Losses. For the Current Period, fuel and energy losses at the Nixon Facility were 18,178 bbls, or 202 bpd, compared to 18,369, or 204 bpd, for the Prior Period. The nominal decrease in fuel and energy losses of 191 bbls, or 2 bpd, was the result of operational efficiency improvements.
Capacity Utilization Rate. The capacity utilization rate for refinery throughput for the Current Period was 78.7% compared to 80.9% for the Prior Period, reflecting a nominal decrease of approximately 2%. The capacity utilization rate for refinery production for the Current Period was 77.3% compared to 79.5% for the Prior Period, reflecting a nominal decrease of approximately 2%. The decrease in capacity utilization rates for refinery throughput and refinery production related to decreases in throughput and production volumes.
Refined Petroleum Product Sales Summary
All of our refined petroleum products are currently sold in the United States. The following tables summarize total refined petroleum product sales by distillation (from light to heavy):
|
Three Months Ended March 31,
|
||||||||||||||||
|
2015
|
2014
|
|||||||||||||||
|
LPG mix
|
$ | 57,308 | 0.0 | % | $ | 156,525 | 0.1 | % | ||||||||
|
Naphtha
|
13,416,199 | 22.0 | % | 28,770,998 | 23.9 | % | ||||||||||
|
Jet fuel
|
16,519,503 | 27.1 | % | 20,034,991 | 16.7 | % | ||||||||||
|
NRLM
|
- | 0.0 | % | 38,767,393 | 32.2 | % | ||||||||||
|
HOBM
|
17,409,079 | 28.5 | % | - | 0.0 | % | ||||||||||
|
AGO
|
13,664,973 | 22.4 | % | 32,646,244 | 27.1 | % | ||||||||||
| $ | 61,067,062 | 100.0 | % | $ | 120,376,151 | 100.0 | % | |||||||||
On May 31, 2014, the Nixon Facility ceased production of Non-Road, Locomotive and Marine (“NRLM”), a transportation-related diesel fuel product. On June 1, 2014, the Nixon Facility began producing heavy oil-based mud blendstock (“HOBM”), a non-transportation lubricant blend product. The shift in product slate from NRLM to HOBM was the result of the Environmental Protection Agency’s (the “EPA’s”) phased-in requirements for small refineries to reduce the sulfur content in transportation-related diesel fuel, such as NRLM, to a maximum of 15 parts per million (“ppm”) sulfur by June 1, 2014. “Topping units,” like the Nixon Facility, typically lack a desulfurization process unit to lower sulfur content levels within the range required by the EPA’s revised fuel quality standards, and integration of such a unit generally requires additional permitting and significant capital expenditures. The Nixon Facility can produce and sell higher ppm sulfur diesel as a feedstock to other refineries and blenders in the United States and as a finished petroleum product to other countries.
Refined Petroleum Product Economic Hedges
Operation cost within our refinery operations business segment includes the effect of economic hedges on our refined petroleum product inventories. For the Current Period, our refinery operations business segment recognized a realized gain of $1,475,774 and an unrealized loss of $548,190. For the Prior Period, our refinery operations business segment recognized a realized loss of $54,469 and an unrealized loss of $127,100.
32
Non-GAAP Performance Measures
Definitions
Certain performance measures used by management to assess our operating results and the effectiveness of our business segments are considered non-GAAP performance measures. These performance measures may differ from similar calculations used by other companies within the oil and gas industry, thereby limiting their usefulness as a comparative measure. Below are definitions of non-GAAP performance measures used by management:
|
●
|
Adjusted Earnings Before Interest, Income Taxes and Depreciation (“EBITDA”) – Reflects EBITDA less the JMA Profit Share. The JMA Profit Share represents the GEL Profit Share plus the Performance Fee for the period pursuant to the Joint Marketing Agreement.
|
|
–
|
Refinery Operations Adjusted EBITDA – Reflects adjusted EBITDA for our refinery operations business segment.
|
|
–
|
Total Adjusted EBITDA – Reflects adjusted EBITDA for our refinery operations and pipeline transportation business segments, as well as corporate and other.
|
|
●
|
EBITDA – Earnings are adjusted for: (i) interest income (expense), (ii) income taxes, and (iii) depreciation and amortization. We exclude from EBITDA other expenses or income not pertaining to the operations of our business segments.
|
|
–
|
Refinery Operations EBITDA – Reflects EBITDA for our refinery operations business segment.
|
|
–
|
Total EBITDA – Reflects EBITDA for our refinery operations and pipeline transportation business segments, as well as corporate and other.
|
|
●
|
Refinery Operating Income – Reflects refined petroleum product sales less direct operating costs (including cost of refined products sold and refinery operating expenses) and the JMA profit share, which is an indirect operating expense.
|
Three Months Ended March 31, 2015 Compared to Three Months Ended March 31, 2014
Refinery Operations Adjusted EBITDA. For the Current Period, refinery operations adjusted EBITDA was $9,094,484 compared to refinery operations adjusted EBITDA of $7,290,089 for the Prior Period. This represented an increase in refinery operations adjusted EBITDA of $1,804,395 for the Current Period compared to the Prior Period. The increase in refinery operations adjusted EBITDA between the periods was the result of lower crude oil and condensate acquisition costs and improved refining margins.
Total Adjusted EBITDA. For the Current Period, we had total adjusted EBITDA of $8,733,419 compared to total adjusted EBITDA of $7,011,881 for the Prior Period. This represented an increase in total adjusted EBITDA of $1,721,538 for the Current Period compared to the Prior Period. The increase in total adjusted EBITDA between the periods was the result of lower crude oil and condensate acquisition costs and improved refining margins.
Refinery Operations EBITDA. For the Current Period, refinery operations EBITDA was $6,655,847 compared to refinery operations EBITDA of $7,290,089 for the Prior Period. This represented a decrease in refinery operations EBITDA of $634,242 for the Current Period compared to the Prior Period. The decrease in refinery operations EBITDA between the periods was the result of the cost of the JMA Profit Share.
Total EBITDA. For the Current Period, we had total EBITDA of $6,294,782 compared to total EBITDA of $7,011,881 for the Prior Period. This represented a decrease in total EBITDA of $717,099 for the Current Period compared to the Prior Period. The decrease in total EBITDA between the periods was the result of the cost of the JMA Profit Share, which was partially offset by improved profitability as a result of higher refining margins.
Refinery Operating Income. Refinery operating income before the JMA Profit Share was $8,798,642 for the Current Period compared to $7,005,525 in the Prior Period. The JMA Profit Share totaled $2,438,637, or 28% of refinery operating income, for the Current Period compared to $0 for the Prior Period. For the Current Period, we had a refinery operating income of $6,360,005 compared to $7,005,525 for the Prior Period.
33
Non-GAAP Reconciliations
Adjusted EBITDA and EBITDA. EBITDA should be considered in conjunction with net income and other performance measures such as operating cash flows. Following is a reconciliation of adjusted EBITDA and EBITDA by business segment for the three months ended March 31, 2015 and 2014:
|
Three Months Ended March 31, 2015
|
Three Months Ended March 31, 2014
|
|||||||||||||||||||||||||||||||
|
Segment
|
Segment
|
|||||||||||||||||||||||||||||||
|
Refinery
|
Pipeline
|
Corporate &
|
Refinery
|
Pipeline
|
Corporate &
|
|||||||||||||||||||||||||||
|
Operations
|
Transportation
|
Other
|
Total
|
Operations
|
Transportation
|
Other
|
Total
|
|||||||||||||||||||||||||
|
Revenue from operations
|
$ | 61,353,954 | $ | 38,395 | $ | - | $ | 61,392,349 | $ | 120,658,667 | $ | 54,031 | $ | - | $ | 120,712,698 | ||||||||||||||||
|
Less: cost of operations(1)
|
(52,259,470 | ) | (53,912 | ) | (408,048 | ) | (52,721,430 | ) | (113,368,578 | ) | (122,510 | ) | (334,729 | ) | (113,825,817 | ) | ||||||||||||||||
|
Other non-interest income
|
- | 62,500 | - | 62,500 | - | 125,000 | - | 125,000 | ||||||||||||||||||||||||
|
Adjusted EBITDA
|
9,094,484 | 46,983 | (408,048 | ) | 8,733,419 | 7,290,089 | 56,521 | (334,729 | ) | 7,011,881 | ||||||||||||||||||||||
|
Less: JMA Profit Share(2)
|
(2,438,637 | ) | - | - | (2,438,637 | ) | - | - | - | - | ||||||||||||||||||||||
|
EBITDA
|
$ | 6,655,847 | $ | 46,983 | $ | (408,048 | ) | $ | 6,294,782 | $ | 7,290,089 | $ | 56,521 | $ | (334,729 | ) | $ | 7,011,881 | ||||||||||||||
|
Depletion, depreciation and amortization
|
(399,231 | ) | (390,605 | ) | ||||||||||||||||||||||||||||
|
Interest expense, net
|
(204,569 | ) | (224,580 | ) | ||||||||||||||||||||||||||||
|
Income before income taxes
|
$ | 5,690,982 | $ | 6,396,696 | ||||||||||||||||||||||||||||
|
(1)
|
Operation cost within the “Refinery Operations” and “Pipeline Transportation” segments includes related general, administrative, and accretion expenses. Operation cost within “Corporate and Other” includes general and administrative expenses associated with corporate maintenance costs, such as accounting fees, director fees and legal expense.
|
|
(2)
|
The JMA Profit Share represents the GEL Profit Share plus the Performance Fee for the period pursuant to the Joint Marketing Agreement. See “Part 1, Item 1 - Note (20) Commitments and Contingencies” and “Part 1, Item 2. Management’s Discussion and Analysis and Results of Operations – Relationship with Genesis” of this report for further discussion of the Joint Marketing Agreement.
|
Refinery Operating Income. The following table provides a reconciliation of refinery operating income to refined petroleum product sales, cost of refined products sold, refinery operating expenses, and JMA Profit Share for the periods indicated. For a reconciliation of refined petroleum product sales to total revenue from operations for our consolidated operations, see “Part I, Item 1. Financial Statements – Consolidated Statements of Operations” of this report.
|
March 31,
|
||||||||
|
2015
|
2014
|
|||||||
|
Total refined petroleum product sales
|
$ | 61,067,062 | $ | 120,376,151 | ||||
|
Less: Cost of refined petroleum products sold
|
(49,387,449 | ) | (110,415,607 | ) | ||||
|
Less: Refinery operating expenses
|
(2,880,971 | ) | (2,955,019 | ) | ||||
|
Refinery operating income before JMA Profit Share
|
8,798,642 | 7,005,525 | ||||||
|
Less: JMA Profit Share
|
(2,438,637 | ) | - | |||||
|
Refinery operating income
|
$ | 6,360,005 | $ | 7,005,525 | ||||
|
Total refined petroleum product sales (bbls)
|
1,026,884 | 1,076,764 | ||||||
34
Critical Accounting Policies
Long-Lived Assets
Refinery and Facilities. Additions to refinery and facilities are capitalized. Expenditures for repairs and maintenance, including maintenance turnarounds, are included as operating expenses under the Operating Agreement and covered by LEH (see “Part I, Item 1. Financial Statements – Note (9) Accounts Payable, Related Party” in this report for additional disclosures related to the Operating Agreement). Management expects to continue making improvements to the Nixon Facility based on technological advances.
Refinery and facilities are carried at cost. Adjustment of the asset and the related accumulated depreciation accounts are made for refinery and facilities’ retirements and disposals, with the resulting gain or loss included in the statements of operations. For financial reporting purposes, depreciation of refinery and facilities is computed using the straight-line method using an estimated useful life of 25 years beginning when the refinery and facilities are placed in service. We did not record any impairment of our refinery and facilities for the three months ended March 31, 2015 and 2014.
Pipelines and Facilities Assets. We record pipelines and facilities at the lower of cost or net realizable value. Depreciation is computed using the straight-line method over estimated useful lives ranging from 10 to 22 years. In accordance with FASB ASC guidance on accounting for the impairment or disposal of long-lived assets, assets are grouped and evaluated for impairment based on the ability to identify separate cash flows generated therefrom.
Construction in Progress. Construction in progress expenditures related to refurbishment activities at the Nixon Facility are capitalized as incurred. Depreciation begins once the asset is placed in service.
Revenue Recognition
We sell various refined petroleum products including jet fuel, naphtha, distillates, and AGO. Revenue from refined petroleum product sales is recognized when title passes. Title passage occurs when refined petroleum products are sold or delivered in accordance with the terms of the respective sales agreements. Revenue is recognized when sales prices are fixed or determinable and collectability is reasonably assured.
Customers assume the risk of loss when title is transferred. Transportation, shipping and handling costs incurred are included in cost of refined products sold. Excise and other taxes that are collected from customers and remitted to governmental authorities are not included in revenue.
Tank rental fees are invoiced monthly in accordance with the terms of the related lease agreement and recognized in revenue as earned. Land easement revenue is recognized monthly as earned and included in other income.
Revenue from our pipeline operations is derived from fee-based contracts and is typically based on transportation fees per unit of volume transported multiplied by the volume delivered. Revenue is recognized when volumes have been physically delivered for the customer through the pipeline.
Asset Retirement Obligations
FASB ASC guidance related to asset retirement obligations (“AROs”) requires that a liability for the discounted fair value of an ARO be recorded in the period in which it is incurred and the corresponding cost capitalized by increasing the carrying amount of the related long-lived asset. The liability is accreted towards its future value each period, and the capitalized cost is depreciated over the useful life of the related asset. If the liability is settled for an amount other than the recorded amount, a gain or loss is recognized.
Management has concluded that there is no legal or contractual obligation to dismantle or remove the refinery and facilities. Further, management believes that these assets have indeterminate lives under FASB ASC guidance for estimating AROs because dates or ranges of dates upon which we would retire these assets cannot reasonably be estimated at this time. When a date or range of dates can reasonably be estimated for the retirement of these assets, we will estimate the cost of performing the retirement activities and record a liability for the fair value of that cost using present value techniques.
We recorded an ARO liability related to future asset retirement costs associated with dismantling, relocating or disposing of our offshore platform, pipeline systems and related onshore facilities, as well as plugging and abandonment of wells and land and sea bed restoration costs. We developed these cost estimates for each of our assets based upon regulatory requirements, platform structure, water depth, reservoir characteristics, reservoir depth, equipment market demand, current procedures, and construction and engineering consultations. Because these costs typically extend many years into the future, estimating future costs are difficult and require management to make judgments that are subject to future revisions based upon numerous factors, including changing technology, political and regulatory environments. We review our assumptions and estimates of future abandonment costs on an annual basis.
35
Income Taxes
We account for income taxes under FASB ASC guidance related to income taxes, which requires recognition of income taxes based on amounts payable with respect to the current year and the effects of deferred taxes for the expected future tax consequences of events that have been included in our financial statements or tax returns. Under this method, deferred tax assets and liabilities are determined based on the differences between the financial accounting and tax basis of assets and liabilities, as well as for operating losses and tax credit carryforwards using enacted tax rates in effect for the year in which the differences are expected to reverse.
As of each reporting date, management considers new evidence, both positive and negative, to determine the realizability of deferred tax assets. Management considers whether it is more likely than not that some portion or all of the deferred tax assets will be realized, which is dependent upon the generation of future taxable income prior to the expiration of any net operating loss carryforwards. When management determines that it is more likely than not that a tax benefit will not be realized, a valuation allowance is recorded to reduce deferred tax assets.
In assessing the realizability of deferred tax assets, management considers whether it is more likely than not that some portion or all of the deferred tax assets will be realized. The ultimate realization of deferred tax assets is dependent upon the generation of future taxable income prior to the expiration of any net operating loss carryforwards.
The guidance also prescribes a recognition threshold and measurement attribute for the financial statement recognition and measurement of a tax position taken or expected to be taken in a tax return, as well as guidance on derecognition, classification, interest and penalties, accounting in interim periods, disclosures and transition.
See “Part I, Item 1. Financial Statements - Note (16) Income Taxes” of this report for further information related to income taxes.
Recently Adopted Accounting Guidance
The guidance issued by the FASB during the three months ended March 31, 2015 is not expected to have a material effect on our consolidated financial statements.
Liquidity and Capital Resources
Sources and Uses of Cash
At March 31, 2015 and December 31, 2014, we had cash and cash equivalents of $2,279,206 and $1,293,233, respectively. We rely on our profit share distribution under the Joint Marketing Agreement and LEH to fund our working capital requirements. During months in which we receive no profit share distribution under the Joint Marketing Agreement, LEH may, but is not required to, fund our operating losses. At March 31, 2015 and December 31, 2014, the working capital amount funded by LEH was $119,645 and $1,174,168, respectively. Amounts funded by LEH are reflected in accounts payable, related party in our consolidated balance sheets.
We believe that our business strategy will be sufficient to support our operations for the next 12 months. During the Current Period, we completed automation of certain meters and refurbishment of certain storage tanks at the Nixon Facility. We also continued with refurbishment of key components of the naphtha stabilizer and depropanizer units. Upgrades to the naphtha stabilizer and depropanizer units will improve the overall quality of the naphtha that we produce, allow higher recovery of lighter products that can be sold as LPG mix, and increase the amount of throughput that can be processed by the Nixon Facility.
Execution of our business strategy depends on several factors, including our future performance, levels of accounts receivable, inventories, accounts payable, capital expenditures, adequate access to credit and financial flexibility to attract long-term capital on satisfactory terms. These factors may be impacted by general economic, political, financial, competitive and other factors beyond our control. There can be no assurance that our business strategy will achieve the anticipated outcomes, or that LEH will continue to fund our working capital requirements during months in which we have operational losses. In the event our business strategy is unsuccessful, or our working capital requirements are not funded by our profit share distribution or LEH, we may experience a significant and material adverse effect on our operations, liquidity, and financial condition. See “Part I, Item 1A. Risk Factors” of our annual report on Form 10-K for the year ended December 31, 2014 for risk factors related to working capital, liquidity and Nixon Facility downtime.
36
Cash Flow
Our cash flow from operations for the periods indicated was as follows:
|
For Three Months Ended March 31,
|
||||||||
|
2015
|
2014
|
|||||||
|
Cash flow from operations
|
||||||||
|
Adjusted income from continuing operations
|
$ | 6,517,934 | $ | 6,771,230 | ||||
|
Change in assets and current liabilities
|
(3,939,940 | ) | (1,571,892 | ) | ||||
|
Total cash flow from operations
|
2,577,994 | 5,199,338 | ||||||
|
Cash inflows (outflows)
|
||||||||
|
Capital expenditures
|
(1,291,915 | ) | (59,178 | ) | ||||
|
Payments on long term debt
|
(300,106 | ) | (5,267,116 | ) | ||||
|
Payments on notes payble
|
- | (11,884 | ) | |||||
|
Total cash outflows
|
(1,592,021 | ) | (5,338,178 | ) | ||||
|
Total change in cash flows
|
$ | 985,973 | $ | (138,840 | ) | |||
For the Current Period, we experienced positive cash flow from operations of $2,577,994 compared to positive cash flow from operations of $5,199,338 for the Prior Period, which represented a decrease in cash flow from operations of $2,621,344 for the Current Period compared to the Prior Period. The decrease in cash flow from operations was primarily due to payments of $1,799,478 and $1,015,830 in JMA Profit Share and accounts payable, related party.
Working Capital
We had working capital of $1,323,957 consisting of $16,496,142 in total current assets and $15,172,185 in total current liabilities, at March 31, 2015. Comparatively, we had a working capital deficit of $3,200,991, consisting of $14,682,657 in total current assets and $17,883,648 in total current liabilities, at December 31, 2014. The $4,524,948 improvement in working capital from the prior period primarily stemmed from improved profitability, which enabled widespread improvements to working capital, such as reductions in accounts payable of $2,487,954 and accounts payable, related party of $1,054,523.
Capital Spending
Capital expenditures in the Current Period totaled $1,291,915 compared to $59,178 in the Prior Period. Capital spending primarily related to investments in the Nixon Facility. We expect to fund additional capital expenditures at the Nixon Facility primarily through cash from operations or other borrowings. On May 2, 2014, LRM entered into a loan and security agreement with Sovereign Bank, a Texas state bank (“Sovereign”), for a term loan facility in the aggregate amount of $2.0 million (the “Sovereign Loan”). The proceeds of the Sovereign Loan are being used primarily to finance costs associated with refurbishment of the Nixon Facility’s naphtha stabilizer and depropanizer units. On August 7, 2014, LRM also entered into a 36 month “build-to-suit” capital lease for the purchase of new boiler equipment for the Nixon Facility. The boiler equipment was delivered in December 2014.
Indebtedness
The principal balance outstanding on the Refinery Note was $8,545,466 and $8,648,980 at March 31, 2015 and December 31, 2014, respectively. The principal balance outstanding on the Sovereign Loan was $1,479,949 and $1,638,898 at March 31, 2015 and December 31, 2014, respectively. The principal balance outstanding on the Notre Dame Debt was $1,300,000 at both March 31, 2015 and December 31, 2014. The principal balance outstanding on a capital lease was $428,759 and $466,401 at March 31, 2015 and December 31, 2014, respectively. See “Part I, Item 1. Financial Statements - Note (12) Long-Term Debt” of this report for additional disclosures related to our long-term debt obligations.
37
ITEM 4. CONTROLS AND PROCEDURES
Disclosure Controls and Procedures
As of the end of the period covered by this report, we carried out an evaluation under the supervision and with the participation of our management, including our Principal Executive Officer and Principal Financial Officer, of the effectiveness of the design and operation of our disclosure controls and procedures as defined in Rules 13a-15(e) and 15d-15(e) under the Securities Exchange Act of 1934 (the “Exchange Act”). We determined that we have inadequate personnel resources to ensure complete segregation of duties within the accounting function. Additionally, we lack documented testing of our financial controls and procedures. The combination of these control deficiencies reflect a material weakness in our internal control over financial reporting.
Based on our evaluation, our Chief Executive Officer (principal executive officer) and interim Chief Financial Officer (principal financial officer) concluded that our disclosure controls and procedures were ineffective as of March 31, 2015. Our disclosure controls and procedures, as defined in Exchange Act Rules 13a-15(e) and 15d-15(e), require us to provide reasonable assurance that information required to be disclosed by us in the reports we file or submit under the Exchange Act is recorded, processed, summarized and reported within the time periods specified in the Securities and Exchange Commission’s rules and forms, and information required to be disclosed by us in the reports we file or submit under the Exchange Act is accumulated and communicated to our management, including our Chief Executive Officer and interim Chief Financial Officer, as appropriate to allow timely decisions regarding required disclosures.
The effectiveness of any system of controls and procedures is subject to certain limitations, and, as a result, there can be no assurance that our controls and procedures will detect all errors or fraud. A control system, no matter how well conceived and operated, can provide only reasonable, not absolute, assurance that the objectives of the control system will be attained.
Changes in Internal Control over Financial Reporting
There were no changes in our internal control over financial reporting as defined in Rules 13a-15(f) and 15d-15(f) under the Exchange Act during the three months ended March 31, 2015 that have materially affected, or are reasonably likely to materially affect, our internal control over financial reporting.
38
PART II OTHER INFORMATION
From time to time we are subject to various lawsuits, claims, liens and administrative proceedings that arise out of the normal course of business. Vendors have placed mechanic’s liens on the Nixon Facility as protection during construction activities. Management does not believe that such liens have a material adverse effect on our results of operations.
In addition to the other information set forth in this report, careful consideration should be given to the risk factors discussed under “Part I, Item 1A. Risk Factors” and elsewhere in our previously filed annual report on Form 10-K for the year ended December 31, 2014. These risks and uncertainties could materially and adversely affect our business, financial condition and results of operations. Our operations could also be affected by additional factors that are not presently known to us or by factors that we currently consider immaterial to our business. There have been no material changes in our assessment of our risk factors from those set forth in our previously filed annual report on Form 10-K for the year ended December 31, 2014.
ITEM 2. UNREGISTERED SALES OF EQUITY SECURITIES AND USE OF PROCEEDS
None.
ITEM 3. DEFAULTS UPON SENIOR SECURITIES
See “Part I, Item. 1. Financial Statements – Note (12) Long-Term Debt” of this report for disclosures related to potential defaults on debt.
Not applicable.
ITEM 5. OTHER INFORMATION
None.
(a) Exhibits:
The following exhibits are filed herewith:
| No. | Description | |
|
31.1
|
Jonathan P. Carroll Certification Pursuant to 18 U.S.C. Section 1350, as adopted pursuant to section 302 of the Sarbanes-Oxley Act of 2002.
|
|
|
31.2
|
Tommy L. Byrd Certification Pursuant to 18 U.S.C. Section 1350, as adopted pursuant to section 302 of the Sarbanes-Oxley Act of 2002.
|
|
|
32.1
|
Jonathan P. Carroll Certification Pursuant to 18 U.S.C. Section 1350, as adopted pursuant to section 906 of the Sarbanes-Oxley Act of 2002.
|
|
|
32.2
|
Tommy L. Byrd Certification Pursuant to 18 U.S.C. Section 1350, as adopted pursuant to section 906 of the Sarbanes-Oxley Act of 2002.
|
|
|
101.INS
|
XBRL Instance Document.
|
|
|
101.SCH
|
XBRL Taxonomy Schema Document.
|
|
|
101.CAL
|
XBRL Calculation Linkbase Document.
|
|
|
101.LAB
|
XBRL Label Linkbase Document.
|
|
|
101.PRE
|
XBRL Presentation Linkbase Document.
|
|
|
101.DEF
|
XBRL Definition Linkbase Document.
|
39
SIGNATURES
Pursuant to the requirements of the Securities Exchange Act of 1934, the registrant has duly caused this report to be signed on its behalf by the undersigned, thereunto duly authorized.
|
BLUE DOLPHIN ENERGY COMPANY
(Registrant)
|
|||
|
Date: May 15, 2015
|
By:
|
/s/ JONATHAN P. CARROLL
|
|
|
Jonathan P. Carroll
|
|||
|
Chairman of the Board,
Chief Executive Officer, President,
Assistant Treasurer and Secretary
(Principal Executive Officer)
|
|||
|
Date: May 15, 2015
|
By:
|
/s/ TOMMY L. BYRD
|
|
|
Tommy L. Byrd
|
|||
|
Interim Chief Financial Officer,
Treasurer and Assistant Secretary
(Principal Financial Officer)
|
|||
40