Attached files
| file | filename |
|---|---|
| 8-K - FORM 8-K - ANI PHARMACEUTICALS INC | v410784_8k.htm |
| EX-99.1 - EXHIBIT 99.1 - ANI PHARMACEUTICALS INC | v410784_ex99-1.htm |
Exhibit 99.2
A Specialty Pharmaceutical Company NASDAQ: ANIP GENERIC AND BRANDED PRESCRIPTION DRUG PRODUCTS Corporate Presentation May 2015
Forward - Looking Statements To the extent any statements made in this presentation deal with information that is not historical, these are forward - looking statements within the meaning of the Private Securities Litigation Reform Act of 1995. Such statements include, but are not limited to, statements about price increases, the Company’s future operations, products financial position, operating results and prospects , the Company’s pipeline or potential markets therefore, and other statements that are not historical in nature, particularly those that utilize terminology such as “anticipates,” “will,” “expects,” “plans,” “potential,” “future,” “believes,” “intends,” “continue,” other words of similar meaning, derivations of such words and the use of future dates. Uncertainties and risks may cause the Company’s actual results to be materially different than those expressed in or implied by such forward - looking statements. Uncertainties and risks include, but are not limited to, the risk that the Company may face with respect to importing raw materials; increased competition; delays or failure in obtaining product approval from the U.S. Food and Drug Administration; general business and economic conditions; market trends; products development; regulatory and other approvals and marketing. More detailed information on these and additional factors that could affect the Company’s actual results are described in the Company’s filings with the Securities and Exchange Commission, including its most recent annual report on Form 10 - K and quarterly reports on Form 10 - Q, as well as its proxy statement. All forward - looking statements in this presentation speak only as of the date of this presentation and are based on the Company’s current beliefs, assumptions, and expectations. The Company undertakes no obligation to update or revise any forward - looking statement, whether as a result of new information, future events or otherwise. 2
3 ANI Mission Statement ANI Pharmaceuticals is an integrated specialty pharmaceutical company developing, manufacturing and marketing branded and generic prescription pharmaceuticals. ANI’s mission is to develop, manufacture, and market niche generic pharmaceuticals, focusing on opportunities in pain management (narcotics), anti - cancer (oncolytics), women’s health (hormones and steroids), and complex formulations including extended release and combination products.
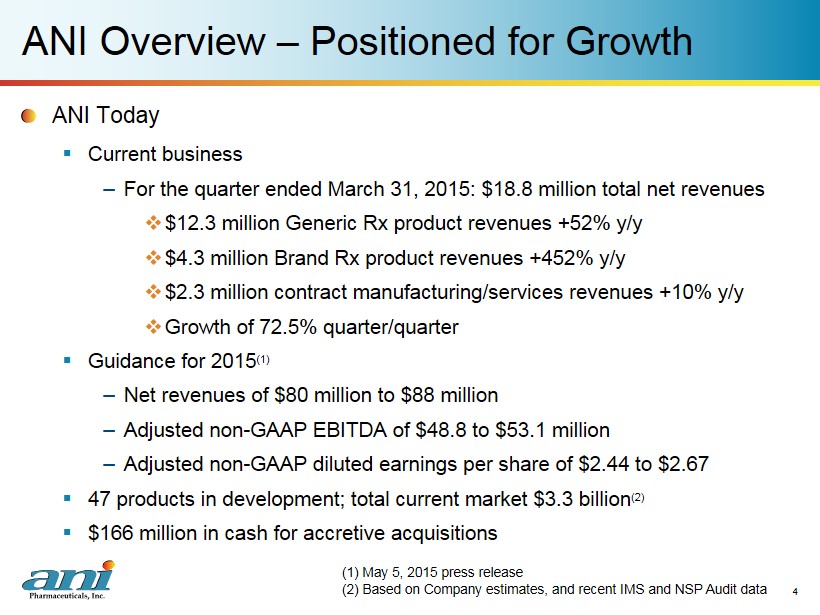
ANI Overview – Positioned for Growth ANI Today ▪ Current business – For the quarter ended March 31, 2015: $18.8 million total net revenues □ $12.3 million Generic Rx product revenues +52% y/y □ $4.3 million Brand Rx product revenues +452% y/y □ $2.3 million c ontract manufacturing/services revenues +10% y/y □ Growth of 72.5% quarter/quarter ▪ Guidance for 2015 (1) – Net revenues of $80 million to $88 million – Adjusted non - GAAP EBITDA of $48.8 to $53.1 million – Adjusted non - GAAP diluted earnings per share of $2.44 to $2.67 ▪ 47 products in development; total current market $3.3 billion (2) ▪ $166 million in cash for accretive acquisitions (1) May 5, 2015 press release (2) Based on Company estimates, and recent IMS and NSP Audit data 4
5 ANI History and Highlights 2013 Completed merger with BioSante Pharmaceuticals and obtains NASDAQ Global Market listing (NASDAQ: ANIP), June 2013 2013 Announced agreement to acquire 31 previously marketed generic products from Teva for $12.5 million and a percentage of future gross profits, December 2013 2014 Closed public offering of common shares netting $46.8 million, March 2014 2014 Acquired Vancocin ® and related assets for $11 million, August 2014 2014 Closed public offering of $143.8 million of convertible debt with simultaneous bond hedge and warrant transactions, December 2014 2014 Acquired Lithobid ® for $12 million, July 2014 2014 Launched Methazolamide Tablets, first product from portfolio of approved generic products acquired from Teva, November 2014 2015 Acquired approved NDA for Testosterone Gel from Teva , May 2015 2015 Acquired approved ANDA for Flecainide tablets from Teva , March 2015 2015 Launched Etodolac Capsules and Propafenone Tablets from portfolio of approved generic products acquired from Teva, March 2015
6 Sales and Marketing / Financial Overview
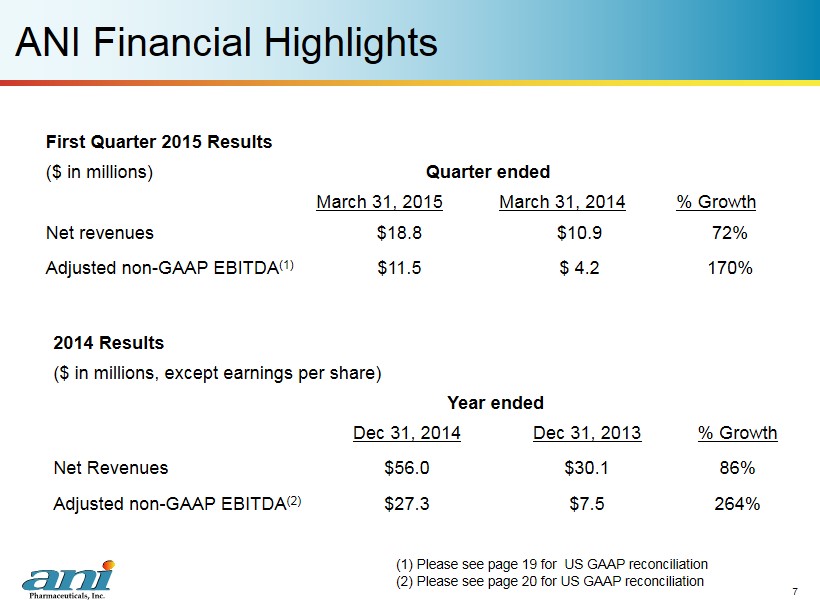
ANI Financial Highlights 7 First Quarter 2015 Results ($ in millions) Quarter ended March 31, 2015 March 31, 2014 % Growth Net revenues $18.8 $10.9 72% Adjusted non - GAAP EBITDA (1) $11.5 $ 4.2 170% (1) Please see page 19 for US GAAP reconciliation (2) Please see page 20 for US GAAP reconciliation 2014 Results ($ in millions, except earnings per share) Year ended Dec 31, 2014 Dec 31, 2013 % Growth Net Revenues $56.0 $30.1 86% Adjusted non - GAAP EBITDA (2) $27.3 $7.5 264%
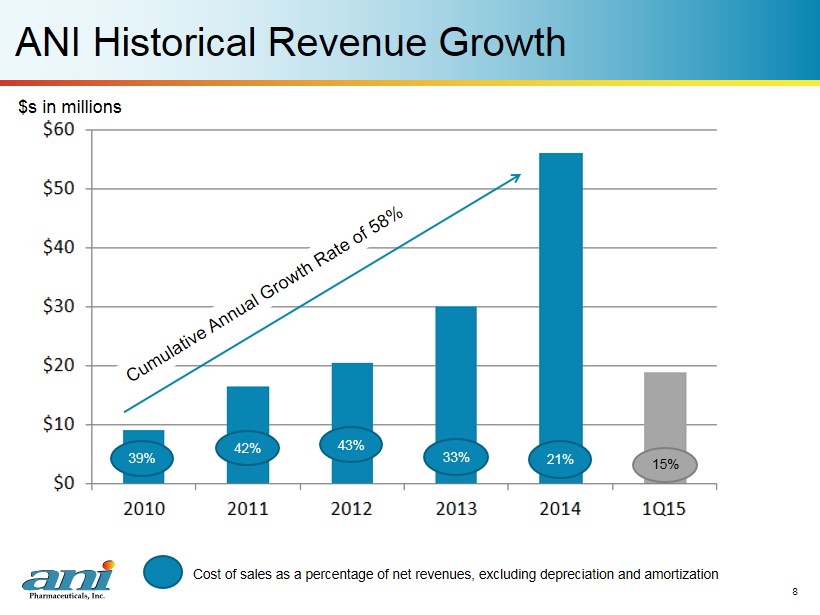
ANI Historical Revenue Growth 8 $s in millions 39% C ost of sales as a percentage of net revenues, excluding depreciation and amortization 42% 43% 33% 21% 15%
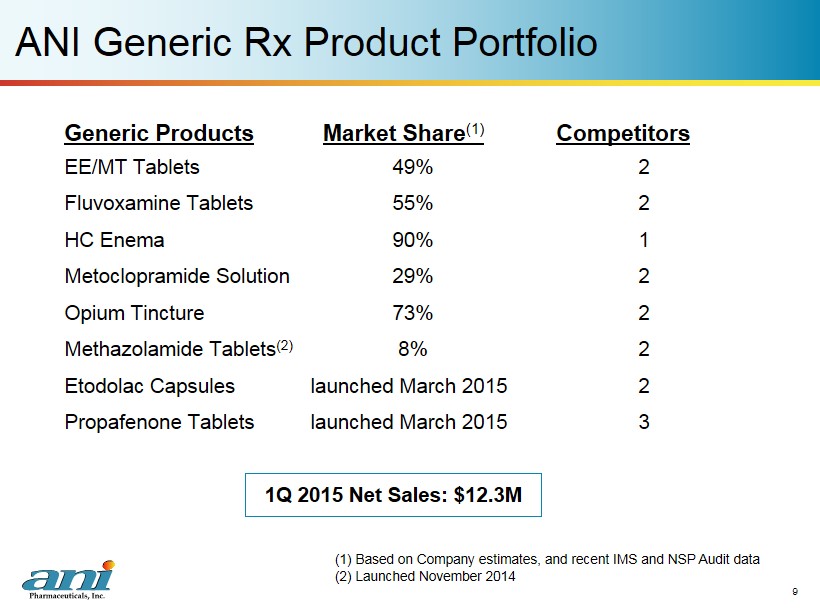
ANI Generic Rx Product Portfolio Generic Products Market Share (1) Competitors EE/MT Tablets 49% 2 Fluvoxamine Tablets 55% 2 HC Enema 90% 1 Metoclopramide Solution 29% 2 Opium Tincture 73% 2 Methazolamide Tablets (2) 8% 2 Etodolac Capsules launched March 2015 2 Propafenone Tablets launched March 2015 3 9 (1) Based on Company estimates, and recent IMS and NSP Audit data (2) Launched November 2014 1Q 2015 Net Sales: $12.3M
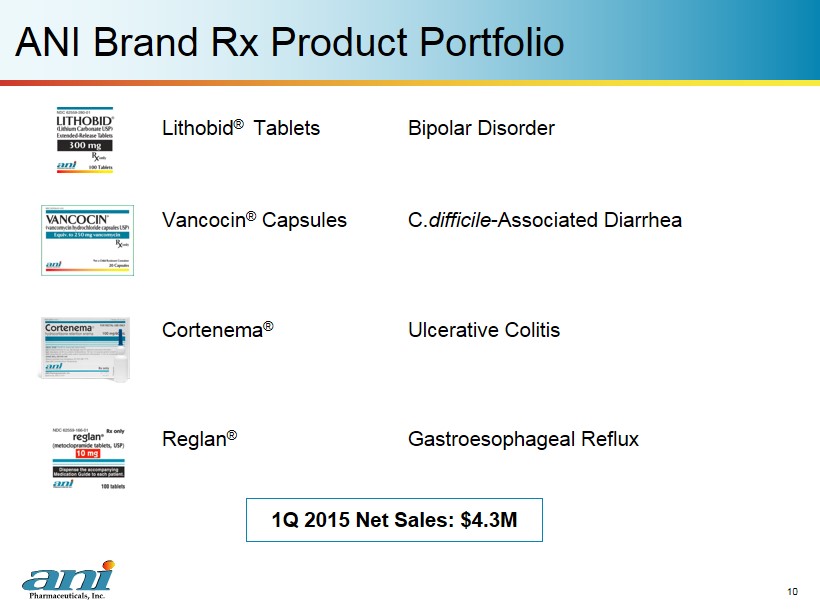
ANI Brand Rx Product Portfolio 10 Lithobid ® Tablets Bipolar Disorder Vancocin ® Capsules C. difficile - Associated Diarrhea Cortenema ® U lcerative Colitis Reglan ® Gastroesophageal Reflux 1Q 2015 Net Sales: $4.3M
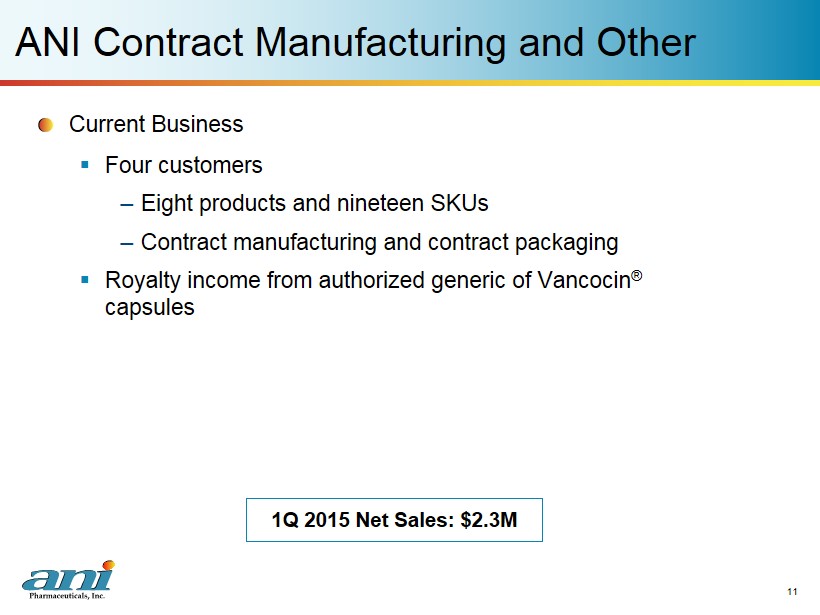
ANI Contract Manufacturing and Other 11 Current Business ▪ Four customers – Eight products and nineteen SKUs – Contract manufacturing and contract packaging ▪ Royalty income from authorized generic of Vancocin ® capsules 1Q 2015 Net Sales: $2.3M
12 Product Development / Business Development Overview
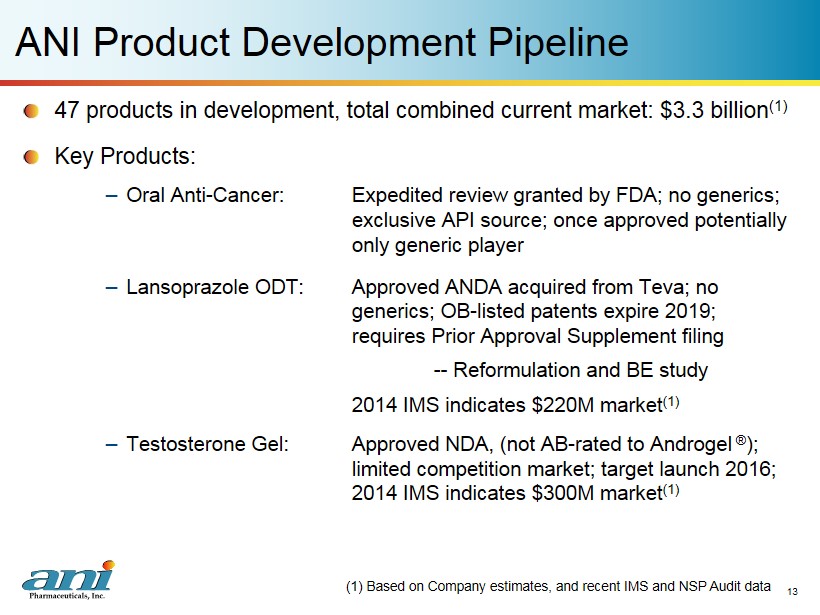
13 ANI Product Development Pipeline 47 p roducts in development, total combined current market: $3.3 billion (1) Key Products: – Oral Anti - Cancer: Expedited review granted by FDA; no generics; exclusive API source; once approved potentially only generic player – Lansoprazole ODT: Approved ANDA acquired from Teva ; no generics; OB - listed patents expire 2019; requires Prior Approval Supplement filing -- Reformulation and BE study 2014 IMS indicates $220M market (1) – Testosterone Gel: Approved NDA, (not AB - rated to Androgel ® ); limited competition market; target launch 2016; 2014 IMS indicates $300M market (1) (1) Based on Company estimates, and recent IMS and NSP Audit data
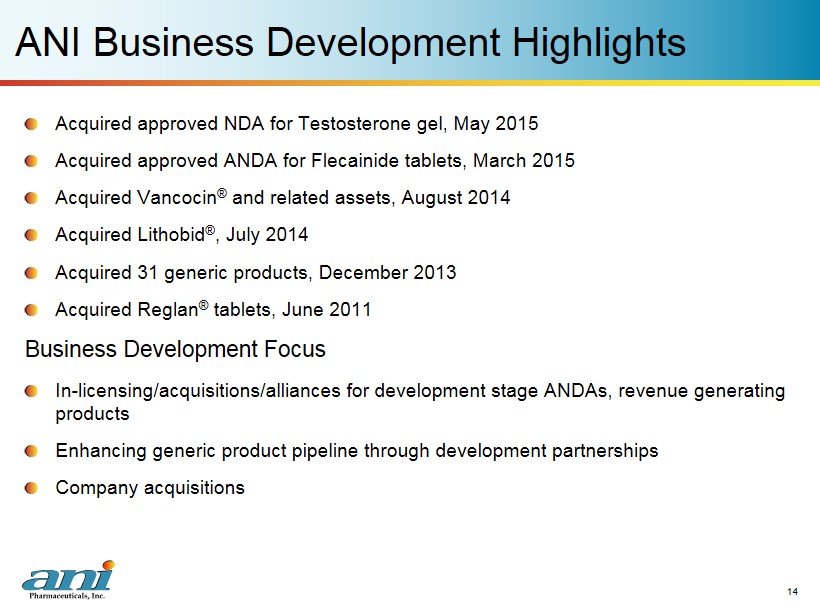
14 ANI Business Development Highlights Acquired approved NDA for Testosterone gel, May 2015 Acquired approved ANDA for Flecainide tablets, March 2015 Acquired Vancocin ® and related assets, August 2014 Acquired Lithobid ® , July 2014 Acquired 31 generic products, December 2013 Acquired Reglan ® tablets, June 2011 Business Development Focus In - licensing/acquisitions/alliances for development stage ANDAs, revenue generating products Enhancing generic product pipeline through development partnerships Company acquisitions
15 Manufacturing Overview
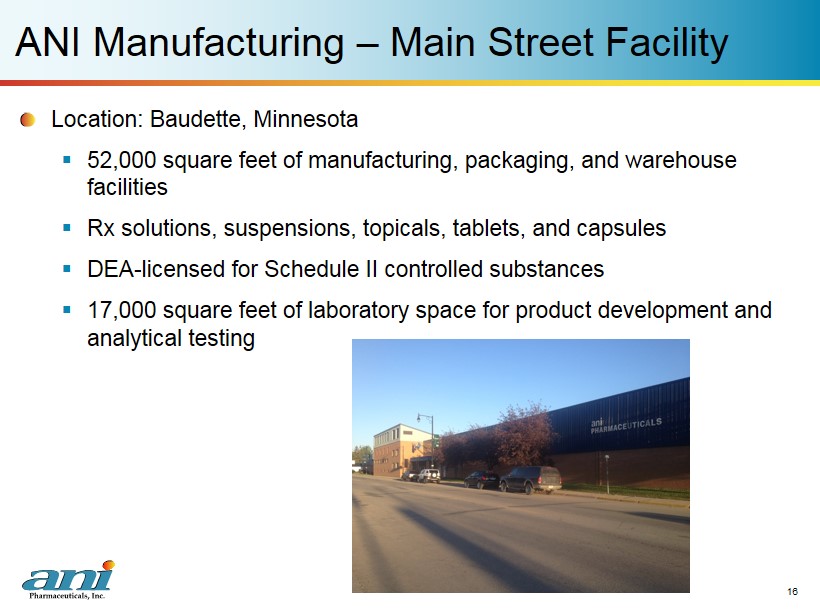
16 ANI Manufacturing – Main Street Facility Location: Baudette , Minnesota ▪ 52,000 square feet of manufacturing , packaging, and warehouse facilities ▪ Rx solutions , suspensions , topicals , tablets , and capsules ▪ DEA - licensed for Schedule II controlled substances ▪ 17,000 square feet of laboratory space for product development and analytical testing
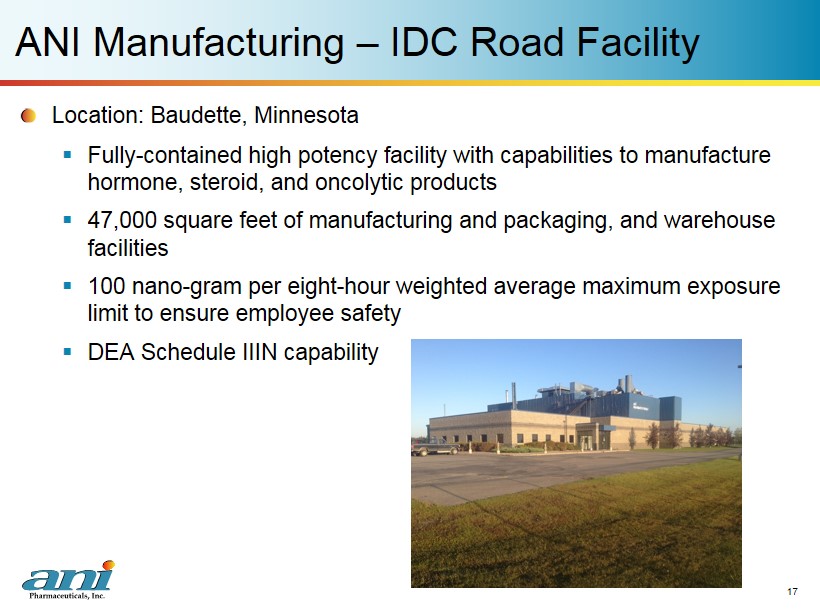
17 ANI Manufacturing – IDC Road Facility Location: Baudette, Minnesota ▪ Fully - contained h igh potency facility with capabilities to manufacture h ormone , steroid , and oncolytic products ▪ 47,000 square feet of manufacturing and packaging, and warehouse facilities ▪ 100 nano - gram per eight - hour weighted average maximum exposure limit to ensure employee safety ▪ DEA Schedule IIIN capability
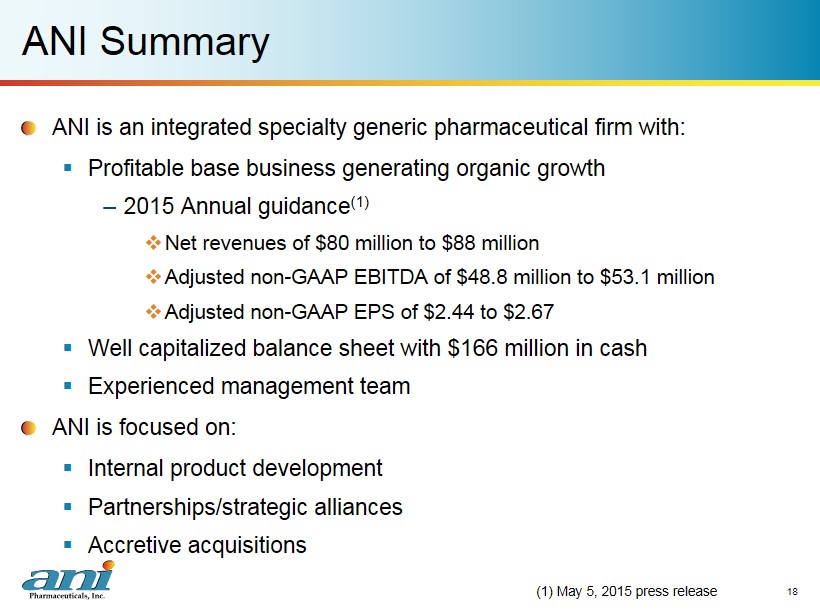
ANI Summary ANI is an integrated specialty generic pharmaceutical firm with: ▪ Profitable base business generating organic growth – 2015 Annual guidance (1) □ Net revenues of $80 million to $88 million □ Adjusted non - GAAP EBITDA of $48.8 million to $53.1 million □ Adjusted non - GAAP EPS of $2.44 to $2.67 ▪ Well capitalized balance sheet with $166 million in cash ▪ Experienced management team ANI is focused on: ▪ Internal product development ▪ Partnerships/strategic alliances ▪ Accretive acquisitions 18 (1) May 5, 2015 press release
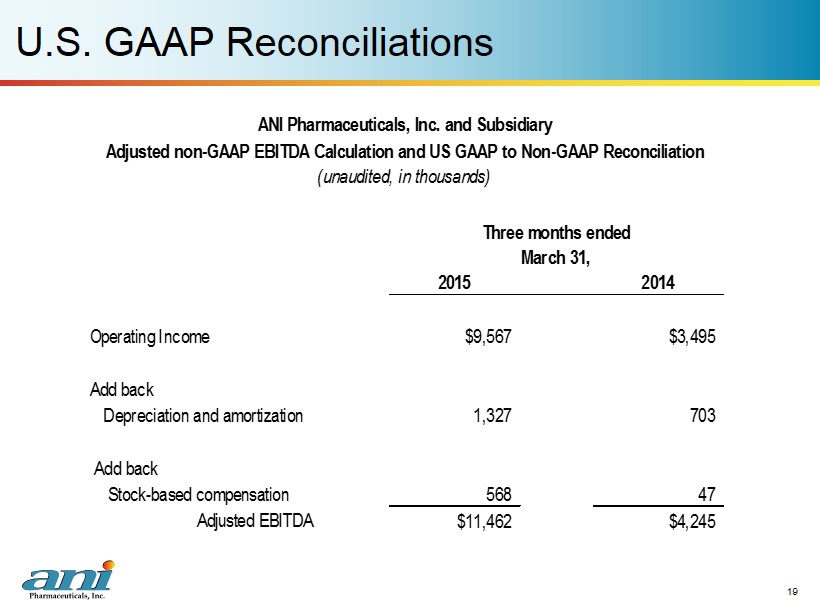
U.S. GAAP Reconciliations 19 2015 2014 Operating Income $9,567 $3,495 Add back Depreciation and amortization 1,327 703 Add back Stock-based compensation 568 47 Adjusted EBITDA $11,462 $4,245 ANI Pharmaceuticals, Inc. and Subsidiary Adjusted non-GAAP EBITDA Calculation and US GAAP to Non-GAAP Reconciliation (unaudited, in thousands) Three months ended March 31,
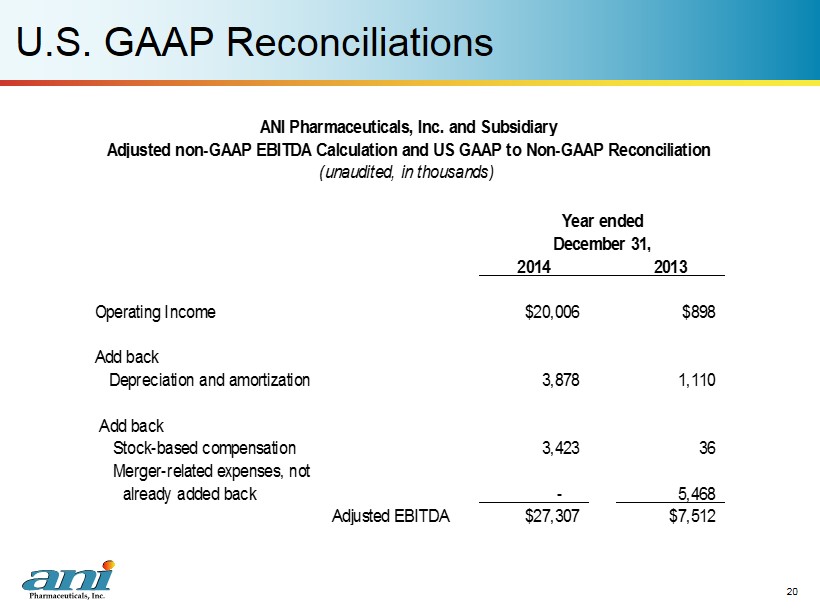
U.S. GAAP Reconciliations 20 2014 2013 Operating Income $20,006 $898 Add back Depreciation and amortization 3,878 1,110 Add back Stock-based compensation 3,423 36 Merger-related expenses, not already added back Adjusted EBITDA $27,307 $7,512 5,468 - ANI Pharmaceuticals, Inc. and Subsidiary Adjusted non-GAAP EBITDA Calculation and US GAAP to Non-GAAP Reconciliation (unaudited, in thousands) Year ended December 31,