Attached files
| file | filename |
|---|---|
| 8-K - CURRENT REPORT - Western New England Bancorp, Inc. | wfd-8k_051415.htm |
Exhibit 99.1

W ESTFIELD F INANCIAL , I NC . A NNUAL M EETING OF S HAREHOLDERS M AY 14, 2015

AGENDA 1. Welcoming Remarks 2. Introductions 3. Procedural Matters Relating to the Conduct of the Annual Meeting 4. Presentation of the Four Proposals before the Annual Meeting 5. Opening of Polls and Balloting 6. Closing of Polls 7. Annual Report of the Company 8. Report of the Inspector of Elections 9. Adjournment of Formal Portion of the Annual Meeting 10. General Question and Answer Period
F ORWARD – LOOKING STATEMENTS Today’s presentation may contain forward - looking statements, which may be identified by the use of such words as “believe,” “expect,” “anticipate,” “should,” “planned,” “estimated” and “potential . ” Examples of forward - looking statements include, but are not limited to, estimates with respect to our financial condition and results of operation and business that are subject to various factors which could cause actual results to differ materially from these estimates . These factors include, but are not limited to : changes in the interest rate environment that reduce margins; changes in the regulatory environment; the highly competitive industry and market area in which we operate; general economic conditions, either nationally or regionally, resulting in, among other things, a deterioration in credit qua lit y; changes in business conditions and inflation; changes in credit market conditions; changes in the securities markets which affect investment management revenues; increases in Federal Deposit Insurance Corporation deposit insurance premiums and assessments could adversely affect our fina nci al condition; changes in technology used in the banking business; the soundness of other financial services institutions which may adversely affect our credit risk; certain of our intangible assets may become impaired in the future; our controls and procedures may fail or be circumvented; new line of business or new products and services, which may subject us to additional risks; changes in key management personnel which may adversely impact our operations; the effect on our operations of governmental legislation and regulation, including changes in accounting regulation or standa rds , the nature and timing of the adoption and effectiveness of new requirements under the Dodd - Frank Act, Basel guidelines, capital requirements and other applicable laws and regulations; severe weather, natural disasters, acts of war or terrorism and other external events which could significantly impact our bu sin ess; and other factors detailed from time to time in our Securities and Exchange Commission (“SEC”) filings. Any or all of our forward - looking statements in today’s presentation or in any other public statements we make may turn out to be wrong . They can be affected by inaccurate assumptions we might make or known or unknown risks and uncertainties . Consequently, no forward - looking statements can be guaranteed . We disclaim any obligation to subsequently revise any forward - looking statements to reflect events or circumstances after the date of such statements, or to reflect the occurrence of anticipated or unanticipated events .

J AMES C. H AGAN P RESIDENT AND C HIEF E XECUTIVE O FFICER
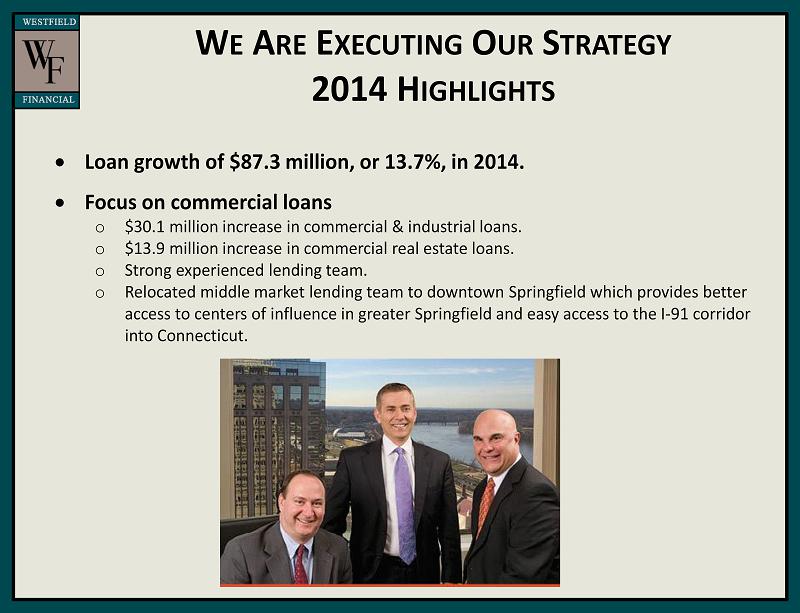
W E A RE E XECUTING O UR S TRATEGY 2014 H IGHLIGHTS Loan growth of $87.3 million, or 13.7%, in 2014. Focus on commercial loans o $30.1 million increase in commercial & industrial loans. o $13.9 million increase in commercial real estate loans. o Strong experienced lending team. o Relocated middle market lending team to downtown Springfield which provides better access to centers of influence in greater Springfield and easy access to the I - 91 corridor into Connecticut .

W E A RE E XECUTING O UR S TRATEGY 2014 H IGHLIGHTS Increasing residential loans to diversify risk and deepen customer relationships o $44.2 million increase in residential loans. o Improved residential lending ability within our branch network through staff training and licensing. o Implemented new processes to speed up turnaround time on loan decisions and closings . Introduced Westfield Wealth Management, a new source of fee income o Formed a strategic alliance with Charter Oak Insurance Agency, a general partner of Massachusetts Mutual Insurance Co . o Offer a variety of services including: ▪ Investment Planning ▪ Trust Services ▪ Insurance

W E A RE E XECUTING O UR S TRATEGY 2014 H IGHLIGHTS Successful market expansion into Connecticut o Granby Banking Center, June 2013. o Enfield Banking Center, November 2014. o Dedicated commercial lender, residential lender, and wealth management advisor for Connecticut. o Deposits of over $23.0 million as of March 31 , 2015.

SELECTED FINANCIAL HIGHLIGHTS Leo R. Sagan Jr., Chief Financial Officer

Q UARTERLY D ILUTED E ARNINGS P ER S HARE $0.04 $0.06 $0.07 $0.08 $0.08 $0.08 $0.09 $0.09 $0.07 $0.08 $0.09 $0.08 $0.00 $0.02 $0.04 $0.06 $0.08 $0.10 Q2 2012 Q3 2012 Q4 2012 Q1 2013 Q2 2013 Q3 2013 Q4 2013 Q1 2014 Q2 2014 Q3 2014 Q4 2014 Q1 2015

C REATING A FAVORABLE SHIFT BY INCREASING LOANS AND REDUCING SECURITIES $ in millions 584 583 595 596 607 620 637 648 686 720 725 730 654 664 636 631 607 558 554 542 496 511 509 515 475 525 575 625 675 725 775 Q2 2012 Q3 2012 Q4 2012 Q1 2013 Q2 2013 Q3 2013 Q4 2013 Q1 2014 Q2 2014 Q3 2014 Q4 2014 Q1 2015 Loans Securities

C ONSISTENTLY S TRONG C REDIT Q UALITY Q1 2015 Q4 2014 Q3 2014 Q2 2014 Q1 2014 Allowance for loan losses as a percentage of loans 1.10% 1.10% 1.07% 1.17% 1.17% Nonperforming loans as a percentage of total loans 1.14% 1.22% 1.23% 0.47% 0.48% Nonperforming assets as a percentage of total assets 0.63% 0.67% 0.68% 0.24% 0.24%

T OTAL D EPOSITS S TEADY GROWTH WHICH IMPROVES FRANCHISE VALUE $ in millions 600 650 700 750 800 850 900 Q2 2012 Q3 2012 Q4 2012 Q1 2013 Q2 2013 Q3 2013 Q4 2013 Q1 2014 Q2 2014 Q3 2014 Q4 2014 Q1 2015 748 754 753 772 783 794 817 807 819 829 834 873

C APITAL M ANAGEMENT S TRATEGIES As of March 31, 2015 0.00% 5.00% 10.00% 15.00% 20.00% 25.00% 2009 2010 2011 2012 2013 2014 Q1 15 20.76% 17.85% 17.34% 14.54% 12.07% 10.80% 10.61% • 2 .3 million shares purchased below TBV for the twelve months ended March 31, 2015. • Dividend payout to shareholders is in line with peers. • Plenty of capital to enable continued asset growth.

S TRONG C APITAL B ASE As of March 31, 2015 Total Capital/Risk Weighted Assets Tier 1 Capital/Risk Weighted Assets Tier 1 Capital/Total Average Assets 5.00% 12.14% 0.00% 3.00% 6.00% 9.00% 12.00% 15.00% 18.00% 21.00% 24.00% Well Capitalized Westfield Financial 6.00% 19.80% 0.00% 3.00% 6.00% 9.00% 12.00% 15.00% 18.00% 21.00% 24.00% Well Capitalized Westfield Financial 10.00% 20.77% 0.00% 3.00% 6.00% 9.00% 12.00% 15.00% 18.00% 21.00% 24.00% Well Capitalized Westfield Financial

T OTAL R ETURN P ERFORMANCE O NE Y EAR T OTAL R ETURN V ERSUS SNL T HRIFT I NDEX (1) - ) Source: SNL Financial, data as of close of business, May 4, 2015 (1) (5.00) 0.00 5.00 10.00 15.00 05/02/2014 06/02/2014 07/02/2014 08/02/2014 09/02/2014 10/02/2014 11/02/2014 12/02/2014 01/02/2015 02/02/2015 03/02/2015 04/02/2015 05/02/2015 WFD SNL U.S. Thrift

W HY I NVEST IN W ESTFIELD F INANCIAL • Stock trading near tangible book . • Experienced, disciplined regional leadership team. • Continued opportunities for organic growth. • Expansion into demographically attractive markets. • Improving mix of interest earning assets. • High credit quality. • Balance sheet mix well positioned for rising rates. • Noninterest income opportunities from new wealth management services.

T HANK Y OU