Attached files
| file | filename |
|---|---|
| 8-K - FORM 8-K - UNITIL CORP | d924068d8k.htm |
 American Gas Association
Financial Forum
May 2015
Exhibit 99.1 |
 1
Safe Harbor Provision
This
presentation
contains
“forward-looking
statements”
made
pursuant
to
the
safe
harbor
provisions of the Private Securities Litigation Reform Act of 1995. These
forward-looking statements include statements regarding Unitil
Corporation’s (“Unitil”) financial condition, results of
operations, capital expenditures, business strategy, regulatory strategy, market opportunities,
and other plans and objectives. In some cases, forward-looking statements
can be identified by terminology such as “may,”
“will,”
“should,”
“expects,”
“plans,”
“anticipates,”
“believes,”
“estimates,”
“predicts,”
“potential”
or “continue”, the negative of such terms, or other comparable
terminology.
These forward-looking statements are neither promises nor guarantees, but
involve risks and uncertainties that could cause the actual results to
differ materially from those set forth in the forward-looking
statements. Those risks and uncertainties include: Unitil’s regulatory
environment (including regulations relating to climate change, greenhouse gas
emissions and other environmental matters); fluctuations in the supply of,
demand for, and the prices of energy commodities and transmission capacity
and Unitil’s ability to recover energy commodity costs in its rates;
customers’ preferred energy sources; severe storms and Unitil’s
ability to recover storm costs in its rates; general economic conditions;
variations in weather; long-term global climate change; Unitil’s
ability to retain its existing customers and attract new customers; Unitil’s
energy brokering customers’
performance and energy used under multi-year energy brokering
contracts; increased competition; integrity and security of operational and
information systems; publicity and reputational risks; and other risks
detailed in Unitil's filings with the Securities and Exchange
Commission,
including
those
appearing
under
the
caption
"Risk
Factors"
in
Unitil's
Annual Report on Form 10-K for the year ended December 31, 2014.
Readers should not place undue reliance on any forward looking statements, which
speak only as of the date they are made. Unitil undertakes no
obligation to update any forward- looking statements to reflect any
change in Unitil’s expectations or in events, conditions, or
circumstances
on
which
any
such
statements
may
be
based,
or
that
may
affect
the
likelihood
that actual results will differ from those set forth in the forward-looking
statements. |
 2
Unitil Overview
Unitil Service Areas
•
Natural gas and electric utility with
operations in Maine, New Hampshire
and Massachusetts
•
Serving approximately 181,000 gas
and electric customers
•
Utility operations sales margin split
55% gas and 45% electric
•
Regulated T&D utility business model
•
Growing operations and customers
•
Regulated electric and gas rate base
growth
•
Robust natural gas system
expansion
•
Constructive rate plans and cost
trackers
•
Attractive dividend yield
•
Experienced management team |
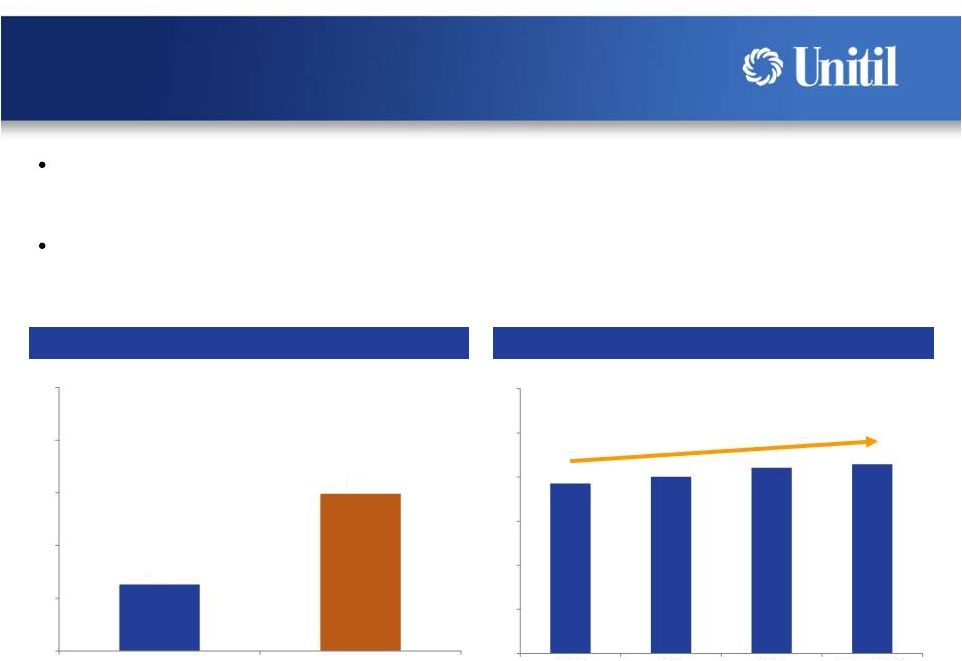
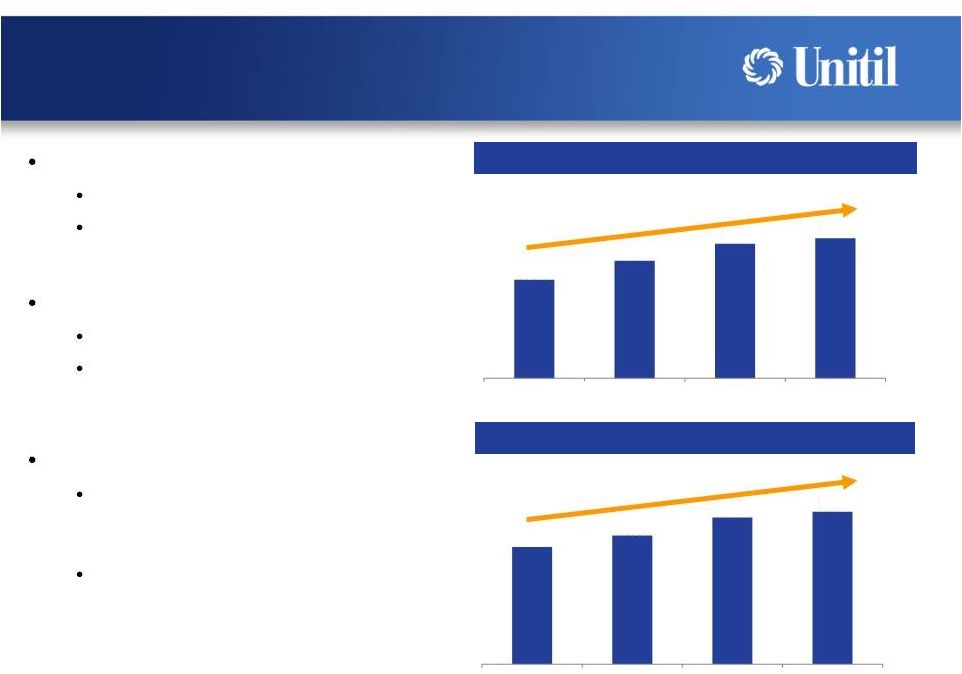 Generating Financial Results
3
Net Income
17% CAGR
($ in millions)
Earnings Per Share
12% CAGR
Robust business fundamentals
Improving economy
Strong demand for natural gas
Utility rate base growth
Significant gas growth potential
Infrastructure replacement and
upgrade projects
Constructive regulation
Rate relief has provided ~50%
increase to sales margin since
2010
High fixed component of rates
and decoupling reduces weather
volatility to earnings
$18.1
$21.6
$24.7
$25.7
2012
2013
2014
LTM Q1 2015
$1.43
$1.57
$1.79
$1.86
2012
2013
2014
LTM Q1 2015 |
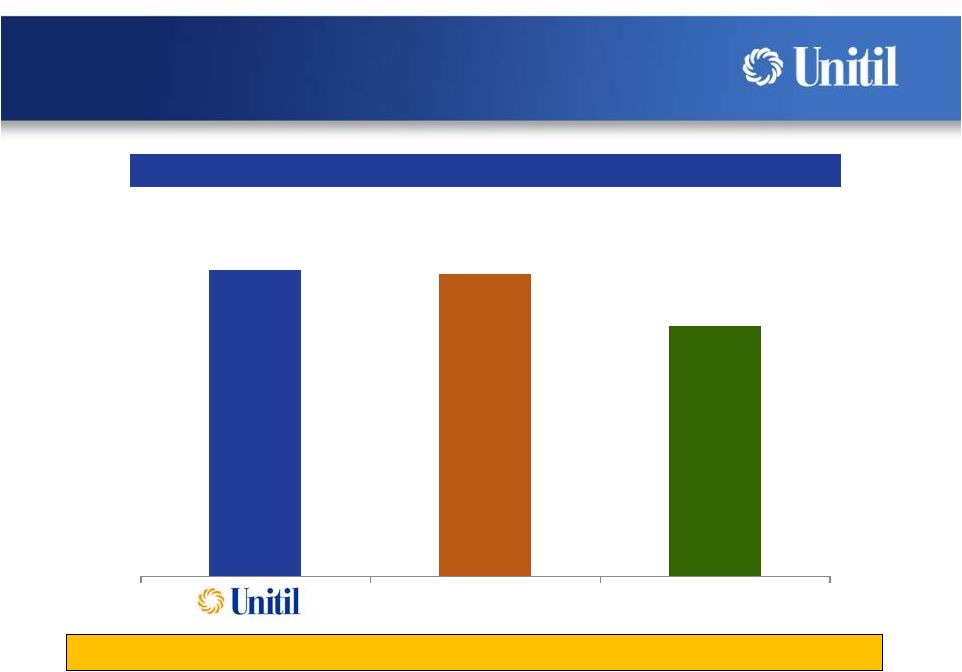 5-Year Total Shareholder Return (2010 -
2014)
Market Performance
4
Unitil 5-year total return of 106% versus 105% for S&P 500 and 87% for
S&P Utility 106%
105%
87%
S&P 500
S&P Utility Index |
 Approximately 100+ years of domestic natural gas supply
U.S. Shale Plays
Domestic Natural Resources
5 |
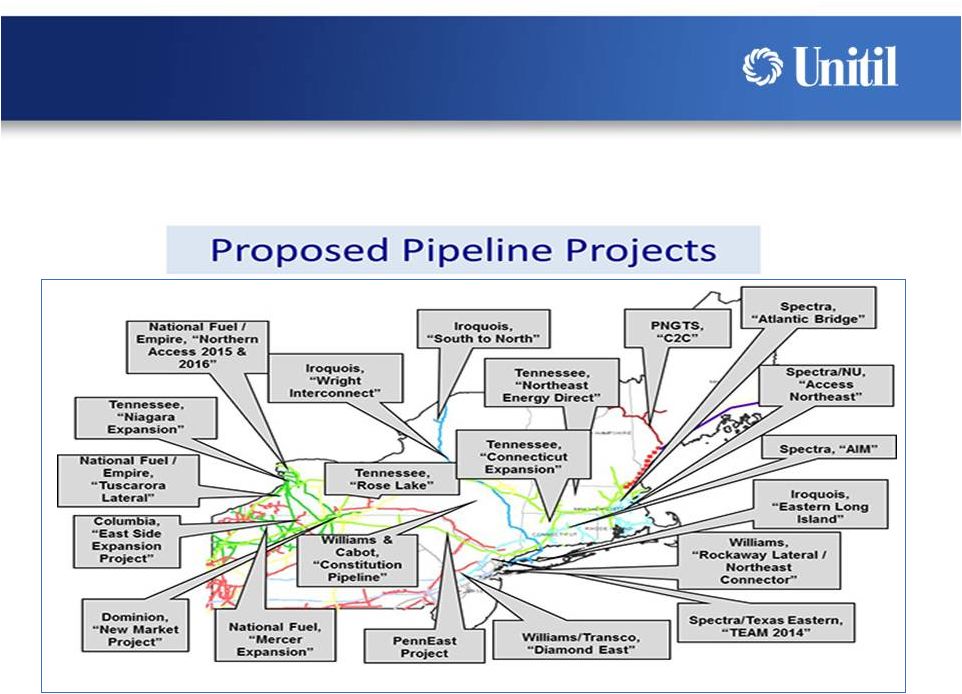 •
Numerous pipeline projects are in development to expand the Northeast pipeline
system, to transport supplies from the Marcellus and Utica shale gas
basins 6
Proposed Northeast
Natural Gas Pipeline Projects
Prepared by Northeast Gas Association based on publicly available information
(2014). Locations approximate. |
 Gas
Growth Potential 7
•
The increasing demand for natural gas in
our service areas provides favorable
conditions for growth
•
Only 60% penetration on existing distribution
system means more room to grow
•
Expansion in adjacent service areas provides
new opportunities for growth each year
•
Convenient, clean, efficient and low cost
natural gas is attracting more and more
commercial and industrial high volume users
Current On-the-Main Penetration
77,900
(60%)
~50,000
(40%)
Current Customers
On-the-Main Prospects |
 The
total
number
of
gas
customers
served
grew
3%
in
2014
–
triple
the
New
England peer group average growth
Weather-normalized gas unit sales have grown at a 5% annual rate since
2012
Customer Growth and Gas Sales
8
Gas Customer Growth
(therms, in millions)
Weather-Normalized Gas Sales
5% CAGR
1%
3%
0%
1%
2%
3%
4%
5%
New England Peers
Unitil
0
50
100
150
200
250
300
2012
2013
2014
LTM Q1 2015 |
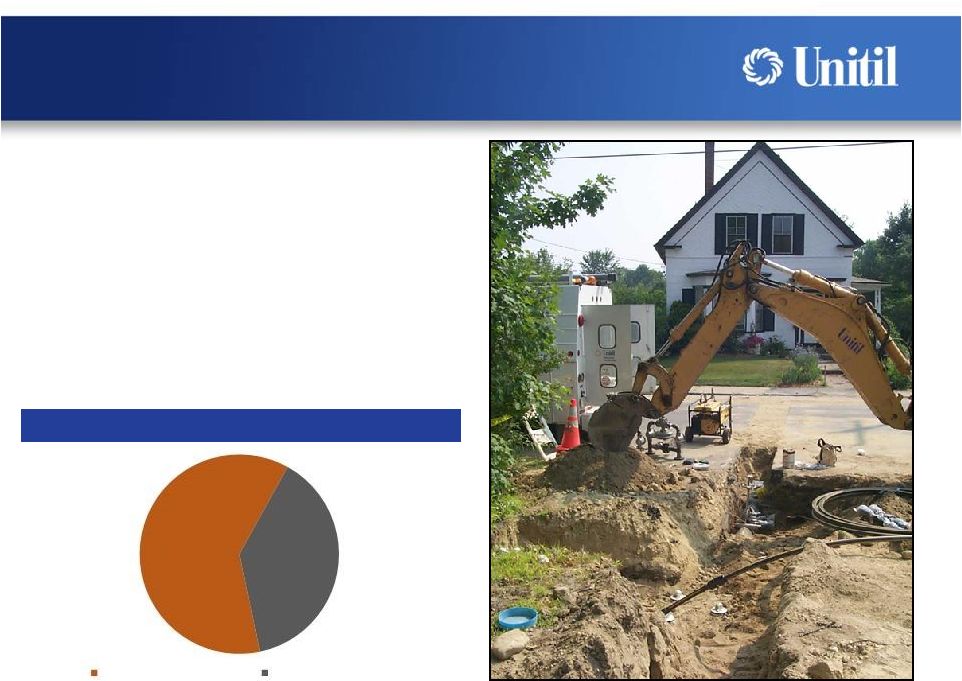
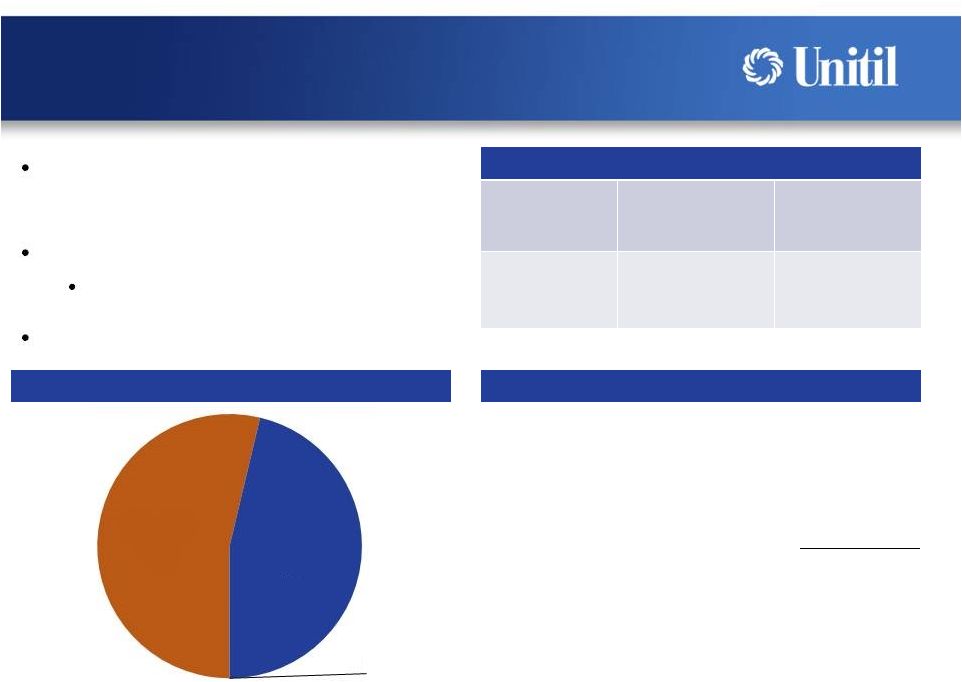
 •
Recent rate design changes
have reduced weather volatility
•
25% of gas margin is fixed (i.e.
customer charge) which levels
customers bills throughout the
year
•
17% of gas margin is decoupled
–
margin is unaffected by
weather
2014 Gas Margin
9
Stability of Gas Margin
Fixed
25%
Decoupled
17%
Variable
58% |
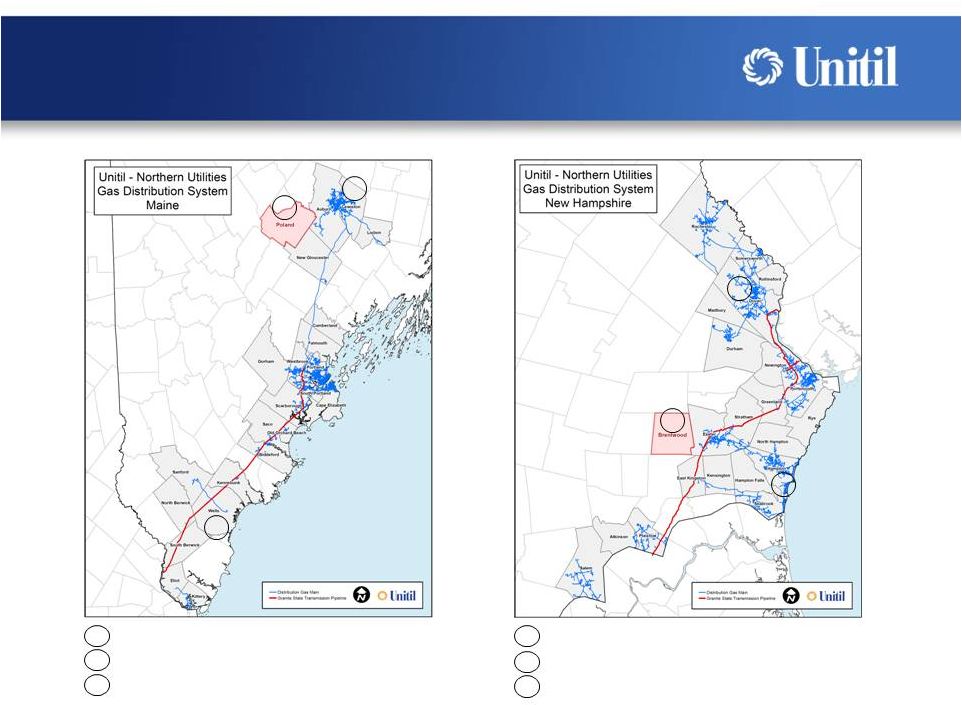 4
Brentwood New Service Area
5
Dover Extension
6
Hampton Extension
1
Poland New Service Area
2
Wells Extension
3
Lewiston Extension
10
New Service Area Expansion
1
2
3
4
5
6 |
 0
4
8
12
16
20
2012
2013
2014
2015 F
2016 F
2017 F
ME
NH
MA
Infrastructure Replacement
11
Modern
gas
infrastructure
–
Approximately
70%
of
gas
mains
are
contemporary
materials
-
polyethylene plastic and protected steel
Replacing
~14
miles
of
remaining
older
leak
prone
mains
annually
across
all
three
states
to
achieve continuous improvement and modernization of entire natural gas delivery
system Cast Iron / Bare Steel Miles Replaced |
 Electric Substation Projects
12
Construction of two major electric distribution
substations in New Hampshire began in 2014
Provides capacity to meet forecasted load growth
in New Hampshire
Enhances reliability and addresses capacity
constraints at existing substations
Kingston Project:
Kingston, NH (Seacoast Region)
Construction began 2014; in service 2016
Total cost of ~$12 million
Broken Ground Project:
Concord, NH (Capital Region)
Construction to begin 2015; in service 2017
Total cost of ~$11 million |
 Capital Budget and Rate Base
13
($ in millions)
($ in millions)
Electric Rate Base
2015 Capital Budget $98 million
Gas Rate Base
3%
10%
($ in millions)
Total capital budget of $98 million
in 2015
Gas
–
$58
million
Electric
–
$31
million
Information
technology
–
$9
million
Gas rate base has grown at an
annual rate of 10% since 2009
Gas
Distribution
Expansion
$21
Electric
Distribution
Expansion
$14
Information
Technology
$9
Infrastructure
Replacement
$22
Gas & Electric
Other
Requirements
$32
$0
$75
$150
$225
$300
$375
2009
2010
2011
2012
2013
2014
$0
$75
$150
$225
$300
$375
2009
2010
2011
2012
2013
2014 |
 14
Balanced Capital Structure
3/31/15 Liquidity
3/31/15 Capitalization
Standard and Poor’s corporate
rating of BBB+
Balanced capital structure
46% equity capitalization
Significant liquidity to fund growth
($ in millions)
Credit Facility Limit
120.0
$
Less: Current Balance
32.0
Liquidity
88.0
$
S&P Credit Rating
Unitil
Consolidated
Unitil Utility
Subsidiaries
Corporate
Rating
BBB+
BBB+
Long Term
Debt
54%
Common
Equity
46%
Preferred
Stock
<0.1% |
 Sales and customer growth combined with constructive rate case results and
cost trackers continue to drive increases in return on equity
Constructive Regulation
15
Return on Equity
Achieved ~$60 million (~50% increase to sales margin) in rate relief since
2010 8.0%
8.2%
9.2%
9.2%
0.0%
3.0%
6.0%
9.0%
12.0%
15.0%
2012
2013
2014
LTM Q1 2015 |
 16
Dividend Strength
Recently increased dividend in Q1 2015
Current quarterly dividend of $0.35 (annual dividend of
$1.40 per share)
Current dividend yield of ~4%
Since incorporation in 1984, Unitil has continuously paid
quarterly dividends and has never reduced its dividend
rate |
 17
Key Investment Highlights
Regulated local distribution utility
business model
Diversified natural gas and electric sales
Growing operations and customer base
Regulated rate base growth
Robust natural gas system expansion
Constructive rate plans and cost trackers
Dividend strength
Experienced management team |