Attached files
| file | filename |
|---|---|
| EX-23.3 - EX-23.3 - Fortress Transportation & Infrastructure Investors LLC | d616610dex233.htm |
| EX-23.2 - EX-23.2 - Fortress Transportation & Infrastructure Investors LLC | d616610dex232.htm |
| EX-23.9 - EX-23.9 - Fortress Transportation & Infrastructure Investors LLC | d616610dex239.htm |
| EX-23.10 - EX-23.10 - Fortress Transportation & Infrastructure Investors LLC | d616610dex2310.htm |
Table of Contents
As filed with the Securities and Exchange Commission on May 14, 2015
Registration No. 333-193182
UNITED STATES
SECURITIES AND EXCHANGE COMMISSION
WASHINGTON, DC 20549
Amendment No. 7
to
FORM S-1
REGISTRATION STATEMENT
UNDER
THE SECURITIES ACT OF 1933
Fortress Transportation and Infrastructure Investors LLC
(Exact name of registrant as specified in its charter)
| Delaware | 6141 | 32-0434238 | ||
| (State or Other Jurisdiction of Incorporation or Organization) |
(Primary Standard Industrial Classification Code Number) |
(I.R.S. Employer Identification No.) |
1345 Avenue of the Americas, 46th Floor
New York, New York 10105
(212) 798-6100
(Address, Including Zip Code, and Telephone Number, Including Area Code, of Registrant’s Principal Executive Offices)
Cameron D. MacDougall
1345 Avenue of the Americas, 46th Floor
New York, New York 10105
(212) 798-6100
(Name, Address, Including Zip Code, and Telephone Number, Including Area Code, of Agent For Service)
Copies to:
| Joseph A. Coco Michael J. Zeidel Skadden, Arps, Slate, Meagher & Flom LLP Four Times Square New York, New York 10036-6522 (212) 735-3000 |
William M. Hartnett Helene R. Banks Cahill Gordon & Reindel LLP Eighty Pine Street New York, New York 10005-1702 (212) 701-3000 |
Approximate date of commencement of proposed sale to the public: As soon as practicable after the effective date of this registration statement.
If any of the securities being registered on this Form are to be offered on a delayed or continuous basis pursuant to Rule 415 under the Securities Act of 1933, check the following box: ¨
If this Form is filed to register additional securities for an offering pursuant to Rule 462(b) under the Securities Act, please check the following box and list the Securities Act registration statement number of the earlier effective registration statement for the same offering. ¨
If this Form is a post-effective amendment filed pursuant to Rule 462(c) under the Securities Act, check the following box and list the Securities Act registration statement number of the earlier effective registration statement for the same offering. ¨
If this Form is a post-effective amendment filed pursuant to Rule 462(d) under the Securities Act, check the following box and list the Securities Act registration statement number of the earlier effective registration statement for the same offering. ¨
Indicate by check mark whether the registrant is a large accelerated filer, an accelerated filer, a non-accelerated filer, or a smaller reporting company. See the definitions of “large accelerated filer,” “accelerated filer” and “smaller reporting company” in Rule 12b-2 of the Exchange Act.
| Large accelerated filer | ¨ | Accelerated filer | ¨ | |||
| Non-accelerated filer | x (Do not check if a smaller reporting company) | Smaller reporting company | ¨ | |||
CALCULATION OF REGISTRATION FEE
|
| ||||||||
| Title of Each Class of Securities To Be Registered |
Amount to be Registered (1) |
Proposed Maximum Offering Price per Share (2) |
Proposed Maximum Aggregate Offering Price (2) |
Amount Of Registration Fee | ||||
| Common shares, representing limited liability company interests |
23,000,000 | $21.00 | $483,000,000 | $56,125(3) | ||||
|
| ||||||||
| (1) | Includes 3,000,000 common shares that may be sold pursuant to the underwriters’ option to purchase additional common shares. |
| (2) | Estimated solely for the purpose of computing the registration fee pursuant to Rule 457(a) under the Securities Act. |
| (3) | The registration fee for the offering was previously paid. |
The Registrant hereby amends this Registration Statement on such date or dates as may be necessary to delay its effective date until the Registrant shall file a further amendment which specifically states that this Registration Statement shall thereafter become effective in accordance with Section 8(a) of the Securities Act of 1933 or until the Registration Statement shall become effective on such date as the Securities and Exchange Commission, acting pursuant to said Section 8(a), may determine.
Table of Contents
The information in this preliminary prospectus is not complete and may be changed. We may not sell these securities until the registration statement filed with the Securities and Exchange Commission is effective. This preliminary prospectus is not an offer to sell these securities and it is not soliciting an offer to buy these securities in any state where the offer or sale is not permitted.
SUBJECT TO COMPLETION, DATED MAY 14, 2015
PRELIMINARY PROSPECTUS

Fortress Transportation and Infrastructure Investors LLC
20,000,000 Common Shares
Representing Limited Liability Company Interests
This is an initial public offering of common shares representing limited liability company interests of Fortress Transportation and Infrastructure Investors LLC. We are selling 20,000,000 of our common shares. After this offering, we will be externally managed by FIG LLC, which is an affiliate of Fortress Investment Group LLC (“Fortress”). Pursuant to the terms of a Management Agreement we have entered into in connection with this offering, FIG LLC, as our Manager, will be responsible for the day-to-day management of our operations, including sourcing, analyzing and executing on asset acquisitions and sales in accordance with our board-approved criteria. See “Our Manager and Management Agreement and Other Compensation Arrangements.”
We expect the public offering price to be between $19.00 and $21.00 per share. Currently, no public market exists for the shares. We have been approved to list our common shares on the New York Stock Exchange (“NYSE”) under the symbol “FTAI.” We will be treated, for U.S. federal income tax purposes, as a partnership and not as an association or a publicly traded partnership taxable as a corporation. See “United States Federal Income Tax Considerations—Taxation of FTAI.”
We are an “emerging growth company” as defined under applicable Federal securities laws and have elected to utilize reduced public company reporting requirements. See “Risk Factors—Risks Related to Our Common Shares—We are an emerging growth company within the meaning of the Securities Act, and due to our taking advantage of certain exemptions from various reporting requirements applicable to emerging growth companies, our common shares could be less attractive to investors.”
Investing in our common shares involves risks. See “Risk Factors” beginning on page 31 to read about certain factors you should consider before buying our common shares.
| Per Share |
Total | |||||||
| Public Offering Price |
$ | $ | ||||||
| Underwriting Discount(1) |
$ | $ | ||||||
| Proceeds Before Expenses to Us |
$ | $ | ||||||
| (1) | We have agreed to reimburse the underwriters for certain expenses in connection with this offering. See “Underwriting.” |
We have granted the underwriters the right for up to 30 days following this offering to purchase up to additional common shares, at the public offering price, less the underwriting discount.
Neither the Securities and Exchange Commission (the “SEC”) nor any state securities commission has approved or disapproved of these securities or passed upon the adequacy or accuracy of this prospectus. Any representation to the contrary is a criminal offense.
The underwriters expect to deliver the common shares against payment on or about , 2015.
Joint Book-Running Managers
| Citigroup | BofA Merrill Lynch | Barclays |
| Deutsche Bank Securities | UBS Investment Bank |
Co-Managers
| JMP Securities | Raymond James | Stephens Inc. |
Wolfe Research Securities
The date of this prospectus is , 2015.
Table of Contents
| 1 | ||||
| 31 | ||||
| 58 | ||||
| 60 | ||||
| 61 | ||||
| 62 | ||||
| 64 | ||||
| 65 | ||||
| 67 | ||||
| MANAGEMENT’S DISCUSSION AND ANALYSIS OF FINANCIAL CONDITION AND RESULTS OF OPERATIONS |
76 | |||
| 105 | ||||
| 115 | ||||
| OUR MANAGER AND MANAGEMENT AGREEMENT AND OTHER COMPENSATION ARRANGEMENTS |
134 | |||
| 141 | ||||
| 149 | ||||
| 150 | ||||
| 152 | ||||
| CERTAIN PROVISIONS OF DELAWARE LAW AND OUR OPERATING AGREEMENT |
154 | |||
| 160 | ||||
| 162 | ||||
| 179 | ||||
| 184 | ||||
| 184 | ||||
| 184 | ||||
| 185 | ||||
| F-1 |
You should rely only on the information contained in this prospectus and any free writing prospectus prepared by us or on our behalf that we have referred you to. We and the underwriters have not authorized anyone to provide you with additional or different information. If anyone provides you with additional, different or inconsistent information, you should not rely on it. We are not making an offer of these securities in any state, country or other jurisdiction where the offer is not permitted. You should not assume that the information in this prospectus or any free writing prospectus is accurate as of any date other than the date of the applicable document regardless of its time of delivery or the time of any sales of our common shares. Our business, financial condition, results of operations or cash flows may have changed since the date of the applicable document.
Until , 2015 (25 days after the date of this prospectus), all dealers that buy, sell or trade our common shares, whether or not participating in this offering, may be required to deliver a prospectus. This is in addition to each dealer’s obligation to deliver a prospectus when acting as underwriter and with respect to its unsold allotments or subscriptions.
Table of Contents
This summary highlights information contained elsewhere in this prospectus. It may not contain all the information that may be important to you. You should read this entire prospectus carefully, including the sections entitled “Risk Factors,” “Management’s Discussion and Analysis of Financial Condition and Results of Operations” and our financial statements and the related notes included elsewhere in this prospectus, before making a decision to purchase our common shares. Some information in this prospectus contains forward-looking statements. See “Forward-Looking Statements.”
Fortress Transportation and Infrastructure Investors LLC (the “Issuer”) is a Delaware limited liability company. Unless the context suggests otherwise, references in this prospectus to “FTAI,” the “Company,” “we,” “us,” and “our” refer to the Issuer and its consolidated subsidiaries, including Fortress Worldwide Transportation and Infrastructure General Partnership (“Holdco”). References in this prospectus to the “General Partner” refer to Fortress Transportation and Infrastructure Master GP LLC, the general partner of the Partnership. References in this prospectus to “Fortress” refer to Fortress Investment Group LLC. References in this prospectus to our “Manager” refer to FIG LLC, our Manager and an affiliate of Fortress. All amounts in this prospectus are expressed in U.S. dollars, except where noted, and the financial statements have been prepared in accordance with U.S. generally accepted accounting principles (“GAAP”).
Our Company
We own and acquire high quality infrastructure and equipment that is essential for the transportation of goods and people globally. We currently invest across four market sectors: aviation, energy, intermodal transport and rail. We target assets that, on a combined basis, generate strong and stable cash flows with the potential for earnings growth and asset appreciation. Our existing mix of assets provides significant cash flows as well as organic growth potential through identified projects. In addition, we believe that there are a large number of acquisition opportunities in our target sectors and that our Manager’s expertise and business and financing relationships, together with our access to capital, will allow us to take advantage of these opportunities. We are externally managed by FIG LLC, an affiliate of Fortress, which has a dedicated team of professionals who collectively have acquired over $17 billion in transportation-related assets since 2002. As of December 31, 2014, we had total consolidated assets of $1,404.2 million and total equity capital of $713.5 million. We intend to pay regular quarterly dividends from funds available for distribution.
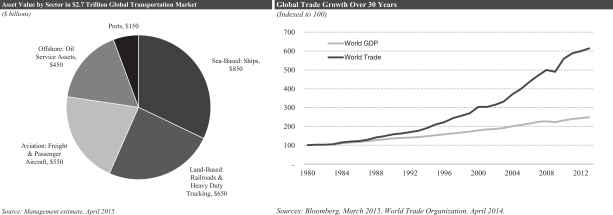
We believe that market developments around the world are generating significant opportunities for the acquisition of infrastructure and equipment essential to the transportation industry. Global trade growth has consistently outpaced global GDP growth over the last three decades and has fueled a large and growing demand for both cargo and passenger-related transportation infrastructure and equipment. At the same time, significant market dislocations are providing tremendous new investment opportunities. Traditional capital providers such as governments and European banks are not keeping pace with the need for long-term capital to support the industry, and we believe this shortage will continue for years to come. We believe that these factors will enable us to acquire attractive assets and continue to grow our business.
Our operations consist of two primary strategic business units—Infrastructure and Equipment Leasing. Our Infrastructure Business acquires long-life assets or operating businesses that provide mission-critical services or functions to transportation networks and typically have high barriers to entry, strong margins, stable cash flows and upside from earnings growth and asset appreciation driven by increased use and inflation. Our Equipment Leasing Business acquires assets that are designed to carry cargo or people or provide functionality to transportation infrastructure. Transportation equipment is typically long-lived, moveable and leased by us to companies that provide transportation services on either operating leases or finance leases. Our leases generally
1
Table of Contents
provide for long-term contractual cash flow with high cash-on-cash yields and may include structural protections to mitigate credit risk. We believe that our existing asset base provides stable cash flow generation with over half of our revenue contracted and the remainder coming from markets with stable or growing demand outlook.
Our goal is to increase our earnings, cash flows and distributions by acquiring a diverse mix of transportation infrastructure and equipment that combine to deliver significant cash flow and upside potential. We target sectors that we believe enjoy strong long-term growth potential and proactively seek investment opportunities within those sectors that we believe have the best risk-adjusted return. We take an opportunistic approach—targeting assets that are distressed or undervalued, or where we believe we can add value through active management, without heavy reliance on the use of financial leverage to generate returns. We also seek to develop incremental opportunities to deploy capital through follow-on investments in our existing assets in order to grow our earnings and create value. As of December 31, 2014, our leverage on a weighted basis across our existing portfolio is approximately 24% of our total capital. While leverage on any individual asset may vary, we target overall leverage for our assets on a consolidated basis of no greater than 50% of our total capital.
The charts below illustrate our existing assets, and our equity deployed in acquiring these assets separated by reporting segment as of December 31, 2014.
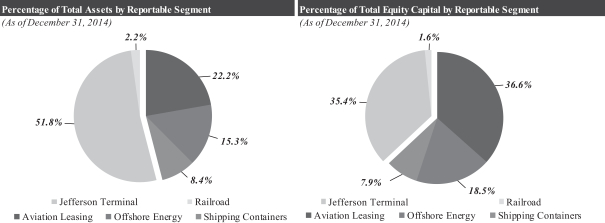
Note:
| • | Excludes $13.9 million of assets and $6.5 million of equity reflected in our corporate operating segment. |
| • | Jefferson Terminal and Railroad are included in our Infrastructure Business and Aviation Leasing, Offshore Energy and Shipping Containers are included in our Equipment Leasing Business. |
Dividends
We view FTAI as a total return investment comprised of current yield and consistent dividend growth. We currently intend to pay regular quarterly dividends and our long term goal is to maintain a payout ratio of between 50-60% of funds available for distribution, with remaining amounts used primarily to fund our future acquisitions. As a public company, there can be no assurance that we will pay dividends in amounts or on a basis consistent with prior distributions to our investors, if at all. See “Dividend Policy.” For the second quarter of 2015, we intend to pay a dividend of $0.33 per share, which will be pro-rated for the period from the consummation of this offering to the end of the quarter and paid in the third quarter of 2015. We have historically not generated sufficient funds available for distribution to support this payout amount and our ability to do so is subject to certain uncertainties including the continued performance of our existing Equipment Leasing Business
2
Table of Contents
as well as the improvement in the operating performance of our Infrastructure Business including Jefferson Terminal and CMQR. Furthermore, some of our prior distributions to our investors would not have been possible without proceeds from equity and debt financings. Any shortfalls in the future may be funded with the proceeds from further equity and debt financings. Since inception through March 31, 2015, we have made a total of fourteen regular quarterly capital distributions which have been characterized as returns of capital to our investors that have grown consistently over time. See “Management’s Discussion and Analysis of Financial Condition and Results of Operations—Liquidity” for a further discussion of FAD, including its potential limitations as a liquidity measure. We currently target an annual growth rate of at least 10% for our regular dividends. Dividends will be authorized by our board of directors and declared by us based on a number of factors including actual results of operations, liquidity and financial condition, restrictions imposed by applicable law, our taxable income, our operating expenses and other factors our board of directors deems relevant. Because we are a holding company and have no direct operations, we will only be able to pay dividends from our available cash on hand and any funds we receive from our subsidiaries and our ability to receive distributions from our subsidiaries may be limited by the financing agreements to which they are subject, see “—Dividend Policy.” For more information regarding our organizational structure following the consummation of this offering, see “—Our Organizational Structure.”
Market Opportunity
We believe that market developments around the world are generating significant opportunities for the acquisition of infrastructure and equipment essential to the transportation industry and that demand for such assets will continue to grow given their critical role in the movement of goods and people globally. According to industry publications, approximately $7.2 trillion of global infrastructure investment will be needed in our target sectors between now and 2030, comprised of approximately $4.5 trillion for rail investments, $2.0 trillion for airports and $0.7 trillion for ports. Additionally, according to industry publications, the global demand for equipment financing over the next 5 to 15 years is approximately $6.1 trillion in our target sectors, comprised of approximately $4.6 trillion in the aviation sector, $1.4 trillion in offshore energy and $0.1 trillion in the intermodal transport sector. We expect this capital investment need to be driven by a number of factors, including global trade growth—which has, on average, doubled the rate of GDP growth over the past 30 years—and an emerging middle class in major markets around the world.
As the demand for infrastructure and related equipment continues to grow, we believe that traditional providers of capital for transportation projects and equipment—including many governments and European banks—are failing to keep pace, particularly following the 2008-2009 financial crisis and changes to the banking regulatory landscape. European banks, for example, were the dominant financing providers in the world’s transportation markets, accounting for over 50% of total transportation lending in 2006; by 2014, they accounted for only 40%, according to Bloomberg. We believe that this funding gap has led operators to rely more heavily
3
Table of Contents
on third parties like us to finance and own transportation infrastructure and equipment on their behalf. We believe that these funding shortages are likely to continue, and will be particularly acute for small and midsized projects as well as projects with unique characteristics that do not fit easily within pre-established financing criteria. We believe that the supply-demand imbalance for capital to fund essential infrastructure and equipment will lead to additional opportunities for us to acquire and operate assets on compelling terms, and that our access to capital and our Manager’s expertise and business and financing relationships position us well to take advantage of those opportunities. If we are able to continue to acquire assets on the basis that we have thus far, we believe that we will be well-positioned to grow our earnings and our cash flow available for dividends.
Our Strategy
We invest across a number of major sectors within the transportation industry, including aviation, energy, intermodal transport and rail, and we may pursue acquisitions in other areas as and when they arise in the future. In general, we seek to own a diverse mix of high quality infrastructure and equipment within our target sectors that generate predictable cash flows, in markets that we believe provide the potential for strong long-term growth and attractive returns on deployed capital. We believe that by investing in a diverse mix of assets across sectors, we can select from among the best risk-adjusted investment opportunities, while avoiding overconcentration in any one segment, further adding to the stability of our business. We target total returns, or IRRs, of 15% to 25% with the use of what we believe to be reasonable leverage. From our inception in June 2011 to December 31, 2014, the IRR for our assets (calculated before overhead expenses and before any management fee or incentive allocation) was 18%.
We take a proactive investment approach—identifying key secular trends as they emerge within our target sectors and then pursuing what we believe are the most compelling opportunities within those sectors. We look for unique investments, including assets that are distressed or undervalued, or where we believe that we can add value through active management. We consider investments across the size spectrum, including smaller opportunities often overlooked by other investors, particularly where we believe we may be able to grow the investment over time. We believe one of our strengths is our ability to create attractive follow-on investment opportunities and deploy incremental capital within our existing portfolio. We have several such opportunities currently identified, including significant potential for future investment at our Jefferson Terminal, as discussed below.
Within each sector, we consider investments in operating infrastructure as well as in equipment that we lease to operators. Within the rail sector, for example, we target rail lines and rail terminals (which we classify as infrastructure) as well as railcars (which on a stand-alone basis we classify as leasing equipment). We believe that as owners of both infrastructure and equipment assets, we have access to more opportunities and can be a more attractive counterparty to the users of our assets. Our Manager has significant prior experience in all of our target sectors, as well as a network of industry relationships, that we believe positions us well to make successful acquisitions and to actively manage and improve operations and cash flow of our existing and newly-acquired assets. These relationships include senior executives at lessors and operators, end users of transportation and infrastructure assets, as well as banks, lenders and other asset owners.
Currently, our Equipment Leasing Business accounts for approximately 63% of our book equity. Longer-term, we expect that approximately half of our equity capital will be deployed in Equipment Leasing assets, and approximately half will be deployed in Infrastructure assets. We have a robust current pipeline of potential acquisition opportunities representing approximately $1.5 billion in equity capital. Of this current pipeline, approximately 30% of potential opportunities are Aviation-related, including aircraft, engines and airports; approximately 25% are Offshore Energy-related, including energy service companies; and the remainder includes opportunities for intermodal, rail and port-related investments. As of the date of this prospectus, we have not reached a binding agreement regarding any of these potential acquisition opportunities. Each opportunity is subject to, among other things, due diligence, further negotiations and entry into definitive documentation, and our ability to consummate any of these potential opportunities is subject to a number of additional factors and conditions.
4
Table of Contents
Market Sectors
Aviation
According to International Air Transport Association (the “IATA”), global demand for passenger traffic has grown at an average annual rate of 5.5% over the past two decades, outpacing global GDP of 3.0% in the same period. According to the International Civil Aviation Organization, aviation passenger traffic (measured in passenger kilometers) has increased at approximately a 4.6% compound annual growth rate from 2004 to 2013. Furthermore, according to The Boeing Company’s (“Boeing”) 2014 Commercial Market Outlook, this growth is expected to continue, rising at an average annual rate of 5% per annum over the next two decades. This projected increase in air travel presents an attractive opportunity for the private sector to invest in airports and aviation-related leasing equipment such as airplanes and engines. Airports are mission-critical infrastructure for global businesses and leisure travelers. There are over 42,000 airports globally, handling over 3.1 billion passengers and generating over $110 billion in revenue annually. Airports are long-lived assets with limited competition due to significant barriers to entry. Typically, private investments in airports are structured as a concession where the private investor receives the right to operate and collect income from the airport for a defined time period, with ownership being retained by governmental entities. Airports tend to generate significant cash flows with minimal maintenance capital expenditures.
The market for aviation equipment, namely commercial aircraft and engines, is also large and growing. According to Boeing, the global commercial passenger and cargo fleet of aircraft is expected to grow from approximately 21,000 at the end of 2013 to over 42,000 by 2033. We estimate that the combined value of the existing commercial aircraft and engine fleet is approximately $550 billion. Furthermore, aircraft operating leases, and thus aircraft lessors, are becoming increasingly important to the aviation industry. According to the IATA, over 30% of the current passenger fleet is subject to operating leases, and industry analysts expect this percentage to grow to over 50%.
Given the cost of such aviation assets, investors in this sector need access to capital as well as specialized technical knowledge in order to compete successfully. We believe that our Manager’s expertise and our access to financing positions us well for future acquisitions across the aviation sector. As of December 31, 2014, our aviation portfolio includes 13 commercial passenger aircraft and 27 commercial jet engines.
Energy
The market for energy infrastructure and transportation equipment includes land-based infrastructure such as terminals, storage facilities, pipelines and trucks as well as marine and offshore energy assets such as ships, barges and other related equipment.
Together, oil and natural gas represent a majority of energy consumed globally and are expected to remain so for the foreseeable future. According to the United States Energy Information Administration (the “EIA”), fossil fuels represented approximately 80% of energy consumption in 2014 and will continue to represent approximately 80% of energy consumption through 2040. Energy demand is expected to grow at an annual rate of 2% over the next 10 years, driven by increasing global population and GDP growth. This growth in energy demand is expected to result from both a larger pool of energy users as well as higher energy use per capita.
Within the energy infrastructure and transportation equipment market, we are focused on two sub-sectors: land-based infrastructure and offshore energy service equipment. Land-based infrastructure refers to facilities that enable the storage, unloading, loading and movement of crude oil and refined products or gas from producers to end users, such as refineries. Because customers typically purchase capacity on a take-or-pay basis, the economics of these assets directly relate to the volume of throughput and are not directly affected by commodity prices. We believe that the demand for this infrastructure is growing, particularly in North America, where the market dislocations around the supply of oil and gas has resulted in significantly increased production of such
5
Table of Contents
products. For example, to support the flow of oil and gas production from newly developed North American oil and gas fields, industry experts estimate that $641 billion in new infrastructure investments will be needed over the next two decades, with much of that investment required during the next few years.
Recently, owners and operators of strategically-located rail assets have participated in the growth of the North American energy sector by transporting petroleum and natural gas products for both refining and export. Volumes of “crude-by-rail” have increased by more than 40 times, from approximately 21,000 barrels per day in 2009 to over 900,000 barrels per day currently. This increase has been driven by growth in U.S. and Canadian crude oil production, which is expected to continue as hydraulic fracking technologies continue to be utilized and improved for greater production efficiency. The increased production has put pressure on existing pipeline infrastructure, driving shippers to seek alternative forms of transportation. Relative to traditional pipeline infrastructure for the transportation of oil, rail transportation provides greater market access, faster infrastructure deployment, end market flexibility and is more cost efficient for “heavier” crude oil generally produced from Canadian oil sands. We believe that this trend will continue and will lead to growth for our existing assets as well as opportunities for new acquisitions.
As of December 31, 2014, we own 60% of a multi-modal crude oil and refined products terminal in Beaumont, Texas called Jefferson Energy Company (“Jefferson Terminal”) which includes rail, truck, ship, storage and pipeline infrastructure. Jefferson Terminal provides key logistics services to nearby refineries, and is currently capable of handling approximately 230,000 barrels per day of free-flowing crude oil and bitumen. Jefferson Terminal currently has in place one take-or-pay contract with a customer providing for a minimum volume of 18,000 barrels per day, and we are actively negotiating additional contracts. In connection with our acquisition of Jefferson Terminal in 2014, we also acquired 300 tank railcars.
Offshore energy equipment refers to the assets used to support the production, processing and transportation of oil and natural gas from offshore (subsea) reserves. We are currently targeting energy service equipment investments within this market, including inspection, maintenance and repair-related opportunities in countries that have a strong national oil company presence. The world’s largest offshore energy markets include the North Sea, the Gulf of Mexico, Brazil, West Africa, Asia and the Middle East. From 2002 to 2011, approximately two-thirds of all new oil and gas discoveries worldwide were located offshore. Because of the significant time required between discovery and production, these discoveries provide a substantial backlog of demand for offshore energy assets and services.
We expect offshore E&P spending to grow significantly in the next few years. We estimate that approximately $250 billion is required to finance the construction of new offshore assets over the next five years in order to supply the existing growth in demand as well as replace retiring assets. We believe that the underlying market demand, together with the need for additional assets such as support and supply vessels, presents us with significant opportunities for new investment in the sector, and that our Manager’s expertise in the sector will enable us to take advantage of these opportunities. In particular, we believe that utilization of inspection, maintenance and repair (“IMR”) assets will continue to remain stable despite fluctuations in oil and gas prices, particularly where those assets are deployed in support of national oil companies. We continue to focus on this area for opportunities within the offshore energy sector.
As of December 31, 2014, we have four offshore energy investments, including one remote operated vehicle (“ROV”) support vessel, one Anchor Handling Tug Supply (“AHTS”) vessel, one construction support vessel and one IMR vessel that is under construction.
Intermodal Transport
The Intermodal Transport, or containerized, market includes the infrastructure and equipment that enables the efficient movement of goods via shipping containers throughout multiple modes of transportation, including
6
Table of Contents
trucking, shipping and rail. The containerized market volume has grown at over 8% per year over the last three decades, more than double the annualized rate of world GDP growth during that same period. While the rate of growth in containerized trade has slowed in the last few years due to general economic conditions, we expect future growth to benefit from an increasing global middle class, driving increased consumption of goods and services worldwide. The Intermodal market includes infrastructure such as container seaports and inland terminals as well as equipment such as containers, chassis or trailers, generators sets, containerships, cranes and other loading equipment.
Seaports are the gateway for the global trade network. There are over 3,000 seaports worldwide, handling nearly 10 billion tons of cargo and generating over $55 billion in revenue annually. Of these, there are over 500 container seaports (handling the import and export of containerized goods) with an annual volume of approximately 700 million twenty foot equivalent units (“TEUs”). Worldwide, seaport volumes are expected to increase 25% from 2012 to 2017. Ports are typically owned by government entities, and are overseen by local port authorities. Over the last two decades, governments have privatized port operations via long-term concession agreements with private parties. Seaports tend to generate strong cash flows via multiple revenue streams from infrastructure users with minimal routine maintenance capital expenditures.
According to Harrison Consulting, the size of the world container fleet as of December 31, 2014 was 36 million TEUs. This equipment is owned or leased by the world’s shipping lines to move their cargo. Approximately 48% of the equipment is leased from container leasing companies and other third-party owners and the other 52% is owned directly. We believe that this market will continue to grow over the next few years and that our Manager’s expertise will enable us to take advantage of such future growth. To date, we have focused our investment activity on acquiring container boxes but we also consider other related opportunities across the sector, including in container seaports and terminals. As of December 31, 2014, our intermodal portfolio includes 152,000 shipping containers and related intermodal equipment.
Rail
The North American economy relies on an extensive network of railroads to transport raw materials such as petroleum, coal, ores, aggregates, lumber and grain as well as finished goods such as food products, paper products, automobiles and machinery. Railroads represent the largest component of North America’s freight transportation industry, carrying more freight than any other mode of transportation on a ton-mile basis. With a network of approximately 140,000 miles of track in the United States, railroads link businesses with each other domestically and with international markets through connections with ports and other international terminals. Unlike other modes of transportation, such as trucking (which uses highways, toll roads, etc.) and shipping companies (that utilize ports), railroad operators generally own or lease their infrastructure of track, land and rail yards. This rail infrastructure, most of which was originally established over 100 years ago, represents a limited supply of assets and a difficult-to-replicate network. According to the Association of American Railroads (“AAR”), there were 574 freight railroads in the United States as of December 31, 2014.
The North American railroad industry has increased its share of freight ton-miles compared to other forms of freight transportation over the past quarter-century. Since deregulation in 1980, the railroad industry has continually improved its overall productivity and cost structure compared to other forms of freight transportation as it consumes less fuel and has lower labor costs per ton transported than other forms of freight transportation. According to the AAR, railroads are estimated to be approximately four times more fuel efficient than truck transportation and a single train can haul the equivalent of up to approximately 280 trucks. In 1980, one gallon of diesel fuel moved one ton of freight by rail an average of 235 miles, versus 2012 where the equivalent gallon of fuel moved one ton of freight an average of 476 miles by rail—representing a 103% increase over 1980. As a result of these cost advantages as well as increased highway congestion, the railroad industry’s share of U.S. freight ton-miles has increased from 22% in 1980 to 29% in 2011.
7
Table of Contents
In addition to operating railroads, the North American rail market includes rail equipment such as railcars and locomotives. According to publicly available sources, there are approximately 2.0 million railcars currently in operation in North America. Approximately 59% of these railcars are leased to railroads and shipping companies, most under multi-year contracts.
We believe that demand for rail related infrastructure and equipment in North America will continue to grow due to the cost-efficient nature of rail. We believe that growing market demand, together with the capital intensive nature of the sector and our Manager’s expertise will enable us to make acquisitions and grow our exposure to the rail sector. As of December 31, 2014, we own one short-line railroad and 300 tank railcars.
Our Strengths
Strong Contracted Cash Flows Plus Growth Potential—We target a diverse mix of transportation infrastructure and equipment that delivers, on a combined basis, significant and predictable current cash flows plus the potential for earnings growth and asset appreciation. Our current portfolio includes assets in the aviation, energy, intermodal transport and rail sectors. Substantially all of our equipment assets are subject to ongoing leases providing stable operating cash flows equal to a significant percentage of the purchase price of our assets. Our holdings also include value-add infrastructure projects where we expect to be able to generate strong earnings and cash flow growth through development and asset repositioning. We expect our future investments to continue to deliver a mix of current cash flow and growth potential.
Opportunistic Investment Approach—We take an opportunistic approach to buying and managing assets—targeting assets that are distressed or undervalued, or where we believe we can add value through active management. We also try to develop incremental opportunities to deploy significant amounts of capital through follow-on investments in our existing assets in order to drive cash flow and growth. In these ways, we seek to deliver attractive returns on our portfolio without heavy reliance on financial leverage. As of December 31, 2014, our leverage on a weighted basis across our existing portfolio is approximately 24% of our total capital. While leverage on any individual asset may vary, we target overall leverage for our assets on a consolidated basis of no greater than 50% of our total capital.
Experienced Investment Team—Our Manager is an affiliate of Fortress, a leading, diversified global investment firm with approximately $67.5 billion under management as of December 31, 2014. Founded in 1998, Fortress manages assets on behalf of over 1,500 institutional clients and private investors worldwide across a range of private equity, credit, liquid hedge funds and traditional asset management strategies. Over the last ten years, Fortress has been one of the industry’s most active investors in transportation-related infrastructure and equipment globally. The Fortress team of investment professionals, currently led by Joseph Adams, has over fifty years of combined experience in acquiring, managing and marketing transportation and infrastructure assets. The team has been working directly together for over ten years and has collectively invested almost $3 billion in equity capital and purchased over $17 billion in transportation and infrastructure assets since 2002. Some of our Manager’s prior transactions include the creation of Aircastle Ltd., one of the world’s leading aircraft lessors; SeaCube Container Leasing Ltd., one of the world’s largest container lessors; RailAmerica Inc., a leading short-line rail operator; and Global Signal Inc., an owner operator and lessor of towers and other communication structures for wireless communications. Aircastle Ltd., SeaCube Container Leasing Ltd., RailAmerica Inc. and Global Signal Inc. generated total returns (and IRRs) of 40% (5%), 153% (48%), 83% (23%) and 229% (61%), respectively, for public investors that purchased shares in the initial public offering and retained those shares until sale or in the case of Aircastle Ltd continue to own.
Extensive Relationships with Experienced Operators—Through our Manager, we have numerous relationships with operators across the transportation industry. We typically seek to partner and often co-invest with experienced operators and owners when making acquisitions, and our existing relationships enable us not
8
Table of Contents
only to source opportunities, but also to maximize the value of each asset post-closing. Our strategy is to actively manage our investments to improve operations, grow cash flows and develop incremental investment opportunities.
We Plan to Pay and Grow Our Dividends—We view FTAI as a total return investment comprised of current yield and consistent dividend growth. Since inception through March 31, 2015, we have made a total of fourteen regular quarterly capital distributions which have been characterized as returns of capital to our investors that have grown consistently over time. For the years ended December 31, 2014 and 2013, capital distributions to members were approximately $76.0 million and $39.6 million, respectively. See “Management’s Discussion and Analysis of Financial Condition and Results of Operations—Liquidity” for a further discussion of FAD, including its potential limitations as a liquidity measure. We intend to continue paying regular quarterly dividends to our shareholders from funds available for distribution, and we currently target an annual growth rate of at least 10% for our regular dividends. Our long term goal is to maintain a payout ratio of between 50-60% of funds available for distribution, with remaining amounts used primarily to fund our future acquisitions and opportunities. Our ability to pay dividends will also be subject to certain risks and limitations. As a public company, there can be no assurance that we will pay dividends in amounts or on a basis consistent with prior distributions to our investors, if at all. See “—Our Organizational Structure” for information regarding our organization structure following the consummation of this offering and “Dividend Policy.”
Existing Portfolio
The following is a summary of our existing portfolio within our two primary strategic business units (Infrastructure and Equipment Leasing), with detail provided for each of our five reportable segments:
| • | Infrastructure (approximately 37.0% of equity within our reportable segments as of December 31, 2014)—We own transportation infrastructure in the rail and energy sectors, including a multi-modal crude oil and refined products terminal in Beaumont, Texas with a significant rail component and a short line railroad that operates from Maine to Montreal. These operations are included within our Jefferson Terminal and Railroad reportable segments, respectively. |
| • | Jefferson Terminal (approximately 35.4% of equity within our reportable segments as of December 31, 2014)—On August 27, 2014, we acquired a 60% equity interest in Jefferson Refinery, LLC (“Jefferson”), an energy infrastructure company that is developing a large multi-modal crude oil and refined products logistics terminal at the Port of Beaumont, Texas and also owns several other key assets involved in the transportation and processing of crude oil and related products. Jefferson Terminal’s unique location close to Port Arthur enjoys direct rail service from three Class I railroads, and is adjacent to four major oil refineries with the capacity for processing over 1.5 million barrels of oil per day, the largest concentration of refineries in North America by capacity. Jefferson Terminal provides key logistics services to nearby refineries, supplying them with the capability to unload inbound crude, and load outbound refined products, by rail, truck, barge or ship. In the future, we expect to be able to provide direct pipeline connections to nearby refineries and storage hubs. Jefferson Terminal has the capacity to handle a total of 230,000 barrels per day of free-flowing crude oil and bitumen, primarily by rail, and offers on-site storage and blending services. We believe Jefferson Terminal is ideally positioned to take advantage of growing demand for rail unloading, storage and dock capacity on the U.S. Gulf Coast, where refineries are shifting from imported waterborne barrels to cheaper domestic (U.S. and Canadian) sources of crude. We expect Jefferson’s attractive location and comprehensive multi-modal capabilities will result in stable and growing demand from refiner customers in the region. Furthermore, Jefferson provides significant organic growth opportunities from identified projects. We currently expect to deploy significant additional capital at Jefferson to increase truck, tank and rail assets and capacity, build out dock capacity to handle Canadian crude exports, and develop pipeline connections to a nearby refinery. |
9
Table of Contents
| • | Railroad (approximately 1.6% of equity within our reportable segments as of December 31, 2014)—We acquired certain assets and assumed certain liabilities of the Montreal, Maine & Atlantic Railroad (“MM&A”), which we have renamed the Central Maine & Quebec Railroad (the “CMQR”, or the “Line”), out of bankruptcy in May and June 2014. The CMQR is a 480-mile Class II railroad that runs from Montreal to the east coast of Maine, primarily transporting pulp and paper, construction products and chemicals. The CMQR offers the most direct route from ports in Montreal and on the East Coast of the U.S. to manufacturers and other customers in Maine and Quebec. We believe that CMQR represents an investment in critical infrastructure with a captive customer base at an attractive valuation and significant growth potential. |
| • | Equipment Leasing (approximately 63.0% of equity within our reportable segments as of December 31, 2014)—We own transportation equipment that we lease out to customers in the following reportable segments: Aviation Leasing, Offshore Energy and Shipping Containers. |
| • | Aviation Leasing (approximately 36.6% of equity within our reportable segments as of December 31, 2014)—We own thirteen commercial aircraft—10 Boeing passenger aircraft (seven 737s, one 757 and two 767s) and three Airbus passenger aircraft (A320s)—that are each on long-term leases. We also own 27 commercial jet engines that are compatible with Boeing 737, 747, 757 and 767 aircraft models. Our engines are primarily on short-term leases with various airlines located around the globe. Our aviation portfolio is currently unlevered. As of December 31, 2014, 13 of our commercial jet engines, and all of our commercial aircraft, were leased to operators or other third parties. Aviation assets currently off lease are either undergoing repair and/or maintenance, or are currently held in short term storage awaiting a future lease. On an equity-weighted basis, our aviation equipment was approximately 93% utilized as of March 31, 2015. Our aircraft assets currently have a weighted average remaining lease term of 33 months, and our engine assets currently have an average remaining lease term of 13 months. In each case, we work closely with our existing customers to extend current leases, thus avoiding downtime and remarketing costs. |
| • | Offshore Energy (approximately 18.5% of equity within our reportable segments as of December 31, 2014)—We have four offshore energy investments, including one ROV support vessel, one AHTS vessel, one construction support vessel and one IMR vessel that is under construction. Our assets in our Offshore Energy segment are subject to long-term charters, whereby the operator assumes the operating expense and utilization risk for the vessels. The locally based operators with whom we partner operate our vessels for large energy companies, some of whom are national oil companies. Our Offshore Energy assets are leased to operators or other third parties and only one vessel is levered. The lease for the ROV support vessel expires in April 2019, the lease for the AHTS vessel expires in November 2023, the lease for the construction support vessel expires in July 2015 and the lease for the IMR vessel expires in December 2023. |
| • | Shipping Containers (approximately 7.9% equity within our reportable segments as of December 31, 2014)—We own, either directly or through a joint venture, interests in approximately 152,000 maritime shipping containers and related equipment. All of our shipping containers are on long-term leases to various shipping companies located around the globe, primarily on a finance lease basis with required or bargain purchase obligations. As of December 31, 2014, our shipping container portfolio was approximately 71% levered on a weighted-average basis. The weighted average remaining lease term for these assets is 2.3 years. |
Recent Developments
Preliminary Estimated Results for the Three Months Ended March 31, 2015. For the three months ended March 31, 2015, we expect to report total revenues in the range of $33.0 million to $35.0 million, comprised of
10
Table of Contents
Equipment Leasing revenues in the range of $22.5 million to $23.5 million and Infrastructure revenues in the range of $10.5 million to $11.5 million. For the three months ended March 31, 2015, we expect to report net income in the range of $1.4 million to $2.4 million, and net income attributable to members in the range of $5.0 million to $6.0 million. For the three months ended March 31, 2015, we expect to report Funds Available for Distribution (“FAD”) in the range of $13.4 million to $14.4 million.
FAD is not a financial measure prepared in accordance with GAAP. The Company uses FAD in evaluating its ability to meet its stated dividend policy as described in the prospectus. The Company believes that FAD will be a useful metric for investors and analysts for similar purposes. However, as described below, FAD is subject to a number of limitations and assumptions and there can be no assurance that the Company will generate FAD sufficient to meet its intended dividends. The GAAP measure most directly comparable to FAD is net cash (used in) provided by operating activities.
Definition
The Company defines FAD as:
| • | cash from operating activities |
| • | plus: |
| ¡ | principal collections on finances leases, |
| ¡ | proceeds from the sale of assets, and |
| ¡ | return of capital distributions from unconsolidated entities, |
| • | less: |
| ¡ | payments on debt, and |
| ¡ | capital distributions to non-controlling interests, and |
| • | excluding changes in working capital. |
| Three Months Ended March 31, 2015 |
||||||||
| Low | High | |||||||
| (Unaudited) | ||||||||
| Range (amounts in thousands except for share and per share data) |
||||||||
| Cash from Operating Activities |
$ | 5,750 | $ | 6,750 | ||||
| Add: Principal Collections on Finance Leases |
2,750 | 3,100 | ||||||
| Add: Proceeds from the Sale of Assets |
100 | 150 | ||||||
| Add: Return of Capital Distributions from Unconsolidated Entities |
875 | 975 | ||||||
| Less: Payments on Debt |
(3,750 | ) | (4,750 | ) | ||||
| Less: Capital Distributions to Non-Controlling Interests |
— | (200 | ) | |||||
| Exclude: Changes in Working Capital |
7,675 | 8,375 | ||||||
|
|
|
|
|
|||||
| Funds Available for Distribution (FAD)(1) |
$ | 13,400 | $ | 14,400 | ||||
|
|
|
|
|
|||||
| Unaudited FAD per share, basic and diluted, as adjusted for the Distribution |
0.25 | 0.27 | ||||||
| Unaudited weighted average shares outstanding, basic and diluted, as adjusted for the Distribution |
53,502,873 | 53,502,873 | ||||||
| (1) | Includes an expected FAD impact attributable to our Jefferson Terminal segment for the three months ended March 31, 2015 in the range of $(4) million to $(5) million. FAD does not include equity capital called from existing limited partners, proceeds from this offering, proceeds from any debt issuance, historical cash and cash equivalents and expected investments in our operations. |
11
Table of Contents
For the quarter ended March 31, 2015, capital distributions to members were approximately $24 million. Our preliminary estimates of the corresponding GAAP operating, investing and financing measures are as follows:
| Three Months Ended March 31, 2015 |
||||||||
| Low | High | |||||||
| (Unaudited) Range (in thousands) |
||||||||
| Cash from operating activities |
$ | 5,750 | $ | 6,750 | ||||
| Cash from investing activities |
(36,150 | ) | (35,150 | ) | ||||
| Cash from financing activities |
44,125 | 45,125 | ||||||
We have provided ranges, rather than specific amounts, for the preliminary results described above primarily because our financial closing procedures for the three months ended March 31, 2015 are not yet complete and, as a result our final results upon completion of our closing procedures may vary from the preliminary estimates. These estimates were prepared by and are the responsibility of our management, based upon a number of assumptions, in connection with the preparation of our financial statements. Additional items that may require material adjustments to the preliminary financial information may be identified. Estimates of results are inherently uncertain and subject to change, and we undertake no obligation to update this information. See “Management’s Discussion and Analysis of Financial Condition and Results of Operations—Application of Critical Accounting Policies,” “Risk Factors—Risks Relating to Our Business” and “Forward-Looking Statements.”
PricewaterhouseCoopers LLP has not audited, reviewed, compiled or performed any procedures with respect to the preliminary financial data. Accordingly, PricewaterhouseCoopers LLP does not express an opinion or any other form of assurance with respect thereto.
Limitations
FAD has material limitations as a liquidity measure of the Company because such measure excludes items that are required elements of the Company’s net cash (used in) provided by operating activities as described below. You should not consider FAD in isolation or as a substitute for analysis of the Company’s results of operations under GAAP and it is not the only metric that you should consider when evaluating the Company’s ability to meet its stated dividend policy. Specifically:
| • | FAD does not include equity capital called from the Company’s existing limited partners, proceeds from this offering, proceeds from any debt issuance or future equity offering, historical cash and cash equivalents and expected investments in the Company’s operations. |
| • | FAD does not give pro forma effect to prior acquisitions, certain of which cannot be quantified. For example, FAD does not give pro forma effect to our acquisition of the Jefferson Terminal because the terminal was not fully operational when we purchased it and is currently in the process of significantly ramping up its operations. As a result, the historical performance of the Jefferson Terminal is not indicative of potential future results. In addition, FAD does not give pro forma effect to our acquisition of CMQR because we purchased CMQR out of bankruptcy when the railway was not fully operational, and the railway is currently in the process of ramping up its operations. As a result, the historical performance of the CMQR is not indicative of potential future results. |
| • | While FAD reflects the cash inflows from the sale of certain assets, FAD does not reflect the cash outflows to acquire the assets as the Company relies on alternative sources of liquidity to fund such purchases. |
| • | FAD does not reflect expenditures related to capital expenditures, acquisitions and other investments as the Company has multiple sources of liquidity and intends to fund these expenditures with the net |
12
Table of Contents
| proceeds from this offering, future incurrences of indebtedness, additional capital contributions and/or future issuances of equity. |
| • | FAD does not reflect any maintenance capital expenditures necessary to maintain the same level of cash generation from our capital investments. |
| • | FAD does not reflect changes in working capital balances as management believes that changes in working capital are primarily driven by short term timing differences which are not meaningful to the Company’s distribution decisions. |
| • | Management has significant discretion to make distributions and the Company is not bound by any contractual provision that requires it to use cash for distributions. |
If such factors were included in FAD, there can be no assurance that the results would be consistent with the Company’s presentation of FAD. For example, the Company’s 2014 acquisitions of Jefferson Terminal and CMQR in our Infrastructure business would have had a negative impact on 2014 FAD, as both generated negative operating results, had such acquisitions been consummated at the beginning of the year.
Intended Second Quarter Dividend Critical Assumptions
For the second quarter of 2015, the Company intends to pay a dividend of $0.33 per share, which will be pro-rated for the period from the consummation of this offering to the end of the quarter and paid in the third quarter of 2015. The Company has historically not generated sufficient funds available for distribution to support this payout amount and there can be no assurance that the Company will be able to meet its goals.
The shortfall between our historical funds available for distribution and our intended second quarter dividend of $0.33 per share primarily relates to fewer owned assets in our Equipment Leasing Business and negative operating performance in our Infrastructure Business during the historical periods presented below.
| Historical FAD per share | ||||||||||
| Three Months Ended March 31, 2015 |
2014 Quarterly Average |
2013 Quarterly Average |
||||||||
| 0.25 to 0.27 | (1) | 0.21 | (1) | 0.26 | (1) | |||||
| (1) | Per share amount calculated using unaudited weighted average shares outstanding, as adjusted for the Distribution, of 53,502,873 |
After giving effect to the Distribution and this offering, our total shares outstanding will be 73.5 million, and our annualized dividend based on the intended payout of $0.33 per share per quarter will be approximately $97 million.
For the first quarter 2015, assuming the mid-point of our range for FAD excluding the impact of the Jefferson Terminal segment, our existing assets generated approximately $18.4 million in FAD, or $73.6 million on an annualized basis, and we expect this number to grow to approximately $80.0 million, or $0.27 per share per quarter, based on increased utilization levels in our Aviation Leasing segment.
We expect that the utilization level of our Jefferson Terminal will increase from its current level of approximately 10% to between 50% and 70%, or to 1.5 – 2 trains per day and at rates consistent with our existing take-or-pay contract. At this level of utilization and rates, we would expect Jefferson Terminal to contribute approximately $23 million to $37 million of FAD, distributions of which are limited to not more than $10 million per any calendar year (or $25 million in the aggregate during the term of the facility) pursuant to the terms of the Jefferson Terminal Credit Agreement.
Similarly, we believe that the performance of CMQR will improve and we currently expect that CMQR will generate $25 million to $30 million in revenue on an annualized basis and will contribute approximately $7.0-
13
Table of Contents
$8.5 million of additional FAD. These two sources of FAD are expected to generate at least $30 million of FAD, or $0.10 per share per quarter (or $0.06 per share per quarter if distributions are limited to not more than $10 million per calendar year pursuant to the terms of the Jefferson Terminal Credit Agreement).
Assumptions are inherently uncertain and there can be no assurance that actual results will not differ from the assumptions set forth above.
In addition to the factors outlined above, the Company’s ability to pay this dividend is subject to certain critical assumptions, including:
| • | Existing investments in our Equipment Leasing Business continue to generate returns generally consistent with prior performance. |
| • | Improved performance in our Infrastructure Business, including the Jefferson Terminal and CMQR. |
| • | An increase in FAD versus historical amounts and our ability to generate FAD consistent with our intended payout. In prior periods we have generated FAD less than our projections and funded shortfalls in part with proceeds from equity and debt financings. |
| • | The continued availability of alternative sources of liquidity. |
Repauno Acquisition. On March 16, 2015 we entered into an agreement to acquire a private, inactive port facility located on the Delaware River in Gibbstown, New Jersey, which we refer to as our “Repauno” investment. We plan to develop Repauno into a multi-use terminal with potential uses to include an auto import facility, perishables and bulk warehouses and an energy storage and handling facility. Our obligation to purchase the port is subject to a number of conditions including our satisfactory completion of environmental due diligence and obtaining all necessary permits. We are actively pursuing this due diligence and permitting analysis; however, we are not yet in a position to fully assess the environmental and other risks and contingencies associated with this potential acquisition.
Repauno has direct links to key transportation modes including deep water, rail and a major interstate highway, and is strategically located between the Northeast and mid-Atlantic metropolitan areas that include over 33% of the overall United States population. The Port of Philadelphia is ranked the busiest port in North America for handling various perishable products, the Port of Wilmington, Delaware is the busiest port in North America for handling bananas and fruit concentrates, and the ports along the Delaware River together are ranked third in the United States for handling iron and steel products. Ports along the Delaware River also handle a significant amount of liquid bulk products and automobiles.
Repauno is comprised of 1,700 acres of land that is currently owned E.I. du Pont Nemours and Company (“DuPont”), and is being sold in response to local government pressure to develop Repauno into an active terminal to spur regional economic activity. We have initially identified 196 acres of Repauno as developable, and we intend to utilize the existing infrastructure for our development plans, including constructing refrigerated warehouses for perishable goods, building a dock and using remaining acreage for additional warehouse space, bulk storage and a liquid natural gas facility. In addition, Repauno includes an underground cavern which can store approximately 8 million gallons, which we believe can be repurposed to store liquid bulk products.
Once redeveloped, we believe Repauno will offer new, state of the art port and cargo handling facilities in contrast to the antiquated, less efficient facilities located in the Philadelphia region.
Acquisition Pipeline. In addition to our current investment portfolio, we have been and continue to be active in evaluating and pursuing various attractive acquisition opportunities. We are currently evaluating over $1.5 billion (measured by equity capital) of potential Infrastructure and Equipment Leasing acquisitions. Of this current pipeline, approximately 30% of potential opportunities are Aviation-related, including aircraft, engines and airports; approximately 25% are Offshore Energy-related, including energy service companies; and the remainder includes opportunities for intermodal, rail and port-related investments. These opportunities are in
14
Table of Contents
varying stages of development from preliminary diligence, to submission of a nonbinding offer, and through delivery of a non-binding letter of intent and negotiation of key terms. However, as of the date of this prospectus, we have not reached a binding agreement regarding any of these potential acquisition opportunities. Each opportunity is subject to, among other things, due diligence, further negotiations and entry into definitive documentation, and our ability to consummate any of these potential opportunities is subject to a number of additional factors and conditions. We plan to use the net proceeds from this proposed offering to help fund this acquisition pipeline.
There can be no assurance that we will be successful in acquiring any such assets or, if acquired, that they will generate returns meeting our expectations, or at all.
Capital Availability. As of December 31, 2014, we had a total of $402.2 million of capital availability remaining under our partnership agreements (including $105.9 million of prior distributions subject to recall pursuant to the terms of the partnership agreement of Holdco (the “Partnership Agreement”)). Following the consummation of this offering, we will no longer be entitled to any capital contributions from our partners. Including capital called from our limited partners prior to the consummation of this offering, we will have received approximately $251.4 million of net equity capital from our limited partners since December 31, 2014. As a result, immediately following the consummation of this offering, we will have available cash of $595.5 million (or $651.7 million if the underwriters exercise their option to purchase in full). We expect to use these funds, together with a combination of revenues from our leasing activities (net of operating expenses), debt borrowings, distributions received from unconsolidated investees and proceeds from the sale of assets, to make new acquisitions and fund growth projects in our existing asset base including those identified above.
Our Manager and Management Agreement and Other Compensation Arrangements
We have entered into a Management Agreement with our Manager, an affiliate of Fortress, effective upon completion of this offering, pursuant to which our Manager provides for the day-to-day management of our operations.
Pursuant to the terms of our Management Agreement, our Manager provides us with a management team and other professionals who are responsible for implementing our business strategy and performing certain services for us, subject to oversight by our board of directors. Our Manager’s duties include: (i) performing all of our day-to-day functions, (ii) determining investment criteria in accordance with the broad investment guidelines adopted by our board of directors, (iii) sourcing, analyzing and executing on acquisitions and sales, (iv) performing ongoing commercial management of the portfolio, and (v) providing financial and accounting management services.
Our Management Agreement has an initial ten-year term beginning at the consummation of this offering and is automatically renewed for one-year terms thereafter unless terminated by our Manager. Our Manager is entitled to receive a management fee from us, payable monthly, that is based on the average value of our total equity (excluding non-controlling interests) determined on a consolidated basis in accordance with GAAP as of the last day of the two most recently completed months multiplied by an annual rate of 1.50%, as further described below. In addition, we are obligated to reimburse certain expenses incurred by our Manager on our behalf.
Under our Management Agreement, each of we, Holdco and the General Partner have agreed that our Manager will have the exclusive authority to manage our and Holdco’s assets as further provided in the Management Agreement. We will not conduct any operations other than our direct ownership of Holdco, which is responsible for acquiring assets on our behalf through one or more of its subsidiaries. Pursuant to the Partnership Agreement, a copy of which has been filed as an exhibit to the registration statement of which this prospectus forms a part, the General Partner which, like our Manager, is an affiliate of Fortress, will be entitled to receive incentive distributions before any amounts are distributed to the Issuer based both on our consolidated net income and capital gains income in each fiscal quarter and for each fiscal year, respectively, subject to certain adjustments.
15
Table of Contents
The terms of our Management Agreement and our compensation arrangements with the General Partner are summarized below and described in more detail under “Our Manager and Management Agreement and Other Compensation Arrangements” in this prospectus.
| Type |
Description | |
| Management Fee |
The management fee is determined by taking the average value of our total equity (excluding non-controlling interests) determined on a consolidated basis in accordance with GAAP at the end of the two most recently completed months multiplied by an annual rate of 1.50%, and is payable monthly in arrears in cash. For illustrative purposes only, and as more fully described in “Unaudited Pro Forma Combined Financial Information,” the amount of the management fee payable to the Manager on a pro forma basis for the year ended December 31, 2014, had the Management Agreement been in effect would have been approximately $9.2 million. | |
| Incentive Allocation to the General Partner | Income Incentive Allocation
Income Incentive Allocation is calculated and payable quarterly in arrears based on our pre-incentive allocation net income for the immediately preceding calendar quarter. For this purpose, pre-incentive allocation net income means, with respect to a calendar quarter, our net income attributable to members during such quarter calculated in accordance with GAAP excluding our pro rata share of (1) gains and losses, realized or unrealized and (2) certain non-cash or one-time items, and any other adjustments as may be approved by our independent directors. Pre-incentive allocation net income does not include any Income Incentive Allocation or Capital Gains Incentive Allocation paid to the General Partner during the quarter.
We will pay the General Partner an Income Incentive Allocation with respect to our pre-incentive allocation net income in each calendar quarter as follows: (1) no Income Incentive Allocation in any calendar quarter in which our pre-incentive allocation net income, expressed as a rate of return on the average value of our net equity capital at the end of the two most recently completed calendar quarters, does not exceed 2.0% for such quarter (8.0% annualized); (2) 100% of our pre-incentive allocation net income with respect to that portion of such pre-incentive allocation net income, if any, that is equal to or exceeds 2.00% but does not exceed 2.2223% for such quarter; and (3) 10.0% of the amount of our pre-incentive allocation net income, if any, that exceeds 2.2223% for such quarter. These calculations are appropriately prorated for any period of less than three months. The effect of the allocation calculation described above is that if pre-incentive allocation net income, expressed as a rate of return on the average value of our net equity capital at the end of the two most recently completed calendar quarters, is equal to or exceeds 2.2223%, the General Partner will receive an Income Incentive Allocation of 10.0% of our pre-incentive allocation net income for the quarter. | |
16
Table of Contents
| Type |
Description | |
| Capital Gains Incentive Allocation
Capital Gains Incentive Allocation is calculated and payable in arrears as of the end of each calendar year and will equal 10% of our pro rata share of cumulative realized gains from the date of the consummation of this offering through the end of the applicable calendar year net of our pro rata share of cumulative realized or unrealized losses, the cumulative non-cash portion of equity-based compensation expenses and all realized gains upon which prior performance-based Capital Gains Incentive Allocation payments were previously made to the General Partner.
For illustrative purposes only, as more fully described in “Unaudited Pro Forma Combined Financial Information,” there would have been no Income Incentive Allocation and $0.04 million of Capital Gains Income Allocation payable to the General Partner on a pro forma basis for the year ended December 31, 2014, had these compensation arrangements been in effect. | ||
| Reimbursement of Expenses |
We will pay or reimburse our Manager and its affiliates for performing certain legal, accounting, due diligence tasks and other services that outside professionals or outside consultants otherwise would perform, provided that such costs and reimbursements are no greater than those which would be paid to outside professionals or consultants on an arm’s-length basis. We will also pay all operating expenses, except those specifically required to be borne by our Manager under our Management Agreement.
Our Manager is responsible for all of its other costs incident to the performance of its duties under the Management Agreement, including compensation of our Manager’s employees, rent for facilities and other “overhead” expenses; we will not reimburse our Manager for these expenses. The expenses required to be paid by us include, but are not limited to, issuance and transaction costs incident to the acquisition, disposition and financing of our assets, legal and auditing fees and expenses, the compensation and expenses of our independent directors, the costs associated with the establishment and maintenance of any credit facilities and other indebtedness of ours (including commitment fees, legal fees, closing costs, etc.), expenses associated with other securities offerings of ours, costs and expenses incurred in contracting with third parties (including affiliates of the Manager), the costs of printing and mailing proxies and reports to our shareholders, costs incurred by our Manager or its affiliates for travel on our behalf, costs associated with any computer software or hardware that is used for us, costs to obtain liability insurance to indemnify our directors and officers and the compensation and expenses of our transfer agent. | |
17
Table of Contents
| Type |
Description | |
| Termination Fee |
If we terminate the Management Agreement, we will generally be required to pay the Manager a termination fee. The termination fee is equal to the amount of the management fee during the 12 months immediately preceding the date of the termination. | |
| Incentive Allocation Fair Value Amount |
An Incentive Allocation Fair Value Amount will be payable to the General Partner if the General Partner is | |
| removed due to the termination of our Management Agreement in certain specified circumstances. The Incentive Allocation Fair Value Amount is an amount equal to the Income Incentive Allocation and the Capital Gains Incentive Allocation that would be paid to the General Partner if our assets were sold for cash at their then current fair market value (as determined by an appraisal, taking into account, among other things, the expected future value of the underlying investments). | ||
| Future Grants of Options to Our Manager |
After this offering, upon the successful completion of an offering of our common shares or other equity securities (including securities issued as consideration in an acquisition), we will grant our Manager options to purchase common shares in an amount equal to 10% of the number of common shares being sold in the offering (or if the issuance relates to equity securities other than our common shares, options to purchase a number of common shares equal to 10% of the gross capital raised in the equity issuance divided by the fair market value of a common share as of the date of issuance), with an exercise price equal to the offering price per share paid by the public or other ultimate purchaser or attributed to such securities in connection with an acquisition (or the fair market value of a common share as of the date of the equity issuance if it relates to equity securities other than our common shares). Any ultimate purchaser of common shares for which such options are granted may be an affiliate of Fortress. For the avoidance of doubt, this initial public offering of our common shares will not constitute an offering for purposes of this provision. | |
Summary Risk Factors
Our business is subject to risks, as discussed more fully in the section entitled “Risk Factors” beginning on page 29. You should carefully consider all of the risks discussed in the “Risk Factors” section before investing in our common shares. In particular, the following risks, among others, may have an adverse effect on our business, which could cause a decrease in the price of our common shares and result in a loss of all or a portion of your investment:
| • | We are reliant on FIG LLC, our Manager, and other key personnel at Fortress and there are conflicts of interest in our relationship with our Manager; |
18
Table of Contents
| • | Our Manager is authorized to follow a broad asset acquisition strategy and changes to such strategy may increase our exposure to certain risks or otherwise adversely affect our business; |
| • | There can be no assurance that targeted returns or any other level of returns can be achieved and there can be no assurance that we will pay dividends in a manner consistent with prior distributions to our investors, or at all; |
| • | Economic uncertainty and political risks have historically negatively impacted the transportation industry and may reduce the demand for our assets, result in non-performance of contracts by our lessees or charterers, limit our ability to obtain additional capital to finance new acquisitions or have other unforeseen negative effects; |
| • | We could experience a period of oversupply in the markets that we operate, which could depress charter or lease rates for our assets, result in decreased utilization of our assets and materially adversely affect our results of operations and cash flows; |
| • | Our cash flows are substantially impacted by our ability to collect compensation from customers and contractual defaults and our failure to renew or obtain new charters or leases may adversely affect our business and results of operations; |
| • | If our investments become concentrated in a particular type of asset or sector, our business and financial results could be adversely affected by changes in market demand or problems specific to that asset or sector; |
| • | The business of acquiring transportation and transportation-related infrastructure assets is highly competitive and market competition for such assets includes both traditional participants as well as a growing number of non-traditional participants seeking investment opportunities, including other affiliates of Fortress; |
| • | The values of the assets we purchase may fluctuate due to various factors; |
| • | Our railroad infrastructure may be damaged, including by flooding and railroad derailments; |
| • | We rely on select operators to perform certain day-to-day activities in managing our assets; and |
| • | Our inability to obtain sufficient capital would constrain our ability to grow our portfolio and to increase our revenues. |
Conflicts of Interest
Although we have established certain policies and procedures designed to mitigate conflicts of interest, there can be no assurance that these policies and procedures will be effective in doing so. It is possible that actual, potential or perceived conflicts of interest could give rise to investor dissatisfaction, litigation or regulatory enforcement actions.
One or more of our officers and directors have responsibilities and commitments to entities other than us. For example, we have some of the same directors and officers as other entities affiliated with Fortress. In addition, we do not have a policy that expressly prohibits our directors, officers, securityholders or affiliates from engaging in business activities of the types conducted by us for their own account. However, our code of business conduct and ethics prohibits, subject to the terms of our organizational documents, the directors, officers and employees of our Manager from engaging in any transaction that involves an actual conflict of interest with us. Our Manager and its members, managers, officers and employees may pursue acquisition opportunities in transportation and transportation-related infrastructure assets, and that we may acquire or dispose of transportation or transportation-related infrastructure assets in which such persons have a personal interest, subject to pre-approval by the independent members of our board of directors only in certain circumstances. In
19
Table of Contents
the event of a violation of this code of business of conduct and ethics that does not constitute bad faith, willful misconduct, gross negligence or reckless disregard of our Manager’s duties, neither our Manager nor its members, managers, officers or employees will be liable to us. See “Risk Factors—Risks Related to our Manager—There are conflicts of interest in our relationship with our Manager.”
Our key agreements, including our Management Agreement, the Partnership Agreement and our operating agreement, were negotiated among related parties, and their respective terms, including fees and other amounts payable, may not be as favorable to us as terms negotiated on an arm’s-length basis with unaffiliated parties. Our independent directors may not vigorously enforce the provisions of our Management Agreement against our Manager. For example, our independent directors may refrain from terminating our Manager because doing so could result in the loss of key personnel.
The structure of our Manager’s and the General Partner’s compensation arrangements may have unintended consequences for us. We have agreed to pay our Manager a management fee and the General Partner is entitled to receive incentive allocations from Holdco that are each based on different measures of performance. Consequently, there may be conflicts in the incentives of our Manager to generate attractive risk-adjusted returns for us. In addition, because the General Partner and our Manager are both affiliates of Fortress, the incentive allocations to the General Partner may cause our Manager to place undue emphasis on the maximization of earnings, including through the use of leverage, at the expense of other objectives, such as preservation of capital, to achieve higher incentive allocations. Investments with higher yield potential are generally riskier or more speculative than investments with lower yield potential. This could result in increased risk to the value of our portfolio of assets and your investment in us.
We may compete with entities affiliated with our Manager or Fortress for certain target assets. From time to time, affiliates of Fortress may focus on investments in assets with a similar profile as our target assets that we may seek to acquire. These affiliates may have meaningful purchasing capacity, which may change over time depending upon a variety of factors, including, but not limited to, available equity capital and debt financing, market conditions and cash on hand. Fortress has multiple existing and planned funds focused on investing in one or more of the sectors in which we acquire assets, each with significant current or expected capital commitments. We may co-invest with these funds in certain target assets. Fortress funds generally have a fee structure similar to ours, but the fees actually paid will vary depending on the size, terms and performance of each fund. Fortress had approximately $67.5 billion of assets under management as of December 31, 2014.
Our Manager may determine, in its discretion, to make a particular acquisition through an investment vehicle other than us. Investment allocation decisions will reflect a variety of factors, such as a particular vehicle’s availability of capital (including financing), investment objectives and concentration limits, legal, regulatory, tax and other similar considerations, the source of the opportunity and other factors that the Manager, in its discretion, deems appropriate. Our Manager does not have an obligation to offer us the opportunity to participate in any particular investment, even if it meets our asset acquisition objectives. In addition, employees of Fortress or certain of its affiliates—including personnel providing services to or on behalf of our Manager—may perform services for Fortress affiliates that may acquire or seek to acquire transportation and infrastructure-related assets.
Our Organizational Structure
We are owned by two entities: Fortress Worldwide Transportation and Infrastructure Investors LP (the “Onshore Partnership”) and Fortress Worldwide Transportation and Infrastructure Investors Offshore L.P. (the “Offshore Partnership”), which holds indirect ownership interests in us through FTAI Offshore Holdings, L.P. (the “Intermediary Offshore Partnership” and, together with the Onshore Partnership, the “Initial Shareholders”). The Onshore Partnership and the Offshore Partnership are limited partnerships controlled by affiliates of Fortress formed for the purpose of investing in us. Immediately prior to the consummation of this offering, we intend to
20
Table of Contents
effect a pro rata distribution of 53,502,873 common shares to the Initial Shareholders based on their relative interests in us, which will result in the Onshore Partnership holding an aggregate of 48,157,963 of our common shares and the Intermediary Offshore Partnership holding an aggregate of 5,344,910 of our common shares. If applicable, immediately prior to the consummation of this offering, the General Partner will also contribute its rights to previously undistributed incentive allocations pursuant to the partnership agreement of the general partner to the Onshore Partnership and the Intermediary Offshore Partnership, in exchange for limited partnership interests in each such partnership equal to the amount of any such undistributed incentive allocations.
Following the expiration of the lock-up agreements entered into between the underwriters and the Initial Shareholders, the Initial Shareholders will distribute (the “Distribution”) the common shares owned by them and any other distributable proceeds allocable to holders of the limited partnership interests of the Initial Shareholders (other than common shares allocable to the General Partner) and the Offshore Partnership will subsequently distribute all of its common shares and any other distributable proceeds allocable to its limited partners, in accordance with the distribution allocation formulas contained in the respective limited partnership agreements of the Initial Shareholders and the Offshore Partnership. For purposes of allocating the common shares in the Distribution, the shares will be valued at the initial public offering price per share. Immediately following the Distribution (assuming an offering price of $20.00 per share, which is the midpoint of the price range set forth on the cover of this prospectus, and no additional issuances or repurchases of common shares following this offering), the General Partner and its affiliates will own approximately 2.1% of our outstanding shares and the other limited partners will own, in the aggregate, approximately 70.7% of our outstanding shares.
Prior to the consummation of this offering, we have received approximately $49.5 million of net equity capital since December 31, 2014 and we expect to cause the existing limited partners of the Offshore Partnership and the Onshore Partnership to contribute $201.9 million of the remaining capital under the respective partnership agreements. See “—Recent Developments—Capital Availability.”
We were formed for the purpose of effecting this offering. Our only business following this offering will be our ownership of partnership interests in Holdco and, as such, our only source of income will be distributions from Holdco, which are subject to the General Partner’s right to receive certain incentive payments before any distributions are made to us. In addition, we will be obligated to pay a management fee to FIG LLC, our Manager, which is an affiliate of Fortress. See “Our Manager and Management Agreement and Other Compensation Arrangements” for additional information on the management fee and potential incentive allocation payable to the General Partner.
21
Table of Contents
The graphic below illustrates our holding company structure both before and after giving effect to this offering and the Distribution (assuming no exercise of the underwriters’ option to purchase additional shares).
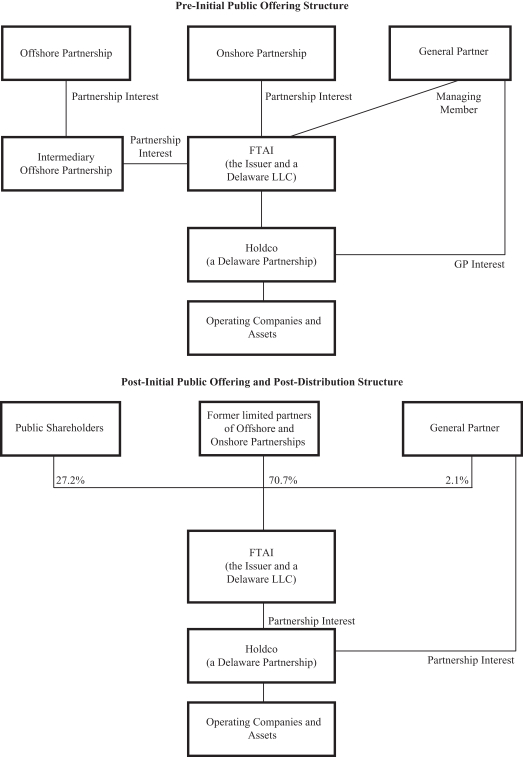
22
Table of Contents
Tax Considerations
Skadden, Arps, Slate, Meagher & Flom LLP has acted as our counsel in connection with this offering. At the closing of this offering, Skadden, Arps, Slate, Meagher & Flom LLP will deliver to us an opinion that, under current law, FTAI will be treated, for U.S. federal income tax purposes, as a partnership and not as an association or a publicly traded partnership taxable as a corporation. Accordingly, our shareholders will be required to report and pay tax currently on their allocable share of our income for U.S. federal income tax purposes, regardless of whether any cash or other dividends are paid to them. See “United States Federal Income Tax Considerations—Taxation of FTAI.”
Emerging Growth Company Status
We are an “emerging growth company” as defined in the Jumpstart Our Business Startups Act, or the JOBS Act. As such, we have elected to take advantage of certain exemptions from various reporting requirements that are applicable to other public companies that are not “emerging growth companies” including, but not limited to, not being required to comply with the auditor attestation requirements of Section 404 of the Sarbanes-Oxley Act of 2002 (the “Sarbanes-Oxley Act”) and exemptions from the requirements of holding a non-binding advisory vote on executive compensation and shareholder approval of any golden parachute payments not previously approved. Because we will take advantage of each of these exemptions, we do not know if some investors will find our common shares less attractive as a result. The result may be a less active trading market for our common shares, and our share price may be more volatile.
In addition, Section 107 of the JOBS Act also provides that an “emerging growth company” can take advantage of the extended transition period provided in Section 13(a) of the Securities Exchange Act of 1934, as amended (the “Exchange Act”), for complying with new or revised accounting standards. In other words, an “emerging growth company” can delay the adoption of certain accounting standards until those standards would otherwise apply to private companies. We have not elected to take advantage of this extended transition period.
We could remain an “emerging growth company” until the earliest of (i) the last day of the first fiscal year in which our annual gross revenues exceed $1 billion, (ii) the last day of the fiscal year following the fifth anniversary of the date of this offering, (iii) the date that we become a “large accelerated filer” as defined in Rule 12b-2 under the Exchange Act, which would occur if the market value of our common shares that is held by non-affiliates exceeds $700 million as of the last business day of our most recently completed second fiscal quarter, or (iv) the date on which we have issued more than $1 billion in non-convertible debt during the preceding three-year period.
Our Corporate Information
We were formed as Fortress Transportation and Infrastructure Investors Ltd., an exempted company incorporated under the laws of Bermuda, on October 23, 2013. We were domesticated in Delaware as a limited liability company and changed our name to Fortress Transportation and Infrastructure Investors LLC on February 19, 2014. Holdco was formed on May 9, 2011 and commenced operations on June 23, 2011; from that time until the current date its operations have consisted of acquiring managing and disposing of transportation and transportation-related infrastructure and equipment assets as more fully described herein. Our principal executive offices are located at 1345 Avenue of the Americas c/o Fortress Transportation and Infrastructure Investors LLC, New York, New York 10105. Our telephone number is 212-798-6100. Our web address is www.ftandi.com. We have included our website address in this prospectus solely as an inactive textual reference. The information on or otherwise accessible through our web site does not constitute a part of this prospectus or any other report or document we file with or furnish to the SEC.
23
Table of Contents
SUMMARY HISTORICAL CONSOLIDATED AND UNAUDITED PRO FORMA COMBINED FINANCIAL INFORMATION
The following tables summarize the consolidated financial information of the Company. The Company is a recently-formed limited liability company that has not, to date, conducted any activities other than those incident to its formation and its ownership of Holdco, which have been deemed immaterial and therefore are not presented in the summary historical consolidated financial data.
The summary consolidated statement of operations data for the years ended December 31, 2014 and 2013, and the summary consolidated balance sheet data as of December 31, 2014 and 2013 have been derived from our audited financial statements.
The unaudited pro forma combined financial information has been prepared to reflect adjustments to our historical consolidated financial information that are (i) directly attributable to the Pro Forma Transactions, (ii) factually supportable, and (iii) with respect to the unaudited pro forma combined statement of operations, expected to have a continuing impact on our results. However, such adjustments are estimates based on certain assumptions and may not prove to be accurate. Information regarding these adjustments is subject to risks and uncertainties that could cause actual results to differ materially from our unaudited pro forma combined financial information.
The unaudited pro forma combined financial information gives effect to the following (the “Pro Forma Transactions”):
| • | the acquisition of Montreal, Maine and Atlantic Railway Ltd. (“MM&A—U.S.”) and Montreal, Maine and Atlantic Canada Co (“MM&A—Canada”) on May 15, 2014 and June 30, 2014, respectively, which are accounted for as business combinations. The acquired businesses were renamed as CMQR subsequent to the acquisition; |
| • | the acquisition of a 60% interest in Jefferson Terminal on August 27, 2014, which was accounted for as a business combination and the financing under the new credit facility entered into in connection with such acquisition; |
| • | the management fee payable to the Manager and the incentive compensation allocable to the General Partner following this offering; and |
| • | the issuance of common shares to the Initial Shareholders immediately prior to this offering in exchange for existing membership interests in the Company. |
The unaudited pro forma combined statement of operations for the year ended December 31, 2014 gives effect to the Pro Forma Transactions as if they had occurred as of January 1, 2014. The unaudited pro forma combined balance sheet as of December 31, 2014 gives effect to the Pro Forma Transactions, as if they had occurred on December 31, 2014.
24
Table of Contents
The following summary historical consolidated and unaudited pro forma combined financial information should be read in conjunction with “Management’s Discussion and Analysis of Financial Condition and Results of Operations,” “Unaudited Pro Forma Combined Financial Information,” and our audited consolidated financial statements and related notes included elsewhere in this prospectus.
| PRO FORMA (UNAUDITED) |
HISTORICAL | |||||||||||
| Year ended December 31, 2014 |
Year ended December 31, 2014 |
Year ended December 31, 2013 |
||||||||||
| (in thousands except for share and per share data) | ||||||||||||
| Statement of Operations data: |
||||||||||||
| Equipment leasing revenues |
$ | 45,154 | $ | 43,984 | $ | 19,530 | ||||||
| Infrastructure revenues |
21,021 | 13,946 | — | |||||||||
|
|
|
|
|
|
|
|||||||
| Total revenues |
66,175 | 57,930 | 19,530 | |||||||||
|
|
|
|
|
|
|
|||||||
| Operating expenses |
34,542 | 27,223 | 3,157 | |||||||||
| General and administrative (1) |
39,739 | 2,007 | 805 | |||||||||
| Acquisition and transaction expenses |
310 | 11,450 | 260 | |||||||||
| Management fees to affiliate |
9,255 | 5,463 | 2,211 | |||||||||
| Depreciation and amortization |
21,266 | 15,998 | 3,909 | |||||||||
| Interest expense (2) |
14,963 | 5,872 | 2,816 | |||||||||
|
|
|
|
|
|
|
|||||||
| Total expenses |
120,075 | 68,013 | 13,158 | |||||||||
|
|
|
|
|
|
|
|||||||
| Equity in earnings of unconsolidated entities, net |
6,093 | 6,093 | 10,325 | |||||||||
| Gain on sale of equipment, net |
1,403 | 7,576 | 2,415 | |||||||||
| Gain on sale of unconsolidated entity |
— | — | 6,144 | |||||||||
| Interest income |
186 | 186 | 23 | |||||||||
| Other income (expense) |
(4,519 | ) | 20 | — | ||||||||
|
|
|
|
|
|
|
|||||||
| Total other income |
3,163 | 13,875 | 18,907 | |||||||||
|
|
|
|
|
|
|
|||||||
| (Loss) Income before income taxes |
(50,737 | ) | 3,792 | 25,279 | ||||||||
| Provision for income taxes |
874 | 874 | — | |||||||||
|
|
|
|
|
|
|
|||||||
| Net (loss) income |
(51,611 | ) | 2,918 | 25,279 | ||||||||
| Less: Net (loss) income attributable to non-controlling interest in consolidated subsidiaries |
(24,312 | ) | (4,862 | ) | 458 | |||||||
|
|
|
|
|
|
|
|||||||
| Net (loss) income attributable to members |
$ | (27,299 | ) | $ | 7,780 | $ | 24,821 | |||||
|
|
|
|
|
|
|
|||||||
| Unaudited (loss) earnings per share, basic and diluted, as adjusted for the Distribution |
(0.51 | ) | 0.15 | 0.46 | ||||||||
| Unaudited weighted average shares outstanding, basic and diluted, as adjusted for the Distribution |
53,502,873 | 53,502,873 | 53,502,873 | |||||||||
| Adjusted Net Income (3) |
$ | 20,657 | $ | 25,081 | ||||||||
|
|
|
|
|
|||||||||
| Adjusted EBITDA (4) |
$ | 89,313 | $ | 70,397 | ||||||||
|
|
|
|
|
|||||||||
| (1) | The increase in pro forma general and administrative expense as compared to historical periods is primarily attributable to approximately $37 million in general and administrative expenses incurred by Jefferson Terminal during its pre-acquisition period in 2014. |
| (2) | The increase in pro forma interest expense as compared to historical periods is primarily attributable to reflecting the interest expense associated with the $100 million term loan from Morgan Stanley Senior Funding, Inc., entered into in connection with the Jefferson Terminal acquisition as if the term loan had been outstanding since January 1, 2014. The term loan has a variable interest rate, which is calculated as 9% at the date of acquisition. |
25
Table of Contents
| PRO FORMA (UNAUDITED) |
HISTORICAL | |||||||||||
| December 31, 2014 |
December 31, 2014 |
December 31, 2013 |
||||||||||
| (in thousands) | ||||||||||||
| Balance Sheet data: |
||||||||||||
| Total assets |
$ | 1,404,201 | $ | 1,404,201 | $ | 278,647 | ||||||
| Debt obligations |
592,867 | 592,867 | 73,388 | |||||||||
| Total liabilities |
690,704 | 690,704 | 82,763 | |||||||||
| Total members’ equity |
713,497 | 713,497 | 195,884 | |||||||||
| (3) | Adjusted Net Income is defined as net income attributable to members, adjusted (a) to exclude the impact of provision for income taxes, equity-based compensation expense, acquisition and transaction expenses, losses on the modification or extinguishment of debt and capital lease obligations, changes in fair value of non-hedge derivative instruments, asset impairment charges, and equity in earnings of unconsolidated entities; (b) to include the impact of cash tax payments, our pro-rata share of the Adjusted Net Income from unconsolidated entities (collectively “Adjusted Net Income”); and (c) to exclude the impact of the non-controlling share of Adjusted Net Income. The Company evaluates investment performance for each reportable segment primarily based on Adjusted Net Income. The Company believes that net income attributable to members as defined by GAAP is the most appropriate earnings measurement, with which to reconcile Adjusted Net Income. |
| Year Ended December 31, 2014 |
Year Ended December 31, 2013 |
|||||||
| (in thousands) | ||||||||
| Net Income attributable to members |
$ | 7,780 | $ | 24,821 | ||||
| Add: Provision for income taxes |
874 | — | ||||||
| Add: Equity-based compensation expense |
1,265 | — | ||||||
| Add: Acquisition and transaction expenses |
11,450 | 260 | ||||||
| Add: Losses on the modification or extinguishment of debt and capital lease obligations |
— | — | ||||||
| Add: Changes in fair value of non-hedge derivative instruments |
25 | — | ||||||
| Add: Asset impairment charges |
— | — | ||||||
| Add: Pro-rata share of Adjusted Net Income from unconsolidated entities (5) |
6,155 | 10,325 | ||||||
| Less: Cash tax payments |
(274 | ) | — | |||||
| Less: Equity in earnings of unconsolidated entities |
(6,093 | ) | (10,325 | ) | ||||
| Less: Non-controlling share of Adjusted Net Income (6) |
(525 | ) | — | |||||
|
|
|
|
|
|||||
| Adjusted Net Income |
$ | 20,657 | $ | 25,081 | ||||
|
|
|
|
|
|||||
| (4) | Adjusted EBITDA is defined as net income attributable to members, adjusted (a) to exclude the impact of provision for income taxes, equity-based compensation expense, acquisition and transaction expenses, losses on the modification or extinguishment of debt and capital lease obligations, changes in fair value of non-hedge derivative instruments, asset impairment charges, depreciation and amortization expense, and interest expense; (b) to include the impact of principal collections on direct finance leases (collectively, “Adjusted EBITDA”) and pro-rata share of the Adjusted EBITDA from unconsolidated entities; and (c) to exclude the impact of equity in earnings of unconsolidated entities and the non-controlling share of Adjusted EBITDA. |
26
Table of Contents
| Year Ended December 31, 2014 |
Year Ended December 31, 2013 |
|||||||
| (in thousands) | ||||||||
| Net Income attributable to members |
$ | 7,780 | $ | 24,821 | ||||
| Add: Provision for income taxes |
874 | — | ||||||
| Add: Equity-based compensation expense |
1,265 | — | ||||||
| Add: Acquisition and transaction expenses |
11,450 | 260 | ||||||
| Add: Losses on the modification or extinguishment of debt and capital lease obligations |
— | — | ||||||
| Add: Changes in fair value of non-hedge derivative instruments |
25 | — | ||||||
| Add: Asset impairment charges |
— | — | ||||||
| Add: Depreciation & amortization expense |
18,692 | 3,909 | ||||||
| Add: Interest expense |
5,872 | 2,816 | ||||||
| Add: Principal collections on direct finance leases |
11,931 | 8,263 | ||||||
| Add: Pro-rata share of the Adjusted EBITDA from unconsolidated entities (7) |
40,014 | 40,898 | ||||||
| Less: Equity in earnings of unconsolidated entities |
(6,093 | ) | (10,325 | ) | ||||
| Less: Non-controlling share of Adjusted EBITDA (8) |
(2,497 | ) | (245 | ) | ||||
|
|
|
|
|
|||||
| Adjusted EBITDA |
$ | 89,313 | $ | 70,397 | ||||
|
|
|
|
|
|||||
| (5) | Pro-rata share of Adjusted Net Income from unconsolidated entities includes the Company’s proportionate share of the unconsolidated entities’ net income adjusted for the excluded and included items detailed in the table above. Included in the year ended December 31, 2014 is $62 of loss on extinguishment of debt. |
| (6) | Non-controlling share of Adjusted Net Income is comprised of the following: |
| Year Ended December 31, 2014 |
Year Ended December 31, 2013 |
|||||||
| (in thousands) | ||||||||
| Non controlling share of equity based compensation |
$ | 454 | $ | — | ||||
| Non controlling share of income tax benefit |
71 | — | ||||||
|
|
|
|
|
|||||
| Non-controlling share of Adjusted Net Income |
$ | 525 | $ | — | ||||
|
|
|
|
|
|||||
| (7) | Pro-rata share of the Adjusted EBITDA from unconsolidated entities is comprised of the following: |
| Year Ended December 31, 2014 |
Year Ended December 31, 2013 |
|||||||
| (in thousands) | ||||||||
| Net income (a) |
$ | 5,876 | $ | 10,082 | ||||
| Interest expense |
2,561 | 4,199 | ||||||
| Depreciation and amortization |
1,232 | 2,189 | ||||||
| Principal collections on finance leases |
30,345 | 24,428 | ||||||
|
|
|
|
|
|||||
| Pro-rata share of the Adjusted EBITDA from unconsolidated entities |
$ | 40,014 | $ | 40,898 | ||||
|
|
|
|
|
|||||
| (a) | Our pro-rata share of net income from investments in unconsolidated entities differs from our earnings from equity method investments. Earnings from equity method investments exclude premium amortization and include interest expense paid to affiliates. Pro-rata share of net income from investments in unconsolidated entities includes loss on extinguishment of debt. |
27
Table of Contents
| (8) | Non-controlling share of Adjusted EBITDA is comprised of the following: |
| Year Ended December 31, 2014 |
Year Ended December 31, 2013 |
|||||||
| (in thousands) | ||||||||
| Non controlling share of equity based compensation |
$ | 454 | $ | — | ||||
| Non controlling share of income tax benefit |
71 | — | ||||||
| Non controlling share of interest expense |
642 | 104 | ||||||
| Non controlling share of depreciation and amortization |
1,330 | 141 | ||||||
|
|
|
|
|
|||||
| Non-controlling share of Adjusted EBITDA |
$ | 2,497 | $ | 245 | ||||
|
|
|
|
|
|||||
28
Table of Contents
THE OFFERING
| Common shares we are offering |
20,000,000 shares. |
| Common shares to be issued and outstanding after this offering |
73,502,873 shares (76,502,873 shares if the underwriters exercise their option to purchase additional shares in full). |
| Use of proceeds |
We intend to use the net proceeds to us from this offering, together with our other sources of capital and liquidity, for the acquisition of new assets in the sectors in which we currently invest—aviation, energy, intermodal transport and rail—as well as to opportunistically acquire assets across the entire transportation and transportation-related infrastructure and equipment market. In addition, we intend to use the net proceeds for follow-on investments in our existing assets, working capital and other general corporate purposes. |
| Dividend policy |
We intend to pay regular quarterly dividends to holders of our common shares out of assets legally available for this purpose. Dividends will be authorized by our board of directors and declared by us based on a number of factors including actual results of operations, liquidity and financial condition, restrictions imposed by applicable law, our taxable income, our operating expenses and other factors our board of directors deem relevant. Our long term goal is to maintain a payout ratio of between 50-60% of funds available for distribution, with remaining amounts used primarily to fund our future acquisitions and opportunities. As a public company, there can be no assurance that we will pay dividends in amounts or on a basis consistent with prior distributions to our investors, if at all. For the second quarter of 2015, we intend to pay a dividend of $0.33 per share, which will be pro-rated for the period from the consummation of this offering to the end of the quarter and paid in the third quarter of 2015. We have historically not generated sufficient funds available for distribution to support this payout amount and our ability to do so is subject to certain uncertainties including the performance of our existing Equipment Leasing Business as well as the improvement in the operating performance of our Infrastructure Business including Jefferson Terminal and CMQR. Furthermore, some of our prior distributions to our investors would not have been possible without proceeds from equity and debt financings. Any shortfalls in the future may be funded with the proceeds from further equity and debt financings. Because we are a holding company and have no direct operations, we will only be able to pay dividends from our available cash on hand and any funds we receive from our subsidiaries and our ability to receive distributions from our subsidiaries may be limited by the financing agreements to which they are subject. See “Dividend Policy.” |
| Risk factors |
See “Risk Factors” for a discussion of factors you should carefully consider before deciding to invest in our common shares. |
29
Table of Contents
| Tax |
Skadden, Arps, Slate, Meagher & Flom LLP has acted as our counsel in connection with this offering. At the closing of this offering, Skadden, Arps, Slate, Meagher & Flom LLP will deliver to us an opinion that, under current law, FTAI will be treated, for U.S. federal income tax purposes, as a partnership and not as an association or a publicly traded partnership taxable as a corporation. Accordingly, our shareholders will be required to report and pay tax currently on their allocable share of our income for U.S. federal income tax purposes, regardless of whether any cash or other dividends are paid to them. See “United States Federal Income Tax Considerations—Taxation of FTAI.” |
| Directed Share Program |
At our request, the underwriters have reserved up to 5% of the shares for sale at the initial public offering price to persons who are directors, officers, or who are otherwise associated with us, through a directed share program. The number of shares available for sale to the general public will be reduced by the number of directed shares purchased by participants in the program. Any directed shares not purchased will be offered by the underwriters to the general public on the same basis as all other shares offered. See “Underwriting.” |
| NYSE symbol |
“FTAI.” |
Except as otherwise indicated, all of the information in this prospectus:
| • | gives retroactive effect to the pro rata distribution of 53,502,873 common shares to the Initial Shareholders based on their relative interests in us; |
| • | assumes no exercise of the underwriters’ option to purchase up to 3,000,000 additional common shares; and |
| • | assumes an initial offering price of $20.00 per share, which is the midpoint of the estimated initial public offering price range set forth on the cover page of this prospectus. |
30
Table of Contents
Investing in our common shares involves a high degree of risk. You should carefully consider the following risk factors, as well as other information contained in this prospectus, before deciding to invest in our common shares. The occurrence of any of the following risks could materially and adversely affect our business, prospects, financial condition, results of operations and cash flow, in which case, the trading price of our common shares could decline and you could lose all or part of your investment.
Risks Relating to Our Business
Uncertainty relating to macroeconomic conditions may reduce the demand for our assets, result in non-performance of contracts by our lessees or charterers, limit our ability to obtain additional capital to finance new investments, or have other unforeseen negative effects.
Uncertainty and negative trends in general economic conditions in the United States and abroad, including significant tightening of credit markets and commodity price volatility, historically have created difficult operating environments for owners and operators in the transportation industry. Many factors, including factors that are beyond our control, may impact our operating results or financial condition and/or affect the lessees and charterers that form our customer base. For some years, the world has experienced weakened economic conditions and volatility following adverse changes in global capital markets. More recently, excess supply in oil and gas markets has put significant downward pressure on prices for these commodities, and may affect demand for assets used in production, refining and transportation of oil and gas. These conditions have resulted in significant contraction, de-leveraging and reduced liquidity in the credit markets. A number of governments have implemented, or are considering implementing, a broad variety of governmental actions or new regulations for the financial markets. In addition, limitations on the availability of capital, higher costs of capital for financing expenditures or the desire to preserve liquidity, may cause our current or prospective customers to make reductions in future capital budgets and spending.
Further, demand for our assets is related to passenger and cargo traffic growth, which in turn is dependent on general business and economic conditions. We cannot assure you that the recent global economic downturn will not continue or worsen, which could have an adverse impact on passenger and cargo traffic levels and consequently our lessees’ and charterers’ business, which may in turn result in a significant reduction in revenues, earnings and cash flows, difficulties accessing capital and a deterioration in the value of our assets. We may also become exposed to increased credit risk from our customers and third parties who have obligations to us, which could result in increased non-performance of contracts by our lessees or charterers and adversely impact our business, prospects, financial condition, results of operations and cash flows.
The industries in which we operate have experienced periods of oversupply during which lease rates and asset values have declined, particularly during the recent economic downturn, and any future oversupply could materially adversely affect our results of operations and cash flows.
The oversupply of a specific asset is likely to depress the lease or charter rates for and the value of that type of asset and result in decreased utilization of our assets, and the industries in which we operate have experienced periods of oversupply during which rates and asset values have declined, particularly during the recent economic downturn. Factors that could lead to such oversupply include, without limitation:
| • | general demand for the type of assets that we purchase; |
| • | general macroeconomic conditions, including market prices for commodities that our assets may serve; |
| • | geopolitical events, including war, prolonged armed conflict and acts of terrorism; |
| • | outbreaks of communicable diseases and natural disasters; |
| • | governmental regulation; |
| • | interest rates; |
31
Table of Contents
| • | the availability of credit; |
| • | restructurings and bankruptcies of companies in the industries in which we operate, including our customers; |
| • | manufacturer production levels and technological innovation; |
| • | manufacturers merging or exiting the industry or ceasing to produce certain asset types; |
| • | retirement and obsolescence of the assets that we own; |
| • | our railroad infrastructure may be damaged, including by flooding and railroad derailments; |
| • | increases in supply levels of assets in the market due to the sale or merging of operating lessors; and |
| • | reintroduction of previously unused or dormant assets into the industries in which we operate. |
These and other related factors are generally outside of our control and could lead to persistence of, or increase in, the oversupply of the types of assets that we acquire or decreased utilization of our assets, either of which could materially adversely affect our results of operations and cash flow. In addition, lessees may redeliver our assets to locations where there is oversupply, which may lead to additional repositioning costs for us if we move them to areas with higher demand. Positioning expenses vary depending on geographic location, distance, freight rates and other factors, and may not be fully covered by drop-off charges collected from the last lessees of the equipment or pick-up charges paid by the new lessees. Positioning expenses can be significant if a large portion of our assets are returned to locations with weak demand, which could materially adversely affect our business, prospects, financial condition, results of operations and cash flow.
There can be no assurance that any target returns will be achieved.
Our target returns for assets are targets only and are not forecasts of future profits. We develop target returns based on our Manager’s assessment of appropriate expectations for returns on assets and the ability of our Manager to enhance the return generated by those assets through active management. There can be no assurance that these assessments and expectations will be achieved and failure to achieve any or all of them may materially adversely impact our ability to achieve any target return with respect to any or all of our assets.
In addition, our target returns are based on estimates and assumptions regarding a number of other factors, including, without limitation, holding periods, the absence of material adverse events affecting specific investments (which could include, without limitation, natural disasters, terrorism, social unrest or civil disturbances), general and local economic and market conditions, changes in law, taxation, regulation or governmental policies and changes in the political approach to transportation investment, either generally or in specific countries in which we may invest or seek to invest. Many of these factors, as well as the other risks described elsewhere in this prospectus, are beyond our control and all could adversely affect our ability to achieve a target return with respect to an asset. Further, target returns are targets for the return generated by specific assets and not by us. Numerous factors could prevent us from achieving similar returns, notwithstanding the performance of individual assets, including, without limitation, taxation and fees payable by us or our operating subsidiaries, including fees payable to our Manager and the incentive allocation payable to General Partner.
There can be no assurance that the returns generated by any of our assets will meet our target returns, or any other level of return, or that we will achieve or successfully implement our asset acquisition objectives, and failure to achieve the target return in respect of any of our assets could, among other things, have a material adverse effect on our business, prospects, financial condition, results of operations and cash flow. Further, even if the returns generated by individual assets meet target returns, there can be no assurance that the returns generated by other existing or future assets would do so, and the historical performance of the assets in our existing portfolio should not be considered as indicative of future results with respect to any assets.
32
Table of Contents
Contractual defaults may adversely affect our business, prospects, financial condition, results of operations and cash flows by decreasing revenues and increasing storage, positioning, collection, recovery and lost equipment expenses.
The success of our business depends in large part on the success of the operators in the sectors in which we participate. Cash flows from our assets are substantially impacted by our ability to collect compensation and other amounts to be paid in respect of such assets from the customers with which we enter into leases, charters or other contractual arrangements. Inherent in the nature of the leases, charters and other arrangements for the use of such assets is the risk that we may not receive, or may experience delay in realizing, such amounts to be paid. While we target the entry into contracts with credit-worthy counterparties, no assurance can be given that such counterparties will perform their obligations during the term of the leases, charters or other contractual arrangements. In addition, when counterparties default, we may fail to recover all of our assets, and the assets we do recover may be returned in damaged condition or to locations where we will not be able to efficiently lease, charter or sell them. In most cases, we maintain, or require our lessees to maintain, certain insurances to cover the risk of damages or loss of our assets. However, these insurance policies may not be sufficient to protect us against a loss.
Depending on the specific sector, the risk of contractual defaults may be elevated due to excess capacity as a result of oversupply during the recent economic downturn. We lease assets to our customers pursuant to fixed-price contracts, and our customers then seek to utilize those assets to transport goods and provide services. If the price at which our customers receive for their transportation services decreases as a result of an oversupply in the marketplace, then our customers may be forced to reduce their prices in order to attract business (which may have an adverse affect on their ability to meet their contractual lease obligations to us), or may seek to renegotiate or terminate their contractual lease arrangements with us to pursue a lower-priced opportunity with another lessor, which may have a direct, adverse effect on us. See “—The industries in which we operate have experienced periods of oversupply during which lease rates and asset values have declined, particularly during the financial crisis, and any future oversupply could materially adversely affect our results of operations and cash flows” above. Any default by a material customer would have a significant impact on our profitability at the time the customer defaulted, which could materially adversely affect our operating results and growth prospects. In addition, some of our counterparties may reside in jurisdictions with legal and regulatory regimes that make it difficult and costly to enforce such counterparties’ obligations.
We may not be able to renew or obtain new or favorable charters or leases, which could adversely affect our business, prospects, financial condition, results of operations and cash flows.
Our operating leases are subject to greater residual risk than direct finance leases because we will own the assets at the expiration of an operating lease term and we may be unable to renew existing charters or leases at favorable rates, or at all, or sell the leased or chartered assets, and the residual value of the asset may be lower than anticipated. In addition, our ability to renew existing charters or leases or obtain new charters or leases will also depend on prevailing market conditions, and upon expiration of the contracts governing the leasing or charter of the applicable assets, we may be exposed to increased volatility in terms of rates and contract provisions. Likewise, our customers may reduce their activity levels or seek to terminate or renegotiate their charters or leases with us. If we are not able to renew or obtain new charters or leases in direct continuation, or if new charters or leases are entered into at rates substantially below the existing rates or on terms otherwise less favorable compared to existing contractual terms, or if we are unable to sell assets for which we are unable to obtain new contracts or leases, our business, prospects, financial condition, results of operations and cash flows could be materially adversely affected.
If we acquire a high concentration of a particular type of asset, or concentrate our investments in a particular sector, our business, prospects, financial condition, results of operations and cash flows could be adversely affected by changes in market demand or problems specific to that asset or sector.
If we acquire a high concentration of a particular asset, or concentrate our investments in a particular sector, our business and financial results could be adversely affected by sector-specific or asset-specific factors. For
33
Table of Contents
example, if a particular sector experiences difficulties such as increased competition or oversupply, the operators we rely on as a lessor may be adversely affected and consequently our business and financial results may be similarly affected. If we acquire a high concentration of a particular asset and the market demand for a particular asset declines, it is redesigned or replaced by its manufacturer or it experiences design or technical problems, the value and rates relating to such asset may decline, and we may be unable to lease or charter such asset on favorable terms, if at all. Any decrease in the value and rates of our assets may have a material adverse effect on our business, prospects, financial condition, results of operations and cash flows.
We operate in highly competitive markets.
The business of acquiring transportation and transportation-related infrastructure assets is highly competitive. Market competition for opportunities includes traditional transportation and infrastructure companies, commercial and investment banks, as well as a growing number of non-traditional participants, such as hedge funds, private equity funds and other private investors, including other affiliates of Fortress. Some of these competitors may have access to greater amounts of capital and/or to capital that may be committed for longer periods of time or may have different return thresholds than us, and thus these competitors may have certain advantages not shared by us. In addition, competitors may have incurred, or may in the future incur, leverage to finance their debt investments at levels or on terms more favorable than those available to us. Strong competition for investment opportunities could result in fewer such opportunities for us, as certain of these competitors have established and are establishing investment vehicles that target the same types of assets that we intend to purchase.
In addition, some of our competitors may have longer operating histories, greater financial resources and lower costs of capital than us, and consequently, may be able to compete more effectively in one or more of our target markets. We likely will not always be able to compete successfully with our competitors and competitive pressures or other factors may also result in significant price competition, particularly during industry downturns, which could have a material adverse effect on our business, prospects, financial condition, results of operations and cash flows.
Litigation to enforce our contracts and recover our assets has inherent uncertainties that are increased by the location of our assets in jurisdictions that have less developed legal systems.
While some of our contractual arrangements are governed by New York law and provide for the non-exclusive jurisdiction of the courts located in the state of New York, our ability to enforce our counterparties’ obligations under such contractual arrangements is subject to applicable laws in the jurisdiction in which enforcement is sought. While some of our existing assets are used in specific jurisdictions, transportation and transportation-related infrastructure assets by their nature generally move throughout multiple jurisdictions in the ordinary course of business. As a result, it is not possible to predict, with any degree of certainty, the jurisdictions in which enforcement proceedings may be commenced. Litigation and enforcement proceedings have inherent uncertainties in any jurisdiction and are expensive. These uncertainties are enhanced in countries that have less developed legal systems where the interpretation of laws and regulations is not consistent, may be influenced by factors other than legal merits and may be cumbersome, time-consuming and even more expensive. For example, repossession from defaulting lessees may be difficult and more expensive in jurisdictions whose laws do not confer the same security interests and rights to creditors and lessors as those in the United States and where the legal system is not as well developed. As a result, the remedies available and the relative success and expedience of collection and enforcement proceedings with respect to the our owned assets in various jurisdictions cannot be predicted. To the extent more of our business shifts to areas outside of the United States and Europe, such as China, it may become more difficult and expensive to enforce our rights and recover our assets.
Certain liens may arise on our assets.
Certain of our assets are currently subject to liens under separate financing arrangements entered into by two of our subsidiaries in connection with acquisitions of shipping containers. In the event of a default under
34
Table of Contents
such arrangements by the applicable subsidiary, the lenders thereunder would be permitted to take possession of or sell such assets. See “Management’s Discussion and Analysis of Financial Condition and Results of Operations—Liquidity and Capital Resources.” In addition, our currently owned assets and assets that we purchase in the future may be subject to other liens based on the industry practices relating to such assets. Until they are discharged, these liens could impair our ability to repossess, re-lease or sell our assets, and to the extent our lessees or charterers do not comply with their obligations to discharge any liens on the applicable assets, we may find it necessary to pay the claims secured by such liens in order to repossess such assets. Such payments could materially adversely affect our operating results and growth prospects.
The values of the assets that we purchase may fluctuate due to various factors.
The fair market values of our assets may decrease or increase depending on a number of factors, including the prevailing level of charter or lease rates from time to time, general economic and market conditions affecting our target markets, type and age of assets, supply and demand for assets, competition, new governmental or other regulations and technological advances, all of which could impact our profitability and our ability to lease, charter or sell such assets. In addition, our assets depreciate as they age and may generate lower revenues and cash flows. We must be able to replace such older, depreciated assets with newer assets, or our ability to maintain or increase our revenues and cash flows will decline. In addition, if we dispose of an asset for a price that is less than the depreciated book value of the asset on our balance sheet or if we determine that an asset’s value has been impaired, we will recognize a related charge in our consolidated statement of operations and such charge could be material.
Our use of joint ventures or partnerships, and our Manager’s outsourcing of certain functions, may present unforeseen obstacles or costs.
We have acquired and may in the future acquire interests in certain assets in cooperation with third-party partners or co-investors through jointly-owned acquisition vehicles, joint ventures or other structures. In these co-investment situations, our ability to control the management of such assets depends upon the nature and terms of the joint arrangements with such partners and our relative ownership stake in the asset, each of which will be determined by negotiation at the time of the investment and the determination of which is subject to the discretion of our Manager. Depending on our Manager’s perception of the relative risks and rewards of a particular asset, our Manager may elect to acquire interests in structures that afford relatively little or no operational and/or management control to us. Such arrangements present risks not present with wholly-owned assets, such as the possibility that a co-investor becomes bankrupt, develops business interests or goals that conflict with our interests and goals in respect of the assets, all of which could materially adversely affect our business, prospects, financial condition, results of operations and cash flows.
In addition, our Manager expects to utilize third party contractors to perform services and functions related to the operation and leasing of our assets. These functions may include billing, collections, recovery and asset monitoring. Because we and our Manager do not directly control these third parties, there can be no assurance that the services they provide will be delivered at a level commensurate with our expectations, or at all. The failure of any such third party contractors to perform in accordance with our expectations could materially adversely affect our business, prospects, financial condition, results of operations and cash flows.
We are subject to the risks and costs of obsolescence of our assets.
Technological and other improvements expose us to the risk that certain of our assets may become technologically or commercially obsolete. For example, in our Aviation Leasing segment, as manufacturers introduce technological innovations and new types of aircraft, some of our assets could become less desirable to potential lessees. Such technological innovations may increase the rate of obsolescence of existing aircraft faster than currently anticipated by us. In addition, the imposition of increased regulation regarding stringent noise or emissions restrictions may make some of our aircraft less desirable and less valuable in the marketplace. In our Offshore Energy segment, development and construction of new, sophisticated, high-specification assets could
35
Table of Contents
cause our assets to become less desirable to potential charterers, and insurance rates may also increase with the age of a vessel, making older vessels less desirable to potential charterers. Any of these risks may adversely affect our ability to lease, charter or sell our assets on favorable terms, if at all, which could materially adversely affect our operating results and growth prospects.
The North American rail sector is a highly regulated industry and increased costs of compliance with, or liability for violation of, existing or future laws, regulations and other requirements could significantly increase our costs of doing business, thereby adversely affecting our profitability.
The rail sector is subject to extensive laws, regulations and other requirements including, but not limited to, those relating to the environment, safety, employment, labor, immigration, minimum wages and overtime pay, health care and benefits, working conditions, public accessibility and other requirements. These laws and regulations are enforced by federal agencies including the Environmental Protection Agency, or EPA, the Department of Transportation, or DOT, the Occupational Safety and Health Act, or OSHA, the Federal Railroad Administration, or FRA, as well as numerous other state, local and federal agencies. Ongoing compliance with, or a violation of, these laws, regulations and other requirements could have a material adverse effect on our business, financial condition and results of operations.
We believe that our rail operations are in substantial compliance with applicable laws and regulations. However, these laws and regulations, and the interpretation or enforcement thereof, are subject to frequent change and varying interpretation by regulatory authorities, and we are unable to predict the ongoing cost to us of complying with these laws and regulations or the future impact of these laws and regulations on our operations. In addition, from time to time we are subject to inspections and investigations by various regulators. In April 2015, we received a notice from Transport Canada that it is investigating a possible violation under the Railway Safety Act related to inspections of our operations conducted in March 2015. We believe we are in compliance with applicable requirements, and, while we cannot predict with certainty the outcome of the investigation, we do not believe it will have a material adverse effect on the Company. Violation of environmental or other laws, regulations and permits can result in the imposition of significant administrative, civil and criminal penalties, injunctions and construction bans or delays.
Legislation passed by Congress or new regulations issued by federal agencies can significantly affect the revenues, costs and profitability of our business. For instance, in December 2009, a proposed bill called the “Surface Transportation Board Reauthorization Act of 2009” was introduced in the Senate but not advanced. In addition, more recently proposed bills such as the “Rail Shipper Fairness Act of 2015,” if adopted, could increase government involvement in railroad pricing, service and operations and significantly change the federal regulatory framework of the railroad industry. Several of the changes under consideration could have a significant negative impact on FTAI’s ability to determine prices for rail services, meet service standards and could force a reduction in capital spending. Statutes imposing price constraints or affecting rail-to-rail competition could adversely affect FTAI’s profitability.
Under various federal, state and local environmental requirements, as the owner or operator of terminals or other facilities, we may be liable for the costs of removal or remediation of contamination at or from our existing locations, whether we knew of, or were responsible for, the presence of such contamination. The failure to timely report and properly remediate contamination may subject us to liability to third parties and may adversely affect our ability to sell or rent our property or to borrow money using our property as collateral. Additionally, we may be liable for the costs of remediating third-party sites where hazardous substances from our operations have been transported for treatment or disposal, regardless of whether we own or operate that site. In the future, we may incur substantial expenditures for investigation or remediation of contamination that has not yet been discovered at our current or former locations or locations that we may acquire.
A discharge of hydrocarbons or hazardous substances into the environment associated with operating our rail assets could subject us to substantial expense, including the cost to recover the materials spilled, restore the
36
Table of Contents
affected natural resources, pay fines and penalties, and natural resource damages and claims made by employees, neighboring landowners, government authorities and other third parties, including for personal injury and property damage. We may experience future catastrophic sudden or gradual releases into the environment from our facilities or discover historical releases that were previously unidentified or not assessed. Although our inspection and testing programs are designed to prevent, detect and address any such releases promptly, the liabilities incurred due to any future releases into the environment from our assets, have the potential to substantially affect our business. Such events could also subject us to media and public scrutiny that could have a negative effect on our operations and also on the value of our common units.
Our business could be adversely affected if service on the railroads is interrupted or if more stringent regulations are adopted regarding railcar design or the transportation of crude oil by rail.
As a result of hydraulic fracturing and other improvements in extraction technologies, there has been a substantial increase in the volume of crude oil and liquid hydrocarbons produced and transported in North America, and a geographic shift in that production versus historical production. The increase in volume and shift in geography has resulted in a growing percentage of crude oil being transported by rail. High-profile accidents involving crude-oil-carrying trains in Quebec, North Dakota and Virginia, and more recently in West Virginia and Illinois, have raised concerns about the environmental and safety risks associated with crude oil transport by rail and the associated risks arising from railcar design.
In February 2015, DOT submitted its final railcar regulations to the Office of Management and Budget for review. A final ruling is expected later this year. If DOT were to adopt more strict specifications for tank cars, it would likely result in increased difficulty and costs to obtain compliant cars after the applicable phase-out dates. While we may be able to pass some of these costs on to our customers, there may be additional costs that we cannot pass on to them. We continue to monitor the railcar regulatory landscape and remain in close contact with railcar suppliers and other industry stakeholders to stay informed of railcar regulation rulemaking developments. Our ability to transport crude oil could be affected if the final rulings result in more stringent design requirements and compressed compliance timelines than currently published. If the final rulings result in more stringent design requirements and compressed compliance timelines, then our ability to transport these volumes could be affected by a delay in the railcar industry’s ability to provide adequate railcar modification repair services. We may not have access to a sufficient number of compliant cars to transport the required volumes under our existing contracts. This may lead to a decrease in revenues and other consequences.
The adoption of additional federal, state, provincial or local laws or regulations, including any voluntary measures by the rail industry regarding railcar design or crude oil and liquid hydrocarbon rail transport activities, or efforts by local communities to restrict or limit rail traffic involving crude oil, could affect our business by increasing compliance costs and decreasing demand for our services, which could adversely affect our financial position and cash flows. Moreover, any disruptions in the operations of railroads, including those due to shortages of railcars, weather-related problems, flooding, drought, accidents, mechanical difficulties, strikes, lockouts or bottlenecks, could adversely impact our customers’ ability to move their product and, as a result, could affect our business.
Our assets are exposed to unplanned interruptions caused by catastrophic events outside of our control which may disrupt our business and cause damage or losses that may not be adequately covered by insurance.
The operations of transportation and infrastructure projects are exposed to unplanned interruptions caused by significant catastrophic events, such as cyclones, earthquakes, landslides, floods, explosions, fires, major plant breakdowns, pipeline or electricity line ruptures or other disasters. Operational disruption, as well as supply disruption, could adversely impact the cash flows available from these assets. For example, the 2011 earthquake in Japan and the related nuclear reactor accidents have caused the disruption of cargo shipping lines by closing off certain ports and requiring additional precautionary and safety measures at other ports around the world. In addition, the cost of repairing or replacing damaged assets could be considerable. Repeated or prolonged
37
Table of Contents
interruption may result in temporary or permanent loss of customers, substantial litigation or penalties for regulatory or contractual non-compliance, and any loss from such events may not be recoverable under relevant insurance policies. Although we believe that we are adequately insured against these types of events, either indirectly through our lessees or charterers or through our own insurance policies, no assurance can be given that the occurrence of any such event will not materially adversely affect us. In addition, if a lessee or charter is not obligated to maintain sufficient insurance, we may incur the costs of additional insurance coverage during the related lease or charter. We can give no assurance that such insurance will be available at commercially reasonable rates, if at all.
Our assets generally require routine maintenance, and we may be exposed to unforeseen maintenance costs.
We may be exposed to unforeseen maintenance costs for our assets associated with a lessee’s or charterer’s failure to properly maintain the asset. We enter into leases and charters with respect to some of our assets pursuant to which the lessees are primarily responsible for many obligations, which generally include complying with all governmental requirements applicable to the lessee or charterer, including operational, maintenance, government agency oversight, registration requirements and other applicable directives. Failure of a lessee or charterer to perform required maintenance during the term of a lease or charter could result in a decrease in value of an asset, an inability to re-lease or charter an asset at favorable rates, if at all, or a potential inability to utilize an asset. Maintenance failures would also likely require us to incur maintenance and modification costs upon the termination of the applicable lease or charter; such costs to restore the asset to an acceptable condition prior to re-leasing, charter or sale could be substantial. Any failure by our lessees or charterers to meet their obligations to perform required scheduled maintenance or our inability to maintain our assets could materially adversely affect our business, prospects, financial condition, results of operations and cash flows.
Some of our customers operate in highly regulated industries and changes in laws or regulations, including laws with respect to international trade, may adversely affect our ability to lease, charter or sell our assets.
Some of our customers operate in highly regulated industries such as aviation and offshore energy. A number of our contractual arrangements—for example, our leasing aircraft engines or offshore energy equipment to third-party operators—require the operator (our customer) to obtain specific governmental or regulatory licenses, consents or approvals. These include consents for certain payments under such arrangements and for the export, import or re-export of the related assets. Failure by our customers or, in certain circumstances, by us, to obtain certain licenses and approvals could negatively affect our ability to conduct our business. In addition, the shipment of goods, services and technology across international borders subjects the operation of our assets to international trade laws and regulations. Moreover, many countries, including the United States, control the export and re-export of certain goods, services and technology and impose related export recordkeeping and reporting obligations. Governments also may impose economic sanctions against certain countries, persons and other entities that may restrict or prohibit transactions involving such countries, persons and entities. If any such regulations or sanctions affect the asset operators that are our customers, our business, prospects, financial condition, results of operations and cash flows may be materially adversely affected.
It is impossible to predict whether third parties will allege liability related to our purchase of the MM&A assets out of bankruptcy, including possible claims related to the July 6, 2013 train derailment near Lac-Mégantic, Quebec.
On July 6, 2013, prior to our ownership, a train carrying crude oil on the MM&A line derailed near Lac-Mégantic, Quebec which resulted in fires that claimed the lives of 47 individuals (the “Incident”). Approximately 2 million gallons of crude oil were either burned or released into the environment, including into the nearby Chaudière River. Prior to our acquisition of the MM&A assets in May and June 2014, we received written assurance from the Quebec Ministry of Sustainable Development, Environment, Wildlife and Parks that it would take full responsibility for the environmental clean-up and that it would not hold CMQR liable for any environmental damages or costs relating to clean-up or restoration of the affected area as a result of the Incident.
38
Table of Contents
While we don’t anticipate any liability relating to the Incident, including liability for claims alleging personal injury, property damage or natural resource damages, there can be no assurance that such claims relating to the Incident may arise in the future. No claims have been made or threatened against us as of March 31, 2015 and we don’t anticipate any expenditures relating to environmental clean-up (including impacts to the Chaudière River) as a result of the Incident.
Certain of our assets are subject to purchase options held by the charterer or lessee of the asset which, if exercised, could reduce the size of our asset base and our future revenues.
We have granted purchase options to the charterers and lessees of certain of our assets. The market values of these assets may change from time to time depending on a number of factors, such as general economic and market conditions affecting the industries in which we operate, competition, cost of construction, governmental or other regulations, technological changes and prevailing levels of charter or lease rates from time to time. The purchase price under a purchase option may be less than the asset’s market value at the time the option may be exercised. In addition, we may not be able to obtain a replacement asset for the price at which the asset is sold. In such cases, our business, prospects, financial condition, results of operations and cash flows may be materially adversely affected.
The profitability of our Offshore Energy segment may be impacted by the profitability of the offshore oil and gas industry generally, which is significantly affected by, among other things, volatile oil and gas prices.
Demand for assets in the Offshore Energy segment and our ability to secure charter contracts for our assets at favorable charter rates following expiry or termination of existing charters will depend, among other things, on the level of activity in the offshore oil and gas industry. The offshore oil and gas industry is cyclical and volatile, and demand for oil-service assets depends on, among other things, the level of development and activity in oil and gas exploration, as well as the identification and development of oil and gas reserves and production in offshore areas worldwide. The availability of high quality oil and gas prospects, exploration success, relative production costs, the stage of reservoir development, political concerns and regulatory requirements all affect the level of activity for charterers of oil-service vessels. Accordingly, oil and gas prices and market expectations of potential changes in these prices significantly affect the level of activity and demand for oil-service assets. Oil and gas prices can be extremely volatile (and have declined significantly in the last six months) and are affected by numerous factors beyond the Company’s control, such as: worldwide demand for oil and gas; costs of exploring, developing, producing and delivering oil and gas; expectations regarding future energy prices; the ability of the Organization of Petroleum Exporting Countries (“OPEC”) to set and maintain production levels and impact pricing; the level of production in non-OPEC countries; governmental regulations and policies regarding development of oil and gas reserves; local and international political, economic and weather conditions; domestic and foreign tax policies; political and military conflicts in oil-producing and other countries; and the development and exploration of alternative fuels. Any reduction in the demand for our assets due to these or other factors could materially adversely affect our operating results and growth prospects.
Our Shipping Containers segment is affected by the lack of an international title registry for containers, which increases the risk of ownership disputes.
Although the Bureau International des Containers registers and allocates a unique four letter prefix to every container in accordance with International Standardization Organization (“ISO”) standard 6346 (Freight container coding, identification and marking) there is no internationally recognized system of recordation or filing to evidence our title to containers nor is there an internationally recognized system for filing security interest in containers. While this has not historically had a material impact on our intermodal assets, the lack of a title recordation system with respect to containers could result in disputes with lessees, end-users, or third parties, such as creditors of end-users, who may improperly claim ownership of the containers, especially in countries with less developed legal systems.
39
Table of Contents
Our international operations involve additional risks, which could adversely affect our business, prospects, financial condition, results of operations and cash flows.
We and our customers operate in various regions throughout the world. As a result, we may, directly or indirectly, be exposed to political and other uncertainties, including risks of:
| • | terrorist acts, armed hostilities, war and civil disturbances; |
| • | acts of piracy; |
| • | significant governmental influence over many aspects of local economies; |
| • | seizure, nationalization or expropriation of property or equipment; |
| • | repudiation, nullification, modification or renegotiation of contracts; |
| • | limitations on insurance coverage, such as war risk coverage, in certain areas; |
| • | political unrest; |
| • | foreign and U.S. monetary policy and foreign currency fluctuations and devaluations; |
| • | the inability to repatriate income or capital; |
| • | complications associated with repairing and replacing equipment in remote locations; |
| • | import-export quotas, wage and price controls, imposition of trade barriers; |
| • | U.S. and foreign sanctions or trade embargoes; |
| • | restrictions on the transfer of funds into or out of countries in which we operate; |
| • | compliance with U.S. Treasury sanctions regulations restricting doing business with certain nations or specially designated nationals; |
| • | regulatory or financial requirements to comply with foreign bureaucratic actions; |
| • | compliance with applicable anti-corruption laws and regulations; |
| • | changing taxation policies, including confiscatory taxation; |
| • | other forms of government regulation and economic conditions that are beyond our control; and |
| • | governmental corruption. |
Any of these or other risks could adversely impact our customers’ international operations which could materially adversely impact our operating results and growth opportunities.
We may make acquisitions in emerging markets throughout the world, and investments in emerging markets are subject to greater risks than developed markets and could adversely affect our business, prospects, financial condition, results of operations and cash flows.
To the extent that we acquire assets in emerging markets—which we may do throughout the world—additional risks may be encountered that could adversely affect our business. Emerging market countries have less developed economies and infrastructure and are often more vulnerable to economic and geopolitical challenges and may experience significant fluctuations in gross domestic product, interest rates and currency exchange rates, as well as civil disturbances, government instability, nationalization and expropriation of private assets and the imposition of taxes or other charges by government authorities. In addition, the currencies in which investments are denominated may be unstable, may be subject to significant depreciation and may not be freely convertible or may be subject to the imposition of other monetary or fiscal controls and restrictions.
Emerging markets are still in relatively early stages of their development and accordingly may not be highly or efficiently regulated. Moreover, emerging markets tend to be shallower and less liquid than more established
40
Table of Contents
markets which may adversely affect our ability to realize profits from our assets in emerging markets when we desire to do so or receive what we perceive to be their fair value in the event of a realization. In some cases, a market for realizing profits from an investment may not exist locally. In addition, issuers based in emerging markets are not generally subject to uniform accounting and financial reporting standards, practices and requirements comparable to those applicable to issuers based in more developed countries, thereby potentially increasing the risk of fraud and other deceptive practices. Settlement of transactions may be subject to greater delay and administrative uncertainties than in developed markets and less complete and reliable financial and other information may be available to investors in emerging markets than in developed markets. In addition, economic instability in emerging markets could adversely affect the value of our assets subject to leases or charters in such countries, or the ability of our lessees or charters, which operate in these markets, to meet their contractual obligations. As a result, lessees or charterers that operate in emerging market countries may be more likely to default under their contractual obligations than those that operate in developed countries. Liquidity and volatility limitations in these markets may also adversely affect our ability to dispose of our assets at the best price available or in a timely manner.
As we have and may continue to acquire assets located in emerging markets throughout the world, we may be exposed to any one or a combination of these risks, which could adversely affect our operating results.
We are actively evaluating acquisitions of assets and operating companies in other transportation and infrastructure sectors which could result in additional risks and uncertainties for our business and unexpected regulatory compliance costs.
While our existing portfolio consists of assets in the aviation, energy, intermodal transport and rail sectors, we are actively evaluating acquisitions of assets and operating companies in other sectors of the transportation and transportation-related infrastructure and equipment markets and we plan to be flexible as other attractive opportunities arise over time. To the extent we make acquisitions in other sectors, we will face numerous risks and uncertainties, including risks associated with the required investment of capital and other resources and with combining or integrating operational and management systems and controls. Entry into certain lines of business may subject us to new laws and regulations and may lead to increased litigation and regulatory risk. Many types of transportation assets, including certain rail, airport and seaport assets, are subject to registration requirements by U.S. governmental agencies, as well as foreign governments if such assets are to be used outside of the United States. Failing to register the assets, or losing such registration, could result in substantial penalties, forced liquidation of the assets and/or the inability to operate and, if applicable, lease the assets. We may need to incur significant costs to comply with the laws and regulations applicable to any such new acquisition. The failure to comply with these laws and regulations could cause us to incur significant costs, fines or penalties or require the assets to be removed from service for a period of time resulting in reduced income from these assets. In addition, if our acquisitions in other sectors produce insufficient revenues, or produce investment losses, or if we are unable to efficiently manage our expanded operations, our results of operations will be adversely affected, and our reputation and business may be harmed.
We may acquire operating businesses, including businesses whose operations are not fully matured and stabilized. These businesses may be subject to significant operating and development risks, including increased competition, cost overruns and delays, and difficulties in obtaining approvals or financing. These factors could materially affect our business, financial condition, liquidity and results of operations.
We have acquired, and may in the future acquire, operating businesses including businesses whose operations are not fully matured and stabilized (such as Jefferson Terminal). While we have deep experience in the construction and operation of these companies, we are nevertheless subject to significant risks and contingencies of an operating business, and these risks are greater where the operations of such businesses are not fully matured and stabilized. Key factors that may affect our operating businesses include, but are not limited to:
| • | competition from market participants; |
41
Table of Contents
| • | general economic and/or industry trends, including pricing for the products or services offered by our operating businesses; |
| • | the issuance and/or continued availability of necessary permits, licenses, approvals and agreements from governmental agencies and third parties as are required to construct and operate such businesses; |
| • | changes or deficiencies in the design or construction of development projects; |
| • | unforeseen engineering, environmental or geological problems; |
| • | potential increases in construction and operating costs due to changes in the cost and availability of fuel, power, materials and supplies; |
| • | the availability and cost of skilled labor and equipment; |
| • | our ability to enter into additional satisfactory agreements with contractors and to maintain good relationships with these contractors in order to construct development projects within our expected cost parameters and time frame, and the ability of those contractors to perform their obligations under the contracts and to maintain their creditworthiness; |
| • | potential opposition from non-governmental organizations, environmental groups, local or other groups which may delay or prevent development activities; |
| • | local and economic conditions; |
| • | changes in legal requirements; and |
| • | force majeure events, including catastrophes and adverse weather conditions. |
Any of these factors could materially affect our business, financial condition, liquidity and results of operations.
Terrorist attacks could negatively impact our operations and our profitability and may expose us to liability and reputational damage.
Terrorist attacks may negatively affect our operations. Such attacks have contributed to economic instability in the United States and elsewhere, and further acts of terrorism, violence or war could similarly affect world trade and the industries in which we and our customers operate. In addition, terrorist attacks or hostilities may directly impact airports or aircraft, ports where our containers and vessels travel, or our physical facilities or those of our customers. In addition, it is also possible that our assets could be involved in a terrorist attack. The consequences of any terrorist attacks or hostilities are unpredictable, and we may not be able to foresee events that could have a material adverse effect on our operations. Although our lease and charter agreements generally require the counterparties to indemnify us against all damages arising out of the use of our assets, and we carry insurance to potentially offset any costs in the event that our customer indemnifications prove to be insufficient, our insurance does not cover certain types of terrorist attacks, and we may not be fully protected from liability or the reputational damage that could arise from a terrorist attack which utilizes our assets.
Because we are a recently formed company with a limited operating history, our historical financial and operating data may not be representative of our future results.
We are a recently formed limited liability company with a limited operating history. Our results of operations, financial condition and cash flows reflected in our consolidated financial statements may not be indicative of the results we would have achieved if we were a public company or results that may be achieved in future periods. Consequently, there can be no assurance that we will be able to generate sufficient income to pay our operating expenses and make satisfactory distributions to our shareholders, or any distributions at all. Further, we will only make acquisitions identified by our Manager. As a result of this concentration of assets, our financial performance will depend on the performance of our Manager in identifying target assets, the availability of opportunities falling within our asset acquisition strategy and the performance of those underlying assets.
42
Table of Contents
Future changes in accounting rules could significantly impact how both we and our customers account for our leases.
Our consolidated financial statements are prepared in accordance with GAAP. In May 2013, the Financial Accounting Standards Board (“FASB”) issued a revised exposure draft, “Leases” (the “Lease ED”), which would replace the existing guidance in the Accounting Standards Codification 840 (“ASC 840”), Leases. Pursuant to the Lease ED, leases would be classified as either leases of property or leases of assets other than property. Leases of property will continue to use operating lease accounting. Leases of other than property would use the receivable residual approach. Under the receivable residual approach, a lease receivable would be recognized for the lessor’s right to receive lease payments, a portion of the carrying amount of the underlying asset would be allocated between the right of use granted to the lessee and the lessor’s residual value and profit or loss would only be recognized at commencement if it is reasonably assured. It is anticipated that the final standard would have an effective date no earlier than 2017. When and if the proposed guidance becomes effective, it may have a significant impact on our consolidated financial statements.
Our leases and charters require payments in U.S. dollars, but many of our customers operate in other currencies; if foreign currencies devalue against the U.S. dollar, our lessees or charterers may be unable to meet their payment obligations to us in a timely manner.
Our current leases and charters require that payments be made in U.S. dollars. If the currency that our lessees or charterers typically use in operating their businesses devalues against the U.S. dollar, our lessees or charterers could encounter difficulties in making payments to us in U.S. dollars. Furthermore, many foreign countries have currency and exchange laws regulating international payments that may impede or prevent payments from being paid to us in U.S. dollars. Future leases or charters may provide for payments to be made in euros or other foreign currencies. Any change in the currency exchange rate that reduces the amount of U.S. dollars obtained by us upon conversion of future lease payments denominated in euros or other foreign currencies, may, if not appropriately hedged by us, have a material adverse effect on us and increase the volatility of our earnings.
Our inability to obtain sufficient capital would constrain our ability to grow our portfolio and to increase our revenues.
Our business is capital intensive, and we have used and may continue to employ leverage to finance our operations. Accordingly, our ability to successfully execute our business strategy and maintain our operations depends on the availability and cost of debt and equity capital. Additionally, our ability to borrow against our assets is dependent, in part, on the appraised value of such assets. If the appraised value of such assets declines, we may be required to reduce the principal outstanding under our debt facilities or otherwise be unable to incur new borrowings.
We can give no assurance that the capital we need will be available to us on favorable terms, or at all. Our inability to obtain sufficient capital, or to renew or expand our credit facilities, could result in increased funding costs and would limit our ability to:
| • | meet the terms and maturities of our existing and future debt facilities; |
| • | purchase new assets or refinance existing assets; |
| • | fund our working capital needs and maintain adequate liquidity; and |
| • | finance other growth initiatives. |
In addition, we conduct our operations so that neither we nor any of our subsidiaries are required to register as an investment company under the Investment Company Act of 1940 (the “Investment Company Act”). As such, certain forms of financing such as finance leases may not be available to us. Please see “— If we are deemed an “investment company” under the Investment Company Act of 1940, it could have a material adverse effect on our business, prospects, financial condition, results of operations and cash flows.”
43
Table of Contents
The effects of various environmental regulations may negatively affect the industries in which we operate which could have a material adverse effect on our financial condition, results of operations and cash flows.
We are subject to federal, state, local and foreign laws and regulations relating to the protection of the environment, including those governing the discharge of pollutants to air and water, the management and disposal of hazardous substances and wastes, the cleanup of contaminated sites and noise and emission levels. Under some environmental laws in the United States and certain other countries, strict liability may be imposed on the owners or operators of assets, which could render us liable for environmental and natural resource damages without regard to negligence or fault on our part. We could incur substantial costs, including cleanup costs, fines and third-party claims for property or natural resource damage and personal injury, as a result of violations of or liabilities under environmental laws and regulations in connection with our or our lessee’s or charterer’s current or historical operations, any of which could have a material adverse effect on our results of operations and financial condition. While we typically maintain liability insurance coverage and typically require our lessees to provide us with indemnity against certain losses, the insurance coverage is subject to large deductibles, limits on maximum coverage and significant exclusions and may not be sufficient or available to protect against any or all liabilities and such indemnities may not cover or be sufficient to protect us against losses arising from environmental damage. In addition, changes to environmental standards or regulations in the industries in which we operate could limit the economic life of the assets we acquire or reduce their value, and also require us to make significant additional investments in order to maintain compliance, which would negatively impact our cash flows and results of operations.
If we are deemed an “investment company” under the Investment Company Act of 1940, it could have a material adverse effect on our business, prospects, financial condition, results of operations and cash flows.
We conduct our operations so that neither we nor any of our subsidiaries are required to register as an investment company under the Investment Company Act. Section 3(a)(1)(A) of the Investment Company Act defines an investment company as any issuer that is or holds itself out as being engaged primarily, or proposes to engage primarily, in the business of investing, reinvesting or trading in securities. Section 3(a)(1)(C) of the Investment Company Act defines an investment company as any issuer that is engaged or proposes to engage in the business of investing, reinvesting, owning, holding or trading in securities and owns or proposes to acquire investment securities having a value exceeding 40% of the value of the issuer’s total assets (exclusive of U.S. Government securities and cash items) on an unconsolidated basis. Excluded from the term “investment securities,” among other things, are U.S. Government securities and securities issued by majority-owned subsidiaries that are not themselves investment companies and are not relying on the exception from the definition of investment company for certain privately-offered investment vehicles set forth in Section 3(c)(1) or Section 3(c)(7) of the Investment Company Act.
We are a holding company that is not an investment company because we are engaged in the business of holding securities of our wholly-owned and majority-owned subsidiaries, which are engaged in transportation and related businesses which lease assets pursuant to operating leases and finance leases. The Investment Company Act may limit our and our subsidiaries’ ability to enter into financing leases and engage in other types of financial activity because less than 40% of the value of our and our subsidiaries’ total assets (exclusive of U.S. Government securities and cash items) on an unconsolidated basis can consist of “investment securities.”
If we or any of our subsidiaries were required to register as an investment company under the Investment Company Act, the registered entity would become subject to substantial regulation that would significantly change our operations, and we would not be able to conduct our business as described in this prospectus. We have not obtained a formal determination from the SEC as to our status under the Investment Company Act and, consequently, any violation of the Investment Company Act would subject us to material adverse consequences.
44
Table of Contents
Risks Related to Our Manager
We are dependent on our Manager and other key personnel at Fortress and may not find suitable replacements if our Manager terminates the Management Agreement or if other key personnel depart.
Our officers and other individuals who perform services for us are employees of our Manager. We are completely reliant on our Manager, which has significant discretion as to the implementation of our operating policies and strategies, to conduct our business. We are subject to the risk that our Manager will terminate the Management Agreement and that we will not be able to find a suitable replacement for our Manager in a timely manner, at a reasonable cost, or at all. Furthermore, we are dependent on the services of certain key employees of our Manager and certain key employees of Fortress whose compensation is partially or entirely dependent upon the amount of management fees earned by our Manager or the incentive allocations distributed to the General Partner and whose continued service is not guaranteed, and the loss of such personnel or services could materially adversely affect our operations. We do not have key man insurance for any of the personnel of the Manager that are key to us. An inability to find a suitable replacement for any departing employee of our Manager or Fortress on a timely basis could materially adversely affect our ability to operate and grow our business.
In addition, our Manager may assign our Management Agreement to an entity whose business and operations are managed or supervised by Mr. Wesley R. Edens, who is a principal and a Co-Chairman of the board of directors of Fortress, an affiliate of our Manager, and a member of the management committee of Fortress since co-founding Fortress in May 1998. In the event of any such assignment to a non-affiliate of Fortress, the functions currently performed by our Manager’s current personnel may be performed by others. We can give you no assurance that such personnel would manage our operations in the same manner as our Manager currently does, and the failure by the personnel of any such entity to acquire assets generating attractive risk-adjusted returns could have a material adverse effect on our business, financial condition, results of operations and cash flows.
There are conflicts of interest in our relationship with our Manager.
Our Management Agreement, the Partnership Agreement and our operating agreement were not negotiated at arm’s-length, and their terms, including fees payable, may not be as favorable to us as if they had been negotiated with an unaffiliated third-party.
There are conflicts of interest inherent in our relationship with our Manager insofar as our Manager and its affiliates—including investment funds, private investment funds, or businesses managed by our Manager, including Seacastle Ships Holdings Inc., Trac Intermodal and Florida East Coast Railway, L.L.C.—invest in transportation and transportation-related infrastructure assets and whose investment objectives overlap with our asset acquisition objectives. Certain opportunities appropriate for us may also be appropriate for one or more of these other investment vehicles. Certain members of our board of directors and employees of our Manager who are our officers also serve as officers and/or directors of these other entities. For example, we have some of the same directors and officers as Seacastle Ships Holdings Inc., Trac Intermodal and Florida East Coast Railway, L.L.C. Although we have the same Manager, we may compete with entities affiliated with our Manager or Fortress, including Seacastle Ships Holdings Inc., Trac Intermodal and Florida East Coast Railway, L.L.C., for certain target assets. From time to time, affiliates of Fortress focus on investments in assets with a similar profile as our target assets that we may seek to acquire. These affiliates may have meaningful purchasing capacity, which may change over time depending upon a variety of factors, including, but not limited to, available equity capital and debt financing, market conditions and cash on hand. Fortress has multiple existing and planned funds focused on investing in one or more of our target sectors, each with significant current or expected capital commitments. We may co-invest with these funds in transportation and transportation-related infrastructure assets. Fortress funds generally have a fee structure similar to ours, but the fees actually paid will vary depending on the size, terms and performance of each fund. Fortress had approximately $67.5 billion of assets under management as of December 31, 2014.
45
Table of Contents
Our Management Agreement generally does not limit or restrict our Manager or its affiliates from engaging in any business or managing other pooled investment vehicles that invest in assets that meet our asset acquisition objectives. Our Manager intends to engage in additional transportation and infrastructure related management and transportation, infrastructure and other investment opportunities in the future, which may compete with us for investments or result in a change in our current investment strategy. In addition, our operating agreement provides that if Fortress or an affiliate or any of their officers, directors or employees acquire knowledge of a potential transaction that could be a corporate opportunity, they have no duty, to the fullest extent permitted by law, to offer such corporate opportunity to us, our shareholders or our affiliates. In the event that any of our directors and officers who is also a director, officer or employee of Fortress or its affiliates acquires knowledge of a corporate opportunity or is offered a corporate opportunity, provided that this knowledge was not acquired solely in such person’s capacity as a director or officer of FTAI and such person acts in good faith, then to the fullest extent permitted by law such person is deemed to have fully satisfied such person’s fiduciary duties owed to us and is not liable to us if Fortress or its affiliates pursues or acquires the corporate opportunity or if such person did not present the corporate opportunity to us.
The ability of our Manager and its officers and employees to engage in other business activities, subject to the terms of our Management Agreement, may reduce the amount of time our Manager, its officers or other employees spend managing us. In addition, we may engage (subject to our strategy) in material transactions with our Manager or another entity managed by our Manager or one of its affiliates, including Seacastle Ships Holdings Inc., Trac Intermodal and Florida East Coast Railway, L.L.C., which may include, but are not limited to, certain financing arrangements, purchases of debt, co-investments, consumer loans, servicing advances and other assets that present an actual, potential or perceived conflict of interest. As described in more detail under “Certain Relationships and Related Party Transactions,” in connection with this offering our board of directors will adopt a policy regarding the approval of any “related person transactions” pursuant to which, certain of the material transactions described above may require disclosure to, and approval by, the independent members of our board of directors. It is possible that actual, potential or perceived conflicts could give rise to investor dissatisfaction, litigation or regulatory enforcement actions. Appropriately dealing with conflicts of interest is complex and difficult, and our reputation could be damaged if we fail, or appear to fail, to deal appropriately with one or more potential, actual or perceived conflicts of interest. Regulatory scrutiny of, or litigation in connection with, conflicts of interest could have a material adverse effect on our reputation, which could materially adversely affect our business in a number of ways, including causing an inability to raise additional funds, a reluctance of counterparties to do business with us, a decrease in the prices of our equity securities and a resulting increased risk of litigation and regulatory enforcement actions.
The structure of our Manager’s and the General Partner’s compensation arrangements may have unintended consequences for us. We have agreed to pay our Manager a management fee and the General Partner is entitled to receive incentive allocations from Holdco that are each based on different measures of performance. Consequently, there may be conflicts in the incentives of our Manager to generate attractive risk-adjusted returns for us. In addition, because the General Partner and our Manager are both affiliates of Fortress, the Income Incentive Allocation paid to the General Partner may cause our Manager to place undue emphasis on the maximization of earnings, including through the use of leverage, at the expense of other objectives, such as preservation of capital, to achieve higher incentive allocations. Investments with higher yield potential are generally riskier or more speculative than investments with lower yield potential. This could result in increased risk to the value of our portfolio of assets and our common shares.
Our directors have approved a broad asset acquisition strategy for our Manager and do not approve each acquisition made by our Manager. In addition, we may change our strategy without a shareholder vote, which may result in our acquiring assets that are different, riskier or less profitable than our current assets.
Our Manager is authorized to follow a broad asset acquisition strategy. We may pursue other types of acquisitions as market conditions evolve. Our Manager makes decisions about our investments in accordance with broad investment guidelines adopted by our board of directors. Accordingly, we may, without a shareholder vote, change our target sectors and acquire a variety of assets that differ from, and are possibly riskier than, our current asset portfolio. Consequently, our Manager has great latitude in determining the types and categories of assets it may decide are proper investments for us, including the latitude to invest in types and categories of
46
Table of Contents
assets that may differ from those in our existing portfolio. Our directors will periodically review our strategy and our portfolio of assets. However, our board does not review or pre-approve each proposed acquisition or our related financing arrangements. In addition, in conducting periodic reviews, the directors rely primarily on information provided to them by our Manager. Furthermore, transactions entered into by our Manager may be difficult or impossible to reverse by the time they are reviewed by the directors even if the transactions contravene the terms of the Management Agreement. In addition, we may change our asset acquisition strategy, including our target asset classes, without a shareholder vote.
Our asset acquisition strategy may evolve in light of existing market conditions and investment opportunities, and this evolution may involve additional risks depending upon the nature of the assets we target and our ability to finance such assets on a short or long-term basis. Opportunities that present unattractive risk-return profiles relative to other available opportunities under particular market conditions may become relatively attractive under changed market conditions and changes in market conditions may therefore result in changes in the assets we target. Decisions to make acquisitions in new asset categories present risks that may be difficult for us to adequately assess and could therefore reduce or eliminate our ability to pay dividends on our common shares or have adverse effects on our liquidity or financial condition. A change in our asset acquisition strategy may also increase our exposure to interest rate, foreign currency or credit market fluctuations. In addition, a change in our asset acquisition strategy may increase our use of non-match-funded financing, increase the guarantee obligations we agree to incur or increase the number of transactions we enter into with affiliates. Our failure to accurately assess the risks inherent in new asset categories or the financing risks associated with such assets could adversely affect our results of operations and our financial condition. For more information about our strategy, see “Business—Asset Acquisition Process.”
Our Manager will not be liable to us for any acts or omissions performed in accordance with the Management Agreement, including with respect to the performance of our assets.
Pursuant to our Management Agreement, our Manager will not assume any responsibility other than to render the services called for thereunder in good faith and will not be responsible for any action of our board of directors in following or declining to follow its advice or recommendations. Our Manager, its members, managers, officers and employees will not be liable to us or any of our subsidiaries, to our board of directors, or our or any subsidiary’s shareholders or partners for any acts or omissions by our Manager, its members, managers, officers or employees, except liability to the Company, our shareholders, directors, officers and employees and persons controlling us, by reason of acts constituting bad faith, willful misconduct, gross negligence or reckless disregard of our Manager’s duties under our Management Agreement. We will, to the full extent lawful, reimburse, indemnify and hold our Manager, its members, managers, officers and employees, sub-advisers and each other person, if any, controlling our Manager harmless of and from any and all expenses, losses, damages, liabilities, demands, charges and claims of any nature whatsoever (including attorneys’ fees) in respect of or arising from any acts or omissions of an indemnified party made in good faith in the performance of our Manager’s duties under our Management Agreement and not constituting such indemnified party’s bad faith, willful misconduct, gross negligence or reckless disregard of our Manager’s duties under our Management Agreement.
Our Manager’s due diligence of potential asset acquisitions or other transactions may not identify all pertinent risks, which could materially affect our business, financial condition, liquidity and results of operations.
Our Manager intends to conduct due diligence with respect to each asset acquisition opportunity or other transaction it pursues. It is possible, however, that our Manager’s due diligence processes will not uncover all relevant facts, particularly with respect to any assets we acquire from third parties. In these cases, our Manager may be given limited access to information about the asset and will rely on information provided by the seller of the asset. In addition, if asset acquisition opportunities are scarce, the process for selecting bidders is competitive, or the timeframe in which we are required to complete diligence is short, our ability to conduct a due diligence investigation may be limited, and we would be required to make decisions based upon a less thorough diligence process than would otherwise be the case. Accordingly, transactions that initially appear to be viable may prove not to be over time, due to the limitations of the due diligence process or other factors.
47
Table of Contents
Risks Related to Taxation
In addition to the following risk factors, please see “United States Federal Income Tax Considerations” for a more complete discussion of certain expected U.S. federal income tax considerations applicable to the purchase, ownership and disposition of common shares.
Shareholders may be subject to U.S. federal income tax on their share of our taxable income, regardless of whether they receive any cash dividends from us.
So long as we would not be required to register as an investment company under the Investment Company Act of 1940 if we were a U.S. Corporation and 90% of our gross income for each taxable year constitutes “qualifying income” within the meaning of the Internal Revenue Code of 1986, as amended (the “Code”), on a continuing basis, FTAI will be treated, for U.S. federal income tax purposes, as a partnership and not as an association or publicly traded partnership taxable as a corporation. Shareholders may be subject to U.S. federal, state, local and possibly, in some cases, non-U.S. income taxation on their allocable share of our items of income, gain, loss, deduction and credit (including our allocable share of those items of Holdco or any other entity in which we invest that is treated as a partnership or is otherwise subject to tax on a flow through basis) for each of our taxable years ending with or within their taxable year, regardless of whether they receive cash dividends from us. Shareholders may not receive cash dividends equal to their allocable share of our net taxable income or even the tax liability that results from that income.
In addition, certain of our holdings, including holdings, if any, in a Controlled Foreign Corporation (“CFC”) or a Passive Foreign Investment Company (“PFIC”), may produce taxable income prior to our receipt of cash relating to such income, and shareholders subject to U.S. federal income tax will be required to take such income into account in determining their taxable income.
Under our operating agreement, in the event of an inadvertent partnership termination in which the Internal Revenue Service (“IRS”) has granted us limited relief, each shareholder also is obligated to make such adjustments as are required by the IRS to maintain our status as a partnership. Such adjustments may require shareholders to recognize additional amounts in income during the years in which they have held common shares. We may also be required to make payments to the IRS. See “United States Federal Income Tax Considerations—Taxation of FTAI.”
Tax gain or loss on a sale or other disposition of our common shares could be more or less than expected.
If a sale of our common shares by a shareholder is taxable in the United States, the shareholder will recognize gain or loss equal to the difference between the amount realized by such shareholder on such sale and such shareholder’s adjusted tax basis in those shares. Prior distributions to such shareholder in excess of the total net taxable income allocated to such shareholder, which will have decreased such shareholder’s adjusted tax basis in its shares, will effectively increase any gain recognized by such shareholder if the shares are sold at a price greater than such shareholder’s adjusted tax basis in those shares, even if the price is less than their original cost to such shareholder. A portion of the amount realized, whether or not representing gain, may be treated as ordinary income to such shareholder. See “United States Federal Income Tax Considerations—Consequences to U.S. Holders—Disposition of Common Shares.”
Our ability to make distributions depends on our receiving sufficient cash distributions from our subsidiaries, and we cannot assure our shareholders that we will be able to make cash distributions to them in amounts that are sufficient to fund their tax liabilities.
Our subsidiaries may be subject to local taxes in each of the relevant territories and jurisdictions in which they operate, including taxes on income, profits or gains and withholding taxes. As a result, our funds available for distribution is indirectly reduced by such taxes, and the post-tax return to our shareholders is similarly reduced by such taxes.
48
Table of Contents
In general, a shareholder that is subject to U.S. federal income tax must include in income its allocable share of FTAI’s items of income, gain, loss, deduction, and credit (including, so long as FTAI is treated as a partnership for tax purposes, FTAI’s allocable share of those items of Holdco and any pass-through subsidiaries of Holdco) for each of our taxable years ending with or within such shareholder’s taxable year. However, the cash distributed to a shareholder may not be sufficient to pay the full amount of such shareholder’s tax liability in respect of its investment in us, because each shareholder’s tax liability depends on such shareholder’s particular tax situation and the tax treatment of our underlying activities or assets.
If we are treated as a corporation for U.S. federal income tax purposes, the value of the shares could be adversely affected.
We have not requested, and do not plan to request, a ruling from the IRS on our treatment as a partnership for U.S. federal income tax purposes, or on any other matter affecting us. As of the date of the consummation of our initial public offering, under then current law and assuming full compliance with the terms of our operating agreement (and other relevant documents) and based upon factual statements and representations made by us, our outside counsel will opine that we will be treated as a partnership, and not as an association or a publicly traded partnership taxable as a corporation for U.S. federal income tax purposes. However, opinions of counsel are not binding upon the IRS or any court, and the IRS may challenge this conclusion and a court may sustain such a challenge. The factual representations made by us upon which our outside counsel will rely relate to our organization, operation, assets, activities, income, and present and future conduct of our operations. In general, if an entity that would otherwise be classified as a partnership for U.S. federal income tax purposes is a “publicly traded partnership” (as defined in the Code) it will be nonetheless treated as a corporation for U.S. federal income tax purposes, unless the exception described below, and upon which we intend to rely, applies. A publicly traded partnership will, however, be treated as a partnership, and not as a corporation for U.S. federal income tax purposes, so long as 90% or more of its gross income for each taxable year constitutes “qualifying income” within the meaning of the Code and it is not required to register as an investment company under the Investment Company Act of 1940. We refer to this exception as the “Qualifying Income Exception.”
Qualifying income generally includes dividends, interest, capital gains from the sale or other disposition of stocks and securities and certain other forms of investment income. We currently expect that a substantial portion of our income will constitute either “Subpart F” income (defined below) derived from CFCs or QEF Inclusions (as defined below). While we believe that such income constitutes qualifying income, no assurance can be given that the IRS will agree with such position. We also believe that our return from investments will include interest, dividends, capital gains and other types of qualifying income, but no assurance can be given as to the types of income that will be earned in any given year.
If we fail to satisfy the Qualifying Income Exception, we would be required to pay U.S. federal income tax at regular corporate rates on our worldwide income. In addition, we would likely be liable for state and local income and/or franchise taxes on such income. Dividends to shareholders would constitute ordinary dividend income taxable to such shareholders to the extent of our earnings and profits, and the payment of these dividends would not be deductible by us. Taxation of us as a publicly traded partnership taxable as a corporation could result in a material adverse effect on our cash flow and the after-tax returns for shareholders and thus could result in a substantial reduction in the value of our common shares.
Non-U.S. Holders (defined below) should anticipate being required to file U.S. tax returns and may be required to pay U.S. tax solely on account of owning and disposing of our common shares.
In light of our intended investment activities, we may be, or may become, engaged in a U.S. trade or business for U.S. federal income tax purposes, in which case some portion of our income would be treated as effectively connected income with respect to Non-U.S. Holders. Moreover, we anticipate that, in the future, we will sell interests in U.S. real holding property corporations (each a “USRPHC,” as defined in ‘‘United States Federal Income Tax Considerations—Consequences to Non-U.S. Holders”) and therefore be deemed to be engaged in a
49
Table of Contents
U.S. trade or business for that reason at such time. If we were to realize gain from the sale or other disposition of a U.S. real property interest (including a USRPHC) or were otherwise engaged in a U.S. trade or business, Non-U.S. Holders generally would be required to file U.S. federal income tax returns and would be subject to U.S. federal withholding tax on their allocable share of the effectively connected income on gain at the highest marginal U.S. federal income tax rates applicable to ordinary income. Non-U.S. holders that are corporations may also be subject to a branch profits tax on their allocable share of such income. See “United States Federal Income Tax Considerations—Consequences to Non-U.S. Holders”. In addition, if we were treated as being engaged in a U.S. trade or business, a portion of any gain recognized by a Non-U.S. Holder on the sale or exchange of its common shares could be treated for U.S. federal income tax purposes as effectively connected income, and hence such Non-U.S. Holder could be subject to U.S. federal income tax on the sale or exchange. Accordingly, Non-U.S. Holders should anticipate being required to file U.S. tax returns and may be required to pay U.S. tax solely on account of owning our common shares.
Non-U.S. Holders that hold (or are deemed to hold) more than 5% of our common shares (or held, or were deemed to hold, more than 5% of our common shares) may be subject to U.S. federal income tax upon the disposition of some or all their common shares.
If a Non-U.S. Holder held more than 5% of our common shares at any time during the 5 year period preceding such Non-U.S. Holder’s disposition of our common shares, and we were considered a USRPHC (determined as if we were a U.S. corporation) at any time during such 5 year period because of our current or previous ownership of U.S. real property interests above a certain threshold, such Non-U.S. Holder may be subject to U.S. tax on such disposition of our common shares (and may have a U.S. tax return filing obligation). See “United States Federal Income Tax Considerations—Consequences to Non-U.S. Holders.”
Tax-exempt shareholders may face certain adverse U.S. tax consequences from owning our common shares.
We are not required to manage our operations in a manner that would minimize the likelihood of generating income that would constitute “unrelated business taxable income” (“UBTI”) to the extent allocated to a tax-exempt shareholder. Although we expect to invest through subsidiaries that are treated as corporations for U.S. federal income tax purposes and such corporate investments would generally not result in an allocation of UBTI to a shareholder on account of the activities of those subsidiaries, we may not invest through corporate subsidiaries in all cases. Moreover, UBTI includes income attributable to debt-financed property and we are not prohibited from debt financing our investments, including investments in subsidiaries. Furthermore, we are not prohibited from being (or causing a subsidiary to be) a guarantor of loans made to a subsidiary. If we (or certain of our subsidiaries) were treated as the borrower for U.S. tax purposes on account of those guarantees, some or all of our investments could be considered debt-financed property. The potential for income to be characterized as UBTI could make our common shares an unsuitable investment for a tax-exempt entity. Tax-exempt shareholders are urged to consult their tax advisors regarding the tax consequences of an investment in common shares. See “United States Federal Income Tax Considerations—Consequences to U.S. Holders—Tax-Exempt Shareholders.”
We may hold or acquire certain investments through an entity classified as a PFIC or CFC for U.S. federal income tax purposes.
Certain of our investments may be in non-U.S. corporations or may be acquired through a non-U.S. subsidiary that would be classified as a corporation for U.S. federal income tax purposes. Such an entity may be a PFIC or a CFC for U.S. federal income tax purposes. U.S. Holders indirectly owning an interest in a PFIC or a CFC may experience adverse U.S. tax consequences. See “United States Federal Income Tax Considerations—Consequences to U.S. Holders—Controlled Foreign Corporations and—Passive Foreign Investment Companies.”
50
Table of Contents
If substantially all of the U.S. source rental income derived from aircraft or ships used to transport passengers or cargo in international traffic (“U.S. source international transport rental income”) of any of our non-U.S. corporate subsidiaries is attributable to activities of personnel based in the United States, such subsidiary could be subject to U.S. federal income tax on a net income basis at regular tax rates, rather than at a rate of 4% on gross income, which would adversely affect our business and result in decreased funds available for distribution to our shareholders.
We expect that the U.S. source international transport rental income of our non-U.S. subsidiaries generally will be subject to U.S. federal income tax, on a gross income basis, at a rate of not in excess of 4% as provided in Section 887 of the Code. If, contrary to expectations, any of our non-U.S. subsidiaries that is treated as a corporation for U.S. federal income tax purposes did not comply with certain administrative guidelines of the IRS, such that 90% or more of such subsidiary’s U.S. source international transport rental income were attributable to the activities of personnel based in the United States (in the case of bareboat leases) or from “regularly scheduled transportation” as defined is such administrative guidelines (in the case of time-charter leases), such subsidiary’s U.S. source rental income would be treated as income effectively connected with a trade or business in the United States. In such case, such subsidiary’s U.S. source international transport rental income would be subject to U.S. federal income tax at a maximum rate of 35%. In addition, such subsidiary would be subject to the U.S. federal branch profits tax on its effectively connected earnings and profits at a rate of 30%. The imposition of such taxes would adversely affect our business and would result in decreased funds available for distribution to our shareholders.
Our subsidiaries may become subject to unanticipated tax liabilities that may have a material adverse effect on our results of operations.
Our subsidiaries may be subject to income, withholding or other taxes in certain non-U.S. jurisdictions by reason of their activities and operations, where their assets are used, or where the lessees of their assets (or others in possession of their assets) are located, and it is also possible that taxing authorities in any such jurisdictions could assert that our subsidiaries are subject to greater taxation than we currently anticipate. For example, a portion of certain of our non-U.S. corporate subsidiaries’ income is treated as effectively connected with a U.S. trade or business, and is accordingly subject to U.S. federal income tax. It is possible that the IRS could assert that a greater portion of any such non-U.S. subsidiaries’ income is effectively connected income that should be subject to U.S. federal income tax.
Our structure involves complex provisions of U.S. federal income tax law for which no clear precedent or authority may be available. Our structure also is subject to potential legislative, judicial or administrative change and differing interpretations, possibly on a retroactive basis.
The U.S. federal income tax treatment of our shareholders depends in some instances on determinations of fact and interpretations of complex provisions of U.S. federal income tax law for which no clear precedent or authority may be available. Prospective investors should be aware that the U.S. federal income tax rules are constantly under review by persons involved in the legislative process, the IRS, and the U.S. Treasury Department, frequently resulting in revised interpretations of established concepts, statutory changes, revisions to regulations and other modifications and interpretations. The IRS pays close attention to the proper application of tax laws to partnerships. The present U.S. federal income tax treatment of an investment in our common shares may be modified by administrative, legislative or judicial interpretation at any time, possibly on a retroactive basis, and any such action may affect our investments and commitments that were previously made, and could adversely affect the value of our shares or cause us to change the way we conduct our business.
Our organizational documents and agreements permit the board of directors to modify our operating agreement from time to time, without the consent of shareholders, in order to address certain changes in Treasury regulations, legislation or interpretation. In some circumstances, such revisions could have a material adverse impact on some or all shareholders. Moreover, we will apply certain assumptions and conventions in an attempt to comply with applicable rules and to report income, gain, deduction, loss and credit to shareholders in a manner that reflects such
51
Table of Contents
shareholders’ beneficial ownership of partnership items, taking into account variation in ownership interests during each taxable year because of trading activity. However, these assumptions and conventions may not be in compliance with all aspects of applicable tax requirements. It is possible that the IRS will assert successfully that the conventions and assumptions used by us do not satisfy the technical requirements of the Code and/or Treasury regulations and could require that items of income, gain, deduction, loss or credit, including interest deductions, be adjusted, reallocated, or disallowed, in a manner that adversely affects shareholders.
We could incur a significant tax liability if the IRS successfully asserts that the “anti-stapling” rules apply to our investments in our non-U.S. and U.S. subsidiaries, which would adversely affect our business and result in decreased funds available for distribution to our shareholders.
If we were subject to the “anti-stapling” rules of Section 269B of the Code, we would incur a significant tax liability as a result of owning more than 50% of the value of both U.S. and non-U.S. corporate subsidiaries, whose equity interests constitute “stapled interests” that may only be transferred together. If the “anti-stapling” rules applied, our non-U.S. corporate subsidiaries that are treated as corporations for U.S. federal income tax purposes would be treated as U.S. corporations, which would cause those entities to be subject to U.S. federal corporate income tax on their worldwide income. Because we intend to separately manage and operate our non-U.S. and U.S. corporate subsidiaries and structure their business activities in a manner that would allow us to dispose of such subsidiaries separately, we do not expect that the “anti-stapling” rules will apply. However, there can be no assurance that the IRS would not successfully assert a contrary position, which would adversely affect our business and result in decreased funds available for distribution to our shareholders.
We cannot match transferors and transferees of our shares, and we have therefore adopted certain income tax accounting positions that may not conform with all aspects of applicable tax requirements. The IRS may challenge this treatment, which could adversely affect the value of our shares.
Because we cannot match transferors and transferees of our shares, we have adopted depreciation, amortization and other tax accounting positions that may not conform with all aspects of existing Treasury regulations. A successful IRS challenge to those positions could adversely affect the amount of tax benefits available to our shareholders. It also could affect the timing of these tax benefits or the amount of gain on the sale of our common shares and could have a negative impact on the value of our common shares or result in audits of and adjustments to our shareholders’ tax returns. See “United States Federal Income Tax Considerations—Consequences to U.S. Holders—Allocation of Profits and Losses.”
We may allocate items of income, gain, loss, and deduction using a monthly or other convention, whereby any such items we recognize in a given month are allocated to our shareholders as of a specified date of such month. As a result, if a shareholder transfers its common shares, it might be allocated income, gain, loss, and deduction realized by us after the date of the transfer. Similarly, if a shareholder acquires additional common shares, it might be allocated income, gain, loss, and deduction realized by us prior to its ownership of such common shares. Consequently, our shareholders may recognize income in excess of cash distributions received from us, and any income so included by a shareholder would increase the basis such shareholder has in it common shares and would offset any gain (or increase the amount of loss) realized by such shareholder on a subsequent disposition of its common shares.
The sale or exchange of 50% or more of our common shares within a 12-month period will result in our termination for U.S. federal income tax purposes.
We will be considered to have terminated as a partnership for U.S. federal income tax purposes if there is a sale or exchange of 50% or more of our common shares within a 12-month period. Our termination would, among other things, result in the closing of our taxable year for all shareholders and could result in a deferral of depreciation and amortization deductions allowable in computing our taxable income.
52
Table of Contents
Risks Related to Our Common Shares
There can be no assurance that the market for our shares will provide you with adequate liquidity.
There can be no assurance that an active trading market for our common shares will develop or be sustained in the future. Accordingly, if an active trading market for our common shares does not develop or is not maintained, the liquidity of our common shares, your ability to sell your common shares when desired and the prices that you may obtain for your common shares will be adversely affected.
The market price and trading volume of our common shares may be volatile, which could result in rapid and substantial losses for our shareholders.
Even if an active trading market develops, the market price of our common shares may be highly volatile and could be subject to wide fluctuations. In addition, the trading volume in our common shares may fluctuate and cause significant price variations to occur. The initial public offering price of our common shares will be determined by negotiation among us, our Manager and its affiliates and the representatives of the underwriters based on a number of factors and may not be indicative of prices that will prevail in the open market following completion of this offering. If the market price of our common shares declines significantly, you may be unable to resell your shares at or above your purchase price, if at all. The market price of our common shares may fluctuate or decline significantly in the future. Some of the factors that could negatively affect our share price or result in fluctuations in the price or trading volume of our common shares include:
| • | a shift in our investor base; |
| • | our quarterly or annual earnings, or those of other comparable companies; |
| • | actual or anticipated fluctuations in our operating results; |
| • | changes in accounting standards, policies, guidance, interpretations or principles; |
| • | announcements by us or our competitors of significant investments, acquisitions or dispositions; |
| • | the failure of securities analysts to cover our common shares; |
| • | changes in earnings estimates by securities analysts or our ability to meet those estimates; |
| • | the operating and share price performance of other comparable companies; |
| • | overall market fluctuations; |
| • | general economic conditions; and |
| • | developments in the markets and market sectors in which we participate. |
Stock markets in the United States have experienced extreme price and volume fluctuations. Market fluctuations, as well as general political and economic conditions such as acts of terrorism, prolonged economic uncertainty, a recession or interest rate or currency rate fluctuations, could adversely affect the market price of our common shares.
We are an emerging growth company within the meaning of the Securities Act, and due to our taking advantage of certain exemptions from various reporting requirements applicable to emerging growth companies, our common shares could be less attractive to investors.
We are an “emerging growth company” as defined in the JOBS Act. As such, we have taken advantage of certain exemptions from various reporting requirements that are applicable to other public companies that are not “emerging growth companies” including, but not limited to, not being required to comply with the auditor attestation requirements of Section 404 of the Sarbanes-Oxley Act and exemptions from the requirements of holding a non-binding advisory vote on executive compensation and shareholder approval of any golden parachute payments not previously approved. As a result, our shareholders may not have access to certain
53
Table of Contents
information they may deem important. We will remain an emerging growth company until the earliest of (a) the last day of the first fiscal year in which our annual gross revenues exceed $1 billion, (b) the last day of the fiscal year following the fifth anniversary of this offering, (c) the date that we become a “large accelerated filer” as defined in Rule 12b-2 under the Exchange Act, which would occur if the market value of our common shares that are held by non-affiliates exceeds $700 million as of the last business day of our most recently completed second fiscal quarter or (d) the date on which we have issued more than $1 billion in non-convertible debt during the preceding three-year period. Because we will take advantage of each of these exemptions, we do not know if some investors will find our common shares less attractive as a result. The result may be a less active trading market for our common shares and our share price may be more volatile.
We will be required by Section 404 of the Sarbanes-Oxley Act to evaluate the effectiveness of our internal controls, and the outcome of that effort may adversely affect our results of operations, financial condition and liquidity.
As a public company, we will be required to comply with Section 404 of the Sarbanes-Oxley Act (the timing of when to comply with the auditor attestation requirements will be determined based on whether we take advantage of certain JOBS Act provisions applicable to emerging growth companies). Section 404 will require that we evaluate our internal control over financial reporting to enable management to report on the effectiveness of those controls. We must undertake a review of our internal controls and procedures. While we have begun the process of evaluating our internal controls, we are in the early phases of our review and will not complete our review until after this offering is completed. The outcome of our review may adversely affect our results of operations, financial condition and liquidity. During the course of our review, we may identify control deficiencies of varying degrees of severity, and we may incur significant costs to remediate those deficiencies or otherwise improve our internal controls. As a public company, we will be required to report control deficiencies that constitute a “material weakness” in our internal control over financial reporting. If we fail to implement the requirements of Section 404 in a timely manner, we may be subject to sanctions or investigation by regulatory authorities, including the SEC or the NYSE. Furthermore, if we discover a material weakness, our share price could decline and our ability to raise capital could be impaired.
Your percentage ownership in us may be diluted in the future.
The initial public offering price of our common shares will be substantially higher than the pro forma as adjusted net tangible book value per share issued and outstanding immediately after this offering. Investors who purchase common shares in this offering will pay a price per share that substantially exceeds the net tangible book value per share of our common shares. If you purchase common shares in this offering, you will experience immediate and substantial dilution of $4.10 in the pro forma as adjusted net tangible book value per share, based upon the initial public offering price of $20.00 per share (the midpoint of the estimated initial public offering price range set forth on the cover page of this prospectus). See “Dilution.”
Furthermore, your percentage ownership in FTAI may be diluted in the future because of equity awards that may be granted to our Manager pursuant to our Management Agreement. After this offering, upon the successful completion of an offering of our common shares or other equity securities (including securities issued as consideration in an acquisition), we will grant our Manager options to purchase common shares in an amount equal to 10% of the number of common shares being sold in the offering (or if the issuance relates to equity securities other than our common shares, options to purchase a number of common shares equal to 10% of the gross capital raised in the equity issuance divided by the fair market value of a common share as of the date of the issuance), with an exercise price equal to the offering price per share paid by the public or other ultimate purchaser or attributed to such securities in connection with an acquisition (or the fair market value of a common share as of the date of the equity issuance if it relates to equity securities other than our common shares), and any such offering or the exercise of the option in connection with such offering would cause dilution. For the avoidance of doubt, this initial public offering of our common shares will not constitute an offering for purposes of this provision.
54
Table of Contents
If our board of directors adopts an equity compensation plan and makes grants of equity awards pursuant to any such plan, those grants would cause further dilution. We anticipate that we will adopt the Fortress Transportation and Infrastructure Investors Nonqualified Stock Option and Incentive Award Plan (the “Incentive Plan”) which will provide for the grant of equity-based awards, including restricted stock, stock options, stock appreciation rights, performance awards, restricted stock units, tandem awards and other equity-based and non-equity based awards, in each case to our Manager, to the directors, officers, employees, service providers, consultants and advisors of our Manager who perform services for us, and to our directors, officers, employees, service providers, consultants and advisors. We have initially reserved 30,000,000 common shares for issuance under the Incentive Plan; on the date of any equity issuance by the Company during the ten-year term of the Incentive Plan (including in respect of securities issued as consideration in an acquisition), the maximum number of shares available for issuance under the Plan will be increased to include an additional number of common shares equal to ten percent (10%) of either (i) the total number of common shares newly issued by the Company in such equity issuance or (ii) if such equity issuance relates to equity securities other than our common shares, a number of our common shares equal to 10% of (i) the gross capital raised in an equity issuance of equity securities other than common shares during the ten-year term of the Incentive Plan, divided by (ii) the fair market value of a common share as of the date of such equity issuance. For a more detailed description of the Incentive Plan, see “Management—Nonqualified Stock Option and Incentive Award Plan.”
Sales or issuances of shares of our common shares could adversely affect the market price of our common shares.
Sales of substantial amounts of shares of our common shares in the public market, or the perception that such sales might occur, could adversely affect the market price of our common shares. The issuance of our common shares in connection with property, portfolio or business acquisitions or the exercise of outstanding options or otherwise could also have an adverse effect on the market price of our common shares. See “Shares Eligible for Future Sale.”
We and our executive officers, directors, Initial Shareholders and the General Partner have agreed that, for a period of 180 days from the date of this prospectus, we and they will not, without the prior written consent of the representatives of the underwriters, dispose of or hedge any shares or any securities convertible into or exchangeable for our common shares. The underwriters, in their sole discretion, may release any of the securities subject to these lock-up agreements at any time, which, in the case of officers and directors, shall be with notice. If the restrictions under the lock-up agreements are waived or upon the expiration of the lock-up agreements, a substantial amount of our common shares may become available for sale into the market, subject to applicable law, which could reduce the market price for our common shares.
The incurrence or issuance of debt, which ranks senior to our common shares upon our liquidation, and future issuances of equity or equity-related securities, which would dilute the holdings of our existing common shareholders and may be senior to our common shares for the purposes of making distributions, periodically or upon liquidation, may negatively affect the market price of our common shares.
We have incurred and may in the future incur or issue debt or issue equity or equity-related securities to finance our operations. Upon our liquidation, lenders and holders of our debt and holders of our preferred shares (if any) would receive a distribution of our available assets before common shareholders. Any future incurrence or issuance of debt would increase our interest cost and could adversely affect our results of operations and cash flows. We are not required to offer any additional equity securities to existing common shareholders on a preemptive basis. Therefore, additional issuances of common shares, directly or through convertible or exchangeable securities (including limited partnership interests in our operating partnership), warrants or options, will dilute the holdings of our existing common shareholders and such issuances, or the perception of such issuances, may reduce the market price of our common shares. Any preferred shares issued by us would likely have a preference on distribution payments, periodically or upon liquidation, which could eliminate or otherwise limit our ability to make distributions to common shareholders. Because our decision to incur or issue debt or issue equity or equity-related securities in the future will depend on market conditions and other factors beyond our control, we cannot predict or
55
Table of Contents
estimate the amount, timing, nature or success of our future capital raising efforts. Thus, common shareholders bear the risk that our future incurrence or issuance of debt or issuance of equity or equity-related securities will adversely affect the market price of our common shares.
Our determination of how much leverage to use to finance our acquisitions may adversely affect our return on our assets and may reduce funds available for distribution.
We utilize leverage to finance many of our asset acquisitions, which entitles certain lenders to cash flows prior to retaining a return on our assets. While our Manager targets using only what we believe to be reasonable leverage, our strategy does not limit the amount of leverage we may incur with respect to any specific asset. The return we are able to earn on our assets and funds available for distribution to our shareholders may be significantly reduced due to changes in market conditions, which may cause the cost of our financing to increase relative to the income that can be derived from our assets.
While we currently intend to pay regular quarterly dividends to our shareholders, we may change our dividend policy at any time.
Although we currently intend to pay regular quarterly dividends to holders of our common shares, we may change our dividend policy at any time. The declaration and payment of dividends to holders of our common shares will be at the discretion of our board of directors in accordance with applicable law after taking into account various factors, including actual results of operations, liquidity and financial condition, restrictions imposed by applicable law, our taxable income, our operating expenses and other factors our board of directors deem relevant. Our long term goal is to maintain a payout ratio of between 50-60% of funds available for distribution, with remaining amounts used primarily to fund our future acquisitions and opportunities. As a public company, there can be no assurance that we will pay dividends in amounts or on a basis consistent with prior distributions to our investors, if at all. See “Dividend Policy.” Because we are a holding company and have no direct operations, we will only be able to pay dividends from our available cash on hand and any funds we receive from our subsidiaries and our ability to receive distributions from our subsidiaries may be limited by the financing agreements (including the Morgan Stanley Credit Agreement which contains a covenant restricting the payment of dividends to us) to which they are subject. For example, the Jefferson Terminal Credit Agreement (as herein defined) contains a covenant that limits its ability to pay dividends to us. See “Management’s Discussion and Analysis of Financial Condition and Results of Operations—Debt Obligations” for a discussion of the restrictions on distributions contained in the Jefferson Terminal Credit Agreement. In addition, pursuant to the Partnership Agreement, the General Partner will be entitled to receive incentive allocations before any amounts are distributed by the Company based both on our consolidated net income and capital gains income in each fiscal quarter and for each fiscal year, respectively. See “Our Manager and Management Agreement and Other Compensation Arrangements—Other Incentive Allocations.”
Anti-takeover provisions in our operating agreement and Delaware law could delay or prevent a change in control.
Provisions in our operating agreement may make it more difficult and expensive for a third party to acquire control of us even if a change of control would be beneficial to the interests of our shareholders. For example, our operating agreement will provide for a staggered board, will require advance notice for proposals by shareholders and nominations, will place limitations on convening shareholder meetings, and will authorize the issuance of preferred shares that could be issued by our board of directors to thwart a takeover attempt. In addition, certain provisions of Delaware law may delay or prevent a transaction that could cause a change in our control. The market price of our shares could be adversely affected to the extent that provisions of our operating agreement discourage potential takeover attempts that our shareholders may favor.
56
Table of Contents
There are certain provisions in our operating agreement regarding exculpation and indemnification of our officers and directors that differ from the Delaware General Corporation Law (the “DGCL”) in a manner that may be less protective of the interests of our shareholders.
Our operating agreement provides that to the fullest extent permitted by applicable law our directors or officers will not be liable to us. Under the DGCL, a director or officer would be liable to us for (i) breach of duty of loyalty to us or our shareholders, (ii) intentional misconduct or knowing violations of the law that are not done in good faith, (iii) improper redemption of shares or declaration of dividend, or (iv) a transaction from which the director derived an improper personal benefit. In addition, our operating agreement provides that we indemnify our directors and officers for acts or omissions to the fullest extent provided by law. Under the DGCL, a corporation can only indemnify directors and officers for acts or omissions if the director or officer acted in good faith, in a manner he reasonably believed to be in the best interests of the corporation, and, in criminal action, if the officer or director had no reasonable cause to believe his conduct was unlawful. Accordingly, our operating agreement may be less protective of the interests of our shareholders, when compared to the DGCL, insofar as it relates to the exculpation and indemnification of our officers and directors.
As a public company, we will incur additional costs and face increased demands on our management.
As a newly public company with shares listed on the NYSE, we will need to comply with an extensive body of regulations that did not apply to us previously, including certain provisions of the Sarbanes-Oxley Act, the Dodd–Frank Wall Street Reform and Consumer Protection Act, regulations of the SEC and requirements of the NYSE. We expect these rules and regulations will increase our legal and financial compliance costs and make some activities more time-consuming and costly. For example, as a result of becoming a public company, we intend to add independent directors and create additional board committees. In addition, we may incur additional costs associated with our public company reporting requirements and maintaining directors’ and officers’ liability insurance. We are currently evaluating and monitoring developments with respect to these rules, which may impose additional costs on us and have a material adverse effect on our business, prospects, financial condition, results of operations and cash flows.
If securities or industry analysts do not publish research or reports about our business, or if they downgrade their recommendations regarding our common shares, our share price and trading volume could decline.
The trading market for our common shares will be influenced by the research and reports that industry or securities analysts publish about us or our business. If any of the analysts who cover us downgrades our common units or publishes inaccurate or unfavorable research about our business, our common share price may decline. If analysts cease coverage of us or fail to regularly publish reports on us, we could lose visibility in the financial markets, which in turn could cause our common share price or trading volume to decline and our common shares to be less liquid.
57
Table of Contents
Some of the statements under “Prospectus Summary,” “Risk Factors,” “Management’s Discussion and Analysis of Financial Condition and Results of Operations,” “Business” and elsewhere in this prospectus may contain forward-looking statements that reflect our current views with respect to, among other things, future events and financial performance. You can identify these forward-looking statements by the use of forward-looking words such as “outlook,” “believes,” “expects,” “potential,” “continues,” “may,” “will,” “should,” “could,” “seeks,” “approximately,” “predicts,” “intends,” “plans,” “estimates,” “anticipates,” “target,” “projects,” “contemplates” or the negative version of those words or other comparable words. Any forward-looking statements contained in this prospectus are based upon our historical performance and on our current plans, estimates and expectations in light of information currently available to us. The inclusion of this forward-looking information should not be regarded as a representation by us, Fortress, the underwriters or any other person that the future plans, estimates or expectations contemplated by us will be achieved. Such forward-looking statements are subject to various risks and uncertainties and assumptions relating to our operations, financial results, financial condition, business, prospects, growth strategy and liquidity. Accordingly, there are or will be important factors that could cause our actual results to differ materially from those indicated in these statements. We believe that these factors include, but are not limited to:
| • | changes in economic conditions generally and specifically in our industry sectors, and other risks relating to the global economy; |
| • | reductions in cash flows received from our assets; |
| • | our ability to take advantage of acquisition opportunities at favorable prices; |
| • | a lack of liquidity surrounding our assets, which could impede our ability to vary our portfolio in an appropriate manner; |
| • | the relative spreads between the yield on the assets we acquire and the cost of financing; |
| • | adverse changes in the financing markets we access affecting our ability to finance our acquisitions; |
| • | customers defaults on their obligations; |
| • | our ability to renew existing contracts and win additional contracts with existing or potential customers; |
| • | the availability and cost of capital for future acquisitions; |
| • | concentration of a particular type of asset or in a particular sector; |
| • | competition within the aviation, energy, intermodal transport and rail sectors; |
| • | the competitive market for acquisition opportunities; |
| • | risks related to operating through joint ventures or partnerships or through consortium arrangements; |
| • | obsolescence of our assets or our ability to sell, re-lease or re-charter our assets; |
| • | exposure to uninsurable losses and force majeure events; |
| • | infrastructure operations may require substantial capital expenditures; |
| • | the legislative/regulatory environment and exposure to increased economic regulation; |
| • | exposure to the oil and gas industry’s volatile oil and gas prices; |
| • | difficulties in obtaining effective legal redress in jurisdictions in which we operate with less developed legal systems; |
| • | our ability to maintain our exemption from registration under the 1940 Act and the fact that maintaining such exemption imposes limits on our operations; |
58
Table of Contents
| • | our ability to successfully utilize leverage in connection with our investments; |
| • | foreign currency risk and risk management activities; |
| • | effectiveness of our internal controls over financial reporting; |
| • | exposure to environmental risks, including increasing environmental legislation and the broader impacts of climate change; |
| • | changes in interest rates and/or credit spreads, as well as the success of any hedging strategy we may undertake in relation to such changes; |
| • | actions taken by national, state, or provincial governments, including nationalization, or the imposition of new taxes, could materially impact the financial performance or value of our assets; |
| • | our dependence on our Manager and its professionals and conflicts of interest in our relationship with our manager; |
| • | volatility in the market price of our common shares; |
| • | the inability to pay dividends to our shareholders in the future; |
| • | our ability to improve the performance of our equipment leasing business and infrastructure business and generate FAD consistent with the assumptions contained in this prospectus; and |
| • | other risks described in the “Risk Factors” section of this prospectus. |
These factors should not be construed as exhaustive and should be read in conjunction with the other cautionary statements that are included in this prospectus. The forward-looking statements made in this prospectus relate only to events as of the date on which the statements are made. We do not undertake any obligation to publicly update or review any forward-looking statement except as required by law, whether as a result of new information, future developments or otherwise.
If one or more of these or other risks or uncertainties materialize, or if our underlying assumptions prove to be incorrect, our actual results may vary materially from what we may have expressed or implied by these forward-looking statements. We caution that you should not place undue reliance on any of our forward-looking statements. You should specifically consider the factors identified in this prospectus that could cause actual results to differ before making an investment decision to purchase our common shares. Furthermore, new risks and uncertainties arise from time to time, and it is impossible for us to predict those events or how they may affect us.
59
Table of Contents
The net proceeds to us from the sale of the 20,000,000 common shares offered hereby are estimated to be approximately $371,406,000, assuming an initial public offering price of $20.00 per share (the midpoint of the estimated initial public offering price range set forth on the cover page of this prospectus) and after deducting the estimated underwriting discounts and commissions and estimated offering expenses payable by us. We intend to use the net proceeds to us from this offering, together with our other sources of capital and liquidity, for the acquisition of new assets in the sectors in which we currently invest—aviation, energy, intermodal transport and rail—as well as to opportunistically acquire assets across the entire transportation and transportation-related infrastructure and equipment market. In addition, we intend to use the net proceeds for follow-on investments in our existing assets, working capital and other general corporate purposes.
A $1.00 increase (decrease) in the assumed initial public offering price of $20.00 per share (the midpoint of the estimated initial public offering price range set forth on the cover page of this prospectus) would increase (decrease) the net proceeds to us from this offering by $18,750,000, assuming the number of common shares offered by us, as set forth on the cover page of this prospectus, remains the same and after deducting the estimated underwriting discounts and commissions and estimated offering expenses payable by us.
60
Table of Contents
The following table sets forth our cash and cash equivalents and capitalization, as of December 31, 2014:
| • | on an actual basis; |
| • | on a pro forma basis to give effect to the “Pro Forma Transactions” set forth in “Unaudited Pro Forma Combined Financial Information”; and |
| • | on an as adjusted basis to give effect to (i) the funding of an aggregate of $251,392,682 in net equity capital that we will have received from existing limited partners of the Onshore Partnership and the Offshore Partnership prior to the offering since December 31, 2014 and (ii) the sale of 20,000,000 common shares by us in this offering, at an assumed initial public offering price of $20.00 per share, the midpoint of the estimated initial public offering price range set forth on the cover page of this prospectus, after deducting the estimated underwriting discounts and commissions and estimated offering expenses payable by us. |
This table should be read in conjunction with “Selected Historical Consolidated Financial Data,” “Unaudited Pro Forma Combined Financial Information,” “Management’s Discussion and Analysis of Financial Condition and Results of Operations” and our audited and unaudited consolidated financial statements and related notes included elsewhere in this prospectus.
| As of December 31, 2014 (in thousands) |
||||||||||||
| Historical | Pro Forma | As Adjusted | ||||||||||
| Cash and cash equivalents |
$ | 22,125 | $ |
22,125 |
|
$ | 595,451 | (1) | ||||
|
|
|
|
|
|
|
|||||||
| Debt: |
||||||||||||
| Loans payable (2) |
243,759 | 243,759 | 243,759 | |||||||||
| Bonds payable (3) |
346,521 | 346,521 | 346,521 | |||||||||
| Loan payable to non-controlling interest (4) |
2,587 | 2,587 | 2,587 | |||||||||
| Members’ equity/Shareholders’ equity: |
||||||||||||
| Common shares, $0.01 par value per share; 2,000,000,000 shares authorized; 53,502,873 shares issued and outstanding, pro forma; 73,502,873 shares issued and outstanding, as adjusted |
— | 535 | 735 | |||||||||
| Additional paid-in-capital |
— | 613,683 | 1,236,282 | |||||||||
| Members’ equity |
614,218 | — | — | |||||||||
| Accumulated other comprehensive income |
214 | 214 | 214 | |||||||||
| Non-controlling interest in equity of consolidated subsidiaries |
99,065 | 99,065 | 99,065 | |||||||||
|
|
|
|
|
|
|
|||||||
| Total members’ equity/shareholders’ equity |
713,497 | 713,497 | 1,336,296 | |||||||||
|
|
|
|
|
|
|
|||||||
| Total capitalization |
$ | 1,306,364 | $ | 1,306,364 | $ | 1,929,163 | ||||||
|
|
|
|
|
|
|
|||||||
| (1) | Consists of (i) $201.9 million of net equity capital expected to be called from existing limited partners of the Onshore Partnership and the Offshore Partnership, (ii) offering proceeds of $371.4 million, after deducting the estimated underwriting discounts and commissions and estimated offering expenses payable by us, and (iii) $22.1 million of historical cash and cash equivalents as of December 31, 2014. Approximately $49.5 million of the $251.4 million in net equity capital received since December 31, 2014 has been invested or is expected to be invested in our operations and is not reflected in cash and cash equivalents. Such amounts are not included in the Company’s calculation of FAD. |
| (2) | Consists of (i) $61.1 million of outstanding indebtedness of our subsidiaries in connection with the acquisition of portfolio of shipping containers subject to finance leases; (ii) a $73.4 million term loan entered into in connection with the acquisition of an offshore construction vessel; and (iii) credit facilities entered into by the Company in connection with its acquisition of Jefferson Terminal and the operations of CMQR. |
| (3) | Consists of (i) $48.5 million principal amount of tax exempt industrial bonds (“Series 2012 Bonds”), including unamortized premium, representing funds loaned to Jefferson Terminal, and (ii) $298 million principal amount of tax exempt industrial bonds (“Series 2010 Bonds”) tendered by the bondholders and purchased by the Company and classified on its consolidated balance sheet as Tendered Bonds and Debt. |
| (4) | Consists of approximately $2.6 million owed by one of our consolidated subsidiaries to the owner of the non-controlling interest in such consolidated subsidiary. |
61
Table of Contents
If you invest in our common shares, your ownership interest will be diluted to the extent of the difference between the initial public offering price in this offering per common share and the pro forma as adjusted net tangible book value per common share upon consummation of this offering. Pro forma net tangible book value per share represents the book value of our total tangible assets less the book value of our total liabilities divided by the number of common shares then issued and outstanding.
Our pro forma net tangible book value as of December 31, 2014 would have been approximately $546,230, or approximately $10.21 per share based on the 53,502,873 common shares that would have been issued and outstanding as of such date. After giving effect to (i) our sale of common shares in this offering at the initial public offering price of $20.00 per share (the midpoint of the estimated initial public offering price range set forth on the cover page of this prospectus), and after deducting the estimated underwriting discounts and commissions and estimated offering expenses payable by us, and (ii) the funding of $251,392,682 in net equity capital since December 31, 2014, our pro forma as adjusted net tangible book value as of December 31, 2014 would have been $1,169,029, or $15.90 per share (assuming no exercise of the underwriters’ option to purchase additional shares). This represents an immediate and substantial dilution of $4.10 per share to new investors purchasing common shares in this offering. The following table illustrates this dilution per share:
| Assumed initial public offering price per share |
$ | 20.00 | ||||||
| Pro forma net tangible book value per share as of December 31, 2014 |
$ | 10.21 | ||||||
| Increase in net tangible book value per share attributable to this offering |
5.69 | |||||||
|
|
|
|||||||
| Pro forma as adjusted net tangible book value per share after giving effect to this offering |
15.90 | |||||||
|
|
|
|||||||
| Dilution per share to new investors in this offering |
$ | 4.10 | ||||||
|
|
|
A $1.00 increase (decrease) in the assumed initial public offering price of $20.00 per share (the midpoint of the estimated initial public offering price range set forth on the cover page of this prospectus) would increase (decrease) our pro forma as adjusted net tangible book value by $18,750, our pro forma as adjusted net tangible book value per share after this offering by $0.26 per share and the dilution to new investors in this offering by $0.26 per share, assuming the number of common shares offered by us, as set forth on the cover page of this prospectus, remains the same and after deducting the estimated underwriting discounts and commissions and estimated offering expenses payable by us.
The following table summarizes, on a pro forma as adjusted basis as of December 31, 2014, the differences between the number of common shares purchased from us, the total price and the average price per share paid by existing shareholders and by the new investors in this offering, before deducting the underwriting discounts and commissions and estimated offering expenses payable by us, at an assumed initial public offering price of $20.00 per share (the midpoint of the estimated initial public offering price range set forth on the cover page of this prospectus).
| Shares Purchased | Total Consideration | Average Price per Share |
||||||||||||||||||
| Number | Percent | Amount | Percent | |||||||||||||||||
| (in thousands) |
||||||||||||||||||||
| Existing shareholders |
53,502,873 | 72.8 | % | 865,611 | 68.4 | % | $ | 16.18 | ||||||||||||
| New investors in this offering |
20,000,000 | 27.2 | 400,000 | 31.6 | 20.00 | |||||||||||||||
|
|
|
|
|
|
|
|
|
|||||||||||||
| Total |
73,502,873 | 100 | % | $ | 1,265,611 | 100 | % | |||||||||||||
|
|
|
|
|
|
|
|
|
|||||||||||||
62
Table of Contents
A $1.00 increase (decrease) in the assumed initial offering price would increase (decrease) total consideration paid by new investors and average price per share paid by new investors by $20,000 and $1.00 per share, respectively. An increase (decrease) of 1.0 million in the number of shares offered by us would increase (decrease) total consideration paid by new investors and average price per share paid by new investors by $20,000 and $0.00 per share, respectively.
If the underwriters’ option to purchase additional shares is fully exercised, the pro forma as adjusted net tangible book value per share after this offering as of December 31, 2014 would have been approximately $16.02 per share and the dilution to new investors per share after this offering would be $3.98 per share.
63
Table of Contents
Since inception through March 31, 2015, we have made a total of fourteen regular quarterly capital distributions which have been characterized as returns of capital to our investors that have grown consistently over time. We currently intend to pay regular quarterly dividends and our long term goal is to maintain a payout ratio of between 50-60% of funds available for distribution, with remaining amounts used primarily to fund our future acquisitions and opportunities. For the second quarter of 2015, we intend to pay a dividend of $0.33 per share, which will be pro-rated for the period from the consummation of this offering to the end of the quarter and paid in the third quarter of 2015. We have historically not generated sufficient funds available for distribution to support this payout amount and our ability to do so is subject to certain uncertainties including the performance of our existing Equipment Leasing Business as well as the improvement in the operating performance of our Infrastructure Business including Jefferson Terminal and CMQR. Furthermore, some of our prior distributions to our investors would not have been possible without proceeds from equity and debt financings. Any shortfalls in the future may be funded with the proceeds from further equity and debt financings. Our dividends will be authorized by our board of directors and declared by us based on a number of factors including actual results of operations, liquidity and financial condition, restrictions imposed by applicable law, our taxable income, our operating expenses and other factors our board of directors deem relevant. Because we are a holding company and have no direct operations, we will only be able to pay dividends from our available cash on hand and any funds we receive from our subsidiaries and our ability to receive distributions from our subsidiaries may be limited by the financing agreements to which they are subject. See “Management’s Discussion and Analysis” for a discussion of restrictions contained in such financing agreements. For more information regarding our organizational structure following the consummation of this offering, see “Prospectus Summary—Our Organizational Structure.” In addition, pursuant to the Partnership Agreement, the General Partner will be entitled to receive incentive allocations before any amounts are distributed by the Company based both on our consolidated net income and capital gains income in each fiscal quarter and for each fiscal year, respectively, subject to certain adjustments. See “Our Manager and Management Agreement and Other Compensation Arrangements—Other Incentive Allocations” for a description of the terms of such arrangements. As a public company, there can be no assurance that we will pay dividends in amounts or on a basis consistent with prior dividends, if at all.
64
Table of Contents
SELECTED HISTORICAL CONSOLIDATED FINANCIAL DATA
The following tables summarize the consolidated financial information of the Company. The Company is a recently-formed limited liability company that has not, to date, conducted any activities other than those incident to its formation and its ownership of Holdco, which have been deemed immaterial and therefore are not presented in the summary historical consolidated financial data.
The selected consolidated statement of operations data for the years ended December 31, 2014 and 2013, and the selected consolidated balance sheet data as of December 31, 2014 and 2013 have been derived from our audited financial statements.
The selected financial data should be read in conjunction with “Management’s Discussion and Analysis of Financial Condition and Results of Operations” and our audited consolidated financial statements and related notes included elsewhere in this prospectus.
| Year ended December 31, 2014 |
Year ended December 31, 2013 |
|||||||
| (in thousands except for share and per share data) |
||||||||
| Statement of Operations data: |
||||||||
| Equipment leasing revenues |
$ | 43,984 | $ | 19,530 | ||||
| Infrastructure revenues |
13,946 | — | ||||||
|
|
|
|
|
|||||
| Total revenues |
57,930 | 19,530 | ||||||
|
|
|
|
|
|||||
| Operating expenses |
27,223 | 3,157 | ||||||
| General and administrative |
2,007 | 805 | ||||||
| Acquisition and transaction expenses |
11,450 | 260 | ||||||
| Management fees to affiliate |
5,463 | 2,211 | ||||||
| Depreciation and amortization |
15,998 | 3,909 | ||||||
| Interest expense |
5,872 | 2,816 | ||||||
|
|
|
|
|
|||||
| Total expenses |
68,013 | 13,158 | ||||||
|
|
|
|
|
|||||
| Equity in earnings of unconsolidated entities, net |
6,093 | 10,325 | ||||||
| Gain on sale of equipment, net |
7,576 | 2,415 | ||||||
| Gain on sale of unconsolidated entity |
— | 6,144 | ||||||
| Interest income |
186 | 23 | ||||||
| Other income |
20 | — | ||||||
|
|
|
|
|
|||||
| Total other income |
13,875 | 18,907 | ||||||
|
|
|
|
|
|||||
| Income before income taxes |
3,792 | 25,279 | ||||||
| Provision for income taxes |
874 | — | ||||||
|
|
|
|
|
|||||
| Net income |
2,918 | 25,279 | ||||||
|
|
|
|
|
|||||
| Less: Net income attributable to non-controlling interest in consolidated subsidiaries |
(4,862 | ) | 458 | |||||
|
|
|
|
|
|||||
| Net income attributable to members |
$ | 7,780 | $ | 24,821 | ||||
|
|
|
|
|
|||||
| Unaudited pro forma net income attributable to members per share, basic and diluted, as adjusted for the Distribution |
0.15 | 0.46 | ||||||
| Unaudited weighted average shares outstanding, basic and diluted, as adjusted for the Distribution |
53,502,873 | 53,502,873 | ||||||
65
Table of Contents
| December 31, | ||||||||
| 2014 | 2013 | |||||||
| (in thousands) | ||||||||
| Balance Sheet data: |
||||||||
| Total assets |
$ | 1,404,201 | $ | 278,647 | ||||
| Debt obligations |
592,867 | 73,388 | ||||||
| Total liabilities |
690,704 | 82,763 | ||||||
| Total members’ equity |
713,497 | 195,884 | ||||||
66
Table of Contents
UNAUDITED PRO FORMA COMBINED FINANCIAL INFORMATION
The following unaudited pro forma combined balance sheet as of December 31, 2014 and unaudited pro forma combined statement of operations for the year ended December 31, 2014 are based on (i) our audited consolidated financial statements for the year ended December 31, 2014, (ii) the unaudited combined financial statements of Central Maine and Quebec Railway (“CMQR”) for the six months ended June 30, 2014 (not included in this prospectus), and (iii) the unaudited consolidated financial statements of Jefferson Refinery LLC (“Jefferson Terminal”) for the period from January 1 through August 26, 2014 (not included in this prospectus).
The unaudited pro forma combined financial information was derived from the application of pro forma adjustments to our audited consolidated financial statements. The unaudited pro forma combined statement of operations for the year ended December 31, 2014 gives effect to the Pro Forma Transactions (as defined below) as if they had occurred as of January 1, 2014. The unaudited pro forma combined balance sheet as of December 31, 2014 gives effect to the Pro Forma Transactions, as if they had occurred on December 31, 2014.
The pro forma adjustments are based on available information and certain assumptions that we believe are reasonable in order to reflect, on a pro forma basis, the impact of the transactions listed below on our historical financial information, and should be read in conjunction with “Use of Proceeds”, “Capitalization”, “Management’s Discussion and Analysis of Financial Condition and Results of Operations”, and our audited consolidated financial statements included elsewhere in this prospectus.
The unaudited pro forma combined financial information has been prepared to reflect adjustments to our historical consolidated financial information that are (i) directly attributable to the Pro Forma Transactions, (ii) factually supportable, and (iii) with respect to the unaudited pro forma combined statement of operations, expected to have a continuing impact on our results. However, such adjustments are estimates based on certain assumptions and may not prove to be accurate. Information regarding these adjustments is subject to risks and uncertainties that could cause actual results to differ materially from our unaudited pro forma combined financial information.
The unaudited pro forma combined financial information gives effect to the following (the “Pro Forma Transactions”):
| • | the acquisition of Montreal, Maine and Atlantic Railway Ltd. (“MM&A—U.S.”) and Montreal, Maine and Atlantic Canada Co (“MM&A—Canada”) on May 15, 2014 and June 30, 2014, respectively, which are accounted for as business combinations. The acquired businesses were renamed as CMQR subsequent to the acquisition; |
| • | the acquisition of a 60% interest in Jefferson Terminal on August 27, 2014, which was accounted for as a business combination and the financing under the new credit facility entered into in connection with such acquisition; |
| • | the management fee payable to the Manager and the incentive compensation allocable to the General Partner following this offering; and |
| • | the issuance of common shares to the Initial Shareholders immediately prior to this offering in exchange for existing membership interests in the Company. |
We have not made any pro forma adjustment for our costs relating to reporting, compliance or investor relations costs, or other incremental costs that we may incur as a public company, including costs relating to compliance with Section 404 of the Sarbanes-Oxley Act of 2002.
The unaudited pro forma combined financial information is included for illustrative and informational purposes only and does not purport to reflect our results of operations or financial condition had the Pro Forma Transactions occurred at an earlier date. The unaudited pro forma combined financial information also should not be considered representative of our future financial condition or results of operations.
67
Table of Contents
No pro forma adjustments have been made to the historical financial statements to the extent that the Pro Forma Transactions were already reflected in the underlying historical data as of or for the entire reporting period presented. The impact of our acquisition of CMQR and Jefferson Terminal are already reflected in our historical consolidated balance sheet as of December 31, 2014. Accordingly, no corresponding pro forma adjustments have been made to the historical consolidated balance sheet for these acquisitions.
In addition, no pro forma adjustment for income tax has been reflected in the unaudited pro forma combined statements of operations as taxable income related to the Pro Forma Transactions is projected to be minimal.
68
Table of Contents
Unaudited Pro Forma Combined Statement of Operations
For the year ended December 31, 2014
| (amounts in thousands except for share and per share |
FTAI historical amounts |
CMQR acquisition (a) |
Jefferson Terminal acquisition and related financing (b) |
Management and incentive fee (c) |
Pro Forma Adjusted |
|||||||||||||||
| Revenues |
||||||||||||||||||||
| Equipment leasing revenues |
$ | 43,984 | $ | — | $ | 1,170 | $ | — | $ | 45,154 | ||||||||||
| Infrastructure revenues |
13,946 | 5,598 | 1,477 | 21,021 | ||||||||||||||||
|
|
|
|
|
|
|
|
|
|
|
|||||||||||
| Total revenues |
57,930 | 5,598 | 2,647 | — | 66,175 | |||||||||||||||
|
|
|
|
|
|
|
|
|
|
|
|||||||||||
| Expenses |
||||||||||||||||||||
| Operating expenses |
27,223 | 7,319 | — | — | 34,542 | |||||||||||||||
| General and administrative |
2,007 | 673 | 37,059 | — | 39,739 | |||||||||||||||
| Acquisition and transaction expenses |
11,450 | (5,646 | ) | (5,494 | ) | — | 310 | |||||||||||||
| Management fees to affiliate |
5,463 | — | — | 3,792 | 9,255 | |||||||||||||||
| Depreciation and amortization |
15,998 | 687 | 4,581 | — | 21,266 | |||||||||||||||
| Interest expense |
5,872 | — | 9,091 | — | 14,963 | |||||||||||||||
|
|
|
|
|
|
|
|
|
|
|
|||||||||||
| Total expenses |
68,013 | 3,033 | 45,237 | 3,792 | 120,075 | |||||||||||||||
|
|
|
|
|
|
|
|
|
|
|
|||||||||||
| Other income (expense) |
||||||||||||||||||||
| Equity in earnings of unconsolidated entities |
6,093 | — | — | — | 6,093 | |||||||||||||||
| Gain (loss) on sale of equipment, net |
7,576 | — | (6,173 | ) | — | 1,403 | ||||||||||||||
| Interest income |
186 | — | — | — | 186 | |||||||||||||||
| Other income (expense) |
20 | (4,678 | ) | 139 | — | (4,519 | ) | |||||||||||||
|
|
|
|
|
|
|
|
|
|
|
|||||||||||
| Total other income (expense) |
13,875 | (4,678 | ) | (6,034 | ) | — | 3,163 | |||||||||||||
|
|
|
|
|
|
|
|
|
|
|
|||||||||||
| Income (loss) before income taxes |
3,792 | (2,113 | ) | (48,624 | ) | (3,792 | ) | (50,737 | ) | |||||||||||
| Provision for income taxes |
874 | — | — | — | 874 | |||||||||||||||
|
|
|
|
|
|
|
|
|
|
|
|||||||||||
| Net income (loss) |
2,918 | (2,113 | ) | (48,624 | ) | (3,792 | ) | (51,611 | ) | |||||||||||
|
|
|
|
|
|
|
|
|
|
|
|||||||||||
| Less: Net income (loss) attributable to non-controlling interests in consolidated subsidiaries |
(4,862 | ) | — | (19,450 | ) | — | (24,312 | ) | ||||||||||||
|
|
|
|
|
|
|
|
|
|
|
|||||||||||
| Net income (loss) attributable to members |
$ | 7,780 | $ | (2,113 | ) | $ | (29,174 | ) | $ | (3,792 | ) | $ | (27,299 | ) | ||||||
|
|
|
|
|
|
|
|
|
|
|
|||||||||||
| Net (loss) per share, basic and diluted |
— | $ | (0.51 | )(d) | ||||||||||||||||
| Weighted average shares outstanding, basic and diluted |
53,502,873 | (d) | ||||||||||||||||||
See notes to unaudited pro forma combined financial information
69
Table of Contents
Unaudited Pro Forma Combined Balance Sheet
As of December 31, 2014
| (amounts in thousands except for share data) |
FTAI historical amounts |
Distribution of common shares (d) |
Pro Forma Adjusted |
|||||||||
| Assets |
||||||||||||
| Cash and cash equivalents |
$ | 22,125 | $ | — | $ | 22,125 | ||||||
| Restricted cash |
21,084 | — | 21,084 | |||||||||
| Accounts receivable, net |
9,588 | — | 9,588 | |||||||||
| Leasing equipment, net |
509,379 | — | 509,379 | |||||||||
| Finance leases, net |
102,813 | — | 102,813 | |||||||||
| Property, plant, and equipment, net |
228,328 | — | 228,328 | |||||||||
| Investments in and advances to unconsolidated entities |
21,569 | — | 21,569 | |||||||||
| Tendered bonds |
298,000 | — | 298,000 | |||||||||
| Intangible assets, net |
52,041 | — | 52,041 | |||||||||
| Goodwill |
115,226 | — | 115,226 | |||||||||
| Other assets |
24,048 | — | 24,048 | |||||||||
|
|
|
|
|
|
|
|||||||
| Total Assets |
$ | 1,404,201 | $ | — | $ | 1,404,201 | ||||||
|
|
|
|
|
|
|
|||||||
| Liabilities |
||||||||||||
| Accounts payable and accrued liabilities |
$ | 42,784 | $ | — | $ | 42,784 | ||||||
| Debt |
592,867 | — | 592,867 | |||||||||
| Maintenance deposits |
35,575 | — | 35,575 | |||||||||
| Security deposits |
13,622 | — | 13,622 | |||||||||
| Other liabilities |
5,856 | — | 5,856 | |||||||||
|
|
|
|
|
|
|
|||||||
| Total liabilities |
690,704 | — | 690,704 | |||||||||
|
|
|
|
|
|
|
|||||||
| Members’ Equity |
||||||||||||
| Common stock, $0.01 par value; 2,000,000,000 shares authorized on a pro forma basis; 53,502,873 shares issued and outstanding on a pro forma basis |
— | 535 | 535 | |||||||||
| Additional paid-in-capital |
— | 613,683 | 613,683 | |||||||||
| Members’ Equity |
614,218 | (614,218 | ) | — | ||||||||
| Accumulated other comprehensive income |
214 | — | 214 | |||||||||
| Non-controlling interest in equity of consolidated subsidiaries |
99,065 | — | 99,065 | |||||||||
|
|
|
|
|
|
|
|||||||
| Total members’ equity |
713,497 | — | 713,497 | |||||||||
|
|
|
|
|
|
|
|||||||
| Total liabilities and members’ equity |
$ | 1,404,201 | $ | — | $ | 1,404,201 | ||||||
|
|
|
|
|
|
|
|||||||
See notes to unaudited pro forma combined financial information
70
Table of Contents
Notes to Unaudited Pro Forma Combined Financial Information
| (a) | CMQR acquisition |
Holdco completed the acquisition of MM&A—U.S. and MM&A—Canada on May 15, 2014 and June 30, 2014, respectively. As described in Note 3 to our Consolidated Financial Statements included elsewhere in this prospectus, the acquired businesses were renamed as CMQR subsequent to the acquisition.
The CMQR pro forma adjustments for the unaudited pro forma combined statement of operations for the year ended December 31, 2014 give effect to the acquisitions as if the acquisitions had been effective on January 1, 2014. The impact of the CMQR acquisition is already reflected in our historical balance sheet as of December 31, 2014; accordingly no pro forma adjustment has been made to our historical consolidated balance sheet as of December 31, 2014.
The following tables summarize the calculation of the pro forma adjustments for the year ended December 31, 2014 resulting from the CMQR acquisition:
| (amounts in thousands) |
CMQR historical amounts (1) |
Purchase accounting and other adjustments (2) |
CMQR acquisition adjustments (1) + (2) |
|||||||||
| Revenues |
||||||||||||
| Infrastructure revenues |
$ | 5,598 | $ | — | $ | 5,598 | ||||||
|
|
|
|
|
|
|
|||||||
| Total revenues |
5,598 | — | 5,598 | |||||||||
|
|
|
|
|
|
|
|||||||
| Expenses |
||||||||||||
| Operating expenses |
7,319 | — | 7,319 | |||||||||
| General and administrative |
673 | — | 673 | |||||||||
| Acquisition and transaction expenses (3) |
— | (5,646 | ) | (5,646 | ) | |||||||
| Depreciation and amortization (4) |
1,482 | (795 | ) | 687 | ||||||||
| Interest expense (5) |
66 | (66 | ) | — | ||||||||
|
|
|
|
|
|
|
|||||||
| Total expenses |
9,540 | (6,507 | ) | 3,033 | ||||||||
|
|
|
|
|
|
|
|||||||
| Other income (expense) |
||||||||||||
| Gain (loss) on sale of equipment, net |
— | — | — | |||||||||
| Other expenses |
(4,678 | ) | — | (4,678 | ) | |||||||
|
|
|
|
|
|
|
|||||||
| Total other income (expense) |
(4,678 | ) | — | (4,678 | ) | |||||||
|
|
|
|
|
|
|
|||||||
| Net income (loss) |
(8,620 | ) | 6,507 | (2,113 | ) | |||||||
| Less: Net income (loss) attributable to non-controlling interests in consolidated subsidiaries |
— | — | — | |||||||||
|
|
|
|
|
|
|
|||||||
| Net income (loss) attributable to members |
$ | (8,620 | ) | $ | 6,507 | $ | (2,113 | ) | ||||
|
|
|
|
|
|
|
|||||||
| (1) | CMQR historical amounts have been derived from the results of operations for the six months ended June 30, 2014. The results of operations of CMQR for the six months ended June 30, 2014 include operations of MM&A—Canada from January 1, 2014 to June 29, 2014 and operations of MM&A— U.S. from January 1, 2014—May 14, 2014, the respective acquisition dates. The results of operations of MM&A—U.S. from May 15, 2014 (date of acquisition) to December 31, 2014 and results of operations of MM&A—Canada from June 30, 2014 (date of acquisition) to December 31, 2014 are already reflected in our historical amounts. |
| (2) | Column reflects the purchase accounting and other adjustments. Refer to footnotes (3), (4) and (5) for further description of these adjustments. |
| (3) | Pro forma adjustment to remove costs of $5,646 incurred in connection with acquisitions and included in FTAI historical amounts as these represent non-recurring charges directly related to the transactions. |
71
Table of Contents
| (4) | Pro forma depreciation and amortization for the year ended December 31, 2014 is calculated based on the purchase price allocation on the date of respective acquisition dates and is as follows: |
| Asset class |
Fair value |
Salvage value |
Range of remaining useful lives (years) |
Recalculated pro forma depreciation and amortization for year ended December 31, 2014 |
||||||||||
| (amounts in thousands) | ||||||||||||||
| Plant, property and equipment |
||||||||||||||
| Land |
$ | 5,484 | $ | — | n/a | $ | — | |||||||
| Track |
4,952 | 756 | 2 to 5 | 1,171 | ||||||||||
| Buildings and improvement |
136 | 23 | 4 | 29 | ||||||||||
| Railroad equipment |
713 | 263 | 4 to 6 | 76 | ||||||||||
| Vehicles |
320 | 65 | 2 | 127 | ||||||||||
| Railcars and locomotives |
1,283 | 400 | 5 | 177 | ||||||||||
|
|
|
|
|
|||||||||||
| 12,888 | 1,507 | |||||||||||||
|
|
|
|
|
|||||||||||
| Intangibles |
||||||||||||||
| Customer lists and customer contracts |
225 | — | 5 | 45 | ||||||||||
|
|
|
|
|
|
|
|||||||||
| Total |
$ | 13,113 | $ | 1,507 | 1,625 | |||||||||
|
|
|
|
|
|||||||||||
| Depreciation and amortization included in CMQR historical financials |
(1,482 | ) | ||||||||||||
| Depreciation and amortization included in FTAI historical financials |
(938 | ) | ||||||||||||
|
|
|
|||||||||||||
| Pro forma adjustment |
$ | (795 | ) | |||||||||||
|
|
|
|||||||||||||
| (5) | Reflects an adjustment to reverse interest expense in CMQR historical amounts as no debt was assumed as part of the acquisition. |
| (b) | Acquisition of 60% interest in Jefferson Terminal and financing under new credit facility |
As described in Note 3 to our Consolidated Financial Statements, we completed the acquisition of a 60% interest in Jefferson Terminal on August 27, 2014.
The pro forma adjustments for the Jefferson Terminal acquisition for the unaudited pro forma combined statement of operations for the year ended December 31, 2014 gives effect to the acquisition as if the acquisition had been effective on January 1, 2014.
The following tables summarize the calculation of the pro forma adjustments for the year ended December 31, 2014 resulting from the Jefferson Terminal acquisition:
| (amounts in thousands) |
Jefferson Terminal historical amounts (1) |
Purchase accounting and related financing adjustments (2) |
Jefferson Terminal acquisition and related financing adjustments (1) + (2) |
|||||||||
| Revenues |
||||||||||||
| Equipment leasing revenues |
$ | 1,170 | $ | — | $ | 1,170 | ||||||
| Infrastructure revenues |
1,477 | — | 1,477 | |||||||||
|
|
|
|
|
|
|
|||||||
| Total revenues |
2,647 | — | 2,647 | |||||||||
|
|
|
|
|
|
|
|||||||
| Expenses |
||||||||||||
| General and administrative |
37,059 | — | 37,059 | |||||||||
| Acquisition and transaction expenses (3) |
— | (5,494 | ) | (5,494 | ) | |||||||
| Depreciation and amortization (4) |
681 | 3,900 | 4,581 | |||||||||
| Interest expense (5) |
6,814 | 2,277 | 9,091 | |||||||||
|
|
|
|
|
|
|
|||||||
| Total expenses |
44,554 | 683 | 45,237 | |||||||||
|
|
|
|
|
|
|
|||||||
72
Table of Contents
| (amounts in thousands) |
Jefferson Terminal historical amounts (1) |
Purchase accounting and related financing adjustments (2) |
Jefferson Terminal acquisition and related financing adjustments (1) + (2) |
|||||||||
| Other income (expense) |
||||||||||||
| Gain (loss) on sale of equipment, net |
$ | (6,173 | ) | $ | — | $ | (6,173 | ) | ||||
| Other income |
139 | — | 139 | |||||||||
|
|
|
|
|
|
|
|||||||
| Total other income (expense) |
(6,034 | ) | — | (6,034 | ) | |||||||
|
|
|
|
|
|
|
|||||||
| Net income (loss) |
(47,941 | ) | (683 | ) | (48,624 | ) | ||||||
| Less: Net income (loss) attributable to non-controlling interests in consolidated subsidiaries (6) |
(2,928 | ) | (16,522 | ) | (19,450 | ) | ||||||
|
|
|
|
|
|
|
|||||||
| Net income (loss) attributable to members |
$ | (45,013 | ) | $ | 15,839 | $ | (29,174 | ) | ||||
|
|
|
|
|
|
|
|||||||
| (1) | Jefferson Terminal historical amounts are derived from the results of operations from January 1, 2014 to August 26, 2014. The results of operations from August 27, 2014 (date of acquisition) to December 31, 2104 are already reflected in our historical amounts. |
| (2) | Column reflects the purchase accounting and related financing adjustments. The Jefferson Terminal acquisition was financed in part with a term loan of $100 million from Morgan Stanley Senior Funding, Inc. Refer to footnotes (3), (4), (5) and (6) below for a further description of these adjustments. |
| (3) | Pro forma adjustment to remove costs of $5,494 incurred in connection with acquisitions and included in FTAI historical amounts as these represent non-recurring charges directly related to the transactions. |
| (4) | Pro forma depreciation and amortization is calculated based on the purchase price allocation on the date of acquisition and is as follows: |
| Asset class |
Fair value | Range of remaining useful lives (years) |
Recalculated pro forma depreciation and amortization for year ended December 31, 2014 |
|||||||
| (amounts in thousands) | ||||||||||
| Plant, property and equipment |
||||||||||
| Land |
$ | 2,770 | — | $ | — | |||||
| Land improvements |
6,803 | 20 | 356 | |||||||
| Building and improvements |
2,139 | 30 | 73 | |||||||
| Crude oil terminal machinery and equipment |
47,286 | 15 to 20 | 2,782 | |||||||
| Other assets |
609 | 5 to 10 | 124 | |||||||
| Construction in progress |
86,223 | — | — | |||||||
|
|
|
|||||||||
| 145,830 | ||||||||||
|
|
|
|||||||||
| Intangibles |
||||||||||
| Customer lists and customer contracts |
35,385 | 10 | 3,538 | |||||||
|
|
|
|
|
|||||||
| Total |
$ | 181,215 | 6,873 | |||||||
|
|
|
|||||||||
| Depreciation and amortization included in Jefferson Terminal historical financials |
(681 | ) | ||||||||
| Depreciation and amortization included in FTAI historical financials |
(2,292 | ) | ||||||||
|
|
|
|||||||||
| Pro forma adjustment |
$ | 3,900 | ||||||||
|
|
|
|||||||||
| (5) | The Jefferson Terminal acquisition was financed in part with a term loan of $100 million from Morgan Stanley Senior Funding, Inc. The loan terms include an original issue discount of 1% and financing costs |
73
Table of Contents
| of $1.25 million. In addition, approximately $2,753 of exit fee is expected to be payable at maturity and is recognized ratably over the term of the loan. We elected the Eurodollar Rate terms for the term loan, which use an Adjusted Eurodollar Rate (with a floor of 1%) plus an applicable margin of 8.00%. |
Based on the current terms, the Eurodollar Rate is calculated as 9% at the date of acquisition and the effective interest rate for the term loan is calculated to be 10.45%. A 0.125% change in the Eurodollar Rate would amount to a change in total pro forma interest expense of approximately $124.
This adjustment recognizes the interest and amortization of deferred financing costs related to the term loan and is calculated as follows:
| (amounts in thousands) | Amounts | |||
| Principal term loan balance |
$ | 100,000 | ||
|
|
|
|||
| Pro forma annual interest expense |
$ | 9,000 | ||
| Amortization of deferred financing fees |
658 | |||
| Interest expense associated with exit fee payable |
787 | |||
|
|
|
|||
| Pro forma interest on term loan |
10,445 | |||
| Interest expense included in Jefferson Terminal historical financials |
(6,814 | ) | ||
| Interest expense included in FTAI historical financials from the acquisition date |
(168 | ) | ||
| Interest capitalized to construction in progress in FTAI historical financials |
(3,534 | ) | ||
| Pro forma interest expense adjustment for 2012 Bonds (i) ($3,601 - $1,253) |
2,348 | |||
|
|
|
|||
| Pro forma adjustment |
$ | 2,277 | ||
|
|
|
|||
| (i) | On August 1, 2012, Jefferson County Development Corporation issued $46.9 million of its Series 2012 Bonds, to specifically fund construction and operation of an intermodal transfer facility for crude oil and refined petroleum products. In connection with the acquisition of Jefferson Terminal, the Company assumed the Series 2012 Bonds and recorded them at a fair value of $48,554, which represented a premium of $1,823 as compared to their face value at the date of acquisition; such premium is being amortized in historical FTAI financials using the effective interest method over the remaining contractual term of the Series 2012 Bonds. The Series 2012 Bonds have a stated maturity of July 1, 2032, bear interest at 8.25%, and require scheduled principal payments. The principal of the Series 2012 Bonds is payable annually at varying amounts. |
Interest expense on the Series 2012 Bonds of approximately $1,253, inclusive of premium amortization of $32, was recorded for the period from August 27, 2014 (date of acquisition) to December 31, 2014 in historical FTAI financials. The total pro forma interest expense for 2012 Bonds would have been $3,601 including a premium amortization of $92, if the transaction would have occurred on January 1, 2014.
| (6) | The pro forma adjustment for net income (loss) attributable to non-controlling interest in consolidated subsidiaries is based on 40% interest held by non-controlling interest holders in Jefferson Terminal and is calculated as follows: |
| (amounts in thousands) | Amounts | |||
| Net loss after acquisition and financing adjustments |
$ | (48,624 | ) | |
| Non-controlling interest (40%) |
(19,450 | ) | ||
| (c) | Management and incentive fee |
The pro forma adjustment reflects the management fee and incentive fee payable by us pursuant to the Management Agreement as if they were in effect as of January 1, 2014.
Pursuant to the Management Agreement, the management fee is calculated based on the average of the two most recent months of consolidated GAAP equity (excluding non-controlling interest) times 1.5% annually
74
Table of Contents
or 0.125% monthly. For pro forma purposes, the adjustment for management fees is based on our pro forma combined GAAP equity (excluding pro forma non-controlling interest) of $614,432 as of December 31, 2014.
The incentive compensation fee allocable by us to the General Partner will be based on our pre-incentive distribution net income (as adjusted in accordance with the Management Agreement) in each calendar quarter as expressed as a rate of return on the average value of the net equity capital at the end of the two most recent calendar quarters and will be calculated as follows:
| • | No incentive distribution will be paid in any calendar quarter in which the calculated pre-incentive distribution net income does not exceed 2.0% for such quarter. |
| • | 100% of the pre-incentive distribution net income, if any, that exceeds 2.00% but does not exceed 2.2223% for such quarter. |
| • | 10.0% of the amount of our pre-incentive distribution net income, if any, that exceeds 2.2223% for such quarter. |
In addition, capital gains incentive compensation is calculated and payable in arrears as of the end of each calendar year and will equal 10% of our pro-rata share of cumulative realized gains from the applicable calendar year net of our pro-rata share of cumulative capital losses for such period, realized and unrealized losses, certain non-cash portion of any equity based compensation expense and all realized gains upon which prior performance-based capital gains incentive distribution payments were previously made to the General Partner.
The adjustment for pro forma incentive fee and pro forma capital gains incentive fee is calculated based on the pro forma pre-incentive net income (loss) and pro forma net realized capital gains for the year ended December 31, 2014, respectively. The Company is in a pro forma pre-incentive distribution net loss position for the year ended December 31, 2014, resulting in pro forma incentive fee of $0. The Company has pro forma net capital gains of $391 for the year ended December 31, 2014, resulting in pro forma capital gains incentive fee of $39. The pro forma capital gains incentive fee of $39 is calculated as 10% of our pro-rata share of pro forma realized gains of $1,403, less our pro-rata share of other realized and unrealized losses of $201, and less our pro-rata share of non-cash equity-based compensation expense of $811.
The pro forma management fee and incentive fee adjustment for the year ended December 31, 2014 is calculated as follows:
| (amounts in thousands) | Amounts | |||
| Pro forma combined GAAP equity |
$ | 614,432 | ||
|
|
|
|||
| Pro forma management fees |
$ | 9,216 | ||
| Pro forma incentive fees |
— | |||
| Pro forma capital gains incentive fees |
39 | |||
|
|
|
|||
| Total pro forma management and incentive fees |
9,255 | |||
| Historical management and incentive fees |
5,463 | |||
|
|
|
|||
| Pro forma adjustment |
$ | 3,792 | ||
|
|
|
|||
| (d) | Reflects an adjustment from members’ equity to additional paid-in capital after giving effect to the pro rata distribution of common shares to the Initial Shareholders immediately prior to this offering. |
This adjustment excludes the funding of an aggregate of $251,392,682 in net equity capital that we will have received from existing limited partners of the Onshore Partnership and the Offshore Partnership prior to the offering since December 31, 2014.
The number of shares used to compute pro forma basic and diluted (loss) earnings per share is 53,502,873, which will be the number of shares outstanding, excluding the shares that are being offered by us in this offering.
75
Table of Contents
MANAGEMENT’S DISCUSSION AND ANALYSIS OF FINANCIAL CONDITION AND
RESULTS OF OPERATIONS
Overview
We own and acquire high quality infrastructure and related equipment that is essential for the transportation of goods and people globally. We currently invest across four market sectors: aviation, energy, intermodal transport and rail. We target assets that, on a combined basis, generate strong cash flows with potential for earnings growth and asset appreciation. We believe that there are a large number of acquisition opportunities in our markets, and that our Manager’s expertise and business and financing relationships, together with our access to capital, will allow us to take advantage of these opportunities. We are externally managed by FIG LLC, an affiliate of Fortress, which has a dedicated team of professionals who collectively have acquired over $17 billion in transportation and infrastructure assets since 2002. As of December 31, 2014, we had total consolidated assets of $1.4 billion and total equity capital of $713 million.
Operating Segments
Our operations consist of two primary strategic business units – Infrastructure and Equipment Leasing. Our Infrastructure Business acquires long-lived assets that provide mission-critical services or functions to transportation networks and typically have high barriers to entry. They often involve an operating business that has strong margins, stable cash flows and upside from earnings growth and asset appreciation driven by increased use and inflation. Our Equipment Leasing Business acquires assets that are designed to carry cargo or people or provide functionality to transportation infrastructure. Transportation equipment assets are typically long-lived, moveable and leased by us on either operating leases or finance leases to companies that provide transportation services. Our leases generally provide for long-term contractual cash flow with high cash-on-cash yields and may include structural protections to mitigate credit risk.
Our reportable segments are comprised of interests in different types of infrastructure and equipment leasing assets. We currently conduct our business through our corporate operating segment (comprising unallocated corporate general and administrative expenses and management fees) and the following five reportable segments: Aviation Leasing, Offshore Energy, Shipping Containers, all of which are within Equipment Leasing Business, and, Jefferson Terminal (formerly known as Crude-by-Rail Terminal) and Railroad, which together comprise our Infrastructure Business.
The Aviation Leasing segment consists of aircraft and aircraft engines held for lease and are typically held long-term. The aviation industry supports the transportation of passengers and freight globally. According to the IATA, global demand for passenger traffic has grown at an average annual rate of 5.5% over the past two decades, outpacing global GDP of 3.0% in the same period. According to the International Civil Aviation Organization, aviation passenger traffic (measured in passenger kilometers) has increased at approximately a 4.6% compound annual growth rate from 2004 to 2013. Furthermore, according to Boeing’s 2014 Commercial Market Outlook, this growth is expected to continue, rising at an average annual rate of 5% per annum over the next two decades. Looking forward, we believe that aircraft operators will continue to rely on leasing for aircraft and engines as they seek to reduce capital intensity which will provide opportunities for us to grow our portfolio.
The Offshore Energy segment consists of vessels and equipment that support offshore oil and gas activities and are typically subject to long-term operating leases. Our Offshore Energy segment also included an investment in an unconsolidated entity which owned a derrick pipe-laying barge, which was sold in November 2013. The offshore energy industry supports the extraction of oil and natural gas from deposits located beneath the sea. According to the EIA, fossil fuels, which represented approximately 80% of energy consumption in 2014, will continue to represent approximately 80% of energy consumption through 2040. Looking forward, we believe that offshore oil and gas exploration and production spending will increase in order to meet rising demand for energy and that will support our ability to make additional acquisitions in this segment.
76
Table of Contents
The Shipping Containers segment consists of investments in shipping containers subject to operating leases and finance leases as well as an investment in an unconsolidated entity engaged in the acquisition and leasing of shipping containers on both an operating lease and finance lease basis. As of December 2014, approximately 5,000 fully-cellular container ships, with an aggregate capacity of approximately 18.6 million TEUs on-board vessel slots, transport 1.6 billion tons of containerized cargo a year. This generates movement of approximately 700 million TEUs through the world’s container ports annually yielding annual revenues of $200 billion for the container shipping lines, and accounts for over 50% of the total value of world seaborne trade. As of December 2014, the size of the world container fleet was approximately 36 million TEUs, 52% of which was owned by shipping lines and other operators, and 48% of which was owned or managed by container lessors. We believe this market will continue to grow and will present us with attractive acquisition opportunities.
The Jefferson Terminal segment consists of a multi-modal crude and refined products terminal and other related assets which were acquired in 2014. Over the last several years, the volume of crude oil shipped by rail has increased dramatically as a result of the significant growth in oil and gas production from unconventional sources in the U.S. and Canada. This surge in production has outpaced the capacity of the existing pipeline infrastructure and led shippers to find alternative forms of transportation. Crude-by-rail offers shippers the ability to maintain the purity of their product at a cost-competitive, faster and more flexible route to market than traditional pipelines. We expect this growth to continue with significant opportunities to make additional acquisitions in this sector.
The Railroad segment consists of our Central Maine and Quebec Railway (“CMQR”) short line railroad operations. The rail sector includes both operating railroads and infrastructure such as terminals and rail lines as well as rail equipment such as railcars and locomotives. According to AAR, there are 574 freight railroads operating on 140,000 miles of track in the U.S. as of December 2013. Due to cost and other advantages over trucking, freight railroads have steadily increased their share of U.S. freight-ton-miles over the last thirty years and we expect this to continue leading to additional opportunities to invest in railroad opportunities.
The Corporate operating segment primarily consists of unallocated corporate general and administrative expenses and management fees.
The Company’s reportable segments are comprised of investments in different types of transportation infrastructure and equipment. Each segment requires different investment strategies. The accounting policies of the segments are the same as those described in the summary of significant accounting policies; however, financial information presented by segment includes the impact of intercompany eliminations.
Results of Operations
During the fourth quarter of 2014, the Chief Operating Decision Maker (“CODM”) implemented Adjusted Net Income as the key performance measure. The new performance measure reflects the current management of our businesses. In addition, this change provides the CODM with the information necessary to assess operational performance as well as make resource and allocation decisions. This change has been reflected in the tables below and prior periods have been conformed to the current presentation. Adjusted Net Income should not be considered as an alternative to net income attributable to members as determined in accordance with GAAP.
Adjusted Net Income is defined as net income attributable to members, adjusted (a) to exclude the impact of provision for income taxes, equity-based compensation expense, acquisition and transaction expenses, losses on the modification or extinguishment of debt and capital lease obligations, changes in fair value of non-hedge derivative instruments, asset impairment charges, and equity in earnings of unconsolidated entities; (b) to include the impact of cash tax payments and our pro-rata share of the Adjusted Net Income from unconsolidated entities (collectively “Adjusted Net Income”); and (c) to exclude the impact of the non-controlling share of Adjusted Net Income. We evaluate investment performance for each reportable segment primarily based on Adjusted Net Income. We believe that net income attributable to members as defined by GAAP is the most appropriate earnings measurement, with which to reconcile Adjusted Net Income.
77
Table of Contents
In addition, we view Adjusted EBITDA as a secondary measurement to Adjusted Net Income, which serves as a useful supplement to investors, analysts and management to measure operating performance of its deployed assets and to compare the Company’s operating results to the operating results of our peers and between periods on a consistent basis. Adjusted EBITDA may not be comparable to similarly titled measures of other companies because other entities may not calculate Adjusted EBITDA in the same manner.
Adjusted EBITDA is defined as net income attributable to members, adjusted (a) to exclude the impact of provision for income taxes, equity-based compensation expense, acquisition and transaction expenses, losses on the modification or extinguishment of debt and capital lease obligations, changes in fair value of non-hedge derivative instruments, asset impairment charges, depreciation and amortization expense, and interest expense; (b) to include the impact of principal collections on direct finance leases (collectively, “Adjusted EBITDA”) and our pro-rata share of the Adjusted EBITDA from unconsolidated entities; and (c) to exclude the impact of equity in earnings of unconsolidated entities and the non-controlling share of Adjusted EBITDA.
Discussed below are our consolidated results of operations for each of our reportable segments (all US dollar amounts, expressed in thousands).
Comparison of the year ended December 31, 2014 (“2014”) to the year ended December 31, 2013 (“2013”)
The following table presents our consolidated results of operations and reconciliation of Net Income attributable to members to Adjusted Net Income in 2014 as compared to 2013:
| Year Ended December 31, 2014 |
Year Ended December 31, 2013 |
Increase (Decrease) |
||||||||||
| (in thousands) | ||||||||||||
| Revenues |
||||||||||||
| Equipment leasing revenues |
||||||||||||
| Lease income |
$27,681 | $ 9,284 | $18,397 | |||||||||
| Maintenance revenue |
5,964 | 2,242 | 3,722 | |||||||||
| Finance lease income |
10,013 | 7,781 | 2,232 | |||||||||
| Other revenue |
326 | 223 | 103 | |||||||||
|
|
|
|
|
|
|
|||||||
| Total equipment leasing revenues |
43,984 | 19,530 | 24,454 | |||||||||
|
|
|
|
|
|
|
|||||||
| Infrastructure revenues |
||||||||||||
| Lease income |
1,325 | — | 1,325 | |||||||||
| Rail revenues |
9,969 | — | 9,969 | |||||||||
| Terminal services revenues |
2,652 | — | 2,652 | |||||||||
|
|
|
|
|
|
|
|||||||
| Total infrastructure revenues |
13,946 | — | 13,946 | |||||||||
|
|
|
|
|
|
|
|||||||
| Total revenues |
$57,930 | $19,530 | $38,400 | |||||||||
|
|
|
|
|
|
|
|||||||
| Expenses |
||||||||||||
| Operating expenses |
27,223 | 3,157 | 24,066 | |||||||||
| General and administrative |
2,007 | 805 | 1,202 | |||||||||
| Acquisition and transaction expenses |
11,450 | 260 | 11,190 | |||||||||
| Management fees to affiliate |
5,463 | 2,211 | 3,252 | |||||||||
| Depreciation and amortization |
15,998 | 3,909 | 12,089 | |||||||||
| Interest expense |
5,872 | 2,816 | 3,056 | |||||||||
|
|
|
|
|
|
|
|||||||
| Total expenses |
$68,013 | $13,158 | $54,855 | |||||||||
|
|
|
|
|
|
|
|||||||
| Other income |
||||||||||||
| Equity in earnings of unconsolidated entities |
6,093 | 10,325 | (4,232 | ) | ||||||||
| Gain on sale of equipment, net |
7,576 | 2,415 | 5,161 | |||||||||
| Gain on sale of unconsolidated entity |
— | 6,144 | (6,144 | ) | ||||||||
| Interest income |
186 | 23 | 163 | |||||||||
| Other income |
20 | — | 20 | |||||||||
|
|
|
|
|
|
|
|||||||
| Total other income |
13,875 | 18,907 | (5,032 | ) | ||||||||
|
|
|
|
|
|
|
|||||||
78
Table of Contents
| Year Ended December 31, 2014 |
Year Ended December 31, 2013 |
Increase (Decrease) |
||||||||||
| (in thousands) | ||||||||||||
| Income before income taxes |
$ | 3,792 | $ | 25,279 | $ | (21,487 | ) | |||||
| Provision for income taxes |
874 | — | 874 | |||||||||
|
|
|
|
|
|
|
|||||||
| Net income |
$ | 2,918 | $ | 25,279 | $ | (22,361 | ) | |||||
|
|
|
|
|
|
|
|||||||
| Less: Net income (loss) attributable to non-controlling |
||||||||||||
| interest in consolidated subsidiaries |
(4,862 | ) | 458 | (5,320 | ) | |||||||
|
|
|
|
|
|
|
|||||||
| Net Income attributable to members |
$ | 7,780 | $ | 24,821 | $ | (17,041 | ) | |||||
|
|
|
|
|
|
|
|||||||
| Add: Provision for income taxes |
874 | — | 874 | |||||||||
| Add: Equity-based compensation expense |
1,265 | — | 1,265 | |||||||||
| Add: Acquisition and transaction expenses |
11,450 | 260 | 11,190 | |||||||||
| Add: Losses on the modification or extinguishment of debt and capital lease obligations |
— | — | — | |||||||||
| Add: Changes in fair value of non-hedge derivative instruments |
25 | — | 25 | |||||||||
| Add: Asset impairment charges |
— | — | — | |||||||||
| Add: Pro-rata share of Adjusted Net Income from unconsolidated entities (1) |
6,155 | 10,325 | (4,170 | ) | ||||||||
| Less: Cash tax payments |
(274 | ) | — | (274 | ) | |||||||
| Less: Equity in earnings of unconsolidated entities |
(6,093 | ) | (10,325 | ) | 4,232 | |||||||
| Less: Non-controlling share of Adjusted Net Income (2) |
(525 | ) | — | (525 | ) | |||||||
|
|
|
|
|
|
|
|||||||
| Adjusted Net Income |
$ | 20,657 | $ | 25,081 | $ | (4,424 | ) | |||||
|
|
|
|
|
|
|
|||||||
| (1) | Pro-rata share of Adjusted Net Income from unconsolidated entities includes the Company’s proportionate share of the unconsolidated entities’ net income adjusted for the excluded and included items detailed in the table above. Included in the year ended December 31, 2014 is $62 of loss on extinguishing of debt. |
| (2) | Non-controlling share of Adjusted Net Income is comprised of equity-based compensation of $454 and provision for income taxes of $71 for the year ended December 31, 2014. |
The following table sets forth a reconciliation of Net Income attributable to members to Adjusted EBITDA in 2014 as compared to 2013:
| Year Ended December 31, 2014 |
Year Ended December 31, 2013 |
Increase (Decrease) |
||||||||||
| (in thousands) | ||||||||||||
| Net Income attributable to members |
$ | 7,780 | $ | 24,821 | $ | (17,041 | ) | |||||
| Add: Provision for income taxes |
874 | — | 874 | |||||||||
| Add: Equity-based compensation expense |
1,265 | — | 1,265 | |||||||||
| Add: Acquisition and transaction expenses |
11,450 | 260 | 11,190 | |||||||||
| Add: Losses on the modification or extinguishment of debt and capital lease obligations |
— | — | — | |||||||||
| Add: Changes in fair value of non-hedge derivative instruments |
25 | — | 25 | |||||||||
| Add: Asset impairment charges |
— | — | — | |||||||||
| Add: Depreciation & amortization expense |
18,692 | 3,909 | 14,783 | |||||||||
| Add: Interest expense |
5,872 | 2,816 | 3,056 | |||||||||
| Add: Principal collections on direct finance leases |
11,931 | 8,263 | 3,668 | |||||||||
| Add: Pro-rata share of the Adjusted EBITDA from unconsolidated entities (3) |
40,014 | 40,898 | (884 | ) | ||||||||
| Less: Equity in earnings of unconsolidated entities |
(6,093 | ) | (10,325 | ) | 4,232 | |||||||
| Less: Non-controlling share of Adjusted EBITDA (4) |
(2,497 | ) | (245 | ) | (2,252 | ) | ||||||
|
|
|
|
|
|
|
|||||||
| Adjusted EBITDA |
$ | 89,313 | $ | 70,397 | $ | 18,916 | ||||||
|
|
|
|
|
|
|
|||||||
| (3) | Pro-rata share of Adjusted EBITDA from unconsolidated entities primarily includes the Company’s proportionate share of the following items for the years ended December 31, 2014 and 2013: (i) interest |
79
Table of Contents
| expense of $2,561 and $4,199, respectively, (ii) depreciation and amortization expense of $1,232 and $2,189, respectively, and (iii) principal collections of finance leases of $30,345 and $24,428. |
| (4) | Non-controlling share of Adjusted EBITDA is comprised of the following items for the years ended December 31, 2014 and 2013: (i) equity based compensation of $454 and $0, respectively, (ii) provision for income taxes of $71 and $0, respectively, (iii) interest expense of $642 and $104, respectively, and (iv) depreciation and amortization expense of $1,330 and $141, respectively. |
During 2014, the Company continued to make additional asset acquisitions in the Aviation Leasing, Offshore Energy and Shipping Containers segments. During 2014, the Company also added two new reportable segments within the Infrastructure Business: Jefferson Terminal and Railroad.
Total revenue increased by $38,400 in 2014 as compared to 2013, driven by higher lease income, maintenance revenue, and finance lease income. Lease income increased by $18,397 in 2014 as compared to 2013 driven by the Aviation Leasing and Offshore Energy segments as asset acquisitions in the Aviation Leasing and Offshore Energy segments contributed to higher revenues in 2014. Maintenance revenue increased by $3,722 in 2014 as compared to 2013 as a result of an increase in the number of aircraft and engines on lease in 2014 as compared to 2013. Finance lease income increased by $2,232 in 2014 as compared to 2013 due to a full year of income in 2014 with respect to an anchor handling tug support vessel acquired in November 2013 and a full year of lease income from a new portfolio of shipping containers acquired in August 2013. Lastly, the Railroad and Jefferson Terminal segments contributed revenues in our Infrastructure Business of $13,946 in 2014, as they were acquired by the Company in the second and third quarters of 2014, respectively.
Total expenses increased by $54,855 in 2014 as compared to 2013. This was driven by an increase in operating expenses of $24,066 and general and administrative expenses of $1,202 in 2014 as compared to 2013, primarily due to the inclusion of Jefferson Terminal and CMQR, both acquired in 2014. Additionally, acquisition and transaction expenses increased by $11,190 in 2014 as compared to 2013, mainly due to costs to acquire Jefferson Terminal and CMQR. Depreciation and amortization increased by $12,089 in 2014 as compared to 2013 due to additional assets acquired in the Aviation Leasing and Offshore Energy segments in 2014, as well as the acquisition of Jefferson Terminal and CMQR related assets. Management fees to affiliates increased by $3,252 in 2014 as compared to 2013 attributable to an increase in the weighted average contributed capital. Interest expense increased by $3,056 in 2014 as compared to 2013 due to additional borrowings during 2014 in connection with CMQR operations and the Jefferson Terminal acquisition.
Total other income decreased by $5,032 in 2014 as compared to 2013. Of this decrease, approximately $10,376 was due to lower equity in earnings of unconsolidated entities and gain on sale of unconsolidated entities recognized in 2013 that did not recur in 2014. Both were related to the disposal of an equity interest in PJW 3000 LLC, an offshore energy joint venture owned for eleven months in 2013 through November 2013. Offsetting these decreases were additional gains on sale of equipment of $5,161 in 2014 as compared to 2013 due to higher sales of assets in the Aviation Leasing segment.
Net income attributable to members decreased by $17,041, to $7,780 in 2014 as compared to $24,821 in 2013, driven by the changes discussed above.
Adjusted Net Income was $20,657 in 2014 as compared to $25,081 in 2013, a decrease of $4,424. In addition to the changes in Net income attributable to members noted above, this decrease was driven by higher acquisition and transaction expenses, mainly due to costs to acquire Jefferson Terminal and CMQR, and provision for income taxes offset by cash tax payments in 2014, all of which are excluded from Adjusted Net Income.
Adjusted EBITDA was $89,313 in 2014 as compared to $70,397 in 2013, an increase of $18,916. In addition to the changes in Net income attributable to members noted above, this increase was primarily due to increased (i) depreciation and amortization expense due to additional assets acquired across nearly all segments, (ii) acquisition and transaction expenses, mainly due to costs to acquire Jefferson Terminal and CMQR,
80
Table of Contents
(iii) principal collections on direct finance leases mainly in the Shipping Containers, Offshore Energy, and Aviation Leasing segments, (iv) our pro-rata share of the Adjusted EBITDA from unconsolidated entities and (v) interest expense on additional borrowings made in 2014. This increase was offset by higher non-controlling share of Adjusted EBITDA, mainly due to Jefferson Terminal.
Additional discussion of the Company’s results of operations in 2014 as compared to 2013 by segment is as follows:
Aviation Leasing Segment
The following table presents our results of operations and reconciliation of Net Income attributable to members to Adjusted Net Income in 2014 as compared to 2013 for the Aviation Leasing segment:
| Year Ended December 31, 2014 |
Year Ended December 31, 2013 |
Increase (Decrease) |
||||||||||
| (in thousands) | ||||||||||||
| Revenues |
||||||||||||
| Equipment leasing revenues |
||||||||||||
| Lease income |
$ | 14,991 | $ | 4,282 | $ | 10,709 | ||||||
| Maintenance revenue |
5,964 | 2,242 | 3,722 | |||||||||
| Other revenue |
3 | 121 | (118 | ) | ||||||||
|
|
|
|
|
|
|
|||||||
| Total revenues |
$ | 20,958 | $ | 6,645 | $ | 14,313 | ||||||
|
|
|
|
|
|
|
|||||||
| Expenses |
||||||||||||
| Operating expenses |
1,713 | 2,191 | (478 | ) | ||||||||
| Depreciation and amortization |
9,445 | 2,972 | 6,473 | |||||||||
|
|
|
|
|
|
|
|||||||
| Total expenses |
$ | 11,158 | $ | 5,163 | $ | 5,995 | ||||||
|
|
|
|
|
|
|
|||||||
| Other income |
||||||||||||
| Gain on sale of equipment, net |
7,576 | 2,415 | 5,161 | |||||||||
| Interest income |
26 | 23 | 3 | |||||||||
|
|
|
|
|
|
|
|||||||
| Total other income |
7,602 | 2,438 | 5,164 | |||||||||
|
|
|
|
|
|
|
|||||||
| Income before income taxes |
17,402 | 3,920 | 13,482 | |||||||||
| Provision for income taxes |
490 | — | 490 | |||||||||
|
|
|
|
|
|
|
|||||||
| Net Income attributable to members |
$ | 16,912 | $ | 3,920 | $ | 12,992 | ||||||
|
|
|
|
|
|
|
|||||||
| Add: Provision for income taxes |
490 | — | 490 | |||||||||
| Add: Equity-based compensation expense |
— | — | — | |||||||||
| Add: Acquisition and transaction expenses |
— | — | — | |||||||||
| Add: Losses on the modification or extinguishment of debt and capital lease obligations |
— | — | — | |||||||||
| Add: Changes in fair value of non-hedge derivative instruments |
— | — | — | |||||||||
| Add: Asset impairment charges |
— | — | — | |||||||||
| Add: Pro-rata share of Adjusted Net Income from unconsolidated entities |
— | — | — | |||||||||
| Less: Cash tax payments |
(266 | ) | — | (266 | ) | |||||||
| Less: Equity in earnings of unconsolidated entities |
— | — | — | |||||||||
| Less: Non-controlling share of Adjusted Net Income |
— | — | — | |||||||||
|
|
|
|
|
|
|
|||||||
| Adjusted Net Income |
$ | 17,136 | $ | 3,920 | $ | 13,216 | ||||||
|
|
|
|
|
|
|
|||||||
81
Table of Contents
The following table sets forth a reconciliation of Net Income attributable to members to Adjusted EBITDA in 2014 as compared to 2013 for the Aviation Leasing segment:
| Year Ended December 31, 2014 |
Year Ended December 31, 2013 |
Increase (Decrease) |
||||||||||
| (in thousands) | ||||||||||||
| Net Income attributable to members |
$ | 16,912 | $ | 3,920 | $ | 12,992 | ||||||
| Add: Provision for income taxes |
490 | — | 490 | |||||||||
| Add: Equity-based compensation expense |
— | — | — | |||||||||
| Add: Acquisition and transaction expenses |
— | — | — | |||||||||
| Add: Losses on the modification or extinguishment of debt and capital lease obligations |
— | — | — | |||||||||
| Add: Changes in fair value of non-hedge derivative instruments |
— | — | — | |||||||||
| Add: Asset impairment charges |
— | — | — | |||||||||
| Add: Depreciation & amortization expense |
12,139 | 2,972 | 9,167 | |||||||||
| Add: Interest expense |
— | — | — | |||||||||
| Add: Principal collections on direct finance leases |
689 | 152 | 537 | |||||||||
| Add: Pro-rata share of the Adjusted EBITDA from unconsolidated entities |
— | — | — | |||||||||
| Less: Equity in earnings of unconsolidated entities |
— | — | — | |||||||||
| Less: Non-controlling share of Adjusted EBITDA |
— | — | — | |||||||||
|
|
|
|
|
|
|
|||||||
| Adjusted EBITDA |
$ | 30,230 | $ | 7,044 | $ | 23,186 | ||||||
|
|
|
|
|
|
|
|||||||
Total revenue in the Aviation Leasing segment increased by $14,313 in 2014 as compared to 2013, driven by higher lease income and maintenance revenue, and a decrease within other revenue. Lease income increased by $10,709 in 2014 as compared to 2013 due to higher (i) aircraft lease income of $8,401 primarily driven by the purchase of fourteen on lease aircraft in 2014, and (ii) engine lease income of $2,300 primarily driven by an increase in the number of engines on lease in 2014 as compared to 2013. Maintenance revenue increased by $3,722 in 2014 as compared to 2013 due to an increase in the number of aircraft and engines on lease in 2014 as compared to 2013. Other revenue decreased by $118 in 2014 as compared to 2013 primarily due to ancillary income in 2013, which did not recur in 2014.
Total expenses in the Aviation Leasing segment increased by $5,995 in 2014 as compared to 2013. This was driven by a decrease in operating expenses of $478 in 2014 as compared to 2013 offset by an increase of $6,473 in depreciation and amortization. The decrease in operating expenses is primarily the result of (i) lower repairs and maintenance expense of $547 in 2014 compared to 2013 which included repair costs for a Boeing 757 passenger aircraft and (ii) lower travel and entertainment expense of $103, both offset by (iii) additional insurance expense of $228 primarily related to additional aircraft and aircraft engines owned and on lease in 2014 as compared to 2013. Depreciation and amortization increased by $6,473 in 2014 as compared to 2013, driven by the additional aircraft and engines owned and on lease in 2014 as compared to 2013.
Total other income in the Aviation Leasing segment increased $5,164 in 2014 as compared to 2013. This was driven by gains on sale of leasing equipment of $7,576 in 2014 related to the sale of two aircraft and five aircraft engines, as compared to gains of $2,415 in 2013 related to the sale of five aircraft engines and one aircraft airframe.
Net income attributable to members increased by $12,992, to $16,912 in 2014 as compared to $3,920 in 2013, driven by the changes noted above.
Adjusted Net Income was $17,136 in 2014 as compared to $3,920 in 2013, an increase of $13,216. In addition to the changes in Net income attributable to members noted above, this movement was driven by an increased provision for taxes offset by cash tax payments.
Adjusted EBITDA was $30,230 in 2014 as compared to $7,044 in 2013, an increase of $23,186. In addition to the changes in Net income attributable to members noted above, this movement was primarily due to increased depreciation and amortization expense driven by the additional aircraft and engines owned and on lease in 2014 as compared to 2013, and additional principal collections on finance leases.
82
Table of Contents
Offshore Energy Segment
The following table presents our results of operations and reconciliation of Net Income attributable to members to Adjusted Net Income in 2014 as compared to 2013 for the Offshore Energy segment:
| Year Ended December 31, 2014 |
Year Ended December 31, 2013 |
Increase (Decrease) |
||||||||||
| (in thousands) | ||||||||||||
| Revenues |
||||||||||||
| Equipment leasing revenues |
||||||||||||
| Lease income |
$ | 12,690 | $ | 5,002 | $ | 7,688 | ||||||
| Finance lease income |
1,716 | 262 | 1,454 | |||||||||
| Other revenue |
224 | — | 224 | |||||||||
|
|
|
|
|
|
|
|||||||
| Total revenues |
$ | 14,630 | $ | 5,264 | $ | 9,366 | ||||||
|
|
|
|
|
|
|
|||||||
| Expenses |
||||||||||||
| Operating expenses |
1,054 | 450 | 604 | |||||||||
| Depreciation and amortization |
2,801 | 937 | 1,864 | |||||||||
| Interest expense |
1,248 | 104 | 1,144 | |||||||||
|
|
|
|
|
|
|
|||||||
| Total expenses |
$ | 5,103 | $ | 1,491 | $ | 3,612 | ||||||
|
|
|
|
|
|
|
|||||||
| Other income |
||||||||||||
| Equity in earnings of unconsolidated entities |
— | 2,700 | (2,700 | ) | ||||||||
| Gain on sale of unconsolidated entity |
— | 6,144 | (6,144 | ) | ||||||||
| Interest income |
160 | — | 160 | |||||||||
|
|
|
|
|
|
|
|||||||
| Total other income |
160 | 8,844 | (8,684 | ) | ||||||||
|
|
|
|
|
|
|
|||||||
| Income before income taxes |
9,687 | 12,617 | (2,930 | ) | ||||||||
| Provision for income taxes |
— | — | — | |||||||||
|
|
|
|
|
|
|
|||||||
| Net income |
9,687 | 12,617 | (2,930 | ) | ||||||||
|
|
|
|
|
|
|
|||||||
| Less: Net income attributable to non-controlling interest in consolidated subsidiaries |
704 | 458 | |
— 246 |
| |||||||
|
|
|
|
|
|
|
|||||||
| Net Income attributable to members |
$ | 8,983 | $ | 12,159 | $ | (3,176 | ) | |||||
|
|
|
|
|
|
|
|||||||
| Add: Provision for income taxes |
— | — | — | |||||||||
| Add: Equity-based compensation expense |
— | — | — | |||||||||
| Add: Acquisition and transaction expenses |
— | — | — | |||||||||
| Add: Losses on the modification or extinguishment of debt and capital lease obligations |
— | — | — | |||||||||
| Add: Changes in fair value of non-hedge derivative instruments |
— | — | — | |||||||||
| Add: Asset impairment charges |
— | — | — | |||||||||
| Add: Pro-rata share of Adjusted Net Income from unconsolidated entities (1) |
— | 2,700 | (2,700 | ) | ||||||||
| Less: Cash tax payments |
(7 | ) | — | (7 | ) | |||||||
| Less: Equity in earnings of unconsolidated entities |
— | (2,700 | ) | 2,700 | ||||||||
| Less: Non-controlling share of Adjusted Net Income |
— | — | — | |||||||||
|
|
|
|
|
|
|
|||||||
| Adjusted Net Income |
$ | 8,976 | $ | 12,159 | $ | (3,183 | ) | |||||
|
|
|
|
|
|
|
|||||||
| (1) | Pro-rata share of Adjusted Net Income from unconsolidated entities includes the Company’s proportionate share of the unconsolidated entities’ net income adjusted for the excluded and included items detailed in the table above. |
83
Table of Contents
The following table sets forth a reconciliation of Net Income attributable to members to Adjusted EBITDA in 2014 as compared to 2013 for the Offshore Energy segment:
| Year Ended December 31, 2014 |
Year Ended December 31, 2013 |
Increase (Decrease) |
||||||||||
| (in thousands) | ||||||||||||
| Net Income attributable to members |
$ | 8,983 | $ | 12,159 | $ | (3,176 | ) | |||||
| Add: Provision for income taxes |
— | — | — | |||||||||
| Add: Equity-based compensation expense |
— | — | — | |||||||||
| Add: Acquisition and transaction expenses |
— | — | — | |||||||||
| Add: Losses on the modification or extinguishment of debt and capital lease obligations |
— | — | — | |||||||||
| Add: Changes in fair value of non-hedge derivative instruments |
— | — | — | |||||||||
| Add: Asset impairment charges |
— | — | — | |||||||||
| Add: Depreciation & amortization expense |
2,801 | 937 | 1,864 | |||||||||
| Add: Interest expense |
1,248 | 104 | 1,144 | |||||||||
| Add: Principal collections on direct finance leases |
292 | 44 | 248 | |||||||||
| Add: Pro-rata share of the Adjusted EBITDA from unconsolidated entities (2) |
— | 4,474 | (4,474 | ) | ||||||||
| Less: Equity in earnings of unconsolidated entities |
— | (2,700 | ) | 2,700 | ||||||||
| Less: Non-controlling share of Adjusted EBITDA (3) |
(246 | ) | (245 | ) | (1 | ) | ||||||
|
|
|
|
|
|
|
|||||||
| Adjusted EBITDA |
$ | 13,078 | $ | 14,773 | $ | (1,695 | ) | |||||
|
|
|
|
|
|
|
|||||||
| (2) | Pro-rata share of Adjusted EBITDA from unconsolidated entities primarily includes the Company’s proportionate share of the following items for the years ended December 31, 2014 and 2013: (i) interest expense of $0 and $703, respectively, and (ii) depreciation and amortization expense of $0 and $957, respectively. |
| (3) | Non-controlling share of Adjusted EBITDA is comprised of the following items for the years ended December 31, 2014 and 2013: (i) depreciation expense of $225 and $141, respectively, (ii) and interest expense of $21 and $104, respectively. |
Total revenue in the Offshore Energy segment increased by $9,366 in 2014 as compared to 2013, driven by higher lease income, finance lease income, and other revenue. Lease income increased by $7,688 in 2014 as compared to 2013 consisting of (i) $5,208 related to a new offshore construction vessel acquired in September 2014 which collected 4 months of rent in 2014, and (ii) incremental rent of $2,480 related to 12 months of rent earned from a remotely operated vehicle support vessel in 2014 as compared to 8.5 months of rent earned in 2013. Finance lease income increased by $1,454 primarily related to a full year of income in 2014 with respect to an anchor handling tug support vessel acquired in November 2013 and subsequently subject to a direct finance lease. Other revenue of $224 recorded in 2014 primarily related to crew reimbursement income for the new offshore construction vessel acquired in September 2014.
Total expenses in the Offshore Energy segment increased by $3,612 in 2014 as compared to 2013. This was driven by an increase in operating expenses of $604 in 2014 as compared to 2013 and an increase in interest expense and depreciation and amortization. The increase in operating results is a result of (i) higher professional fees of $523, (ii) additional insurance expense of $190, and (iii) an increase in other operating expenses of $211, offset by (iv) lower organizational costs of $320. Depreciation and amortization increased by $1,864 in 2014 as compared to 2013 primarily due to an increase of $1,301 attributable to 4 months of depreciation on the new offshore construction vessel, and an increase of $563 attributable to 12 months of depreciation on our remotely operated vehicle support vessel in 2014 compared to the 8.5 months of depreciation in 2013. Interest expense increased by $1,144 in 2014 as compared to 2013 primarily due to $1,043 attributable to the 4 months of interest on the loan associated with acquiring the offshore construction vessel in September 2014.
Total other income in the Offshore Energy segment decreased by $8,684 in 2014 as compared to 2013. This was driven primarily by a $2,700 decrease in equity in earnings of unconsolidated entities and a $6,144 decrease in gain on sale of unconsolidated entity, both related to the disposal of an equity interest in PJW 3000 LLC, an offshore energy joint venture, in November 2013.
84
Table of Contents
Net income attributable to members decreased by $3,176, to $8,983 in 2014 as compared to $12,159 in 2013, driven by the changes discussed above.
Adjusted Net Income was $8,976 in 2014 as compared to $12,159 in 2013, a decrease of $3,183. This decrease was primarily due to the changes in Net income attributable to members noted above.
Adjusted EBITDA was $13,078 in 2014 as compared to $14,773 in 2013, a decrease of $1,695. In addition to the changes in Net income attributable to members, this decrease was driven by higher (i) depreciation and amortization expense related to assets owned for the full year of 2014 as compared to a partial year in 2013, (ii) interest expense related to an additional borrowing in 2014, and (iii) higher principal collections on direct finance leases. These amounts were offset by a decrease in the pro-rata share of the Adjusted EBITDA from unconsolidated entities, related to the disposal of an equity interest in PJW 3000 LLC, an offshore energy joint venture, in November 2013.
Shipping Containers Segment
The following table presents our results of operations and reconciliation of Net Income attributable to members to Adjusted Net Income in 2014 as compared to 2013 for the Shipping Containers segment:
| Year Ended December 31, 2014 |
Year Ended December 31, 2013 |
Increase (Decrease) |
||||||||||
| (in thousands) | ||||||||||||
| Revenues |
||||||||||||
| Equipment leasing revenues |
||||||||||||
| Finance lease income |
$ | 8,297 | $ | 7,519 | $ | 778 | ||||||
| Other revenue |
99 | 102 | (3 | ) | ||||||||
|
|
|
|
|
|
|
|||||||
| Total revenues |
$ | 8,396 | $ | 7,621 | $ | 775 | ||||||
|
|
|
|
|
|
|
|||||||
| Expenses |
||||||||||||
| Operating expenses |
257 | 516 | (259 | ) | ||||||||
| Interest expense |
2,840 | 2,699 | 141 | |||||||||
|
|
|
|
|
|
|
|||||||
| Total expenses |
$ | 3,097 | $ | 3,215 | $ | (118 | ) | |||||
|
|
|
|
|
|
|
|||||||
| Other income |
||||||||||||
| Equity in earnings of unconsolidated entities |
6,093 | 7,625 | (1,532 | ) | ||||||||
| Other income (expense) |
(26 | ) | — | (26 | ) | |||||||
|
|
|
|
|
|
|
|||||||
| Total other income |
6,067 | 7,625 | (1,558 | ) | ||||||||
|
|
|
|
|
|
|
|||||||
| Income before income taxes |
11,366 | 12,031 | (665 | ) | ||||||||
| Provision for income taxes |
100 | — | 100 | |||||||||
|
|
|
|
|
|
|
|||||||
| Net Income attributable to members |
$ | 11,266 | $ | 12,031 | $ | (765 | ) | |||||
|
|
|
|
|
|
|
|||||||
| Add: Provision for income taxes |
100 | — | 100 | |||||||||
| Add: Equity-based compensation expense |
— | — | — | |||||||||
| Add: Acquisition and transaction expenses |
— | — | — | |||||||||
| Add: Losses on the modification or extinguishment of debt and capital lease obligations |
— | — | — | |||||||||
| Add: Changes in fair value of non-hedge derivative instruments |
25 | — | 25 | |||||||||
| Add: Asset impairment charges |
— | — | — | |||||||||
| Add: Pro-rata share of Adjusted Net Income from unconsolidated entities (1) |
6,155 | 7,625 | (1,470 | ) | ||||||||
| Less: Cash tax payments |
— | — | — | |||||||||
| Less: Equity in earnings of unconsolidated entities |
(6,093 | ) | (7,625 | ) | 1,532 | |||||||
| Less: Non-controlling share of Adjusted Net Income |
— | — | — | |||||||||
|
|
|
|
|
|
|
|||||||
| Adjusted Net Income |
$ | 11,453 | $ | 12,031 | $ | (578 | ) | |||||
|
|
|
|
|
|
|
|||||||
85
Table of Contents
| (1) | pro-rata share of Adjusted Net Income from unconsolidated entities includes the Company’s proportionate share of the unconsolidated entities’ net income adjusted for the excluded and included items detailed in the table above. Included in the year ended December 31, 2014 is $62 of loss on extinguishment of debt. |
The following table sets forth a reconciliation of Net Income attributable to members to Adjusted EBITDA in 2014 as compared to 2013 for the Shipping Containers segment:
| Year Ended December 31, 2014 |
Year Ended December 31, 2013 |
Increase (Decrease) |
||||||||||
| (in thousands) | ||||||||||||
| Net Income attributable to members |
$ | 11,266 | $ | 12,031 | $ | (765 | ) | |||||
| Add: Provision for income taxes |
100 | — | 100 | |||||||||
| Add: Equity-based compensation expense |
— | — | — | |||||||||
| Add: Acquisition and transaction expenses |
— | — | — | |||||||||
| Add: Losses on the modification or extinguishment of debt and capital lease obligations |
— | — | — | |||||||||
| Add: Changes in fair value of non-hedge derivative instruments |
25 | — | 25 | |||||||||
| Add: Asset impairment charges |
— | — | — | |||||||||
| Add: Depreciation & amortization expense |
— | — | — | |||||||||
| Add: Interest expense |
2,840 | 2,699 | 141 | |||||||||
| Add: Principal collections on direct finance leases |
10,950 | 8,067 | 2,883 | |||||||||
| Add: Pro-rata share of the Adjusted EBITDA from unconsolidated entities (2) |
40,014 | 36,424 | 3,590 | |||||||||
| Less: Equity in earnings of unconsolidated entities |
(6,093 | ) | (7,625 | ) | 1,532 | |||||||
| Less: Non-controlling share of Adjusted EBITDA |
— | — | — | |||||||||
|
|
|
|
|
|
|
|||||||
| Adjusted EBITDA |
$ | 59,102 | $ | 51,596 | $ | 7,506 | ||||||
|
|
|
|
|
|
|
|||||||
| (2) | Pro-rata share of Adjusted EBITDA from unconsolidated entities primarily includes the Company’s proportionate share of the following items for the years ended December 31, 2014 and 2013: (i) interest expense of $2,561 and $3,496, respectively, (ii) depreciation and amortization expense of $1,232 and $1,232, respectively, and (iii) principal collections of finance leases of $30,345 and $24,428, respectively. |
Total revenue in the Shipping Containers segment increased by $775 in 2014 as compared to 2013, principally driven by higher finance lease income, offset by lower other revenue. Finance lease income increased by $778 due to $1,417 of income earned from a new portfolio of shipping containers acquired in August 2013 subject to direct finance leases offset by $639 decrease in finance income generated from a legacy portfolio of shipping containers as a result of the amortization of the underlying principal balances.
Total expenses in the Shipping Containers segment decreased by $118 in 2014 as compared to 2013. This was driven by a decrease in operating expenses of $259 in 2014 as compared to 2013 offset by an increase in interest expense. The decrease in operating expenses is a result of lower (i) professional fees of $272 (ii) travel and entertainment expenses of $26 (iii) other administrative expenses of $4, all offset by higher insurance expense of $43. Interest expense increased by $141 in 2014 as compared to 2013 primarily related to a full year of interest expense on a term loan used to finance the acquisition of a portfolio of shipping containers purchased in August 2013.
Total other income in the Shipping Containers segment decreased $1,558 in 2014 as compared to 2013. This was driven by decreased equity in earnings of unconsolidated entities of $1,532 related to a shipping container joint venture and a decrease in other income (expense) of $25 due to a decrease in the fair value of a non-hedge derivative.
Net income attributable to members decreased by $765, to $11,266 in 2014 as compared to $12,031 in 2013, driven by the changes discussed above.
86
Table of Contents
Adjusted Net Income was $11,453 in 2014 as compared to $12,031 in 2013, a decrease of $578. In addition to the changes in Net income attributable to members noted above, this was impacted by a loss on the extinguishment of a capital lease obligation, and the decrease in fair value of a non-hedge derivative instrument in 2014.
Adjusted EBITDA was $59,102 in 2014 as compared to $51,596 in 2013, an increase of $7,506. In addition to the changes in Net income attributable to members noted above, this increase was driven by a higher pro-rata share of Adjusted EBITDA from unconsolidated entities related to a shipping container joint venture and additional principal collections on direct finance leases.
Jefferson Terminal Segment
The following table presents our results of operations and reconciliation of Net Loss attributable to members to Adjusted Net Loss in 2014 for the Jefferson Terminal segment:
| Year Ended December 31, 2014 |
||||
| (in thousands) | ||||
| Revenues |
||||
| Infrastructure revenues |
||||
| Lease income |
$ | 1,325 | ||
| Terminal services revenues |
2,652 | |||
|
|
|
|||
| Total revenues |
$ | 3,977 | ||
|
|
|
|||
| Expenses |
||||
| Operating expenses |
9,095 | |||
| Acquisition and transaction expenses |
5,494 | |||
| Depreciation and amortization |
2,763 | |||
| Interest expense |
1,552 | |||
|
|
|
|||
| Total expenses |
$ | 18,904 | ||
|
|
|
|||
| Other income |
||||
| Other income |
46 | |||
|
|
|
|||
| Total other income |
46 | |||
|
|
|
|||
| Loss before income taxes |
(14,881 | ) | ||
| Provision for income taxes |
284 | |||
|
|
|
|||
| Net loss |
(15,165 | ) | ||
|
|
|
|||
| Less: Net loss attributable to non-controlling interest in consolidated subsidiaries |
(5,566 | ) | ||
|
|
|
|||
| Net Loss attributable to members |
$ | (9,599 | ) | |
|
|
|
|||
| Add: Provision for income taxes |
284 | |||
| Add: Equity-based compensation expense |
1,137 | |||
| Add: Acquisition and transaction expenses |
5,494 | |||
| Add: Losses on the modification or extinguishment of debt and capital lease obligations |
— | |||
| Add: Changes in fair value of non-hedge derivative instruments |
— | |||
| Add: Asset impairment charges |
— | |||
| Add: Pro-rata share of Adjusted Net Income from unconsolidated entities |
— | |||
| Less: Cash tax payments |
— | |||
| Less: Equity in earnings of unconsolidated entities |
— | |||
| Less: Non-controlling share of Adjusted Net Income (1) |
(525 | ) | ||
|
|
|
|||
| Adjusted Net Loss |
$ | (3,209 | ) | |
|
|
|
|||
| (1) | Non-controlling share of Adjusted Net Income is comprised of equity-based compensation of $454 and income tax benefit of $71 for the year ended December 31, 2014. |
87
Table of Contents
The following table sets forth a reconciliation of Net Loss attributable to members to Adjusted EBITDA in 2014 for the Jefferson Terminal segment:
| Year ended December 31, 2014 |
||||
| (in thousands) | ||||
| Net Loss attributable to members |
$ | (9,599 | ) | |
| Add: Provision for income taxes |
284 | |||
| Add: Equity-based compensation expense |
1,137 | |||
| Add: Acquisition and transaction expenses |
5,494 | |||
| Add: Losses on the modification or extinguishment of debt and capital lease obligations |
— | |||
| Add: Changes in fair value of non-hedge derivative instruments |
— | |||
| Add: Asset impairment charges |
— | |||
| Add: Depreciation & amortization expense |
2,763 | |||
| Add: Interest expense |
1,552 | |||
| Add: Principal collections on direct finance leases |
— | |||
| Add: Pro-rata share of the Adjusted EBITDA from unconsolidated entities |
— | |||
| Less: Equity in earnings of unconsolidated entities |
— | |||
| Less: Non-controlling share of Adjusted EBITDA (2) |
(2,251 | ) | ||
|
|
|
|||
| Adjusted EBITDA |
$ | (620 | ) | |
|
|
|
|||
| (2) | Non-controlling share of Adjusted EBITDA is comprised of the following items for the years ended December 31, 2014: (i) equity-based compensation of $454, (ii) provision for income taxes of $71, (iii) interest expense of $621, (iv) depreciation and amortization expense of $1,105. |
Jefferson Terminal is a new reportable segment for the Company in 2014. Total revenue of $3,977 in 2014 relates to revenue generated from Jefferson Terminal. Revenue was comprised of $2,652 in terminal services revenue and $1,325 in lease income from tank railcars purchased and subsequently leased in 2014.
Total expenses of $18,904 in 2014 were comprised of (i) operating expenses of $9,095 incurred in connection with terminal operations and construction management, including $1,137 of equity-based compensation expense (ii) acquisition and transaction costs of $5,494 incurred in connection with the due diligence and consummation of the purchase of Jefferson Terminal, (iii) amortization expense related to acquired customer relationships of $1,180 (iv) depreciation expense of $1,583 related to tank railcars and property, plant and equipment placed into service during 2014, and (v) interest expense of $1,552 related to term debt used to finance the purchase of Jefferson Terminal, as well as amounts outstanding on previously issued municipal bonds.
Net loss attributable to members was in $9,599 in 2014, driven by the changes discussed above.
Adjusted Net Loss was $3,209. In addition to the changes in Net loss attributable to members noted above, this was impacted by equity-based compensation expense and acquisition and transaction expenses incurred in connection with the due diligence and consummation of the purchase of Jefferson Terminal.
Adjusted EBITDA was $(620) in 2014. In addition to the changes in Net loss attributable to members noted above, this was impacted by acquisition and transaction expenses incurred in connection with the due diligence and consummation of the purchase of Jefferson Terminal and depreciation and amortization expense related to acquired customer relationships, tank railcars and property, plant and equipment placed into service during 2014.
88
Table of Contents
Railroad Segment
The following table presents our results of operations and reconciliation of Net Loss attributable to members to Adjusted Net Loss in 2014 for the Railroad segment:
| Year Ended December 31, 2014 |
||||
| (in thousands) | ||||
| Revenues |
||||
| Infrastructure revenues |
||||
| Rail revenues |
$ | 9,969 | ||
|
|
|
|||
| Total infrastructure revenues |
9,969 | |||
|
|
|
|||
| Total revenues |
$ | 9,969 | ||
|
|
|
|||
| Expenses |
||||
| Operating expenses |
15,104 | |||
| Acquisition and transaction expenses |
5,646 | |||
| Depreciation and amortization |
989 | |||
| Interest expense |
187 | |||
|
|
|
|||
| Total expenses |
$ | 21,926 | ||
|
|
|
|||
| Net Loss attributable to members |
$ | (11,957 | ) | |
|
|
|
|||
| Add: Provision for income taxes |
— | |||
| Add: Equity-based compensation expense |
128 | |||
| Add: Acquisition and transaction expenses |
5,646 | |||
| Add: Losses on the modification or extinguishment of debt and capital lease obligations |
— | |||
| Add: Changes in fair value of non-hedge derivative instruments |
— | |||
| Add: Asset impairment charges |
— | |||
| Add: Pro-rata share of Adjusted Net Income from unconsolidated entities |
— | |||
| Less: Cash tax payments |
— | |||
| Less: Equity in earnings of unconsolidated entities |
— | |||
| Less: Non-controlling share of Adjusted Net Income |
|
— |
| |
|
|
|
|||
| Adjusted Net Loss |
$ | (6,183 | ) | |
|
|
|
|||
The following table sets forth a reconciliation of Net Loss attributable to members to Adjusted EBITDA in 2014 for the Railroad segment:
| Year Ended December 31, 2014 |
||||
| (in thousands) | ||||
| Net Loss attributable to members |
$ | (11,957 | ) | |
| Add: Provision for income taxes |
— | |||
| Add: Equity-based compensation expense |
128 | |||
| Add: Acquisition and transaction expenses |
5,646 | |||
| Add: Losses on the modification or extinguishment of debt and capital lease obligations |
— | |||
| Add: Changes in fair value of non-hedge derivative instruments |
— | |||
| Add: Asset impairment charges |
— | |||
| Add: Depreciation & amortization expense |
989 | |||
| Add: Interest expense |
187 | |||
| Add: Principal collections on direct finance leases |
— | |||
| Add: Pro-rata share of the Adjusted EBITDA from unconsolidated entities |
— | |||
| Less: Equity in earnings of unconsolidated entities |
— | |||
| Less: Non-controlling share of Adjusted EBITDA |
— | |||
|
|
|
|||
| Adjusted EBITDA |
$ | (5,007 | ) | |
|
|
|
|||
89
Table of Contents
Railroad is a new reportable segment for the Company in 2014. Total revenue of $9,969 in 2014 relates to revenue generated from CMQR since its acquisition during the second quarter of 2014. Revenue was driven by (i) $8,172 in freight rail revenue, (ii) $1,620 in switching & miscellaneous rail revenue, (iii) $171 in car hire income, and (iv) $6 of revenue for ancillary services provided to customers.
Total expenses of $21,926 in 2014 were comprised of (i) operating expenses of $15,104 incurred in connection with railroad operations, (ii) acquisition and transaction costs of $5,646 incurred in connection with the due diligence and consummation of the purchase of CMQR, (iii) depreciation expense of $962 related to property, plant, and equipment placed into service in 2014, (iv) amortization expense of $27 related to acquired customer relationships, and (v) interest expense of $187 related to borrowings under the CMQR Credit Agreement used to finance construction and improvements to the railroad.
Net loss attributable to members was $11,957 in 2014, driven by the changes discussed above.
Adjusted Net Loss was $6,183. In addition to the changes in Net loss attributable to members noted above, this was impacted by acquisition and transaction expenses incurred in connection with the due diligence and consummation of the purchase of CMQR.
Adjusted EBITDA was $(5,007) in 2014. In addition to the changes in Net loss attributable to members noted above, this was impacted by acquisition and transaction expenses incurred in connection with the due diligence and consummation of the purchase of CMQR, and depreciation and amortization expense related to property, plant, and equipment placed into service in 2014.
Corporate
The following table presents our results of operations and reconciliation of Net Loss attributable to members to Adjusted Net Loss in 2014 as compared to 2013 for Corporate:
| Year Ended December 31, 2014 |
Year Ended December 31, 2013 |
Increase (Decrease) |
||||||||||
| (in thousands) | ||||||||||||
| Expenses |
||||||||||||
| General and administrative |
$ | 2,007 | $ | 805 | $ | 1,202 | ||||||
| Acquisition and transaction expenses |
310 | 260 | 50 | |||||||||
| Management fees to affiliate |
5,463 | 2,211 | 3,252 | |||||||||
| Interest expense |
45 | 13 | 32 | |||||||||
|
|
|
|
|
|
|
|||||||
| Total expenses |
7,825 | 3,289 | 4,536 | |||||||||
|
|
|
|
|
|
|
|||||||
| Net Loss attributable to members |
$ | (7,825 | ) | $ | (3,289 | ) | $ | (4,536 | ) | |||
|
|
|
|
|
|
|
|||||||
| Add: Provision for income taxes |
— | — | — | |||||||||
| Add: Equity-based compensation expense |
— | — | — | |||||||||
| Add: Acquisition and transaction expenses |
310 | 260 | 50 | |||||||||
| Add: Losses on the modification or extinguishment of debt and capital lease obligations |
— | — | — | |||||||||
| Add: Changes in fair value of non-hedge derivative instruments |
— | — | — | |||||||||
| Add: Asset impairment charges |
— | — | — | |||||||||
| Add: Pro-rata share of Adjusted Net Income from unconsolidated entities |
— | — | |
— |
| |||||||
| Less: Cash tax payments |
(1 | ) | — | (1 | ) | |||||||
| Less: Equity in earnings of unconsolidated entities |
— | — | — | |||||||||
| Less: Non-controlling share of Adjusted Net Income |
— | — | — | |||||||||
|
|
|
|
|
|
|
|||||||
| Adjusted Net Loss |
$ | (7,516 | ) | $ | (3,029 | ) | $ | (4,487 | ) | |||
|
|
|
|
|
|
|
|||||||
90
Table of Contents
The following table sets forth a reconciliation of Net Loss attributable to members to Adjusted EBITDA in 2014 as compared to 2013 for Corporate:
| Year Ended December 31, 2014 |
Year Ended December 31, 2013 |
Increase (Decrease) |
||||||||||
| (in thousands) | ||||||||||||
| Net Loss attributable to members |
$ | (7,825 | ) | $ | (3,289 | ) | $ | (4,536 | ) | |||
| Add: Provision for income taxes |
— | — | — | |||||||||
| Add: Equity-based compensation expense |
— | — | — | |||||||||
| Add: Acquisition and transaction expenses |
310 | 260 | 50 | |||||||||
| Add: Losses on the modification or extinguishment of debt and capital lease obligations |
— | — | — | |||||||||
| Add: Changes in fair value of non-hedge derivative instruments |
— | — | — | |||||||||
| Add: Asset impairment charges |
— | — | — | |||||||||
| Add: Depreciation & amortization expense |
— | — | — | |||||||||
| Add: Interest expense |
45 | 13 | 32 | |||||||||
| Add: Principal collections on direct finance leases |
— | — | — | |||||||||
| Add: Pro-rat a share of the Adjusted EBITDA from unconsolidated entities |
— | — | — | |||||||||
| Less: Equity in earnings of unconsolidated entities |
— | — | — | |||||||||
| Less: Non-controlling share of Adjusted EBITDA |
— | — | — | |||||||||
|
|
|
|
|
|
|
|||||||
| Adjusted EBITDA |
$ | (7,470 | ) | $ | (3,016 | ) | $ | (4,454 | ) | |||
|
|
|
|
|
|
|
|||||||
In Corporate, total expenses increased by $4,536 in 2014 compared to 2013 mainly due to an increase in management fees of $3,252 attributable to an increase in the weighted average contributed capital, higher professional fees of $1,202, an increase in costs for abandoned transaction opportunities of $50, as well as additional interest expense of $32 related to an increase in the amount of short term borrowings from an affiliate.
Net loss attributable to members increased by $4,536, to $7,825 in 2014 as compared to $3,289 in 2013, driven by the changes discussed above.
Adjusted Net Loss was $7,516 in 2014 as compared to $3,029 in 2013, an increase of $4,487. In addition to the changes in Net loss attributable to members noted above, this was impacted by higher acquisition and transaction expenses incurred for potential acquisition opportunities in 2014, which is excluded from Adjusted Net Loss.
Adjusted EBITDA was $(7,470) in 2014 as compared to $(3,016) in 2013, a decrease of $4,454. In addition to the changes in Net loss attributable to members noted above, the decrease was driven by higher acquisition and transaction expenses incurred for potential acquisition opportunities in 2014 and interest expense.
Transactions with Affiliates and Affiliated Entities
We have entered into a Management Agreement with our Manager, an affiliate of Fortress, effective upon completion of this offering, pursuant to which our Manager provides for the day-to-day management of our operations. Our Management Agreement requires our Manager to manage our business affairs in conformity with a broad asset acquisition strategy adopted and monitored by our board of directors. From time to time, we may engage (subject to our strategy) in material transactions with our Manager or another entity managed by our Manager or one of its affiliates or other affiliates of Fortress, which may include, but are not limited to, certain financing arrangements, acquisition of assets, acquisition of debt obligations, debt, co-investments, and other assets that present an actual, potential or perceived conflict of interest. See “Risk Factors—Risks Related to Our Manager,” “Our Manager and Management Agreement and Other Compensation Arrangements” and “Certain Relationships and Related Party Transactions” included elsewhere in this prospectus.
91
Table of Contents
Liquidity and Capital Resources
Our principal uses of liquidity have been (i) acquisitions of transportation infrastructure and equipment, (ii) distributions to our partners, (iii) expenses associated with our operating activities, and (iv) debt service obligations associated with our investments (all dollar amounts are expressed in thousands).
| • | In 2014 and 2013, cash used for the purpose of making investments was $543,853 and $129,853, respectively. |
| • | In 2014 and 2013, distributions to members were $75,999 and $39,631, respectively. |
| • | Uses of liquidity associated with our operating expenses are captured on a net basis in our cash flows from operating activities. Uses of liquidity associated with our debt obligations are captured in our cash flows from financing activities. |
Our principal sources of liquidity to fund these uses have been (i) revenues from our infrastructure and equipment assets (including finance lease collections and maintenance reserve collections) after operating expenses, (ii) borrowings, (iii) distributions received from unconsolidated investees, (iv) proceeds from the sale of assets, and (v) capital contributions from our members.
| • | During 2014 and 2013, cash flows from operating activities, plus the principal collections on finance leases and maintenance reserve collections were $(16,296) and $20,993, respectively. |
| • | During 2014, additional borrowings of $179,569 were obtained in connection with the Jefferson Terminal Facility of $100 million, the FTAI Pride Credit Agreement of $75 million, and the CMQR Credit Agreement of $10.0 million and we made total principal repayments of $31,131. During 2013, additional borrowings of $24,774 were obtained in connection with a note payable to the non-controlling interest in one of our consolidated subsidiaries of $3,225 and a bank loan obtained in connection with our acquisition of an additional portfolio of shipping containers of $21,549 and we made total principal repayments of $7,377. |
| • | During 2014 and 2013, we received $17,271 and $13,224 in cash distributions from our unconsolidated investees, respectively, of which $8,207 and $8,713 were included in cash flows from operating activities, respectively. |
| • | During 2014 and 2013, proceeds from the sale of assets were $37,074 and $30,434, respectively. |
| • | During 2014 and 2013, capital contributions from members were $490,747 and $94,819, respectively. As of December 31, 2014, we had a total of $402,194 of capital availability remaining under our partnership agreements (including $105,885 of prior distributions subject to recall pursuant to the terms of the Partnership Agreement). Prior to the consummation of this offering, we have received approximately $49,473 of net equity capital since December 31, 2014, and we expect to have caused our limited partners to contribute $201,920 of such remaining capital. Following the consummation of this offering, we will no longer be entitled to any capital contributions from our partners. |
As of December 31, 2014, planned capital expenditures for the Company and its subsidiaries for the next 12 months totaled approximately $105 million, occurring primarily at the Jefferson Terminal segment. The Company expects to fund a portion of its share of the capital expenditures with approximately $49 million of net equity capital received from its limited partners since December 31, 2014 (exclusive of the $201.9 million in capital the Company has called prior to this offering). The remaining amounts are expected to be funded by both borrowings and contributions from non-controlling interest holders.
92
Table of Contents
In addition, the Company is currently evaluating over $1.5 billion of potential Infrastructure and Equipment Leasing transactions which could occur within the next 12 months. See “Summary—Recent Developments—Acquisition Pipeline.” However, as of the date of this prospectus, none of the above-referenced pipeline transactions or negotiations are definitive or included within our planned liquidity needs of the Company.
Historical Cash Flow
Comparison of the years ended December 31, 2014 and December 31, 2013
The following table compares the historical cash flow for the years ended December 31, 2014 and December 31, 2013.
| Year Ended December 31, 2014 |
Year Ended December 31, 2013 |
|||||||
| (in thousands) | ||||||||
| Cash Flow Data: |
||||||||
| Net cash (used in) provided by operating activities |
$ | (31,551 | ) | $ | 11,913 | |||
| Net cash used in investing activities |
(571,416 | ) | (87,765 | ) | ||||
| Net cash provided by financing activities |
617,856 | 78,964 | ||||||
Net cash used in operating activities was $31,551 in 2014 and cash provided by operating activities was $11,913 in 2013, representing a $43,464 decrease. Net income was $2,918 at December 31, 2014, compared to $25,279 at December 31, 2013, a decrease of $22,361. The decrease in net cash provided by operating activities was primarily due to an increase in cash used in accounts payable and accrued liabilities of $46,792 due to the expansion of our business specifically with the acquisitions of Jefferson and CMQR during 2014. Accounts receivable increased by $4,603 related to an increase in our customer base due to the purchase of equipment held for lease, and the acquisitions of the Jefferson Terminal and CMQR. Offsetting the decrease was an increase in non-cash adjustments to reconcile net income which include an increase of (i) $12,089 relating to depreciation and amortization, (ii) $2,694 of amortization of lease intangibles, (iii) $4,232 in equity in earnings of unconsolidated entities, (iv) $1,265 of equity based compensation and (v) $6,144 of gain on the sale of an unconsolidated entity in 2013. Offsetting these increases was a decrease in the gain on sale of equipment of $5,161 due to additional sales of equipment in 2014 as compared to 2013.
Net cash used in investing activities was $571,416 and $87,765 in 2014 and 2013, respectively, representing a $483,651 increase. The increased use in cash for investing was driven by the number of investments made in 2014 versus 2013 as we continue to execute our business plan. In 2014, acquisitions of leasing equipment, Jefferson Terminal, and CMQR resulted in cash outflows of $387,118, $47,811 and $11,308, respectively, as compared to cash outflows for 2013 acquisitions of leasing equipment of $88,045 and acquisition of finance leases of $41,808. In conjunction with Jefferson Terminal, the Company previously funded term loans and other receivables of $97,616 in 2014. Acquisitions of property plant and equipment increased cash outflows in 2014 by $49,441 due to the continued expansion and development of CMQR and Jefferson Terminal. Acquisition of lease intangibles resulted in cash outflows in 2014 of $20,435 as compared to $0 in 2013, due to the acquisition of aircraft with in place leases. The deposit paid for the purchase of the MT6015 vessel resulted in a cash outflow of $7,450 as compared to $0 in 2013, a result of the formation of a new joint venture in the Offshore Energy segment in 2014. During 2014, cash outflows further increased by the funding of an escrow account of $1,000 as part of the acquisition of equipment held for lease. In addition, the funding of restricted cash balances increased by $6,186 in 2014 as compared to 2013 in connection with the requirements of the Jefferson Terminal Credit Agreement. Cash inflows aggregating $58,069 were generated in 2014 compared to $43,208 in 2013, reflecting principal collections from direct finance leases, proceeds from the sale of assets and return of capital from unconsolidated entities.
Net cash provided by financing activities was $617,856 and $78,964 in 2014 and 2013, respectively, representing a $538,892 increase. Such increase was attributable to (i) an increase in capital contributions from members of $395,928, offset by an increase in capital distributions to members of $36,368, (ii) an increase in
93
Table of Contents
capital contributions of $54,523 attributable to non-controlling interests in 2014, offset by an increase in capital distributions to non-controlling interests of $244, (iii) an increase in proceeds from borrowings, net of repayments, of $131,041 and (iv) a decrease in cash received from the receipt of maintenance deposits net of releases of $519. These increases were offset by a decrease in cash received for security deposits net of returns of $902 and cash outflows relating to the payment of financing fees of $4,610.
Liquidity
Funds Available for Distribution (“FAD”) is not a financial measure prepared in accordance with GAAP. The Company uses FAD in evaluating its ability to meet its stated dividend policy as described in the prospectus. The Company believes that FAD will be a useful metric for investors and analysts for similar purposes. However, as described below, FAD is subject to a number of limitations and assumptions and there can be no assurance that the Company will generate FAD sufficient to meet its intended dividends. The GAAP measure most directly comparable to FAD is net cash (used in) provided by operating activities.
Definition
The Company defines FAD as:
| • | cash from operating activities |
| • | plus: |
| ¡ | principal collections on finances leases, |
| ¡ | proceeds from the sale of assets, and |
| ¡ | return of capital distributions from unconsolidated entities, |
| • | less: |
| ¡ | payments on debt, and |
| ¡ | capital distributions to non-controlling interests, and |
| • | excluding changes in working capital. |
| Year Ended December 31, 2014 |
Year Ended December 31, 2013 |
|||||||
| (amounts in thousands except for share and per share data) |
||||||||
| Cash from Operating Activities |
$ | (31,551 | ) | $ | 11,913 | |||
| Add: Principal Collections on Finance Leases |
11,931 | 8,263 | ||||||
| Add: Proceeds from the Sale of Assets |
37,074 | 30,434 | ||||||
| Add: Return of Capital Distributions from Unconsolidated Entities |
9,064 | 4,511 | ||||||
| Less: Payments on Debt |
(31,131 | ) | (7,377 | ) | ||||
| Less: Capital Distributions to Non-Controlling Interests |
(565 | ) | (321 | ) | ||||
| Exclude: Changes in Working Capital |
50,440 | 7,229 | ||||||
|
|
|
|
|
|||||
| Funds Available for Distribution (FAD) |
$ | 45,262 | $ | 54,652 | ||||
|
|
|
|
|
|||||
| Unaudited FAD per share, basic and diluted, as adjusted for the Distribution |
0.85 | 1.02 | ||||||
| Unaudited quarterly average FAD per share, basic and diluted, as adjusted for the Distribution |
0.21 | 0.26 | ||||||
| Unaudited weighted average shares outstanding, basic and diluted, as adjusted for the Distribution |
53,502,873 | 53,502,873 | ||||||
For the years ended December 31, 2014 and 2013, capital distributions to members were approximately $76.0 million and $39.6 million, respectively.
94
Table of Contents
Limitations
FAD has material limitations as a liquidity measure of the Company because such measure excludes items that are required elements of the Company’s net cash (used in) provided by operating activities as described below. You should not consider FAD in isolation or as a substitute for analysis of the Company’s results of operations under GAAP and it is not the only metric that you should consider when evaluating the Company’s ability to meet its stated dividend policy. Specifically:
| • | FAD does not include equity capital called from the Company’s existing limited partners, proceeds from this offering, proceeds from any debt issuance or future equity offering, historical cash and cash equivalents and expected investments in the Company’s operations. |
| • | FAD does not give pro forma effect to prior acquisitions, certain of which cannot be quantified. For example, FAD does not give pro forma effect to our acquisition of the Jefferson Terminal because the terminal was not fully operational when we purchased it and is currently in the process of significantly ramping up its operations. As a result, the historical performance of the Jefferson Terminal is not indicative of potential future results. In addition, FAD does not give pro forma effect to our acquisition of CMQR because we purchased CMQR out of bankruptcy when the railway was not fully operational, and the railway is currently in the process of ramping up its operations. As a result, the historical performance of the CMQR is not indicative of potential future results. |
| • | While FAD reflects the cash inflows from the sale of certain assets, FAD does not reflect the cash outflows to acquire the assets as the Company relies on alternative sources of liquidity to fund such purchases. |
| • | FAD does not reflect expenditures related to capital expenditures, acquisitions and other investments as the Company has multiple sources of liquidity and intends to fund these expenditures with the net proceeds from this offering, future incurrences of indebtedness, additional capital contributions and/or future issuances of equity. |
| • | FAD does not reflect any maintenance capital expenditures necessary to maintain the same level of cash generation from our capital investments. |
| • | FAD does not reflect changes in working capital balances as management believes that changes in working capital are primarily driven by short term timing differences which are not meaningful to the Company’s distribution decisions. |
| • | Management has significant discretion to make distributions and the Company is not bound by any contractual provision that requires it to use cash for distributions. |
If such factors were included in FAD, there can be no assurance that the results would be consistent with the Company’s presentation of FAD. For example, the Company’s 2014 acquisitions of Jefferson Terminal and CMQR in our Infrastructure Business would have had a negative impact on 2014 FAD, as both generated negative operating results, had such acquisitions been consummated at the beginning of the year.
Intended Second Quarter Dividend Critical Assumptions
For the second quarter of 2015, the Company intends to pay a dividend of $0.33 per share, which will be pro-rated for the period from the consummation of this offering to the end of the quarter and paid in the third quarter of 2015. The Company has historically not generated sufficient funds available for distribution to support this payout amount and there can be no assurance that the Company will be able to meet its goals.
The shortfall between our historical funds available for distribution and our intended second quarter dividend of $0.33 per share primarily relates to fewer owned assets in our Equipment Leasing Business and negative operating performance in our Infrastructure Business during historical periods presented below.
| Historical FAD per share | ||||||||||
| Three Months Ended March 31, 2015 |
2014 Quarterly Average |
2013 Quarterly Average |
||||||||
| 0.25 to 0.27 | (1) | 0.21 | (1) | 0.26 | (1) | |||||
95
Table of Contents
| (1) | Per share amount calculated using unaudited weighted average shares outstanding, as adjusted for the Distribution, of 53,502,873 |
After giving effect to the Distribution and this offering, our total shares outstanding will be 73.5 million, and our annualized dividend based on the intended payout of $0.33 per share per quarter will be approximately $97 million.
For the first quarter 2015, assuming the mid-point of our range for FAD excluding the impact of the Jefferson Terminal segment, our existing assets generated approximately $18.4 million in FAD, or $73.6 million on an annualized basis, and we expect this number to grow to approximately $80.0 million, or $0.27 per share per quarter, based on increased utilization levels in our Aviation Leasing segment.
We expect that the utilization level of our Jefferson Terminal will increase from its current level of approximately 10% to between 50% and 70%, or to 1.5 – 2 trains per day and at rates consistent with our existing take-or-pay contract. At this level of utilization and rates, we would expect Jefferson Terminal to contribute approximately $23 million to $37 million of FAD, distributions of which are limited to not more than $10 million per any calendar year (or $25 million in the aggregate during the term of the facility) pursuant to the terms of the Jefferson Terminal Credit Agreement.
Similarly, we believe that the performance of CMQR will improve and we currently expect that CMQR will generate $25 million to $30 million in revenue on an annualized basis and will contribute approximately $7.0- $8.5 million of additional FAD. These two sources of FAD are expected to generate at least $30 million of FAD, or $0.10 per share per quarter (or $0.06 per share per quarter if distributions are limited to not more than $10 million per calendar year pursuant to the terms of the Jefferson Terminal Credit Agreement).
Assumptions are inherently uncertain and there can be no assurance that actual results will not differ from the assumptions set forth above.
In addition to the factors outlined above, the Company’s ability to pay this dividend is subject to certain critical assumptions, including:
| • | Existing investments in our Equipment Leasing Business continue to generate returns generally consistent with prior performance. |
| • | Improved performance in our Infrastructure Business, including the Jefferson Terminal and CMQR. |
| • | An increase in FAD versus historical amounts and our ability to generate FAD consistent with our intended payout. In prior periods we have generated FAD less than our projections and funded shortfalls in part with proceeds from equity and debt financings. |
| • | The continued availability of alternative sources of liquidity. |
Debt Obligations
The debt agreements to which our subsidiaries are a party include customary terms and conditions, including covenants and representations and warranties. These agreements restrict, among other things, the ability of our subsidiaries that are party to such agreements and their respective subsidiaries to incur indebtedness, create liens on property, make investments or distributions, or dispose of assets.
Under such debt agreements, certain events, including non-payment of principal or interest, bankruptcy or insolvency, or a breach of a covenant or a representation or warranty may constitute an event of default and trigger an acceleration of payments.
Container Loan #1
On December 27, 2012, a subsidiary of the company entered into a Credit Agreement (“Container Loan #1”) with a bank for an initial aggregate amount of approximately $55.9 million. Borrowings under the loan bear
96
Table of Contents
interest at a rate selected by the Company of either (i) a LIBOR based rate plus a spread of 3.75% or (ii) a Base Rate equal to the higher of the Prime Rate or the Federal Funds Rate plus 1.50%, plus a spread of 3.75%.
Container Loan #1 requires monthly payments of interest and scheduled principal payments through its maturity. It can be prepaid without penalty after December 27, 2015. At December 31, 2014, the outstanding principal amount of the indebtedness under Container Loan #1 was approximately $42.0 million. Container Loan #1 is secured on a first priority basis by the Company’s interests in the shipping containers financed by Container Loan #1 and its related direct finance leases. Container Loan #1 contains negative covenants which limit certain actions of the borrowers.
Upon the occurrence and during the continuance of an event of default under Container Loan #1, principal, interest and any fees or other amounts owed under Container Loan #1 bear interest at a rate that is 2% per annum in excess of the interest rate otherwise payable with respect to such amounts. As of December 31, 2014, our subsidiaries were in compliance with all of the covenants under this agreement.
Container Loan #2
On August 15, 2013, a subsidiary of the Company, entered into a Credit Agreement (“Container Loan #2”) with a bank for an initial aggregate amount of approximately $21.5 million in connection with the acquisition of a portfolio of shipping containers and related equipment subject to direct finance leases. Borrowings under Container Loan #2 bear interest at a rate of LIBOR plus a spread of 3.25%.
Container Loan #2 requires quarterly payments of interest and scheduled principal payments through its maturity and can be prepaid without penalty at any time. At December 31, 2014, the outstanding principal amount of the indebtedness under Container Loan #2 was approximately $19.1 million. Container Loan #2 is secured on a first priority basis by the Company’s interests in the shipping containers financed by the Container Loan #2 and its related direct finance leases. Container Loan #2 contains negative covenants which limit certain actions of the borrowers.
Upon the occurrence and during the continuance of an event of default under the Container Loan #2, principal, interest and any fees or other amounts owed under the Container Loan #2 bear interest at a rate that is 2.5% per annum in excess of the interest rate otherwise payable with respect to such amounts. As of December 31, 2014, our subsidiaries were in compliance with all of the covenants under this agreement.
Jefferson Terminal Credit Agreement
On August 27, 2014, Jefferson Gulf Coast Energy Partners LLC, a subsidiary of the Company, entered into a credit agreement (the “Jefferson Terminal Credit Agreement”) with a financial institution for an aggregate amount of $100.0 million. Borrowings under the Jefferson Terminal Credit Agreement bear interest, at the Company’s option, at the Adjusted Eurodollar Rate plus a spread of 8.00% or at a Base Rate plus a spread of 7.00%. At December 31, 2014, borrowings under the Jefferson Terminal Credit Agreement bore interest at a rate of 9.00%. The Jefferson Terminal Credit Agreement provides for a prepayment premium of 3% of the aggregate principal amount prepaid, including repayment at maturity (the “exit fee”).
The Jefferson Terminal Credit Agreement requires quarterly payments of $0.25 million beginning with the quarter ending December 31, 2014, with such quarterly payments increasing to $1.25 million beginning with the quarter ending December 31, 2016, and may be prepaid or repaid at any time prior to its maturity on February 28, 2018. At December 31, 2014, the outstanding principal amount of the indebtedness under the Jefferson Terminal Credit Agreement was approximately $99.8 million.
The Jefferson Terminal Credit Agreement is secured on a first priority basis by substantially all assets of Jefferson Terminal, with certain exceptions. The Jefferson Terminal Agreement contains affirmative and negative covenants which limit certain actions of the borrowers. In addition, the Jefferson Terminal Credit Agreement contains a financial covenant requiring Consolidated EBITDA of Jefferson Gulf Coast Energy Holdings, LLC and its subsidiaries to be at least $30.0 million in any rolling twelve month period beginning with December 31, 2015. At December 31, 2014, the Company was in compliance with all covenants under the Jefferson Terminal Agreement.
97
Table of Contents
The Jefferson Terminal Credit Agreement contains a restricted payment covenant that restricts the Jefferson parties to the agreement and their subsidiaries from making distributions to us unless (a) the Jefferson Group Members (as defined in such agreement) would, on a pro forma basis after giving effect to such restricted payment, have a total debt leverage ratio of not more than 2.50 to 1.00 and (b) such distributions do not exceed $10 million in any calendar year or $25 million in the aggregate during the term of the Jefferson Terminal Credit Agreement. This restriction is subject to a number of other exceptions, including, among others, an exception for (a) issuances of equity to management not in excess of $2 million in any calendar year (with unused amounts in any calendar year being carried over to succeeding calendar years), (b) exceptions for activities otherwise permitted by the Jefferson Terminal Credit Agreement, to the extent such activities constitute a restricted payment, (c) exceptions for payments made with respect to (i) operating costs and expenses of FTAI Energy Partners LLC incurred in the ordinary course of business, other corporate overhead costs and expenses of FTAI Energy Partners LLC, (ii) taxes, (iii) permitted tax distributions, (iv) financing for certain permitted investments, (v) salary, bonus and other benefits payable to officers and employees of parent and any other director or indirect parent company of Jefferson Gulf Coast Energy Holdings LLC to the extent related to the ownership or operation of Jefferson Gulf Coast Energy Holdings LLC, and (vi) fees and expenses related to any unsuccessful equity or debt offering by Parent that is directly attributable to the operations of Jefferson Gulf Coast Energy Holdings LLC, Jefferson Gulf Coast Energy Partners LLC or their subsidiaries. As a result of these restrictions, Jefferson Gulf Coast Energy Partners LLC may only make limited distributions to us, if any, which in turn limits the availability of cash from Jefferson that we may use to make distributions to our shareholders.
Series 2010 Bonds
On December 1, 2010, Jefferson County Industrial Development Corporation issued $300.0 million of its Series 2010 Bonds, which provided tax-exempt financing for businesses, to be used for specific purposes to stimulate the economy of the respective beneficiary counties. The proceeds of this issuance were loaned to Jefferson Terminal, to be held in trust as restricted cash, to ensure adherence to the restrictions of use of the funds. Use of the proceeds requires approval from a trustee prior to release of funds.
In accordance with the terms of the trust indenture and security agreements, Series 2010 Bonds can be tendered by bondholders and purchased by the Company using the unused restricted cash proceeds. Series 2010 Bonds purchased by the Company are deemed to be owned by the Company, and are classified as assets, tendered bonds, in the Consolidated Balance Sheet with an equal corresponding amount as debt, as Series 2010 bonds owned by the Company are not deemed extinguished or cancelled. Tendered bonds do not convey principal or interest payments while held by the Company. During the year ended December 31, 2014, $2.0 million of principal was repaid related to the Series 2010 Bonds and the remaining $298.0 million of principal was tendered by the bondholders and purchased by the Company utilizing unused restricted cash proceeds. As of December 31, 2014, in the Consolidated Balance Sheet, the Company has $298.0 million of Tendered Bonds and an equal corresponding amount in Debt.
The Series 2010 bonds have a stated maturity date of December 1, 2040, currently bear interest at a rate of 0.6% per year, and the principal amount is due at maturity. At December 31, 2014, the Company was in compliance with all the covenants under the Series 2010 Bonds.
Series 2012 Bonds
On August 1, 2012, Jefferson County Industrial Development Corporation issued $46.9 million of its Series 2012 Bonds to specifically fund construction and operation of an intermodal transfer facility for crude oil and refined petroleum products. The proceeds of this issuance were loaned to Jefferson Terminal, to be held in trust as restricted cash, to ensure adherence to the restrictions of use of the funds. Use of the proceeds requires approval from a trustee prior to release of funds. Such restricted cash may only be released to us after payment of applicable reserves, including a six-month interest reserve, and expenses, as determined by the trustee.
In connection with the Company’s acquisition of Jefferson Terminal, the Series 2012 Bonds were recorded at a fair value of $48.5 million and the premium is being amortized using the effective interest method over the remaining contractual term of the Series 2012 Bonds. As of December 31, 2014, $46.7 million of original principal on the Series 2012 Bonds remained outstanding.
98
Table of Contents
The Series 2012 Bonds have a stated maturity of July 1, 2032, bear interest at 8.25%, and require scheduled principal payments. The principal of the Series 2012 Bonds are payable annually at varying amounts. At December 31, 2014, the Company was in compliance with all the covenants under the Series 2012 Bonds.
FTAI Pride Credit Agreement
On September 15, 2014, FTAI Pride, LLC, (“FTAI Pride”) a subsidiary of the Company entered into a credit agreement (the “FTAI Pride Credit Agreement”) with a bank in respect of a term loan in an aggregate
amount of $75.0 million. The loan proceeds were used in connection with the acquisition of an advanced offshore construction vessel. Borrowings under the FTAI Pride Credit Agreement bear interest at the LIBOR rate plus a spread of 4.50%. At December 31, 2014, borrowings under the FTAI Pride Credit Agreement bore interest at a rate of 4.74%.
The FTAI Pride Credit Agreement requires quarterly payments of interest and scheduled principal payments of $1.6 million beginning in the quarter ending December 31, 2014, through its maturity and can be prepaid without penalty at any time. At December 31, 2014, the outstanding principal amount of indebtedness under the FTAI Pride Credit Agreement was approximately $73.4 million.
The FTAI Pride Credit Agreement is secured on a first priority basis by the offshore construction vessel and charter. The FTAI Pride Credit Agreement contains affirmative and negative covenants which limit certain actions of the borrower and a financial covenant requiring a Fixed Charges Coverage Ratio (as defined by the FTAI Pride Credit Agreement) of FTAI Pride of not less than 1.15:1.00 in any twelve month period ending December 31, 2014, or later. At December 31, 2014, the Company was in compliance with all the covenants under the FTAI Pride Credit Agreement.
CMQR Credit Agreement
On September 18, 2014, CMQR entered into a credit agreement (the “CMQR Credit Agreement”) with a financial institution in respect of a revolving line of credit in an aggregate amount of $10.0 million. Borrowings under the CMQR Credit Agreement bear interest at either (i) Adjusted LIBOR plus a spread of 2.50% or 4.50%, (ii) the U.S or Canadian Base Rate plus a spread of 1.50% or 3.50%, or (iii) the Canadian Fixed Rate plus a spread of 2.50% or 4.50%, as each of those terms is defined by the CMQR Credit Agreement and the maturity date is September 18, 2017. Borrowings under the CMQR Credit Agreement bore interest at an average rate of 2.95% at December 31, 2014.
The CMQR Credit Agreement requires quarterly payments of interest. At December 31, 2014, the outstanding principal amount of indebtedness under the CMQR Credit Agreement was approximately $9.4 million.
The CMQR Credit Agreement is also indirectly supported by the Onshore and Offshore Funds (the “sponsors”). In the event of a default under the credit agreement, CMQR’s lenders can cause CMQR to call up to $20.0 million (subject to reduction of such amount to take into account capital contributions to CMQR) in capital from the sponsors, and in the event of CMQR’s bankruptcy, the lenders can put the debt back to the sponsors. The CMQR Credit Agreement contains affirmative and negative covenants which limit certain actions of CMQR and a financial covenant requiring a Fixed Charge Coverage Ratio as defined, of CMQR and its subsidiaries of not less than 1.30:1.00 in any rolling four-quarter period, effective after September 30, 2014. At December 31, 2014, the Company was in compliance with the covenants contained in the CMQR Credit Agreement.
Additional Future Liquidity
Following the consummation of this offering, we expect one or more of our subsidiaries to enter into a revolving credit agreement providing for an approximate $100 million in borrowing capacity, secured by certain of such subsidiaries’ aviation assets, on available market terms. No financial institutions have provided commitments with respect to any such financing and we cannot predict that our subsidiaries will be able to obtain such financing or that such financing will be available on market terms.
99
Table of Contents
Loan Payable to Non-Controlling Interest
In May 2013, in connection with the capitalization of a consolidated entity, the Company and the owner of the non-controlling interest loaned approximately $18.3 million and $3.2 million, respectively, to the entity in proportion to their respective ownership percentages of 85% and 15%. The loans bear interest at an annual rate of 5% and require monthly payments of principal and interest through their final maturity in May 2021. At December 31, 2014, the outstanding principal amount of the loan payable to non-controlling interest was approximately $2.6 million. The loan amount funded by the Company and related interest have been eliminated in consolidation.
Contractual Obligations
The following table summarizes our future obligations, by period due, as of December 31, 2014, under our various contractual obligations and commitments. We had no off-balance sheet arrangements as of December 31, 2014. The following table summarizes our commitments to settle contractual obligations in cash as of December 31, 2014:
| Payments Due by Period (in thousands) | ||||||||||||||||||||||||||||
| Total | 2015 | 2016 | 2017 | 2018 | 2019 | Thereafter | ||||||||||||||||||||||
| Container Loan #1 |
$ | 42,040 | $ | 7,279 | $ | 7,279 | $ | 27,482 | $ | — | $ | — | $ | — | ||||||||||||||
| Container Loan #2 |
19,115 | 7,763 | 7,385 | 452 | 3,515 | — | — | |||||||||||||||||||||
| Note payable to non-controlling interest |
2,587 | 403 | 403 | 403 | 403 | 403 | 572 | |||||||||||||||||||||
| FTAI Pride Credit Agreement |
73,438 | 6,250 | 6,250 | 6,250 | 6,250 | 48,438 | — | |||||||||||||||||||||
| CMQR Credit Agreement |
9,416 | — | — | 9,416 | — | — | — | |||||||||||||||||||||
| Jefferson Credit Agreement |
99,750 | 1,000 | 2,000 | 5,000 | 91,750 | — | — | |||||||||||||||||||||
| Jefferson Bonds Payable (1) |
344,730 | 1,220 | 1,320 | 1,425 | 1,545 | 1,670 | 337,550 | |||||||||||||||||||||
|
|
|
|
|
|
|
|
|
|
|
|
|
|
|
|||||||||||||||
| Total principal payments on loans and bonds payable |
591,076 | 23,915 | 24,637 | 50,428 | 103,463 | 50,511 | 338,122 | |||||||||||||||||||||
|
|
|
|
|
|
|
|
|
|
|
|
|
|
|
|||||||||||||||
| Total estimated interest payments (2) |
92,292 | 18,865 | 17,835 | 16,522 | 7,520 | 5,129 | 26,421 | |||||||||||||||||||||
| Operating lease obligations |
49,087 | 4,892 | 4,372 | 4,386 | 3,362 | 3,219 | 28,856 | |||||||||||||||||||||
|
|
|
|
|
|
|
|
|
|
|
|
|
|
|
|||||||||||||||
| Total contractual obligations |
$ | 732,455 | $ | 47,672 | $ | 46,844 | $ | 71,336 | $ | 114,345 | $ | 58,859 | $ | 393,399 | ||||||||||||||
|
|
|
|
|
|
|
|
|
|
|
|
|
|
|
|||||||||||||||
| (1) | Includes $298,000 of tendered bonds which do not convey principal or interest payments while held by the Company and excludes unamortized premium. |
| (2) | Estimated interest payments based on rates as of December 31, 2014; excludes interest payments on $298,000 of tendered bonds which do not convey interest while held by the Company. |
Quantitative and Qualitative Disclosures About Market Risk
Market risk represents the risk of changes in value of a financial instrument, caused by fluctuations in interest rates and foreign exchange rates. Changes in these factors could cause fluctuations in our results of operations and cash flows. We are exposed to the market risks described below.
Interest Rate Risk
Interest rate risk is the exposure to loss resulting from changes in the level of interest rates and the spread between different interest rates. Interest rate risk is highly sensitive to many factors, including the U.S. government’s monetary and tax policies, global economic factors and other factors beyond our control. We are exposed to changes in the level of interest rates and to changes in the relationship or spread between interest rates. Our primary interest rate exposure relates to our term loan arrangements.
Our borrowing agreements generally require payments based on a variable interest rate index, such as LIBOR. Therefore, to the extent our borrowing costs are not fixed, increases in interest rates may reduce our net income by increasing the cost of our debt without any corresponding increase in rents or cash flow from our
100
Table of Contents
finance leases. We manage our exposure to interest rate movements through the use of interest rate derivatives (interest rate swaps and caps). As a result, when market rates of interest change, there is generally not a material impact on our interest expense, future earnings or cash flows.
The following discussion about the potential effects of changes in interest rates is based on a sensitivity analysis, which models the effects of hypothetical interest rate shifts on our financial condition and results of operations. Although we believe a sensitivity analysis provides the most meaningful analysis permitted by the rules and regulations of the SEC, it is constrained by several factors, including the necessity to conduct the analysis based on a single point in time and by the inability to include the extraordinarily complex market reactions that normally would arise from the market shifts modeled. Although the following results of a sensitivity analysis for changes in interest rates may have some limited use as a benchmark, they should not be viewed as a forecast. This forward-looking disclosure also is selective in nature and addresses only the potential interest expense impacts on our financial instruments and, in particular, does not address the mark-to-market impact on our interest rate derivatives. It also does not include a variety of other potential factors that could affect our business as a result of changes in interest rates.
As of December 31, 2014, assuming we do not hedge our exposure to interest rate fluctuations related to our outstanding floating rate debt, a hypothetical 100-basis point increase/decrease in our variable interest rate on our borrowings would result in an interest expense increase/(decrease) of approximately $2.4 million and $(2.4 million), respectively, over the next twelve months before the impact of interest rate derivatives.
Through the use of an interest rate swap, we have reduced our exposure to interest rate changes with respect to 70% of the outstanding principal balance of Container Loan #1. Through the use of an interest rate cap, we have reduced our exposure to interest rate changes with respect to 50% of the outstanding principal balance of that portion of Container Loan #2 attributable to equipment which is subject to direct finance leases having a five year term (representing a notional amount of approximately $2.5 million at December 31, 2014).
Foreign Currency Exchange Risk
Our functional currency is U.S. dollars. All of our leasing arrangements are denominated in U.S. dollars. Currently, the majority of freight rail revenue is also denominated in U.S. dollars, but a portion is denominated in Canadian dollars. Although foreign exchange risk could arise from our and our lessees’ operations in multiple jurisdictions, we do not have significant exposure to foreign currency risk as our leasing arrangements are denominated in U.S. dollars. All of our purchase agreements are negotiated in U.S. dollars, and we currently receive the majority of revenue in U.S. dollars. We pay substantially all of our expenses in U.S. dollars; however we pay some expenses in Canadian dollars. Because we currently receive the majority of our revenues in U.S. dollars and pay substantially all of our expenses in U.S. dollars, we do not expect a change in foreign exchange rates would have a significant impact on our results of operations or cash flows.
Application of Critical Accounting Policies
Operating Leases
We lease equipment pursuant to net operating leases. Operating leases with fixed rentals and step rentals are recognized on a straight-line basis over the term of the initial lease, assuming no renewals. Revenue is not recognized when collection is not reasonably assured. When collectability is not reasonably assured, the customer is placed on non-accrual status and revenue is recognized when cash payments are received.
We also recognize lease revenue related to the portion of maintenance payments received from lessees of aviation equipment that are not expected to be reimbursed in connection with major maintenance events.
101
Table of Contents
Finance Leases
As of December 31, 2014, we lease shipping containers, and an anchor handling tug supply vessel subject to finance leases. These leases generally include a lessee obligation to purchase the leased equipment at the end of the lease term, a bargain purchase option, or provide for minimum lease payments with a present value of 90% or more of the fair value of the asset at the date of lease inception. Net investment in finance leases represents the minimum lease payments due from lessees, net of unearned income. The lease payments are segregated into principal and interest components similar to a loan. Unearned income is recognized on an effective interest method over the lease term and is recorded as finance lease income. The principal component of the lease payment is reflected as a reduction to the net investment in finance leases.
Maintenance Payments
Typically, under an operating lease of aviation equipment, the lessee is responsible for performing all maintenance and is generally required to make maintenance payments to the Company for heavy maintenance, overhaul or replacement of certain high-value components of the aircraft or engine. These maintenance payments are based on hours or cycles of utilization or on calendar time, depending on the component, and are generally required to be made monthly in arrears. If a lessee is making monthly maintenance payments, the Company would typically be obligated to reimburse the lessee for costs they incur for heavy maintenance, overhaul or replacement of certain high-value components to the extent of maintenance payments received in respect of the specific maintenance event, usually shortly following the completion of the relevant work.
The Company records the portion of maintenance payments paid by the lessee that is expected to be reimbursed as maintenance deposit liabilities on the consolidated balance sheet. Reimbursements made to the lessee upon the receipt of evidence of qualifying maintenance work are charged against the maintenance deposit liability.
Property, Plant and Equipment, Leasing Equipment and Depreciation
Property, plant and equipment and leasing equipment are stated at cost (inclusive of capitalized acquisition costs, where applicable), and depreciated to estimated residual values using the straight-line method over estimated useful lives and residual values which are summarized as follows:
| Range of Estimated Useful Lives |
Residual Value Estimates | |||
| Passenger aircraft | 25 years from date of manufacture | Not to exceed 15% of manufacturer’s list price when new | ||
| Aircraft engines | 2 - 6 years, based on maintenance adjusted service life | Sum of engine core salvage value plus the estimated fair value of life limited parts | ||
| Offshore energy vessels | 25 years from date of manufacture | 20% of new build cost | ||
| Railcars and locomotives | 40 - 50 years from date of manufacture | Scrap value at end of useful life | ||
| Track and track related assets | 15 - 50 years from date of manufacture | Scrap value at end of useful life | ||
| Buildings and improvements |
20 - 30 years | Scrap value at end of useful life | ||
| Railroad Equipment |
3 - 15 years from date of manufacture | Scrap value at end of useful life | ||
| Crude Oil Terminal Machinery and Equipment | 15 - 20 years from date of manufacture | Scrap value at end of useful life | ||
| Vehicles | 7 years from date of manufacture | Scrap value at end of useful life | ||
| Furniture and Fixtures | 3 - 10 years from date of purchase | None | ||
| Computer Hardware and Software | 3 - 5 years from date of purchase | None |
102
Table of Contents
Major improvements and modifications incurred in connection with the acquisition of property, plant and equipment and leasing equipment that are required to get the asset ready for initial service are capitalized and depreciated over the remaining life of the asset. Costs of major additions and betterments are capitalized and depreciation commences once it is placed into service. Interest costs directly related to and incurred during the construction period of property, plant and equipment are capitalized.
For planned major maintenance or component overhaul activities for aviation equipment off lease, the cost of such major maintenance or component overhaul event is capitalized and depreciated on a straight-line basis over the period until the next maintenance or component overhaul event is required.
In accounting for leasing equipment, the Company makes estimates about the expected useful lives, residual values and the fair value of acquired in-place leases and acquired maintenance liabilities (for aviation equipment). In making these estimates, the Company relies upon observable market data for the same or similar types of equipment and, in the case of Aviation equipment, its own estimates with respect to a lessee’s anticipated utilization of the aircraft. When the Company acquires leasing equipment subject to an in-place lease, determining the fair value of the in-place lease requires the Company to make assumptions regarding the current fair values of leases for identical or similar equipment in order to determine if the in-place lease is within a fair value range of current lease rates. If a lease is below or above the range of current lease rates, the resulting lease discount or premium is recognized as a lease intangible and amortized into lease income over the remaining term of the lease.
The Company reviews its depreciation policies on a regular basis to determine whether changes have taken place that would suggest that a change in its depreciation policies, useful lives of its equipment or the assigned residual values is warranted.
Impairment of Long-lived Assets
The Company performs a recoverability assessment of each of its long-lived assets whenever events or changes in circumstances, or indicators, indicate that the carrying amount or net book value of an asset may not be recoverable. Indicators may include, but are not limited to, a significant lease restructuring or early lease termination; significant traffic decline; or the introduction of newer technology aircraft, vessels, engines or railcars. When performing a recoverability assessment, the Company measures whether the estimated future undiscounted net cash flows expected to be generated by the asset exceeds its net book value. The undiscounted cash flows consist of cash flows from currently contracted leases and terminal services contracts, future projected leases, terminal service and freight rail rates, transition costs, estimated down time and estimated residual or scrap values. In the event that an asset does not meet the recoverability test, the carrying value of the asset will be adjusted to fair value resulting in an impairment charge.
Management of the Company develops the assumptions used in the recoverability analysis based on its knowledge of active lease contracts, current and future expectations of the global demand for a particular asset and historical experience in the leasing markets, as well as information received from third party industry sources. The factors considered in estimating the undiscounted cash flows are impacted by changes in future periods due to changes in contracted lease rates, residual values, economic conditions, technology, demand for a particular asset type and other factors.
Goodwill
The Company reviews carrying values of goodwill at least annually to assess impairment since these assets are not amortized. An annual impairment review is conducted as of October 1st of each year. Additionally, the Company reviews the carrying value of goodwill whenever events or changes in circumstances indicate that its carrying amount may not be recoverable. The determination of fair value involves significant management judgment. Impairment is expensed when incurred. For an annual goodwill impairment assessment, an optional
103
Table of Contents
qualitative analysis may be performed. If the option is not elected or if it is more likely than not that the fair value of a reporting unit is less than its carrying amount, then a two-step goodwill impairment test is performed to identify potential goodwill impairment and measure an impairment loss.
The first step compares the fair value of a respective reporting unit with its carrying amount, including goodwill. The estimate of fair value of the respective reporting unit is based on the best information available as of the date of assessment, which primarily incorporates certain factors including the Company’s assumptions about operating results, business plans, income projections, anticipated future cash flows and market data. If the estimated fair value of the reporting unit is less than the carrying amount a second step must be completed in order to determine the amount of goodwill impairment that should be recorded, if any. Although the Company believes the estimates of fair value are reasonable, the determination of certain valuation inputs is subject to management’s judgment. Changes in these inputs could materially affect the results of the impairment review. If the forecasts of cash flows generated by the Jefferson Terminal and the Railroad reporting units or other key inputs are negatively revised in the future, the estimated fair value of the Jefferson Terminal and Railroad reporting units would be adversely impacted, potentially leading to an impairment in the future that could materially affect the Company’s operating results. The Company performed a sensitivity analysis for goodwill impairment and determined that a hypothetical 5% decline in the fair value of each reporting unit as of October 1, 2014 would not result in an impairment of goodwill for any reporting unit. As of December 31, 2014, there was no impairment of goodwill.
Derivative Financial Instruments
In the normal course of business the Company may utilize interest rate derivatives to manage its exposure to interest rate risks, principally related to the hedging of variable rate interest payments on various debt facilities. If certain conditions are met, an interest rate derivative may be specifically designated as a cash flow hedge. One of the Company’s designated interest rate derivatives is a cash flow hedge. The Company does not enter into speculative derivative transactions.
On the date that the Company enters into an interest rate derivative, its designation as a cash flow hedge is formally documented. On an ongoing basis, an assessment is made as to whether the interest rate derivative has been highly effective in offsetting changes in the cash flows of the variable rate interest payments on the associated debt and whether the interest rate derivative is expected to remain highly effective in future periods. If it were to be determined that the interest rate derivative is not (or has ceased to be) highly effective as a cash flow hedge, the use of cash flow hedge accounting would be discontinued prospectively.
All interest rate derivatives are recognized on the balance sheet at their fair value. For interest rate derivatives designated as cash flow hedges, the effective portion of the interest rate derivative’s gain or loss is initially reported as a component of other comprehensive income and subsequently reclassified into earnings when the interest payments on the debt are recorded in earnings. The ineffective portion of the interest rate derivative, if any, is calculated and recorded in interest expense. Changes in fair value of non-hedge derivatives are recorded in earnings on a current basis.
In the event of a termination of an interest rate derivative prior to its contracted maturity, any related net gains or losses in accumulated other comprehensive income at the date of termination would be reclassified into earnings, unless it remains probable that interest payments on the debt will continue to occur, in which case the amount in accumulated other comprehensive income would be reclassified into earnings as the interest payments on the debt affect earnings.
Recent Accounting Pronouncements
Please see note 2 to our audited consolidated financial statements included elsewhere in this prospectus for recent accounting pronouncements.
104
Table of Contents
Transportation and infrastructure assets generally are long-lived, physical assets that are essential to the transportation of people and products globally, and which are typically critical to support sustainable economic development. The transportation asset market includes major sectors such as aviation, air and sea ports, energy, shipping, offshore, containers, rail, and trucking. We estimate the global transportation market to be approximately $2.7 trillion, and expect that market to continue to grow. While our strategy permits us to acquire a broad array of transportation-related assets, we are currently active in four sectors where we believe there are meaningful opportunities to deploy capital to achieve attractive risk adjusted returns. These sectors are aviation, energy, intermodal transport and rail.
Aviation
The aviation industry supports the transportation of passengers and freight globally. The aviation sector includes both infrastructure such as airports, as well as aviation related equipment (airplanes and engines). Demand for key aviation assets is tied to the underlying demand for passenger and freight movement. Commercial air travel and air freight activity have historically been long-term growth sectors, broadly correlated with world economic activity and expanding at a rate of one to two times the rate of global GDP growth. According to the IATA, global demand for passenger traffic has grown at an average annual rate of 5.5% over the past two decades, outpacing global GDP of 3.0% in the same period. According to the International Civil Aviation Organization, aviation passenger traffic (measured in passenger kilometers) has increased at approximately a 4.6% compound annual growth rate from 2004 to 2013. Furthermore, according to Boeing’s 2014 Commercial Market Outlook, this growth is expected to continue, rising at an average annual rate of 5% per annum over the next two decades. This projected increase in air travel presents an attractive opportunity for the private sector to invest in airports and flight equipment.
Airports are mission-critical infrastructure for global businesses and leisure travelers. There are over 42,000 airports globally, handling over 3.1 billion passengers and generating over $110 billion in revenue annually. Airports are long-lived assets with limited competition due to significant barriers to entry. Typically, private investments in airports are structured as a concession where the private investor received the right to operate and collect income from the airport for a defined time period, with ownership being retained by governmental entities. Airports tend to generate significant cash flows with minimal maintenance capital expenditures.
105
Table of Contents
With regard to aviation equipment, over the next twenty years, the global commercial passenger and cargo fleet of aircraft is expected to grow from approximately 21,000 at the end of 2013 to over 42,000 by 2033. As part of this increase in traffic demand, Boeing estimates that demand for new assets over the next 20 years will be in excess of 36,000 aircraft.
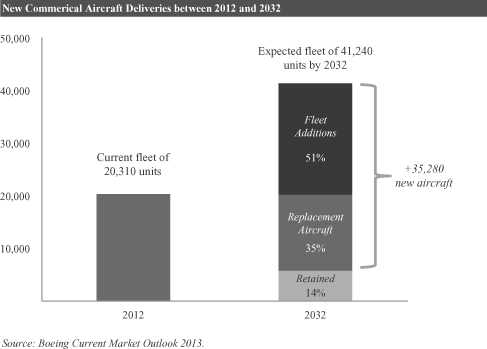
According to Boeing, this demand is being fueled by several factors, including additions to global capacity as well as replacement of older aircraft. Capacity growth is expected to be driven by economic growth in emerging markets, namely the Asia Pacific, Latin America and Middle East regions, which is forecasted to account for nearly 20,000 new aircraft. In order to support this expansion, the emerging markets are going to be the largest recipients of new aircraft over this period, with Asia, the Middle East and Latin America representing nearly 50% of new deliveries. Replacement of older equipment, largely as a result of old age and fuel efficiency, is expected to account for approximately 15,500 new aircraft.
Aircraft Leasing
Due to the cost of aircraft acquisitions, aircraft financing complexities and airlines’ need for fleet flexibility, the role of operating lessors has grown significantly over the past twenty years. Historically, airlines owned 100% of the fleet which they operated and acquisitions were financed through traditional loans and bank debt that was collateralized with the assets themselves. Over time, however, as airlines consolidated and grew in fleet size, the need for non-traditional financing sources drove the emergence of operating leases. As a result of this, operators are now able to quickly grow a fleet while carrying fewer assets on their balance sheets.
According to Ascend Fleet data, as of October 2013, approximately 33% of the in-service passenger and cargo aircraft fleet worldwide was owned and managed by an operating lease company. From 1999 to 2007, according to IATA, the lessor fleet grew at a compounded annual rate of 7.0% per year. Although this growth rate has begun to taper as the rate of retirement for older aircraft increases, we expect that, by 2020, approximately half of the world fleet will be owned by an operating lease company. Looking forward, we believe that aircraft operators will continue to rely on leasing as they seek to reduce capital intensity, to eliminate balance sheet residual risks from aircraft, to pursue alternative financing sources when traditional bank sources are constrained, and to preserve flexibility in their fleet composition. In addition to national and network carriers,
106
Table of Contents
low-cost-carriers (“LCC”) and regional airlines are major contributors to the lessor customer base as they seek to grow fleets quickly while mitigating capital intensity. In many regions, particularly across emerging populations, LCCs have become a primary method of air transport. The four largest domestic markets in Southeast Asia—Indonesia, Philippines, Malaysia and Thailand—all have LCC penetration of over 50%.
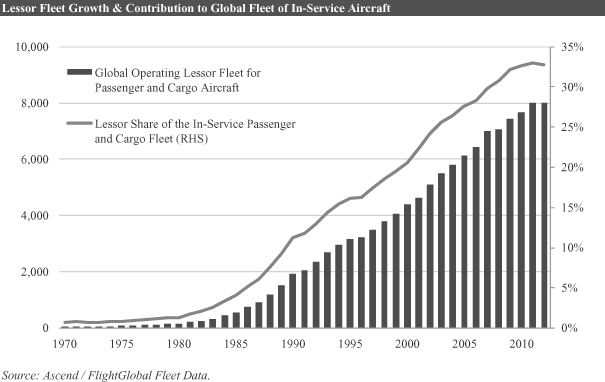
Engine Leasing
The market for engine leasing, while less developed than that of aircraft, is becoming an important option for operators globally. Similar to the use of leasing aircraft as a financing tool, we expect operators to increase their use of engine leasing as a method of reducing maintenance outflows, residual balance sheet risk, and capital intensity. As engines become more complex and technologically advanced, operators look to partner with engine lessors in order to eliminate the need for capital and technical expertise. According to Engine Lease Finance Corporation, as of 2013, approximately 35% of the global engine fleet was leased, while the remainder was owned by operators. Demand for leased engines is driven by the following factors:
| • | Capital intensity—As airlines take delivery of new aircraft, they are also required to maintain a fleet of supporting spare engines, which are used when another engine is undergoing repair or is removed from wing for any other purpose. Engines, as they become the drivers for fuel efficiency and additional thrust at lighter weights, are rising in price. Leasing provides carriers a method to carry fewer engines on their balance sheet and requires less initial capital upon taking in a new aircraft. |
| • | Maintenance Cost Mitigation—Engine maintenance, including minor and major repairs or overhauls, have become material expenses to an operator. Based on publicly available sources, we believe engine maintenance represents a $23 billion industry, which is expected to grow to $33 billion by 2023, representing 38% of global MRO work. As the cost of owning engines poses a greater risk to profits, airlines will seek operating leases and other methods to mitigating costs. |
| • | Aircraft Retirement Cost Management—As airlines begin retiring aircraft, and in particular a fleet of aircraft, engine leasing plays a critical role in reducing the costs associated with phasing out assets. |
107
Table of Contents
| During the end of an aircraft’s life, investing in long-term engine maintenance no longer makes economic sense. Instead, short-term leasing is a valuable tool to operators during this period. |
We believe the market for leased aircraft and engines will continue to grow as the global demand for traffic fuels demand for new aircraft, and thus the need for financing solutions. In addition, we view the increased supply of new aircraft to be a driving force for aircraft retirements, which is a positive trend for engine leasing and fleet management solutions.
Energy
The market for energy infrastructure and transportation equipment includes land-based infrastructure such as terminals, storage facilities, pipelines and trucks as well as marine and offshore energy assets such as ships, barges and other related equipment.
Together, oil and natural gas represent a majority of energy consumed globally and are expected to remain so for the foreseeable future. According to the EIA, fossil fuels represented approximately 80% of energy consumption in 2014 and will continue to represent approximately 80% of energy consumption through 2040. Energy demand is expected to grow at an annual rate of 2% over the next 10 years, driven by increasing global population and GDP growth. This growth in energy demand is expected to result from both a larger pool of energy users as well as higher energy use per capita.
Within the energy infrastructure and transportation equipment market, we are focused on two sub-sectors: land-based infrastructure and offshore energy service equipment. Land-based infrastructure refers to facilities that enable the storage, unloading, loading and movement of crude oil and refined products from producers to end users such as refineries. Because customers typically purchase capacity on a take-or-pay basis, the economics of these assets directly relate to the volume of throughput and are not directly affected by commodity prices. We believe that the demand for this infrastructure is growing, particularly in North America, where the market dislocations around the supply of oil and gas has resulted in significantly increased production of such products. For example, to support the flow of oil and gas production from newly developed North American oil and gas fields, industry experts estimate that $641 billion in new infrastructure investments will be needed over the next two decades, with much of that investment required during the next few years.
Recently, owners and operators of strategically-located rail assets have participated in the growth of the North American energy sector by transporting petroleum and natural gas products for both refining and export. Volumes of “crude-by-rail” have increased by more than sixteen times, from approximately 29,605 carloads in 2010 to 493,126 in 2014. This increase has been driven by growth in U.S. and Canadian crude oil production, which is expected to continue as hydraulic fracking technologies continue to be utilized and improved for greater production efficiency. The increased production has put pressure on existing pipeline infrastructure, driving shippers to seek alternative forms of transportation. Relative to traditional pipeline infrastructure for the transportation of oil, rail transportation provides greater market access, faster infrastructure deployment, end market flexibility and is more cost efficient for “heavier” crude oil generally produced from Canadian oil sands. We believe that this trend will continue and will lead to growth for our existing assets as well as opportunities for new infrastructure acquisitions. As of December 31, 2014, we own 60% of multi-modal crude oil and refined products terminal in Beaumont, Texas which includes rail, truck, ship, storage and pipeline infrastructure as well as 300 tank railcars.
Jefferson
The United States has historically been the largest consumer of petroleum-based products in the world. According to the EIA 2014 Refinery Capacity Report, there were 139 operating oil refineries in the United States, with a total refining capacity of approximately 17.7 million barrels per day (17.7 MMb/d). According to a recent EIA publication, average United States crude oil production in 2015 is expected to grow by approximately
108
Table of Contents
1.9 MMb/d, to 10.6 MMb/d from 8.7 MMb/d in 2014, an increase of approximately 22%. In addition, the Canadian Association of Petroleum Producers projects that Canadian crude oil production will increase by approximately 40%, or 1.4 MMb/d, from 3.5 MMb/d in 2013 to 4.9 MMb/d in 2020. As a result of the recent and projected growth in North American crude oil production, the United States has reduced its reliance on imported crude oil. The EIA estimates that crude oil imported from foreign sources (crude oil from outside North America) since 2010 declined by approximately 2.5 MMb/d or 27%, to 6.7 MMb/d in 2013.
Historically, lower 48-state domestic oil production was sourced from fields located principally in Texas and Louisiana. As a result, the U.S. petroleum complex was constructed around a transportation network of pipelines which moved large volumes of domestic crude oil and products from the major refining centers in the Gulf Coast states to refineries in the Mid-continent and northern tier states. As U.S. domestic production declined, the Gulf Coast became a major hub for importing large volumes of waterborne crude oil. Refineries on the U.S. East Coast also came to rely on waterborne imports of crude oil. Recent production growth in Canada and the U.S. Mid-continent has placed considerable stress on the North American crude oil pipeline network, which was designed to transport volumes from south to north with limited capacity to send volumes east or west. Construction of new pipelines has been delayed by commercial and regulatory constraints.
Crude-by-rail transportation has emerged to fill the gap. The AAR estimates that crude oil originated carloads on U.S. Class I railroads have increased by more than sixteen times, from approximately 29,605 carloads in 2010 to 493,126 carloads in 2014. In the first half of 2014, more than 11% of all U.S. domestic crude oil was transported by rail. While crude-by-rail can be more expensive than transporting crude oil by pipeline (ignoring the upfront capital investment), rail offers several advantages over pipelines. Crude-by-rail creates flexibility to move swiftly and capitalize on market imbalances and to redeploy assets as bottlenecks shift. Rail terminals for loading and unloading crude oil can be constructed quickly and connected to an extensive rail network to reach all major processing centers. Crude-by-rail provides optionality to source crude oil from multiple basins without the need for large financial commitments to long-term take-or-pay contracts as is typical with new pipeline construction. For undiluted bitumen or heavy Canadian crude oil, in particular, transportation by rail is considered more attractive than by pipeline, which requires the heavy crude to be diluted, at additional cost, before it can be moved through a pipe. Crude-by-rail also provides the ability to ship Canadian crude in segregated batches, which means the oil can then be exported from U.S. ports. Once Canadian crude oil is placed in a pipeline in the U.S. it is considered a mixed batch, and cannot be exported.
Offshore Energy
The offshore energy industry includes the extraction, processing and transportation of oil and natural and gas from deposits located beneath the sea floor. Offshore energy is a capital-intensive industry that employs thousands of drilling rigs, construction and support vessels, and production units with a total estimated replacement value in excess of $400 billion. The demand for offshore energy assets and services is driven by E&P spending, which consists of capital expenditure (“CAPEX”) related spending and operating expenditure (“OPEX”) related spending. OPEX spending occurs primarily during the production phase of an offshore oil and gas field and typically exhibits lower volatility and greater visibility than CAPEX related spending. The demand for our Offshore Energy assets is driven mainly by OPEX spending. Our Offshore Energy assets perform a range of IMR services to maintain and enhance existing offshore oil and gas production, as well as support the installation of new offshore infrastructure.
Offshore oil and gas production currently accounts for 30% of total global oil and gas production. Despite the growth in unconventional oil and gas production from North America, we expect offshore oil and gas production to remain a meaningful part of the energy production mix. Two primary factors drive the demand for offshore energy assets and services. The first is the increasing need to maintain existing offshore energy infrastructure. According to Clarkson Research Services, there are over 7,000 subsea structures and over 300 floating production units in operation. In addition, there are thousands of fixed offshore production platforms in operation. All of these structures require periodic IMR. The second demand driver for offshore energy assets and
109
Table of Contents
services is the industry’s push into deep-water exploration and development. Deep-water is attractive for oil and gas companies due to larger reservoirs and higher well productivity versus shallow water fields. Deep-water fields are typically farther from shore and involve more complex well and field infrastructure, which requires more sophisticated offshore energy assets and services. Furthermore, deep-water wells are more complex and require more service intensity per well than onshore or shallow-water wells, resulting in greater demand for offshore energy assets and services over time.
The following describes assets in the offshore energy sector which we believe are essential to the construction and maintenance of offshore field infrastructure:
Offshore Support Vessels—Used to transport supplies from shore, tow rigs and other offshore structures, provide emergency response and firefighting services, and transport personnel. The two primary asset types in this category are Platform Supply Vessels and Anchor Handling Towing Supply vessels.
Construction / Subsea—Vessels and barges used in the installation, commissioning, IMR of offshore infrastructure including production platforms, subsea equipment and pipelines, as well as provision of well services. The primary assets in this category include construction vessels, construction support vessels, IMR vessels, ROV vessels, pipe-lay support vessels and dive support vessels.
Drilling Rigs—Used to drill wells and provide a variety of well services. There are four primary types of rigs: jack-up drilling rigs, semi-submersible drilling rigs, drillships, and tender rigs. Jack-up drilling rigs typically operate in shallow waters while semi-submersible drilling rigs, drillships and tender rigs operating in mid-water to ultra deep-water environments.
Floating Production Units—Used to process the stream from the well and separate the oil, natural gas and natural gas liquids from the rest of the stream (water, drilling fluids, sand, etc.) and offload the oil and gas to pipelines or tankers for transport to market. Floating production units are typically either vessel based (converted tankers or purpose-built), semi-submersible floating production units, Tender Leg Platforms or Spars.
Heavy Transport—Vessels and barges used to transport (“dry-tow”) large structures from shore to an offshore field for installation or from a field to shore during field decommissioning. The key benefits of dry-tow versus a wet-tow (via AHTS vessel or tug) are shorter transit time and lower insurance cost.
Accommodation—The provision of offshore hotel services for workers, typically in relation to construction, maintenance and repair of offshore production units. Accommodation units are distinguished by available deck space, lifting capacity and accommodation capacity. There are four types of accommodation units: jack-ups, barges, semi-submersibles and monohull vessels.
We believe increasing deep-water development and production, as well as aging offshore infrastructure, supports growing demand for offshore energy assets and services. The recent oil price decline has led to oil and gas companies reducing and deferring spending decisions, which in turn has created an oversupply of offshore energy assets. The oversupply of offshore energy assets has led to lower day-rates, utilization and earnings for offshore service companies. We expect the current market situation within offshore energy to continue for the next one to three years, and we expect to find attractive investment opportunities as asset owners seek (or are forced) to sell assets, pursue alternative financing schemes or restructure their balance sheets.
Intermodal Transport
Since its beginnings in the late 1960s, intermodal freight transportation, or containerization, has become an integral part of the world economy. Today, the intermodal market includes the infrastructure and equipment that enables the efficient movement of goods throughout multiple modes of transportation including trucking, shipping and rail via a shipping container. The use of containers in global trade has resulted in huge productivity and efficiency gains including improved productivity, security and efficiency. Containers provide a secure and
110
Table of Contents
cost-effective method of transportation because they can be used in multiple modes of transportation, making it possible to move cargo from a point of origin to a final destination without repeated unpacking and repacking. As a result, containers reduce transit time and freight and labor costs, as they permit faster loading and unloading of shipping vessels and more efficient utilization of transportation containers than traditional break-bulk shipping methods. The protection provided by containers also reduces damage, loss and theft of cargo during shipment. While the growth in the containerized cargo market has slowed in the last few years due to general economic conditions, we expect future growth will benefit from a growing global middle class and resulting increased consumption of goods and services worldwide.
Intermodal infrastructure consists primarily of seaports, which are the gateway for the global trade network. There are over 3,000 seaports worldwide, handling nearly 10 billion tons of cargo and generating over $55 billion in revenue annually. Of these, there are over 500 container seaports (handling the import and export of containerized goods) with an annual volume of approximately 700 million TEUs. Worldwide, seaport volumes are expected to increase 25% by 2017. Ports are typically owned by government entities, and are overseen by local port authorities. Over the last two decades, governments have privatized port operations via long-term concession agreements with private parties. Seaports generate multiple revenue streams from infrastructure users. Seaports tend to generate strong cash flows with minimal routine maintenance capital expenditures.
Intermodal equipment includes shipping containers, chassis or trailers, generators sets, containerships, cranes and other loading equipment used and useful in transporting containerized freight. Container trade has grown at an annual rate of more than 8% for over 30 years. Since 2000 growth has been driven by globalization and the emergence of China as the world’s leading manufacturing base. The chart below compares cumulative world GDP, seaborne trade, container trade and container fleet growth from 1980 to 2014, and shows that container trade has grown at a multiple of GDP growth during this time.
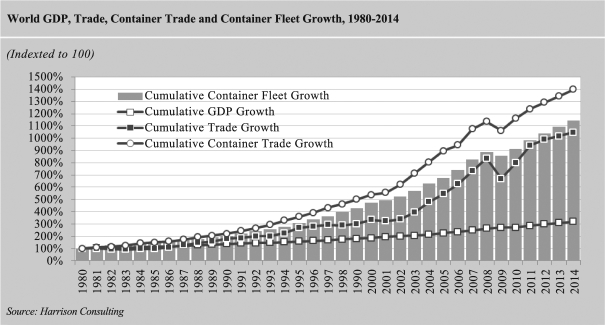
As of December 31, 2014, more than 5,000 fully-cellular container ships, with an aggregate capacity of approximately 18.6 million TEUs on-board vessel slots, transport 1.6 billion tons of containerized cargo a year. This generates movement of approximately 700 million TEUs through the world’s container ports annually, yields annual revenues of $200 billion for the container shipping lines, and accounts for over 50% of the total value of world seaborne trade.
111
Table of Contents
Containers are large steel boxes built to ISO norms and used for intermodal freight transportation. Most types of ISO containers used in international trade share the following distinctive features:
| • | Standard dimensions—Containers are generally 8’ wide, 8’ 6 inches high (standard) or 9’ 6 inches high (high-cube), and 20’, 40’ or 45’ long. |
| • | Steel-frame construction—Containers are constructed with a strong steel frame which is fully or partially enclosed with steel panels, has a wooden, composite or steel floor and doors at the rear. |
| • | Corner castings—Containers stand on four heavy-duty corner castings and have four more on their top corners by which they are usually handled. |
As of December 31, 2014, the size of the world container fleet was approximately 36 million TEUs, 52% of which was owned by shipping lines and other operators, and 48% of which was owned or managed by container lessors.
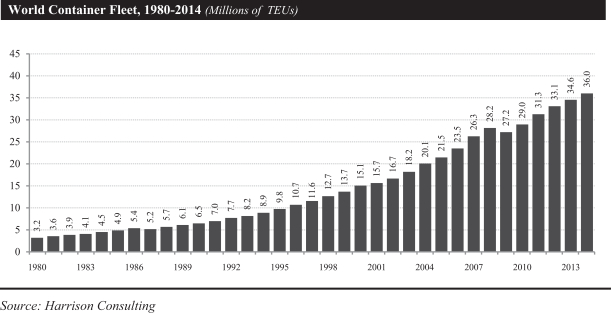
A description of the three principal types of containers is set forth below:
Dry freight standard containers—A dry freight standard container is constructed of steel sides, roof, an end panel at the front and a set of doors at the rear, a wooden floor and a steel undercarriage. Dry freight standard containers are the least expensive and most commonly used type of container. They are used to carry general cargo, such as manufactured component parts, consumer staples, electronics and apparel. Dry freight standard containers comprised approximately 90% of the worldwide container fleet, as measured in TEUs, at December 31, 2014.
Dry freight specialized containers—Dry freight specialized containers are similar to dry-freight standard containers but modified in some way for specific cargos or uses. The main types are open-tops and flat racks. On an open-top container the steel-panel roof is replaced with a tarpaulin supported by removable roof bows. A flat-rack container is a heavily reinforced steel platform with a wood deck and steel end panels. Open-top and flat-rack containers are generally used to transport heavy or oversized cargo, such as marble slabs, building products or machinery. Dry freight specialized containers comprised approximately 2.5% of the worldwide container fleet, as measured in TEUs, at December 31, 2014.
112
Table of Contents
Other containers—Other containers include refrigerated containers, tank containers, 45’ containers, pallet-wide containers and other types of containers. The two most prominent types of such containers are refrigerated containers and tank containers. A refrigerated container has an integral refrigeration unit affixed to the front which controls the internal temperature of the container and enables it to transport perishable goods. Tank containers are used to transport liquid bulk products such as chemicals, oils and other liquids. Other containers comprised approximately 7.5% of the worldwide container fleet, as measured in TEUs, at December 31, 2014.
Leasing provides shipping lines with increased flexibility to manage availability and the location of their containers, increased ability to meet peak demand requirements, and a reduction of capital expenditures. Container lessors owned approximately 48% of the total worldwide container fleet of 36 million TEUs at December 31, 2014. The percentage of leased containers utilized by shipping lines may increase in the near future, given limited access to credit and competing needs for capital expenditures by our customers. Given the uncertainty and variability of export volumes and the fact that shipping lines have difficulty in accurately forecasting their container requirements at different ports, the availability of containers for lease significantly reduces a shipping line’s need to purchase and maintain excess container inventory.
We believe these factors should foster continued growth in container leasing and will present us with attractive acquisition opportunities.
The container-related statistical data in the subsection of this Industry Overview entitled “Intermodal Transport” has been prepared by Harrison Consulting and the accompanying commentary is based on Harrison Consulting findings. It is included in this prospectus in reliance on the authority of Harrison Consulting as an expert in statistical and other analysis of the container leasing industry. See “Experts.” Harrison Consulting has informed us that it has derived the information set forth in this subsection from publicly available data, and that its estimates of future container trade growth are based on assumptions about the world economy and trade flows as of December 31, 2014.
Rail
North American economy is dependent on the movement of freight ranging from raw materials such as coal, ores, aggregates, lumber and grain to finished goods, such as food products, paper products, automobiles and machinery. Railroads represent the largest component of North America’s freight transportation industry, carrying more freight than any other mode of transportation. According to the AAR, as of 2009, railroads account for approximately 40% of total freight ton-miles while trucks and ships account for approximately 33% and 12%, respectively. With a network of approximately 140,000 miles of track in the U.S. railroads link businesses with each other domestically and with international markets through connections with ports and other international terminals. Unlike other modes of transportation, such as trucking (which uses highways, toll roads, etc.) and shipping companies (that utilize ports), railroad operators generally own their infrastructure of track, land and rail yards. This infrastructure, most of which was originally established over 100 years ago, represents a limited supply of assets and a difficult-to-replicate network.
The railroad industry has increased its share of freight ton-miles compared to other forms of freight transportation over the past quarter century. Since 1980, the railroad industry has continually improved its cost structure compared to other forms of freight transportation as it consumes less fuel and has lower labor costs per ton transported than other forms of freight transportation. According to the AAR, railroads’ operating ratios (operating costs as a percentage of revenue) have decreased from 86.4% in 1995 to 70.8% in 2013 as a result of significant reductions to labor and rolling stock (locomotives and railcars) requirements and the spinning off of less dense network segments. According to the AAR, railroads are estimated to be approximately four times more fuel efficient than truck transportation and a single train can haul the equivalent of up to 280 trucks. Additionally, as the price of fuel has increased over the past several years, the fuel efficiency advantage of railroads as compared to other forms of freight transportation has grown. In 1980, one gallon of diesel fuel moved one ton of freight by rail an average of 235 miles, versus 2012 where the equivalent gallon of fuel moved
113
Table of Contents
one ton of freight an average of 476 miles by rail—representing a 103% increase over 1980. As a result, the railroad industry’s share of U.S. freight ton-miles has increased from 29% in 1980 to 30% in 2011. The revenue of the five U.S. Class I railroads has increased at a 6.4% compound annual growth rate over the last ten years, from $38.3 billion to $71.3 billion.
Rail Industry Structure
According to the AAR, there are 574 railroads in the United States operating approximately 140,000 miles of track. The AAR classifies railroads operating in the United States into one of three categories based on the amount of revenues and track-miles. There are seven Class I railroads (each with revenues over $467 million in revenues in 2013). Regional and local/short line railroads operate approximately 43,200 miles of track in the United States. The primary function of these smaller railroads is to provide feeder traffic to the Class I carriers. Regional and local/short line railroads combined account for approximately 5% of total industry rail revenues in 2013.
Regional and Short line Railroads
Short lines and regional railways have always been a part of the rail industry in North America. In the 1800s, most North American railroads were constructed to serve a local or regional interest. Today’s Class I railroads are descended from hundreds of short lines and regionals that came together in successive waves of consolidation.
During the 1980s the number of regional and short line railroads increased dramatically. Deregulation of U.S. railroads simplified abandonment and sales regulations, allowing the major carriers to gain many of the savings of abandonment while preserving the traffic on the rail lines. Carriers created through this divestiture process now account for the majority of regional and short line railroads. Short line and regional railroads today serve important roles in moving freight within their service areas and function as a critical traffic “feeder” network for the Class I railroads.
Over the past decade, the number of regional and short line railroads has remained relatively constant at approximately 560. While some new entrants were formed through spin-offs or divestitures of Class I railroads, they have generally been offset by other existing regional and short lines either exiting the business or being merged with or acquired by other railroads. With the growth of multi-carrier holding companies, such as Genesee & Wyoming, the number of operators of regional and short line railroads has decreased. The consolidation brought on by multi-carrier holding companies has induced a number of shippers with private railroads to sell those railroads to the major short line operators. Similarly, Class I railroads sell and lease rail lines to smaller rail entities in order to address a range of issues impacting costs and productivity.
Railcars and Equipment
In addition to operating railroads and rail-related infrastructure such as terminals, the North American rail market includes rail equipment such as railcars and locomotives. According to publicly available sources, there are approximately 2.0 million railcars currently in operation in North America. Approximately 59% of these railcars are leased to railroads and shipping companies, most under multi-year contracts.
114
Table of Contents
Our Company
We own and acquire high quality infrastructure and equipment that is essential for the transportation of goods and people globally. We currently invest across four market sectors: aviation, energy, intermodal transport and rail. We target assets that, on a combined basis, generate strong and stable cash flows with the potential for earnings growth and asset appreciation. Our existing mix of assets provides significant cash flows as well as organic growth potential through identified projects. In addition, we believe that there are a large number of acquisition opportunities in our target sectors and that our Manager’s expertise and business and financing relationships, together with our access to capital, will allow us to take advantage of these opportunities. We are externally managed by FIG LLC, an affiliate of Fortress, which has a dedicated team of professionals who collectively have acquired over $17 billion in transportation-related assets since 2002. As of December 31, 2014, we had total consolidated assets of $1,404.2 million and total equity capital of $713.5 million. We intend to pay regular quarterly dividends from funds available for distribution.
We believe that market developments around the world are generating significant opportunities for the acquisition of infrastructure and equipment essential to the transportation industry. Global trade growth has consistently outpaced global GDP growth over the last three decades and has fueled a large and growing demand for both cargo and passenger-related transportation infrastructure and equipment. At the same time, significant market dislocations are providing tremendous new investment opportunities. Traditional capital providers such as governments and European banks are not keeping pace with the need for long-term capital to support the industry, and we believe this shortage will continue for years to come. We believe that these factors will enable us to acquire attractive assets and continue to grow our business.
Our operations consist of two primary strategic business units—Infrastructure and Equipment Leasing. Our Infrastructure Business acquires long-life assets or operating businesses that provide mission-critical services or functions to transportation networks and typically have high barriers to entry, strong margins, stable cash flows and upside from earnings growth and asset appreciation driven by increased use and inflation. Our Equipment Leasing Business acquires assets that are designed to carry cargo or people or provide functionality to transportation infrastructure. Transportation equipment is typically long-lived, moveable and leased by us to companies that provide transportation services on either operating leases or finance leases. Our leases generally provide for long-term contractual cash flow with high cash-on-cash yields and may include structural protections to mitigate credit risk. We believe that our existing asset base provides stable cash flow generation with over half of our revenue contracted and the remainder coming from markets with stable or growing demand outlook.
Our goal is to increase our earnings, cash flows and distributions by acquiring a diverse mix of transportation infrastructure and equipment that combine to deliver significant cash flow and upside potential. We target sectors that we believe enjoy strong long-term growth potential and proactively seek investment opportunities within those sectors that we believe have the best risk-adjusted return. We take an opportunistic approach—targeting assets that are distressed or undervalued, or where we believe we can add value through active management, without heavy reliance on the use of financial leverage to generate returns. We also seek to develop incremental opportunities to deploy capital through follow-on investments in our existing assets in order to grow our earnings and create value. As of December 31, 2014, our leverage on a weighted basis across our existing portfolio is approximately 24% of our total capital. While leverage on any individual asset may vary, we target overall leverage for our assets on a consolidated basis of no greater than 50% of our total capital.
115
Table of Contents
The charts below illustrate our existing assets, and our equity deployed in acquiring these assets separated by reporting segment as of December 31, 2014.
Note:
| • | Excludes $13.9 million of assets and $6.5 million of equity reflected in our corporate operating segment. |
| • | Jefferson Terminal and Railroad are included in our Infrastructure Business and Aviation Leasing, Offshore Energy and Shipping Containers are included in our Equipment Leasing Business. |
Dividends
We view FTAI as a total return investment comprised of current yield and consistent dividend growth. We currently intend to pay regular quarterly dividends and our long term goal is to maintain a payout ratio of between 50-60% of funds available for distribution, with remaining amounts used primarily to fund our future acquisitions. As a public company, there can be no assurance that we will pay dividends in amounts or on a basis consistent with prior distributions to our investors, if at all. See “Dividend Policy.” For the second quarter of 2015, we intend to pay a dividend of $0.33 per share, which will be pro-rated for the period from the consummation of this offering to the end of the quarter and paid in the third quarter of 2015. We have historically not generated sufficient funds available for distribution to support this payout amount and our ability to do so is subject to certain uncertainties including the continued performance of our existing Equipment Leasing Business as well as the improvement in the operating performance of our Infrastructure Business including Jefferson Terminal and CMQR. Furthermore, some of our prior distributions to our investors would not have been possible without proceeds from equity and debt financings. Any shortfalls in the future may be funded with the proceeds from further equity and debt financings. Since inception through March 31, 2015, we have made a total of fourteen regular quarterly capital distributions which have been characterized as returns of capital to our investors that have grown consistently over time. See “Management’s Discussion and Analysis of Financial Condition and Results of Operations—Liquidity” for a further discussion of FAD, including its potential limitations as a liquidity measure. We currently target an annual growth rate of at least 10% for our regular dividends. Dividends will be authorized by our board of directors and declared by us based on a number of factors including actual results of operations, liquidity and financial condition, restrictions imposed by applicable law, our taxable income, our operating expenses and other factors our board of directors deems relevant. Because we are a holding company and have no direct operations, we will only be able to pay dividends from our available cash on hand and any funds we receive from our subsidiaries and our ability to receive distributions from our subsidiaries may be limited by the financing agreements to which they are subject, see “—Dividend Policy.”
116
Table of Contents
Market Opportunity
We believe that market developments around the world are generating significant opportunities for the acquisition of infrastructure and equipment essential to the transportation industry and that demand for such assets will continue to grow given their critical role in the movement of goods and people globally. According to industry publications, approximately $7.2 trillion of global infrastructure investment will be needed in our target sectors between now and 2030, comprised of approximately $4.5 trillion for rail investments, $2.0 trillion for airports and $0.7 trillion for ports. Additionally, according to industry publications, the global demand for equipment financing over the next 5 to 15 years is approximately $6.1 trillion in our target sectors, comprised of approximately $4.6 trillion in the aviation sector, $1.4 trillion in offshore energy and $0.1 trillion in the intermodal transport sector. We expect this capital investment need to be driven by a number of factors, including global trade growth—which has, on average, doubled the rate of GDP growth over the past 30 years—and an emerging middle class in major markets around the world.
As the demand for infrastructure and related equipment continues to grow, we believe that traditional providers of capital for transportation projects and equipment—including many governments and European banks —are failing to keep pace, particularly following the 2008 to 2009 financial crisis and changes to the banking regulatory landscape. European banks, for example, were the dominant financing providers in the world’s transportation markets, accounting for over 50% of total transportation lending in 2006; by 2014, they accounted for only 40%, according to Bloomberg. We believe that this funding gap has led operators to rely more heavily on third parties like us to finance and own transportation infrastructure and equipment on their behalf. We believe that these funding shortages are likely to continue, and will be particularly acute for small and midsized projects as well as projects with unique characteristics that do not fit easily within pre-established financing criteria. We believe that the supply-demand imbalance for capital to fund essential infrastructure and equipment will lead to additional opportunities for us to acquire and operate assets on compelling terms, and that our access to capital and our Manager’s expertise and business and financing relationships position us well to take advantage of those opportunities. If we are able to continue to acquire assets on the basis that we have thus far, we believe that we will be well-positioned to grow our earnings and our cash flow available for dividends.
Market Sectors
Aviation
According to the IATA, global demand for passenger traffic has grown at an average annual rate of 5.5% over the past two decades, outpacing global GDP of 3.0% in the same period. According to the International Civil Aviation Organization, aviation passenger traffic (measured in passenger kilometers) has increased at approximately a 4.6% compound annual growth rate from 2004 to 2013. Furthermore, according to Boeing’s 2014 Commercial Market Outlook, this growth is expected to continue, rising at an average annual rate of 5% per annum over the next
117
Table of Contents
two decades. This projected increase in air travel presents an attractive opportunity for the private sector to invest in airports and aviation-related leasing equipment such as airplanes and engines. Airports are mission-critical infrastructure for global businesses and leisure travelers. There are over 42,000 airports globally, handling over 3.1 billion passengers and generating over $110 billion in revenue annually. Airports are long-lived assets with limited competition due to significant barriers to entry. Typically, private investments in airports are structured as a concession where the private investor receives the right to operate and collect income from the airport for a defined time period, with ownership being retained by governmental entities. Airports tend to generate significant cash flows with minimal maintenance capital expenditures.
The market for aviation equipment, namely commercial aircraft and engines, is also large and growing. According to Boeing, the global commercial passenger and cargo fleet of aircraft is expected to grow from approximately 21,000 at the end of 2013 to over 42,000 by 2033. We estimate that the combined value of the existing commercial aircraft and engine fleet is approximately $550 billion. Furthermore, aircraft operating leases, and thus aircraft lessors, are becoming increasingly important to the aviation industry. According to the IATA, over 30% of the current passenger fleet is subject to operating leases, and industry analysts expect this percentage to grow to over 50%.
Given the cost of such aviation assets, investors in this sector need access to capital as well as specialized technical knowledge in order to compete successfully. We believe that our Manager’s expertise and our access to financing positions us well for future acquisitions across the aviation sector. As of December 31, 2014, our aviation portfolio includes 13 commercial passenger aircraft and 27 commercial jet engines.
Energy
The market for energy infrastructure and transportation equipment includes land-based infrastructure such as terminals, storage facilities, pipelines and trucks as well as marine and offshore energy assets such as ships, barges and other related equipment.
Together, oil and natural gas represent a majority of energy consumed globally and are expected to remain so for the foreseeable future. According to the EIA, fossil fuels represented approximately 80% of energy consumption in 2014 and will continue to represent approximately 80% of energy consumption through 2040. Energy demand is expected to grow at an annual rate of 2% over the next 10 years, driven by increasing global population and GDP growth. This growth in energy demand is expected to result from both a larger pool of energy users as well as higher energy use per capita.
Within the energy infrastructure and transportation equipment market, we are focused on two sub-sectors: land-based infrastructure and offshore energy service equipment. Land-based infrastructure refers to facilities that enable the storage, unloading, loading and movement of crude oil and refined products or gas from producers to end users such as refineries. Because customers typically purchase capacity on a take-or-pay basis, the economics of these assets directly relate to the volume of throughput and are not directly affected by commodity prices. We believe that the demand for this infrastructure is growing, particularly in North America, where the market dislocations around the supply of oil and gas has resulted in significantly increased production of such products. For example, to support the flow of oil and gas production from newly developed North American oil and gas fields, industry experts estimate that $641 billion in new infrastructure investments will be needed over the next two decades, with much of that investment required during the next few years.
Recently, owners and operators of strategically-located rail assets have participated in the growth of the North American energy sector by transporting petroleum and natural gas products for both refining and export. Volumes of “crude-by-rail” have increased by more than sixteen times, from approximately 29,605 carloads in 2010 to 493,126 in 2014. This increase has been driven by growth in U.S. and Canadian crude oil production, which is expected to continue as hydraulic fracking technologies continue to be utilized and improved for greater production efficiency. The increased production has put pressure on existing pipeline infrastructure, driving
118
Table of Contents
shippers to seek alternative forms of transportation. Relative to traditional pipeline infrastructure for the transportation of oil, rail transportation provides greater market access, faster infrastructure deployment, end market flexibility and is more cost efficient for “heavier” crude oil generally produced from Canadian oil sands. We believe that this trend will continue and will lead to growth for our existing assets as well as opportunities for new acquisitions.
As of December 31, 2014, we own 60% of a multi-modal crude oil and refined products terminal in Beaumont, Texas called Jefferson Terminal which includes rail, truck, ship, storage and pipeline infrastructure. Jefferson Terminal provides key logistics services to nearby refineries, and is currently capable of handling approximately 230,000 barrels per day of free-flowing crude oil and bitumen. Jefferson Terminal currently has in place one take-or-pay contract with a customer providing for a minimum volume of 18,000 barrels per day, and we are actively negotiating additional contracts. In connection with our acquisition of Jefferson Terminal in 2014, we also acquired 300 tank railcars.
Offshore energy equipment refers to the assets used to support the production, processing and transportation of oil and natural gas from offshore (subsea) reserves. We are currently targeting energy service equipment investments within this market, including inspection, maintenance and repair-related opportunities in countries that have a strong national oil company presence. The world’s largest offshore energy markets include the North Sea, the Gulf of Mexico, Brazil, West Africa, Asia and the Middle East. From 2002 to 2011, approximately two-thirds of all new oil and gas discoveries worldwide were located offshore. Because of the significant time required between discovery and production, these discoveries provide a substantial backlog of demand for offshore energy assets and services.
We expect offshore E&P spending to grow significantly in the next few years. We estimate that approximately $250 billion is required to finance the construction of new offshore assets over the next five years in order to supply the existing growth in demand as well as replace retiring assets. We believe that the underlying market demand, together with the need for additional assets such as support and supply vessels, presents us with significant opportunities for new investment in the sector, and that our Manager’s expertise in the sector will enable us to take advantage of these opportunities. In particular, we believe that utilization of IMR assets will continue to remain stable despite fluctuations in oil and gas prices, particularly where those assets are deployed in support of national oil companies. We continue to focus on this area for opportunities within the offshore energy sector. As of December 31, 2014, we have four offshore energy investments, including one ROV support vessel, one AHTS vessel, one construction support vessel and one IMR vessel that is under construction.
Intermodal Transport
The Intermodal Transport, or containerized, market includes the infrastructure and equipment that enables the efficient movement of goods via shipping containers throughout multiple modes of transportation, including trucking, shipping and rail. The containerized market volume has grown at over 8% per year over the last three decades, more than double the annualized rate of world GDP growth during that same period. While the rate of growth in containerized trade has slowed in the last few years due to general economic conditions, we expect future growth to benefit from an increasing global middle class, driving increased consumption of goods and services worldwide. The Intermodal market includes infrastructure such as container seaports and inland terminals as well as equipment such as containers, chassis or trailers, generators sets, containerships, cranes and other loading equipment.
Seaports are the gateway for the global trade network. There are over 3,000 seaports worldwide, handling nearly 10 billion tons of cargo and generating over $55 billion in revenue annually. Of these, there are over 500 container seaports (handling the import and export of containerized goods) with an annual volume of approximately 700 million TEUs. Worldwide, seaport volumes are expected to increase 25% from 2012 to 2017. Ports are typically owned by government entities, and are overseen by local port authorities. Over the last two decades, governments have privatized port operations via long-term concession agreements with private parties. Seaports tend to generate strong cash flows via multiple revenue streams from infrastructure users with minimal routine maintenance capital expenditures.
119
Table of Contents
According to Harrison Consulting, the size of the world container fleet as of December 31, 2014 was 36 million TEUs. This equipment is owned or leased by the world’s shipping lines to move their cargo. Approximately 48% of the equipment is leased from container leasing companies and other third-party owners and the other 52% is owned directly. We believe that this market will continue to grow over the next few years and that our Manager’s expertise will enable us to take advantage of such future growth. To date, we have focused our investment activity on acquiring container boxes but we also consider other related opportunities across the sector, including in container seaports and terminals. As of December 31, 2014, our intermodal portfolio includes 152,000 shipping containers and related intermodal equipment.
Rail
The North American economy relies on an extensive network of railroads to transport raw materials such as petroleum, coal, ores, aggregates, lumber and grain as well as finished goods such as food products, paper products, automobiles and machinery. Railroads represent the largest component of North America’s freight transportation industry, carrying more freight than any other mode of transportation on a ton-mile basis. With a network of approximately 140,000 miles of track in the United States, railroads link businesses with each other domestically and with international markets through connections with ports and other international terminals. Unlike other modes of transportation, such as trucking (which uses highways, toll roads, etc.) and shipping companies (that utilize ports), railroad operators generally own or lease their infrastructure of track, land and rail yards. This rail infrastructure, most of which was originally established over 100 years ago, represents a limited supply of assets and a difficult-to-replicate network. According to the AAR, there were 574 freight railroads in the United States as of December 31, 2014.
The North American railroad industry has increased its share of freight ton-miles compared to other forms of freight transportation over the past quarter-century. Since deregulation in 1980, the railroad industry has continually improved its overall productivity and cost structure compared to other forms of freight transportation as it consumes less fuel and has lower labor costs per ton transported than other forms of freight transportation. According to the AAR, railroads are estimated to be approximately four times more fuel efficient than truck transportation and a single train can haul the equivalent of up to approximately 280 trucks. In 1980, one gallon of diesel fuel moved one ton of freight by rail an average of 235 miles, versus 2012 where the equivalent gallon of fuel moved one ton of freight an average of 476 miles by rail—representing a 103% increase over 1980. As a result of these cost advantages as well as increased highway congestion, the railroad industry’s share of U.S. freight ton-miles has increased from 22% in 1980 to 29% in 2011.
In addition to operating railroads, the North American rail market includes rail equipment such as railcars and locomotives. According to publicly available sources, there are approximately 2.0 million railcars currently in operation in North America. Approximately 59% of these railcars are leased to railroads and shipping companies, most under multi-year contracts.
We believe that demand for rail related infrastructure and equipment in North America will continue to grow due to the cost-efficient nature of rail. We believe that growing market demand, together with the capital intensive nature of the sector and our Manager’s expertise will enable us to make acquisitions and grow our exposure to the rail sector. As of December 31, 2014, we own one short-line railroad and 300 tank railcars.
Our Strategy
We invest across a number of major sectors within the transportation industry, including aviation, energy, intermodal transport and rail, and we may pursue acquisitions in other areas as and when they arise in the future. In general, we seek to own a diverse mix of high quality infrastructure and equipment within our target sectors that generate predictable cash flows, in markets that we believe provide the potential for strong long-term growth and attractive returns on deployed capital. We believe that by investing in a diverse mix of assets across sectors, we can select from among the best risk-adjusted investment opportunities, while avoiding overconcentration in any one
120
Table of Contents
segment, further adding to the stability of our business. We target IRRs of 15% to 25% with the use of what we believe to be reasonable leverage. From our inception in June 2011 to December 31, 2014, the IRR for our assets (calculated before overhead expenses and before any management fee or incentive allocation) was 18%.
We take a proactive investment approach – identifying key secular trends as they emerge within our target sectors and then pursuing what we believe are the most compelling opportunities within those sectors. We look for unique investments, including assets that are distressed or undervalued, or where we believe that we can add value through active management. We consider investments across the size spectrum, including smaller opportunities often overlooked by other investors, particularly where we believe we may be able to grow the investment over time. We believe one of our strengths is our ability to create attractive follow-on investment opportunities and deploy incremental capital within our existing portfolio. We have several such opportunities currently identified, including significant potential for future investment at our Jefferson Terminal, as discussed below.
Within each sector, we consider investments in operating infrastructure as well as in equipment that we lease to operators. Within the rail sector, for example, we target rail lines and rail terminals (which we classify as infrastructure) as well as railcars (which on a stand-alone basis we classify as leasing equipment). We believe that as owners of both infrastructure and equipment assets, we have access to more opportunities and can be a more attractive counterparty to the users of our assets. Our Manager has significant prior experience in all of our target sectors, as well as a network of industry relationships, that we believe positions us well to make successful acquisitions and to actively manage and improve operations and cash flow of our existing and newly-acquired assets. These relationships include senior executives at lessors and operators, end users of transportation and infrastructure assets, as well as banks, lenders and other asset owners.
Currently, our Equipment Leasing Business accounts for approximately 63% of our book equity. Longer-term, we expect that approximately half of our equity capital will be deployed in Equipment Leasing assets, and approximately half will be deployed in Infrastructure assets. We have a robust current pipeline of potential acquisition opportunities representing approximately $1.5 billion in equity capital. Of this current pipeline, approximately 30% of potential opportunities are Aviation-related, including aircraft, engines and airports; approximately 25% are Offshore Energy-related, including energy service companies; and the remainder includes opportunities for intermodal, rail and port-related investments. As of the date of this prospectus, we have not reached a binding agreement regarding any of these potential acquisition opportunities. Each opportunity is subject to, among other things, due diligence, further negotiations and entry into definitive documentation, and our ability to consummate any of these potential opportunities is subject to a number of additional factors and conditions.
Our Strengths
Strong Contracted Cash Flows Plus Growth Potential—We target a diverse mix of transportation infrastructure and equipment that delivers, on a combined basis, significant and predictable current cash flows plus the potential for earnings growth and asset appreciation. Our current portfolio includes assets in the aviation, energy, intermodal transport and rail sectors. Substantially all of our equipment assets are subject to ongoing leases providing stable operating cash flows equal to a significant percentage of the purchase price of our assets. Our holdings also include value-add infrastructure projects where we expect to be able to generate strong earnings and cash flow growth through development and asset repositioning. We expect our future investments to continue to deliver a mix of current cash flow and growth potential.
Opportunistic Investment Approach—We take an opportunistic approach to buying and managing assets—targeting assets that are distressed or undervalued, or where we believe we can add value through active management. We also try to develop incremental opportunities to deploy significant amounts of capital through follow-on investments in our existing assets in order to driver cash flow and growth. In these ways, we seek to deliver attractive returns on our portfolio without heavy reliance on financial leverage. As of December 31, 2014,
121
Table of Contents
our leverage on a weighted basis across our existing portfolio is approximately 24% of our total capital. While leverage on any individual asset may vary, we target overall leverage for our assets on a consolidated basis of no greater than 50% of our total capital.
Experienced Investment Team—Our Manager is an affiliate of Fortress, a leading, diversified global investment firm with approximately $67.5 billion under management as of December 31, 2014. Founded in 1998, Fortress manages assets on behalf of over 1,500 institutional clients and private investors worldwide across a range of private equity, credit, liquid hedge funds and traditional asset management strategies. Over the last ten years, Fortress has been one of the industry’s most active investors in transportation-related infrastructure and equipment globally. The Fortress team of investment professionals, currently led by Joseph Adams, has over fifty years of combined experience in acquiring, managing and marketing transportation and infrastructure assets. The team has been working directly together for over ten years and has collectively invested almost $3 billion in equity capital and purchased over $17 billion in transportation and infrastructure assets since 2002. Some of our Manager’s prior transactions include the creation of Aircastle Ltd., one of the world’s leading aircraft lessors; SeaCube Container Leasing Ltd., one of the world’s largest container lessors; RailAmerica Inc., a leading short-line rail operator; and Global Signal Inc., an owner operator and lessor of towers and other communication structures for wireless communications. Aircastle Ltd., SeaCube Container Leasing Ltd., RailAmerica Inc. and Global Signal Inc. generated total returns (and IRRs) of 40% (5%), 153% (48%), 83% (23%) and 229% (61%), respectively, for public investors that purchased shares in the IPO and retained those shares until sale or in the case of Aircastle Ltd continue to own.
Extensive Relationships with Experienced Operators—Through our Manager, we have numerous relationships with operators across the transportation industry. We typically seek to partner and often co-invest with experienced operators and owners when making acquisitions, and our existing relationships enable us not only to source opportunities, but also to maximize the value of each asset post-closing. Our strategy is to actively manage our investments to improve operations, grow cash flows and develop incremental investment opportunities.
We Plan to Pay and Grow Our Dividends—We view FTAI as a total return investment comprised of current yield and consistent dividend growth. Since inception through March 31, 2015, we have made a total of fourteen regular quarterly capital distributions which have been characterized as returns of capital to our investors that have grown consistently over time. For the years ended December 31, 2014 and 2013, capital distributions to members were approximately $76.0 million and $39.6 million, respectively. See “Management’s Discussion and Analysis of Financial Condition and Results of Operations—Liquidity” for a further discussion of FAD, including its potential limitations as a liquidity measure. We intend to continue paying regular quarterly dividends to our shareholders from funds available for distribution, and we currently target an annual growth rate of at least 10% for our regular dividends. Our long term goal is to maintain a payout ratio of between 50-60% of cash flows available for distribution, with remaining amounts used primarily to fund our future acquisitions and opportunities. Our ability to pay dividends will also be subject to certain risks and limitations. As a public company, there can be no assurance that we will pay dividends in amounts or on a basis consistent with prior distributions to our investors, if at all. See “—Our Organization Structure” for information regarding our organization structure following the consummation of this offering and “Dividend Policy.”
Existing Portfolio
We focus on assets that generate contracted cash flow and also have potential upside from growth in earnings and asset appreciation. We target primarily equity ownership of assets or entities that own assets. Our existing assets are made up of both operating companies that own transportation-related infrastructure such as our rail assets as well as transportation equipment that we lease out. Our average investment size (equity capital) as of December 31, 2014 was approximately $16 million.
Our transportation-related infrastructure operating companies are stand-alone companies that either directly own or operate their assets or operate them through a long-term concession or lease arrangement. Our customers
122
Table of Contents
pay for the use of the asset typically based on the volume of use or committed availability. We generally have multiple customers and negotiate rates and usage of the assets based on the demand by our customers and the availability of the asset at the time. We typically pay for the operating expenses of the asset and as such retain the risks and opportunities of performance.
For our equipment, we lease our assets to our customers on either operating or direct finance leases. Our operating leases are typically triple net leases, whereby the lessee pays rent as well as taxes, insurance and maintenance expenses that arise from the use of the leased equipment, with fixed per diems. Under operating leases, we bear the re-leasing and residual value risks. Under a direct finance lease, the customer commits to a fixed lease term and typically receives a bargain purchase option at the expiration of the lease. Under this type of lease, the substantive risks and rewards of equipment ownership are transferred to the lessee. The lease payments are segregated into principal and interest components similar to a loan. The interest component, calculated using the effective interest method over the term of the lease, is recognized by us as finance revenue. The principal component of the lease payments is reflected as a reduction to the net investment in the direct finance lease assets in our cash flow statement. As a result, we do not bear utilization or residual value risk for assets that are subject to direct finance leases.
Our strategy is purposefully broad to enable us to make attractive acquisitions of a wide array of assets. Currently, our existing portfolio consists of assets in four industry sectors: aviation, energy, intermodal transport and rail. However, we plan to opportunistically acquire assets across the entire transportation and transportation-related infrastructure and equipment market—including in airports, seaports and other transportation and infrastructure-related assets—in order to find the highest quality assets, take advantage of attractive acquisition opportunities and focus on value-oriented investments with upside potential.
Infrastructure
Jefferson Terminal
In August 2014, we and certain other Fortress affiliates purchased substantially all of the assets of Jefferson Terminal, a Texas-based group of companies developing crude oil and refined products logistics assets. Our equity interest in Jefferson is approximately 60%, and other affiliates of Fortress own an additional 20%.
Jefferson is currently developing a large multi-modal crude oil and refined products handling terminal at the Port of Beaumont, Texas (the “Port”) and also owns several other key assets involved in the transportation and processing of crude oil and related products. The majority of Jefferson’s revenue is initially expected to be derived from operations at Jefferson Terminal. Jefferson Terminal has a unique combination of direct rail service from three Class I railroads, barge docks and deep water ship loading capacity, capabilities to handle multiple types of crude oil including free-flowing crude as well as bitumen, and a prime location close to Port Arthur, which is the largest single refinery market in North America by capacity. As a result, Jefferson is ideally positioned to take advantage of the rapidly growing crude-by-rail and crude export markets, which are being driven by a boom in U.S. and Canadian oil production. Heavy and extra heavy crude from western Canada (extra heavy crude is predominantly known as ‘bitumen’) is in especially high demand in the Gulf Coast because refineries in the area are configured to handle heavier blends of crude (previously sourced almost exclusively from Mexico and Venezuela) than those in other parts of the U.S. Canadian bitumen offers Gulf Coast refineries an excellent feedstock, which is most cheaply and easily transported by rail rather than pipeline because of its high viscosity.
Jefferson Terminal is located on approximately 250 acres of land at the Port. Today, Jefferson leases 197.5 acres from the Port under three separate leases. The three leases have 10-year primary terms, with two 10-year extensions at Jefferson’s option. Assuming we were to exercise these extension options, the leases would terminate in June 2042 (20 acres), July 2043 (32.5 acres), and March 2045 (145 acres). As part of the leases, Jefferson has been granted the concession to operate as the sole handler of liquid hydrocarbons at the Port.
123
Table of Contents
Jefferson does not own any land at Jefferson Terminal, but does own the equipment and leasehold improvements carried out as part of the Jefferson Terminal build-out. The Port has contributed over $40 million in infrastructure related to Jefferson Terminal, and plans to invest another $20 million over the next six to 12 months.
Jefferson has finished construction and begun operations on both the light oil unloading track (the “Light System”), which has the capacity to handle up to two unit trains (120 cars) per day of light, free-flowing crude, and the heavy oil unloading track (the “Heavy System”), which has the capacity to unload up to one unit train per day of heavy crude or bitumen requiring heating. In addition, Jefferson Terminal has two truck unloading bays, capable of handling approximately 50 trucks, each carrying 170 barrels, per day. In aggregate, including rail and truck handling, Jefferson Terminal has a total unloading capacity of 230,000 barrels per day, and storage tanks, either completed or under construction, with capacity to hold approximately 700,000 barrels. Today, crude oil is brought into the Terminal by rail or truck and then either held in storage, or loaded directly onto a barge for transportation to one of the local refineries or larger storage hubs. We also have the ability to unload or load directly from or to an ocean-going ship (up to Aframax size), which would allow our customers to export Canadian crude or refined U.S. product. We are currently developing direct pipeline connections to local refineries, which will provide them with a lower cost of transportation to and from the Terminal.
The immediate Port Arthur area is home to 1.5 Mb/d of refining capacity, including the largest refinery in North America, owned by Motiva (a joint venture between Shell and Saudi Aramco). Jefferson also expects to serve refineries in the nearby Lake Charles, Louisiana area, which contains another 700 Mb/d of refining capacity, as well as export markets for Canadian crude and refined products.
In addition to Jefferson Terminal, Jefferson owns several other energy and transportation-related assets, including 300 tank railcars; a gas processing and condensate stabilization plant, currently being refurbished and slated for operation in 2016; a pipeline, and pipeline rights-of-way; and an additional private marine terminal that can be developed to load refined petroleum products onto barges. These assets represent additional opportunities to generate stable, recurring cash flow and can be developed in the future to take advantage of the growing demand for crude oil transportation assets and the shifting landscape of U.S. domestic energy policy, including the opening up for export of domestically produced crude oil and related products. We currently expect to invest approximately $60 million of equity capital in Jefferson Terminal over the next twelve months, with more than $110 million of equity capital in potential investment opportunities at Jefferson further in the future.
CMQR
In the second quarter of 2014, we acquired via a bankruptcy proceeding certain assets and assumed certain liabilities of the Montreal, Maine & Atlantic Railroad. The total purchase price was $15.2 million. In addition, we have injected an additional $8.2 million for working capital, capital expenditures and deal expenses as of December 31, 2014. Subsequent to the purchase, MM&A was renamed the Central Maine & Quebec Railroad.
CMQR is a 480-mile Class II railroad that runs from Montreal to the east coast of Maine, primarily transporting pulp and paper, construction products and chemicals. The CMQR offers the most direct route from ports in Montreal and on the East Coast of the United States to manufacturers and other customers in Maine and Quebec. We believe that CMQR represents an investment in critical infrastructure with a captive customer base at an attractive valuation and significant growth potential. Following the acquisition close in June 2014, we put in place a new management team composed of a number of former RailAmerica, Inc. executives, including John Giles, the former CEO of RailAmerica, Inc. From July 2014 to March 2015, CMQR’s monthly revenue grew from $1.1 million to $2.2 million, an increase of over 100%. We expect this positive trend to continue in 2015 as we develop new commercial opportunities and increase our freight share with existing customers.
Leasing Equipment
Aviation
We own and manage 40 aviation assets, including 13 commercial passenger aircraft and 27 commercial jet engines.
124
Table of Contents
As of December 31, 2014, 13 of our commercial jet engines, and all of our commercial aircraft were leased to operators or other third parties. Aviation assets currently off lease are either undergoing repair and/or maintenance, or are currently held in short term storage awaiting a future lease. On an equity-weighted basis, our aviation equipment was approximately 93% utilized as of March 31, 2015. Our aircraft assets currently have a weighted average remaining lease term of 33 months, and our engine assets currently have an average remaining lease term of 13 months. In each case, we work closely with our existing customers to extend current leases, thus avoiding downtime and remarketing costs. The chart below describes the assets in our Aviation Leasing segment:
| Engine Assets | ||||||||||
| Engine Type | Number | Manufacturer | Aircraft Compatibility | Economic Interest (%) | ||||||
|
CFM56-3 |
9 | CFMI | B737-300 / B737-400 / B737-500 | 100% | ||||||
|
CF6-80 |
6 | General Electric | B747 / B767 | 100% | ||||||
|
PW2037 |
4 | Pratt & Whitney | B757 | 100% | ||||||
|
PW4056 |
6 | Pratt & Whitney | B747 / B767 | 100% | ||||||
| RB211 |
2 | Rolls Royce | B757 | 100% | ||||||
| Aircraft Assets | ||||||||
| Airframe Type | Number | Manufacturer | Economic Interest (%) | |||||
|
B757-200 |
1 | Boeing | 100% | |||||
|
B767-300ER |
2 | Boeing | 100% | |||||
|
A320-200 |
3 | Airbus | 100% | |||||
|
B737-800 |
2 | Boeing | 100% | |||||
|
B737-700 |
5 | Boeing | 100% | |||||
Offshore Energy
We own one ROV support vessel, one construction support vessel and one AHTS vessel. In addition we have contracted with a Norwegian shipyard to build a new IMR vessel. Our assets in our Offshore Energy segment are subject to long-term charters, whereby the operator assumes the operating expense and utilization risk for the vehicles. The AHTS vessel is a 2010-built DP-1, 5,150 bhp vessel used in the offshore oil and gas industry. The AHTS vessel was built by Guangzhou Panyu Lingshan Shipyard Ltd. in China and is designed to provide support services to offshore platforms, rigs and larger construction vessels. The AHTS vessel has accommodation for 30 personnel and is equipped with an advanced firefighting system and rescue boat to provide standby / emergency rescue services and a winch with total bollard pull of 68.5 tons. The AHTS vessel is subject to a 10-year direct finance lease with a local Mexican operator. We own 100% of the AHTS vessel and our finance lease will expire in November 2023. The AHTS vessel is currently unlevered.
The construction support vessel is a 2014-built subsea construction support vessel for the SURF (subsea, umbilicals, risers, and flowlines), IMR, and Pipelay markets. The construction support vessel was built at Davie Shipyard in Quebec, Canada and is designed to provide a range of services including flexible and small-diameter rigid pipelay, cable lay, saturation diving, ROV support, well intervention, top hole drilling and subsea installation. Our construction support vessel has advanced dynamic positioning (DP-3) systems, a 250-ton subsea crane, a moon pool, 2,000 square meters of open deck space and 100-person accommodation. The construction support vessel is mobilizing for a project in Angola. The construction support vessel is on a bareboat charter that has a fixed period that ends during July 2015; however, the current charterer may extend the charter until September 2015. We are currently in discussions with multiple parties regarding a new charter for our construction support vessel. The construction support vessel is 50% levered as of December 31, 2014.
125
Table of Contents
Our ROV support vessel is a 2011-built DP-2, 6,000 bhp construction support vessel that is used in the offshore oil and gas industry. The ROV vessel was built by Jaya Holdings at their yard in Batam, Indonesia and is designed to provide construction support services including ROV support, dive support, accommodation and subsea and platform lifts. The ROV vessel has accommodation for 120 personnel, a moon pool, a 50-ton crane, and can carry up to three ROVs. The ROV vessel is subject to a six-year bareboat charter with a local Malaysian operator, who in turn leases the vessel to major oil companies in that region. We own 85% of the vessel, and our lessee is a co-owner of the remaining 15%. Our bareboat charter expires in April 2019. The ROV support vessel is currently unlevered.
Our IMR vessel is under construction at the Kleven Shipyard in Norway and is scheduled to be delivered during December 2015. The vessel is a DP-2 construction support and IMR vessel with a 150-ton crane, a moon pool, 1,100 square meters of deck space and accommodation for 90 personnel. The vessel will have reduced fuel consumption and lower emissions and is designed for a broad range of construction support activities including ROV support, subsea installations, well intervention, top-hole drilling and supply and transport duties. We own 50% of the IMR vessel and our lessee is a co-owner of the remaining 50%. Upon delivery, the vessel will enter an 8-year bareboat charter. We expect to arrange debt financing for this vessel prior to delivery.
The chart below describes the assets in our Offshore Energy segment as of December 31, 2014:
| Offshore Energy Assets | ||||||||||
| Asset Type | Year Built | Description | Lease Expiration | Economic Interest (%) | ||||||
|
AHTS Vessel |
2010 | Anchor handling tug supply vessel with accommodation for 30 personnel and a total bollard pull of 68.5 tons |
November 2023 | 100% | ||||||
| Construction Support Vessel |
2014 | Construction support vessel with 250-ton crane, 2,000 square meter deck space, a moon pool, and accommodation for 100 personnel |
July 2015 (firm period) |
100% | ||||||
| ROV Support Vessel |
2011 | Construction support vessel with accommodation for 120 personnel, a moon pool, and a 50-ton crane |
April 2019 | 85% | ||||||
| IMR Vessel |
|
Estimated 2015 |
|
IMR vessel with 150-ton crane, 1,100 square meter deck space, a moon pool, accommodation for 90 personnel |
December 2023 | 50% | ||||
Intermodal Transport
We own, either directly or through a joint venture, interests in approximately 152,000 maritime shipping containers and related equipment through three separate portfolios. Of these three portfolios, one is comprised of approximately 5,000 shipping containers and related equipment that are subject to direct finance leases with a major US-based shipping line. The portfolio consists of a mix of intermodal equipment, including 45’ Dry and Reefer Containers, 40’ Reefer Containers and 53’ Dry Containers, in addition to generator sets and 23’, 40’ and 53’ Chassis. The equipment is subject to direct finance leases that expire in ~0.5-3.5 years, at which point the lessee has an obligation to purchase the containers at a fixed price. All of these shipping containers are currently leased to operators or other third parties, and as of December 31, 2014 are 70% levered.
126
Table of Contents
We also own a container portfolio that is comprised of approximately 40,000 shipping containers that are subject to a direct finance lease with a major Asian shipping line. The containers in this portfolio consist of 20’ Dry, 40’ Dry and 40’ High Cube dry containers (“HC Dry”). The containers are subject to a direct finance lease that expires in December 2017, at which point the lessee has an obligation to purchase the containers at a fixed price. All of these shipping containers are currently leased to operators or other third parties, and as of December 31, 2014 are 65% levered.
We also own a 51% interest in a portfolio of approximately 105,000 shipping containers of various types, including both dry and refrigerated units. Of these, approximately 66,500 are subject to direct finance leases with seven separate shipping lines, and the majority of those finance leases contain bargain purchase options at lease expiration. The remaining 38,500 containers in this portfolio are subject to operating leases with a large Asian shipping line with an average remaining lease term of approximately one year. Across the portfolio of 105,000 containers, the remaining average lease term is approximately two years. All of these shipping containers are currently leased to operators or other third parties, and as of December 31, 2014 are 75% levered.
The chart below describes the assets in our Shipping Containers segment as of December 31, 2014:
| Shipping Containers Assets | ||||||||||||
| Number | Type | Average Age | Lease Type | Customer Mix | Economic Interest (%) | |||||||
|
Portfolio #1 7,000 |
45’ Dry 45’ Reefer 40’ Reefer 53’ Dry 23’ Chassis 40’ Chassis 53’ Chassis |
~10 years | Direct Finance Lease |
1 Customer | 100 | % | ||||||
|
Portfolio #2 40,000 |
20’ Dry 40’ Dry 40’ HC Dry |
~10 years | Direct Finance Lease |
1 Customer | 100 | % | ||||||
|
Portfolio #3 105,000 |
20’ Dry 20’ Reefer 20’ Specials 40’ Dry 40’ HC Dry 40’ HC Reefer 40’ Specials 45’ Dry |
~8 Years | Direct Finance Lease/Operating Lease |
8 Customers | 51 | % | ||||||
Asset Acquisition Process
Our strategy is to acquire assets that are essential to the transportation of goods and people globally. We acquire assets that are used by major operators of transportation and infrastructure networks. We seek to acquire assets and businesses that we believe operate in sectors with long-term macroeconomic growth opportunities and that have significant cash flow and upside potential from earnings growth and asset appreciation. We target IRRs of 15% to 25% with the use of what we believe to be reasonable leverage. From our inception in June 2011 to December 31, 2014, the IRR for our assets (calculated before overhead expenses and before any management fee or incentive allocation) was 18%.
We take a proactive approach to markets and opportunities by first developing an asset acquisition strategy with our Manager and then pursuing optimal opportunities within that strategy. In addition to relying on our own experience, we source new opportunities by making use of our Manager’s network of industry relationships in
127
Table of Contents
order to find, structure and execute attractive acquisitions. These relationships include senior executives at industry leading operators, end users of the assets as well as banks, lenders and other asset owners. We believe that sourcing assets both globally and through multiple channels will enable us to find the most attractive opportunities. We are selective in the assets we pursue, and efficient in the manner in which we pursue them. For example, since March 2014, we have evaluated over 120 opportunities, conducted partial to full due diligence on 31 of these opportunities, and subsequently closed 14 transactions.
Once attractive opportunities are identified, our Manager performs detailed due diligence on each of our potential acquisitions. Due diligence on each of our assets always includes a comprehensive review of the asset itself as well as the industry and market dynamics, competitive positioning, and financial and operational performance. Where appropriate, our Manager conducts physical inspections, a review of the credit quality of each of our counterparties, the regulatory environment, and a review of all material documentation. In some cases, third-party specialists are hired to physically inspect and/or value the target assets.
We and our Manager also spend a significant amount of time on structuring our acquisitions to minimize risks while also optimizing expected returns. We plan to employ what we believe to be reasonable amounts of leverage in connection with our acquisitions. In determining the amount of leverage for each acquisition, we consider a number of characteristics, including, but not limited to, the existing cash flow, the length of the lease or contract term, and the specific counterparty. While leverage on any individual asset may vary, we target overall leverage for our assets on a consolidated basis of no greater than 50% of total capital.
Additional Acquisition Opportunities
In addition to our current investment portfolio, we have been and continue to be active in evaluating and pursuing various attractive acquisition opportunities. We are currently evaluating over $1.5 billion (measured by equity capital) of potential Infrastructure and Equipment Leasing acquisitions. Of this current pipeline, approximately 30% of potential opportunities are Aviation-related, including aircraft, engines and airports; approximately 25% are Offshore Energy-related, including energy service companies; and the remainder includes opportunities for intermodal, rail and port-related investments. These opportunities are in varying stages of development from preliminary diligence, to submission of a nonbinding offer, and through delivery of a non-binding letter of intent and negotiation of key terms, in a variety of different sectors, including both the sectors in which we have historically been active (aviation, energy, intermodal and rail), as well as other transportation or infrastructure-related assets, including but not limited to airports and seaports. However, as of the date of this prospectus, we have not reached a binding agreement regarding any of these potential acquisition opportunities. Each opportunity is subject to, among other things, due diligence, further negotiations and entry into definitive documentation, and our ability to consummate any of these potential opportunities is subject to a number of additional factors and conditions. See “Prospectus Summary—Recent Developments.” There can be no assurance that we will be successful in acquiring any such assets.
Asset Management
Our Manager actively manages and monitors our portfolios of assets on an ongoing basis, and in some cases engages third parties to assist with the management of those assets. Invoices from each of our customers are typically issued and collected on a monthly basis. Our Manager frequently reviews the status of all of our assets, and in the case that any are returning from lease or undergoing repair, outlines our options, which may include the re-lease or sale of that asset. In the case of operating infrastructure, our Manager plays a central role in developing and executing operational, finance and business development strategies. On a periodic basis, our Manager discusses the status of our acquired assets with our board of directors.
In some situations, we may acquire assets through a joint venture entity or own a minority position in an investment entity. In such circumstances, we will seek to protect our interests through appropriate levels of board representation, minority protections and other structural enhancements.
128
Table of Contents
We and our Manager maintain relationships with operators worldwide and, through these relationships, hold direct conversations as to leasing needs and opportunities. Where helpful, we reach out to third parties who assist in leasing our assets. As an example, we often partner with MRO facilities in the aviation sector to lease these engines and support airlines’ fleet management needs.
While we expect to hold our assets for extended periods of time, we and our Manager continually review our assets to assess whether we should sell or otherwise monetize them. Aspects that will factor into this process include relevant market conditions, the asset’s age, lease profile, relative concentration or remaining expected useful life.
Credit Process
We and our Manager monitor the credit quality of our various lessees on an ongoing basis. This monitoring includes interacting with our customers regularly to monitor collections, review period financial statements and discuss their operating performance. Most of our lease agreements are written with conditions that require reporting on the part of our lessees, and we actively reach out to our lessees to maintain contact and monitor their liquidity positions. Furthermore, many of our leases and contractual arrangements include credit enhancement elements that provide us with additional collateral or credit support to strengthen our credit position. Since our inception through December 31, 2014, we have not experienced any material credit losses.
We are subject to concentrations of credit risk with respect to amounts due from customers on our direct finance leases and operating leases. We attempt to limit credit risk by performing ongoing credit evaluations. See “—Customers.”
Customers
Our customers consist of global operators of transportation and infrastructure networks, including airlines, offshore energy service providers and major shipping lines. We maintain on-going relationships and discussions with our customers and seek to have consistent dialogue. In addition to helping us monitor the needs and quality of our customers, we believe these relationships help source additional opportunities and gain insight into attractive opportunities in the transportation and infrastructure sector. Given our limited operating history, a substantial portion of our revenue has historically been derived from a small number of customers. For the years ended December 31, 2014 and 2013, we earned approximately 39% and 70%, respectively, of our revenue from our largest customers. We derive a significant percentage of our revenue within specific sectors from a limited number of customers. However we do not think that we are dependent upon any particular customer, or that the loss of one or more of them would have a material adverse effect on our business or the relevant segment, because of our ability to release assets at similar terms following the loss of any such customer. See “Risk Factors—Contractual defaults may adversely affect our business, prospects, financial condition, results of operations and cash flows by decreasing revenues and increasing storage, positioning, collection, recovery and lost equipment expenses.”
Please refer to Note 15 of our consolidated financial statements for a report, by segment, of revenues from our external customers, and net income (loss) attributable to members for the years ended December 31, 2014 and 2013, as well as a report, by segment, of our total assets as of December 31, 2014 and 2013.
Competition
The business of acquiring, managing and marketing transportation and transportation-related infrastructure assets is highly competitive. Market competition for acquisition opportunities includes traditional transportation and infrastructure companies, commercial and investment banks, as well as a growing number of non-traditional participants, such as hedge funds, private equity funds, and other private investors.
129
Table of Contents
Additionally, the markets for our products and services are competitive, and we face competition from a number of sources. These competitors include engine and aircraft parts manufacturers, aircraft and aircraft engine lessors, airline and aircraft services and repair companies, aircraft spare parts distributors, offshore services providers, maritime equipment lessors, shipping container lessors, container shipping lines, and other transportation and infrastructure equipment lessors.
We compete with other market participants on the basis of industry knowledge, availability of capital, and deal structuring experience and flexibility, among other things. We believe our Manager’s experience in the transportation and the transportation-related infrastructure industry, and our access to capital, in addition to our focus on diverse asset classes and customers provides a competitive advantage versus competitors that maintain a single sector focus.
Environmental Regulations
We are subject to federal, state, local and foreign laws and regulations relating to the protection of the environment, including those governing the discharge of pollutants to air and water, the management and disposal of hazardous substances and wastes, the cleanup of contaminated sites and noise and emission levels. Under some environmental laws in the United States and certain other countries, strict liability may be imposed on the owners or operators of assets, which could render us liable for environmental and natural resource damages without regard to negligence or fault on our part. We could incur substantial costs, including cleanup costs, fines and third-party claims for property or natural resource damage and personal injury, as a result of violations of or liabilities under environmental laws and regulations in connection with our or our lessee’s or charterer’s current or historical operations. While we typically maintain liability insurance coverage and typically require our lessees to provide us with indemnity against certain losses, the insurance coverage is subject to large deductibles, limits on maximum coverage and significant exclusions and may not be sufficient or available to protect against any or all liabilities and such indemnities may not cover or be sufficient to protect us against losses arising from environmental damage. In addition, changes to environmental standards or regulations in the industries in which we operate could limit the economic life of the assets we acquire or reduce their value, and also require us to make significant additional investments in order to maintain compliance.
Employees
Our Manager provides a management team and other professionals who are responsible for implementing our business strategy and performing certain services for us, subject to oversight by our board of directors, and as a result, we have no employees other than 26 individuals employed by Jefferson and 105 individuals employed by CMQR, of which 43 CMQR employees are covered under a collective bargaining agreement that has currently expired and is under negotiation. From time to time, certain of our officers may enter into written agreements with us that memorialize the provision of certain services; these agreements do not provide for the payment of any cash compensation to such officers from us. The employees of our Manager are not a party to any collective bargaining agreement. In addition, our Manager expects to utilize third party contractors to perform services and functions related to the operation and leasing of our assets such as aircraft, jet engines and shipping containers. These functions may include billing, collections, recovery and asset monitoring.
Insurance
Our leases generally require that our customers carry physical damage and liability insurance providing primary insurance coverage for loss and damage to our assets as well as for related cargo and third parties while the assets are on lease. In addition, in certain cases, we maintain contingent liability coverage for any claims or losses on our assets while they are on hire or otherwise in the possession of a third-party. Finally, we procure insurance for our assets when they are not on hire or are otherwise under our control.
130
Table of Contents
Properties and Offices
As of December 31, 2014, we did not own any real estate or other real property materially important to our operation. Our administrative and principal executive offices are located at 1345 Avenue of the Americas, New York, NY 10105. We believe that our office facilities are suitable and adequate for our business as it is contemplated to be conducted.
Conflicts of Interest
Although we have established certain policies and procedures designed to mitigate conflicts of interest, there can be no assurance that these policies and procedures will be effective in doing so. It is possible that actual, potential or perceived conflicts of interest could give rise to investor dissatisfaction, litigation or regulatory enforcement actions.
One or more of our officers and directors have responsibilities and commitments to entities other than us. For example, we have some of the same directors and officers as other entities affiliated with Fortress. Joseph P. Adams, Jr., our Chief Executive Officer, is also a director of Florida East Coast Industries, Inc. Florida East Coast Railway Corp., Seacastle Operating Company Ltd. and Trac Intermodal Holding Corp., each of which is a Fortress-controlled entity engaging, directly or through its affiliates, in transportation and infrastructure-related businesses. Jonathan G. Atkeson, our Chief Operating Officer, is also a director of Seacastle Operating Company Ltd. and Trac Intermodal Holding Corp., each of which is a Fortress-controlled entity engaging, directly or through its affiliates, in transportation and infrastructure-related businesses. Cameron D. MacDougall serves as secretary (or an equivalent function) in numerous Fortress affiliates. In addition, each of Messrs. Adams, Atkeson and MacDougall are limited partners in Fortress-managed private investment funds which have invested, and may invest, in sectors in which we seek to acquire assets. In addition, we do not have a policy that expressly prohibits our directors, officers, securityholders or affiliates from engaging in business activities of the types conducted by us for their own account. However, our code of business conduct and ethics prohibits, subject to the terms of our organizational documents, the directors, officers and employees of our Manager from engaging in any transaction that involves an actual conflict of interest with us. In other words, this means that our Manager and its members, managers, officers and employees may pursue acquisition opportunities in transportation and transportation-related infrastructure assets, and that we may acquire or dispose of transportation or transportation-related infrastructure assets in which such persons have a personal interest, subject to pre-approval by the independent members of our board of directors in certain circumstances. In the event of a violation of this code of business of conduct and ethics that does not constitute bad faith, willful misconduct, gross negligence or reckless disregard of our Manager’s duties, neither or Manager nor its members, managers, officers or employees will be liable to us. See “Risk Factors—Risks Related to Our Manager—There are conflicts of interest in our relationship with our Manager.”
Our key agreements, including our Management Agreement, the Partnership Agreement, and our operating agreement were negotiated among related parties, and their respective terms, including fees and other amounts payable, may not be as favorable to us as terms negotiated on an arm’s-length basis with unaffiliated parties. Our independent directors may not vigorously enforce the provisions of our Management Agreement against our Manager. For example, our independent directors may refrain from terminating our Manager because doing so could result in the loss of key personnel.
The structure of the Manager’s and the General Partner’s compensation arrangements may have unintended consequences for us. We have agreed to pay our Manager a management fee and the General Partner is entitled to receive incentive allocation from Holdco that are each based on different measures of performance. Consequently, there may be conflicts in the incentives of our Manager to generate attractive risk-adjusted returns for us. In addition, because the General Partner and our Manager are both affiliates of Fortress, the incentive allocations to the General Partner may cause our Manager to place undue emphasis on the maximization of earnings, including through the use of leverage, at the expense of other objectives, such as preservation of
131
Table of Contents
capital, to achieve higher incentive allocations. Investments with higher yield potential are generally riskier or more speculative than investments with lower yield potential. This could result in increased risk to the value of our portfolio of assets and your investment in us.
We may compete with entities affiliated with our Manager or Fortress for certain target assets. From time to time, affiliates of Fortress may focus on investments in assets with a similar profile as our target assets that we may seek to acquire. These affiliates may have meaningful purchasing capacity, which may change over time depending upon a variety of factors, including, but not limited to, available equity capital and debt financing, market conditions and cash on hand. Fortress has multiple existing and planned funds focused on investing in one or more of the sectors in which we acquire assets, each with significant current or expected capital commitments. We may co-invest with these funds in certain target assets. Fortress funds generally have a fee structure similar to ours, but the fees actually paid will vary depending on the size, terms and performance of each fund. Fortress had approximately $67.5 billion of assets under management as of December 31, 2014.
Our Manager may determine, in its discretion, to make a particular acquisition through an investment vehicle other than us. Investment allocation decisions will reflect a variety of factors, such as a particular vehicle’s availability of capital (including financing), investment objectives and concentration limits, legal, regulatory, tax and other similar considerations, the source of the opportunity and other factors that the Manager, in its discretion, deems appropriate. Our Manager does not have an obligation to offer us the opportunity to participate in any particular investment, even if it meets our asset acquisition objectives. In addition, employees of Fortress or certain of its affiliates—including personnel providing services to or on behalf of our Manager—may perform services for Fortress affiliates that may acquire or seek to acquire transportation and infrastructure-related assets.
Emerging Growth Company Status
We are an “emerging growth company” as defined in the JOBS Act. As such, we have elected to take advantage of certain exemptions from various reporting requirements that are applicable to other public companies that are not “emerging growth companies” including, but not limited to, not being required to comply with the auditor attestation requirements of Section 404 of the Sarbanes-Oxley Act and exemptions from the requirements of holding a non-binding advisory vote on executive compensation and shareholder approval of any golden parachute payments not previously approved. Because we will take advantage of any or all of these exemptions, we do not know if some investors will find our common shares less attractive as a result. The result may be a less active trading market for our common shares, and our share price may be more volatile.
In addition, Section 107 of the JOBS Act also provides that an “emerging growth company” can take advantage of the extended transition period provided in Section 13(a) of the Exchange Act, for complying with new or revised accounting standards. In other words, an “emerging growth company” can delay the adoption of certain accounting standards until those standards would otherwise apply to private companies. We have not elected to advantage of this extended transition period.
We could remain an “emerging growth company” until the earliest of (i) the last day of the first fiscal year in which our annual gross revenues exceed $1 billion, (ii) the last day of the fiscal year following the fifth anniversary of the date of this offering, (iii) the date that we become a “large accelerated filer” as defined in Rule 12b-2 under the Exchange Act, which would occur if the market value of our common shares that is held by non-affiliates exceeds $700 million as of the last business day of our most recently completed second fiscal quarter, or (iv) the date on which we have issued more than $1 billion in non-convertible debt during the preceding three-year period.
132
Table of Contents
Legal Proceedings
In the ordinary course of conducting our business, we may become involved in various legal actions and other claims. Litigation is subject to many uncertainties, the outcome of individual litigated matters is not predictable with assurance, and it is reasonably possible that some of these matters may be decided unfavorably to the Company. We are not currently subject to any legal proceedings outside of the ordinary course of conducting our business.
Corporate History
We were incorporated as Fortress Transportation and Infrastructure Investors Ltd. on October 23, 2013. We were domesticated in Delaware as a limited liability company and changed our name to Fortress Transportation and Infrastructure Investors LLC on February 13, 2014. Our business has been, and will continue to be, conducted through our subsidiary, Fortress Worldwide Transportation and Infrastructure General Partnership, or Holdco. Holdco was formed on May 9, 2011 and commenced operations on June 23, 2011; from that time until the current date its operations have consisted of acquiring, managing and disposing of transportation and infrastructure assets as more fully described herein.
Geographic Information
Please refer to Note 15 of our consolidated financial statements for a report, by geographic area for each segment, of revenues from our external customers, for the years ended December 31, 2014 and 2013, as well as a report, by geographic area for each segment, of our total property, plant and equipment and equipment held for lease as of December 31, 2014 and 2013.
133
Table of Contents
OUR MANAGER AND MANAGEMENT AGREEMENT AND OTHER COMPENSATION ARRANGEMENTS
General
We are externally managed by FIG LLC, a Delaware limited liability company, which we refer to as our Manager, pursuant to the terms of our Management Agreement effective upon the completion of this offering. Our Manager is an affiliate of Fortress. Our principal executive offices are located at 1345 Avenue of the Americas, New York, New York 10105, c/o Fortress Transportation and Infrastructure Investors LLC. Our telephone number is (212) 798-6100.
Our officers and the other individuals who execute our business strategy are employees of our Manager or its affiliates. These individuals are not required to exclusively dedicate their services to us and may provide services for other entities affiliated with our Manager.
Executive Officers
The following table lists each of our executive officers upon consummation of this offering, each of whom is an employee of our Manager.
| Name |
Age | Position | ||||
| Joseph P. Adams Jr. |
57 | Chief Executive Officer | ||||
| Jonathan G. Atkeson |
42 | Chief Financial Officer and Chief Operating Officer | ||||
Biographical Information
For biographical information for our executive officers, see “Management” included elsewhere in this prospectus.
Management Agreement
We have entered into a Management Agreement with our Manager effective upon completion of this offering, which provides for the day-to-day management of our operations. Our Management Agreement requires our Manager to manage our business affairs in conformity with the policies and the strategy that are approved and monitored by our board of directors. There is no limit on the amount our Manager may invest on our behalf without seeking the approval of our board of directors, and our investment mandate is purposefully broad to allow us to opportunistically acquire assets that we believe offer the most attractive risk-adjusted return profile. For more information about our strategy, see “Business—Asset Acquisition Process.”
Our Manager’s duties will include: (i) performing all of our day-to-day functions, (ii) determining acquisition criteria in conjunction with, and subject to the supervision of, our board of directors, (iii) sourcing, analyzing and executing on asset acquisitions and sales, (iv) performing ongoing commercial management of the portfolio, and (v) providing financial and accounting management services. Our Manager is responsible for our day-to-day operations and performs (or causes to be performed) such services and activities relating to our assets and operations as may be appropriate, which includes, without limitation, the following:
| • | serving as our consultant with respect to the periodic review of the acquisition criteria and parameters for asset acquisitions, borrowings, financing transactions and operations; |
| • | investigating, analyzing, valuing and selecting asset acquisition opportunities; |
| • | with respect to our prospective acquisitions and dispositions of assets, conducting negotiations with brokers, sellers and purchasers and their respective agents and representatives, investment bankers and owners of privately and publicly held companies; |
134
Table of Contents
| • | engaging and supervising independent contractors that provide services relating to us or our assets, including but not limited to investment banking, legal or regulatory advisory, tax advisory, due diligence, accounting advisory, securities brokerage and other financial brokerage and consulting services as the Manager determines from time to time is advisable; |
| • | negotiating the sale, exchange or other disposition of any assets; |
| • | coordinating and managing operations of any of our joint venture or co-investment interests and conducting all matters with respect to those joint ventures or co-investments; |
| • | coordinating and supervising all matters related to our assets, including the leasing and/or sale and management of such assets and retaining agents, managers or other advisors in connection therewith; |
| • | providing executive and administrative personnel, office space and office services required in rendering services to us; |
| • | administering the day-to-day operations and performing and supervising the performance of such other administrative functions necessary to our management as may be agreed upon by our Manager and our board of directors, including, without limitation, the collection of revenues and the payment of our debts and obligations and maintenance of appropriate computer services to perform such administrative functions; |
| • | communicating with the past, current and prospective holders of any of our equity or debt securities as required to satisfy the reporting and other requirements of any governmental bodies or agencies or trading markets and to maintain effective relations with such holders; |
| • | counseling us in connection with policy decisions to be made by our board of directors; |
| • | evaluating and recommending to our board of directors modifications to any hedging strategies in effect on the date hereof and engaging in hedging activities consistent with such strategies, as in effect from time to time; |
| • | counseling us regarding the maintenance of our exemption from the 1940 Act and monitoring compliance with the requirements for maintaining such an exemption; |
| • | assisting us in developing criteria that are specifically tailored to our acquisition objectives and making available to us its knowledge and experience with respect to our target assets; |
| • | representing and making recommendations to us in connection with the purchase and finance, and commitment to purchase and finance, of our target assets, and in connection with the sale and commitment to sell such assets; |
| • | monitoring the operating performance of our assets and providing periodic reports with respect thereto to our board of directors, including comparative information with respect to such operating performance, valuation and budgeted or projected operating results; |
| • | investing and re-investing any of our moneys and securities (including investing in short-term investments pending investment in asset acquisitions, payment of fees; costs and expenses; or payments of dividends or distributions to our shareholders and partners) and advising us as to our capital structure and capital raising; |
| • | causing us to retain qualified accountants and legal counsel, as applicable, to assist in developing appropriate accounting procedures, compliance procedures and testing systems with respect to financial reporting obligations and to conduct quarterly compliance reviews with respect thereto; |
| • | causing us to qualify to do business in all applicable jurisdictions and to obtain and maintain all appropriate licenses; |
| • | taking all necessary actions to enable us to make required tax filings and reports, including soliciting shareholders for required information to the extent provided by the provisions of the Code; |
135
Table of Contents
| • | assisting us in complying with all regulatory requirements applicable to us in respect of our business activities, including preparing or causing to be prepared all financial statements required under applicable regulations and contractual undertakings and all reports and documents required under the Exchange Act; |
| • | handling and resolving all claims, disputes or controversies (including all litigation, arbitration, settlement or other proceedings or negotiations) in which we may be involved or to which we may be subject arising out of our day-to-day operations, subject to such limitations or parameters as may be imposed from time to time by our board of directors; |
| • | using commercially reasonable efforts to cause expenses incurred by us or on our behalf to be within any expense guidelines set by our board of directors from time to time; |
| • | performing such other services as may be required from time to time for management and other activities relating to our assets as our board of directors and our Manager shall agree from time to time or as our Manager shall deem appropriate under the particular circumstances; |
| • | using commercially reasonable efforts to cause us to comply with all applicable laws; and |
| • | traveling in connection with the performance of any services or activities relating to our assets, operations, acquisitions or investment analysis. |
Indemnification
Pursuant to our Management Agreement, our Manager does not assume any responsibility other than to render the services called for thereunder in good faith and is not responsible for any action of our board of directors in following or declining to follow its advice or recommendations. Our Manager, its members, managers, officers and employees is not liable to us or any of our subsidiaries, to our board of directors, or our or any subsidiary’s shareholders or partners for any acts or omissions by our Manager, its members, managers, officers or employees, except as described below by reason of acts constituting bad faith, willful misconduct, gross negligence or reckless disregard of our Manager’s duties under our Management Agreement. To the full extent lawful, we are required to reimburse, indemnify and hold our Manager, its members, managers, officers and employees, sub-advisers and each other person, if any, controlling our Manager, harmless of and from any and all expenses, losses, damages, liabilities, demands, charges and claims of any nature whatsoever (including attorneys’ fees) in respect of or arising from any acts or omissions of an indemnified party made in good faith in the performance of our Manager’s duties under our Management Agreement and not constituting such indemnified party’s bad faith, willful misconduct, gross negligence or reckless disregard of our Manager’s duties under our Management Agreement.
Our Manager, to the full extent lawful, reimburses indemnifies and holds the Company, our members, shareholders, directors, officers and employees and each other person, if any, controlling us, harmless of and from any and all expenses, losses, damages, liabilities, demands, charges and claims of any nature whatsoever (including attorneys’ fees) in respect of or arising from our Manager’s bad faith, willful misconduct, gross negligence or reckless disregard of its duties under our Management Agreement. Our Manager carries errors and omissions and other customary insurance.
Management Team
Pursuant to the terms of our Management Agreement, our Manager provides us with a management team, including a chief executive officer and chief financial officer, to provide the management services to be provided by our Manager to us. The members of our management team devote such of their time to the management of us as our board of directors reasonably deems necessary and appropriate, commensurate with our level of activity from time to time.
136
Table of Contents
Assignment
Our Management Agreement shall terminate automatically upon assignment by the Manager unless such assignment is consented to in writing by the Company and a majority of our independent directors or otherwise permitted under our Management Agreement; provided, however, that our Manager may assign our Management Agreement to an entity whose business and operations are managed or supervised by Mr. Wesley R. Edens, who is a principal and a Co-Chairman of the board of directors of Fortress, an affiliate of our Manager, and a member of the management committee of Fortress since co-founding Fortress in May 1998. We may not assign our Management Agreement without the prior written consent of our Manager, except in the case of an assignment to another organization which is our successor (by merger, consolidation or purchase of assets), in which case such successor organization shall be bound under our Management Agreement and by the terms of such assignment in the same manner as we are bound under our Management Agreement.
Term
The initial term of our Management Agreement expires on the tenth anniversary of this offering, and the Management Agreement will be renewed automatically each year for an additional one-year period unless (i) a majority consisting of at least two-thirds of our independent directors or a simple majority of the holders of our outstanding common shares, agree that there has been unsatisfactory performance that is materially detrimental to us or (ii) a simple majority of our independent directors agree that the management fee payable to our Manager is unfair; provided, that we shall not have the right to terminate our Management Agreement under foregoing clause (ii) if the Manager agrees to continue to provide the services under the Management Agreement at a fee that a simple majority of our independent directors has reasonably determined to be fair.
If we elect not to renew our Management Agreement at the expiration of the original term or any such one-year extension term as set forth above, our Manager will be provided with notice of any such termination at least 60 days prior to the expiration of the then existing term. In the event of such termination or other termination as set forth above, we would be required to pay the termination fee, and the General Partner would be entitled to receive the Incentive Allocation Fair Value Amount, in each case as described below. If the Manager elects not to renew our Management Agreement at the expiration of the original term or any one-year extension term as set forth above, the Manager will provide us with notice of such termination at least 60 days prior to the expiration of the then existing term, and the Management Agreement will expire on its expiration date following the delivery of such notice.
We may also terminate our Management Agreement at any time for cause effective upon 60 days’ prior written notice of termination from us to our Manager, in which case no termination fee would be due, for the following reasons:
| • | the willful violation of the Management Agreement by the Manager in its corporate capacity (as distinguished from the acts of any employees of the Manager which are taken without the complicity of any of the Manager’s management) under the Management Agreement; |
| • | our Manager’s fraud, misappropriation of funds, or embezzlement against us; and |
| • | our Manager’s gross negligence of duties under our Management Agreement. |
In addition, our Manager may terminate the Management Agreement effective upon 60 days’ prior written notice of termination to us in the event that we default in the performance or observance of any material term, condition or covenant contained in the Management Agreement and such default continues for a period of 30 days after written notice thereof specifying such default and requesting that the same be remedied in such 30 day period.
If our Management Agreement is terminated by our Manager upon our breach, we would be required to pay to our Manager the termination fee and to the General Partner the Incentive Allocation Fair Value Amount, each of which is described below.
137
Table of Contents
Management Fee
We will pay our Manager a monthly management fee (in arrears in cash) that is based on the average value of our total equity (excluding non-controlling interests) determined on a consolidated basis in accordance with GAAP as of the last day of the two most recently completed months multiplied by an annual rate of 1.50%. Our Manager computes each installment of the management fee within 15 days after the end of the month with respect to which such installment is payable, and such installment shall be due and payable no later than the date which is 20 days after the end of the month with respect to which such installment is payable.
Reimbursement of Expenses
If our Manager, its affiliates and their respective employees perform certain legal, accounting, due diligence tasks and other services that outside professionals or outside consultants otherwise would perform, we will pay or reimburse our Manager or its affiliates for the cost of performing such tasks, provided that such costs and reimbursements are no greater than those which would be paid to outside professionals or consultants on an arm’s-length basis.
We also pay all operating expenses incurred by the Company or by the Manager or its affiliates on behalf of the Company, except those specifically required to be borne by our Manager under our Management Agreement. Our Manager is responsible for compensation of our Manager’s employees, rent for our Manager’s facilities and other “overhead” expenses; we do not reimburse our Manager for these expenses. The expenses required to be paid by us include, but are not limited to, issuance and transaction costs incident to the sourcing, acquisition, disposition and financing of our acquisitions, legal, auditing, asset management, sourcing and underwriting fees and expenses, the compensation and expenses of our independent directors, the costs associated with the establishment and maintenance of any credit facilities and other indebtedness of ours (including commitment fees, legal fees, closing costs, etc.), expenses associated with other securities offerings of ours, costs and expenses incurred in contracting with third parties (including affiliates of the Manager), the costs of printing and mailing proxies and reports to our shareholders, costs incurred by our Manager or its affiliates for travel on our behalf, costs associated with any computer software or hardware that is used for us, expenses related to any office maintained for the Company, costs to obtain liability insurance to indemnify our directors and officers and the compensation and expenses of our transfer agent.
Termination Fee
We are required to pay our Manager a termination fee if we terminate the Management Agreement on the basis of a board determination that our Manager’s performance is unsatisfactory and materially detrimental to us or that the management fees payable by us to our Manager are not fair, or if the Manager terminates the Management Agreement due to a material breach by us. The termination fee is a fee equal to the amount of the management fee earned during the 12 full months immediately preceding the date of termination.
Grant of Options to Our Manager
After this offering, upon the successful completion of an offering of our common shares or other equity securities shares (including securities issued as consideration in an acquisition), we will grant our Manager options to purchase common shares in an amount equal to 10% of the number of common shares being sold in the offering (or if the issuance relates to equity securities other than our common shares, options to purchase a number of common shares equal to 10% of the gross capital raised in the equity issuance divided by the fair market value of a common share as of the date of issuance), with an exercise price equal to the offering price per share paid by the public or other ultimate purchaser or attributed to such securities in connection with an acquisition (or the fair market value of a common share as of the date of the equity issuance if it relates to equity
138
Table of Contents
securities other than our common shares). Any ultimate purchaser of common shares for which such options are granted may be an affiliate of Fortress. For the avoidance of doubt, this initial public offering of our common shares will not constitute an offering for purposes of this provision.
Other Incentive Allocations
We will not conduct any operations other than our direct ownership of Holdco, which is responsible for acquiring assets on our behalf through one or more of its subsidiaries. Pursuant to the Partnership Agreement, a copy of which has been filed as an exhibit to the registration statement of which this prospectus forms a part, the General Partner will be entitled to receive incentive allocations before any amounts are distributed to us based both on our consolidated net income and capital gains income in each fiscal quarter and for each fiscal year, respectively, subject to certain adjustments. The terms of such compensation arrangements are summarized below.
Income Incentive Allocation
Income Incentive Allocation is calculated and payable quarterly in arrears based on our pre-incentive allocation net income for the immediately preceding calendar quarter. For this purpose, pre-incentive allocation net income means, with respect to a calendar quarter, our net income attributable to members during such quarter calculated in accordance with GAAP, but excluding our pro rata portion, as applicable, of the following: (i) gains and losses, realized or unrealized, (ii) the non-cash portion of any equity-based compensation expense, (iii) the one-time impact of any non-capitalized acquisition-related expenses, including transaction and integration expenses, provided that such amounts are capitalized and amortized in respect of such acquisition and such amortization is included in the calculation of pre-incentive allocation net income, (iv) any non-cash portion of the provision for income taxes, net of cash payments for income taxes, and (v) any other amounts approved by our independent directors upon reasonable request by the Manager. Pre-incentive allocation net income does not include any Income Incentive Allocation or Capital Gains Incentive Allocation paid to the General Partner during the quarter.
We will pay the General Partner an Income Incentive Allocation with respect to our pre-incentive allocation net income in each calendar quarter as follows: (1) no Income Incentive Allocation in any calendar quarter in which our pre-incentive allocation net income, as expressed as a rate of return on the average value of our net equity capital at the end of the two most recently completed calendar quarters, does not exceed 2.0% for such quarters (8.0% annualized); (2) 100% of our pre-incentive allocation net income with respect to that portion of such pre-incentive allocation net income, if any, that exceeds 2.00% but does not exceed 2.2223% for such quarter; and (3) 10.0% of the amount of our pre-incentive allocation net income, if any, that exceeds 2.2223% for such quarter. These calculations are appropriately prorated for any period of less than three months. The effect of the calculation described above is that if pre-incentive allocation net income, as expressed as a rate of return on the average value of our net equity capital at the end of the two most recently completed calendar quarters, is equal to or exceeds 2.2223%, the General Partner will receive an Income Incentive Allocation of 10.0% of our pre-incentive allocation net income for the quarter.
Capital Gains Incentive Allocation
Capital Gains Incentive Allocation is calculated and payable in arrears as of the end of each calendar year and will equal 10% of our pro rata share of cumulative realized gains from the date of the consummation of this offering through the end of the applicable calendar year, net of our pro rata share of the following: (i) any cumulative realized or unrealized losses and the cumulative non-cash portion of equity-based compensation expenses, in each case, for such period, and (ii) all realized gains upon which prior performance-based Capital Gains Incentive Allocations were previously paid to the General Partner.
139
Table of Contents
Incentive Allocation Fair Value Amount
We are required to pay the General Partner the Incentive Allocation Fair Value Amount if the General Partner is removed due to the termination of our Management Agreement on the basis of a board determination that our Manager’s performance is unsatisfactory and materially detrimental to us or that the management fees payable by us to our Manager are not fair, or if the Manager terminates the Management Agreement due to a material breach by us. The Incentive Allocation Fair Value Amount is an amount equal to the Income Incentive Allocation and the Capital Gains Incentive Allocation that would be paid to the General Partner if our assets were sold for cash at their then current fair market value (as determined by an appraisal, taking into account, among other things, the expected future value of the underlying investments).
140
Table of Contents
Directors and Executive Officers
Upon consummation of this offering our operating agreement will provide that our board of directors shall consist of not less than three and not more than nine directors as the board of directors may from time to time determine. Our board of directors currently consists of two directors. Upon consummation of this offering, we will reconstitute our board of directors so that one existing member will resign, and four new members, Messrs. Edens, Goodwin, Tuchman and Robinson, will be elected. Our board of directors is divided into three classes that are, as nearly as possible, of equal size. Each class of directors is elected for a three-year term of office, but the terms are staggered so that the term of only one class of directors expires at each annual general meeting. The initial terms of the Class I, Class II and Class III directors will expire in 2016, 2017 and 2018, respectively. Messrs. Goodwin and Robinson each serves as a Class I director, Messrs. Adams and Tuchman each serves as a Class II director, and Mr. Edens serves as a Class III director. All officers serve at the discretion of the board of directors.
Upon consummation of this offering, we will have five directors. We expect our board of directors to determine that Messrs. Goodwin, Robinson and Tuchman will qualify as independent directors under the corporate governance standards of the NYSE.
Our operating agreement does not provide for cumulative voting in the election of directors, which means that the holders of a majority of our issued and outstanding common shares can elect all of the directors standing for election, and the holders of the remaining shares will not be able to elect any directors.
Board of Directors
Set forth below is information concerning our directors as of the consummation of this offering. A description of the business experience of each of our directors for at least the past five years follows the table.
| Name |
Age | Position | ||||
| Wesley R. Edens |
52 | Chairman of the Board of Directors | ||||
| Joseph P. Adams Jr. |
57 | Director and Chief Executive Officer | ||||
| Paul R. Goodwin |
69 | Director | ||||
| Ray M. Robinson |
63 | Director | ||||
| Martin Tuchman |
72 | Director | ||||
Wesley R. Edens—Director—Mr. Edens will join our board of directors as Chairman effective upon consummation of this offering. Mr. Edens is Co-Founder, Principal and Co-Chairman of the board of directors of Fortress. He is also Chairman of the board of directors of each of Newcastle Investment Corp., New Residential Investment Corp., New Media Investment Group Inc., New Senior Investment Group Inc., Florida East Coast Railway Corp., Mapeley Limited and Nationstar Mortgage Holdings Inc., and he is a director of Intrawest Resorts Holdings, Inc., Gaming and Leisure Properties Inc., Springleaf Finance Corporation, Springleaf Holdings Inc. and Springleaf Finance Inc. Mr. Edens also previously served on the boards of the following publicly traded companies and registered investment companies: Brookdale Senior Living Inc. from September 2005 to June 2014; GAGFAH S.A. from September 2006 to June 2014; Penn National Gaming Inc. from October 2008 to November 2013; Gatehouse Media Inc. from June 2005 to November 2013; Aircastle Limited from August 2006 to August 2012; Rail America Inc. from November 2006 to October 2012; Eurocastle Investment Limited, from August 2003 to November 2011; Whistler Blackcomb Holdings, Inc., from October 2012 to November 2012; Fortress Investment Trust II, from July 2002 (deregistered with the SEC in January 2011); and FRIT PINN LLC, from November 2001 (deregistered with the SEC in September 2011). Prior to forming Fortress Investment Group LLC, Mr. Edens was a partner and a managing director of BlackRock Financial Management Inc., where he headed BlackRock Asset Investors, a private equity fund. In addition, Mr. Edens was formerly a partner and a managing director of Lehman Brothers. Mr. Edens received a B.S. in Finance from Oregon State University.
141
Table of Contents
Mr. Edens brings strong leadership, extensive business and managerial experience, and a tremendous knowledge of the financial services industry to the board of directors. In addition, Mr. Edens brings his broad strategic vision to the Company and the board of directors. Further, his experience on the boards of other public companies, including serving as chairman of the board of certain of such companies, provides the board of directors with insights into how boards at other companies address issues similar to those faced by us.
Joseph P. Adams Jr.—Director—Mr. Adams is our Chief Executive Officer and will continue to be a part of our board of directors effective upon consummation of this offering. He is a member of the Management Committee of Fortress and is a Managing Director at Fortress within the Private Equity Group. He has served as a member of the board of directors of Seacastle, Inc., SeaCube Container Leasing Ltd., Aircastle Limited and RailAmerica Inc. Previously, Mr. Adams was a partner at Brera Capital Partners and at Donaldson, Lufkin & Jenrette where he was in the transportation industry group. In 2002, Mr. Adams served as the first Executive Director of the Air Transportation Stabilization Board. Mr. Adams received a B.S. in Engineering from the University of Cincinnati and an M.B.A. from Harvard Business School.
Mr. Adams’ experience, including his role serving as Deputy Chairman on a number of boards for portfolio companies of Fortress provides the board with valuable insights into how boards at other companies address issues similar to those faced by the Company. In addition, his experience as a private equity investor and investment and merchant banker provides the board with valuable guidance on financial, strategic planning and investor relations matters, particularly as it relates to transportation related industries.
Paul R. Goodwin—Director—Mr. Goodwin will join our board of directors prior to the consummation of this offering. He was a member of the board of directors of SeaCube Container Leasing Ltd, from 2009 through April 2013, and on the board of directors of RailAmerica, Inc. from October 2009 through October 2012. Mr. Goodwin served on the board of directors of Manhattan Associates, Inc. from April 2003 through May 2011. From June 2003 through 2004, Mr. Goodwin served as a consultant to CSX Corporation, which, through its subsidiaries, operates the largest rail network in the eastern United States. Mr. Goodwin also served on the board of the National Railroad Retirement Investment Trust from 2003 through 2006. From April 2000 until June 2003, Mr. Goodwin served as vice-chairman and chief financial officer of CSX Corporation. Mr. Goodwin started with CSX Corporation in 1965 and held various senior management positions with entities affiliated with CSX Corporation group, including executive vice president and chief financial officer, senior vice president finance and planning and executive vice president of finance and administration. Mr. Goodwin graduated from Cornell University with a Bachelor of Civil Engineering and received an MBA from George Washington University.
Mr. Goodwin’s forty-six years of experience, including serving as vice-chairman and chief financial officer of CSX Corporation, is highly relevant to the Company. His experience provides the board of directors with a deep understanding of the freight railroad business and also provides financial expertise to the board of directors, including an understanding of financial accounting and reporting, including internal controls, and corporate finance and capital markets.
Ray M. Robinson—Director—Mr. Robinson will join our board of directors prior to the consummation of this offering. He has served as director of Acuity Brands Inc. since 2001. Mr. Robinson has been the non-executive chairman of Citizens Trust Bank since May 2003. He was the president of Atlanta’s East Lake Golf Club from May 2003 to December 2005 and President Emeritus since December 2005. Mr. Robinson was the Chairman of Atlanta’s East Lake Community Foundation from November 2003 to January 2005 and has been Vice Chairman since January 2005. From 1996 to 2003 he served as the President of the Southern Region of AT&T Corporation. Mr. Robinson is also currently a director of Aaron’s Inc., American Airlines, and Avnet, Inc. (Lead Director) and was previously a director of Choicepoint Inc., Mirant Corporation, and RailAmerica, Inc.
Mr. Robinson was selected as a director nominee because of his extensive service on other public company boards, sales and marketing experience gained through senior leadership positions, extensive operational skills from his tenure at AT&T, and longstanding involvement in civic and charitable leadership roles in the community qualify him to serve as a director of our board of directors.
142
Table of Contents
Martin Tuchman—Director—Martin Tuchman will join our board of directors prior to the consummation of this offering. He has served as a Director of the Horizon Lines, Inc. since November 2011. Mr. Tuchman is Chief Executive Officer of the Tuchman Group, which overseas holdings in real estate, banking and international shipping, and has headed Kingstone Capital V, a private investment group, since 2007. Since March 2011, Mr. Tuchman has served on the Board of Directors for Sea Cube Container Leasing Ltd. Since December 2008, Mr. Tuchman has served as the Vice Chairman of the First Choice Bank in Lawrenceville, N.J. In 1968, after helping develop the current standard for intermodal containers and chassis in connection with the American National Standards Institute, Mr. Tuchman co-founded Interpool, Inc., a leading container leasing business, which was sold to funds affiliated with Fortress Investment Group LLC, in 2007. In 1987, Mr. Tuchman formed Trac Lease, a chassis leasing company which was subsequently merged into Interpool, Inc. Mr. Tuchman holds a Bachelor of Science degree in Mechanical Engineering from the New Jersey Institute of Technology and an M.B.A. from Seton Hall University.
Mr. Tuchman’s experience in the container leasing and shipping industry and as Chief Executive Officer of The Tuchman Group provides the board with valuable insights on the financial and strategic planning matters, particularly as they relate to transportation related industries.
Executive Officers
Set forth below is information concerning our executive officers upon consummation of this offering, each of whom is an employee of our Manager or an affiliate of our Manager. The term of office of each of the individuals below will begin with the consummation of this offering. There is no understanding between any of the officers listed below and our Manager pursuant to which such officer was selected for his position. A description of the business experience of each of our executive officers for at least the past five years follows the table:
| Name |
Age | Position | ||||
| Joseph P. Adams Jr. |
57 | Chief Executive Officer | ||||
| Jonathan G. Atkeson |
42 | Chief Financial Officer and Chief Operating Officer | ||||
Joseph P. Adams Jr.—Chief Executive Officer and Director—Mr. Adams is our Chief Executive Officer. For information regarding Mr. Adams, see above.
Jonathan G. Atkeson—Chief Financial Officer/Chief Operating Officer—Mr. Atkeson is our Chief Operating Officer and Chief Financial Officer. Mr. Atkeson joined Fortress in July 2003 and is a managing director in the acquisitions area. From 2000 to 2003, Mr. Atkeson worked as a vice president in the private equity group at Whitney & Co., LLC. Prior to that, he was a member of the mergers & acquisitions group at Credit Suisse First Boston. Mr. Atkeson received a B.S.P.H. in Environmental Science and Engineering from the University of North Carolina at Chapel Hill and a J.D. from Yale Law School.
Committees of the Board of Directors
Upon consummation of this offering, we will establish the following committees of our board of directors.
Audit Committee
The audit committee:
| • | reviews the audit plans and findings of our independent registered public accounting firm and our internal audit and risk review staff, as well as the results of regulatory examinations, and tracks management’s corrective action plans where necessary; |
| • | reviews our financial statements, including any significant financial items and/or changes in accounting policies, with our senior management and independent registered public accounting firm; |
143
Table of Contents
| • | reviews our financial risk and control procedures, compliance programs and significant tax, legal and regulatory matters; and |
| • | has the sole discretion to appoint annually our independent registered public accounting firm, evaluate its independence and performance and set clear hiring policies for employees or former employees of the independent registered public accounting firm. |
The members of the audit committee are Messrs. Goodwin (Chair), Robinson and Tuchman. Upon effectiveness of the registration statement, each member of the committee will be “independent,” as defined under the rules of the NYSE and Rule 10A-3 of the Exchange Act. Our board of directors has determined that each director appointed to the audit committee is financially literate, and the board has determined that Mr. Goodwin is our audit committee financial expert.
Nominating and Corporate Governance Committee
The nominating and corporate governance committee:
| • | reviews the performance of our board of directors and makes recommendations to the board regarding the selection of candidates, qualification and competency requirements for service on the board and the suitability of proposed nominees as directors; |
| • | advises the board with respect to the corporate governance principles applicable to us; |
| • | oversees the evaluation of the board and management; |
| • | reviews and approves in advance any related party transaction, other than those that are pre-approved pursuant to pre-approval guidelines or rules established by the committee; and |
| • | recommends guidelines or rules to cover specific categories of transactions. |
The members of the nominating and corporate governance committee are Messrs. Tuchman (Chair), Goodwin and Robinson. Each member of our nominating and corporate governance committee is independent, as defined under the rules of the NYSE.
Compensation Committee
The compensation committee:
| • | evaluates the performance of our Manager; |
| • | reviews the compensation and fees payable to our Manager under our Management Agreement; |
| • | prepares compensation committee reports; and |
| • | determines from time to time the remuneration for our independent directors. |
The members of the compensation committee are Messrs. Robinson (chair), Goodwin and Tuchman. Each member of our compensation committee is independent, as defined under the rules of the NYSE. The “independent” directors that are appointed to the compensation committee are also “non-employee” directors as defined in Rule 16b-3(b)(3) under the Exchange Act and “outside” directors within the meaning of Section 162(m)(4)(c)(i) of the Code.
Compensation of Directors
We have not yet paid any compensation to our directors. Following completion of this offering, we will pay an annual fee to each independent director equal to $150,000, payable in semi-annual installments. In addition, an annual fee of $10,000 will be paid to the chair of the audit committee of the board of directors. Fees owed to
144
Table of Contents
independent directors may be paid by issuance of common shares, based on the value of such common shares at the date of issuance, rather than in cash, provided that any such issuance does not prevent such director from being determined to be independent and such shares are granted pursuant to the Incentive Plan or another stockholder-approved plan or the issuance is otherwise exempt from NYSE listing requirements. Each independent director will also receive an initial one-time grant of fully vested options to purchase 5,000 common shares under the Incentive Plan upon the date of the first meeting of our board of directors attended by such director with an exercise price equal to the fair market value of the underlying common shares on the date of grant. For additional information on director equity compensation, see “—Nonqualified Stock Option and Incentive Award Plan,” below. Affiliated directors, however, will not be separately compensated by us. All members of the board of directors will be reimbursed for reasonable costs and expenses incurred in attending meetings of our board of directors.
Executive Officer Compensation
Each of our officers is an employee of our Manager or an affiliate of our Manager. Because our Management Agreement provides that our Manager is responsible for managing our affairs, our officers do not receive cash compensation from us for serving as our officers. Our officers, in their capacities as officers or personnel of our Manager or its affiliates, will devote such portion of their time to our affairs as is necessary to enable us to operate our business.
Nonqualified Stock Option and Incentive Award Plan
We anticipate that we will adopt the Fortress Transportation and Infrastructure Investors LLC Nonqualified Stock Option and Incentive Award Plan in connection with this offering. The Incentive Plan is intended to facilitate the use of long-term equity-based awards and incentives for the benefit of non-officer directors, officers, directors, employees, advisors, service providers, consultants and other personnel of us and our Manager.
A summary of the Incentive Plan is set forth below. This summary does not purport to be complete and is subject to and qualified in its entirety by the full text of the form of the Incentive Plan anticipated to be adopted, which will be filed as an exhibit to this registration statement.
Summary of the Incentive Plan Terms
The Incentive Plan will be administered by our Board of Directors, or by any committee our Board of Directors may appoint to administer the Incentive Plan (the “Committee”). We anticipate that our Compensation Committee will be appointed to administer the Incentive Plan. As the administrator of the Incentive Plan, the Committee will have the authority to grant awards under the Incentive Plan and to adopt, alter and repeal such administrative rules, guidelines and practices governing the Incentive Plan as it deems advisable for the administration of the Incentive Plan. The Committee will also have the authority to interpret the terms and provisions of the Incentive Plan, any award issued under the Incentive Plan and any award agreements relating thereto, and to otherwise supervise the administration of the Incentive Plan. In particular, the Committee will have the authority to determine the terms and conditions of awards under the Incentive Plan, including, without limitation, the exercise price, the number of our common shares subject to awards, the term of the awards and the vesting schedule applicable to awards and to waive or amend the terms and conditions of outstanding awards. All decisions made by the Committee pursuant to the provisions of the Incentive Plan will be final, conclusive and binding on all persons.
The terms of the Incentive Plan provide for the grant of stock options that are not intended to qualify as “incentive stock options” under Section 422 of the Code, stock appreciation rights (“SARs”), restricted stock, performance awards, tandem awards and other stock-based and non-stock based awards, in each case to our
145
Table of Contents
Manager, to the employees, officers, directors, consultants, service providers and advisors of our Manager who perform services for us, to our employees, officers, consultants, service providers and advisors, and to such other persons who the Committee selects to be participants in the Incentive Plan. Such awards may be granted singly, in tandem, or in combination with each of the other awards.
We expect to initially reserve 30,000,000 common shares for issuance under the Incentive Plan. We expect that on the date of any equity issuance by the Company during the ten-year term of the Incentive Plan (including in respect of securities issued as consideration in an acquisition), the maximum number of shares available for issuance under the Plan will be increased to include an additional number of common shares equal to ten percent (10%) of either (i) the total number of common shares newly issued by the Company in such equity issuance or (ii) if such equity issuance relates to equity securities other than our common shares, a number of our common shares equal to the Equity Security Factor. For purposes of the Incentive Plan, the “Equity Security Factor” means a number of common shares equal to (i) the gross capital raised in an equity issuance of equity securities other than common shares during the ten-year term of the Incentive Plan (as determined by the Committee), divided by (ii) the fair market value of a common share as of the date of such equity issuance.
The common shares which may be issued pursuant to an award under the Incentive Plan may be treasury stock, authorized but unissued stock or stock acquired on the open market to satisfy the requirements of the Incentive Plan. Awards may consist of any combination of such stock, or, at our election cash. If any shares subject to an award are forfeited, cancelled, exchanged or surrendered or if an award otherwise terminates or expires without a distribution of shares to the participant, such shares will again be available for grants under the Incentive Plan. We reserve the right under the Incentive Plan to cancel any stock option with an exercise price that equals or exceeds the fair market value of a common share on the date of such cancellation, and any such shares that were subject to the cancelled stock option will again be available for issuance of stock options under the Incentive Plan, including issuable to the participant who held such cancelled stock option and irrespective of whether such issuance would be deemed a repricing of such stock option. The grant of a Tandem Award (as described below) will not reduce the number of our common shares or preferred shares reserved and available for issuance under the Incentive Plan.
Upon the occurrence of any event which affects our common shares in such a way that an adjustment of outstanding awards is appropriate to prevent the dilution or enlargement of rights under the awards, the Committee will make appropriate equitable adjustments. The Committee may also provide for other substitutions or adjustments in its sole discretion, including, without limitation, the cancellation of any outstanding award and payment in cash or other property in exchange thereof, equal to the excess, if any, of the fair market value of the shares or other property subject to the award over the exercise price, if any.
We anticipate that we will grant our Manager or an affiliate of our Manager options in connection with our equity offerings as compensation for our Manager’s role in raising capital for us. We intend to grant to our Manager or an affiliate of our Manager a number of options equal to up to 10% of either (i) the aggregate number of common shares being issued in such offering at an exercise price per share equal to the offering price per share, as determined by the Committee or (ii) if such equity issuance relates to equity securities other than our common shares, a number of common shares equal to the Equity Security Factor, at an exercise price equal to the fair market value of a common share as of the date of the equity issuance. The main purpose of these options is to provide transaction-specific compensation to the Manager, in a form that aligns our Manager’s interests with those of our stockholders, for the valuable services it provides in raising capital for us to invest through equity offerings. The Incentive Plan provides that such options will be fully vested as of the date of grant and exercisable as to 1/30 of the shares subject to the option on the first day of each of the 30 calendar months following the date of the grant. The exercise price of such options may be paid in cash or its equivalent, as determined by the Committee. Payment in whole or in part may also be made by the following cashless exercise procedures: (1) by withholding from shares otherwise issuable upon exercise of such option, (2) in the form of our unrestricted shares already owned by our Manager which have a fair market value on the date of surrender equal to the aggregate option price of our shares as to which such option shall be exercised or (3) by means of any other cashless exercise procedure approved by the Committee.
146
Table of Contents
In addition, the Committee will have the authority to grant such other awards to our Manager as it deems advisable, provided that no such award may be granted to our Manager in connection with any issuance by us of equity securities in excess of 10% of either (i) the maximum number of common shares being proposed to be issued by the Company in such equity issuance or (ii) if such equity issuance relates to equity securities other than common shares, the maximum number of common shares determined in accordance with the Equity Security Factor. Our Board of Directors may also determine to issue options to the Manager that are not subject to the Incentive Plan, provided that the number of our common shares underlying any options granted to the Manager in connection with capital raising efforts would not exceed 10% of either (i) the maximum number of common shares being proposed to be issued by the Company in such equity issuance or (ii) if such equity issuance relates to equity securities other than common shares, the maximum number of common shares determined in accordance with the Equity Security Factor and would be subject to NYSE rules.
In addition, each of the Committee and our Manager will have the authority under the terms of the Incentive Plan to direct awards of tandem options (“Tandem Awards”) to employees of our Manager who act as officers or perform other services for us that correspond on a one-to-one basis with the options granted to our Manager, such that exercise by such employee of the Tandem Awards would result in the corresponding options held by our Manager being cancelled. As a condition to the grant of Tandem Awards, our Manager will be required to agree that so long as such Tandem Awards remain outstanding, our Manager will not exercise any options under any designated Manager options that relate to the options outstanding under such Tandem Awards. If any Tandem Awards are forfeited, expire or are cancelled without being exercised, the related options under the designated Manager options will again become exercisable in accordance with their terms. The terms and conditions of any Tandem Awards (e.g., the per-share exercise price, the schedule of vesting, exercisability and delivery, etc.) will be determined by the Committee or the Manager, as the case may be, in its sole discretion and must be included in an award agreement, provided, that the term of such Tandem Awards may not be greater than the term of the designated Manager options to which they relate. As determined by our Manager, in its sole discretion, payment of the exercise price of such Tandem Awards in whole or in part may be made by the following cashless exercise procedures: (i) by withholding from shares otherwise issuable upon exercise of such Tandem Award, (ii) in the form of our unrestricted shares already owned by the holder of such Tandem Award which have a fair market value on the date of surrender equal to the aggregate option price of the shares as to which such Tandem Award shall be exercised or (iii) by means of any other cashless exercise procedure approved by the Committee. All options granted to our Manager will become fully vested and exercisable upon a “change of control” (as defined in the Incentive Plan) or a termination of the Manager’s services to us for any reason, and any Tandem Awards will be governed by the terms and conditions set forth in the applicable award agreements, as determined by the Committee or the Manager, as the case may be.
As a general matter, the Incentive Plan provides that the Committee has the power to determine the number of shares covered by options, the exercise price of options, at what time or times each option may be exercised and, subject to the provisions of the Incentive Plan, the period of time, if any, after death, disability or other termination of employment during which options may be exercised. Options may become vested and exercisable in installments, and the exercisability of options may be accelerated by the Committee. To the extent permitted by applicable law, we may make loans available to the optionee in connection with the exercise of stock options. Such loans must be evidenced by the delivery of a promissory note and will bear interest and be subject to such other terms and conditions (including, without limitation, the execution by the optionee of a pledge agreement) as the Committee may determine. In any event, such loan amount may not exceed the sum of (x) the exercise price less the par value of the common shares subject to such option then being exercised plus (y) any federal, state or local income taxes attributable to such exercise.
The Committee may also grant SARs in tandem with all or part of, or completely independent of, a grant of options or any other award under the Plan. A SAR issued in tandem with an option may be granted at the time of grant of the related option or at any time during the term of such option. The amount payable in cash and/or shares with respect to each SAR will be equal in value to a percentage (including up to 100%) of the amount by which the per-share fair market value of the applicable share on the exercise date exceeds the fair market value
147
Table of Contents
per share of the applicable share on the date of grant of the SAR. The applicable percentage will be established by the Committee. The award agreement under which the SAR is granted may state whether the amount payable is to be paid wholly in cash, wholly in shares or in any combination of the foregoing, and if the award agreement does not state the manner of payment, the Committee will determine such manner of payment at the time of payment. The amount payable in shares, if any, is determined with reference to the fair market value per share of the applicable share on the date of exercise.
SARs issued in tandem with options shall be exercisable only to the extent that the options to which they relate are exercisable. Upon exercise of the tandem SAR, and to the extent of such exercise, the participant’s underlying option shall automatically terminate. Similarly, upon the exercise of the tandem option, and to the extent of such exercise, the participant’s related SAR will automatically terminate.
The Committee may also grant restricted stock, RSUs, performance awards, tandem awards and other stock and non-stock-based awards under the Incentive Plan. These awards will be subject to such conditions and restrictions as the Committee may determine, which may include, without limitation, the achievement of certain performance goals or continued service with us through a specific period.
In addition, each new non-officer or non-employee member of our board of directors will be granted an initial one-time grant of an option relating to 5,000 shares of our common stock upon the date of the first meeting of our board of directors attended by such director. Such initial option grant, which will be fully vested on the date of grant, will have an exercise price equal to the fair market value of the underlying common shares on the date of grant.
While we intend to grant additional awards under the Incentive Plan to eligible participants, we have not yet established specific parameters regarding the granting of such future awards under the Incentive Plan. As such, the benefits or amounts that will be received by or allocated to any participants under the Incentive Plan following completion of this offering are not currently determinable.
Code of Ethics
Our board of directors has established a code of business conduct and ethics that applies to our directors and to our Manager’s officers, directors and personnel when such individuals are acting for or on our behalf. Among other matters, our code of business conduct and ethics is designed to deter wrongdoing and to promote:
| • | honest and ethical conduct, including the ethical handling of actual or apparent conflicts of interest between personal and professional relationships; |
| • | full, fair, accurate, timely and understandable disclosure in our SEC reports and other public communications; |
| • | compliance with applicable governmental laws, rules and regulations; |
| • | prompt internal reporting of violations of the code to appropriate persons identified in the code; and |
| • | accountability for adherence to the code. |
Any waiver of the code of business conduct and ethics for our officers or directors may be made only by our board of directors as a whole or by the audit committee and will be promptly disclosed as required by law or stock exchange regulations.
148
Table of Contents
Prior to the consummation of this offering, all of our ownership interests will be owned by the Initial Shareholders. The following table sets forth the beneficial ownership of our common shares by the Initial Shareholders immediately prior to this offering and after giving effect to this offering. Other than the Initial Shareholders and their direct and indirect equity holders, we are not aware of any person, or group of affiliated persons, who beneficially own more than five percent of our issued and outstanding common shares. Except as described in footnote (3) to the table below, none of our officers and directors beneficially own any of our common shares.
The percentage of beneficial ownership of our common shares assumes that there are 53,502,873 common shares issued and outstanding immediately prior to this offering and 73,502,873 common shares issued and outstanding immediately following this offering, and does not assume that the underwriters will exercise their option to purchase additional shares.
Following the Distribution, the Initial Shareholders will no longer hold any of our common shares and all of such shares will be distributed to their direct or indirect equityholders (other than shares allocable to the General Partner) in accordance with the respective limited partnership agreements of the Initial Shareholders and the Offshore Partnership. See “Prospectus Summary—Our Organizational Structure” included elsewhere in this prospectus.
| Immediately Prior to this Offering | Immediately Following this Offering | |||||||||||||||
| Name and Address of Beneficial Owner (1) |
Amount and Nature of Beneficial Ownership |
Percent of Class | Amount and Nature of Beneficial Ownership |
Percent of Class | ||||||||||||
| Fortress Worldwide Transportation and Infrastructure Investors LP (2) |
48,157,963 | 90.0 | % | 48,157,963 | 65.5 | % | ||||||||||
| FTAI Offshore Holdings L.P. (2) |
5,344,910 | 10.0 | % | 5,344,910 | 7.3 | % | ||||||||||
| Joseph P. Adams Jr.(3) |
— | — | — | * | ||||||||||||
| Jonathan G. Atkeson(3) |
— | — | — | * | ||||||||||||
| * | Less than one percent. |
| (1) | The address of all persons and entities listed above is c/o Fortress Investment Group LLC, 1345 Avenue of the Americas, 46th Floor, New York, New York 10105. |
| (2) | The general partner of each of Fortress Worldwide Transportation and Infrastructure Investors LP and FTAI Offshore Holdings L.P. is Fortress Worldwide Transportation and Infrastructure Delaware GP LLC (the “Fortress General Partner”). Both Fortress General Partner and Fortress Worldwide Transportation and Infrastructure Master Delaware GP LLC are wholly owned subsidiaries of Principal Holdings I LP. The general partner of Principal Holdings I LP is FIG Asset Co. LLC, a wholly owned subsidiary of Fortress Investment Group LLC. By virtue of his ownership interest in Fortress Investment Group LLC and certain of its affiliates, as well as his role in advising certain investment funds, Wesley R. Edens may be deemed to be the natural person that has sole or shared voting and investment control over the shares listed as beneficially owned by each of the above-listed beneficial owners. Mr. Edens disclaims beneficial ownership of such shares. |
| (3) | Each of Mr. Adams and Mr. Atkeson is a limited partner of Fortress Worldwide Transportation Investors LP and will receive common shares of the Company following the Distribution in accordance with the limited partnership agreement of Fortress Worldwide Transportation and Infrastructure Investors LP. Their respective common shares will remain pledged to Fortress in connection with loan arrangements applicable to their commitments as limited partners. |
149
Table of Contents
CERTAIN RELATIONSHIPS AND RELATED PARTY TRANSACTIONS
In connection with this offering, our board of directors will adopt a policy regarding the approval of any “related person transaction,” which is any transaction or series of transactions in which we or any of our subsidiaries is or are to be a participant, the amount involved exceeds $120,000, and a “related person” (as defined under SEC rules) has a direct or indirect material interest. Any material transactions we engage in with our Manager or another entity managed by our Manager or one of its affiliates would likely constitute related person transactions under the policy and such transactions may include, but are not limited to, certain financing arrangements, purchases of debt, co-investments, consumer loans, servicing advances and other assets. Under the policy, a related person will be required to promptly disclose to the legal department of our Manager any proposed related person transaction and all material facts about the proposed transaction. The legal department would then assess and promptly communicate that information to our independent directors.
Based on their consideration of all of the relevant facts and circumstances, our independent directors will decide whether or not to approve such transaction and will generally approve only those transactions that are in, or are not inconsistent with, our best interests, as determined by at least a majority of the independent directors acting with ordinary care and in good faith. If we become aware of an existing related person transaction that has not been pre-approved under this policy, the transaction will be referred to our independent directors, who will evaluate all options available, including ratification, revision or termination of such transaction. Our policy will require any director who may be interested in a related person transaction to recuse himself or herself from any consideration of such related person transaction.
Management Agreement
We have entered into a Management Agreement with our Manager, an affiliate of Fortress, effective upon completion of this offering, which provides for the day-to-day management of our operations for a management fee. See “Our Manager and Management Agreement and Other Compensation Arrangements” included elsewhere in this prospectus. The Management Agreement requires our Manager to manage our business affairs in conformity with the policies and the strategy that are approved and monitored by our board of directors. From time to time, we may engage (subject to our strategy) in material transactions with our Manager or another entity managed by our Manager or one of its affiliates or other affiliates of Fortress, including Seacastle Ships Holdings Inc., Trac Intermodal and Florida East Coast Railway, L.L.C., which may include, but are not limited to, certain financing arrangements, purchases of debt, co-investments, consumer loans, servicing advances and other assets that present an actual, potential or perceived conflict of interest. In certain circumstances, these transactions must be disclosed to, and approved by, the independent members of our board of directors. See “Our Manager and Management Agreement and Other Compensation Arrangements.”
Fortress Incentive Allocations
We have entered into certain incentive allocation arrangements with the general partner of Holdco, an affiliate of Fortress. See “Our Manager and Management Agreement and Other Compensation Arrangements.”
Our Operating Agreement
See “Certain Provisions of Delaware Law and Our Operating Agreement.”
Registration Rights Agreement
Prior to the consummation of this offering, we intend to enter into a registration rights agreement (the “Registration Rights Agreement”) granting our Manager and its affiliates certain rights to register common shares held by them under the Securities Act. A description of the Registration Rights Agreement is set forth below and is qualified in its entirety by the actual agreement, a copy of which has been filed with the registration statement of which this prospectus forms a part.
150
Table of Contents
Demand Rights.
Under the Registration Rights Agreement, our Manager, the General Partner and their respective affiliates (together with permitted transferees, the “Fortress Entities”), for so long as the Management Agreement is in effect, a year has not elapsed from the execution of the Registration Rights Agreement or the Fortress Entities directly or indirectly beneficially own an amount of our common shares (whether owned at the time of this offering, are subsequently acquired, or may be acquired pursuant to a right to conversion or exercise) equal to or greater than 1% of our common shares issued and outstanding immediately after the consummation of this offering (a “Registrable Amount”), may exercise “demand” registration rights that allow the Fortress Entities, at any time after 180 days following the consummation of this offering, to request that we register under the Securities Act an amount equal to or greater than a Registrable Amount. The Fortress Entities will be entitled to unlimited demand registrations so long as such persons, together, beneficially own a Registrable Amount. We will not be obligated to grant a request for a demand registration within one month of any other demand registration.
Piggyback Rights.
For so long as the Fortress Entities beneficially own a Registrable Amount, the Fortress Entities will also have “piggyback” registration rights that allow them to include the common shares that they own in any public offering of equity securities initiated by us (other than those public offerings pursuant to registration statements on Forms S-4 or S-8 or pursuant to an employee benefit plan arrangement) or by any of our other shareholders that have registration rights. These “piggyback” registration rights will be subject to proportional cutbacks based on the manner of the offering and the identity of the party initiating such offering.
Shelf Registration.
We will also grant to the Fortress Entities, for so long as they beneficially own a Registrable Amount or otherwise hold restricted Securities, the right to request a shelf registration on Form S-1 or Form S-3 or any other appropriate form providing for offerings of our common shares to be made on a continuous basis until all shares covered by such registration have been sold, subject to our right to suspend the use of the shelf registration prospectuses for a reasonable period of time (not exceeding 60 days in succession or 90 days in the aggregate in any 12 month period) if we determine that certain disclosures required by the shelf registration statements would be detrimental to us or our shareholders. In addition, the Fortress Entities may elect to participate in such shelf registrations within 10 days after notice of the registration is given.
Indemnification; Expenses; Lock-ups.
We will agree to indemnify the applicable selling shareholders, their affiliates and their respective officers, directors, employees, managers, partners, agents and controlling persons against any losses or damages resulting from any untrue statement or omission of material fact in any registration statement, prospectus or preliminary prospects or any issuer free writing prospectus or any amendment or supplement thereto pursuant to which they sell our common shares, unless such liability arose from the applicable selling shareholder’s misstatement or omission, and the applicable selling shareholder will agree to indemnify us against all losses caused by its misstatements or omissions. We will pay all registration and offering-related expenses incidental to our performance under the Registration Rights Agreement, and the applicable selling shareholder will pay its portion of all underwriting discounts, commissions and transfer taxes, if any, relating to the sale of its common shares thereunder. We have agreed to enter into, and to cause our officers and directors to enter into, lock-up agreements in connection with any exercise of registration rights by the Fortress Entities.
Indemnification Agreements
Prior to the completion of this offering, we intend to enter into separate indemnification agreements with each of our directors and officers. See “Certain Provisions of Delaware Law and our Operating Agreement—Anti-Takeover Effects of Delaware Law and Our Operating Agreement—Limitations on Liability and Indemnification of Directors and Officers.”
151
Table of Contents
The following descriptions of our common shares and provisions of our operating agreement as will be in effect upon the completion of this offering do not purport to be complete and are subject to, and are qualified in their entirety by reference to, all of the provisions of our operating agreement, a copy of which has been filed as an exhibit to the registration statement of which this prospectus forms a part. Prospective investors are urged to read the exhibits for a complete understanding of our operating agreement.
General
Following the consummation of this offering, our authorized shares will consist of:
| • | 2,000,000,000 common shares; and |
| • | 200,000,000 preferred shares. |
Common Shares
All of our issued and outstanding common shares prior to and following completion of this offering are and will be duly issued. Upon payment in full of the consideration payable with respect to our common shares, as determined by our board of directors, the holders of such shares shall not be liable to us to make any additional capital contributions with respect to such shares (except as otherwise required by Sections 18-607 and 18-804 of the Delaware LLC Act). No holder of common shares is entitled to preemptive, preferential or similar rights or redemption or conversion rights. Holders of common shares are entitled to one vote per share on all matters submitted to a vote of holders of common shares. Unless a different majority is required by law or by our operating agreement, resolutions to be approved by holders of common shares require approval by a simple majority of votes cast at a meeting at which a quorum is present.
Each holder of common shares is entitled to one vote for each common share held on all matters submitted to a vote of shareholders. Except as provided with respect to any other class or series of shares, the holders of our common shares will possess the exclusive right to vote for the election of directors and for all other purposes. Our operating agreement does not provide for cumulative voting in the election of directors, which means that the holders of a majority of the outstanding common shares can elect all of the directors standing for election, and the holders of the remaining shares are not able to elect any directors.
Subject to any preference rights of holders of any preferred shares that we may issue in the future, holders of our common shares are entitled to receive dividends, if any, declared from time to time by our board of directors out of legally available funds. In the event of our liquidation, dissolution or winding up, the holders of our common shares are entitled to share ratably in all assets remaining after the payment of liabilities, subject to any rights of holders of our preferred shares prior to distribution.
Preferred Shares
Pursuant to our operating agreement, our board of directors by resolution may establish one or more series of preferred shares having such number of shares, designations, dividend rates, relative voting rights, conversion or exchange rights, redemption rights, liquidation rights and other relative participation, optional or other special rights, qualifications, limitations or restrictions as may be fixed by the board without any further shareholder approval. The rights with respect to a series of preferred shares may be more favorable to the holder(s) thereof than the rights attached to our common shares. It is not possible to state the actual effect of the issuance of any preferred shares on the rights of holders of our common shares until our board of directors determines the specific rights attached to such preference share. The effect of issuing preferred shares may include, among other things, one or more of the following:
| • | restricting dividends in respect of our common shares; |
| • | diluting the voting power of our common shares or providing that holders of preferred shares have the right to vote on matters as a class; |
152
Table of Contents
| • | impairing the liquidation rights of our common shares; or |
| • | delaying or preventing a change of control of us. |
Registrar or Transfer Agent
The registrar and transfer agent for our common shares is American Stock Transfer & Trust Company, LLC.
Listing
We have been approved to list our common shares on the NYSE under the symbol “FTAI.”
153
Table of Contents
CERTAIN PROVISIONS OF DELAWARE LAW AND OUR OPERATING AGREEMENT
OUR OPERATING AGREEMENT
Organization and Duration
Our limited liability company was formed on February 13, 2014 as Fortress Transportation and Infrastructure Investors LLC, and will remain in existence until dissolved in accordance with our operating agreement.
Purpose
Under our operating agreement, we are permitted to engage in any business activity that lawfully may be conducted by a limited liability company organized under Delaware law and, in connection therewith, to exercise all of the rights and powers conferred upon us pursuant to the agreements relating to such business activity; provided, however, that, except if our board of directors determines that it is no longer in our best interests, our Manager shall not cause us to engage, directly or indirectly, in any business activity that our board of directors determines would cause us to be treated as an association taxable as a corporation or otherwise taxable as an entity for federal income tax purposes.
Agreement to be Bound by our Operating Agreement; Power of Attorney
By purchasing our common shares, you will be admitted as a member of our limited liability company and will be deemed to have agreed to be bound by the terms of our operating agreement. Pursuant to this agreement, each shareholder and each person who acquires shares from a shareholder grants to certain of our officers (and, if appointed, a liquidator) a power of attorney to, among other things, execute and file documents required for our qualification, continuance or dissolution. The power of attorney also grants certain of our officers the authority to make certain amendments to, and to make consents and waivers under and in accordance with, our operating agreement.
Limited Liability
The Delaware LLC Act provides that a member who receives a distribution from a Delaware limited liability company and knew at the time of the distribution that the distribution was in violation of the Delaware LLC Act shall be liable to the company for the amount of the distribution for three years. Under the Delaware LLC Act, a limited liability company may not make a distribution to a member if, after the distribution, all liabilities of the company, other than liabilities to members on account of their shares and liabilities for which the recourse of creditors is limited to specific property of the company, would exceed the fair value of the assets of the company. For the purpose of determining the fair value of the assets of a company, the Delaware LLC Act provides that the fair value of property subject to liability for which recourse of creditors is limited shall be included in the assets of the company only to the extent that the fair value of that property exceeds the nonrecourse liability. Under the Delaware LLC Act, an assignee who becomes a substituted member of a company is liable for the obligations of his assignor to make contributions to the company, except the assignee is not obligated for liabilities unknown to him at the time the assignee became a member and that could not be ascertained from the operating agreement.
Amendment of Our Operating Agreement
Amendments to our operating agreement may be proposed only by or with the consent of our board of directors. To adopt a proposed amendment, our board of directors is required to seek written approval of the holders of the number of shares required to approve the amendment or call a meeting of our shareholders to consider and vote upon the proposed amendment. Except as set forth below, an amendment must be approved by holders of a majority of the total outstanding shares.
154
Table of Contents
Prohibited Amendments. No amendment may be made that would:
| • | enlarge the obligations of any shareholder without such shareholder’s consent, unless approved by at least a majority of the type or class of shares so affected; |
| • | provide that we are not dissolved upon an election to dissolve our limited liability company by our board of directors that is approved by holders of a majority of the outstanding shares; |
| • | change the term of existence of our company; or |
| • | give any person the right to dissolve our limited liability company other than our board of directors’ right to dissolve our limited liability company with the approval of holders of a majority of the total combined voting power of our outstanding shares. |
The provision of our operating agreement preventing the amendments having the effects described in any of the clauses above can be amended upon the approval of holders of at least two-thirds of the outstanding shares.
No Shareholder Approval. Our board of directors may generally make amendments to our operating agreement without the approval of any shareholder or assignee to reflect:
| • | a change in our name, the location of our principal place of our business, our registered agent or our registered office; |
| • | the admission, substitution, withdrawal or removal of shareholders in accordance with our operating agreement; |
| • | the merger of our company or any of its subsidiaries into, or the conveyance of all of our assets to, a newly-formed entity if the sole purpose of that merger or conveyance is to effect a mere change in our legal form into another limited liability entity; |
| • | a change that our board of directors determines to be necessary or appropriate for us to qualify or continue our qualification as a company in which our members have limited liability under the laws of any state or to ensure that we will not be treated as an association taxable as a corporation or otherwise taxed as an entity for U.S. federal income tax purposes other than as we specifically so designate; |
| • | an amendment that our board of directors determines, based upon the advice of counsel, to be necessary or appropriate to prevent us, members of our board, or our officers, agents or trustees from in any manner being subjected to the provisions of the Investment Company Act of 1940, the Investment Advisers Act of 1940, or ‘‘plan asset’’ regulations adopted under the Employee Retirement Income Security Act of 1974, or ERISA, whether or not substantially similar to plan asset regulations currently applied or proposed; |
| • | an amendment or issuance that our board of directors determines to be necessary or appropriate for the authorization of additional securities; |
| • | any amendment expressly permitted in our operating agreement to be made by our board of directors acting alone; |
| • | an amendment effected, necessitated or contemplated by a merger agreement that has been approved under the terms of our operating agreement; |
| • | any amendment that our board of directors determines to be necessary or appropriate for the formation by us of, or our investment in, any corporation, partnership or other entity, as otherwise permitted by our operating agreement; |
| • | a change in our fiscal year or taxable year and related changes; and |
| • | any other amendments substantially similar to any of the matters described in the clauses above. |
155
Table of Contents
In addition, our board of directors may make amendments to our operating agreement without the approval of any shareholder or assignee if our board of directors determines that those amendments:
| • | do not adversely affect the shareholders in any material respect; |
| • | are necessary or appropriate to satisfy any requirements, conditions or guidelines contained in any opinion, directive, order, ruling or regulation of any federal or state agency or judicial authority or contained in any federal or state statute; |
| • | are necessary or appropriate to facilitate the trading of shares or to comply with any rule, regulation, guideline or requirement of any securities exchange on which the shares are or will be listed for trading, compliance with any of which our board of directors deems to be in the best interests of us and our shareholders; |
| • | are necessary or appropriate for any action taken by our board of directors relating to splits or combinations of shares under the provisions of our operating agreement; or |
| • | are required to effect the intent expressed in this prospectus or the intent of the provisions of our operating agreement or are otherwise contemplated by our operating agreement. |
Termination and Dissolution
We will continue as a limited liability company until terminated under our operating agreement. We will dissolve upon: (1) the election of our board of directors to dissolve us, if approved by holders of a majority of our outstanding shares; (2) the sale, exchange or other disposition of all or substantially all of our assets and those of our subsidiaries; (3) the entry of a decree of judicial dissolution of our limited liability company; or (4) at any time that we no longer have any shareholders, unless our business is continued in accordance with the Delaware LLC Act.
Election to be Treated as a Corporation
If the Board of Directors determines that it is no longer in our best interests to continue as a partnership for U.S. federal income tax purposes, the Board of Directors may elect to treat us as an association or as a publicly traded partnership taxable as a corporation for U.S. federal (and applicable state) income tax purposes.
In the event that the board of directors determines the company should seek relief pursuant to Section 7704(e) of the Code to preserve the status of the company as a partnership for federal (and applicable state) income tax purposes, the company and each shareholder shall agree to adjustments required by the tax authorities, and the company shall pay such amounts as required by the tax authorities, to preserve the status of the company as a partnership.
Books and Reports
We are required to keep appropriate books of our business at our principal offices. The books will be maintained for both tax and financial reporting purposes on an accrual basis by our Manager. For financial reporting purposes and for tax purposes, our fiscal year is the calendar year. Our Manager has agreed to use reasonable efforts to furnish to you tax information (including Schedule K-1) as promptly as possible, which describes your allocable share of our income, gain, loss and deduction for our preceding taxable year. In preparing this information, our Manager will use various accounting and reporting conventions to determine your allocable share of income, gain, loss and deduction. Delivery of this information by our Manager may be subject to delay as a result of the late receipt of any necessary tax information from an investment in which we hold an interest. It is therefore possible that, in any taxable year, our shareholders will need to apply for extensions of time to file their tax returns.
156
Table of Contents
ANTI-TAKEOVER EFFECTS OF DELAWARE LAW AND OUR OPERATING AGREEMENT
The following is a summary of certain provisions of our operating agreement that may be deemed to have an anti-takeover effect and may delay, deter or prevent a tender offer or takeover attempt that a shareholder might consider to be in its best interest, including those attempts that might result in a premium over the market price for the shares held by shareholders.
Authorized but Unissued Shares
The authorized but unissued shares of our common shares and our preferred shares will be available for future issuance without obtaining shareholder approval. These additional shares may be utilized for a variety of corporate purposes, including future offerings to raise additional capital and corporate acquisitions. The existence of authorized but unissued common shares and preferred stock could render more difficult or discourage an attempt to obtain control over us by means of a proxy contest, tender offer, merger or otherwise.
Delaware Business Combination Statute—Section 203
We are a limited liability company organized under Delaware law. Some provisions of Delaware law may delay or prevent a transaction that would cause a change in our control.
Section 203 of the DGCL, which restricts certain business combinations with interested shareholders in certain situations, does not apply to limited liability companies unless they elect to utilize it. Our operating agreement does not currently elect to have Section 203 of the DGCL apply to us. In general, this statute prohibits a publicly held Delaware corporation from engaging in a business combination with an interested shareholder for a period of three years after the date of the transaction by which that person became an interested shareholder, unless the business combination is approved in a prescribed manner. For purposes of Section 203, a business combination includes a merger, asset sale or other transaction resulting in a financial benefit to the interested shareholder, and an interested shareholder is a person who, together with affiliates and associates, owns, or within three years prior, did own, 15% or more of voting shares.
Other Provisions of Our Operating Agreement
Our operating agreement provides that our board shall consist of not fewer than three and not more than nine directors as the board of directors may from time to time determine. Our board of directors will consist of five directors and will be divided into three classes that are, as nearly as possible, of equal size. Each class of directors is elected for a three-year term of office, but the terms are staggered so that the term of only one class of directors expires at each annual general meeting. The current terms of the Class I, Class II and Class III directors will expire in 2016, 2017, and 2018, respectively. We believe that classification of our board of directors will help to assure the continuity and stability of our business strategies and policies as determined by our board of directors. Additionally, there is no cumulative voting in the election of directors. This classified board provision could have the effect of making the replacement of incumbent directors more time consuming and difficult. At least two annual meetings of shareholders, instead of one, will generally be required to effect a change in a majority of our board of directors.
The classified board provision could increase the likelihood that incumbent directors will retain their positions. The staggered terms of directors may delay, defer or prevent a tender offer or an attempt to change control of us, even though a tender offer or change in control might be believed by our shareholders to be in their best interest.
In addition, our operating agreement provides that a director may be removed, only for cause, and only by the affirmative vote of at least 80% of the then issued and outstanding common shares entitled to vote in the election of directors.
157
Table of Contents
In addition, our board of directors shall have the power to appoint a person as a director to fill a vacancy on our board occurring as a result of the death, disability, disqualification removal or resignation of a director, or as a result of an increase in the size of our board of directors.
Pursuant to our operating agreement, preferred shares may be issued from time to time, and the board of directors is authorized to determine and alter all designations, preferences, rights, powers and duties without limitation. See “Description of Common Shares—Preferred Shares.” Our operating agreement does not provide our shareholders with the ability to call a special meeting of the shareholders.
Ability of Our Shareholders to Act
Our operating agreement does not permit our shareholders to call special shareholders meetings. Special meetings of shareholders may be called by a majority of the Board of Directors or a committee of the Board of Directors that has been duly designated by the Board of Directors and whose powers include the authority to call such meetings. Written notice of any special meeting so called shall be given to each shareholder of record entitled to vote at such meeting not less than 10 or more than 60 days before the date of such meeting, unless otherwise required by law.
Our operating agreement also prohibits our shareholders from consenting in writing to take any action in lieu of taking such action at a duly called annual or special meeting of our shareholders.
Our operating agreement provides that nominations of persons for election to our board of directors may be made at any annual meeting of our shareholders, or at any special meeting of our shareholders called for the purpose of electing directors, (a) by or at the direction of our board of directors or (b) by certain shareholders. In addition to any other applicable requirements, for business to be properly brought before an annual meeting by a shareholder, such shareholder must have given timely notice thereof in proper written form to our Secretary. To be timely, a shareholder’s notice must be delivered to or mailed and received at our principal executive offices (i) in the case of an annual meeting, not less than 90 days nor more than 120 days prior to the anniversary date of the immediately preceding annual meeting of shareholders; provided, however, that in the event that the annual meeting is called for a date that is not within 25 days before or after such anniversary date, notice by a shareholder in order to be timely must be so received not later than the close of business on the tenth day following the day on which such notice of the date of the annual meeting was mailed or such public disclosure of the date of the annual meeting was made, whichever first occurs and (ii) in the case of a special meeting, not later than the tenth day following the day on which such notice of the date of the special meeting was mailed or such public disclosure of the date of the special meeting was made, whichever first occurs.
Limitations on Liability and Indemnification of Directors and Officers
Our operating agreement provides that our directors will not be personally liable to us or our shareholders for monetary damages for breach of a fiduciary duty as a director, except to the extent such exemption is not permitted under the Delaware Limited Liability Company Act.
Our operating agreement provides that we must indemnify our directors and officers to the fullest extent permitted by law. We are also expressly authorized to advance certain expenses (including attorneys’ fees and disbursements and court costs) to our directors and officers and carry directors’ and officers’ insurance providing indemnification for our directors and officers for some liabilities. We believe that these indemnification provisions and insurance are useful to attract and retain qualified directors and officers.
Prior to the completion of this offering, we intend to enter into separate indemnification agreements with each of our directors and executive officers. Each indemnification agreement will provide, among other things, for indemnification to the fullest extent permitted by law and our operating agreement against (i) any and all expenses and liabilities, including judgments, fines, penalties and amounts paid in settlement of any claim with our approval and counsel fees and disbursements, (ii) any liability pursuant to a loan guarantee, or otherwise, for any of our indebtedness, and (iii) any liabilities incurred as a result of acting on our behalf (as a fiduciary or
158
Table of Contents
otherwise) in connection with an employee benefit plan. The indemnification agreements will provide for the advancement or payment of all expenses to the indemnitee and for reimbursement to us if it is found that such indemnitee is not entitled to such indemnification under applicable law and our operating agreement.
Corporate Opportunity
Under our operating agreement, to the extent permitted by law:
| • | Fortress and its respective affiliates, including the Manager and General Partner, have the right to, and have no duty to abstain from, exercising such right to, engage or invest in the same or similar business as us, do business with any of our clients, customers or vendors or employ or otherwise engage any of our officers, directors or employees; |
| • | if Fortress and its respective affiliates, including the Manager and General Partner, or any of their officers, directors or employees acquire knowledge of a potential transaction that could be a corporate opportunity, it has no duty to offer such corporate opportunity to us, our shareholders or affiliates; |
| • | we have renounced any interest or expectancy in, or in being offered an opportunity to participate in, such corporate opportunities; and |
| • | in the event that any of our directors and officers who is also a director, officer or employee of Fortress and their respective affiliates, including the Manager and General Partner, acquire knowledge of a corporate opportunity or is offered a corporate opportunity, provided that this knowledge was not acquired solely in such person’s capacity as our director or officer and such person acted in good faith, then such person is deemed to have fully satisfied such person’s fiduciary duty and is not liable to us if Fortress and their respective affiliates, including the Manager and General Partner, pursues or acquires the corporate opportunity or if such person did not present the corporate opportunity to us. |
159
Table of Contents
SHARES ELIGIBLE FOR FUTURE SALE
Prior to this offering, there has been no public market for our common shares, and we cannot predict the effect, if any, that sales of shares or availability of any shares for sale will have on the market price of our common shares prevailing from time to time. Sales of substantial amounts of our common shares (including shares issued on the exercise of options, warrants or convertible securities, if any) or the perception that such sales could occur, could adversely affect the market price of our common shares and our ability to raise additional capital through a future sale of securities.
Upon completion of this offering, we will have 73,502,873 common shares issued and outstanding (or a maximum of 76,502,873 shares if the underwriters exercise their option to purchase additional shares in full). All of the 73,502,873 common shares sold in this offering (or 76,502,873 shares if the underwriters exercise their option to purchase additional shares in full) will be freely tradable without restriction or further registration under the Securities Act unless such shares are purchased by “affiliates” as that term is defined in Rule 144 under the Securities Act. Upon completion of this offering, approximately 72.8% of our issued and outstanding common shares will be held by the Initial Shareholders. These shares will be “restricted securities” as that phrase is defined in Rule 144. Subject to certain contractual restrictions, including the lock-up agreements described below and restrictions in the respective limited partnership agreements of the Initial Shareholders, holders of restricted shares will be entitled to sell those shares in the public market if they qualify for an exemption from registration under Rule 144 or any other applicable exemption under the Securities Act. Subject to the lock-up agreements described below and the provisions of Rules 144, additional shares will be available for sale as set forth below.
Lock-Up Agreements
We and our executive officers, directors, Initial Shareholders and the General Partner have agreed with the underwriters that, subject to certain exceptions, for a period of 180 days after the date of this prospectus, we and they will not directly or indirectly offer, pledge, sell, contract to sell, sell any option or contract to purchase or otherwise dispose of any of our common shares or any securities convertible into or exercisable or exchangeable for our common shares, or in any manner transfer all or a portion of the economic consequences associated with the ownership of our common shares, or cause a registration statement covering any of our common shares to be filed, without the prior written consent of the representatives of the underwriters. See “Underwriting.” The representatives may waive these restrictions at their discretion.
The representatives have no present intent or arrangement to release any of the securities subject to these lock-up agreements. The release of any lock-up is considered on a case-by-case basis. Factors in deciding whether to release shares may include the length of time before the lock-up expires, the number of shares involved, the reason for the requested release, market conditions, the trading price of our common shares, historical trading volumes of our common shares and whether the person seeking the release is an officer, director or affiliate of the Company.
Following the expiration of these lock-up agreements and upon completion of the Distribution, the Limited Partners, including the General Partner, will not be subject to any contractual restrictions on the sale of the shares received by them in the Distribution, and may freely resell such securities under Rule 144 as described below or pursuant to any other applicable exemption under the Securities Act.
Rule 144
In general, under Rule 144 under the Securities Act, a person (or persons whose shares are aggregated) who is not deemed to have been an affiliate of ours at any time during the three months preceding a sale, and who has beneficially owned restricted securities within the meaning of Rule 144 for at least six months (including any period of consecutive ownership of preceding non-affiliated holders) would be entitled to sell those shares, subject only to the availability of current public information about us. A non-affiliated person who has beneficially owned restricted securities within the meaning of Rule 144 for at least one year would be entitled to sell those shares without regard to the provisions of Rule 144.
160
Table of Contents
A person (or persons whose shares are aggregated) who is deemed to be an affiliate of ours and who has beneficially owned restricted securities within the meaning of Rule 144 for at least six months would be entitled to sell within any three-month period a number of shares that does not exceed the greater of 1% of the then outstanding shares of our common shares or the average weekly trading volume of our common shares reported through the NYSE during the four calendar weeks preceding such sale. Such sales are also subject to certain manner of sale provisions, notice requirements and the availability of current public information about us.
161
Table of Contents
UNITED STATES FEDERAL INCOME TAX CONSIDERATIONS
The following is a summary of U.S. federal income tax considerations generally applicable to the purchase, ownership and disposition of common shares by U.S. Holders (as defined below) and Non-U.S. Holders (as defined below). This discussion deals only with common shares held as capital assets by shareholders who purchase common shares in this offering. This discussion does not cover all aspects of U.S. federal income taxation that may be relevant to the purchase, ownership or disposition of our common shares by prospective investors in light of their particular circumstances. In particular, this discussion does not address all of the tax considerations that may be relevant to certain types of investors subject to special treatment under U.S. federal income tax laws, such as the following:
| • | brokers or dealers in securities or currencies; |
| • | financial institutions; |
| • | pension plans; |
| • | regulated investment companies; |
| • | real estate investment trusts; |
| • | cooperatives; |
| • | except to the extent discussed below, tax-exempt entities; |
| • | insurance companies; |
| • | persons holding common shares as part of a hedging, integrated, conversion or constructive sale transaction or a straddle; |
| • | traders in securities that elect to use a mark-to-market method of accounting for their securities holdings; |
| • | persons liable for alternative minimum tax; |
| • | U.S. expatriates; |
| • | partnerships or entities or arrangements treated as partnerships or other pass through entities for U.S. federal income tax purposes (or investors therein); or |
| • | U.S. Holders (as defined below) whose “functional currency” is not the U.S. dollar. |
Furthermore, this discussion is based upon the provisions of the Code, the Treasury regulations promulgated thereunder and administrative and judicial interpretations thereof, all as of the date hereof. Such authorities may be repealed, revoked, modified or subject to differing interpretations, possibly on a retroactive basis, so as to result in U.S. federal income tax consequences different from those discussed below. In addition, this discussion does not address any state, local or non-U.S. tax considerations, or any U.S. federal tax considerations other than income tax considerations (such as estate or gift tax consequences or the Medicare contribution tax on certain investment income).
For purposes of this discussion, you will be considered a “U.S. Holder” if you beneficially own our common shares and you are for U.S. federal income tax purposes one of the following:
| • | a citizen or an individual who is a resident of the United States; |
| • | a corporation (or other entity taxable as a corporation) created or organized under the laws of the United States, any state thereof or the District of Columbia; |
| • | an estate the income of which is subject to U.S. federal income taxation regardless of its source; or |
| • | a trust if you (i) are subject to the primary supervision of a court within the United States and one or more U.S. persons have the authority to control all of your substantial decisions or (ii) have a valid election in effect under applicable U.S. Treasury regulations to be treated as a U.S. person. |
162
Table of Contents
You will be considered a “Non-U.S. Holder” if you beneficially own our common shares and you are not a U.S. Holder or a partnership or other passthrough entity for U.S. federal income tax purposes. If you are a partnership or other passthrough entity for U.S. federal income tax purposes, the U.S. federal income tax treatment of your partners or owners generally will depend upon the status of such partners or owners and your activities.
The United States federal income tax treatment of our shareholders depends in some instances on determinations of fact and interpretations of complex provisions of federal income tax law for which no clear precedent or authority may be available. In addition, the tax consequences of holding common shares to any particular shareholder will depend on the shareholder’s particular tax circumstances. Accordingly, you should consult your own tax advisor regarding the United States federal, state, local, and non-U.S. tax consequences of acquiring, holding, exchanging, or otherwise disposing of common shares and of our treatment for united states federal income tax purposes as a partnership, and not as an association or a publicly traded partnership taxable as a corporation.
Federal Income Tax Opinion Regarding Partnership Status
Skadden, Arps, Slate, Meagher & Flom LLP has acted as our counsel in connection with this offering. On the closing date Skadden, Arps, Slate, Meagher & Flom LLP will deliver an opinion that based on current law FTAI will be treated, for U.S. federal income tax purposes, as a partnership and not as an association or publicly traded partnership (within the meaning of Section 7704 of the Code) subject to tax as a corporation. The opinion of Skadden, Arps, Slate Meagher & Flom LLP is based on various assumptions and representations relating to FTAI’s organization, operation, assets, activities and income, including that all such representations set forth in the officer’s certificate on which the opinion is based and all other factual information set forth in the relevant documents, records and instruments are true and correct, that all actions described in this offering are completed in a timely fashion and that we will at all times operate in accordance with the method of operation described in our organizational documents and this offering. Such opinion is conditioned upon representations and covenants made by our management regarding our organization, assets, activities, income, and present and future conduct of our business operations, and assumes that such representations and covenants are accurate and complete. You should be aware that opinions of counsel are not binding on the IRS, and no assurance can be given that the IRS will not challenge the conclusions set forth in such opinions.
Taxation of FTAI
FTAI intends to operate so that it will qualify to be treated for U.S. federal income tax purposes as a partnership, and not as an association or publicly traded partnership taxable as a corporation. Given the ongoing importance of our actual method of operation each year, and the possibility of future changes in our circumstances, no assurance can be given by Skadden, Arps, Slate, Meagher & Flom LLP or FTAI that FTAI will so qualify for any particular year. Skadden, Arps, Slate, Meagher, & Flom LLP will have no obligation to advise FTAI or FTAI’s shareholders of any subsequent change in the matters stated, represented or assumed, or of any subsequent change in, or differing IRS interpretation of, the applicable law. FTAI’s taxation as a partnership that is not a publicly traded partnership taxable as a corporation will depend on its ability to meet, on a continuing basis, through actual operating results, the “Qualifying Income Exception” (as described below), the compliance with which will not be reviewed by Skadden, Arps, Slate, Meagher & Flom LLP on an ongoing basis. Accordingly, no assurance can be given that the actual results of our operations for any taxable year will satisfy the Qualifying Income Exception.
An entity that would otherwise be classified as a partnership for U.S. federal income tax purposes may nonetheless be taxable as a corporation if it is a “publicly traded partnership,” unless an exception applies. FTAI will be publicly traded for this purpose. Nevertheless, an exception, which we refer to as the Qualifying Income Exception, exists with respect to a publicly traded partnership if (i) at least 90% of such partnership’s gross
163
Table of Contents
income for each taxable year consists of “qualifying income” and (ii) the partnership would not be required to register under the Investment Company Act if it were a U.S. corporation. Qualifying income generally includes dividends, interest, capital gains from the sale or other disposition of stock and securities and other forms of investment income. FTAI currently expects that a substantial portion of its income will constitute either “Subpart F” income (defined below) derived from CFCs or QEF Inclusions (each as defined below). While we believe that such income constitutes qualifying income, no assurance can be given that the IRS will agree with such position. FTAI also expects that its return from investments will also include interest, dividends, capital gains and other types of qualifying income sufficient, in the aggregate, to satisfy the Qualifying Income Exception, although we cannot assure that this will in fact be the case.
While it is treated as a publicly traded partnership, FTAI intends to manage its investments so that it will satisfy the Qualifying Income Exception. There can be no assurance, however, that FTAI will do so or that the IRS would not challenge its compliance with the Qualifying Income Exception and, therefore, assert that FTAI should be taxable as a corporation for U.S. federal income tax purposes.
If FTAI fails to satisfy the Qualifying Income Exception (other than a failure which is determined by the IRS to be inadvertent and which is cured within a reasonable period of time after the discovery of such failure as discussed below) or if FTAI elects to be treated as a corporation based upon a determination by its board of directors, FTAI will be treated as if it had transferred all of its assets, subject to its liabilities, to a newly formed corporation, on the first day of the year in which it failed to satisfy the Qualifying Income Exception (or the date on which the election to be treated as a corporation was effective), in return for stock of such corporation, and then distributed such stock to its shareholders in liquidation of their interests in FTAI. This contribution and liquidation should be tax-free to our shareholders (except for a Non-U.S. Holder if we own an interest in U.S. real property or an interest in a USRPHC as discussed below in “Taxation of Non-U.S. Persons”) so long as we do not have liabilities in excess of our tax basis in our assets.
If, for any reason (including our failure to meet the Qualifying Income Exception or a determination by our board of directors to elect to be treated as a corporation), FTAI were treated as an association or publicly traded partnership taxable as a corporation for U.S. federal income tax purposes, we would be subject to U.S. federal income tax on our taxable worldwide income at regular corporate income tax rates, without deduction for any distributions to shareholders, thereby materially reducing the amount of any funds available for distribution to shareholders. In addition, if FTAI were treated as a corporation for U.S. federal income tax purposes, distributions made to shareholders would be treated as taxable dividend income to the extent of FTAI’s current or accumulated earnings and profits. Any distribution in excess of current and accumulated earnings and profits would first be treated as a return of capital to the extent of a shareholder’s adjusted tax basis in its common shares (determined separately with respect to each share), which would not be subject to tax. Thereafter, to the extent such distribution were to exceed a shareholder’s adjusted tax basis in its common shares, the distribution would be treated as gain from the sale or exchange of such common shares.
If at the end of any year FTAI fails to meet the Qualifying Income Exception, FTAI may still qualify as a partnership for U.S. federal income tax purposes if it is entitled to relief under the Code for an inadvertent termination of partnership status. This relief will be available if (i) the failure to meet the Qualifying Income Exception is cured within a reasonable time after discovery, (ii) the failure is determined by the IRS to be inadvertent, and (iii) FTAI and each of our shareholders (during the failure period) agree to make such adjustments or to pay such amounts as are required by the IRS. Under FTAI’s operating agreement, each of our shareholders is obligated to make such adjustments or to pay such amounts as are required by the IRS to maintain FTAI’s status as a partnership for U.S. federal income tax purposes. It is not possible to determine at this time whether FTAI would be entitled to this relief in any or all circumstances. It also is not clear under the Code whether this relief is available for FTAI’s first taxable year as a publicly traded partnership. If this relief provision is inapplicable to a particular set of circumstances involving FTAI, FTAI will not qualify as a partnership for U.S. federal income tax purposes. Even if this relief provision applies and FTAI retains its partnership status, FTAI or our shareholders (during the failure period) will be required to pay such amounts as are determined by the IRS.
164
Table of Contents
Despite its classification as a partnership, a significant portion of FTAI’s income will be derived through its corporate subsidiaries, and such subsidiaries may be subject to corporate income tax.
In addition, FTAI expects that all or substantially all of the items of income, gain, loss, deduction, or credit realized by FTAI will be realized in the first instance by Holdco and allocated to FTAI for reallocation to its shareholders. Unless otherwise specified, references in this section to “we” “us,” and “our” refer to FTAI and Holdco and references to “our” items of income, gain, loss, deduction, or credit include the realization of such items by Holdco and the allocation of such items to FTAI. The remainder of this discussion assumes that FTAI will be treated for U.S. federal income tax purposes as a partnership.
Investment Structures
To manage our affairs so as to meet the Qualifying Income Exception, we may structure certain investments through entities classified as corporations for U.S. federal income tax purposes. Because our shareholders are expected to be located in numerous taxing jurisdictions, no assurances can be given that any such investment structure will have the same impact on all shareholders, and such investment structure may even impose additional tax burdens on some shareholders. If the entities are non-U.S. corporations, they may be considered PFICs or CFCs, the consequences of which are described below. If the entities are U.S. corporations, they would be subject to U.S. federal income tax on their operating income, including any gain recognized on their disposition of their investments. In addition, if the investment involves interests in U.S. real property, gain recognized on disposition generally would be subject to U.S. federal income tax, whether the corporations are U.S. or non-U.S. corporations.
Consequences to U.S. Holders
Taxation of U.S. Holders on Our Profits and Losses
As a partnership for U.S. federal income tax purposes, we are not a taxable entity and we incur no U.S. federal income tax liability. Instead, each shareholder, in computing its own U.S. federal income tax liability for any taxable year, will be required to take into account its allocable share of items of our income, gain, loss, deduction and credit for each of our taxable years ending with or within such shareholder’s taxable year, regardless whether the shareholder has received any distributions. The characterization of an item of our income, gain, loss, deduction or credit generally will be determined at our (rather than at the shareholder’s) level.
With respect to individual and other non-corporate U.S. Holders, certain dividends paid by a corporation (including certain qualified foreign corporations) to us and that are allocable to such U.S. Holders may qualify for reduced rates of taxation. A qualified foreign corporation includes a non-U.S. corporation that is eligible for the benefits of specified income tax treaties with the United States. In addition, a non-U.S. corporation is treated as a qualified corporation with respect to its shares that are readily tradable on an established securities market in the United States. Among other exceptions, individual and other non-corporate U.S. Holders generally will not be eligible for reduced rates of taxation on any dividends if the payer is a CFC or PFIC for the taxable year in which such dividends are paid or for the preceding taxable year. U.S. Holders that are corporations may be entitled to a “dividends received deduction” in respect of dividends paid to us by U.S. corporations. We currently expect that a significant portion of our income will be derived from “Subpart F” income (defined below) derived from CFCs or QEF Inclusions (defined below) derived from PFICs, which will not be eligible for the reduced rates of taxation generally available to individual and other non-corporate shareholders or the “dividends received deduction” available to corporate shareholders. You should consult your own tax advisor regarding the application of the foregoing rules in light of your particular circumstances.
Allocation of Profits and Losses
For each of our taxable years, items of income, gain, loss, deduction or credit recognized by us will be allocated among our shareholders in accordance with their allocable shares of our items of income, gain, loss, deduction and credit. A shareholder’s allocable share of such items will be determined by our operating
165
Table of Contents
agreement, provided such allocations either have “substantial economic effect” or are determined to be in accordance with the shareholder’s interest in us. If the allocations provided by our agreement were successfully challenged by the IRS, the redetermination of the allocations to a particular shareholder for U.S. federal income tax purposes could be less favorable than the allocations set forth in our operating agreement.
We may derive taxable income from an investment that is not matched by a corresponding distribution of cash. This could occur, for example, if we used cash to make an investment or to reduce debt instead of distributing profits. Some of the investment practices authorized by our operating agreement could be subject to special provisions under the Code that, among other things, may affect the timing and character of the gains or losses recognized by us. These provisions may also require us to accrue original issue discount or be treated as having sold securities for their fair market value, both of which may cause us to recognize income without receiving cash with which to make distributions. To the extent that there is a discrepancy between our recognition of income and our receipt of the related cash payment with respect to such income, income likely will be recognized prior to our receipt and distribution of cash. Accordingly, it is possible that a shareholder’s U.S. federal income tax liability with respect to its allocable share of our earnings in a particular taxable year could exceed the cash distributions to the shareholder for the year, thus giving rise to an out-of-pocket payment by the shareholder.
Section 706 of the Code provides that items of our income and deductions must be allocated between transferors and transferees of our common shares. We will apply certain assumptions and conventions in an attempt to comply with applicable rules and to report income, gain, loss, deduction and credit to shareholders in a manner that reflects such shareholders’ respective beneficial shares of our items. These conventions are designed to more closely align the receipt of cash and the allocation of income between our shareholders, but these assumptions and conventions may not be in compliance with all aspects of applicable tax requirements. We may allocate items of income, gain, loss, deduction, and credit using a monthly or other convention, whereby any such items we recognize in a given month are allocated to our shareholders as of a specified date of such month. As a result, if a shareholder transfers its common shares, it might be allocated income, gain, loss, deduction, and credit realized by us after the date of the transfer. Similarly, if a shareholder acquires additional common shares, it might be allocated income, gain, loss, deduction, and credit realized by us prior to its ownership of such units. Consequently, our shareholders may recognize income in excess of cash distributions received from us, and any income so included by a shareholder would increase the basis such shareholder has in it common shares and would offset any gain (or increase the amount of loss) realized by such shareholder on a subsequent disposition of its common shares.
If our conventions are not allowed by the Treasury regulations (or only apply to transfers of less than all of a shareholder’s shares) or if the IRS otherwise does not accept our conventions, the IRS may contend that our taxable income or losses must be reallocated among our shareholders. If such a contention were sustained, certain shareholders’ tax liabilities would be adjusted to the possible detriment of certain other shareholders. We are authorized to revise our method of allocation between transferors and transferees (as well as among shareholders whose interests otherwise could vary during a taxable period).
Adjusted Tax Basis of Common Shares
A shareholder’s adjusted tax basis in its common shares will equal the amount paid for the common shares and will be increased by the shareholder’s allocable share of (i) items of our income and gain and (ii) our liabilities, if any. A shareholder’s adjusted tax basis will be decreased, but not below zero, by (i) distributions from us, (ii) the shareholder’s allocable share of items of our deductions and losses, and (iii) the shareholder’s allocable share of the reduction in our liabilities, if any.
A shareholder generally is allowed to deduct its allocable share of our losses (if any) only to the extent of such shareholder’s adjusted tax basis in the common shares it is treated as holding at the end of the taxable year in which the losses occur. If the recognition of a shareholder’s allocable share of our losses would reduce its adjusted tax basis for its common share below zero, the recognition of such losses by such shareholder would be
166
Table of Contents
deferred to subsequent taxable years and would be allowed if and when such shareholder had sufficient tax basis so that such losses would not reduce such shareholder’s adjusted tax basis below zero.
Shareholders who purchase common shares in separate transactions must combine the basis of those common shares and maintain a single adjusted tax basis for all of those common shares. Upon a sale or other disposition of less than all of the common shares, a portion of that adjusted tax basis must be allocated to the common shares sold, using an “equitable apportionment” method, which generally means that the adjusted tax basis allocated to the interest sold equals an amount that bears the same relation to the shareholder’s adjusted tax basis in its entire interest in FTAI as the value of the common shares sold bears to the value of the shareholder’s entire interest in FTAI.
Treatment of Distributions
Distributions of cash by us generally will not be taxable to a shareholder to the extent of such shareholder’s adjusted tax basis (described above) in its common shares. Any cash distributions in excess of a shareholder’s adjusted tax basis generally will be treated as gain from the sale or exchange of common shares (as described below). Except as described below, such gain would generally be treated as capital gain and would be long-term capital gain to the extent the shareholder’s holding period for its interest exceeds one year. A reduction in a shareholder’s allocable share of our liabilities, and certain distributions of marketable securities by us, will be treated as cash distributions for U.S. federal income tax purposes. A decrease in a shareholder’s percentage interest in us because of our issuance of additional common shares may decrease such shareholder’s allocable share of our liabilities. A non-pro rata distribution of money or property (including a deemed distribution as a result of a reduction of a shareholder’s share of our liabilities) may cause a shareholder to recognize ordinary income if the distribution reduces the shareholder’s share of our “unrealized receivables,” including depreciation recapture, and/or substantially appreciated “inventory items,” both as defined in Section 751 of the Code and collectively, “Section 751 Assets.”
Disposition of Common Shares
A sale or other taxable disposition of all or a portion of a shareholder’s common shares will result in the recognition of gain or loss in an amount equal to the difference, if any, between the amount realized on the disposition (including the shareholder’s share of our liabilities allocable to such common shares) and the shareholder’s adjusted tax basis in its common shares. A shareholder’s adjusted tax basis will be adjusted for this purpose by its allocable share of our income or loss for the year of such sale or other disposition. Because the amount realized includes a shareholder’s share of our liabilities, and prior distributions in excess of the total net taxable income allocated to such shareholder will have decreased such shareholder’s adjusted tax basis in its shares, the gain, if any, recognized on a sale or other disposition of common shares could result in a tax liability in excess of any cash received from such sale or other disposition.
Except as described below, any gain or loss recognized with respect to such sale or other disposition generally will be treated as capital gain or loss and will be long-term capital gain or loss to the extent the shareholder’s holding period for its interest exceeds one year. A portion of such gain may be treated as ordinary income under the Code to the extent attributable to the shareholder’s allocable share of unrealized gain or loss in Section 751 Assets.
Shareholders who purchase common shares at different times and intend to sell all or a portion of the common shares within a year of their most recent purchase are urged to consult their tax advisors regarding the application of certain “split holding period” rules to them and the treatment of any gain or loss as long-term or short term capital gain or loss. For example, a selling shareholder may use the actual holding period of the portion of its transferred common shares, provided its common shares are divided into identifiable common shares with ascertainable holding periods, the selling shareholder can identify the portion of the common shares transferred, and the selling shareholder elects to use the identification method for all sales or exchanges of our common shares.
Shareholders should review carefully the discussions below under the subheadings titled “Passive Foreign Investment Companies” and “Controlled Foreign Corporations.”
167
Table of Contents
Limitation on Deductibility of Capital Losses
Any capital losses generated by us will be deductible by individuals or other non-corporate shareholders only to the extent of such shareholders’ capital gains for the taxable year plus up to $3,000 of ordinary income ($1,500 in the case of a married individual filing a separate return). Excess capital losses may be carried forward by individuals and other non-corporate shareholders indefinitely. Any capital losses generated by us will be deductible by corporate shareholders to the extent of such shareholders’ capital gains for the taxable year. Corporations may carry capital losses back three years and forward five years. Shareholders should consult their tax advisors regarding the deductibility of capital losses.
Limitation on Deductibility of Our Losses
A shareholder will be restricted from taking into account for U.S. federal income tax purposes its allocable share of any loss incurred by us in excess of the adjusted tax basis of such shareholder’s common shares. In addition, the Code restricts individuals, certain non-corporate taxpayers and certain closely held corporations from taking into account for U.S. federal income tax purposes any of our net losses in excess of the amounts for which such shareholder is “at risk” with respect to its interest as of the end of our taxable year in which such loss occurred. The amount for which a shareholder is “at risk” with respect to its common shares is equal to its adjusted tax basis for such common shares, less any amounts borrowed (i) in connection with its acquisition of such common shares for which it is not personally liable and for which it has pledged no property other than its common shares; (ii) from persons who have a proprietary interest in us and from certain persons related to such persons; or (iii) for which the shareholder is protected against loss through nonrecourse financing, guarantees or similar arrangements. A shareholder subject to the at risk limitation must recapture losses deducted in previous years to the extent that distributions (including distributions deemed to result from a reduction in a shareholder’s share of our liabilities) cause such shareholder’s at risk amount to be less than zero at the end of any taxable year.
Losses disallowed or recaptured as a result of these limitations will carry forward and will be allowable to the extent that a shareholder’s adjusted tax basis or at risk amount, whichever is the limiting factor, subsequently increases. Upon the taxable disposition of our common shares, any gain recognized by a shareholder can be offset by losses that were previously suspended by the at risk limitation, but may not be offset by losses suspended by the basis limitation. Any excess loss above the gain previously suspended by the at risk or basis limitations may no longer be used.
In addition to the basis and at risk limitations, a passive activity loss limitation generally limits the deductibility of losses incurred by individuals, estates, trusts, some closely-held corporations and personal service corporations from “passive activities” (generally, trade or business activities in which the taxpayer does not materially participate). The passive loss limitations are applied separately with respect to each publicly traded partnership. Consequently, any passive losses we generate will be available to offset only passive income generated by us. Passive losses that exceed a shareholder’s share of passive income we generate may be deducted in full when the shareholder disposes of all of its common shares in a fully taxable transaction with an unrelated party. The passive loss rules generally are applied after other applicable limitations on deductions, including the at risk and basis limitations.
Limitation on Interest Deductions
The deductibility of an individual or other non-corporate shareholder’s “investment interest expense” is limited to the amount of that shareholder’s “net investment income.” Investment interest expense generally includes the shareholder’s allocable share of investment interest expense incurred by us, if any, and investment interest expense incurred by the shareholder on any loan incurred to purchase or carry common shares. A shareholder’s share of our net passive income will not be treated as investment income for this purpose. Net investment income includes gross income from property held for investment and amounts treated as portfolio income, such as dividends and interest, under the passive activity loss rules, less deductible expenses, other than interest, directly connected with the production of investment income. For this purpose, any long-term capital
168
Table of Contents
gain or qualifying dividend income that is taxable at long-term capital gains rates is excluded from net investment income, unless the shareholder elects to pay tax on such gain or dividend income at ordinary income rates.
Limitation on Deduction of Certain Other Expenses
For individuals, estates and trusts, certain miscellaneous itemized deductions are deductible only to the extent that they exceed 2% of the adjusted gross income of the taxpayer. We may have a significant amount of expenses that will be treated as miscellaneous itemized deductions. Moreover, an individual whose adjusted gross income exceeds specified threshold amounts is required to further reduce the amount of allowable itemized deductions.
In general, neither we nor any shareholder may deduct organizational or syndication expenses. While an election may be made by a partnership to amortize organizational expenses over a 15-year period, we will not make such an election. Syndication fees (i.e., expenditures made in connection with the marketing and issuance of the common shares) must be capitalized and cannot be amortized or otherwise deducted.
Shareholders are urged to consult their tax advisors regarding the deductibility of itemized expenses incurred by us.
Foreign Tax Credit Limitation
Shareholders may be entitled to a foreign tax credit for U.S. federal income tax purposes with respect to their allocable shares of creditable foreign taxes paid on our income and gains, although no foreign tax credits will be available to non-corporate shareholders in respect of any foreign taxes paid by any of our corporate subsidiaries. Complex rules may, depending on a shareholder’s particular circumstances, limit the availability or use of foreign tax credits. Gains from the sale of our investments may be treated as U.S. source gains. Consequently, a shareholder may not be able to use the foreign tax credit arising from any foreign taxes imposed on such gains unless such credit can be applied (subject to applicable limitations) against tax due on other income treated as derived from foreign sources. Certain losses that we incur may be treated as foreign source losses, which could reduce the amount of foreign tax credits otherwise available.
Foreign Currency Gain or Loss
Our functional currency will be the U.S. dollar, and our income or loss will be calculated in U.S. dollars. It is likely that we will recognize “foreign currency” gain or loss with respect to transactions involving non-U.S. dollar currencies. In general, foreign currency gain or loss is treated as ordinary income or loss for U.S. federal income tax purposes. Shareholders should consult their tax advisors with respect to the tax treatment of foreign currency gain or loss.
Tax-Exempt Shareholders
A shareholder that is a tax-exempt entity for U.S. federal income tax purposes and, therefore, exempt from U.S. federal income taxation, may nevertheless be subject to “unrelated business income tax” to the extent, if any, that its allocable share of our income consists of UBTI. A tax-exempt partner of a partnership that regularly engages in a trade or business which is unrelated to the exempt function of the tax-exempt partner must include in computing its UBTI, its pro rata share (whether or not distributed) of such partnership’s gross income derived from such unrelated trade or business. Moreover, a tax-exempt partner of a partnership could be treated as earning UBTI to the extent that such partnership derives income from “debt-financed property,” or if the partnership interest itself is debt financed. Debt-financed property means property held to produce income with respect to which there is “acquisition indebtedness” (i.e., indebtedness incurred in acquiring or holding property).
We are not required to manage our operations in a manner that would minimize the likelihood of generating income that would constitute UBTI to the extent allocated to a tax-exempt shareholder. Although we expect to invest through subsidiaries that are treated as corporations for U.S. federal income tax purposes and such
169
Table of Contents
corporate investments would generally not result in an allocation of UBTI to a shareholder on account of the activities of those subsidiaries, we may not invest through corporate subsidiaries in all cases. Moreover, UBTI includes income attributable to debt-financed property and we are not prohibited from debt financing our investments, including investments in subsidiaries. Furthermore, we are not prohibited from being (or causing a subsidiary to be) a guarantor of loans made to a subsidiary. If we (or certain of our subsidiaries) were treated as the borrower for U.S. tax purposes on account of those guarantees, some or all of our investments could be considered debt-financed property. The potential for income to be characterized as UBTI could make our common shares an unsuitable investment for a tax-exempt entity. Tax-exempt shareholders are urged to consult their tax advisors regarding the tax consequences of an investment in common shares.
Controlled Foreign Corporations
A non-U.S. entity generally will be treated as a CFC if it is treated as a corporation for U.S. federal income tax purposes and if more than 50% of (i) the total combined voting power of all classes of stock of the non-U.S. entity entitled to vote or (ii) the total value of the stock of the non-U.S. entity is owned (actually or constructively) by U.S. Shareholders on any day during the taxable year of such non-U.S. entity. For purposes of this discussion, a “U.S. Shareholder” with respect to a non-U.S. entity means a U.S. person that owns (actually or constructively) 10% or more of the total combined voting power of all classes of stock of the non-U.S. entity entitled to vote.
Holdco will be treated as a U.S. person for these purposes. If Holdco is a U.S. Shareholder in a non-U.S. entity that is treated as a CFC, each U.S. Holder of our common shares (without regard to its percentage ownership) generally will be required to include in income on a current basis its allocable share of the CFC’s “Subpart F” income reported by Holdco and allocated to us. Subpart F income includes dividends, interest, net gain from the sale or disposition of securities, non-actively managed rents and certain other passive types of income. The aggregate Subpart F income inclusions in any taxable year relating to a particular CFC are limited to such entity’s current earnings and profits. These inclusions are treated as ordinary income (whether or not such inclusions are attributable to net capital gains). Thus, a shareholder may be required to report as ordinary income its allocable share of the CFC’s Subpart F income reported by Holdco and allocated to us without corresponding receipts of cash.
The tax basis of Holdco’s shares of such CFC, and a shareholder’s tax basis in its common shares, will be increased to reflect any required Subpart F income inclusions. Such income will be treated as income from sources within the United States for foreign tax credit purposes to the extent derived by the CFC from U.S. sources. Such income will not be eligible for the favorable 15% tax rate generally applicable to “qualified dividend income” for individual and other non-corporate U.S. persons. Amounts included as such income with respect to direct and indirect investments will not be taxable again when actually distributed.
Regardless of whether any CFC has Subpart F income, any gain allocated to a shareholder from the disposition of stock in a CFC will be treated as ordinary income to the extent of the shareholder’s allocable share of the current and/or accumulated earnings and profits of the CFC. In this regard, earnings would not include any amounts previously taxed pursuant to the CFC rules. Net losses (if any) of a CFC will not pass through to our shareholders.
Passive Foreign Investment Companies
Although we anticipate that any non-U.S. corporation in which we invest as the majority shareholder will be a CFC as described above, it is possible that we may make an investment in a non-U.S. corporation that is not a CFC but is instead classified as a PFIC for U.S. federal income tax purposes. A non-U.S. entity that is not treated as a CFC with respect to a shareholder will be treated as a PFIC for U.S. federal income tax purposes if (i) such entity is treated as a corporation for U.S. federal income tax purposes and (ii) either 75% or more of the gross income of such entity for the taxable year is “passive income” (as defined in Section 1297 of the Code and the
170
Table of Contents
Treasury regulations promulgated thereunder) or the average percentage of assets held by such entity during the taxable year which produce passive income or which are held for the production of passive income is at least 50%. A U.S. Holder will be subject to the PFIC rules for an investment in a PFIC (including indirectly, through its ownership of common shares) without regard to its percentage ownership. If you hold an interest in a non-U.S. corporation for any taxable year during which the corporation is classified as a PFIC with respect to you, then the corporation will continue to be classified as a PFIC with respect to you for any subsequent taxable year during which you continue to hold an interest in the corporation, even if the corporation’s income or assets would not cause it to be a PFIC in such subsequent taxable year, unless an exception applies.
Except as described below, we will make, where possible, an election (a “QEF Election”) with respect to each entity treated as a PFIC to treat such non-U.S. entity as a qualified electing fund (“QEF”) in the first year we hold shares in such entity. A QEF Election is effective for our taxable year for which the election is made and all subsequent taxable years and may not be revoked without the consent of the IRS.
As a result of a QEF Election with respect to a non-U.S. entity that is a PFIC, we will be required to include in our gross income each year our pro rata share of such non-U.S. entity’s ordinary earnings and net capital gains (such inclusions in gross income, “QEF Inclusions”), for each year in which the non-U.S. entity owned directly or indirectly by us is a PFIC, whether or not we receive cash in respect of its income. Thus, U.S. Holders may be required to report taxable income as a result of QEF Inclusions without corresponding receipts of cash. A shareholder may, however, elect to defer, until the occurrence of certain events, payment of the U.S. federal income tax attributable to QEF Inclusions for which no current distributions are received, but will be required to pay interest on the deferred tax computed by using the statutory rate of interest applicable to an extension of time for payment of tax. Net losses (if any) of a PFIC will not, however, pass through to us or to U.S. Holders and may not be carried back or forward in computing such PFIC’s ordinary earnings and net capital gain in other taxable years. Consequently, U.S. Holders may, over time, be taxed on amounts that, as an economic matter, exceed our net profits. Our tax basis in the shares of such non-U.S. entities, and a U.S. Holder’s basis in our common shares, will be increased to reflect QEF Inclusions. No portion of the QEF Inclusion attributable to ordinary income will be eligible for the favorable tax rate generally applicable to “qualified dividend income” for individual and other non-corporate U.S. Holders. Amounts included as QEF Inclusions with respect to direct and indirect investments generally will not be taxed again when actually distributed.
In certain cases, we may be unable to make a QEF Election with respect to a PFIC. This could occur if we are unable to obtain the information necessary to make a QEF Election because, for example, such entity is not an affiliate of ours or because such entity itself invests in underlying investment vehicles over which we have no control. If we do not make a QEF Election with respect to a PFIC, Section 1291 of the Code will treat any gain on a disposition by us of shares of such entity, any gain on the disposition of the common shares by a U.S. Holder at a time when we own shares of such entity, and certain other defined “excess distributions,” as if such gain or excess distribution were ordinary income earned ratably over the shorter of the period during which the shareholder held its common shares or the period during which we held our shares in such entity. For gain and excess distributions allocated to prior years, (i) the tax rate will be the highest in effect for that taxable year and (ii) the tax will be payable generally without regard to offsets from deductions, losses and expenses. U.S. Holders will also be subject to an interest charge for any deferred tax. No portion of this ordinary income will be eligible for the favorable tax rate generally applicable to “qualified dividend income” for individual and other non-corporate U.S. Holders.
If a non-U.S. entity held by Holdco is classified as both a CFC and a PFIC during the time Holdco is a U.S. Shareholder of such non-U.S. entity, a U.S. Holder will be required to include amounts in income with respect to such non-U.S. entity as described above under the subheading “—Controlled Foreign Corporations,” and the consequences described under this subheading will not apply. If Holdco’s ownership percentage in a non-U.S. entity changes such that it is not a U.S. Shareholder with respect to such non-U.S. entity, then a U.S. Holder may be subject to the PFIC rules. The interaction of these rules is complex, and shareholders are urged to consult their tax advisors in this regard.
171
Table of Contents
Consequences to Non-U.S. Holders
As a partnership for U.S. federal income tax purposes, we are not a taxable entity and we incur no U.S. federal income tax liability. Instead, each shareholder, in computing its own U.S. federal income tax liability for any taxable year, will be required to take into account its allocable share of items of our income, gain, loss, deduction and credit for each of our taxable years ending with or within such shareholder’s taxable year, regardless whether the shareholder has received any distributions. The characterization of an item of our income, gain, loss, deduction or credit generally will be determined at our (rather than at the shareholder’s) level.
Special rules apply to Non-U.S. Holders. In light of our intended investment activities, we may be or may become engaged in a U.S. trade or business for U.S. federal income tax purposes, in which case some portion of our income would be treated as effectively connected income with respect to Non-U.S. Holders. If a Non-U.S. Holder were treated as being engaged in a U.S. trade or business in any year because of an investment in our common shares in such year, such Non-U.S. Holder generally would be (i) subject to withholding by us or the applicable withholding agent on its distributive share of our income effectively connected with such U.S. trade or business, (ii) required to file a U.S. federal income tax return for such year reporting its allocable share, if any, of income or loss effectively connected with such trade or business and (iii) required to pay U.S. federal income tax at regular U.S. federal income tax rates on any such income. Moreover, a corporate Non-U.S. Holder might be subject to a U.S. branch profits tax on its allocable share of any effectively connected earnings and profits. Any amount so withheld would be creditable against such Non-U.S. Holder’s U.S. federal income tax liability, and such Non-U.S. Holder could claim a refund to the extent that the amount withheld exceeded such Non-U.S. Holder’s U.S. federal income tax liability for the taxable year. Finally, if we were treated as being engaged in a U.S. trade or business, a portion of any gain recognized by a Non-U.S. Holder on the sale or exchange of its common shares could be treated for U.S. federal income tax purposes as effectively connected income, and hence such Non-U.S. Holder could be subject to U.S. federal income tax on the sale or exchange.
Generally, under the Foreign Investment in Real Property Tax Act of 1980 (“FIRPTA”) provisions of the Code, Non-U.S. Holders are subject to U.S. tax in the same manner as U.S. Holders on any gain recognized on the disposition of an interest, other than an interest solely as a creditor, in U.S. real property. An interest in U.S. real property includes stock in a U.S. corporation (except for certain stock of publicly-traded U.S. corporations) if, at any time during the shorter of (i) the applicable Non-U.S. Holder’s holding period or (ii) the five year period preceding the applicable disposition (the “applicable period”), interests in U.S. real property constitute 50% or more by value of the sum of the corporation’s assets used in a trade or business, its U.S. real property interests and its interests in real property located outside the United States (a “USRPHC”). Consequently, a Non-U.S. Holder who invests directly in U.S. real property, or indirectly by owning the stock of a USRPHC, will be subject to tax under FIRPTA on the disposition of such investment (and a corporate Non-U.S. Holder might be subject to a U.S. 30% branch profits tax on any associated earnings and profits). The FIRPTA tax will also apply if the non-U.S. person is a holder of an interest in a partnership that owns an interest in U.S. real property or an interest in a USRPHC. We have made and expect, from time to time, to make certain investments that could constitute investments in U.S. real property or USRPHCs. Each Non-U.S. Holder will be subject to U.S. federal income tax under FIRPTA on such shareholder’s allocable share of any gain realized on the disposition of a FIRPTA interest and will be subject to the filing requirements discussed above. However, the U.S. branch profits tax described above will generally not apply in the case of the sale of USRPHCs.
In addition, a Non-U.S. Holder who disposes of our common shares and who owns more than 5% of our common shares (or owned more than 5% of our common shares at any time during the applicable period) may be subject to FIRPTA upon such disposition. For purposes of determining whether a Non-U.S. Holder owns more than 5% of our common shares, special attribution rules apply. Where a Non-U.S. Holder who owns (or is deemed to own) or owned (or was deemed to have owned) during the applicable period, more than 5% of our common shares disposes of common shares at a time when we are a USRPHC (determined as described above, as if we were a U.S. corporation) or have at any time been a USRPHC within the applicable period, any gain generally will be subject to U.S. federal income tax at 20% (for individuals) or 35% (for corporations), and such Non-U.S. Holder will have a U.S. tax return filing obligation. While we do not believe that we currently are, or
172
Table of Contents
have been, a USRPHC, we are not under any obligation to avoid becoming a USRPHC or to notify shareholders in the event that we determine we have become a USRPHC. If any Non-U.S. Holder owns or anticipates owning more than 5% of our common shares, such shareholder should consult its tax advisor.
A Non-U.S. Holder generally is subject to withholding by us or the applicable withholding agent of U.S. tax at a 30% rate on such Non-U.S. Holder’s distributive share of the gross amount of interest, dividends and other fixed or determinable annual or periodical income (“FDAP Income”) received by us from sources within the United States if such income is not treated as effectively connected with a U.S. trade or business. The 30% rate may be reduced or eliminated under the provisions of an applicable income tax treaty between the United States and the country in which the Non-U.S. Holder resides or is organized. Whether a Non-U.S. Holder is eligible for such treaty benefits will depend upon the provisions of the applicable treaty as well as the treatment of us under the laws of the Non-U.S. Holder’s jurisdiction. The 30% withholding tax rate does not apply to certain portfolio interest on obligations of U.S. persons allocable to certain Non-U.S. Holders. Moreover, Non-U.S. Holders generally are not subject to U.S. federal income tax on capital gains if: (i) such gains are not effectively connected with the conduct of a U.S. trade or business of such Non-U.S. Holder; or (ii) a tax treaty between the United States and the country in which the Non-U.S. Holder resides or is organized is applicable and such gains are not attributable to a permanent establishment in the United States maintained by such Non-U.S. Holder. Notwithstanding the prior sentence, capital gains earned by a Non-U.S. Holder may be subject to U.S. federal income tax at a flat rate of 30% if such Non-U.S. Holder is an individual and is present in the United States for 183 or more days during the taxable year in which such capital gains are recognized and certain other requirements are met. Non-U.S. Holders that are corporations may also be subject to a 30% branch profits tax on such effectively connected earnings and profits. The 30% rate applicable to branch profits may be reduced or eliminated under the provisions of an applicable income tax treaty between the United States and the country in which the Non-U.S. Holder resides or is organized.
Notwithstanding the foregoing, and although each Non-U.S. Holder is required to provide us with an applicable Form W-8, we nevertheless may be unable to accurately or timely determine the tax status of our shareholders for purposes of establishing whether reduced rates of withholding apply to some or all of our shareholders. In such a case, a Non-U.S. Holder’s allocable share of distributions of U.S.-source dividend, interest, and other FDAP Income will be subject to U.S. withholding tax at a rate of 30%. Furthermore, if a Non-U.S. Holder would not be subject to U.S. tax based on its tax status or otherwise were eligible for a reduced rate of U.S. withholding, such Non-U.S. Holder might need to take additional steps to receive a credit or refund of any excess withholding tax paid on its account, which could include the filing of a non-resident U.S. income tax return with the IRS. Among other limitations applicable to claiming treaty benefits, if a Non-U.S. Holder resides in a treaty jurisdiction which does not treat us as a passthrough entity, such Non-U.S. Holder might not be eligible to receive a refund or credit of excess U.S. withholding taxes paid on its account.
In general, different rules from those described above apply in the case of Non-U.S. Holders subject to special treatment under U.S. federal income tax law, including a Non-U.S. Holder: (i) who has an office or fixed place of business in the United States or is otherwise carrying on a U.S. trade or business; (ii) who is an individual present in the United States for 183 or more days and certain other conditions are satisfied; or (iii) who is a former citizen or resident of the United States.
Non-U.S. Holders are urged to consult their tax advisors with regard to the U.S. federal income and other tax consequences to them of acquiring, holding and disposing of common shares, as well as the effects of state, local and non-U.S. tax laws, as well as eligibility for any reduced withholding benefits.
173
Table of Contents
Administrative Matters
Tax Matters Partner
We expect that prior to the Distribution, the Onshore Partnership, and after the Distribution, the General Partner, will act as our “tax matters partner.” Our board of directors will have the authority, subject to certain restrictions, to appoint another shareholder to act on our behalf in connection with an administrative or judicial review of our items of income, gain, loss, deduction or credit.
Section 754 Election
Under Section 754 of the Code, we may elect to have the adjusted tax basis of our assets adjusted in the event of a distribution of property to a shareholder or a transfer of a common share by sale or exchange, or as a result of the death of a shareholder. Pursuant to the terms of our operating agreement, the board of directors, in its sole discretion, is authorized to direct us to make such an election. Such an election, if made, can be revoked only with the consent of the IRS. We have not yet determined whether we will make the election permitted by Section 754 of the Code.
Without a Section 754 election, there will be no adjustment for the transferee of common shares even if the purchase price of those common shares is higher than the common shares’ share of the aggregate adjusted tax basis of our assets immediately prior to the transfer. In that case, on a sale by us of an asset, gain allocable to the transferee would include built-in gain allocable to the transferee at the time of the transfer. Moreover, if common shares were transferred at a time when we had a “substantial built-in loss” inherent in our assets, we would be obligated to reduce the tax basis in that portion of such assets attributable to such shares. Each U.S. Holder should consult its own tax advisor as to the effects of a Section 754 election.
Technical Termination
Subject to the electing large partnership rules described below, we will be considered to have been terminated as a partnership for U.S. federal income tax purposes if there is a sale or exchange of 50% or more of the total common shares within a 12-month period. Our termination would result in the closing of our taxable year for all shareholders for U.S. federal income tax purposes. In the case of a shareholder reporting on a taxable year different from our taxable year, the closing of our taxable year may result in more than 12 months of our taxable income or loss being includable in the shareholder’s taxable income for the year of termination. We would be required to make new tax elections after a termination, and we may be required to file two tax returns for one fiscal year. A termination could also result in penalties if we were unable to determine that the termination had occurred. Moreover, a termination might either accelerate the application of, or subject us to, any tax legislation enacted before the termination. A technical termination could also result in a deferral of depreciation and amortizations deductions allowable in computing taxable income.
Pursuant to an IRS relief procedure, if a technically terminated publicly traded partnership requests relief under such procedure and the IRS grants such relief, then, among other things, the partnership need only provide one Schedule K-1 to its partners for the year, notwithstanding the two short taxable years for the partnership.
Information Returns
We have agreed to use reasonable efforts to furnish to shareholders tax information (including Schedule K-1) as promptly as possible, which describes their allocable share of our income, gain, loss, deduction, and credit for our preceding taxable year. Delivery of this information by us will be subject to delay in the event of, among other reasons, the late receipt of any necessary tax information from an investment in which we hold an interest. It is therefore possible that, in any taxable year, our shareholders will need to apply for extensions of time to file their tax returns. There can be no assurance for Non-U.S. Holders that this information will meet such shareholders’ jurisdictions’ compliance requirements.
174
Table of Contents
It is possible that we may engage in transactions that subject FTAI and, potentially, our shareholders to other information reporting requirements with respect to an investment in us. Shareholders may be subject to substantial penalties if they fail to comply with such information reporting requirements. Shareholders should consult with their own tax advisors regarding such information reporting requirements.
Nominee Reporting
Persons who hold our common shares as nominees for another person are required to furnish to us (i) the name, address and taxpayer identification number of the beneficial owner and the nominee; (ii) a statement regarding whether the beneficial owner is (1) a person that is not a U.S. person, (2) a foreign government, an international organization or any wholly-owned agency or instrumentality of either of the foregoing, or (3) a tax exempt entity; (iii) the amount and description of common shares held, acquired or transferred for the beneficial owner; and (iv) specific information including the dates of acquisitions and transfers, means of acquisitions and transfers, and acquisition costs for purchases, as well as the amount of net proceeds from sales.
Brokers and financial institutions are required to furnish additional information, including whether they are U.S. persons and specific information on common shares they acquire, hold or transfer for their own account. A penalty of $50 per failure, up to a maximum of $100,000 per calendar year, is imposed by the Code for failure to report that information to us. The nominee is required to supply the beneficial owner of the common shares with the information furnished to us.
Audits
We may be audited by the IRS. Adjustments resulting from an IRS audit may require a shareholder to adjust a prior year’s tax liability, and possibly may result in an audit of such shareholder’s tax returns. Any audit of shareholders’ tax returns could result in adjustments not related to our tax returns as well as those related to our tax returns.
Accounting Method and Taxable Year
We currently use the accrual method of accounting and the calendar year as our taxable year for U.S. federal income tax purposes. Each shareholder will be required to include in income its share of our income, gain, loss and deduction for each taxable year ending within or with its taxable year. In addition, a shareholder who has a taxable year ending on a date other than December 31 and who disposes of all of its common shares following the close of our taxable year but before the close of its taxable year must include its share of income, gain, loss and deduction in income for the taxable year of disposition, with the result that it will be required to include in income for its taxable year its share of more than one year of our income, gain, loss and deduction.
A partnership is required to have a taxable year that is the same as for any partner, or group of partners, that owns a majority interest (more than 50%) in the partnership, and is required to change its taxable year each time a group of partners with a different taxable year acquires a majority interest, unless the partnership has been forced to change its taxable year during the preceding two-year period.
Elective Procedures for Large Partnerships
The Code allows large partnerships to elect streamlined procedures for income tax reporting. This election, if made, would reduce the number of items that must be separately stated on the Schedules K-1 that are issued to shareholders, and such Schedules K-1 would have to be provided on or before the first March 15 following the close of each taxable year. In addition, this election would prevent us from suffering a “technical termination” (which would close our taxable year) if, within a 12-month period, there is a sale or exchange of 50% or more of our total interests. If an election is made, IRS audit adjustments will flow through to the shareholders for the year in which the adjustments take effect, rather than the shareholders in the year to which the adjustment relates. In
175
Table of Contents
addition, we, rather than the shareholders, generally will be liable for any interest and penalties that result from an audit adjustment. Despite the foregoing benefits, there are also costs and administrative burdens associated with such an election. Consequently, as of this time, FTAI has not elected to be subject to the reporting procedures applicable to large partnerships.
Backup Withholding
For each calendar year, we will report to shareholders and to the IRS the amount of distributions that we pay, and the amount of tax (if any) that we withhold on these distributions. Under the backup withholding rules, a shareholder may be subject to backup withholding tax with respect to distributions paid unless (i) such shareholder is a corporation or falls within another exempt category and demonstrates this fact when required or (ii) such shareholder provides a taxpayer identification number, certifies as to no loss of exemption from backup withholding tax and otherwise complies with the applicable requirements of the backup withholding tax rules. An exempt shareholder should indicate its exempt status on a properly completed IRS Form W-8BEN or W-9, as applicable. Backup withholding is not an additional tax; the amount of any backup withholding from a payment to a shareholder will be allowed as a credit against such shareholder’s U.S. federal income tax liability and may entitle such shareholder to a refund from the IRS, provided such shareholder supplies the required information to the IRS in a timely manner.
If shareholders do not timely provide us (or your broker, the clearing agent, or other intermediary, as appropriate) with an IRS Form W-8 or W-9, as applicable, or such form is not properly completed, such shareholders may become subject to U.S. backup withholding taxes in excess of what would have been imposed had we received certification from all shareholders. In certain circumstances, payments we make may be subject to excess U.S. backup withholding taxes, which will be treated by us as an expense that will be borne by all shareholders on a pro rata basis (where we are or may be unable to cost efficiently allocate any such excess withholding tax cost specifically to the shareholders that failed to timely provide the proper U.S. tax certifications).
Additional Withholding Requirements
The relevant withholding agent may be required to withhold 30% of any interest, dividends, and other FDAP Income from sources within the United States or, after December 31, 2016, of gross proceeds from the sale of any property of a type which can produce FDAP Income within the United States (including our Common Shares), to: (i) a foreign financial institution (as the beneficial owner or, in some cases, as an intermediary for the beneficial owner) unless such foreign financial institution agrees to verify, report and disclose its U.S. accountholders and meets certain other specified requirements; or (ii) a non-financial foreign entity (as the beneficial owner or, in some cases, as an intermediary for the beneficial owner) unless such entity certifies that it does not have any substantial U.S. owners or provides the name, address and taxpayer identification number of each substantial U.S. owner and such entity meets certain other specified requirements. An intergovernmental agreement between the United States and an applicable foreign country may modify the foregoing requirements. Shareholders are encouraged to consult their own tax advisors regarding the possible implications of this legislation on their investment in our common shares.
Uniformity of Common Shares
Because we cannot match transferors and transferees of common shares and for other reasons, we must maintain uniformity of the economic and tax characteristics of the common shares to a purchaser of these common shares. As a result, we may be unable to completely comply with a number of U.S. federal income tax requirements. Any non-uniformity could have a negative impact on the value of the common shares.
Our operating agreement permits us to take positions in filing our U.S. federal income tax returns that preserve the uniformity of our common shares.
176
Table of Contents
A shareholder’s adjusted tax basis in common shares is reduced by its share of our deductions (whether or not such deductions were claimed on a shareholder’s income tax return) so that any position that we take that understates deductions will overstate the shareholder’s adjusted tax basis in its common shares, and may cause the shareholder to understate gain or overstate loss on any sale of such common shares. The IRS may challenge one or more of any positions we take to preserve the uniformity of common shares. If such a challenge were sustained, the uniformity of common shares may be affected, and under some circumstances, the gain from a sale of common shares may be increased without the benefit of additional deductions.
Tax Shelter Regulations
If we were to engage in a “reportable transaction,” we (and possibly shareholders and others) would be required to make a detailed disclosure of the transaction to the IRS in accordance with Treasury regulations governing tax shelters and other potentially tax-motivated transactions. A transaction may be a reportable transaction based upon any of several factors, including the fact that it is a type of tax avoidance transaction publicly identified by the IRS as a “listed transaction” or that it produces certain kinds of losses in excess of $2 million. An investment in us may be considered a “reportable transaction” if, for example, we recognize certain significant losses in the future. In certain circumstances, a shareholder who disposes of an interest in a transaction resulting in the recognition by such shareholder of significant losses in excess of certain threshold amounts may be obligated to disclose its participation in such transaction. Our participation in a reportable transaction also could increase the likelihood that our U.S. federal income tax information return (and possibly a shareholder’s tax return) would be audited by the IRS. Certain of these rules are currently unclear and it is possible that they may be applicable in situations other than significant loss transactions.
Moreover, if we were to participate in a reportable transaction with a significant purpose to avoid or evade tax, or in any listed transaction, shareholders may be subject to (i) significant accuracy-related penalties with a broad scope, (ii) for those persons otherwise entitled to deduct interest on federal tax deficiencies, nondeductibility of interest on any resulting tax liability, and (iii) in the case of a listed transaction, an extended statute of limitations.
Shareholders should consult their own tax advisors concerning any possible disclosure obligation under the Treasury regulations governing tax shelters with respect to the ownership dispositions of their interests in us.
New Legislation or Administrative or Judicial Action
The rules dealing with U.S. federal income taxation are constantly under review by persons involved in the legislative process, the IRS and the U.S. Treasury Department, frequently resulting in revised interpretations of established concepts, statutory changes, revisions to regulations and other modifications and interpretations. No assurance can be given as to whether, or in what form, any proposals affecting us or our shareholders will be enacted. The IRS pays close attention to the proper application of tax laws to partnerships. The present U.S. federal income tax treatment of an investment in common shares may be modified by administrative, legislative or judicial interpretation at any time, and any such action may affect investments and commitments previously made. Changes to the U.S. federal income tax laws and interpretations thereof could, for example, make it more difficult or impossible to meet the Qualifying Income Exception for us to be treated as a partnership that is not taxable as a corporation for U.S. federal income tax purposes.
Our organizational documents and agreements permit the board of directors to modify the operating agreement from time to time, without the consent of the shareholders, in order to address certain changes (or expected future changes) in U.S. federal income tax laws, Treasury regulations, or interpretation. In some circumstances, such revisions could have a material adverse impact on some or all of our shareholders.
177
Table of Contents
THE FOREGOING DISCUSSION IS NOT INTENDED AS A SUBSTITUTE FOR CAREFUL TAX PLANNING. THE TAX MATTERS RELATING TO FTAI AND HOLDERS OF COMMON SHARES ARE COMPLEX AND ARE SUBJECT TO VARYING INTERPRETATIONS. MOREOVER, THE EFFECT OF EXISTING INCOME TAX LAWS, THE MEANING AND IMPACT OF WHICH IS UNCERTAIN AND OF PROPOSED CHANGES IN INCOME TAX LAWS WILL VARY WITH THE PARTICULAR CIRCUMSTANCES OF EACH SHAREHOLDER AND, IN REVIEWING THIS PROSPECTUS, THESE MATTERS SHOULD BE CONSIDERED. IF YOU ARE CONSIDERING THE PURCHASE OF OUR COMMON SHARES, YOU SHOULD CONSULT YOUR OWN TAX ADVISORS WITH RESPECT TO THE U.S. FEDERAL, STATE, LOCAL AND NON-U.S. TAX CONSEQUENCES OF ANY INVESTMENT IN OUR COMMON SHARES.
178
Table of Contents
We and the underwriters named below have entered into an underwriting agreement with respect to the shares being offered. Subject to certain conditions, each underwriter has severally agreed to purchase the number of shares indicated in the following table. Citigroup Global Markets Inc., Merrill Lynch, Pierce Fenner & Smith Incorporated and Barclays Capital Inc. are the representatives of the underwriters listed below.
| Underwriters |
Number of Shares | |||
| Citigroup Global Markets Inc. |
||||
| Merrill Lynch, Pierce, Fenner & Smith Incorporated |
||||
| Barclays Capital Inc. |
||||
| Deutsche Bank Securities Inc. |
||||
| UBS Securities LLC |
||||
| JMP Securities LLC |
||||
| Raymond James & Associates, Inc. |
||||
| Stephens Inc. |
||||
| WR Securities, LLC |
||||
|
|
|
|||
| Total |
20,000,000 | |||
|
|
|
|||
The underwriting agreement provides that the obligations of the several underwriters to purchase our common shares offered hereby are subject to certain conditions precedent and that the underwriters will purchase all of our common shares offered by this prospectus, other than those covered by the option to purchase additional shares described below, if any of these shares are purchased. The underwriting agreement also provides that if an underwriter defaults, the purchase commitments of non-defaulting underwriters may also be increased or this offering may be terminated.
The underwriters have an option to buy up to an additional 3,000,000 shares from us to cover sales by the underwriters of a greater number of shares than the total number set forth in the table above. They may exercise that option for 30 days. If any shares are purchased pursuant to this option, the underwriters will severally purchase shares in approximately the same proportion as set forth in the table above.
The following tables show the per share and total underwriting discounts and commissions to be paid to the underwriters by us. Such amounts are shown assuming both no exercise and full exercise of the underwriters’ option to purchase 3,000,000 additional shares.
| No Exercise | Full Exercise | |||||||
| Per Share |
$ | $ | ||||||
| Total |
$ | $ | ||||||
Shares sold by the underwriters to the public will initially be offered at the initial public offering price set forth on the cover of this prospectus. Any shares sold by the underwriters to securities dealers may be sold at a discount of up to $ per share from the initial public offering price. After the initial offering of the shares, the representatives may change the offering price and the other selling terms. The offering of the shares by the underwriters is subject to receipt and acceptance and subject to the underwriters’ right to reject any order in whole or in part.
Our executive officers, directors, Initial Shareholders and the General Partner have agreed with the underwriters, subject to certain exceptions, not to dispose of or hedge any of their common shares or securities convertible into or exchangeable for common shares during the period from the date of this prospectus
179
Table of Contents
continuing through the date 180 days after the date of this prospectus, except with the prior written consent of the representatives of the underwriters. This agreement does not apply to any existing employee benefit plans. See “Shares Eligible for Future Sale” for further discussion of the lock-up agreements and a discussion of certain transfer restrictions.
At our request, the underwriters have reserved up to 5% of the shares for sale at the initial public offering price to persons who are directors, officers, or who are otherwise associated with us, through a directed share program. The number of shares available for sale to the general public will be reduced by the number of directed shares purchased by participants in the program. Any directed shares not purchased will be offered by the underwriters to the general public on the same basis as all other shares offered. We have agreed to indemnify the underwriters against certain liabilities and expenses, including liabilities under the Securities Act, in connection with the sales of the directed shares.
Prior to the offering, there has been no public market for the shares. The initial public offering price has been negotiated among us, the Manager, the General Partner and the representatives. Among the factors to be considered in determining the initial public offering price of the shares, in addition to prevailing market conditions, will be our historical performance, estimates of our business potential and earnings prospects, an assessment of our management and the consideration of the above factors in relation to market valuation of companies in related businesses.
We have been approved to list the common shares on the NYSE under the symbol “FTAI.” In order to meet one of the requirements for listing the common shares on the NYSE, the underwriters have undertaken to sell lots of 100 or more shares to a minimum of 400 beneficial holders.
In connection with the offering, the underwriters may purchase and sell common shares in the open market. These transactions may include short sales, stabilizing transactions and purchases to cover positions created by short sales. Short sales involve the sale by the underwriters of a greater number of shares than they are required to purchase in the offering, and a short position represents the amount of such sales that have not been covered by subsequent purchases. A “covered short position” is a short position that is not greater than the amount of additional shares for which the underwriters’ option described above may be exercised. The underwriters may cover any covered short position by either exercising their option to purchase additional shares or purchasing shares in the open market. In determining the source of shares to cover the covered short position, the underwriters will consider, among other things, the price of shares available for purchase in the open market as compared to the price at which they may purchase additional shares pursuant to the option described above. “Naked” short sales are any short sales that create a short position greater than the amount of additional shares for which the option described above may be exercised. The underwriters must cover any such naked short position by purchasing shares in the open market. A naked short position is more likely to be created if the underwriters are concerned that there may be downward pressure on the price of the common shares in the open market after pricing that could adversely affect investors who purchase in the offering. Stabilizing transactions consist of various bids for or purchases of common shares made by the underwriters in the open market prior to the completion of the offering.
The underwriters may also impose a penalty bid. This occurs when a particular underwriter repays to the underwriters a portion of the underwriting discount received by it because the representatives have repurchased shares sold by or for the account of such underwriter in stabilizing or short covering transactions.
Purchases to cover a short position and stabilizing transactions, as well as other purchases by the underwriters for their own accounts, may have the effect of preventing or retarding a decline in the market price of our common shares, and together with the imposition of the penalty bid, may stabilize, maintain or otherwise affect the market price of our common shares. As a result, the price of our common shares may be higher than the price that otherwise might exist in the open market. The underwriters are not required to engage in these activities and may end any of these activities at any time.
180
Table of Contents
In addition, the underwriters will receive an expense allowance of up to $20,000 under the underwriting agreement.
The underwriters do not expect sales to discretionary accounts to exceed 5% of the total number of shares offered.
We estimate that the total expenses of the offering, excluding underwriting discounts and commissions, will be approximately $3.6 million.
We have agreed to indemnify the several underwriters against certain liabilities, including liabilities under the Securities Act.
Deutsche Bank AG, Cayman Islands Branch, an affiliate of Deutsche Bank Securities Inc., owns a 49% interest in an indirect subsidiary of the Issuer, Intermodal Finance I. In addition, on September 5, 2012, Intermodal Finance I entered into a Term Loan Agreement (the “DB Term Loan”) with Deutsche Bank AG, Cayman Islands Branch for an initial aggregate amount of $125.0 million in connection with the acquisition of a portfolio of shipping containers subject to direct finance leases. On December 17, 2012 the DB Term Loan was amended to provide for an additional borrowing of $53.0 million, which was used in connection with the acquisition of a portfolio of shipping containers subject to operating leases. Deutsche Bank AG, Cayman Islands Branch acts as administrative agent and is a lender the DB Term Loan. An administrative agent fee calculated at a rate of 0.25% is payable. The DB Term Loan requires monthly payments of interest, administrative agent fees and scheduled amortization payments through its maturity on September 25, 2019. As of December 31, 2014, Intermodal Finance I has paid Deutsche Bank AG, Cayman Islands Branch an aggregate of $1.0 million in administrative agent fees.
The underwriters and their respective affiliates are full service financial institutions engaged in various activities, which may include sales and trading, commercial and investment banking, advisory, investment management, investment research, principal investment, hedging, market making, brokerage and other financial and non-financial activities and services. Certain of the underwriters and their respective affiliates have provided, and may in the future provide, a variety of these services to the issuer and to persons and entities with relationships with the issuer, for which they received or will receive customary fees and expenses.
In the ordinary course of their various business activities, the underwriters and their respective affiliates, officers, directors and employees may purchase, sell or hold a broad array of investments and actively traded securities, derivatives, loans, commodities, currencies, credit default swaps and other financial instruments for their own account and for the accounts of their customers, and such investment and trading activities may involve or relate to assets, securities and/or instruments of the issuer (directly, as collateral securing other obligations or otherwise) and/or persons and entities with relationships with the issuer. The underwriters and their respective affiliates may also communicate independent investment recommendations, market color or trading ideas and/or publish or express independent research views in respect of such assets, securities or instruments and may at any time hold, or recommend to clients that they should acquire, long and/or short positions in such assets, securities and instruments.
Because the Financial Industry Regulatory Authority, Inc. (“FINRA”) is expected to view the common units offered hereby as interests in a direct participation program, there is no conflict of interest between us and the underwriters under Rule 5121 of the FINRA Rules and the offering is being made in compliance with Rule 2310 of the FINRA Rules. Investor suitability with respect to the common units should be judged similarly to the suitability with respect to other securities that are listed for trading on a national securities exchange.
Selling Restrictions
Notice to Prospective Investors in the Dubai International Financial Centre
This prospectus relates to an Exempt Offer in accordance with the Offered Securities Rules of the Dubai Financial Services Authority (“DFSA”). This prospectus is intended for distribution only to persons of a type
181
Table of Contents
specified in the Offered Securities Rules of the DFSA. It must not be delivered to, or relied on by, any other person. The DFSA has no responsibility for reviewing or verifying any documents in connection with Exempt Offers. The DFSA has not approved this prospectus nor taken steps to verify the information set forth herein and has no responsibility for the prospectus. The shares to which this prospectus relates may be illiquid and/or subject to restrictions on their resale. Prospective purchasers of the shares offered should conduct their own due diligence on the shares. If you do not understand the contents of this prospectus you should consult an authorized financial advisor.
Notice to Prospective Investors in Australia
No placement document, prospectus, product disclosure statement or other disclosure document has been lodged with the Australian Securities and Investments Commission (“ASIC”), in relation to the offering. This prospectus does not constitute a prospectus, product disclosure statement or other disclosure document under the Corporations Act 2001 (the “Corporations Act”), and does not purport to include the information required for a prospectus, product disclosure statement or other disclosure document under the Corporations Act.
Any offer in Australia of the shares may only be made to persons (the “Exempt Investors”) who are “sophisticated investors” (within the meaning of section 708(8) of the Corporations Act), “professional investors” (within the meaning of section 708(11) of the Corporations Act) or otherwise pursuant to one or more exemptions contained in section 708 of the Corporations Act so that it is lawful to offer the shares without disclosure to investors under Chapter 6D of the Corporations Act.
The shares applied for by Exempt Investors in Australia must not be offered for sale in Australia in the period of 12 months after the date of allotment under the offering, except in circumstances where disclosure to investors under Chapter 6D of the Corporations Act would not be required pursuant to an exemption under section 708 of the Corporations Act or otherwise or where the offer is pursuant to a disclosure document which complies with Chapter 6D of the Corporations Act. Any person acquiring shares must observe such Australian on-sale restrictions.
This prospectus contains general information only and does not take account of the investment objectives, financial situation or particular needs of any particular person. It does not contain any securities recommendations or financial product advice. Before making an investment decision, investors need to consider whether the information in this prospectus is appropriate to their needs, objectives and circumstances, and, if necessary, seek expert advice on those matters.
Notice to Prospective Investors in Hong Kong
The shares have not been offered or sold and will not be offered or sold in Hong Kong, by means of any document, other than (a) to “professional investors” as defined in the Securities and Futures Ordinance (Cap. 571) of Hong Kong and any rules made under that Ordinance; or (b) in other circumstances which do not result in the document being a “prospectus” as defined in the Companies Ordinance (Cap. 32) of Hong Kong or which do not constitute an offer to the public within the meaning of that Ordinance. No advertisement, invitation or document relating to the shares has been or may be issued or has been or may be in the possession of any person for the purposes of issue, whether in Hong Kong or elsewhere, which is directed at, or the contents of which are likely to be accessed or read by, the public of Hong Kong (except if permitted to do so under the securities laws of Hong Kong) other than with respect to shares which are or are intended to be disposed of only to persons outside Hong Kong or only to “professional investors” as defined in the Securities and Futures Ordinance and any rules made under that Ordinance.
Notice to Prospective Investors in Japan
The shares have not been and will not be registered under the Financial Instruments and Exchange Law of Japan (Law No. 25 of 1948, as amended) and, accordingly, will not be offered or sold, directly or indirectly, in
182
Table of Contents
Japan, or for the benefit of any Japanese Person or to others for re-offering or resale, directly or indirectly, in Japan or to any Japanese Person, except in compliance with all applicable laws, regulations and ministerial guidelines promulgated by relevant Japanese governmental or regulatory authorities in effect at the relevant time. For the purposes of this paragraph, “Japanese Person” shall mean any person resident in Japan, including any corporation or other entity organized under the laws of Japan.
Notice to Prospective Investors in Singapore
This prospectus has not been registered as a prospectus with the Monetary Authority of Singapore. Accordingly, this prospectus and any other document or material in connection with the offer or sale, or invitation for subscription or purchase, of shares may not be circulated or distributed, nor may the shares be offered or sold, or be made the subject of an invitation for subscription or purchase, whether directly or indirectly, to persons in Singapore other than (i) to an institutional investor under Section 274 of the Securities and Futures Act, Chapter 289 of Singapore (the “SFA”), (ii) to a relevant person pursuant to Section 275(1), or any person pursuant to Section 275(1A), and in accordance with the conditions specified in Section 275, of the SFA, or (iii) otherwise pursuant to, and in accordance with the conditions of, any other applicable provision of the SFA.
Where the shares are subscribed or purchased under Section 275 of the SFA by a relevant person which is:
a) a corporation (which is not an accredited investor (as defined in Section 4A of the SFA)) the sole business of which is to hold investments and the entire share capital of which is owned by one or more individuals, each of whom is an accredited investor; or
b) a trust (where the trustee is not an accredited investor) whose sole purpose is to hold investments and each beneficiary of the trust is an individual who is an accredited investor, securities (as defined in Section 239(1) of the SFA) of that corporation or the beneficiaries’ rights and interest (howsoever described) in that trust shall not be transferred within six months after that corporation or that trust has acquired the shares pursuant to an offer made under Section 275 of the SFA except:
i) to an institutional investor or to a relevant person defined in Section 275(2) of the SFA, or to any person arising from an offer referred to in Section 275(1A) or Section 276(4)(i)(B) of the SFA;
ii) where no consideration is or will be given for the transfer;
iii) where the transfer is by operation of law;
iv) as specified in Section 276(7) of the SFA; or
v) as specified in Regulation 32 of the Securities and Futures (Offers of Investments) (Shares and Debentures) Regulations 2005 of Singapore.
183
Table of Contents
Skadden, Arps, Slate, Meagher & Flom LLP is representing us in connection with this offering. The underwriters have been represented by Cahill Gordon & Reindel LLP.
The financial statements of Fortress Transportation and Infrastructure Investors LLC as of December 31, 2014 and 2013 and for each of the two years in the period ended December 31, 2014 included in this Prospectus have been so included in reliance on the report of PricewaterhouseCoopers LLP, an independent registered public accounting firm, given on the authority of said firm as experts in auditing and accounting.
The financial statements of Intermodal Finance I Ltd. as of December 31, 2014 and 2013 and for each of the two years in the period ended December 31, 2014 included in this Prospectus have been so included in reliance on the report of PricewaterhouseCoopers LLP, an independent registered public accounting firm, given on the authority of said firm as experts in auditing and accounting.
The financial statements of Jefferson Refinery, LLC and subsidiaries as of December 31, 2013 and 2012 and for each of the two years in the period ended December 31, 2013 included in this Prospectus have been so included in reliance on the report of UHY LLP, an independent registered public accounting firm, given on the authority of said firm as experts in auditing and accounting.
The combined financial statements of Montreal, Maine & Atlantic Railway Ltd. and Montreal, Maine & Atlantic Canada Co. as of December 31, 2013 and 2012 and for each of the two years in the period ended December 31, 2013 included in this Prospectus have been so included in reliance on the report of Baker Newman & Noyes, LLC, an independent registered public accounting firm, given on the authority of said firm as experts in auditing and accounting.
We have obtained the graphical, statistical and other information about the container leasing industry set forth in this prospectus, including all information under the subheading “Intermodal” in the section titled “Industry Overview,” and all estimates about future container trade growth appearing elsewhere in this prospectus, from Harrison Consulting, and we have included such information in reliance upon the authority of Harrison Consulting as an expert in statistical and other analysis of the container leasing industry. The “Intermodal” subsection of the “Industry Overview” section of this prospectus has been prepared by Harrison Consulting, which has confirmed to us that such section fairly summarizes the matters set forth therein, as stated in the consent of Harrison Consulting filed as an exhibit to the registration statement of which this prospectus is a part.
MARKET AND INDUSTRY DATA AND FORECASTS
Certain market and industry data included in this prospectus has been obtained from third-party sources that we believe to be reliable. Market estimates are calculated by using independent industry publications, government publications, and third-party forecasts in conjunction with our assumptions about our markets. We have not independently verified such third-party information. While we are not aware of any misstatements regarding any market, industry or similar data presented herein, such data involves risks and uncertainties and is subject to change based on various factors, including those discussed under the headings “Forward-Looking Statements” and “Risk Factors” in this prospectus.
184
Table of Contents
WHERE YOU CAN FIND MORE INFORMATION
We have filed a registration statement, of which this prospectus is a part, on Form S-1 with the SEC relating to this offering. This prospectus does not contain all of the information in the registration statement and the exhibits included with the registration statement. References in this prospectus to any of our contracts, agreements or other documents are not necessarily complete, and you should refer to the exhibits attached to the registration statement for copies of the actual contracts, agreements, or documents. You may read and copy the registration statement, the related exhibits and other material we file with the SEC at the SEC’s public reference room in Washington, D.C. at 100 F Street, Room 1580, N.E., Washington, D.C. 20549. You can also request copies of those documents, upon payment of a duplicating fee, by writing to the SEC. Please call the SEC at 1-800-SEC-0330 for further information on the operation of the public reference rooms. The SEC also maintains an internet site that contains reports, proxy and information statements and other information regarding issuers that file with the SEC. The website address is http://www.sec.gov.
Upon the effectiveness of the registration statement, we will be subject to the informational requirements of the Exchange Act, and, in accordance, with the Exchange Act, will file reports, proxy and information statements and other information with the SEC. Such annual, quarterly and special reports, proxy and information statements and other information can be inspected and copied at the locations set forth above. We intend to make this information available on the investor relations section of our website, www.ftandi.com. We have included our website address in this prospectus solely as an inactive textual reference. Information on, or accessible through, our website is not part of this prospectus.
185
Table of Contents
INDEX TO CONSOLIDATED FINANCIAL STATEMENTS OF FORTRESS TRANSPORTATION AND INFRASTRUCTURE INVESTORS LLC, INTERMODAL FINANCE I LTD., JEFFERSON REFINERY, LLC AND SUBSIDIARIES, AND MONTREAL, MAINE & ATLANTIC RAILWAY LTD. AND MONTREAL, MAINE & ATLANTIC CANADA CO.
| Page | ||||
| CONSOLIDATED FINANCIAL STATEMENTS OF FORTRESS TRANSPORTATION AND INFRASTRUCTURE INVESTORS LLC: |
||||
| F-3 | ||||
| F-4 | ||||
| Consolidated Statements of Income for the Years Ended December 31, 2014 and 2013 |
F-5 | |||
| F-6 | ||||
| Consolidated Statements of Changes in Members’ Equity for the Years Ended December 31, 2014 and 2013 |
F-7 | |||
| Consolidated Statements of Cash Flows for the Years Ended December 31, 2014 and 2013 |
F-8 | |||
| F-10 | ||||
| CONSOLIDATED FINANCIAL STATEMENTS OF INTERMODAL FINANCE I LTD: |
||||
| F-49 | ||||
| F-51 | ||||
| Consolidated Statements of Income for the Years Ended December 31, 2014 and 2013 |
F-52 | |||
| Consolidated Statements of Comprehensive Income for the Years Ended December 31, 2014 and 2013 |
F-53 | |||
| Consolidated Statements of Cash Flows for the Years Ended December 31, 2014 and 2013 |
F-54 | |||
| Consolidated Statements of Members’ Equity for the Years Ended December 31, 2014 and 2013 |
F-55 | |||
| F-56 | ||||
In accordance with Regulation S-X 3-09, the audited consolidated financial statements of Intermodal Finance I Ltd. as of and for the years ended December 31, 2014 and 2013 are presented herein.
| FINANCIAL STATEMENTS OF JEFFERSON REFINERY, LLC AND SUBSIDIARIES: |
||||
| F-69 | ||||
| F-70 | ||||
| Consolidated Statements of Operations and Comprehensive Loss for the Years Ended December 31, 2013 and 2012 |
F-71 | |||
| Consolidated Statements of Members’ Equity for the Years Ended December 31, 2013 and 2012 |
F-72 | |||
| Consolidated Statements of Cash Flows for the Years Ended December 31, 2013 and 2012 |
F-73 | |||
| F-74 | ||||
F-1
Table of Contents
In accordance with Regulation S-X 3-05, the audited financial statements of Jefferson Refinery, LLC and Subsidiaries as of and for the year ended December 31, 2013 and 2012 are presented herein.
| Page | ||||
| FINANCIAL STATEMENTS OF JEFFERSON REFINERY, LLC AND SUBSIDIARIES: |
||||
| Consolidated Balance Sheets at December 31, 2013 and June 30, 2014 (unaudited) |
F-87 | |||
| F-88 | ||||
| F-89 | ||||
| F-90 | ||||
| F-91 | ||||
In accordance with Regulation S-X 3-05, the unaudited financial statements of Jefferson Refinery, LLC and Subsidiaries as of June 30, 2014 (unaudited) and December 31, 2013 and for the six months ended June 30, 2014 (unaudited) and June 30, 2013 (unaudited) are presented herein.
| FINANCIAL STATEMENTS OF MONTREAL, MAINE & ATLANTIC RAILWAY LTD. AND MONTREAL, MAINE & ATLANTIC CANADA CO.: |
||||
| F-102 | ||||
| F-104 | ||||
| F-105 | ||||
| Combined Statements of Equity for the Years Ended December 31, 2013 and 2012 |
F-106 | |||
| Combined Statements of Cash Flows for the Years Ended December 31, 2013 and 2012 |
F-107 | |||
| F-108 | ||||
In accordance with Regulation S-X 3-05, the audited financial statements of Montreal, Maine & Atlantic Railway Ltd. and Montreal, Maine & Atlantic Canada Co. as of and for the year ended December 31, 2013 and 2012 are presented herein.
| FINANCIAL STATEMENTS OF MONTREAL, MAINE & ATLANTIC RAILWAY LTD. AND MONTREAL, MAINE & ATLANTIC CANADA CO.: |
||||
| Condensed Combined Balance Sheets at March 31, 2014 (unaudited) and December 31, 2013 |
F-128 | |||
| F-129 | ||||
| F-130 | ||||
| F-131 | ||||
| F-132 | ||||
In accordance with Regulation S-X 3-05, the unaudited financial statements of Montreal, Maine & Atlantic Railway Ltd. and Montreal, Maine & Atlantic Canada Co. as of March 31, 2014 (unaudited) and December 31, 2013 and for the three months ended March 31, 2014 (unaudited) and March 31, 2013 (unaudited) are presented herein.
F-2
Table of Contents
FORTRESS TRANSPORTATION AND INFRASTRUCTURE INVESTORS LLC
REPORT OF INDEPENDENT REGISTERED PUBLIC ACCOUNTING FIRM
Report of Independent Registered Public Accounting Firm
To the Members of Fortress Transportation and Infrastructure Investors LLC:
In our opinion, the accompanying consolidated balance sheets and the related consolidated statements of operations, comprehensive income (loss), changes in members’ equity and cash flows present fairly, in all material respects, the financial position of Fortress Transportation and Infrastructure Investors LLC at December 31, 2014, and 2013, and the results of its operations and its cash flows for each of the two years in the period ended December 31, 2014 in conformity with accounting principles generally accepted in the United States of America. These financial statements are the responsibility of the Company’s management. Our responsibility is to express an opinion on these financial statements based on our audits. We conducted our audits of these statements in accordance with the standards of the Public Company Accounting Oversight Board (United States). Those standards require that we plan and perform the audit to obtain reasonable assurance about whether the financial statements are free of material misstatement. An audit includes examining, on a test basis, evidence supporting the amounts and disclosures in the financial statements, assessing the accounting principles used and significant estimates made by management, and evaluating the overall financial statement presentation. We believe that our audits provide a reasonable basis for our opinion.
/s/ PricewaterhouseCoopers LLP
New York, New York
April 15, 2015
F-3
Table of Contents
FORTRESS TRANSPORTATION AND INFRASTRUCTURE INVESTORS LLC
CONSOLIDATED BALANCE SHEETS
(Dollar amounts in thousands, unless otherwise noted)
| December 31, | ||||||||||||
| Notes | 2014 | 2013 | ||||||||||
| Assets |
||||||||||||
| Cash and cash equivalents |
2 | $ | 22,125 | $ | 7,236 | |||||||
| Restricted cash |
2 | 21,084 | 1,120 | |||||||||
| Accounts receivable, net |
9,588 | 2,632 | ||||||||||
| Leasing equipment, net |
4 | 509,379 | 107,020 | |||||||||
| Finance leases, net |
5 | 102,813 | 114,770 | |||||||||
| Property, plant, and equipment, net |
6 | 228,328 | — | |||||||||
| Investments in and advances to unconsolidated entities |
7 | 21,569 | 32,744 | |||||||||
| Tendered bonds |
2 | 298,000 | — | |||||||||
| Intangible assets, net |
8 | 52,041 | — | |||||||||
| Goodwill |
3 | 115,226 | — | |||||||||
| Other assets |
24,048 | 13,125 | ||||||||||
|
|
|
|
|
|||||||||
| Total assets |
$ | 1,404,201 | $ | 278,647 | ||||||||
|
|
|
|
|
|||||||||
| Liabilities |
||||||||||||
| Accounts payable and accrued liabilities |
$ | 42,784 | $ | 5,005 | ||||||||
| Debt |
9 | 592,867 | 73,388 | |||||||||
| Maintenance deposits |
2 | 35,575 | 817 | |||||||||
| Security deposits |
2 | 13,622 | 3,416 | |||||||||
| Other liabilities |
5,856 | 137 | ||||||||||
|
|
|
|
|
|||||||||
| Total liabilities |
690,704 | 82,763 | ||||||||||
|
|
|
|
|
|||||||||
| Commitments and Contingencies |
16 | |||||||||||
| Members’ Equity |
||||||||||||
| Members’ equity |
614,218 | 192,101 | ||||||||||
| Accumulated other comprehensive income |
214 | 328 | ||||||||||
| Non-controlling interest in equity of consolidated subsidiaries |
99,065 | 3,455 | ||||||||||
|
|
|
|
|
|||||||||
| Total members’ equity |
713,497 | 195,884 | ||||||||||
|
|
|
|
|
|||||||||
| Total liabilities and members’ equity |
$ | 1,404,201 | $ | 278,647 | ||||||||
|
|
|
|
|
|||||||||
See accompanying notes to consolidated financial statements.
F-4
Table of Contents
FORTRESS TRANSPORTATION AND INFRASTRUCTURE INVESTORS LLC
CONSOLIDATED STATEMENTS OF INCOME
(Dollar amounts in thousands, except for share and per share data)
| Year Ended December 31, | ||||||||||
| Notes | 2014 | 2013 | ||||||||
| Revenues |
||||||||||
| Equipment leasing revenues |
$ | 43,984 | $ | 19,530 | ||||||
| Infrastructure revenues |
13,946 | — | ||||||||
|
|
|
|
|
|||||||
| Total revenues |
11 | 57,930 | 19,530 | |||||||
|
|
|
|
|
|||||||
| Expenses |
||||||||||
| Operating expenses |
27,223 | 3,157 | ||||||||
| General and administrative |
2,007 | 805 | ||||||||
| Acquisition and transaction expenses |
3 | 11,450 | 260 | |||||||
| Management fees to affiliate |
14 | 5,463 | 2,211 | |||||||
| Depreciation and amortization |
4, 6, 8 | 15,998 | 3,909 | |||||||
| Interest expense |
9 | 5,872 | 2,816 | |||||||
|
|
|
|
|
|||||||
| Total expenses |
68,013 | 13,158 | ||||||||
|
|
|
|
|
|||||||
| Other income |
||||||||||
| Equity in earnings of unconsolidated entities |
7 | 6,093 | 10,325 | |||||||
| Gain on sale of equipment, net |
7,576 | 2,415 | ||||||||
| Gain on sale of unconsolidated entity |
— | 6,144 | ||||||||
| Interest income |
186 | 23 | ||||||||
| Other income |
20 | — | ||||||||
|
|
|
|
|
|||||||
| Total other income |
13,875 | 18,907 | ||||||||
|
|
|
|
|
|||||||
| Income before income taxes |
3,792 | 25,279 | ||||||||
| Provision for income taxes |
13 | 874 | — | |||||||
|
|
|
|
|
|||||||
| Net income |
2,918 | 25,279 | ||||||||
|
|
|
|
|
|||||||
| Less: Net income (loss) attributable to non-controlling interests in consolidated subsidiaries |
(4,862 | ) | 458 | |||||||
|
|
|
|
|
|||||||
| Net income attributable to members |
$ | 7,780 | $ | 24,821 | ||||||
|
|
|
|
|
|||||||
| Pro forma net income attributable to members per share (Note 18) – basic and diluted (unaudited) |
$ | 0.15 | $ | 0.46 | ||||||
|
|
|
|
|
|||||||
| Weighted average shares of common stock outstanding used in computing the pro forma net income attributable to members per share (Note 18) – basic and diluted (unaudited) |
53,502,873 | 53,502,873 | ||||||||
|
|
|
|
|
|||||||
See accompanying notes to consolidated financial statements.
F-5
Table of Contents
FORTRESS TRANSPORTATION AND INFRASTRUCTURE INVESTORS LLC
CONSOLIDATED STATEMENTS OF COMPREHENSIVE INCOME (LOSS)
(Dollar amounts in thousands, unless otherwise noted)
| Year Ended December 31, | ||||||||
| 2014 | 2013 | |||||||
| Net income |
$ | 2,918 | $ | 25,279 | ||||
| Other comprehensive income (loss): |
||||||||
| Change in fair value of cash flow hedge (1) |
(114 | ) | 405 | |||||
|
|
|
|
|
|||||
| Comprehensive income |
$ | 2,804 | $ | 25,684 | ||||
|
|
|
|
|
|||||
| Comprehensive income (loss) attributable to non-controlling interest |
$ | (4,862 | ) | $ | 458 | |||
|
|
|
|
|
|||||
| Comprehensive income attributable to members |
$ | 7,666 | $ | 25,226 | ||||
|
|
|
|
|
|||||
| (1) | Includes the Company’s share of equity method investee amounts of $0 and $77 for the years ended December 31, 2014 and 2013, respectively. |
See accompanying notes to consolidated financial statements.
F-6
Table of Contents
FORTRESS TRANSPORTATION AND INFRASTRUCTURE INVESTORS LLC
CONSOLIDATED STATEMENTS OF CHANGES IN MEMBERS’ EQUITY
(Dollar amounts in thousands, unless otherwise noted)
| Members’ Equity |
Accumulated Other Comprehensive Income |
Non-controlling interest in equity of consolidated subsidiaries |
Total Members’ Equity |
|||||||||||||
| Members’ equity—January 1, 2013 |
$ | 112,092 | $ | (77 | ) | $ | — | $ | 112,015 | |||||||
| Comprehensive income (loss): |
||||||||||||||||
| Net income for the period |
24,821 | — | 458 | 25,279 | ||||||||||||
| Other comprehensive income |
— | 405 | — | 405 | ||||||||||||
|
|
|
|
|
|
|
|
|
|||||||||
| Total comprehensive income |
24,821 | 405 | 458 | 25,684 | ||||||||||||
| Capital contributions (1) |
97,086 | — | 3,318 | 100,404 | ||||||||||||
| Capital distributions (1) |
(41,898 | ) | — | (321 | ) | (42,219 | ) | |||||||||
|
|
|
|
|
|
|
|
|
|||||||||
| Members’ equity—December 31, 2013 |
192,101 | 328 | 3,455 | 195,884 | ||||||||||||
| Comprehensive income (loss): |
||||||||||||||||
| Net income for the period |
7,780 | — | (4,862 | ) | 2,918 | |||||||||||
| Other comprehensive income (loss) |
— | (114 | ) | — | (114 | ) | ||||||||||
|
|
|
|
|
|
|
|
|
|||||||||
| Total comprehensive income (loss) |
7,780 | (114 | ) | (4,862 | ) | 2,804 | ||||||||||
| Capital contributions |
490,747 | — | 99,772 | 590,519 | ||||||||||||
| Capital distributions |
(76,410 | ) | — | (565 | ) | (76,975 | ) | |||||||||
| Equity-based compensation |
— | — | 1,265 | 1,265 | ||||||||||||
|
|
|
|
|
|
|
|
|
|||||||||
| Members’ equity—December 31, 2014 |
$ | 614,218 | $ | 214 | $ | 99,065 | $ | 713,497 | ||||||||
|
|
|
|
|
|
|
|
|
|||||||||
| (1) | Amounts also include deemed distributions to members and simultaneous recontributions in the amount of $2,267. |
See accompanying notes to consolidated financial statements.
F-7
Table of Contents
FORTRESS TRANSPORTATION AND INFRASTRUCTURE INVESTORS LLC
CONSOLIDATED STATEMENTS OF CASH FLOWS
(Dollar amounts in thousands, unless otherwise noted)
| Year Ended December 31, |
||||||||
| 2014 | 2013 | |||||||
| Cash flows from operating activities: |
||||||||
| Net income |
$ | 2,918 | $ | 25,279 | ||||
| Adjustments to reconcile net income to net cash provided by operating activities: |
||||||||
| Equity in earnings of unconsolidated entities |
(6,093 | ) | (10,325 | ) | ||||
| Gain on sale of equipment |
(7,576 | ) | (2,415 | ) | ||||
| Gain on sale of unconsolidated entity |
— | (6,144 | ) | |||||
| Equity based compensation |
1,265 | — | ||||||
| Depreciation and amortization |
15,998 | 3,909 | ||||||
| Change in current and deferred income taxes |
626 | — | ||||||
| Change in fair value of non-hedge derivative |
25 | — | ||||||
| Amortization of lease intangibles |
2,694 | — | ||||||
| Amortization of deferred financing costs |
576 | 125 | ||||||
| Amortization of bond premium |
(32 | ) | — | |||||
| Operating distributions from unconsolidated entities |
8,207 | 8,713 | ||||||
| Bad debt expense |
281 | — | ||||||
| Change in: |
||||||||
| Accounts receivable |
(7,212 | ) | (2,609 | ) | ||||
| Other assets |
(2,654 | ) | (6,481 | ) | ||||
| Accounts payable and accrued liabilities |
(45,900 | ) | 892 | |||||
| Management fees payable to affiliate |
2,362 | 875 | ||||||
| Other liabilities |
2,964 | 94 | ||||||
|
|
|
|
|
|||||
| Net cash (used in) provided by operating activities |
(31,551 | ) | 11,913 | |||||
|
|
|
|
|
|||||
| Cash flows from investing activities: |
||||||||
| Construction deposit related to vessel |
(7,450 | ) | — | |||||
| Change in restricted cash |
(7,306 | ) | (1,120 | ) | ||||
| Acquisition of CMQR |
(11,308 | ) | — | |||||
| Acquisition of Jefferson Terminal |
(47,811 | ) | — | |||||
| Funding of Jefferson Terminal term loans and other receivables |
(97,616 | ) | ||||||
| Acquisition of finance leases |
— | (41,808 | ) | |||||
| Principal collections on finance leases |
11,931 | 8,263 | ||||||
| Acquisition of leasing equipment |
(387,118 | ) | (88,045 | ) | ||||
| Acquisition of property plant and equipment |
(49,441 | ) | — | |||||
| Acquisition of lease intangibles |
(20,435 | ) | — | |||||
| Proceeds from sale of investment in unconsolidated entity |
— | 22,000 | ||||||
| Collection of notes receivable |
4,500 | |||||||
| Proceeds from sale of leasing equipment |
31,597 | 8,434 | ||||||
| Proceeds from sale of property, plant and equipment |
842 | — | ||||||
| Proceeds from sale of equipment held for sale |
135 | — | ||||||
| Escrow funding for purchase of aircraft |
(1,000 | ) | — | |||||
| Return of capital distributions from unconsolidated entities |
9,064 | 4,511 | ||||||
|
|
|
|
|
|||||
| Net cash used in investing activities |
|
(571,416 |
) |
|
(87,765 |
) | ||
|
|
|
|
|
|||||
See accompanying notes to consolidated financial statements.
F-8
Table of Contents
FORTRESS TRANSPORTATION AND INFRASTRUCTURE INVESTORS LLC
CONSOLIDATED STATEMENTS OF CASH FLOWS
(Dollar amounts in thousands, unless otherwise noted)
| Year Ended December 31, |
||||||||
| 2014 | 2013 | |||||||
| Cash flows from financing activities: |
||||||||
| Purchase of interest rate cap |
$ | — | $ | (43 | ) | |||
| Proceeds from debt |
179,569 | 24,774 | ||||||
| Repayment of debt |
(31,131 | ) | (7,377 | ) | ||||
| Payment of financing costs |
(4,793 | ) | (183 | ) | ||||
| Receipt of security deposits |
2,389 | 3,466 | ||||||
| Return of security deposits |
(500 | ) | (675 | ) | ||||
| Receipt of maintenance deposits |
3,324 | 817 | ||||||
| Release of maintenance deposits |
(3,026 | ) | — | |||||
| Capital contributions from members |
490,747 | 94,819 | ||||||
| Capital distributions to members |
(75,999 | ) | (39,631 | ) | ||||
| Capital contributions from non-controlling interests |
57,841 | 3,318 | ||||||
| Capital distributions to non-controlling interests |
(565 | ) | (321 | ) | ||||
|
|
|
|
|
|||||
| Net cash provided by financing activities |
617,856 | 78,964 | ||||||
|
|
|
|
|
|||||
| Net increase in cash and cash equivalents |
14,889 | 3,112 | ||||||
| Cash and cash equivalents, beginning of period |
7,236 | 4,124 | ||||||
|
|
|
|
|
|||||
| Cash and cash equivalents, end of period |
$ | 22,125 | $ | 7,236 | ||||
|
|
|
|
|
|||||
| Supplemental disclosure of cash flow information: |
||||||||
| Cash paid for interest |
$ | 3,627 | $ | 2,700 | ||||
| Cash paid for taxes |
$ | 274 | $ | — | ||||
| Supplemental disclosure of non-cash investing and financing activities: |
||||||||
| Acquisition of finance leases |
$ | — | $ | (894 | ) | |||
| Acquisition of leasing equipment |
(52,556 | ) | (503 | ) | ||||
| Acquisition of property, plant and equipment |
(22,454 | ) | — | |||||
| Acquisition of CMQR |
(2,991 | ) | — | |||||
| Acquisition of Jefferson |
(38,207 | ) | — | |||||
| Assumed security deposit |
8,317 | — | ||||||
| Assumed maintenance deposit |
34,461 | — | ||||||
| Non-cash contribution of non-controlling interest |
38,207 | — | ||||||
| Equity compensation to non-controlling interest |
1,265 | — | ||||||
| Loan receivable from non-controlling interest |
3,725 | — | ||||||
| Note receivable from sale of unconsolidated entity |
— | 4,500 | ||||||
| Deemed distribution and contribution of capital |
— | 2,267 | ||||||
| Change in fair value of cash flow hedge |
(114 | ) | 328 | |||||
| Distribution payable |
(411 | ) | — | |||||
| Partnership’s share of change in fair value of cash flow hedge of equity method investee |
$ | — | $ | 77 | ||||
|
|
|
|
|
|||||
See accompanying notes to consolidated financial statements.
F-9
Table of Contents
FORTRESS TRANSPORTATION AND INFRASTRUCTURE INVESTORS LLC
NOTES TO CONSOLIDATED FINANCIAL STATEMENTS
(Dollar amounts in thousands, unless otherwise noted)
| 1. | ORGANIZATION |
Fortress Transportation and Infrastructure Investors LLC (the “Company”) is a Delaware limited liability company which was formed on February 19, 2014, and had not, prior to the completion of the restructuring transactions in which it acquired all of the partnership interests in Fortress Transportation and Infrastructure General Partnership (the “Partnership”), conducted any activities other than those incident to its formation for the preparation of its initial public offering. The term of the Company shall continue indefinitely unless earlier dissolved as a result of an Event of Dissolution, as defined.
The Partnership is a holding company that conducts its business through subsidiaries which are currently engaged in the ownership and leasing of aviation equipment, offshore energy equipment and shipping containers; the Partnership also owns and operates a short line railroad in North America (“CMQR”) and a multi-modal crude oil and refined products terminal in Beaumont, Texas (“Jefferson Terminal”). The Partnership has five reportable segments, Aviation Leasing, Offshore Energy, Shipping Containers, Jefferson Terminal and Railroad, which operate in two primary businesses, Equipment Leasing and Infrastructure (Note 15).
Unless the context suggests otherwise, references in the consolidated financial statements to the Company refer to the Partnership and its consolidated subsidiaries prior to the consummation of the restructuring transaction described above.
On May 5, 2014, the operating agreement of the Company was amended and restated to effectuate the contributions of 99.95% of the partner interests in the Partnership, which were held by Fortress Worldwide Transportation and Infrastructure Investors LP (the “Onshore Fund”), Fortress Worldwide Transportation and Infrastructure Offshore LP (the “Offshore Fund”) and Fortress Worldwide Transportation and Infrastructure Master GP LLC (the “Master GP”), to the Company. The Master GP is also the managing member of the Company and continues to retain a 0.05% interest in the Partnership.
At December 31, 2014, through their investment in the Company, the beneficial owners of the Partnership were the Onshore Fund, with an 89.97% interest, the Offshore Fund with a 9.98% interest, and the Master GP with a 0.05% interest. At December 31, 2014, the aggregate capital commitments of the investors of the Onshore Fund, Offshore Fund and Master GP, which are designated for investment in the Partnership, were approximately $995,497, of which approximately $699,190 had been called.
At December 31, 2013, through their investment in the Company, the beneficial owners of the Partnership were the Onshore Fund with an 86.29% interest, the Offshore Fund with a 13.66% interest and the Master GP with a 0.05% interest.
The Master GP is entitled to an incentive return (the “Incentive Return”) generally equal to 10% of the Company’s returns (before certain taxes), as defined, subject to: i) an 8% cumulative preferred return payable to the Onshore Fund and Offshore Fund investors and ii) a clawback provision which requires amounts previously distributed as Incentive Return to be returned to the Company for the benefit of the Onshore Fund and Offshore Fund investors (after adjusting for tax in accordance with the partnership agreement) if, upon the termination of the Company, the amounts ultimately distributed to the Master GP exceed its allocable amount.
The Master GP is owned by an affiliate of Fortress Investment Group LLC (“Fortress”). The Onshore Fund and the Offshore Fund are investment vehicles which are sponsored by Fortress. The general partner of the Onshore Fund and the Offshore Fund is owned by an affiliate of Fortress.
The Company is managed by FIG Transportation Fund Management LLC (the “Manager”), an affiliate of Fortress, pursuant to a management agreement (the “Management Agreement”) which provides for the Partnership to bear obligations for management fees and expense reimbursements payable to the Manager (Note 14).
F-10
Table of Contents
FORTRESS TRANSPORTATION AND INFRASTRUCTURE INVESTORS LLC
NOTES TO CONSOLIDATED FINANCIAL STATEMENTS
(Dollar amounts in thousands, unless otherwise noted)
| 2. | SUMMARY OF SIGNIFICANT ACCOUNTING POLICIES |
Basis of Accounting—The accompanying consolidated financial statements are prepared in accordance with U.S. generally accepted accounting principles (“GAAP”) and include the accounts of the Company and its subsidiaries. The Company consolidates all entities in which it has a controlling financial interest and in which it has control over significant operating decisions, as well as variable interest entities (“VIE’s”) in which the Company is the primary beneficiary. All significant intercompany transactions and balances have been eliminated. The ownership interest of other investors in consolidated subsidiaries is recorded as non-controlling interest.
The Company uses the equity method of accounting for investments in entities in which the Company exercises significant influence but which do not meet the requirements for consolidation. Under the equity method, the Company records its proportionate share of the underlying net income (loss) of these entities.
Variable Interest Entity—The assessment of whether an entity is a VIE and the determination of whether to consolidate a VIE requires judgment. VIEs are defined as entities in which equity investors do not have the characteristics of a controlling financial interest or do not have sufficient equity at risk for the entity to finance its activities without additional subordinated financial support from other parties. A VIE is required to be consolidated by its primary beneficiary, and only by its primary beneficiary, which is defined as the party who has the power to direct the activities of a VIE that most significantly impact its economic performance and who has the obligation to absorb losses or the right to receive benefits from the VIE that could potentially be significant to the VIE.
The VIE in which the Company has an interest is WWTAI IES MT6015 Ltd. (“MT6015”), an entity formed in 2014 which has entered into a contract with a shipbuilder for the construction an offshore multi service / inspection, maintenance and repair vessel (the “Vessel”) for a price of approximately $75 million. A subsidiary of the Company and a third party each hold a 50% interest in MT6015 and have equal representation on its board of directors. In connection with the initial capitalization of MT6015, another subsidiary of the Company provided the partner with a $3,725 loan which was utilized by the partner to fund its equity contribution to MT6015. In addition, the agreement provides the Company with disproportionate voting rights, in certain situations, as defined by the agreement. Accordingly, the Company determined that MT6015 is a VIE, that it was the primary beneficiary, and accordingly has been presented on a consolidated basis in the accompanying financial statements.
At December 31, 2014, MT6015 had total assets of $7,450, which are available only to settle the obligations of MT6015. Other than entering into the above commitment, the entity has no operations in 2014, and no creditors of MT6015 have recourse to any assets or to the general credit of the Company.
At December 31, 2013, the Company did not hold any interest in a VIE.
Reclassifications—Certain prior period amounts have been reclassified to conform to current period presentation.
Use of Estimates—The preparation of financial statements in conformity with GAAP requires management to make estimates and assumptions that affect the reported amounts of assets and liabilities, the disclosure of contingent assets and liabilities at the date of the consolidated financial statements and the reported amounts of revenues and expenses during the reporting period. Actual results could differ from those estimates.
Risks and Uncertainties—In the normal course of business, the Company encounters several significant types of economic risk including credit, market, and capital market risks. Credit risk is the risk of the inability or unwillingness of a lessee, customer, or derivative counterparty to make contractually required payments or to fulfill its other contractual obligations. Market risk reflects the risk of a downturn or
F-11
Table of Contents
FORTRESS TRANSPORTATION AND INFRASTRUCTURE INVESTORS LLC
NOTES TO CONSOLIDATED FINANCIAL STATEMENTS
(Dollar amounts in thousands, unless otherwise noted)
volatility in the underlying industry segments in which the Company operates which could adversely impact the pricing of the services offered by the Company or a lessee’s or customer’s ability to make payments, increase the risk of unscheduled lease terminations and depress lease rates and the value of the Company’s leasing equipment or operating assets. Capital market risk is the risk that the Company is unable to obtain capital at reasonable rates to fund the growth of its business or to refinance existing debt facilities. The Company, through its subsidiaries, also conducts operations outside of the United States; such international operations are subject to the same risks as those associated with its United States operations as well as additional risks, including unexpected changes in regulatory requirements, heightened risk of political and economic instability, potentially adverse tax consequences and the burden of complying with foreign laws. The Company does not have significant exposure to foreign currency risk as all of its leasing arrangements, terminal services revenue and the majority of freight rail revenue are denominated in U.S. dollars.
Cash and Cash Equivalents—The Company considers all highly liquid short-term investments with a maturity of 90 days or less when purchased to be cash equivalents.
Restricted Cash—Restricted cash of $21,084 and $1,120 at December 31, 2014 and 2013, respectively, consists of cash held in segregated accounts pursuant to the requirements of the Company’s debt agreements (Note 9).
Property, Plant and Equipment, Leasing Equipment and Depreciation
Property, plant and equipment and leasing equipment are stated at cost (inclusive of capitalized acquisition costs, where applicable) and depreciated using the straight-line method, over estimated useful lives, to estimated residual values which are summarized as follows:
| Range of Estimated Useful Lives |
Residual Value Estimates | |||
| Passenger aircraft |
25 years from date of manufacture | Not to exceed 15% of manufacturer’s list price when new | ||
| Aircraft engines |
2 - 6 years, based on maintenance adjusted service life | Sum of engine core salvage value plus the estimated fair value of life limited parts | ||
| Offshore energy vessels |
25 years from date of manufacture | 20% of new build cost | ||
| Railcars and locomotives |
40 - 50 years from date of manufacture | Scrap value at end of useful life | ||
| Track and track related assets |
15 - 50 years from date of manufacture | Scrap value at end of useful life | ||
| Buildings and improvements |
20 - 30 years | Scrap value at end of useful life | ||
| Railroad Equipment |
3 - 15 years from date of manufacture | Scrap value at end of useful life | ||
| Crude Oil Terminal Machinery and Equipment |
15 - 20 years from date of manufacture | Scrap value at end of useful life | ||
| Vehicles |
7 years from date of manufacture | Scrap value at end of useful life | ||
| Furniture and Fixtures |
3 - 10 years from date of purchase | None | ||
| Computer Hardware and Software |
3 - 5 years from date of purchase | None | ||
F-12
Table of Contents
FORTRESS TRANSPORTATION AND INFRASTRUCTURE INVESTORS LLC
NOTES TO CONSOLIDATED FINANCIAL STATEMENTS
(Dollar amounts in thousands, unless otherwise noted)
Major improvements and modifications incurred in connection with the acquisition of property, plant and equipment and leasing equipment that are required to get the asset ready for initial service are capitalized and depreciated over the remaining life of the asset. Costs of major additions and betterments are capitalized and depreciation commences once it is placed into service. Interest costs directly related to and incurred during the construction period of property, plant and equipment are capitalized.
For planned major maintenance or component overhaul activities for aviation equipment off lease, the cost of such major maintenance or component overhaul event is capitalized and depreciated on a straight-line basis over the period until the next maintenance or component overhaul event is required.
In accounting for leasing equipment, the Company makes estimates about the expected useful lives, residual values and the fair value of acquired in-place leases and acquired maintenance liabilities (for aviation equipment). In making these estimates, the Company relies upon observable market data for the same or similar types of equipment and, in the case of aviation equipment, its own estimates with respect to a lessee’s anticipated utilization of the aircraft or engine. When the Company acquires leasing equipment subject to an in-place lease, determining the fair value of the in-place lease requires the Company to make assumptions regarding the current fair values of leases for identical or similar equipment, in order to determine if the in-place lease is within a fair value range of current lease rates. If a lease is below or above the range of current lease rates, the resulting lease discount or premium is recognized as a lease intangible and amortized into lease rental lease income over the remaining term of the lease.
The Company reviews its depreciation policies on a regular basis to determine whether changes have taken place that would suggest that a change in its depreciation policies, useful lives of its equipment or the assigned residual values is warranted.
Equipment held for sale of $0 and $200 at December 31, 2014 and 2013, respectively, is included as a component of Other Assets in the accompanying Consolidated Balance Sheet.
Capitalized Interest—The interest cost associated with major development and construction projects is capitalized and included in the cost of the project. Interest capitalization ceases once a project is substantially complete or no longer undergoing construction activities to prepare it for its intended use. The Company capitalized interest of $3,534 and $0 during the years ending December 31, 2014 and 2013, respectively.
Repairs and Maintenance—Repair and maintenance costs that do not extend the lives of the assets are expensed as incurred. For the years ending December 31, 2014 and 2013, $235 and $712, of repair and maintenance expenses, respectively, were recorded in operating expenses in the accompanying Consolidated Statement of Income.
Impairment of Long-Lived Assets—The Company performs a recoverability assessment of each of its long-lived assets whenever events or changes in circumstances, or indicators, indicate that the carrying amount or net book value of an asset may not be recoverable. Indicators may include, but are not limited to, a significant lease restructuring or early lease termination; significant traffic decline; or the introduction of newer technology aircraft, vessels, engines or railcars. When performing a recoverability assessment, the Company measures whether the estimated future undiscounted net cash flows expected to be generated by the asset exceeds its net book value. The undiscounted cash flows consist of cash flows from currently contracted leases and terminal services contracts, future projected leases, terminal service and freight rail rates, transition costs, estimated down time and estimated residual or scrap values. In the event that an asset does not meet the recoverability test, the carrying value of the asset will be adjusted to fair value resulting in an impairment charge.
F-13
Table of Contents
FORTRESS TRANSPORTATION AND INFRASTRUCTURE INVESTORS LLC
NOTES TO CONSOLIDATED FINANCIAL STATEMENTS
(Dollar amounts in thousands, unless otherwise noted)
Management develops the assumptions used in the recoverability analysis based on its knowledge of active contracts, current and future expectations of the global demand for a particular asset and historical experience in the leasing markets, as well as information received from third party industry sources. The factors considered in estimating the undiscounted cash flows are impacted by changes in future periods due to changes in contracted lease rates, terminal service, and freight rail rates, residual values, economic conditions, technology, demand for a particular asset type and other factors.
Security Deposits—The Company’s operating leases generally require the lessee to pay a security deposit or provide a letter of credit. Security deposits are held until specified return dates stipulated in the lease or lease expiration.
Maintenance Payments—Typically, under an operating lease of aviation equipment, the lessee is responsible for performing all maintenance and is generally required to make maintenance payments to the Company for heavy maintenance, overhaul or replacement of certain high-value components of the aircraft or engine. These maintenance payments are based on hours or cycles of utilization or on calendar time, depending on the component, and are generally required to be made monthly in arrears. If a lessee is making monthly maintenance payments, the Company would typically be obligated to reimburse the lessee for costs they incur for heavy maintenance, overhaul or replacement of certain high-value components to the extent of maintenance payments received in respect of the specific maintenance event, usually shortly following the completion of the relevant work.
The Company records the portion of maintenance payments paid by the lessee that are expected to be reimbursed as maintenance deposit liabilities on the Consolidated Balance Sheet. Reimbursements made to the lessee upon the receipt of evidence of qualifying maintenance work are charged against the maintenance deposit liability.
Lease Incentives and Amortization—Lease incentives are amortized as a reduction of lease income over the primary term of the lease.
Lease acquisition costs related to reconfiguration of the aircraft cabin, other lessee specific modifications and other direct costs are capitalized and amortized over the primary term of the lease, assuming no lease renewals.
Goodwill—Goodwill includes the excess of the purchase price over the fair value of the net tangible and intangible assets associated with the acquisitions of CMQR and Jefferson Terminal (Note 3). A total of approximately $115,226 goodwill was recorded in 2014.
The Company reviews the carrying values of goodwill at least annually to assess impairment since these assets are not amortized. An annual impairment review is conducted as of October 1st of each year. Additionally, the Company reviews the carrying value of goodwill whenever events or changes in circumstances indicate that its carrying amount may not be recoverable. The determination of fair value involves significant management judgment. Impairment is expensed when incurred.
For an annual goodwill impairment assessment, an optional qualitative analysis may be performed. If the option is not elected or if it is more likely than not that the fair value of a reporting unit is less than its carrying amount, then a two-step goodwill impairment test is performed to identify potential goodwill impairment and measure an impairment loss. A qualitative analysis was not elected for the year ended December 31, 2014.
The first step of an impairment assessment compares the fair value of a respective reporting unit with its carrying amount, including goodwill. The estimate of fair value of the respective reporting unit is based on the best information available as of the date of assessment, which primarily incorporates certain factors
F-14
Table of Contents
FORTRESS TRANSPORTATION AND INFRASTRUCTURE INVESTORS LLC
NOTES TO CONSOLIDATED FINANCIAL STATEMENTS
(Dollar amounts in thousands, unless otherwise noted)
including the Company’s assumptions about operating results, business plans, income projections, anticipated future cash flows and market data. If the estimated fair value of the reporting unit is less than the carrying amount, a second step must be completed in order to determine the amount of goodwill impairment that should be recorded, if any.
For the purpose of performing the annual analysis, the Company’s two reporting units subject to the test are the Jefferson Terminal reporting unit and the Railroad reporting units. The Company estimates the fair value of the reporting units using an income approach, specifically a discounted cash flow analysis. This analysis requires the Company to make significant assumptions and estimates about the extent and timing of future cash flows, discount rates and growth rates. The estimates and assumptions used consider historical performance and are consistent with the assumptions used in determining future profit plans for the reporting units. The Company also utilizes market valuation models and other financial ratios, which require the Company to make certain assumptions and estimates regarding the applicability of those models to its assets and businesses.
Although the Company believes the estimates of fair value are reasonable, the determination of certain valuation inputs is subject to management’s judgment. Changes in these inputs could materially affect the results of the impairment review. If the forecasts of cash flows generated by the Jefferson Terminal and the Railroad reporting units or other key inputs are negatively revised in the future, the estimated fair value of the Jefferson Terminal and Railroad reporting units would be adversely impacted, potentially leading to an impairment in the future that could materially affect the Company’s operating results. The Company performed a sensitivity analysis for goodwill impairment and determined that a hypothetical 5% decline in the fair value of each reporting unit as of October 1, 2014 would not result in an impairment of goodwill for any reporting unit.
As of December 31, 2014, there was no impairment of goodwill.
Tendered bonds—A subsidiary of the Company has borrowed the proceeds of certain tax-exempt industrial development bonds issued by the Jefferson County (Texas) Industrial Development Corporation. The proceeds were initially held in trust, as restricted cash, to ensure adherence to the restrictions of use of the funds. Use of the proceeds required approval from a trustee prior to release of funds. In accordance with the terms of the trust indenture and security agreements, these bonds can be tendered by bondholders and purchased by the Company using the unused restricted cash proceeds. The bonds purchased by the Company are deemed to be owned by the Company, and are classified as assets, tendered bonds, in the Consolidated Balance Sheet with an equal corresponding amount as debt, as the bonds owned by the Company have not been deemed extinguished or cancelled. Tendered bonds do not convey principal or interest payments while held by the Company.
Intangibles and amortization—Intangibles include the value of acquired favorable and unfavorable leases and existing customer relationships acquired in connection with the acquisitions of CMQR and Jefferson Terminal (Note 3). In accounting for leasing equipment acquired with in-place leases, the Company makes estimates about the fair value of the acquired in-place leases. In determining the fair value of the in-place lease, the Company makes assumptions regarding the current fair values of leases for identical or similar equipment in order to determine if the in-place lease is within a fair value range of current lease rates. If a lease is below or above the range of current lease rates, the resulting lease discount or premium is recognized as a lease intangible and amortized into rental income over the remaining term of the lease.
Intangible assets also include the value of existing customer relationships acquired in connection with the acquisitions of CMQR and Jefferson Terminal (Note 3).
Acquired lease intangibles are amortized over the associated remaining lease terms of 4 to 64 months on a straight-line basis over the remaining lease terms and recorded as a component of equipment leasing
F-15
Table of Contents
FORTRESS TRANSPORTATION AND INFRASTRUCTURE INVESTORS LLC
NOTES TO CONSOLIDATED FINANCIAL STATEMENTS
(Dollar amounts in thousands, unless otherwise noted)
revenues. Customer relationship intangible assets are amortized on a straight-line basis over their useful lives as the pattern in which the asset’s economic benefits are consumed cannot reliably be determined. Customer relationship intangible assets have useful lives ranging from 5-10 years, no estimated residual value, and amortization is recorded as a component of depreciation and amortization in the accompanying Consolidated Statement of Income. One customer relationship intangible asset, related to a customer contract at Jefferson Terminal, expires on July 31, 2017 and has 2 one-year renewal options.
Deferred Financing Costs—Costs incurred in connection with obtaining long term financing are capitalized and amortized to interest expense over the term of the underlying loans. Unamortized deferred financing costs of $4,919 and $616 as of December 31, 2014 and 2013, respectively, are recorded as a component of other assets in the accompanying Consolidated Balance Sheets. Amortization expenses of $576 and $125 for the years ended December 31, 2014 and 2013, respectively, are included as a component of interest expense in the accompanying Consolidated Statements of Income.
Revenue Recognition
Equipment Leasing Revenues
Operating Leases—The Company leases equipment pursuant to net operating leases. Operating leases with fixed rentals and step rentals are recognized on a straight-line basis over the term of the lease, assuming no renewals. Revenue is not recognized when collection is not reasonably assured. When collectability is not reasonably assured, the customer is placed on non-accrual status and revenue is recognized when cash payments are received.
The Company also recognizes maintenance revenue related to the portion of maintenance payments received from lessees of aviation equipment that are not expected to be reimbursed in connection with major maintenance events.
Straight-line rents of approximately $805 and $708 are included as a component of Accounts Receivable in the accompanying Consolidated Balance Sheets at December 31, 2014 and 2013, respectively. For the years ended December 31, 2014 and 2013, straight-line rent of $97 and $708, respectively, was recognized in Equipment Leasing Revenues in the Consolidated Statement of Income.
Finance Leases—The Company holds two portfolios of shipping containers and an anchor handling tug supply vessel, subject to finance leases, as of December 31, 2014. These leases generally include a lessee obligation to purchase the leased equipment at the end of the lease term, a bargain purchase option, or provide for minimum lease payments with a present value of 90% or more of the fair value of the leased equipment at the date of lease inception. Net investment in finance leases represents the minimum lease payments due from lessees, net of unearned income. The lease payments are segregated into principal and interest components similar to a loan. Unearned income is recognized on an effective interest method over the lease term and is recorded as finance lease income. The principal component of the lease payment is reflected as a reduction to the net investment in finance leases.
Infrastructure Revenues
Freight Rail Revenues—Freight revenues are recognized proportionally as freight moves from origin to destination. Other miscellaneous revenues, such as unloading and switching revenue, are recognized as the service is performed or contractual obligations are met.
Terminal Services Revenues—Terminal services revenues are recognized when services have been provided to the customer, the product has been delivered, the price is considered to be fixed or determinable and collectability is reasonably assured. Prepayments for services are deferred until the period in which the
F-16
Table of Contents
FORTRESS TRANSPORTATION AND INFRASTRUCTURE INVESTORS LLC
NOTES TO CONSOLIDATED FINANCIAL STATEMENTS
(Dollar amounts in thousands, unless otherwise noted)
above criteria are met. Terminal services fees include services provided to third-party customers related to receipt and redelivery of crude oil products.
Concentration of Credit Risk—The Company is subject to concentrations of credit risk with respect to amounts due from customers on its finance leases and operating leases. The Company attempts to limit its credit risk by performing ongoing credit evaluations. During the year ended December 31, 2014, the Company earned approximately 39% of its revenue from three lessees; one each in the aviation leasing, offshore energy and shipping containers segments. During the year ended December 31, 2013, the Company earned approximately 70% of its revenue from three lessees, one each in the aviation leasing, shipping containers and offshore energy segments.
The Company maintains cash and restricted cash balances, which generally exceed federally insured limits, and subject the Company to credit risk, in high credit quality financial institutions. The Company monitors the financial condition of these institutions and has experienced no losses associated with these accounts.
Provision for Doubtful Accounts—The Company determines the provision for doubtful accounts based on its assessment of the collectability of its receivables on a customer-by-customer basis. The provision for doubtful accounts at December 31, 2014 and 2013 was $111 and $0, respectively. Bad debt expense was $281 and $0 for the years ended December 31, 2014 and 2013, respectively.
Expense Recognition—Expenses are recognized on an accrual basis as incurred.
Acquisition and Transaction expenses—Acquisition and transaction expense is comprised of costs related to completed business combinations and terminated deal costs related to abandoned pursuits, including advisory, legal, accounting, valuation and other professional or consulting fees.
Comprehensive Income (Loss)—Comprehensive income (loss) is defined as the change in equity of a business enterprise during a period from transactions and other events and circumstances, excluding those resulting from investments by and distributions to owners. The Company’s comprehensive income (loss) represents net income (loss), as presented in the consolidated statements of income, adjusted for fair value changes related to derivatives accounted for as cash flow hedges and the Company’s pro-rata share of items of comprehensive income derived from investments in unconsolidated entities.
On January 1, 2013, the Company adopted amended guidance for comprehensive income, which requires disclosures related to reclassifications from accumulated other comprehensive income to net income in each reporting period. The Company had a reclassification adjustment of $171 and $98 which impacted accumulated other comprehensive income during the years ended December 31, 2014 and 2013, respectively.
Derivative Financial Instruments—In the normal course of business the Company may utilize interest rate derivatives to manage its exposure to interest rate risks, principally related to the hedging of variable rate interest payments on various debt facilities. If certain conditions are met, an interest rate derivative may be specifically designated as a cash flow hedge. In connection with its debt obligations, the Company has entered into one interest rate derivative designated as a cash flow hedge and one non-hedge derivative (Note 9). The Company does not enter into speculative derivative transactions. Derivative assets of $232 and $371, as of December 31, 2014 and 2013, respectively, were recorded within other assets in the Consolidated Balance Sheet.
On the date that the Company enters into an interest rate derivative, its designation as a cash flow hedge is formally documented. On an ongoing basis, an assessment is made as to whether the interest rate derivative has been highly effective in offsetting changes in the cash flows of the variable rate interest payments on the associated debt and whether the interest rate derivative is expected to remain highly effective in future
F-17
Table of Contents
FORTRESS TRANSPORTATION AND INFRASTRUCTURE INVESTORS LLC
NOTES TO CONSOLIDATED FINANCIAL STATEMENTS
(Dollar amounts in thousands, unless otherwise noted)
periods. If it were to be determined that the interest rate derivative is not (or has ceased to be) highly effective as a cash flow hedge, the use of hedge accounting would be discontinued prospectively.
All interest rate derivatives are recognized on the balance sheet at their fair value. For interest rate derivatives designated as cash flow hedges, the effective portion of the interest rate derivative’s gain or loss is initially reported as a component of other comprehensive income and subsequently reclassified into earnings when the interest payments on the debt are recorded in earnings. The ineffective portion of the interest rate derivative, if any, is calculated and recorded in interest expense. Changes in fair value of non-hedge derivatives are recorded in earnings on a current basis. The estimated net amount of existing gains/losses reported in accumulated other comprehensive income at December 31, 2014 expected to be reclassified into earnings within the next 12 months is approximately $92.
In the event of a termination of an interest rate derivative prior to its contracted maturity, any related net gains or losses in accumulated other comprehensive income at the date of termination would be reclassified into earnings, unless it remains probable that interest payments on the debt will continue to occur, in which case the amount in accumulated other comprehensive income would be reclassified into earnings as the interest payments on the debt affect earnings.
Foreign Currency—The Company’s functional and reporting currency is the U.S. dollar. Purchases and sales of assets and income and expense items denominated in foreign currencies are translated into U.S. dollar amounts on the respective dates of such transactions. Net realized foreign currency gains or losses relating to the differences between these recorded amounts and the U.S. dollar equivalent actually received or paid are reported as a component of operating expenses within the Consolidated Statement of Income.
Income Taxes—A portion of the Company’s income earned by its corporate subsidiaries is subject to U.S. federal and state income taxation, taxed at prevailing rates. The remainder of the Company’s income is allocated directly to its partners and is not subject to a corporate level of taxation. Certain subsidiaries of the Company are subject to income tax in the foreign countries in which they conduct business.
The Company accounts for these taxes using the asset and liability method under which deferred tax assets and liabilities are recognized for the future tax consequences attributable to differences between the financial statement carrying amounts of existing assets and liabilities and their respective tax bases. A valuation allowance is established when management believes it is more likely than not that a deferred tax asset will not be realized.
The Company files income tax returns in the U.S. federal jurisdiction, various state jurisdictions and in certain foreign jurisdictions. The income tax returns filed by the Company and its subsidiaries are subject to examination by the U.S. federal, state and foreign tax authorities. The Company recognizes tax benefits for uncertain tax positions only if it is more likely than not that the position is sustainable based on its technical merits. Interest and penalties on uncertain tax positions are included as a component of the provision for income taxes in the Consolidated Statements of Income.
Distributions and Allocations to Members—Distributions to members are recorded when paid or, in the case of an in-kind distribution, when distributed. The character of distributions made during the reporting period may differ from their ultimate characterization for federal income tax purposes due to book/tax differences in the character of income and expense recognition. Distributions and allocations are determined with respect to each member, as defined by and in accordance with the operating agreement.
Recently Adopted Accounting Pronouncements—In February 2013, the FASB issued Accounting Standards Update (“ASU”) 2013-02 (“ASU 2013-02”), Reporting Amounts Reclassified Out of Accumulated Other Comprehensive Income. The update requires disclosure of amounts reclassified out of accumulated
F-18
Table of Contents
FORTRESS TRANSPORTATION AND INFRASTRUCTURE INVESTORS LLC
NOTES TO CONSOLIDATED FINANCIAL STATEMENTS
(Dollar amounts in thousands, unless otherwise noted)
other comprehensive income by component. In addition, an entity is required to present either on the face of the statement of income or in the notes, significant amounts reclassified out of accumulated other comprehensive income by the respective line items of net income but only if the amount reclassified is required to be reclassified to net income in its entirety in the same reporting period. For amounts not reclassified in their entirety to net income, an entity is required to cross-reference to other disclosures that provide additional detail about those amounts. The Company adopted ASU 2013-02 beginning January 1, 2013.
Unadopted Accounting Pronouncements—In May 2013, the FASB issued a revised exposure draft, “Leases” (the “Lease ED”), which would replace the existing guidance in the Accounting Standards Codification 840 (“ASC 840”), Leases. Pursuant to the Lease ED, leases would be classified as either leases of property or leases of assets other than property. Leases of property will continue to use operating lease accounting. Leases of other than property would use the receivable residual approach. Under the receivable residual approach, a lease receivable would be recognized for the lessor’s right to receive lease payments, a portion of the carrying amount of the underlying asset would be allocated between the right of use granted to the lessee and the lessor’s residual value and profit or loss would only be recognized at commencement if it is reasonably assured. It is anticipated that the final standard would have an effective date no earlier than 2017. When and if the proposed guidance becomes effective, it may have a significant impact on the Company’s consolidated financial statements.
In April 2014, the FASB issued ASU 2014-08, “Reporting Discontinued Operations and Disclosures of Disposals of Components of an Entity,” which changes the criteria for determining which disposals can be presented as discontinued operations and modifies related disclosure requirements. Under the new guidance, a discontinued operation is defined as a disposal of a component or group of components that is disposed of or is classified as held for sale and represents a strategic shift that has (or will have) a major effect on an entity’s operations and financial results. The standard states that a strategic shift should include a disposal of (i) major geographical area of operations, (ii) a major line of business, (iii) a major equity method investment, or (iv) other major parts of an entity. ASU 2014-08 is effective prospectively for new disposals (or classifications as held for sale) that occur within annual periods beginning on or after December 14, 2014, and interim periods within those annual periods. The Company is currently evaluating the impact of adopting this new guidance on the consolidated financial statements.
In May 2014, the FASB issued an ASU 2014-09, “Revenue from Contracts with Customers (Topic 606),” which provides a single comprehensive model for recognizing revenue from contracts with customers and supersedes existing revenue recognition guidance. The new standard requires that a company recognize revenue when it transfers promised goods or services to customers in an amount that reflects the consideration the company expects to receive in exchange for those goods or services. Companies will need to use more judgment and estimates than under the guidance currently in effect, including estimating the amount of variable revenue to recognize over each identified performance obligation. Additional disclosures will be required to help users of financial statements understand the nature, amount and timing of revenue and cash flows arising from contracts. The new standard will become effective for the Company beginning with the first quarter 2017 and early adoption is not permitted. The Company is currently evaluating the impact of adopting this new guidance on its consolidated financial statements.
In February 2015, the FASB issued ASU 2015-02, “Amendments to the Consolidation Analysis” (“ASU 2015-02”). ASU 2015-02 amends the consolidation guidance for VIEs and general partners’ investments in limited partnerships and modifies the evaluation of whether limited partnerships and similar legal entities are VIEs or voting interest entities. ASU 2015-02 is effective for interim and annual reporting periods beginning after December 15, 2015, with early adoption permitted. The Company is currently evaluating the impact of adopting this new guidance on the consolidated financial statements.
F-19
Table of Contents
FORTRESS TRANSPORTATION AND INFRASTRUCTURE INVESTORS LLC
NOTES TO CONSOLIDATED FINANCIAL STATEMENTS
(Dollar amounts in thousands, unless otherwise noted)
| 3. | ACQUISITIONS |
CMQR
The Company, through its subsidiaries, acquired certain assets and assumed certain liabilities of Montreal, Maine and Atlantic Railway Ltd. (“MM&A—U.S.”) and Montreal, Maine and Atlantic Canada Co (“MM&A—Canada”) for an aggregate purchase price of approximately $15.2 million, including assumed liabilities of approximately $3.2 million. The acquisitions were accounted for as business combinations pursuant to ASC 805 and the results of operations of the acquired businesses of MM&A—U.S. and MM&A—Canada have been included in the consolidated financial statements of the Company since their respective dates of acquisition. The closing of MM&A—U.S. and MM&A—Canada occurred on May 15, 2014 and June 30, 2014, respectively. Subsequent to the acquisitions, the acquired businesses were renamed as the Central Maine and Quebec Railway (“CMQR”). CMQR is headquartered in Maine, employs approximately 110 employees, and owns and operates approximately 500 miles of track in the US and Canada. CMQR is reported within the Railroad segment.
MM&A—U.S. and MM&A—Canada previously operated an integrated, international short-line freight railroad system in Maine, Vermont and Quebec, Canada and since mid-2013, had been operating under the respective bankruptcy protections in the US and Canada. Its assets were sold at auction to the Company, as supervised by the respective judicial courts in the U.S. and Canada. The Company viewed the acquisitions of MM&A—U.S. and MM&A—Canada as an opportunity to gain entry into the railroad industry.
The Company’s acquisition accounting for CMQR is still preliminary, pending the finalization of estimates used in the determination of fair values of fixed assets, environmental liabilities, and accrued expenses, as well as physical inspection of fixed assets. Subsequent to the acquisition, measurement period adjustments as of the acquisition date were made to the valuation of fixed assets acquired and employee and environmental liabilities assumed consisting of an increase to fixed assets of $679, an increase to assumed employee liabilities of $232, an increase to assumed environmental liabilities of $680, and additional goodwill recorded of $233. The measurement period adjustments impacted depreciation expense by $30.
The property, plant and equipment acquired in connection with CMQR is being depreciated based on estimated remaining useful lives from the date of acquisition, which are 4 years for buildings, 2-5 years for track and track related assets, 4-6 years for railroad equipment, 2 years for vehicles and 5 years for freight cars and locomotives, as all of the acquired assets were near the end of their useful lives at the time of acquisition.
In connection with the purchase, the Company incurred transaction related costs of approximately $5,646, included within Acquisition and Transaction expenses, and general and administrative expenses and employee severance expenses of approximately $392, included within Operating Expenses, in the Consolidated Statement of Income for the year ended December 31, 2014. The goodwill recognized is comprised primarily of an assembled workforce and is expected to be deductible for tax purposes.
JEFFERSON TERMINAL
The Company, through its subsidiaries, acquired certain assets and assumed certain liabilities of Jefferson Refinery, LLC, Port of Beaumont Petroleum Transload Terminal I, LLC, and Port of Beaumont Petroleum Transload Terminal II, LLC (collectively “Jefferson Terminal”). Jefferson Terminal is comprised of complementary energy logistics assets and is headquartered in The Woodlands, Texas. Its principal operations are to engage in the business of terminalling, storage, throughput and transloading of crude oil and petroleum products. Prior to the acquisition, a subsidiary of the Company had several term loan
F-20
Table of Contents
FORTRESS TRANSPORTATION AND INFRASTRUCTURE INVESTORS LLC
NOTES TO CONSOLIDATED FINANCIAL STATEMENTS
(Dollar amounts in thousands, unless otherwise noted)
agreements with Jefferson Refinery, LLC (“Pre-Existing Debt Relationships”) of $97.6 million. The acquisition of Jefferson was consummated on August 27, 2014. The Company viewed the acquisition of Jefferson Terminal as an opportunity to gain entry into this industry.
Jefferson Terminal was purchased for an aggregate purchase price of approximately $607.8 million, including assumed liabilities of $522.0 million (of which $97.6 million relates to Pre-Existing Debt Relationships) and equity consideration of $38.2 million. The Company owns a 60% interest in Jefferson Terminal. The remaining 40% interest in Jefferson Terminal is owned by a portion of the retaining shareholders and a private equity fund sponsored by Fortress, each holding an interest of 20% and accounted for as non-controlling interests in the accompanying consolidated financial statements. In connection with the acquisition, a $100 million loan was also obtained (Note 9).
The acquisition was accounted for as a business combination under ASC 805 and the results of operations of the acquired business of Jefferson Terminal have been included in the consolidated financial statements since the date of acquisition. In connection with the purchase, the Company incurred transaction related costs of approximately $5,494, included within Acquisition and Transaction expenses, in the Consolidated Statement of Income for the year ended December 31, 2014. The Company’s acquisition accounting for Jefferson Terminal is still preliminary, pending the final determination of certain estimated amounts for property, plant and equipment, construction in progress, and accrued liabilities. The goodwill recognized is attributable to strategic opportunities and expected future cash flows of the business and is expected to be deductible for tax purposes. Property, plant and equipment acquired in connection with Jefferson Terminal is being depreciated based on estimated remaining useful lives from the date of acquisition.
The fair values assigned to acquired assets and assumed liabilities of CMQR and Jefferson Terminal at their respective dates of acquisition are as follows:
| CMQR | Jefferson Terminal |
|||||||
| Assets: |
||||||||
| Restricted cash |
$ | — | $ | 190,811 | ||||
| Land and improvements |
5,484 | 9,573 | ||||||
| Track |
4,952 | — | ||||||
| Buildings and improvements |
136 | 2,139 | ||||||
| Crude oil terminal machinery and equipment |
— | 47,286 | ||||||
| Railroad Equipment |
713 | — | ||||||
| Furniture and fixtures |
— | 317 | ||||||
| Computer hardware and software |
— | 34 | ||||||
| Turnout and other track materials |
1,415 | — | ||||||
| Vehicles |
320 | 258 | ||||||
| Railcars and locomotives |
1,283 | — | ||||||
| Construction in progress |
— | 86,223 | ||||||
| Prepaids and other deposits |
103 | 6,102 | ||||||
| Tendered bonds |
— | 115,000 | ||||||
| Customer lists and customer contracts |
225 | 35,385 | ||||||
| Goodwill |
593 | 114,633 | ||||||
|
|
|
|
|
|||||
| Total assets |
15,224 | 607,761 | ||||||
|
|
|
|
|
|||||
F-21
Table of Contents
FORTRESS TRANSPORTATION AND INFRASTRUCTURE INVESTORS LLC
NOTES TO CONSOLIDATED FINANCIAL STATEMENTS
(Dollar amounts in thousands, unless otherwise noted)
| CMQR | Jefferson Terminal |
|||||||
| Liabilities: |
||||||||
| Employee-related liabilities |
(1,119 | ) | — | |||||
| Environmental remediation liabilities |
(1,333 | ) | — | |||||
| Real estate taxes |
(714 | ) | — | |||||
| Accrued expenses |
— | (56,150 | ) | |||||
| Term loan |
— | (93,995 | ) | |||||
| Bonds Payable |
— | (348,788 | ) | |||||
| Note Payable |
— | (21,297 | ) | |||||
| Other liabilities |
— | (1,753 | ) | |||||
|
|
|
|
|
|||||
| Total liabilities |
(3,166 | ) | (521,983 | ) | ||||
|
|
|
|
|
|||||
| Net assets acquired |
$ | 12,058 | $ | 85,778 | ||||
|
|
|
|
|
|||||
During the year ended December 31, 2014, goodwill additions of $593 and $114,633 were attributed to the Railroad and Jefferson Terminal reportable segments, respectively.
In accordance with ASC 805, the acquired assets and assumed liabilities were recorded at their estimated fair values at the acquisition dates. During the measurement period, additional assets or liabilities may be recognized if new information is obtained about facts and circumstances that existed as of the acquisition date that, if known, would have resulted in the recognition of those assets or liabilities as of that date. The preliminary measurement of net assets acquired may be adjusted after obtaining additional information regarding, among other things, asset valuations (including market and other information with which to determine fair values), liabilities assumed, the analysis of assumed contracts, and revisions of previous estimates. These adjustments may be significant and will be accounted for retrospectively.
The preliminary fair values assigned to intangible assets were determined through the use of the replacement cost method and the income approach, specifically the multi-period excess earnings method. Both valuation methods rely on management’s judgments, including the cost to recreate the customer relationships, expected future cash flows resulting from existing customer relationships, customer attrition rates, contributory effects of other assets utilized in the business, and peer group cost of capital as well as other factors. The valuation of tangible assets was derived using a combination of the income approach, the market approach and the cost approach. Significant judgments used in valuing tangible assets include estimated reproduction or replacement cost, useful lives of assets and estimated selling prices. The valuation of assumed liabilities, including bonds payable, was derived using the market approach, using quoted values as available and the income approach, comparing the stated interest rate on certain credit agreements to the market interest rate. The valuation of equity interests conveyed to retaining shareholders was derived using the market approach, as agreed between the parties, representing the cash that would have been offered on an arm’s length basis, on the acquisition date.
Supplementary Pro Forma Information—The unaudited pro forma information has been derived from our historical consolidated financial statements and has been prepared to give effect to the acquisitions, assuming that the acquisitions of CMQR and Jefferson Terminal occurred on January 1, 2013. The unaudited pro forma pre-tax net income (loss) for the years ended December 31, 2014 and 2013 has been adjusted to reflect the additional depreciation and amortization that would have resulted from changes in the estimated fair value of assets and liabilities.
F-22
Table of Contents
FORTRESS TRANSPORTATION AND INFRASTRUCTURE INVESTORS LLC
NOTES TO CONSOLIDATED FINANCIAL STATEMENTS
(Dollar amounts in thousands, unless otherwise noted)
| Year ended December 31, 2014 |
Year ended December 31, 2013 |
|||||||
| Pro Forma—CMQR |
||||||||
| Revenues |
$ | 63,528 | $ | 46,100 | ||||
| Pre-tax net income (loss) |
1,497 | (20,830 | ) | |||||
| Pro Forma—Jefferson Terminal |
||||||||
| Revenues |
$ | 60,577 | $ | 19,530 | ||||
| Pre-tax net income (loss) |
(46,906 | ) | (1,543 | ) | ||||
The pro forma combined financial information is based on the Company’s preliminary allocation of purchase price. Pro forma results do not include any anticipated synergies or other anticipated benefits of the acquisition. Accordingly, the unaudited pro forma financial information is not necessarily indicative or either future results of operations or results that might have been achieved had the acquisition occurred on January 1, 2013.
During the year ended December 31, 2014, for CMQR and Jefferson Terminal, the Company recognized $9,969 and $2,652, respectively, in revenues and $11,957 and $15,768, respectively, of loss before income taxes, which includes acquisition and transaction related expenses of $5,646 and $5,494, respectively.
| 4. | LEASING EQUIPMENT |
The following is a summary of leasing equipment recorded on the Consolidated Balance Sheets:
| December 31, 2014 | ||||||||||||||||
| Aviation Leasing |
Offshore Energy |
Jefferson Terminal |
Total | |||||||||||||
| Equipment |
||||||||||||||||
| Leasing equipment: |
$ | 298,204 | $ | 182,355 | $ | 44,326 | $ | 524,885 | ||||||||
| Less: Accumulated depreciation |
(11,331 | ) | (3,737 | ) | (438 | ) | (15,506 | ) | ||||||||
|
|
|
|
|
|
|
|
|
|||||||||
| Leasing equipment, net |
$ | 286,873 | $ | 178,618 | $ | 43,888 | $ | 509,379 | ||||||||
|
|
|
|
|
|
|
|
|
|||||||||
| December 31, 2013 | ||||||||||||
| Aviation Leasing |
Offshore Energy |
Total | ||||||||||
| Equipment |
||||||||||||
| Leasing equipment: |
$ | 68,606 | $ | 43,073 | $ | 111,679 | ||||||
| Less: Accumulated depreciation |
(3,722 | ) | (937 | ) | (4,659 | ) | ||||||
|
|
|
|
|
|
|
|||||||
| Leasing equipment, net |
$ | 64,884 | $ | 42,136 | $ | 107,020 | ||||||
|
|
|
|
|
|
|
|||||||
During the year ended December 31, 2014, the Company acquired fourteen aircraft, nine aircraft engines, and three hundred tank railcars; and sold five aircraft engines, and two aircraft. During the year ended December 31, 2013, the Company acquired seventeen aircraft engines; and sold five aircraft engines and three airframes.
Depreciation expense for leasing equipment for the years ended December 31, 2014 and 2013 was $12,683 and $3,909, respectively.
F-23
Table of Contents
FORTRESS TRANSPORTATION AND INFRASTRUCTURE INVESTORS LLC
NOTES TO CONSOLIDATED FINANCIAL STATEMENTS
(Dollar amounts in thousands, unless otherwise noted)
| 5. | FINANCE LEASES |
Finance leases are summarized as follows:
| December 31, 2014 | ||||||||||||
| Offshore Energy |
Shipping Containers |
Total | ||||||||||
| Finance leases |
$ | 22,045 | $ | 109,492 | $ | 131,537 | ||||||
| Unearned revenue |
(11,580 | ) | (17,144 | ) | (28,724 | ) | ||||||
|
|
|
|
|
|
|
|||||||
| Finance leases, net |
$ | 10,465 | $ | 92,348 | $ | 102,813 | ||||||
|
|
|
|
|
|
|
|||||||
| December 31, 2013 | ||||||||||||||||
| Aviation Leasing |
Offshore Energy |
Shipping Containers |
Total | |||||||||||||
| Finance leases |
$ | 744 | $ | 24,050 | $ | 128,778 | $ | 153,572 | ||||||||
| Unearned revenue |
(29 | ) | (13,295 | ) | (25,478 | ) | (38,802 | ) | ||||||||
|
|
|
|
|
|
|
|
|
|||||||||
| Finance leases, net |
$ | 715 | $ | 10,755 | $ | 103,300 | $ | 114,770 | ||||||||
|
|
|
|
|
|
|
|
|
|||||||||
At December 31, 2014, future minimum lease payments to be received under finance leases for the remainder of the lease terms are as follows:
| Offshore Energy |
Shipping Containers |
Total | ||||||||||
| 2015 |
$ | 2,008 | $ | 27,138 | $ | 29,146 | ||||||
| 2016 |
2,013 | 25,702 | 27,715 | |||||||||
| 2017 |
2,008 | 51,308 | 53,316 | |||||||||
| 2018 |
2,008 | 5,344 | 7,352 | |||||||||
| 2019 |
2,008 | — | 2,008 | |||||||||
| Thereafter |
12,000 | — | 12,000 | |||||||||
|
|
|
|
|
|
|
|||||||
| Total |
$ | 22,045 | $ | 109,492 | $ | 131,537 | ||||||
|
|
|
|
|
|
|
|||||||
| 6. | PROPERTY, PLANT AND EQUIPMENT |
Property, plant and equipment consists of the following:
| December 31, 2014 | ||||||||||||
| Railroad | Jefferson Terminal |
Total | ||||||||||
| Land and improvements |
$ | 5,484 | $ | 9,573 | $ | 15,057 | ||||||
| Buildings and Improvements |
470 | 2,139 | 2,609 | |||||||||
| Crude oil terminal machinery and equipment |
50,627 | 50,627 | ||||||||||
| Track and track related assets |
11,988 | — | 11,988 | |||||||||
| Railroad equipment |
1,268 | — | 1,268 | |||||||||
| Computer hardware and software |
— | 34 | 34 | |||||||||
| Furniture and fixtures |
— | 317 | 317 | |||||||||
| Vehicles |
321 | 258 | 579 | |||||||||
| Construction in progress |
— | 146,663 | 146,663 | |||||||||
| Railcars and locomotives |
1,293 | — | 1,293 | |||||||||
|
|
|
|
|
|
|
|||||||
| 20,824 | 209,611 | 230,435 | ||||||||||
| Less: accumulated depreciation |
(962 | ) | (1,145 | ) | (2,107 | ) | ||||||
|
|
|
|
|
|
|
|||||||
| Property, plant and equipment, net |
$ | 19,862 | $ | 208,466 | $ | 228,328 | ||||||
|
|
|
|
|
|
|
|||||||
F-24
Table of Contents
FORTRESS TRANSPORTATION AND INFRASTRUCTURE INVESTORS LLC
NOTES TO CONSOLIDATED FINANCIAL STATEMENTS
(Dollar amounts in thousands, unless otherwise noted)
Property, plant and equipment acquired during the year ended December 31, 2014 was $14,303 and $145,830 in connection with the acquisitions of CMQR and Jefferson Terminal (Note 3), respectively. During the year ending December 31, 2014, additional property, plant and equipment of $70,302 was acquired, and is included within construction in progress and track and track related assets. Depreciation expense for property, plant and equipment was $2,107 for the year ended December 31, 2014.
| 7. | INVESTMENTS IN UNCONSOLIDATED ENTITIES |
The following table presents the ownership interest and carrying values of the Company’s investments in unconsolidated entities:
| Carrying Value | ||||||||||||||
| December 31, | ||||||||||||||
| Date Acquired | Ownership Percentage |
2014 | 2013 | |||||||||||
| PJW 3000 LLC |
April 2012 | 16.67 | % | $ | — | $ | — | |||||||
| Intermodal Finance I, Ltd |
September 2012 | 51 | % | 21,569 | 32,744 | |||||||||
|
|
|
|
|
|||||||||||
| $ | 21,569 | $ | 32,744 | |||||||||||
|
|
|
|
|
|||||||||||
PJW 3000 LLC
On April 26, 2012, the Company acquired a non-controlling 16.67% interest in PJW 3000 LLC from a third party for a total purchase price, including acquisition costs, of approximately $19,635. The Company exercised significant influence over PJW 3000 LLC through its representation on the entity’s board of managers. PJW 3000 LLC owned an offshore derrick pipe laying barge which was subject to a long-term net lease. At the time of acquisition, the price paid by the Company exceeded its proportionate share of the net equity of PJW 3000 LLC by approximately $3,000; this premium was amortized on a straight line basis over the 28.5 year estimated remaining useful life of the vessel. On November 26, 2013, the Company sold its interest in PJW 3000 LLC for a sales price of $26,500 (consisting of $22,000 in cash and a $4,500 one-year note receivable supported by an unconditional bank guarantee, which is included as a component of other assets in the accompanying Consolidated Balance Sheet at December 31, 2013) and recognized a gain of approximately $6,144. The note receivable was settled on November 17, 2014.
For 2013, the Company has reflected summary statement of income data for PJW 3000 LLC through November 26, 2013, the date the Company sold its interest in PJW 3000 LLC.
Intermodal Finance I, Ltd
On September 5, 2012, the Company contributed approximately $21,400 (consisting of an equity component of $8,600 and a shareholder loan component of $12,800) for a 51% non-controlling interest in Intermodal Finance I, Ltd., a newly formed joint venture which then acquired a portfolio of 28 finance leases, representing 10 customers and comprising approximately 97,500 shipping containers, for a net purchase price of approximately $165,150. Operating control of Intermodal Finance I, Ltd. is shared with the other joint venture partner which owns a 49% interest in the entity. At the date of acquisition, the finance leases had remaining terms ranging from 5 months to 5.33 years and had remaining outstanding balances aggregating approximately $202,800, of which four of the finance leases were subject to non-recourse syndication liabilities to third parties having aggregate outstanding balances of approximately
F-25
Table of Contents
FORTRESS TRANSPORTATION AND INFRASTRUCTURE INVESTORS LLC
NOTES TO CONSOLIDATED FINANCIAL STATEMENTS
(Dollar amounts in thousands, unless otherwise noted)
$21,840. In accordance with ASC 805-50, Intermodal Finance I, Ltd. allocated the purchase price to the acquired assets and assumed liabilities based upon their relative fair values. In December 2012, the Company contributed an additional amount of approximately $13,800 (consisting of an equity component of approximately $6,100 and a shareholder loan component of approximately $7,700) to Intermodal Finance I, Ltd. in connection with the acquisition of a portfolio of approximately 38,000 shipping containers from a third party which were simultaneously leased back to seller pursuant to nine operating leases.
Summary financial information for these unconsolidated entities is as follows:
Statement of Income
| Year Ended December 31, | ||||||||
| 2014 | 2013 | |||||||
| Revenues |
||||||||
| Total revenues |
$ | 20,331 | $ | 56,480 | ||||
|
|
|
|
|
|||||
| Expenses |
||||||||
| Operating Expenses |
1,527 | 6,055 | ||||||
| General and administrative |
807 | 1,157 | ||||||
| Depreciation and amortization |
2,416 | 8,157 | ||||||
| Interest expense |
5,022 | 11,075 | ||||||
| Loss on debt extinguishment |
119 | — | ||||||
|
|
|
|
|
|||||
| Total expenses |
9,891 | 26,444 | ||||||
|
|
|
|
|
|||||
| Other income |
||||||||
| Gain on early termination of finance lease |
917 | 1,052 | ||||||
| Other income |
45 | 45 | ||||||
|
|
|
|
|
|||||
| Total other income |
962 | 1,097 | ||||||
|
|
|
|
|
|||||
| Net income |
11,402 | 31,133 | ||||||
| Other comprehensive income |
— | 431 | ||||||
|
|
|
|
|
|||||
| Comprehensive income |
$ | 11,402 | $ | 31,564 | ||||
|
|
|
|
|
|||||
| Company’s equity in earnings, net of amortization of $0 and $95, respectively |
$ | 6,093 | $ | 10,325 | ||||
|
|
|
|
|
|||||
F-26
Table of Contents
FORTRESS TRANSPORTATION AND INFRASTRUCTURE INVESTORS LLC
NOTES TO CONSOLIDATED FINANCIAL STATEMENTS
(Dollar amounts in thousands, unless otherwise noted)
Balance Sheet
| December 31, | ||||||||
| 2014 | 2013 | |||||||
| Assets |
||||||||
| Cash and cash equivalents |
$ | 5,214 | $ | 4,653 | ||||
| Restricted cash |
2,320 | 3,435 | ||||||
| Accounts receivable |
1,051 | 784 | ||||||
| Leasing assets, net of accumulated depreciation of $4,449 and $2,281, respectively |
74,045 | 76,214 | ||||||
| Finance leases, net |
62,393 | 121,893 | ||||||
| Deferred costs, net of accumulated amortization of $602 and $325, respectively |
1,524 | 1,505 | ||||||
| Other assets |
8 | 543 | ||||||
|
|
|
|
|
|||||
| Total assets |
$ | 146,555 | $ | 209,027 | ||||
|
|
|
|
|
|||||
| Liabilities |
||||||||
| Accounts payable and accrued liabilities |
$ | 141 | $ | 172 | ||||
| Syndication liabilities |
5,152 | 9,761 | ||||||
| Debt |
120,303 | 165,262 | ||||||
| Other Liabilities |
399 | — | ||||||
|
|
|
|
|
|||||
| Total liabilities |
125,995 | 175,195 | ||||||
|
|
|
|
|
|||||
| Members’ Equity |
||||||||
| Members’ equity |
20,560 | 33,832 | ||||||
|
|
|
|
|
|||||
| Total members’ equity |
20,560 | 33,832 | ||||||
|
|
|
|
|
|||||
| Total liabilities and members’ equity |
$ | 146,555 | $ | 209,027 | ||||
|
|
|
|
|
|||||
| Company’s investment in and advances to unconsolidated entities |
$ | 21,569 | $ | 32,744 | ||||
|
|
|
|
|
|||||
| 8. | INTANGIBLE ASSETS AND LIABILITIES |
The Company’s intangible assets and liabilities are summarized as follows:
| December 31, 2014 | ||||||||||||||||
| Aviation Leasing |
Jefferson Terminal |
Railroad | Total | |||||||||||||
| Intangible assets: |
||||||||||||||||
| Acquired favorable lease intangibles |
$ | 20,435 | $ | — | $ | — | $ | 20,435 | ||||||||
| Accumulated amortization |
(2,796 | ) | — | — | (2,796 | ) | ||||||||||
|
|
|
|
|
|
|
|
|
|||||||||
| Total acquired favorable lease intangibles, net |
17,639 | — | — | 17,639 | ||||||||||||
|
|
|
|
|
|
|
|
|
|||||||||
| Customer relationships |
— | 35,385 | 225 | 35,610 | ||||||||||||
| Accumulated amortization |
— | (1,180 | ) | (28 | ) | (1,208 | ) | |||||||||
|
|
|
|
|
|
|
|
|
|||||||||
| Total acquired customer relationships, net |
— | 34,205 | 197 | 34,402 | ||||||||||||
|
|
|
|
|
|
|
|
|
|||||||||
| Total intangible assets, net |
$ | 17,639 | $ | 34,205 | $ | 197 | $ | 52,041 | ||||||||
|
|
|
|
|
|
|
|
|
|||||||||
F-27
Table of Contents
FORTRESS TRANSPORTATION AND INFRASTRUCTURE INVESTORS LLC
NOTES TO CONSOLIDATED FINANCIAL STATEMENTS
(Dollar amounts in thousands, unless otherwise noted)
| December 31, 2014 | ||||||||||||||||
| Aviation Leasing |
Jefferson Terminal |
Railroad | Total | |||||||||||||
| Intangible liabilities: |
||||||||||||||||
| Acquired unfavorable lease intangibles |
$ | 261 | $ | — | $ | — | $ | 261 | ||||||||
| Accumulated amortization |
(24 | ) | — | — | (24 | ) | ||||||||||
|
|
|
|
|
|
|
|
|
|||||||||
| Total acquired unfavorable lease intangibles, net |
$ | 237 | $ | — | $ | — | $ | 237 | ||||||||
|
|
|
|
|
|
|
|
|
|||||||||
Intangible liabilities relate to unfavorable lease intangibles and are included as a component of other liabilities in the accompanying Consolidated Balance Sheet. Amortization of intangibles for the years ended December 31, 2014 and 2013 was $3,902 and $0, respectively. Amortization of lease intangibles, of $2,694 and $0 for the years ended December 31, 2014 and 2013, respectively, is included as a component of equipment leasing revenue in the Consolidated Statement of Income. Amortization of customer relationships of $1,208 and $0 for the years ended December 31, 2014 and 2013, respectively, is included in depreciation and amortization in the Consolidated Statement of Income. As of December 31, 2014, estimated net annual amortization of intangibles is as follows:
| December 31, 2014 | ||||
| 2015 |
$ | 9,969 | ||
| 2016 |
8,093 | |||
| 2017 |
6,491 | |||
| 2018 |
6,142 | |||
| 2019 |
4,574 | |||
| Thereafter |
16,535 | |||
|
|
|
|||
| Total |
$ | 51,804 | ||
|
|
|
|||
| 9. | DEBT |
The Company’s debt at December 31, 2014 and 2013 is summarized as follows:
| December 31, | ||||||||
| 2014 | 2013 | |||||||
| Loans payable |
||||||||
| Container Loan #1 |
$ | 42,040 | $ | 49,319 | ||||
| Container Loan #2 |
19,115 | 21,079 | ||||||
| FTAI Pride Credit Agreement |
73,438 | — | ||||||
| CMQR Credit Agreement |
9,416 | |||||||
| Jefferson Credit Agreement |
99,750 | — | ||||||
|
|
|
|
|
|||||
| Total loans payable |
243,759 | 70,398 | ||||||
| Bonds payable |
||||||||
| Series 2010 Bonds |
298,000 | — | ||||||
| Series 2012 Bonds (including unamortized premium of $1,791 in 2014) |
48,521 | — | ||||||
|
|
|
|
|
|||||
| Total bonds payable |
346,521 | — | ||||||
F-28
Table of Contents
FORTRESS TRANSPORTATION AND INFRASTRUCTURE INVESTORS LLC
NOTES TO CONSOLIDATED FINANCIAL STATEMENTS
(Dollar amounts in thousands, unless otherwise noted)
| December 31, | ||||||||
| 2014 | 2013 | |||||||
| Note payable to non-controlling interest |
||||||||
| Note payable to non-controlling interest |
$ | 2,587 | $ | 2,990 | ||||
|
|
|
|
|
|||||
| Total note payable to non-controlling interest |
2,587 | 2,990 | ||||||
|
|
|
|
|
|||||
| Total debt |
$ | 592,867 | $ | 73,388 | ||||
|
|
|
|
|
|||||
| Total debt due within one year |
$ | 23,915 | $ | 9,647 | ||||
|
|
|
|
|
|||||
Loans Payable
Container Loan #1—On December 27, 2012, a subsidiary of the Company entered into a Credit Agreement (“Container Loan #1”) with a bank for an initial aggregate amount of approximately $55,991 in connection with the acquisition of a portfolio of shipping containers subject to finance leases. Borrowings under the loan bear interest at a rate selected by the Company of either (i) a LIBOR based rate plus a spread of 3.75% or (ii) a Base Rate equal to the higher of the Prime Rate or the Federal Funds Rate plus 1.50%, plus a spread of 3.75%. At December 31, 2014 and December 31, 2013 borrowings under the loan were LIBOR based borrowings bearing interest at a rate of 3.90% and 3.92%, respectively. Container Loan #1 requires monthly payments of interest and scheduled principal payments through its maturity on December 27, 2017 and can be prepaid without penalty after the third anniversary of the closing of the loan. Container Loan #1 is secured by the Company’s interest in the shipping containers and related finance leases. Interest expense for the years ended December 31, 2014 and December 31, 2013 was approximately $1,979 and $2,284, respectively, and the average interest rate was 4.00% and 4.34%, respectively, inclusive of the effect of an interest rate swap (see below).
Pursuant to the Container Loan #1 agreement, amounts realized by the Company in connection with the finance lease are remitted directly into a trust account as restricted cash for disbursement according to specified payment priorities. Any amounts remaining in the trust account after payment of required obligations are released to the Company. As of December 31, 2014, the Company was in compliance with all of the covenants under this agreement.
In connection with Container Loan #1, the Company entered into an interest rate swap agreement (the “Swap”) on January 17, 2013 with respect to 70% of the outstanding balance of the Loan and designated as a cash flow hedge which fixed the LIBOR rate at 0.681%. The initial notional amount of the Swap was approximately $39,194, with scheduled monthly decreases through the maturity date of the Container Loan #1. The fair value of the Swap at December 31, 2014 and December 31, 2013 was $214 and $328, respectively. Periodic settlement payments made in connection with the Swap during the years ended December 31, 2014 and December 31, 2013 of approximately $171 and $175, respectively, were recorded as a component of interest expense in the accompanying Consolidated Statement of Income.
Container Loan #2—On August 15, 2013, a subsidiary of the Company entered into a Credit Agreement (“Container Loan #2”) with a bank for an initial aggregate amount of approximately $21,548 in connection with the acquisition of a portfolio of shipping containers subject to finance leases. Borrowings under Container Loan #2 bear interest at a rate of LIBOR plus a spread of 3.25%. At both December 31, 2014 and December 31, 2013, borrowings under Container Loan #2 bore interest at a rate of 3.49%. Container Loan #2 requires quarterly payments of interest and scheduled principal payments through its maturity on August 28, 2018 and can be prepaid without penalty at any time. Container Loan #2 is secured by the Company’s interest in the shipping containers and related finance leases. Interest expense on Container
F-29
Table of Contents
FORTRESS TRANSPORTATION AND INFRASTRUCTURE INVESTORS LLC
NOTES TO CONSOLIDATED FINANCIAL STATEMENTS
(Dollar amounts in thousands, unless otherwise noted)
Loan #2 for the years ended December 31, 2014 and December 31, 2013 was approximately $713 and $289, respectively, and the average interest rate was 3.59% and 3.54%, respectively.
Pursuant to the Container Loan #2 agreement, amounts realized by the Company in connection with the finance leases are remitted directly into a trust account for disbursement according to specified payment priorities. Any amounts remaining in the trust account after payment of required obligations are released to the Company. As of December 31, 2014, the Company was in compliance with all of the covenants under this agreement.
In connection with Container Loan #2, on September 20, 2013, the Company entered into an interest rate cap agreement (the “Cap”), which was not designated as a cash flow hedge, with an initial payment date of February 28, 2014. The Cap was acquired at an initial cost of approximately $57 (inclusive of an up-front origination fee of approximately $14) and capped LIBOR at 2.5% with respect to 50% of the portion of the outstanding balance of Container Loan #2 attributable to the 5-year finance leases. The initial notional amount of the Cap was approximately $2,554, with scheduled quarterly decreases through the August 28, 2018 maturity date of the Loan. The fair value of the Cap at December 31, 2014 and December 31, 2013 was approximately $18 and $43, respectively.
FTAI Pride Credit Agreement—On September 15, 2014, FTAI Pride, LLC, (“FTAI Pride”) a subsidiary of the Company entered into a credit agreement (the “FTAI Pride Credit Agreement”) with a financial institution for a term loan in an aggregate amount of $75,000. The loan proceeds were used in connection with the acquisition of an offshore construction vessel. Borrowings under the FTAI Pride Credit Agreement bear interest at the LIBOR rate plus a spread of 4.50%. At December 31, 2014, borrowings under the FTAI Pride Credit Agreement bore interest at a rate of 4.74% and interest expense for the year ended December 31, 2014 was approximately $1,043.
The FTAI Pride Credit Agreement requires quarterly payments of interest and scheduled principal payments of $1,562 beginning in the quarter ending December 31, 2014, through its maturity and can be prepaid without penalty at any time. At December 31, 2014, the outstanding principal amount of indebtedness under the FTAI Pride Credit Agreement was approximately $73,438.
The FTAI Pride Credit Agreement is secured on a first priority basis by the offshore construction vessel and charter. The FTAI Pride Credit Agreement contains affirmative and negative covenants which limit certain actions of the borrower and a financial covenant requiring a Fixed Charges Coverage Ratio, as defined, of not less than 1.15:1.00 in any twelve month period ending December 31, 2014, or later. At December 31, 2014, the Company was in compliance with all the covenants under the FTAI Pride Credit Agreement.
CMQR Credit Agreement—On September 18, 2014, CMQR entered into a credit agreement (the “CMQR Credit Agreement”) with a financial institution for a revolving line of credit in an aggregate amount of $10,000. Borrowings under the CMQR Credit Agreement bear interest at either (i) Adjusted LIBOR plus a spread of 2.50% or 4.50%, (ii) the U.S. or Canadian Base Rate plus a spread of 1.50% or 3.50%, or (iii) the Canadian Fixed Rate plus a spread of 2.50% or 4.50%, as each of those terms is defined by the CMQR Credit Agreement. The maturity date of the CMQR Credit Agreement is September 18, 2017. Borrowings under the CMQR Credit Agreement bore interest at an average rate of 2.95% at December 31, 2014, and interest expense for the year ended December 31, 2014 was approximately $102.
The CMQR Credit Agreement requires quarterly payments of interest. At December 31, 2014, outstanding principal indebtedness under the CMQR Credit Agreement was approximately $9,416.
The CMQR Credit Agreement is also indirectly supported by the Onshore and Offshore Funds (the “Sponsors”). In the event of a default under the credit agreement, CMQR’s lenders can cause CMQR to call up to $20 million (subject to reduction of such amount to take into account capital contributions to CMQR)
F-30
Table of Contents
FORTRESS TRANSPORTATION AND INFRASTRUCTURE INVESTORS LLC
NOTES TO CONSOLIDATED FINANCIAL STATEMENTS
(Dollar amounts in thousands, unless otherwise noted)
in capital from the Sponsors, and in the event of CMQR’s bankruptcy, the lenders can put the debt back to the Sponsors. The CMQR Credit Agreement contains affirmative and negative covenants which limit certain actions of CMQR and a financial covenant requiring a Fixed Charge Coverage Ratio, as defined, of CMQR and its subsidiaries of not less than 1.30:1.00 in any rolling four-quarter period, effective after September 30, 2014. At December 31, 2014, the Company was in compliance with the covenants contained in the CMQR Credit Agreement.
Jefferson Terminal Credit Agreement—On August 27, 2014, a subsidiary of the Company, entered into a credit agreement (the “Jefferson Terminal Credit Agreement”) with a financial institution for an aggregate amount of $100,000. The loan proceeds were used to partially finance the acquisition of Jefferson Terminal (Note 3) as well as to pay certain working capital amounts. Borrowings under the Jefferson Terminal Credit Agreement bear interest, at the Company’s option, at the Adjusted Eurodollar Rate plus a spread of 8.00% or at a Base Rate plus a spread of 7.00%. The Jefferson Terminal Credit Agreement provides for a prepayment premium ranging from 1-3% of the aggregate principal amount prepaid, including repayment at maturity (the “Exit Fee”). The Exit Fee payable at maturity of approximately $2,753 is being recognized ratably over the term of the loan and recorded as a component of interest expense in the Consolidated Statement of Income. At December 31, 2014, borrowings under the Jefferson Terminal Credit Agreement bore interest at a rate of 9.00% and interest expense for the year ending December 31, 2014 was approximately $3,703, of which approximately $3,534 related to capital improvements and was capitalized to Construction in Progress. Interest expense includes $262 of accrued exit fees and $275 of deferred financing fees for the year ending December 31, 2014.
The Jefferson Terminal Credit Agreement requires quarterly payments of $250 beginning with the quarter ending December 31, 2014, with such quarterly payments increasing to $1,250 beginning with the quarter ending December 31, 2016, and may be prepaid or repaid at any time prior to its maturity on February 27, 2018. At December 31, 2014, the outstanding principal amount of indebtedness under the Jefferson Terminal Credit Agreement was approximately $99,750. Accrued exit fees of $262 are classified as a component of accounts payable and accrued liabilities in the Consolidated Balance Sheet.
The Jefferson Terminal Credit Agreement is secured on a first priority basis by substantially all assets of Jefferson Terminal, as defined in the agreement. The Jefferson Terminal Credit Agreement contains affirmative and negative covenants which limit certain actions of the borrowers. In addition, the Jefferson Terminal Credit Agreement contains a financial covenant requiring Consolidated EBITDA, as defined within the agreement, of Jefferson Gulf Coast Energy Holdings, LLC and its subsidiaries to be at least $30,000 in any rolling twelve month period beginning with December 31, 2015. At December 31, 2014, the Company was in compliance with all the covenants under the Jefferson Terminal Credit Agreement.
Bonds Payable
Series 2010 Bonds—On December 1, 2010, Jefferson County Development Corporation issued $300 million of tax-exempt industrial bonds (“Series 2010 Bonds”), which provided tax-exempt financing for businesses, to be used for specific purposes to stimulate the economy of the respective beneficiary counties. The proceeds of this issuance were loaned to Jefferson Terminal, to be held in trust, as restricted cash, to ensure adherence to the restrictions of use of the funds. Use of the proceeds requires approval from a trustee prior to release of funds.
In accordance with the terms of the trust indenture and security agreements, Series 2010 Bonds can be tendered by bondholders and purchased by the Company using the unused restricted cash proceeds. Series 2010 Bonds purchased by the Company are deemed to be owned by the Company, and are classified as assets, tendered bonds, in the Consolidated Balance Sheet with an equal corresponding amount as debt, as
F-31
Table of Contents
FORTRESS TRANSPORTATION AND INFRASTRUCTURE INVESTORS LLC
NOTES TO CONSOLIDATED FINANCIAL STATEMENTS
(Dollar amounts in thousands, unless otherwise noted)
Series 2010 bonds owned by the Company are not deemed extinguished or cancelled. Tendered bonds do not convey principal or interest payments while held by the Company.
During the year ended December 31, 2014, $2,000 of principal was repaid related to the Series 2010 Bonds and the remaining $298,000 of principal was tendered by the bondholders and purchased by the Company utilizing unused restricted cash proceeds. As of December 31, 2014, in the Consolidated Balance Sheet, the Company has $298,000 of Tendered Bonds and an equal corresponding amount in Debt.
The Series 2010 bonds have a stated maturity date of December 1, 2040, bear interest at a rate of 0.6% per year, and the principal amount is due at maturity. Interest expense for the Series 2010 Bonds was approximately $130 for the year ended December 31, 2014. At December 31, 2014, the Company was in compliance with all the covenants under the Series 2010 Bonds.
Series 2012 Bonds—On August 1, 2012, Jefferson County Development Corporation issued $46.9 million of tax-exempt industrial bonds (“Series 2012 Bonds”), to specifically fund construction and operation of an intermodal transfer facility for crude oil and refined petroleum products. The proceeds of this issuance were loaned to Jefferson Terminal, to be held in trust, as restricted cash, to ensure adherence to the restrictions of use of the funds. Use of the proceeds requires approval from a trustee prior to release of funds.
In connection with the Company’s acquisition of Jefferson Terminal, the Series 2012 Bonds were recorded at a fair value of $48,554, which represented a premium of $1,823 as compared to their face value at the date of acquisition; such premium is being amortized using the effective interest method over the remaining contractual term of the Series 2012 Bonds. During the year ended December 31, 2014, interest expense on the Series 2012 Bonds was approximately $1,253, inclusive of premium amortization of $32. As of December 31, 2014, $46.7 million of principal of Series 2012 Bonds remained outstanding.
The Series 2012 Bonds have a stated maturity of July 1, 2032, bear interest at 8.25%, and require scheduled principal payments. The principal of the Series 2012 Bonds is payable annually at varying amounts. At December 31, 2014, the Company was in compliance with all the covenants under the Series 2012 Bonds.
Note Payable to Non-Controlling Interest
Note Payable to Non-Controlling Interest—In May 2013, in connection with the capitalization of a consolidated subsidiary, the Company and the owner of the non-controlling interest loaned approximately $18,275 and $3,225, respectively, to the entity in proportion to their respective ownership percentages of 85% and 15%. The loans bear interest at an annual rate of 5% and require monthly payments of principal and interest through their final maturity in May 2021. The loan amount funded by the Company and related interest have been eliminated in consolidation. Interest expense in connection with the loan payable to non-controlling interest during the year ended December 31, 2014 and December 31, 2013 was approximately $138 and $104, respectively.
At December 31, 2014, scheduled principal repayments under the Company’s debt agreements for the next five years and thereafter are summarized as follows:
| 2015 | 2016 | 2017 | 2018 | 2019 | Thereafter | Total | ||||||||||||||||||||||
| Bonds payable (excluding unamortized premium of $1,791 in 2014) |
$ | 1,220 | $ | 1,320 | $ | 1,425 | $ | 1,545 | $ | 1,670 | $ | 337,550 | $ | 344,730 | ||||||||||||||
| Loans payable |
22,292 | 22,914 | 48,600 | 101,515 | 48,438 | — | 243,759 | |||||||||||||||||||||
| Note payable to non-controlling interest |
403 | 403 | 403 | 403 | 403 | 572 | 2,587 | |||||||||||||||||||||
|
|
|
|
|
|
|
|
|
|
|
|
|
|
|
|||||||||||||||
| Total |
$ | 23,915 | $ | 24,637 | $ | 50,428 | $ | 103,463 | $ | 50,511 | $ | 338,122 | $ | 591,076 | ||||||||||||||
|
|
|
|
|
|
|
|
|
|
|
|
|
|
|
|||||||||||||||
F-32
Table of Contents
FORTRESS TRANSPORTATION AND INFRASTRUCTURE INVESTORS LLC
NOTES TO CONSOLIDATED FINANCIAL STATEMENTS
(Dollar amounts in thousands, unless otherwise noted)
| 10. | FAIR VALUE MEASUREMENTS |
Fair value measurements and disclosures require the use of valuation techniques to measure fair value that maximize the use of observable inputs and minimize use of unobservable inputs. These inputs are prioritized as follows:
| • | Level 1: Observable inputs such as quoted prices in active markets for identical assets or liabilities. |
| • | Level 2: Inputs other than quoted prices included within Level 1 that are observable, either directly or indirectly, such as quoted prices for similar assets or liabilities or market corroborated inputs. |
| • | Level 3: Unobservable inputs for which there is little or no market data and which require the Company to develop its own assumptions about how market participants price the asset or liability. |
The valuation techniques that may be used to measure fair value are as follows:
| • | Market approach—Uses prices and other relevant information generated by market transactions involving identical or comparable assets or liabilities. |
| • | Income approach—Uses valuation techniques to convert future amounts to a single present amount based on current market expectations about those future amounts. |
| • | Cost approach—Based on the amount that currently would be required to replace the service capacity of an asset (replacement cost). |
The following tables set forth the Company’s financial assets measured at fair value on a recurring basis as of December 31, 2014 and 2013, by level within the fair value hierarchy. Assets measured at fair value are classified in their entirety based on the lowest level of input that is significant to their fair value measurement.
| Fair Value as of December 31, 2014 |
Fair Value Measurements at December 31, 2014 Using Fair Value Hierarchy |
|||||||||||||||||
| Total | Level 1 | Level 2 | Level 3 | Valuation Technique | ||||||||||||||
| Assets: |
||||||||||||||||||
| Cash and cash equivalents |
$ | 22,125 | $ | 22,125 | $ | — | $ | — | Market | |||||||||
| Restricted cash |
21,084 | 21,084 | — | — | Market | |||||||||||||
| Derivative assets |
232 | — | 232 | — | Income | |||||||||||||
|
|
|
|
|
|
|
|
|
|||||||||||
| Total |
$ | 43,441 | $ | 43,209 | $ | 232 | $ | — | ||||||||||
|
|
|
|
|
|
|
|
|
|||||||||||
| Fair Value as of December 31, 2013 |
Fair Value Measurements at December 31, 2013 Using Fair Value Hierarchy |
|||||||||||||||||
| Total | Level 1 | Level 2 | Level 3 | Valuation Technique | ||||||||||||||
| Assets: |
||||||||||||||||||
| Cash and cash equivalents |
$ | 7,236 | $ | 7,236 | $ | — | $ | — | Market | |||||||||
| Restricted cash |
1,120 | 1,120 | — | — | Market | |||||||||||||
| Derivative assets |
371 | — | 371 | — | Income | |||||||||||||
|
|
|
|
|
|
|
|
|
|||||||||||
| Total |
$ | 8,727 | $ | 8,356 | $ | 371 | $ | — | ||||||||||
|
|
|
|
|
|
|
|
|
|||||||||||
At December 31, 2014 and 2013, the Company had no liabilities that were measured at fair value on a recurring basis.
F-33
Table of Contents
FORTRESS TRANSPORTATION AND INFRASTRUCTURE INVESTORS LLC
NOTES TO CONSOLIDATED FINANCIAL STATEMENTS
(Dollar amounts in thousands, unless otherwise noted)
The Company’s cash and cash equivalents and restricted cash consist largely of demand deposit accounts with initial maturities of 90 days or less that are considered to be highly liquid and easily tradable. These instruments are valued using inputs observable in active markets for identical instruments and are therefore classified as Level 1 within the fair value hierarchy. The Company’s derivatives are valued using discounted cash flow models with observable market inputs (i.e., cash rates, futures rates, swap rates and contractual cash flows) that can be verified and do not involve significant judgments and are therefore classified as Level 2 within the fair value hierarchy.
Except as discussed below, the Company’s financial instruments other than cash and cash equivalents, restricted cash, and derivatives consist principally of accounts receivable, tendered bonds, accounts payable and accrued liabilities, bonds payable, security deposits, maintenance deposits and management fees payable, whose fair value approximates their carrying value based on an evaluation of pricing data, vendor quotes, and historical trading activity or due to their short maturity profiles.
The Company’s note receivable at December 31, 2014, which is included as a component of other assets in the accompanying Consolidated Balance Sheet, consists of a $3,725 loan bearing interest at 12.00% made to the Company’s joint venture partner in the WWTAI IES MT 6015 joint venture (Note 2) which is collateralized by other property owned by the joint venture partner. The fair value of this note receivable approximates its carrying value due to it bearing a market rate of interest for similar types of loans. The Company’s note receivable at December 31, 2013, which is included as a component of other assets in the accompanying Consolidated Balance Sheet, consists of a $4,500 short-term note received in connection with the sale of the Company’s interest in the PJW 3000 LLC joint venture and supported by an unconditional bank guaranty issued by a reputable financial institution and therefore had a fair value which approximated its carrying value. This note was repaid in November 2014.
The fair value of Container Loan #1 reported in loans payable in the Consolidated Balance Sheet, was approximately $42,515 and $50,093, at December 31, 2014 and 2013, respectively, based upon current market interest rates for similar types of loans. The fair value of Container Loan #2 reported in loans payable in the Consolidated Balance Sheet, was approximately $19,129 and $21,126, at December 31, 2014 and 2013, respectively, based upon current market interest rates for similar types of loans. The fair values of the Jefferson Terminal Credit Agreement, CMQR Credit Agreement, and FTAI Pride Credit Agreement reported in loans payable in the Consolidated Balance Sheet approximate their carrying values due to their bearing market rates of interest.
The fair value of the note payable to non-controlling interest at December 31, 2014 and 2013 approximates its carrying value as such loan bears interest at market rate for similar types of instruments.
The Company measures the fair value of certain assets and liabilities on a non-recurring basis when GAAP requires the application of fair value, including events or changes in circumstances that indicate that the carrying amounts of assets may not be recoverable. Assets subject to these measurements include goodwill, intangible assets, property, plant and equipment and equipment held for lease owned by the Company. The Company records such assets at fair value when it is determined the carrying value may not be recoverable. Fair value measurements for assets subject to impairment tests are based on an income approach which uses Level 3 inputs, which include the Company’s assumptions as to future cash flows from operation of the underlying businesses and the leasing and eventual sale of assets.
During the years ended December 31, 2014 and 2013, no impairment charges were recognized.
F-34
Table of Contents
FORTRESS TRANSPORTATION AND INFRASTRUCTURE INVESTORS LLC
NOTES TO CONSOLIDATED FINANCIAL STATEMENTS
(Dollar amounts in thousands, unless otherwise noted)
| 11. | REVENUES |
Components of revenue in the years ended December 31, 2014 and 2013 are as follows:
| Year Ended December 31, 2014 | ||||||||||||||||||||||||
| Equipment Leasing | Infrastructure | Total | ||||||||||||||||||||||
| Aviation Leasing |
Offshore Energy |
Shipping Containers |
Jefferson Terminal |
Railroad | ||||||||||||||||||||
| Revenues |
||||||||||||||||||||||||
| Equipment leasing revenues |
||||||||||||||||||||||||
| Lease income |
$ | 14,991 | $ | 12,690 | $ | — | $ | — | $ | — | $ | 27,681 | ||||||||||||
| Maintenance revenue |
5,964 | — | — | — | — | 5,964 | ||||||||||||||||||
| Finance lease income |
— | 1,716 | 8,297 | — | — | 10,013 | ||||||||||||||||||
| Other revenue |
3 | 224 | 99 | — | — | 326 | ||||||||||||||||||
|
|
|
|
|
|
|
|
|
|
|
|
|
|||||||||||||
| Total equipment leasing revenues |
$ | 20,958 | $ | 14,630 | $ | 8,396 | $ | — | $ | — | $ | 43,984 | ||||||||||||
|
|
|
|
|
|
|
|
|
|
|
|
|
|||||||||||||
| Infrastructure revenues |
||||||||||||||||||||||||
| Lease income |
— | — | — | 1,325 | — | 1,325 | ||||||||||||||||||
| Rail revenues |
— | — | — | — | 9,969 | 9,969 | ||||||||||||||||||
| Terminal services revenues |
— | — | — | 2,652 | — | 2,652 | ||||||||||||||||||
|
|
|
|
|
|
|
|
|
|
|
|
|
|||||||||||||
| Total infrastructure revenues |
$ | — | $ | — | $ | — | $ | 3,977 | $ | 9,969 | $ | 13,946 | ||||||||||||
|
|
|
|
|
|
|
|
|
|
|
|
|
|||||||||||||
| Total revenues |
$ | 20,958 | $ | 14,630 | $ | 8,396 | $ | 3,977 | $ | 9,969 | $ | 57,930 | ||||||||||||
|
|
|
|
|
|
|
|
|
|
|
|
|
|||||||||||||
| Year Ended December 31, 2013 | ||||||||||||||||||||||||
| Equipment Leasing | Infrastructure | Total | ||||||||||||||||||||||
| Aviation Leasing |
Offshore Energy |
Shipping Containers |
Jefferson Terminal |
Railroad | ||||||||||||||||||||
| Revenues |
||||||||||||||||||||||||
| Equipment leasing revenues |
||||||||||||||||||||||||
| Lease income |
$ | 4,282 | $ | 5,002 | $ | — | $ | — | $ | — | $ | 9,284 | ||||||||||||
| Maintenance revenue |
2,242 | — | — | — | — | 2,242 | ||||||||||||||||||
| Finance lease income |
— | 262 | 7,519 | — | — | 7,781 | ||||||||||||||||||
| Other revenue |
121 | — | 102 | — | — | 223 | ||||||||||||||||||
|
|
|
|
|
|
|
|
|
|
|
|
|
|||||||||||||
| Total equipment leasing revenues |
6,645 | 5,264 | 7,621 | — | — | 19,530 | ||||||||||||||||||
|
|
|
|
|
|
|
|
|
|
|
|
|
|||||||||||||
| Total revenues |
$ | 6,645 | $ | 5,264 | $ | 7,621 | $ | — | $ | — | $ | 19,530 | ||||||||||||
|
|
|
|
|
|
|
|
|
|
|
|
|
|||||||||||||
Minimum future annual revenues contracted to be received under existing operating leases of equipment at December 31, 2014 are as follows:
| 2015 |
$ | 62,596 | ||
| 2016 |
41,417 | |||
| 2017 |
44,323 | |||
| 2018 |
20,165 | |||
| 2019 |
7,843 | |||
| Thereafter |
309 | |||
|
|
|
|||
| $ | 176,653 | |||
|
|
|
F-35
Table of Contents
FORTRESS TRANSPORTATION AND INFRASTRUCTURE INVESTORS LLC
NOTES TO CONSOLIDATED FINANCIAL STATEMENTS
(Dollar amounts in thousands, unless otherwise noted)
| 12. | EQUITY BASED COMPENSATION |
In August 2014, the Company granted a senior employee of a subsidiary equity based compensation consisting of 1.25 million restricted shares of such subsidiary’s equity instruments in exchange for services to be provided. The awards vest in three tranches, over three years, subject to continued employment and the achievement of three separate performance conditions based on EBITDA for that subsidiary, as defined. The award expires in August 2017. The award is equity based, with compensation expense recognized ratably over the remaining service period when it is probable that the performance conditions will be achieved. The grant date fair value of the award is $23,879 which was based on the fair value per share on the date of grant, August 27, 2014 and estimated using a market approach. During the year ending December 31, 2014, the achievement of one performance condition representing 50% of the grant value was deemed probable, and $1,137 in compensation expense was recognized and if it continues to be probable, an additional $10,802 of compensation expense could be recognized. If all vesting conditions for the entire award granted are met, future compensation expense of $22,742 would be recognized as of that date, through the year ended December 31, 2017. All restricted shares were outstanding and unvested as of December 31, 2014. The award has an assumed forfeiture rate of zero.
In December 2014, the Company granted a senior employee of a subsidiary equity based compensation consisting of 1.1 million common units of such subsidiary’s equity instruments with a grant date fair value of $1,353 in exchange for services to be provided. The awards have a term of 16.5 months, and will vest 50% on May 15, 2015 with the remaining 50% on May 15, 2016, subject to continued employment through each respective vesting date. The award is equity based, with compensation expense recognized ratably over the vesting period. During the year ending December 31, 2014, no portion of this award was vested or forfeited, and $13 of compensation expense was recognized. The award has an assumed forfeiture rate of zero. During the year ended December 31, 2014, this same employee also exercised an option to purchase 0.5 million common units in such subsidiary at $1/unit. The fair value at the time of exercise was $1.23/unit, and accordingly $115 of compensation expense was recognized.
The fair value of the award was based on the fair value of the operating subsidiary on the date of grant, which was estimated using a discounted cash flow analysis which requires the application of discount factors and terminal multiples to projected cash flows. Discount factors and terminal multiples were based on market based inputs and transactions, as available at the measurement date.
F-36
Table of Contents
FORTRESS TRANSPORTATION AND INFRASTRUCTURE INVESTORS LLC
NOTES TO CONSOLIDATED FINANCIAL STATEMENTS
(Dollar amounts in thousands, unless otherwise noted)
| 13. | INCOME TAXES |
The current and deferred components of the income tax expense included in the Consolidated Statement of Income are as follows:
| December 31, | ||||||||
| 2014 | 2013 | |||||||
| Current: |
||||||||
| Federal |
$ | 700 | $ | — | ||||
| State and local |
15 | — | ||||||
| Foreign |
— | — | ||||||
|
|
|
|
|
|||||
| Total current provision |
715 | — | ||||||
|
|
|
|
|
|||||
| Deferred: |
||||||||
| Federal |
158 | — | ||||||
| State and local |
1 | — | ||||||
| Foreign |
— | — | ||||||
|
|
|
|
|
|||||
| Total deferred provision |
159 | — | ||||||
|
|
|
|
|
|||||
| Total provision for income taxes |
$ | 874 | $ | — | ||||
|
|
|
|
|
|||||
The Company is taxed as a flow-through entity for U.S. income tax purposes and its taxable income or loss generated is the responsibility of its partners. Taxable income or loss generated by the Company’s corporate subsidiaries is subject to U.S. federal, state and foreign corporate income tax in locations where they conduct business.
The difference between the Company’s reported provision for income taxes and the U.S. federal statutory rate of 35% is as follows:
| December 31, | ||||||||
| 2014 | 2013 | |||||||
| U.S. federal tax at statutory rate |
$ | 1,327 | $ | 8,687 | ||||
| Income not subject to tax |
(9,144 | ) | (8,687 | ) | ||||
| State and local taxes |
16 | — | ||||||
| Change in valuation allowance |
8,675 | — | ||||||
|
|
|
|
|
|||||
| Provision for income taxes |
$ | 874 | $ | — | ||||
|
|
|
|
|
|||||
The Company’s effective tax rate differs from the U.S. federal tax rate of 35% primarily due to a significant portion of its income not subject to U.S. corporate tax rates or is deemed to be foreign sourced and is either not taxable or taxable at effectively lower tax rates.
F-37
Table of Contents
FORTRESS TRANSPORTATION AND INFRASTRUCTURE INVESTORS LLC
NOTES TO CONSOLIDATED FINANCIAL STATEMENTS
(Dollar amounts in thousands, unless otherwise noted)
Significant components of our deferred tax assets and liabilities are as follows:
| December 31, | ||||||||
| 2014 | 2013 | |||||||
| Deferred tax assets: |
||||||||
| Net operating loss carryforwards |
$ | 6,144 | $ | — | ||||
| Accrued expenses |
1,934 | — | ||||||
| Interest expense |
1,033 | |||||||
| Other |
451 | |||||||
|
|
|
|
|
|||||
| Total deferred tax assets |
9,562 | — | ||||||
| Less valuation allowance |
(8,675 | ) | — | |||||
|
|
|
|
|
|||||
| Net deferred tax assets |
887 | — | ||||||
| Deferred tax liabilities: |
||||||||
| Fixed assets |
$ | 1,046 | $ | — | ||||
|
|
|
|
|
|||||
| Net deferred tax assets (liabilities) |
$ | (159 | ) | $ | — | |||
|
|
|
|
|
|||||
Current and deferred tax assets and liabilities are reported in other assets and other liabilities, respectively, in the Consolidated Balance Sheet. In assessing the realizability of deferred tax assets, management considers whether it is more likely than not that some portion or all of the deferred tax assets will not be realized. The ultimate realization of deferred tax assets is dependent upon the generation of future taxable income during the periods in which temporary differences become deductible. The Company has analyzed its deferred tax assets and has determined, based on the weight of available evidence, that it is more likely than not that a significant portion will not be realized. Accordingly, a valuation allowance in the amount of approximately $8.7 million has been recognized as of December 31, 2014 related to certain deductible temporary differences and net operating loss carryforwards.
A summary of the changes in the valuation allowance follows:
| December 31, | ||||||||
| 2014 | 2013 | |||||||
| Valuation allowance at beginning of period |
$ | — | $ | — | ||||
| Increase (decrease) to valuation allowance attributable to: |
||||||||
| Current year income/loss |
8,675 | — | ||||||
|
|
|
|
|
|||||
| Valuation allowance at end of period |
$ | 8,675 | $ | — | ||||
|
|
|
|
|
|||||
As of December 31, 2014, certain corporate subsidiaries of the Company had U.S. federal net operating loss carryforwards of approximately $13.0 million and $12.3 million of various state and local net operating loss carryforwards that are available to offset future taxable income, if and when it arises. These net operating loss carryforwards begin to expire in the year 2034. The Company also had net operating loss carryforwards for Canadian federal and provincial income taxes of $4.0 million which will begin to expire in the year 2034. The utilization of the net operating loss carryforwards to reduce future income taxes will depend on the corporate subsidiaries’ ability to generate sufficient taxable income prior to the expiration of the carryforward period. In addition, the maximum annual use of net operating loss carryforwards may be limited in certain situations after changes in stock ownership occur.
As of and for the years ended December 31, 2014 and 2013, the Company had not established a liability for uncertain tax positions as no such positions existed. In general, the Company’s tax returns and the tax
F-38
Table of Contents
FORTRESS TRANSPORTATION AND INFRASTRUCTURE INVESTORS LLC
NOTES TO CONSOLIDATED FINANCIAL STATEMENTS
(Dollar amounts in thousands, unless otherwise noted)
returns of its corporate subsidiaries are subject to U.S. federal, state and local and foreign income tax examinations by tax authorities. Generally, the Company is not subject to examination by taxing authorities for tax years prior to 2011. The Company does not believe that it is reasonably possible that the total amount of unrecognized tax benefits will significantly change within 12 months of the reporting date.
| 14. | MANAGEMENT AGREEMENT AND AFFILIATE TRANSACTIONS |
The Manager is paid annual fees in exchange for advising the Company on various aspects of its business, formulating its investment strategies, arranging for the acquisition and disposition of assets, arranging for financing, monitoring performance, and managing its day-to-day operations, inclusive of all costs incidental thereto. In addition, the Manager may be reimbursed for various expenses incurred by the Manager on the Company’s behalf, including the costs of legal, accounting and other administrative activities.
The management fee is calculated at an annual rate of 1.25% for any Onshore Fund or Offshore Fund investor (collectively, the “Fund Investors”) with a capital commitment of at least $100 million and 1.50% for any capital commitment of less than $100 million, payable semi-annually in arrears. Commencing with the date of the initial closing of the Onshore Fund and the Offshore Fund and continuing through the third anniversary of their final closing (the “Fund Commitment Period”), this percentage is applied to the weighted average of all capital called, reduced for any return of capital resulting from the partial or complete disposition of any Portfolio Investment, as defined. Subsequent to the Fund Commitment Period, the management fee percentage is applied to the lesser of (a) the weighted daily average of all capital contributions of the Fund Investors, reduced for any return of capital resulting from the partial or complete disposition of any Portfolio Investment, as defined, or (b) the net asset value of the Onshore Fund and the Offshore Fund (calculated by averaging the net asset value of the fund on the last day of each semi-annual period and the last day of each of the two preceding fiscal quarters). The amount of the management fee payable to the Manager shall be reduced (but not below zero) by the amount of any transaction, advisory, break-up, director’s, origination or similar fees received by the Master GP or the general partner of the Onshore Fund or the Offshore Fund during the six month period preceding the applicable Management Fee Due Date, as defined. Neither the Master GP, the general partner of the Onshore Fund or the Offshore Fund nor their affiliates are required to contribute capital to fund any portion of the management fee incurred.
In addition, affiliates of the Manager may receive an amount not to exceed $1 million per annum to cover legal, compliance, operational, tax, accounting, insurance, transfer agent and informational technology services (“Specified General and Administrative Expenses”) performed by employees of such affiliates on behalf of the Company or the Onshore Fund and the Offshore Fund.
During the years ended December 31, 2014 and 2013, the Company incurred $5,463 and $2,211, respectively, of management fees. To date, there have been no Specified General and Administrative Expenses incurred pursuant to the Management Agreement. Accrued management fees of $3,626 and $1,264 as of December 31, 2014 and 2013, respectively, are included as a component of accounts payable and accrued liabilities in the accompanying Consolidated Balance Sheet.
The Incentive Return, as described in Note 1, is payable to the Master GP from Distributable Proceeds of the Company (as defined) as they are distributed. Accordingly, an Incentive Return may be paid to the Master GP in connection with a particular investment if and when such investment generates proceeds in excess of the capital called with respect to such investment, plus an 8% cumulative preferred return on such investment and on all previously liquidated investments. If, upon the termination of the Company, the aggregate amount paid to the Master GP as Incentive Return exceeds the amount actually due after taking into account the aggregate return to the Onshore Fund and the Offshore Fund investors, the excess is required to be returned by the Master GP (that is
F-39
Table of Contents
FORTRESS TRANSPORTATION AND INFRASTRUCTURE INVESTORS LLC
NOTES TO CONSOLIDATED FINANCIAL STATEMENTS
(Dollar amounts in thousands, unless otherwise noted)
“clawed back”, after adjusting for tax in accordance with the Company agreements) to the Company for benefit of the Fund Investors. During the years ended December 31, 2014 and December 31, 2013, approximately $668 and $527, respectively, of Incentive Return was distributed to the Master GP.
Certain employees of an affiliate of the Manager are or may become entitled to receive profit sharing arrangements from the Master GP, pursuant to which they receive a portion of the Master GP’s Incentive Return. The Company is not required to reimburse the Master GP for such amounts. During the years ended December 31, 2014 and 2013, the Master GP did not incur any amounts payable to these employees under such profit sharing arrangements attributable to the operations of the Company.
Certain affiliates of the Company or the Manager may from time to time hold the debt of, or otherwise engage in business with, subsidiaries of the Company.
As of December 31, 2014 and 2013, amounts receivable from the Manager of $335 and $0, respectively, are included within other assets in the Consolidated Balance Sheet. As of December 31, 2014 and 2013, amounts due to the Manager, excluding accrued management fees, of $160 and $101, respectively, are included within other liabilities in the Consolidated Balance Sheet.
As of December 31, 2014, a private equity fund sponsored by Fortress owns a 20% interest in Jefferson Terminal which has been accounted for as a component of non-controlling interest in consolidated subsidiaries in the accompanying consolidated financial statements. The amount of this non-controlling interest at December 31, 2014 was $54,273 and for the year ending December, 31, 2014, the amount of this non-controlling interest share of net income (loss) was $(3,068).
| 15. | SEGMENT INFORMATION |
The Company’s reportable segments represent strategic business units comprised of investments in different types of transportation and infrastructure assets. The Company has five reportable segments which operate in the Equipment Leasing and Infrastructure businesses across several market sectors. The Company’s reportable segments are Aviation Leasing, Offshore Energy, Shipping Containers, Jefferson Terminal (formerly referred to as Crude-by-Rail Terminal) and Railroad. Aviation Leasing consists of aircraft and aircraft engines held for lease and are typically held long-term. Offshore Energy consists of (a) vessels and equipment that support offshore oil and gas drilling and production which are typically subject to long-term operating leases, and (b) in 2013, an interest in an unconsolidated entity which owned a derrick pipe-laying barge, which was sold in November 2013 (Note 7). Shipping Containers consist of investments in shipping containers and related equipment subject to operating leases and finance leases and also includes an investment in an unconsolidated entity engaged in the acquisition and leasing of shipping containers (on both an operating lease and finance lease basis). Jefferson Terminal consists of a multi-modal crude oil and refined products terminal and other related assets. Railroad consists of our CMQR railroad operations (Note 3).
With the CMQR and Jefferson Terminal acquisitions, the Company created two new reporting segments during 2014, Jefferson Terminal and Railroad. The Chief Operating Decision Maker (“CODM”) also implemented Adjusted Net Income as the key performance measure during the same period. This segment structure and performance measure reflects the current management of the businesses. These changes provide the CODM with the information necessary to assess operational performance as well as make resource and allocation decisions. These changes have been reflected within the following tables and the accompanying 2013 tables have been conformed to the current presentation described above.
Corporate consists primarily of unallocated Company level general and administrative expenses and management fees. The accounting policies of the segments are the same as those described in the summary
F-40
Table of Contents
FORTRESS TRANSPORTATION AND INFRASTRUCTURE INVESTORS LLC
NOTES TO CONSOLIDATED FINANCIAL STATEMENTS
(Dollar amounts in thousands, unless otherwise noted)
of significant accounting policies. The Company evaluates investment performance for each reportable segment primarily based on Net Income attributable to members and Adjusted Net Income.
Adjusted Net Income is defined as net income attributable to members, adjusted (a) to exclude the impact of provision for income taxes, equity-based compensation expense, acquisition and transaction expenses, losses on the modification or extinguishment of debt and capital lease obligations, changes in fair value of non-hedge derivative instruments, asset impairment charges, and equity in earnings of unconsolidated entities; (b) to include the impact of cash tax payments, the Company’s pro-rata share of the Adjusted Net Income from unconsolidated entities (collectively “Adjusted Net Income”), and (c) to exclude the impact of the non-controlling share of Adjusted Net Income.
The Company believes that net income attributable to members as defined by GAAP is the most appropriate earnings measurement with which to reconcile Adjusted Net Income. Adjusted Net Income should not be considered as an alternative to Net Income attributable to members as determined in accordance with GAAP.
The following tables set forth certain information for each reportable segment of the Company:
I. As of and for the Year Ended December 31, 2014
| Year Ended December 31, 2014 | ||||||||||||||||||||||||||||
| Equipment Leasing | Infrastructure | |||||||||||||||||||||||||||
| Aviation Leasing |
Offshore Energy |
Shipping Containers |
Jefferson Terminal |
Railroad | Corporate | Total | ||||||||||||||||||||||
| Revenues |
||||||||||||||||||||||||||||
| Equipment leasing |
$ | 20,958 | $ | 14,630 | $ | 8,396 | $ | — | $ | — | $ | — | $ | 43,984 | ||||||||||||||
| Infrastructure |
— | — | — | 3,977 | 9,969 | — | 13,946 | |||||||||||||||||||||
|
|
|
|
|
|
|
|
|
|
|
|
|
|
|
|||||||||||||||
| Total revenues |
20,958 | 14,630 | 8,396 | 3,977 | 9,969 | — | 57,930 | |||||||||||||||||||||
|
|
|
|
|
|
|
|
|
|
|
|
|
|
|
|||||||||||||||
| Expenses |
||||||||||||||||||||||||||||
| Operating expenses |
1,713 | 1,054 | 257 | 9,095 | 15,104 | — | 27,223 | |||||||||||||||||||||
| General and administrative |
— | — | — | — | — | 2,007 | 2,007 | |||||||||||||||||||||
| Acquisition and transaction expense |
— | — | — | 5,494 | 5,646 | 310 | 11,450 | |||||||||||||||||||||
| Management fees |
— | — | — | — | — | 5,463 | 5,463 | |||||||||||||||||||||
| Depreciation and amortization |
9,445 | 2,801 | — | 2,763 | 989 | — | 15,998 | |||||||||||||||||||||
| Interest expense |
— | 1,248 | 2,840 | 1,552 | 187 | 45 | 5,872 | |||||||||||||||||||||
|
|
|
|
|
|
|
|
|
|
|
|
|
|
|
|||||||||||||||
| Total expenses |
11,158 | 5,103 | 3,097 | 18,904 | 21,926 | 7,825 | 68,013 | |||||||||||||||||||||
|
|
|
|
|
|
|
|
|
|
|
|
|
|
|
|||||||||||||||
| Other income (expense) |
||||||||||||||||||||||||||||
| Equity in earnings of unconsolidated entities |
— | — | 6,093 | — | — | — | 6,093 | |||||||||||||||||||||
| Gain on sale of equipment |
7,576 | — | — | — | — | — | 7,576 | |||||||||||||||||||||
| Interest income |
26 | 160 | — | — | — | — | 186 | |||||||||||||||||||||
| Other income (expense) |
— | — | (26 | ) | 46 | — | — | 20 | ||||||||||||||||||||
|
|
|
|
|
|
|
|
|
|
|
|
|
|
|
|||||||||||||||
| Total other income (expense) |
7,602 | 160 | 6,067 | 46 | — | — | 13,875 | |||||||||||||||||||||
|
|
|
|
|
|
|
|
|
|
|
|
|
|
|
|||||||||||||||
| Income before income taxes |
17,402 | 9,687 | 11,366 | (14,881 | ) | (11,957 | ) | (7,825 | ) | 3,792 | ||||||||||||||||||
| Provision for income taxes |
490 | — | 100 | 284 | — | — | 874 | |||||||||||||||||||||
|
|
|
|
|
|
|
|
|
|
|
|
|
|
|
|||||||||||||||
| Net income (loss) |
16,912 | 9,687 | 11,266 | (15,165 | ) | (11,957 | ) | (7,825 | ) | 2,918 | ||||||||||||||||||
|
|
|
|
|
|
|
|
|
|
|
|
|
|
|
|||||||||||||||
| Less: Net income attributable to non-controlling interests in consolidated subsidiaries |
— | 704 | — | (5,566 | ) | — | — | (4,862 | ) | |||||||||||||||||||
|
|
|
|
|
|
|
|
|
|
|
|
|
|
|
|||||||||||||||
| Net income (loss) attributable to members |
$ | 16,912 | $ | 8,983 | $ | 11,266 | $ | (9,599 | ) | $ | (11,957 | ) | $ | (7,825 | ) | $ | 7,780 | |||||||||||
|
|
|
|
|
|
|
|
|
|
|
|
|
|
|
|||||||||||||||
F-41
Table of Contents
FORTRESS TRANSPORTATION AND INFRASTRUCTURE INVESTORS LLC
NOTES TO CONSOLIDATED FINANCIAL STATEMENTS
(Dollar amounts in thousands, unless otherwise noted)
The following table sets forth a reconciliation of Adjusted Net Income to Net Income attributable to members for the year ended December 31, 2014:
| Year Ended December 31, 2014 | ||||||||||||||||||||||||||||
| Equipment Leasing | Infrastructure | |||||||||||||||||||||||||||
| Aviation Leasing |
Offshore Energy |
Shipping Containers |
Jefferson Terminal |
Railroad | Corporate | Total | ||||||||||||||||||||||
| Adjusted Net Income |
$ | 17,136 | $ | 8,976 | $ | 11,453 | $ | (3,209 | ) | $ | (6,183 | ) | $ | (7,516 | ) | $ | 20,657 | |||||||||||
|
|
|
|
|
|
|
|
|
|
|
|
|
|||||||||||||||||
| Add: Non-controlling share of adjustments to Adjusted Net Income |
525 | |||||||||||||||||||||||||||
| Add: Equity in earnings of unconsolidated entities |
6,093 | |||||||||||||||||||||||||||
| Add: Cash tax payments |
274 | |||||||||||||||||||||||||||
| Less: Pro-rata share of Adjusted Net Income from investments in unconsolidated entities |
(6,155 | ) | ||||||||||||||||||||||||||
| Less: Asset impairment charges |
— | |||||||||||||||||||||||||||
| Less: Changes in fair value of non-hedge derivative instruments |
(25 | ) | ||||||||||||||||||||||||||
| Less: Losses on the modification or extinguishment of debt and capital lease obligations |
— | |||||||||||||||||||||||||||
| Less: Acquisition and transaction expenses |
(11,450 | ) | ||||||||||||||||||||||||||
| Less: Equity-based compensation expense |
(1,265 | ) | ||||||||||||||||||||||||||
| Less: Provision for income taxes |
(874 | ) | ||||||||||||||||||||||||||
|
|
|
|||||||||||||||||||||||||||
| Net Income attributable to members |
$ | 7,780 | ||||||||||||||||||||||||||
|
|
|
|||||||||||||||||||||||||||
F-42
Table of Contents
FORTRESS TRANSPORTATION AND INFRASTRUCTURE INVESTORS LLC
NOTES TO CONSOLIDATED FINANCIAL STATEMENTS
(Dollar amounts in thousands, unless otherwise noted)
The following table sets forth summarized balance sheet information as of December 31, 2014:
| December 31, 2014 | ||||||||||||||||||||||||||||
| Equipment Leasing | Infrastructure | |||||||||||||||||||||||||||
| Aviation Leasing |
Offshore Energy |
Shipping Containers |
Jefferson Terminal |
Railroad | Corporate | Total | ||||||||||||||||||||||
| Total assets |
$ | 308,957 | $ | 212,699 | $ | 117,298 | $ | 720,727 | $ | 30,605 | $ | 13,915 | $ | 1,404,201 | ||||||||||||||
|
|
|
|
|
|
|
|
|
|
|
|
|
|
|
|||||||||||||||
| Debt |
$ | — | $ | 76,024 | $ | 61,154 | $ | 446,272 | $ | 9,417 | $ | — | $ | 592,867 | ||||||||||||||
|
|
|
|
|
|
|
|
|
|
|
|
|
|
|
|||||||||||||||
| Total liabilities |
$ | 50,282 | $ | 81,903 | $ | 61,434 | $ | 470,171 | $ | 19,499 | $ | 7,415 | $ | 690,704 | ||||||||||||||
|
|
|
|
|
|
|
|
|
|
|
|
|
|
|
|||||||||||||||
| Members’ equity |
||||||||||||||||||||||||||||
| Members’ equity |
258,675 | 123,477 | 55,650 | 159,438 | 10,478 | 6,500 | 614,218 | |||||||||||||||||||||
| Accumulated other comprehensive income |
— | — | 214 | — | — | — | 214 | |||||||||||||||||||||
| Non-controlling interests in equity of consolidated subsidiaries |
— | 7,319 | — | 91,118 | 628 | — | 99,065 | |||||||||||||||||||||
|
|
|
|
|
|
|
|
|
|
|
|
|
|
|
|||||||||||||||
| Total members’ equity |
258,675 | 130,796 | 55,864 | 250,556 | 11,106 | 6,500 | 713,497 | |||||||||||||||||||||
|
|
|
|
|
|
|
|
|
|
|
|
|
|
|
|||||||||||||||
| Total liabilities and members’ equity |
$ | 308,957 | $ | 212,699 | $ | 117,298 | $ | 720,727 | $ | 30,605 | $ | 13,915 | $ | 1,404,201 | ||||||||||||||
|
|
|
|
|
|
|
|
|
|
|
|
|
|
|
|||||||||||||||
F-43
Table of Contents
FORTRESS TRANSPORTATION AND INFRASTRUCTURE INVESTORS LLC
NOTES TO CONSOLIDATED FINANCIAL STATEMENTS
(Dollar amounts in thousands, unless otherwise noted)
Summary information with respect to the Company’s geographic sources of revenue and the location of property, plant and equipment and equipment held for lease as of December 31, 2014 and for the year then ended is as follows:
| Year Ended December 31, 2014 | ||||||||||||||||||||||||||||
| Equipment Leasing | Infrastructure | |||||||||||||||||||||||||||
| Aviation Leasing |
Offshore Energy |
Shipping Containers |
Jefferson Terminal |
Railroad | Corporate | Total | ||||||||||||||||||||||
| Revenues |
||||||||||||||||||||||||||||
| Africa |
$ | 7,818 | $ | — | $ | — | $ | — | $ | — | $ | — | $ | 7,818 | ||||||||||||||
| Asia |
3,246 | 7,483 | 6,024 | — | — | — | 16,753 | |||||||||||||||||||||
| Europe |
8,240 | 5,432 | — | — | — | — | 13,672 | |||||||||||||||||||||
| North America |
1,561 | 1,715 | 2,372 | 3,977 | 9,969 | — | 19,594 | |||||||||||||||||||||
| South America |
93 | — | — | — | — | — | 93 | |||||||||||||||||||||
|
|
|
|
|
|
|
|
|
|
|
|
|
|
|
|||||||||||||||
| Total revenues |
$ | 20,958 | $ | 14,630 | $ | 8,396 | $ | 3,977 | $ | 9,969 | $ | — | $ | 57,930 | ||||||||||||||
|
|
|
|
|
|
|
|
|
|
|
|
|
|
|
|||||||||||||||
| December 31, 2014 | ||||||||||||||||||||||||||||
| Equipment Leasing | Infrastructure |
|
|
|||||||||||||||||||||||||
| Aviation Leasing |
Offshore Energy |
Shipping Containers |
Jefferson Terminal |
Railroad | Corporate | Total | ||||||||||||||||||||||
| Property, plant and equipment and equipment held for lease, net |
||||||||||||||||||||||||||||
| Africa |
$ | 47,945 | $ | — | $ | — | $ | — | $ | — | $ | — | $ | 47,945 | ||||||||||||||
| Asia |
119,232 | 40,637 | — | — | — | — | 159,869 | |||||||||||||||||||||
| Europe |
105,762 | 137,981 | — | — | — | — | 243,743 | |||||||||||||||||||||
| North America |
13,335 | — | — | 252,354 | 19,862 | — | 285,551 | |||||||||||||||||||||
| South America |
599 | — | — | — | — | — | 599 | |||||||||||||||||||||
|
|
|
|
|
|
|
|
|
|
|
|
|
|
|
|||||||||||||||
| Total property, plant and equipment and equipment held for lease, net |
$ | 286,873 | $ | 178,618 | $ | — | $ | 252,354 | $ | 19,862 | $ | — | $ | 737,707 | ||||||||||||||
|
|
|
|
|
|
|
|
|
|
|
|
|
|
|
|||||||||||||||
F-44
Table of Contents
FORTRESS TRANSPORTATION AND INFRASTRUCTURE INVESTORS LLC
NOTES TO CONSOLIDATED FINANCIAL STATEMENTS
(Dollar amounts in thousands, unless otherwise noted)
II. As of and for the Year Ended December 31, 2013
| Year Ended December 31, 2013 | ||||||||||||||||||||||||||||
| Equipment Leasing | Infrastructure | |||||||||||||||||||||||||||
| Aviation Leasing |
Offshore Energy |
Shipping Containers |
Jefferson Terminal |
Railroad | Corporate | Total | ||||||||||||||||||||||
| Revenues |
||||||||||||||||||||||||||||
| Equipment leasing |
$ | 6,645 | $ | 5,264 | $ | 7,621 | $ | — | $ | — | $ | — | $ | 19,530 | ||||||||||||||
|
|
|
|
|
|
|
|
|
|
|
|
|
|
|
|||||||||||||||
| Total revenues |
6,645 | 5,264 | 7,621 | — | — | — | 19,530 | |||||||||||||||||||||
|
|
|
|
|
|
|
|
|
|
|
|
|
|
|
|||||||||||||||
| Expenses |
||||||||||||||||||||||||||||
| Operating expenses |
2,191 | 450 | 516 | — | — | — | 3,157 | |||||||||||||||||||||
| General and administrative |
— | — | — | — | — | 805 | 805 | |||||||||||||||||||||
| Acquisition and transaction expense |
— | — | — | — | — | 260 | 260 | |||||||||||||||||||||
| Management fees |
— | — | — | — | — | 2,211 | 2,211 | |||||||||||||||||||||
| Depreciation and amortization |
2,972 | 937 | — | — | — | — | 3,909 | |||||||||||||||||||||
| Interest expense |
— | 104 | 2,699 | — | — | 13 | 2,816 | |||||||||||||||||||||
|
|
|
|
|
|
|
|
|
|
|
|
|
|
|
|||||||||||||||
| Total expenses |
5,163 | 1,491 | 3,215 | — | — | 3,289 | 13,158 | |||||||||||||||||||||
|
|
|
|
|
|
|
|
|
|
|
|
|
|
|
|||||||||||||||
| Other income (expense) |
||||||||||||||||||||||||||||
| Equity in earnings of unconsolidated entities |
— | 2,700 | 7,625 | — | — | — | 10,325 | |||||||||||||||||||||
| Gain on sale of equipment |
2,415 | — | — | — | — | — | 2,415 | |||||||||||||||||||||
| Gain on sale of unconsolidated entity |
— | 6,144 | — | — | — | — | 6,144 | |||||||||||||||||||||
| Interest income |
23 | — | — | — | — | — | 23 | |||||||||||||||||||||
|
|
|
|
|
|
|
|
|
|
|
|
|
|
|
|||||||||||||||
| Total other income (expense) |
2,438 | 8,844 | 7,625 | — | — | — | 18,907 | |||||||||||||||||||||
|
|
|
|
|
|
|
|
|
|
|
|
|
|
|
|||||||||||||||
| Income before income taxes |
3,920 | 12,617 | 12,031 | — | — | (3,289 | ) | 25,279 | ||||||||||||||||||||
| Provision for income taxes |
— | — | — | — | — | — | — | |||||||||||||||||||||
|
|
|
|
|
|
|
|
|
|
|
|
|
|
|
|||||||||||||||
| Net income (loss) |
3,920 | 12,617 | 12,031 | — | — | (3,289 | ) | 25,279 | ||||||||||||||||||||
|
|
|
|
|
|
|
|
|
|
|
|
|
|
|
|||||||||||||||
| Less: Net income attributable to non-controlling interest in consolidated subsidiaries |
— | 458 | — | — | — | — | 458 | |||||||||||||||||||||
|
|
|
|
|
|
|
|
|
|
|
|
|
|
|
|||||||||||||||
| Net income (loss) attributable to members |
$ | 3,920 | $ | 12,159 | $ | 12,031 | $ | — | $ | — | $ | (3,289 | ) | $ | 24,821 | |||||||||||||
|
|
|
|
|
|
|
|
|
|
|
|
|
|
|
|||||||||||||||
F-45
Table of Contents
FORTRESS TRANSPORTATION AND INFRASTRUCTURE INVESTORS LLC
NOTES TO CONSOLIDATED FINANCIAL STATEMENTS
(Dollar amounts in thousands, unless otherwise noted)
The following table sets forth a reconciliation of Adjusted Net Income to Net Income attributable to members for the year ended December 31, 2013:
| Year Ended December 31, 2013 | ||||||||||||||||||||
| Equipment Leasing | ||||||||||||||||||||
| Aviation Leasing |
Offshore Energy |
Shipping Containers |
Corporate | Total | ||||||||||||||||
| Adjusted Net Income |
$ | 3,920 | $ | 12,159 | $ | 12,031 | $ | (3,029 | ) | $ | 25,081 | |||||||||
|
|
|
|
|
|
|
|
|
|||||||||||||
| Add: Non-controlling share of adjustments to Adjusted Net Income |
— | |||||||||||||||||||
| Add: Equity in earnings of unconsolidated entities |
10,325 | |||||||||||||||||||
| Add: Cash tax payments |
— | |||||||||||||||||||
| Less: Pro-rata share of Adjusted Net Income from investments in unconsolidated entities |
(10,325 | ) | ||||||||||||||||||
| Less: Asset impairment charges |
— | |||||||||||||||||||
| Less: Changes in fair value of non-hedge derivative instruments |
— | |||||||||||||||||||
| Less: Losses on the modification or extinguishment of debt and capital lease obligations |
— | |||||||||||||||||||
| Less: Acquisition and transaction expenses |
(260 | ) | ||||||||||||||||||
| Less: Equity-based compensation expense |
— | |||||||||||||||||||
| Less: Provision for income taxes |
— | |||||||||||||||||||
|
|
|
|||||||||||||||||||
| Net Income attributable to members |
$ | 24,821 | ||||||||||||||||||
|
|
|
|||||||||||||||||||
The following table sets forth summarized balance sheet information as of December 31, 2013:
| December 31, 2013 | ||||||||||||||||||||||||||||
| Equipment Leasing | Infrastructure | |||||||||||||||||||||||||||
| Aviation Leasing |
Offshore Energy |
Shipping Containers |
Jefferson Terminal |
Railroad | Corporate | Total | ||||||||||||||||||||||
| Total assets |
$ | 69,309 | $ | 60,105 | $ | 139,747 | $ | — | $ | — | $ | 9,486 | $ | 278,647 | ||||||||||||||
|
|
|
|
|
|
|
|
|
|
|
|
|
|
|
|||||||||||||||
| Debt |
$ | — | $ | 2,990 | $ | 70,398 | $ | — | $ | — | $ | — | $ | 73,388 | ||||||||||||||
|
|
|
|
|
|
|
|
|
|
|
|
|
|
|
|||||||||||||||
| Total liabilities |
$ | 3,788 | $ | 5,246 | $ | 70,725 | $ | — | $ | — | $ | 3,004 | $ | 82,763 | ||||||||||||||
|
|
|
|
|
|
|
|
|
|
|
|
|
|
|
|||||||||||||||
| Members’ equity |
||||||||||||||||||||||||||||
| Members’ equity |
65,521 | 51,404 | 68,694 | — | — | 6,482 | 192,101 | |||||||||||||||||||||
| Accumulated other comprehensive income |
— | — | 328 | — | — | — | 328 | |||||||||||||||||||||
| Non-controlling interest in equity of consolidated subsidiaries |
— | 3,455 | — | — | — | — | 3,455 | |||||||||||||||||||||
|
|
|
|
|
|
|
|
|
|
|
|
|
|
|
|||||||||||||||
| Total members’ equity |
65,521 | 54,859 | 69,022 | — | — | 6,482 | 195,884 | |||||||||||||||||||||
|
|
|
|
|
|
|
|
|
|
|
|
|
|
|
|||||||||||||||
| Total liabilities and members’ equity |
$ | 69,309 | $ | 60,105 | $ | 139,747 | $ | — | $ | — | $ | 9,486 | $ | 278,647 | ||||||||||||||
|
|
|
|
|
|
|
|
|
|
|
|
|
|
|
|||||||||||||||
F-46
Table of Contents
FORTRESS TRANSPORTATION AND INFRASTRUCTURE INVESTORS LLC
NOTES TO CONSOLIDATED FINANCIAL STATEMENTS
(Dollar amounts in thousands, unless otherwise noted)
Summary information with respect to the Company’s geographic sources of revenue and the location of property, plant and equipment and equipment held for lease as of December 31, 2013 and for the year then ended is as follows:
| Year Ended December 31, 2013 | ||||||||||||||||||||||||||||
| Equipment Leasing | Infrastructure | |||||||||||||||||||||||||||
| Aviation Leasing |
Offshore Energy |
Shipping Containers |
Jefferson Terminal |
Railroad | Corporate | Total | ||||||||||||||||||||||
| Revenues |
||||||||||||||||||||||||||||
| Africa |
$ | 654 | $ | — | $ | — | $ | — | $ | — | $ | — | $ | 654 | ||||||||||||||
| Asia |
1,714 | 5,002 | 6,665 | — | — | — | 13,381 | |||||||||||||||||||||
| Europe |
3,319 | — | — | — | — | — | 3,319 | |||||||||||||||||||||
| North America |
958 | 262 | 956 | — | — | — | 2,176 | |||||||||||||||||||||
|
|
|
|
|
|
|
|
|
|
|
|
|
|
|
|||||||||||||||
| Total revenues |
$ | 6,645 | $ | 5,264 | $ | 7,621 | $ | — | $ | — | $ | — | $ | 19,530 | ||||||||||||||
|
|
|
|
|
|
|
|
|
|
|
|
|
|
|
|||||||||||||||
| December 31, 2013 | ||||||||||||||||||||||||||||
| Equipment Leasing | Infrastructure | |||||||||||||||||||||||||||
| Aviation Leasing |
Offshore Energy |
Shipping Containers |
Jefferson Terminal |
Railroad | Corporate | Total | ||||||||||||||||||||||
| Property, plant and equipment and equipment held for lease, net |
||||||||||||||||||||||||||||
| Africa |
$ | 532 | $ | — | $ | — | $ | — | $ | — | $ | — | $ | 532 | ||||||||||||||
| Asia |
5,018 | 42,136 | — | — | — | — | 47,154 | |||||||||||||||||||||
| Europe |
40,773 | — | — | — | — | — | 40,773 | |||||||||||||||||||||
| North America |
18,561 | — | — | — | — | — | 18,561 | |||||||||||||||||||||
|
|
|
|
|
|
|
|
|
|
|
|
|
|
|
|||||||||||||||
| Total property, plant and equipment and equipment held for lease, net |
$ | 64,884 | $ | 42,136 | $ | — | $ | — | $ | — | $ | — | $ | 107,020 | ||||||||||||||
|
|
|
|
|
|
|
|
|
|
|
|
|
|
|
|||||||||||||||
| 16. | COMMITMENTS AND CONTINGENCIES |
In the normal course of business the Company may enter into contracts that contain a variety of representations and warranties and which provide general indemnifications. The Company’s maximum exposure under these arrangements is unknown as such arrangements would involve future claims that may be made against the Company that have not yet occurred. The Company believes the risk of loss in connection with such arrangements to be remote.
In connection with the acquisition of Jefferson Terminal, the Company committed to provide additional cash funding of $5.8 million, which was completed in 2015.
In connection with the formation of MT6015, a consolidated VIE (Note 2), the Company and its joint venture partner are each obligated to fund additional equity contributions of $11,925.
F-47
Table of Contents
FORTRESS TRANSPORTATION AND INFRASTRUCTURE INVESTORS LLC
NOTES TO CONSOLIDATED FINANCIAL STATEMENTS
(Dollar amounts in thousands, unless otherwise noted)
Two of the Company’s subsidiaries are lessees under various operating leases. As of December 31, 2014, minimum future rental payments under these leases are as follows:
| December 31, 2014 | ||||
| 2015 |
$ | 4,892 | ||
| 2016 |
4,372 | |||
| 2017 |
4,386 | |||
| 2018 |
3,362 | |||
| 2019 |
3,219 | |||
| Thereafter |
28,856 | |||
|
|
|
|||
| $ | 49,087 | |||
|
|
|
|||
| 17. | SUBSEQUENT EVENTS |
The Company has evaluated subsequent events through April 15, 2015, the date the financial statements, were available to be issued and determined that no subsequent events have occurred that would require recognition in the consolidated financial statements or disclosure in the accompanying notes.
| 18. | UNAUDITED PRO FORMA NET INCOME PER SHARE |
Pro forma basic and diluted net income per share attributable to common shareholders for the years ended December 31, 2014 and 2013 have been computed to reflect the number of shares that will be outstanding after giving effect to the issuance of common shares to the Initial Shareholders. The unaudited pro forma basic and diluted earnings per share for the years ended December 31, 2014 and 2013 does not give effect to the initial public offering and the use of proceeds therefrom. The following table sets forth the computation of the Company’s unaudited pro forma basic and diluted net income per share for the years ended December 31, 2014 and 2013 (in thousands, except for share and per share data):
| Year Ended December 31, | ||||||||
| 2014 | 2013 | |||||||
| Numerator |
||||||||
| Net income attributable to members |
$ | 7,780 | $ | 24,821 | ||||
| Denominator |
||||||||
| Weighted average shares of common stock outstanding used in computing the pro forma net income per share—basic and diluted |
53,502,873 | 53,502,873 | ||||||
| Pro forma net income per share—basic and diluted |
$ | 0.15 | $ | 0.46 | ||||
F-48
Table of Contents
To the Members of Intermodal Finance I Ltd:
We have audited the accompanying consolidated financial statements of Intermodal Finance I Ltd. and its subsidiaries, which comprise the consolidated balance sheets as of December 31, 2014 and December 31, 2013 and the related consolidated statements of income, comprehensive income, members’ equity and cash flows for the years then ended.
Management’s Responsibility for the Consolidated Financial Statements
Management is responsible for the preparation and fair presentation of the consolidated financial statements in accordance with accounting principles generally accepted in the United States of America; this includes the design, implementation, and maintenance of internal control relevant to the preparation and fair presentation of consolidated financial statements that are free from material misstatement, whether due to fraud or error.
Auditor’s Responsibility
Our responsibility is to express an opinion on the consolidated financial statements based on our audits. We conducted our audits in accordance with auditing standards generally accepted in the United States of America. Those standards require that we plan and perform the audit to obtain reasonable assurance about whether the consolidated financial statements are free from material misstatement.
An audit involves performing procedures to obtain audit evidence about the amounts and disclosures in the consolidated financial statements. The procedures selected depend on our judgment, including the assessment of the risks of material misstatement of the consolidated financial statements, whether due to fraud or error. In making those risk assessments, we consider internal control relevant to the Company’s preparation and fair presentation of the consolidated financial statements in order to design audit procedures that are appropriate in the circumstances, but not for the purpose of expressing an opinion on the effectiveness of the Company’s internal control. Accordingly, we express no such opinion. An audit also includes evaluating the appropriateness of accounting policies used and the reasonableness of significant accounting estimates made by management, as well as evaluating the overall presentation of the consolidated financial statements. We believe that the audit evidence we have obtained is sufficient and appropriate to provide a basis for our audit opinion.
Opinion
In our opinion, the consolidated financial statements referred to above present fairly, in all material respects, the financial position of Intermodal Finance I Ltd. and its subsidiaries at December 31, 2014 and December 31, 2013 and the results of their operations and their cash flows for the years then ended in accordance with accounting principles generally accepted in the United States of America.
Other Matter
Our audits were conducted for the purpose of forming an opinion on the consolidated financial statements taken as a whole. The consolidating information contained in the Other Financial Information section is the responsibility of management and was derived from and relates directly to the underlying accounting and other records used to prepare the consolidated financial statements. The consolidating information has been subjected to the auditing procedures applied in the audit of the consolidated financial statements and certain additional procedures, including comparing and reconciling such information directly to the underlying accounting and other records used to prepare the consolidated financial statements or to the consolidated financial statements themselves and other additional procedures, in accordance with auditing standards generally accepted in the United States of America. In our opinion, the consolidating information is fairly stated, in all material respects, in relation to the consolidated financial statements taken as a whole. The consolidating information is presented for
F-49
Table of Contents
purposes of additional analysis of the consolidated financial statements rather than to present the financial position or results of operations of the individual companies and is not a required part of the consolidated financial statements. Accordingly, we do not express an opinion on the financial position or results of operations of the individual companies.
/s/ PricewaterhouseCoopers LLP
New York, New York
April 15, 2015
F-50
Table of Contents
CONSOLIDATED BALANCE SHEETS
(dollar amounts in thousands)
| December 31, | ||||||||
| 2014 | 2013 | |||||||
| ASSETS |
||||||||
| Cash and cash equivalents |
$ | 5,214 | $ | 4,653 | ||||
| Restricted cash |
2,320 | 3,435 | ||||||
| Accounts receivable |
1,051 | 784 | ||||||
| Leasing equipment, net of accumulated depreciation of $4,449 and $2,281 |
74,045 | 76,214 | ||||||
| Net investment in direct finance leases |
62,393 | 121,893 | ||||||
| Deferred costs, net of accumulated amortization of $602 and $583 |
1,524 | 2,033 | ||||||
| Other assets |
8 | 15 | ||||||
|
|
|
|
|
|||||
| Total assets |
$ | 146,555 | $ | 209,027 | ||||
|
|
|
|
|
|||||
| LIABILITIES |
||||||||
| Accounts payable and accrued liabilities |
$ | 44 | $ | 40 | ||||
| Management fees payable |
92 | 70 | ||||||
| Accrued interest payable |
19 | 51 | ||||||
| Accrued interest payable to affiliates |
2 | 7 | ||||||
| Term loan payable |
97,727 | 134,052 | ||||||
| Loans payable to affiliates |
22,576 | 31,210 | ||||||
| Syndication liabilities |
5,152 | 9,761 | ||||||
| Other liabilities |
383 | 4 | ||||||
|
|
|
|
|
|||||
| Total liabilities |
125,995 | 175,195 | ||||||
| Members’ equity |
20,560 | 33,832 | ||||||
|
|
|
|
|
|||||
| Total liabilities and members’ equity |
$ | 146,555 | $ | 209,027 | ||||
|
|
|
|
|
|||||
See notes to consolidated financial statements.
F-51
Table of Contents
CONSOLIDATED STATEMENTS OF INCOME
(dollar amounts in thousands)
| Year Ended December 31, 2014 |
Year Ended December 31, 2013 |
|||||||
| REVENUES |
||||||||
| Equipment leasing revenue |
$ | 12,380 | $ | 12,393 | ||||
| Finance revenue |
7,951 | 12,482 | ||||||
| Other income |
45 | 6 | ||||||
| Gain on early termination of finance lease |
917 | 1,052 | ||||||
| Gain on disposal of equipment |
— | 15 | ||||||
|
|
|
|
|
|||||
| Total revenues |
21,293 | 25,948 | ||||||
|
|
|
|
|
|||||
| EXPENSES |
||||||||
| Direct operating expenses |
207 | 382 | ||||||
| Management fee |
1,527 | 1,389 | ||||||
| Depreciation and amortization |
2,416 | 2,415 | ||||||
| Interest expense |
4,477 | 6,117 | ||||||
| Interest expense—affiliates |
545 | 737 | ||||||
| Loss on debt extinguishment |
119 | — | ||||||
| General and administrative expense |
600 | 657 | ||||||
|
|
|
|
|
|||||
| Total expenses |
9,891 | 11,697 | ||||||
|
|
|
|
|
|||||
| NET INCOME |
$ | 11,402 | $ | 14,251 | ||||
|
|
|
|
|
|||||
See notes to consolidated financial statements.
F-52
Table of Contents
CONSOLIDATED STATEMENTS OF COMPREHENSIVE INCOME
(dollar amounts in thousands)
| Year Ended December 31, 2014 |
Year Ended December 31, 2013 |
|||||||
| Net income |
$ | 11,402 | $ | 14,251 | ||||
| Other comprehensive income
|
— | — | ||||||
|
|
|
|
|
|||||
| Comprehensive income |
$ | 11,402 | $ | 14,251 | ||||
|
|
|
|
|
|||||
See notes to consolidated financial statements.
F-53
Table of Contents
CONSOLIDATED STATEMENTS OF CASH FLOWS
(dollar amounts in thousands)
| Year Ended December 31, 2014 |
Year Ended December 31, 2013 |
|||||||
| CASH FLOWS FROM OPERATING ACTIVITIES: |
||||||||
| Net income |
$ | 11,402 | $ | 14,251 | ||||
| Adjustments to reconcile net income to net cash provided by operating activities: |
||||||||
| Depreciation and amortization |
2,693 | 2,689 | ||||||
| Gain on early termination of finance lease |
(917 | ) | (1,052 | ) | ||||
| Gain on disposal of equipment |
— | (15 | ) | |||||
| Change in: |
||||||||
| Accounts receivable |
(267 | ) | 179 | |||||
| Other assets |
7 | (15 | ) | |||||
| Accounts payable and accrued liabilities |
4 | (157 | ) | |||||
| Accrued interest payable |
(37 | ) | (32 | ) | ||||
| Management fees payable |
22 | 13 | ||||||
| Other liabilities |
379 | (10 | ) | |||||
|
|
|
|
|
|||||
| Net cash provided by operating activities |
13,286 | 15,851 | ||||||
|
|
|
|
|
|||||
| CASH FLOWS FROM INVESTING ACTIVITIES: |
||||||||
| Principal collections on direct finance leases |
40,082 | 42,961 | ||||||
| Proceeds from early termination of finance lease |
20,335 | 5,990 | ||||||
| Proceeds from disposal of equipment |
— | 121 | ||||||
| Restricted cash |
1,115 | 70 | ||||||
|
|
|
|
|
|||||
| Net cash provided by investing activities |
61,532 | 49,142 | ||||||
|
|
|
|
|
|||||
| CASH FLOWS FROM FINANCING ACTIVITIES: |
||||||||
| Principal repayments on term loan |
(36,325 | ) | (41,657 | ) | ||||
| Principal repayments on loans payable to affiliates |
(8,634 | ) | (8,846 | ) | ||||
| Principal repayments on syndication liabilities |
(4,609 | ) | (3,617 | ) | ||||
| Deferred financing fee |
(15 | ) | (50 | ) | ||||
| Capital distributions |
(24,674 | ) | (10,728 | ) | ||||
|
|
|
|
|
|||||
| Net cash provided by financing activities |
(74,257 | ) | (64,898 | ) | ||||
|
|
|
|
|
|||||
| Net increase in cash and cash equivalents |
561 | 95 | ||||||
| Cash and cash equivalents, beginning of year |
4,653 | 4,558 | ||||||
|
|
|
|
|
|||||
| Cash and cash equivalents, end of year |
$ | 5,214 | $ | 4,653 | ||||
|
|
|
|
|
|||||
| SUPPLEMENTAL DISCLOSURE: |
||||||||
| Cash paid for interest |
$ | 4,782 | $ | 6,613 | ||||
|
|
|
|
|
|||||
See notes to consolidated financial statements.
F-54
Table of Contents
CONSOLIDATED STATEMENTS OF MEMBERS’ EQUITY
(dollar amounts in thousands)
| WWTAI Container HoldCo Ltd |
Deutsche Bank AG |
Total | ||||||||||
| Members’ Equity at December 31, 2012 |
$ | 15,458 | $ | 14,851 | $ | 30,309 | ||||||
| Capital distributions |
(5,898 | ) | (4,830 | ) | (10,728 | ) | ||||||
| Comprehensive income: |
||||||||||||
| Net income for the period |
7,268 | 6,983 | 14,251 | |||||||||
| Other comprehensive income |
— | — | — | |||||||||
|
|
|
|
|
|
|
|||||||
| Total comprehensive income |
7,268 | 6,983 | 14,251 | |||||||||
|
|
|
|
|
|
|
|||||||
| Members’ Equity at December 31, 2013 |
16,828 | 17,004 | 33,832 | |||||||||
| Capital distributions |
(12,587 | ) | (12,087 | ) | (24,674 | ) | ||||||
| Comprehensive income: |
||||||||||||
| Net income for the period |
5,815 | 5,587 | 11,402 | |||||||||
| Other comprehensive income |
— | — | — | |||||||||
|
|
|
|
|
|
|
|||||||
| Total comprehensive income |
5,815 | 5,587 | 11,402 | |||||||||
|
|
|
|
|
|
|
|||||||
| Members’ Equity at December 31, 2014 |
$ | 10,056 | $ | 10,504 | $ | 20,560 | ||||||
|
|
|
|
|
|
|
|||||||
See notes to consolidated financial statements.
F-55
Table of Contents
NOTES TO CONSOLIDATED FINANCIAL STATEMENTS
(dollar amounts in thousands, unless otherwise noted)
| 1. | ORGANIZATION |
Intermodal Finance I Ltd. (“Intermodal Finance”) is a Cayman Islands Limited Liability Company which was formed on August 21, 2012 for the object and purpose of, directly or indirectly, investing in portfolios of shipping containers subject to operating leases or direct financing leases, and engaging in all activities incidental hereto.
The members of Intermodal Finance are WWTAI Container HoldCo, with a 51% interest, and Deutsche Bank AG, Cayman Islands Branch, with a 49% interest. Intermodal Finance shall continue in existence until such time as its members determine upon its winding up and dissolution. Intermodal Finance commenced operations on September 5, 2012.
| 2. | SUMMARY OF SIGNIFICANT ACCOUNTING POLICIES |
Basis of Accounting—The accompanying consolidated financial statements are prepared in accordance with U.S. generally accepted accounting principles (“GAAP”) and include the accounts of Intermodal Finance and its subsidiaries. Intermodal Finance consolidates those entities which it has an investment of 50% or more and in which it has control over significant operating decisions, as well as variable interest entities in which Intermodal Finance is the primary beneficiary. All significant intercompany transactions and balances have been eliminated.
Intermodal Finance holds a variable interest in WWTAI Container 1 Ltd (“Container 1”), an entity which holds an investment in four direct finance leases, and has determined that it is the primary beneficiary of Container 1. Accordingly, Intermodal Finance consolidates Container 1 (collectively, the “Company”).
Use of Estimates—The preparation of financial statements in conformity with GAAP requires management to make estimates and assumptions that affect the reported amounts of assets and liabilities, the disclosure of contingent assets and liabilities at the date of the consolidated financial statements and the reported amounts of revenues and expenses during the reporting period. Actual results could differ from those estimates.
Risks and Uncertainties—In the normal course of business, the Company may encounter two significant types of economic risk: credit risk and market risk. Credit risk is the risk of default on leases, loans, securities or derivatives, as applicable, which results from the inability or unwillingness of a lessee, borrower, or derivative counterparty to make required or expected payments. Market risk reflects changes in the value of leasing assets (including residual value estimates), loans, securities or derivatives, as applicable, due to changes in interest rates or other market factors, including the value of the collateral underlying loans and the valuation of equity and debt securities. The Company conducts operations outside of the United States; such international operations are subject to risks, such as unexpected changes in regulatory requirements, heightened risk of political and economic instability, potentially adverse tax consequences and the burden of complying with foreign laws.
Cash and Cash Equivalents—The Company considers all highly liquid short-term investments with a maturity of 90 days or less when purchased to be cash equivalents. Substantially all of the Company’s amounts on deposit with major financial institutions exceed insured limits.
Restricted Cash—Restricted cash consists of cash held in segregated accounts pursuant to the requirements of the Company’s Term Loan agreement (Note 4).
Deferred Costs and Amortization—Deferred financing costs incurred in connection with the Term Loan are amortized over the seven year term of the underlying loan. Amortization expense for the year ended December 31, 2014 and 2013 was approximately $277 thousand and $274 thousand, respectively.
F-56
Table of Contents
INTERMODAL FINANCE I LTD.
NOTES TO CONSOLIDATED FINANCIAL STATEMENTS
(dollar amounts in thousands, unless otherwise noted)
Deferred costs also include a commission paid to a third party in connection with the acquisition and leaseback of a portfolio of shipping containers. This commission is being amortized using the straight line method over the term of the underlying lease. Amortization expense for the year ended December 31, 2014 and 2013 was approximately $248 thousand and $245 thousand, respectively.
Direct Finance Leases—Direct finance leases are recorded at the aggregated future minimum lease payments, including any bargain or economically compelled purchase options granted to the customer, less unearned income.
Leasing Equipment—Shipping containers held for lease are stated at initial cost and are depreciated on a straight-line basis to an estimated residual value over a 15 year useful life from date of manufacture. The shipping containers owned by the Company are being depreciated over remaining useful lives ranging from 5.5 to 7.5 years. Depreciation expense for the years ended December 31, 2014 and 2013 was $2,168 thousand and $2,170 thousand, respectively.
The Company recognizes repair and maintenance costs that do not extend the lives of the assets as incurred and includes them as a component of direct operating expenses in the consolidated statement of income.
The Company performs a recoverability assessment of shipping container portfolios at least annually. In addition, a recoverability assessment is performed whenever events or changes in circumstances, or indicators, indicate that the carrying amount or net book value of an asset may not be recoverable. Indicators may include, but are not limited to, a decline in demand for the types of equipment owned by the Company, or other indicators of obsolescence. When performing a recoverability assessment, the Company measures whether the estimated future undiscounted net cash flows expected to be generated by the equipment exceed its net book value. The undiscounted cash flows consist of cash flows from currently contracted leases, future projected lease rates, transition costs, estimated down time and estimated residual or scrap values for the equipment. In the event that the equipment does not meet the recoverability test, the carrying value of the equipment will be adjusted to fair value resulting in an impairment charge.
Management of the Company develops the assumptions used in the recoverability analysis based on its knowledge of active lease contracts, current and future expectations of the global demand for a particular container type and historical experience in the container leasing market, as well as information received from third party industry sources. The factors considered in estimating the undiscounted cash flows are impacted by changes in future periods due to changes in contracted lease rates, residual values, economic conditions, technology, demand for a particular container type and other factors.
Revenue Recognition—The Company leases shipping containers pursuant to operating leases. Operating leases with fixed rentals and step rentals are recognized on a straight-line basis over the term of the initial lease, assuming no renewals.
The Company determines the provision for doubtful accounts based on its assessment of the collectability of its receivables on a customer-by-customer basis and places a likelihood of default percentage on each delinquent account individually. Changes in economic conditions may require a re-assessment of the risk and could result in increases or decreases in the allowance for doubtful accounts. At December 31, 2014 and 2013, there were no provisions for doubtful accounts on the Company’s accounts receivable.
The Company also holds a portfolio of direct finance lease receivables. In most instances, the leases include a bargain purchase option to purchase the leased equipment at the end of the lease term. Net investment in direct finance leases represents the receivables due from lessees, net of unearned income. The lease payments are segregated into principal and interest components similar to a loan. Unearned income is recognized on an effective interest method over the life of the lease term and is recorded as finance revenue
F-57
Table of Contents
INTERMODAL FINANCE I LTD.
NOTES TO CONSOLIDATED FINANCIAL STATEMENTS
(dollar amounts in thousands, unless otherwise noted)
in the consolidated statement of income. The principal component of the lease payment is reflected as a reduction to the net investment in direct finance leases.
Expense Recognition—The Company recognizes expenses as incurred on an accrual basis.
Comprehensive Income—Comprehensive income consists of net income and other gains and losses, net of tax, if any, affecting shareholders’ equity that, under GAAP, are excluded from net income. Such amounts include the changes in the fair value of derivative instruments, reclassification into the earnings of amounts previously deferred relating to the derivative instruments and foreign currency translation gains and losses. For the year ended December 31, 2014 and 2013, there were no differences between the Company’s comprehensive income and the net income as presented in the consolidated statement of operations.
Foreign Currency—The Company’s functional and reporting currency is the U.S. dollar. Purchases and sales of assets and income and expense items denominated in foreign currencies are translated into U.S. dollar amounts on the respective dates of such transactions. Differences between these recorded amounts and the U.S. dollar equivalent actually received or paid are reported as net realized foreign currency gains or losses.
Federal Income Taxes—No income taxes have been provided for in these consolidated financial statements as each investor in the Company is individually responsible for reporting income or loss based upon its respective share of the Company’s income and expenses as reported for income tax purposes.
There are no uncertain tax positions that would require recognition in the consolidated financial statements. The Company files income tax returns in the U.S. federal jurisdiction and various state jurisdictions. The income tax returns filed by the Company are subject to examination by the U.S. Federal and state tax authorities.
Distributions and Allocations to Members—Distributions to members are recorded when paid or, in the case of an in-kind distribution, when distributed. The character of distributions made during the reporting period may differ from their ultimate characterization for federal income tax purposes due to book/tax differences in the character of income and expense recognition. Distributions and allocations are determined with respect to each member, as defined by and in accordance with the operating agreement.
Concentration of Credit Risk—The Company is subject to concentrations of credit risk with respect to amounts due from customers on its direct finance leases and operating leases. The Company attempts to limit its credit risk by performing ongoing credit evaluations. The Company’s three largest customers represented approximately 15%, 11%, and 16%, 11% (direct finance lease customers) and 58% and 47% (operating lease customer), respectively, of revenues for the years ended December 31, 2014 and 2013. Based on the in-place operating lease contract at December 31, 2014 and 2013, the maximum amount of loss the Company would incur if the operating lease customer failed completely to perform according to the terms of the lease would be approximately $13,479 and $25,900 million, respectively. As it relates to the Company’s direct finance lease portfolio, the three largest customers account for approximately 56%, 14% and 11% and 37%, 24% and 11%, of the outstanding principal at December 31, 2014 and 2013, respectively. If any of these customers were to default, the Company would seek to recover the equipment securing the lease, with a view towards either selling or re-leasing the equipment. To date, the Company has not experienced any losses related to direct finance leases and does not expect future uncollectible amounts related to the principal balances receivable.
Deterioration in credit quality of several of the Company’s major customers could have an adverse effect on its consolidated financial position and operating results. Management does not believe significant risk exists in connection with the Company’s concentrations of credit as of December 31, 2014 and 2013.
F-58
Table of Contents
INTERMODAL FINANCE I LTD.
NOTES TO CONSOLIDATED FINANCIAL STATEMENTS
(dollar amounts in thousands, unless otherwise noted)
Unadopted Accounting Pronouncements—In May 2013, the FASB issued a revised exposure draft, “Leases” (the “Lease ED”), which would replace the existing guidance in the Accounting Standards Codification 840 (“ASC 840”), Leases. Pursuant to the Lease ED, leases would be classified as either leases of property or leases of assets other than property. Leases of property will continue to use operating lease accounting. Leases of other than property would use the receivable residual approach. Under the receivable residual approach, a lease receivable would be recognized for the lessor’s right to receive lease payments, a portion of the carrying amount of the underlying asset would be allocated between the right of use granted to the lessee and the lessor’s residual value and profit or loss would only be recognized at commencement if it is reasonably assured. It is anticipated that the final standard would have an effective date no earlier than 2017. When and if the proposed guidance becomes effective, it may have a significant impact on the Company’s consolidated financial statements. Although the presentation of the Company’s financial statements, and those of its lessees would change under the proposed standard, management of the Company does not believe the proposed standard will have a material impact on the business of the Company.
| 3. | SHIPPING CONTAINER PORTFOLIOS |
Direct Finance Lease Portfolio—On September 5, 2012, the Company acquired a portfolio of 28 direct finance leases (“DFL’s”) representing 10 customers and comprising approximately 97,500 shipping containers for a net purchase price of $165,149. At the date of acquisition, the DFL’s had remaining terms ranging from 5 months to 5.33 years. At the date of acquisition, the remaining outstanding balance of the DFL’s was approximately $202,800, of which four of the DFL’s were subject to non-recourse syndication liabilities to third parties having an aggregate outstanding balance of approximately $21,800 (Note 5). In accordance with ASC 805, Business Combinations, the company allocated the purchase price to the acquired assets and assumed liabilities based upon their relative fair values, as follows:
| DFL receivables |
$ | 184,681 | ||
| Cash |
471 | |||
| Accounts payable |
(471 | ) | ||
| Syndication liabilities |
(19,532 | ) | ||
|
|
|
|||
| Total |
$ | 165,149 | ||
|
|
|
In September 2014, one of the DFL lessees completed an early buy-out of its obligations under three DFL’s for a payment of $20,335. Such amount exceeded the carrying values of these DFL’s by $917, which has been recorded as a gain on early termination of finance lease in the accompanying consolidated statement of income.
In March 2013, one of the DFL lessees completed an early buy-out of its obligations under the DFL for a payment of $5,990. Such amount exceeded the carrying value by $1,052, which has been recorded as a gain on early termination of finance lease in the accompanying consolidated statement of income.
At December 31, 2014 and 2013 the components of the Company’s net investment in direct financing leases are comprised as follows:
| 2014 | 2013 | |||||||
| Minimum lease payments |
$ | 70,326 | $ | 139,606 | ||||
| Less: Unearned income |
(7,933 | ) | (17,713 | ) | ||||
|
|
|
|
|
|||||
| Net investment in direct finance leases |
$ | 62,393 | $ | 121,893 | ||||
|
|
|
|
|
|||||
F-59
Table of Contents
INTERMODAL FINANCE I LTD.
NOTES TO CONSOLIDATED FINANCIAL STATEMENTS
(dollar amounts in thousands, unless otherwise noted)
Future minimum lease payments to be received under direct finance leases for the next five years and thereafter are as follows:
| Year Ending December 31, |
Amount | |||
| 2015 |
$ | 32,921 | ||
| 2016 |
18,712 | |||
| 2017 |
11,092 | |||
| 2018 |
5,971 | |||
| 2019 |
1,630 | |||
|
|
|
|||
| Total |
$ | 70,326 | ||
|
|
|
|||
Operating Lease Portfolio—On December 17, 2012, the Company acquired a portfolio of approximately 38,300 shipping containers for a purchase price of approximately $78,600 and simultaneously leased them back to the seller pursuant to nine separate operating leases having terms ranging from 27 months to 42 months. Pursuant to ASC 805-50, the entire purchase price was allocated to the underlying shipping containers.
Minimum future annual lease rentals to be received pursuant to operating leases of shipping containers at December 31, 2014 are as follows:
| Year Ending December 31, |
Amount | |||
| 2015 |
$ | 10,675 | ||
| 2016 |
2,804 | |||
|
|
|
|||
| Total |
$ | 13,479 | ||
|
|
|
|||
| 4. | DEBT |
Term Loan Payable
On September 5, 2012, the Company entered in to a Term Loan Agreement (the “Term Loan”) with Deutsche Bank AG, Cayman Islands Branch (the “Lender”) for an initial aggregate amount of $125,000 in connection with the acquisition of a portfolio of shipping containers subject to direct finance leases. On December 17, 2012 the Term Loan was amended to provide for an additional borrowing of $53,000 which was used in connection with the acquisition of a portfolio of shipping containers subject to operating leases. Borrowings under the Term Loan bear interest at either (i) LIBOR plus 3% or (ii) a Base Rate (equal to the higher of the Prime Rate or the Federal Funds Rate, plus 0.50%) plus a spread of 0.25%. In addition, an administrative agent fee calculated at a rate of 0.50% per annum is also payable. In April 2013, the administrative agent fee rate was reduced to 0.25%. In October 2014, the LIBOR spread was reduced to 2.75%. All borrowings under the Term Loan as of December 31, 2014 and 2013 were LIBOR based borrowings and the interest rate at December 31, 2014 and 2013 was approximately 2.91% and 3.17%, respectively (exclusive of the administrative agent fee). The Term Loan requires monthly payments of interest, administrative agent fees and scheduled amortization payments through its maturity on September 25, 2019. The Term Loan is secured by the Company’s interest in the shipping containers and related direct finance leases and operating lease agreements. Interest expense on the Term Loan for year ended December 31, 2014 and 2013 was $3,758 and $5,000, respectively, exclusive of administrative agent fees of $304 and $515, respectively.
F-60
Table of Contents
INTERMODAL FINANCE I LTD.
NOTES TO CONSOLIDATED FINANCIAL STATEMENTS
(dollar amounts in thousands, unless otherwise noted)
Pursuant to the Term Loan agreement, amounts realized by the Company from its operations during each Collection Period, as defined, are accumulated as restricted cash in a Collection Account for disbursement according to payment priorities specified in the Term Loan agreement. Residual amounts remaining in the Collection Account after payment of required obligations are released to the Company.
Scheduled principal repayments under the Term Loan for the next five years and thereafter are summarized as follows:
| Year |
Amount | |||
| 2015 |
$ | 30,709 | ||
| 2016 |
20,887 | |||
| 2017 |
12,276 | |||
| 2018 |
5,969 | |||
| 2019 |
21,039 | |||
| Thereafter |
6,847 | |||
|
|
|
|||
| Total |
$ | 97,727 | ||
|
|
|
|||
Class B Term Loan Payable to Affiliates
On September 5, 2012, the Company entered in to a Class B Term Loan Agreement (the Class B Loan”) with its members, pursuant to which it borrowed an initial aggregate amount of $25,000 in connection with the acquisition of a portfolio of shipping containers subject to direct finance leases. On December 17, 2012 the Class B Loan was amended to provide for an additional borrowing of approximately $15,100 which was used in connection with the acquisition of a portfolio of shipping containers subject to operating leases. Borrowings under the Class B Loan are unsecured and bear interest at a rate of 2%. Interest expense on the Class B Loan for the year ended December 31, 2014 and 2013 was approximately $545 and $737, respectively. Payments of principal and interest on the Class B Loan are subject to the available cash flow of the Company remaining in the Collection Account after satisfaction of senior payment priorities as delineated in the Term Loan agreement. The Class B Loan matures on September 25, 2017, at which time all remaining balances of principal and accrued interest are due.
Remaining scheduled principal repayments under the Class B Loan are summarized as follows:
| Year |
Amount | |||
| 2015 |
$ | 4,462 | ||
| 2016 |
712 | |||
| 2017 |
17,402 | |||
|
|
|
|||
| Total |
$ | 22,576 | ||
|
|
|
|||
| 5. | SYNDICATION LIABILITIES |
In connection with the acquisition of the DFL’s in September 2012, the Company assumed syndication liabilities to third parties relating to four of the acquired DFL contracts. The syndication liabilities have remaining terms equal to the remaining terms of the associated DFL contracts, which range from 28 months to 42 months. The acquisition date fair value ascribed to these obligations was approximately $19,500. Interest on the syndication liabilities is recognized using the effective interest method at rates which range
F-61
Table of Contents
INTERMODAL FINANCE I LTD.
NOTES TO CONSOLIDATED FINANCIAL STATEMENTS
(dollar amounts in thousands, unless otherwise noted)
from 2.30% to 4.44%. Interest expense recognized on the syndication liabilities amounted to approximately $561 and $845 during the year ended December 31, 2014 and 2013. The obligations pursuant to these arrangements are non recourse to the Company and the sole source of payment for these obligations is the cash flows generated from the underlying DFL contracts.
In September 2014, in connection with the early termination of three DFL’s, the Company settled the associated liabilities related to the syndication holder in those DFL contracts and extinguished the liabilities at their nominal value of approximately $2,136. The amount paid exceeded the carrying value by approximately $119 thousand, accordingly such amount has been reflected in the accompanying statement of income as a loss on extinguishment of debt.
Scheduled repayments of the syndication liabilities for the remaining terms of the associated DFL contracts summarized as follows:
| Year |
Amount | |||
| 2015 |
$ | 1,951 | ||
| 2016 |
1,994 | |||
| 2017 |
1,207 | |||
|
|
|
|||
| Total |
$ | 5,152 | ||
|
|
|
|||
| 6. | MANAGEMENT AGREEMENT |
The Company has engaged Container Leasing International LLC (the “Manager”) to manage and administer its DFL portfolio pursuant to a management agreement having an initial term of 10 years and providing for three additional extension terms of one-year each. Pursuant to the management agreement, the Manager receives (i) a base monthly fee equal to 1.5% of payments received on the DFL contracts and is entitled to receive additional fees, as applicable, equal to (a) 5% of the sum of net sales proceeds and casualty proceeds for containers which have been sold or lost and (b) a recovery fee of 25 dollars for each container recovered by the Manager following the occurrence of a lessee default under a DFL contract and (ii) a base monthly fee equal to (a) 4% of the Net Operating Income, as defined, of the containers subject to operating leases and an additional fee of 5% of the net sales proceeds from the sale or disposal of containers subject to operating leases.
| 7. | FAIR VALUE OF FINANCIAL INSTRUMENTS |
In assessing the fair value of financial instruments, the Company applies the provisions included in ASC 820 “Fair Value Measurements and Disclosures.” ASC 820 provides that fair value is a market-based measurement, not an entity-specific measurement. It further clarifies that fair value is an exit price, representing the price that would be received to sell an asset or paid to transfer a liability in the principal or most advantageous market in an orderly transaction between market participants on the measurement date. ASC 820 requires the use of valuation techniques to measure fair value that maximize the use of observable inputs and minimize use of unobservable inputs. These inputs are prioritized as follows:
| • | Level 1: Observable inputs such as quoted prices in active markets for identical assets or liabilities. |
| • | Level 2: Inputs other than quoted prices included within Level 1 that are observable for the asset or liability, either directly or indirectly. Level 2 inputs include quoted prices for similar assets or liabilities |
F-62
Table of Contents
INTERMODAL FINANCE I LTD.
NOTES TO CONSOLIDATED FINANCIAL STATEMENTS
(dollar amounts in thousands, unless otherwise noted)
| in active markets and inputs other than quoted prices that are observable for the asset or liability, such as interest rates and yield curves that are observable at commonly quoted intervals. |
| • | Level 3: Unobservable inputs for which there is little or no market data and which require internal development of assumptions about how market participants price the asset or liability. |
The Company’s financial instruments consist principally of cash and cash equivalents, restricted cash, accounts receivable, accounts payable and accrued liabilities, term loan payable, loans payable to affiliates and syndication liabilities. The fair value of cash and cash equivalents, restricted cash, accounts receivable and accounts payable and accrued liabilities approximates their carrying values because of their short term nature.
The fair value of the term loan payable is based on inputs classified as Level 2 in the fair value hierarchy and approximates its carrying value because such loan bears interest at a floating market rate for similar types of loans.
The fair value of loans payable to affiliates approximates its carrying value as such loans bear interest at market rate for similar types of instruments.
| 8. | SUBSEQUENT EVENTS |
The Company has evaluated whether any material events have occurred subsequent to the balance sheet date through April 15, 2015 the date the consolidated financial statements were available to be issued.
F-63
Table of Contents
OTHER FINANCIAL INFORMATION
F-64
Table of Contents
Consolidating Balance Sheet
(dollar amounts in thousands)
December 31, 2014
| Intermodal Finance I Ltd |
WWTAI Container I Ltd |
Eliminations | Consolidated Intermodal Finance I Ltd |
|||||||||||||
| ASSETS |
||||||||||||||||
| Cash and cash equivalents |
$ | 1,573 | $ | 3,641 | $ | — | $ | 5,214 | ||||||||
| Restricted cash |
2,320 | — | — | 2,320 | ||||||||||||
| Accounts receivable |
1,051 | — | — | 1,051 | ||||||||||||
| Leasing equipment, net of accumulated depreciation of $4,449 |
74,045 | — | — | 74,045 | ||||||||||||
| Net investment in direct finance leases |
22,940 | 39,453 | — | 62,393 | ||||||||||||
| Deferred costs, net of accumulated amortization of $602 |
1,524 | — | — | 1,524 | ||||||||||||
| Other assets |
8 | — | — | 8 | ||||||||||||
| Due from affiliates |
37,561 | — | (37,561 | ) | — | |||||||||||
|
|
|
|
|
|
|
|
|
|||||||||
| Total assets |
$ | 141,022 | $ | 43,094 | $ | (37,561 | ) | $ | 146,555 | |||||||
|
|
|
|
|
|
|
|
|
|||||||||
| LIABILITIES |
||||||||||||||||
| Accounts payable and accrued liabilities |
$ | 44 | $ | — | $ | — | $ | 44 | ||||||||
| Management fees payable |
92 | — | — | 92 | ||||||||||||
| Accrued interest payable |
19 | — | — | 19 | ||||||||||||
| Accrued interest payable to affiliates |
2 | — | — | 2 | ||||||||||||
| Term loan payable |
97,727 | — | — | 97,727 | ||||||||||||
| Loans payable to affiliates |
22,576 | — | — | 22,576 | ||||||||||||
| Syndication liabilities |
— | 5,152 | — | 5,152 | ||||||||||||
| Other liabilities |
2 | 381 | — | 383 | ||||||||||||
| Due to affiliate |
— | 37,561 | (37,561 | ) | — | |||||||||||
|
|
|
|
|
|
|
|
|
|||||||||
| Total liabilities |
120,462 | 43,094 | (37,561 | ) | 125,995 | |||||||||||
|
|
|
|
|
|
|
|
|
|||||||||
| Members’ equity |
20,560 | — | — | 20,560 | ||||||||||||
|
|
|
|
|
|
|
|
|
|||||||||
| Total liabilities and members’ equity |
$ | 141,022 | $ | 43,094 | $ | (37,561 | ) | $ | 146,555 | |||||||
|
|
|
|
|
|
|
|
|
|||||||||
F-65
Table of Contents
Consolidating Balance Sheet
(dollar amounts in thousands)
December 31, 2013
| Intermodal Finance I Ltd |
WWTAI Container I Ltd |
Eliminations | Consolidated Intermodal Finance I Ltd |
|||||||||||||
| ASSETS |
||||||||||||||||
| Cash and cash equivalents |
$ | 1,729 | $ | 2,924 | $ | — | $ | 4,653 | ||||||||
| Restricted cash |
3,435 | — | — | 3,435 | ||||||||||||
| Accounts receivable |
784 | — | — | 784 | ||||||||||||
| Leasing equipment, net of accumulated depreciation of $2,281 |
76,214 | — | — | 76,214 | ||||||||||||
| Net investment in direct finance leases |
54,256 | 67,637 | — | 121,893 | ||||||||||||
| Deferred costs, net of accumulated amortization of $583 |
2,033 | — | — | 2,033 | ||||||||||||
| Other Assets |
12 | 3 | — | 15 | ||||||||||||
| Due from affiliates |
60,803 | — | (60,803 | ) | — | |||||||||||
|
|
|
|
|
|
|
|
|
|||||||||
| Total assets |
$ | 199,266 | $ | 70,564 | $ | (60,803 | ) | $ | 209,027 | |||||||
|
|
|
|
|
|
|
|
|
|||||||||
| LIABILITIES |
||||||||||||||||
| Accounts payable and accrued liabilities |
$ | 40 | $ | — | $ | — | $ | 40 | ||||||||
| Management fees payable |
70 | — | — | 70 | ||||||||||||
| Accrued interest payable |
51 | — | — | 51 | ||||||||||||
| Accrued interest payable to affiliates |
7 | — | — | 7 | ||||||||||||
| Term loan payable |
134,052 | — | — | 134,052 | ||||||||||||
| Loans payable to affiliates |
31,210 | — | — | 31,210 | ||||||||||||
| Syndication liabilities |
— | 9,761 | — | 9,761 | ||||||||||||
| Other liabilities |
4 | — | — | 4 | ||||||||||||
| Due to affiliate |
— | 60,803 | (60,803 | ) | — | |||||||||||
|
|
|
|
|
|
|
|
|
|||||||||
| Total liabilities |
165,434 | 70,564 | (60,803 | ) | 175,195 | |||||||||||
| Members’ equity |
33,832 | — | — | 33,832 | ||||||||||||
|
|
|
|
|
|
|
|
|
|||||||||
| Total liabilities and members’ equity |
$ | 199,266 | $ | 70,564 | $ | (60,803 | ) | $ | 209,027 | |||||||
|
|
|
|
|
|
|
|
|
|||||||||
F-66
Table of Contents
Consolidating Statement of Income
(dollar amounts in thousands)
Year Ended December 31, 2014
| Intermodal Finance I Ltd |
WWTAI Container I Ltd |
Eliminations | Consolidated Intermodal Finance I Ltd |
|||||||||||||
| REVENUES |
||||||||||||||||
| Equipment leasing revenue |
$ | 12,380 | $ | — | $ | — | $ | 12,380 | ||||||||
| Finance revenue |
4,444 | 3,507 | — | 7,951 | ||||||||||||
| Participation income-affiliate |
3,300 | — | (3,300 | ) | — | |||||||||||
| Other income |
— | 45 | — | 45 | ||||||||||||
| Gain on early termination of finance lease |
329 | 588 | — | 917 | ||||||||||||
| Gain on disposal of equipment |
— | — | — | — | ||||||||||||
|
|
|
|
|
|
|
|
|
|||||||||
| Total revenues |
20,453 | 4,140 | (3,300 | ) | $ | 21,293 | ||||||||||
|
|
|
|
|
|
|
|
|
|||||||||
| EXPENSES |
||||||||||||||||
| Direct operating expenses |
— | 207 | — | 207 | ||||||||||||
| Management fee |
1,527 | — | — | 1,527 | ||||||||||||
| Depreciation and amortization |
2,416 | — | — | 2,416 | ||||||||||||
| Interest expense |
4,035 | 442 | — | 4,477 | ||||||||||||
| Interest expense—affiliates |
545 | — | — | 545 | ||||||||||||
| General and administrative expense |
528 | 72 | — | 600 | ||||||||||||
| Loss on debt extinguishment |
— | 119 | — | 119 | ||||||||||||
| Participation expense-affiliate |
— | 3,300 | (3,300 | ) | — | |||||||||||
|
|
|
|
|
|
|
|
|
|||||||||
| Total expenses |
9,051 | 4,140 | (3,300 | ) | 9,891 | |||||||||||
|
|
|
|
|
|
|
|
|
|||||||||
| NET INCOME |
$ | 11,402 | $ | — | $ | — | $ | 11,402 | ||||||||
|
|
|
|
|
|
|
|
|
|||||||||
F-67
Table of Contents
Intermodal Finance I Ltd.
Consolidating Statement of Income
(dollar amounts in thousands)
Year Ended December 31, 2013
| Intermodal Finance I Ltd |
WWTAI Container I Ltd |
Eliminations | Consolidated Intermodal Finance I Ltd |
|||||||||||||
| REVENUES |
||||||||||||||||
| Equipment leasing revenue |
$ | 12,393 | $ | — | $ | — | $ | 12,393 | ||||||||
| Finance revenue |
5,723 | 6,759 | — | 12,482 | ||||||||||||
| Participation income—affiliate |
5,524 | — | (5,524 | ) | — | |||||||||||
| Other income |
6 | — | — | 6 | ||||||||||||
| Gain on early termination of finance lease |
1,052 | 1,052 | ||||||||||||||
| Gain on disposal of equipment |
15 | — | — | 15 | ||||||||||||
|
|
|
|
|
|
|
|
|
|||||||||
| Total revenues |
24,713 | 6,759 | (5,524 | ) | $ | 25,948 | ||||||||||
|
|
|
|
|
|
|
|
|
|||||||||
| EXPENSES |
||||||||||||||||
| Direct operating expenses |
— | 382 | — | 382 | ||||||||||||
| Management fee |
1,389 | — | — | 1,389 | ||||||||||||
| Depreciation and amortization |
2,415 | — | — | 2,415 | ||||||||||||
| Interest expense |
5,273 | 844 | — | 6,117 | ||||||||||||
| Interest expense—affiliates |
737 | — | — | 737 | ||||||||||||
| General and administrative expense |
648 | 9 | — | 657 | ||||||||||||
| Participation expense—affiliate |
— | 5,524 | (5,524 | ) | — | |||||||||||
|
|
|
|
|
|
|
|
|
|||||||||
| Total expenses |
10,462 | 6,759 | (5,524 | ) | 11,697 | |||||||||||
|
|
|
|
|
|
|
|
|
|||||||||
| NET INCOME |
$ | 14,251 | $ | — | $ | — | $ | 14,251 | ||||||||
|
|
|
|
|
|
|
|
|
|||||||||
F-68
Table of Contents
To the Members of
Jefferson Refinery, LLC and Subsidiaries
The Woodlands, Texas
We have audited the accompanying consolidated financial statements of Jefferson Refinery, LLC and Subsidiaries (collectively, the “Company”), which comprise the consolidated balance sheets as of December 31, 2013 and 2012, and the related consolidated statements of operations and comprehensive loss, members’ equity, and cash flows for the years then ended, and the related notes to the consolidated financial statements.
Management’s Responsibility for the Consolidated Financial Statements
Management is responsible for the preparation and fair presentation of these consolidated financial statements in accordance with accounting principles generally accepted in the United States of America; this includes the design, implementation, and maintenance of internal control relevant to the preparation and fair presentation of consolidated financial statements that are free from material misstatement, whether due to fraud or error.
Auditor’s Responsibility
Our responsibility is to express an opinion on these consolidated financial statements based on our audits. We conducted our audits in accordance with auditing standards generally accepted in the United States of America. Those standards require that we plan and perform the audits to obtain reasonable assurance about whether the consolidated financial statements are free from material misstatement.
An audit involves performing procedures to obtain audit evidence about the amounts and disclosures in the consolidated financial statements. The procedures selected depend on the auditor’s judgment, including the assessment of the risks of material misstatement of the consolidated financial statements, whether due to fraud or error. In making those risk assessments, the auditor considers internal control relevant to the entity’s preparation and fair presentation of the consolidated financial statements in order to design audit procedures that are appropriate in the circumstances, but not for the purpose of expressing an opinion on the effectiveness of the entity’s internal control. Accordingly, we express no such opinion. An audit also includes evaluating the appropriateness of accounting policies used and the reasonableness of significant accounting estimates made by management, as well as evaluating the overall presentation of the consolidated financial statements.
We believe that the audit evidence we have obtained is sufficient and appropriate to provide a basis for our audit opinion.
Opinion
In our opinion, the consolidated financial statements referred to above present fairly, in all material respects, the consolidated financial position of Jefferson Refinery, LLC and Subsidiaries as of December 31, 2013 and 2012, and the consolidated results of their operations and their cash flows for the years then ended in accordance with accounting principles generally accepted in the United States of America.
Emphasis-of-Matter – Asset Purchase Agreement
As discussed in Note L, on June 5, 2014, the Company entered into an asset purchase agreement, which closed on August 27, 2014, whereby substantially all of the Company’s assets and liabilities were sold. Our opinion is not modified with respect to that matter.
/s/ UHY LLP
Houston, Texas
August 27, 2014
F-69
Table of Contents
JEFFERSON REFINERY, LLC AND SUBSIDIARIES
| December 31, | ||||||||
| 2013 | 2012 | |||||||
| ASSETS |
||||||||
| CURRENT ASSETS |
||||||||
| Cash and cash equivalents |
$ | 170,439 | $ | 157,921 | ||||
| Other receivables |
90,300 | — | ||||||
| Prepaid expenses |
183,823 | — | ||||||
| Other current assets |
5,349 | 5,349 | ||||||
|
|
|
|
|
|||||
| TOTAL CURRENT ASSETS |
449,911 | 163,270 | ||||||
| PROPERTY AND EQUIPMENT, NET |
117,656,222 | 34,746,409 | ||||||
| DEBT ISSUE COSTS, NET |
4,351,040 | 3,526,708 | ||||||
| RESTRICTED CASH |
307,862,582 | 336,709,590 | ||||||
| OTHER ASSETS |
3,730 | 19,583 | ||||||
|
|
|
|
|
|||||
| TOTAL ASSETS |
$ | 430,323,485 | $ | 375,165,560 | ||||
|
|
|
|
|
|||||
| LIABILITIES AND MEMBERS’ EQUITY |
||||||||
| CURRENT LIABILITIES |
||||||||
| Accounts payable |
$ | 5,479,919 | $ | 1,982,250 | ||||
| Accounts payable – related parties |
18,202,303 | 377,733 | ||||||
| Accrued expenses |
8,084,649 | 6,057,447 | ||||||
| Current portion of long-term debt |
27,021,129 | 15,509,796 | ||||||
| Current portion of bonds payable |
80,000 | 70,000 | ||||||
| Deferred revenue |
21,297,086 | — | ||||||
|
|
|
|
|
|||||
| TOTAL CURRENT LIABILITIES |
80,165,086 | 23,997,226 | ||||||
| LONG-TERM LIABILITIES |
||||||||
| Long-term debt, net of current portion |
2,338,777 | 5,959,375 | ||||||
| Bonds payable, net of discount and current portion |
343,799,645 | 343,649,029 | ||||||
|
|
|
|
|
|||||
| TOTAL LONG-TERM LIABILITIES |
346,138,422 | 349,608,404 | ||||||
|
|
|
|
|
|||||
| TOTAL LIABILITIES |
426,303,508 | 373,605,630 | ||||||
| COMMITMENTS AND CONTINGENCIES |
||||||||
| MEMBERS’ EQUITY |
||||||||
| Members’ deficit |
(1,200,378 | ) | (783,728 | ) | ||||
| Non-controlling interests |
5,220,355 | 2,343,658 | ||||||
|
|
|
|
|
|||||
| TOTAL MEMBERS’ EQUITY |
4,019,977 | 1,559,930 | ||||||
|
|
|
|
|
|||||
| TOTAL LIABILITIES AND MEMBERS’ EQUITY |
$ | 430,323,485 | $ | 375,165,560 | ||||
|
|
|
|
|
|||||
See accompanying notes to consolidated financial statements.
F-70
Table of Contents
JEFFERSON REFINERY, LLC AND SUBSIDIARIES
CONSOLIDATED STATEMENTS OF OPERATIONS AND COMPREHENSIVE LOSS
| Year Ended December 31, | ||||||||
| 2013 | 2012 | |||||||
| REVENUE |
$ | — | $ | — | ||||
| OPERATING EXPENSES |
||||||||
| General and administrative |
2,735,272 | 1,966,792 | ||||||
| Depreciation and amortization |
70,293 | 59,322 | ||||||
|
|
|
|
|
|||||
| LOSS FROM OPERATIONS |
(2,805,565 | ) | (2,026,114 | ) | ||||
| OTHER INCOME (EXPENSE) |
||||||||
| Interest expense |
(27,855 | ) | (64,450 | ) | ||||
| Other income |
12,429 | 226,179 | ||||||
|
|
|
|
|
|||||
| TOTAL OTHER INCOME (EXPENSE) |
(15,426 | ) | 161,729 | |||||
|
|
|
|
|
|||||
| NET LOSS AND COMPREHENSIVE LOSS |
(2,820,991 | ) | (1,864,385 | ) | ||||
| LESS: NET LOSS AND COMPREHENSIVE LOSS ATTRIBUTABLE TO NON-CONTROLLING INTERESTS |
304,516 | 11,076 | ||||||
|
|
|
|
|
|||||
| NET LOSS AND COMPREHENSIVE LOSS ATTRIBUTABLE TO JEFFERSON REFINERY, LLC |
$ | (2,516,475 | ) | $ | (1,853,309 | ) | ||
|
|
|
|
|
|||||
| COMPREHENSIVE LOSS |
$ | (2,820,991 | ) | $ | (1,864,385 | ) | ||
|
|
|
|
|
|||||
See accompanying notes to consolidated financial statements.
F-71
Table of Contents
JEFFERSON REFINERY, LLC AND SUBSIDIARIES
CONSOLIDATED STATEMENTS OF MEMBERS’ EQUITY
| Members’ Equity (Deficit) |
Tier I & II | Tier III, IV, V |
Total Non- Controlling Interests |
Total Members’ Equity |
||||||||||||||||
| Balance at December 31, 2011 |
$ | (5,724,067 | ) | $ | 1,990,288 | $ | 4,303,360 | $ | — | $ | 569,581 | |||||||||
| Member contributions, net of commissions |
— | — | 500,000 | 2,410,909 | 2,910,909 | |||||||||||||||
| Distributions |
— | — | — | (56,175 | ) | (56,175 | ) | |||||||||||||
| Net loss |
(1,372,607 | ) | (185,331 | ) | (295,371 | ) | (11,076 | ) | (1,864,385 | ) | ||||||||||
|
|
|
|
|
|
|
|
|
|
|
|||||||||||
| Balance at December 31, 2012 |
(7,096,674 | ) | 1,804,957 | 4,507,989 | 2,343,658 | 1,559,930 | ||||||||||||||
| Member contributions, net of commissions |
— | — | — | 3,791,589 | 3,791,589 | |||||||||||||||
| Distributions |
— | — | — | (610,376 | ) | (610,376 | ) | |||||||||||||
| Rights to receive membership interests |
2,099,825 | — | — | — | 2,099,825 | |||||||||||||||
| Net loss |
(2,143,864 | ) | (143,657 | ) | (228,954 | ) | (304,516 | ) | (2,820,991 | ) | ||||||||||
|
|
|
|
|
|
|
|
|
|
|
|||||||||||
| Balance at December 31, 2013 |
$ | (7,140,713 | ) | $ | 1,661,300 | $ | 4,279,035 | $ | 5,220,355 | $ | 4,019,977 | |||||||||
|
|
|
|
|
|
|
|
|
|
|
|||||||||||
See accompanying notes to consolidated financial statements.
F-72
Table of Contents
JEFFERSON REFINERY, LLC AND SUBSIDIARIES
CONSOLIDATED STATEMENTS OF CASH FLOWS
| Year Ended December 31, | ||||||||
| 2013 | 2012 | |||||||
| CASH FLOWS FROM OPERATING ACTIVITIES |
||||||||
| Net loss |
$ | (2,820,991 | ) | $ | (1,864,385 | ) | ||
| Adjustments to reconcile net loss to net cash provided by (used in) operating activities: |
||||||||
| Depreciation and amortization |
70,293 | 59,322 | ||||||
| Changes in operating assets and liabilities: |
||||||||
| Prepaid expenses, other current assets and other assets |
(258,270 | ) | 10,523 | |||||
| Accounts payable and accrued expenses |
(2,394,200 | ) | (1,974,229 | ) | ||||
| Deferred revenue |
16,544,066 | — | ||||||
|
|
|
|
|
|||||
| NET CASH PROVIDED BY (USED IN) OPERATING ACTIVITIES |
11,140,898 | (3,768,769 | ) | |||||
| CASH FLOWS FROM INVESTING ACTIVITIES |
||||||||
| Purchase of property and equipment |
(41,483,420 | ) | (8,738,734 | ) | ||||
| Release of (increase in) restricted cash |
28,847,008 | (36,704,007 | ) | |||||
|
|
|
|
|
|||||
| NET CASH USED IN INVESTING ACTIVITIES |
(12,636,412 | ) | (45,442,741 | ) | ||||
| CASH FLOWS FROM FINANCING ACTIVITIES |
||||||||
| Payments for debt issue costs |
(1,209,003 | ) | (2,048,707 | ) | ||||
| Proceeds from long-term debt |
1,375,000 | 3,693,492 | ||||||
| Repayments on bonds payable |
(75,000 | ) | — | |||||
| Repayments on long-term debt |
(1,764,178 | ) | (476,975 | ) | ||||
| Proceeds from bond issuance |
— | 43,640,625 | ||||||
| Members contributions, net of commissions |
3,791,589 | 2,910,909 | ||||||
| Members distributions |
(610,376 | ) | (56,175 | ) | ||||
|
|
|
|
|
|||||
| NET CASH PROVIDED BY FINANCING ACTIVITIES |
1,508,032 | 47,663,169 | ||||||
|
|
|
|
|
|||||
| NET INCREASE (DECREASE) IN CASH AND CASH EQUIVALENTS |
12,518 | (1,548,341 | ) | |||||
| CASH AND CASH EQUIVALENTS |
||||||||
| Beginning of period |
157,921 | 1,706,262 | ||||||
|
|
|
|
|
|||||
| End of period |
$ | 170,439 | $ | 157,921 | ||||
|
|
|
|
|
|||||
| SUPPLEMENTAL CASH FLOW INFORMATION |
||||||||
| Interest paid, net of amount capitalized |
$ | 6,569 | $ | 51,004 | ||||
|
|
|
|
|
|||||
| NON-CASH INVESTING AND FINANCING ACTIVITIES |
||||||||
| Property and equipment financed through debt and equity |
$ | 13,079,738 | $ | 1,565,777 | ||||
|
|
|
|
|
|||||
| Property and equipment purchased on account |
$ | 21,571,914 | $ | — | ||||
|
|
|
|
|
|||||
| Capitalization of interest costs |
$ | 5,440,431 | $ | 5,280,256 | ||||
|
|
|
|
|
|||||
| Capitalization of bond discount amortization |
$ | 235,616 | $ | 78,404 | ||||
|
|
|
|
|
|||||
| Capitalization of debt issue costs amortization |
$ | 384,671 | $ | 800,890 | ||||
|
|
|
|
|
|||||
| Property and equipment financed and long-term debt arrangements settled through deferred revenue |
$ | 4,753,020 | $ | — | ||||
|
|
|
|
|
|||||
See accompanying notes to consolidated financial statements.
F-73
Table of Contents
JEFFERSON REFINERY, LLC AND SUBSIDIARIES
NOTES TO CONSOLIDATED FINANCIAL STATEMENTS
DECEMBER 31, 2013 AND 2012
NOTE A – NATURE OF OPERATIONS
Jefferson Refinery, LLC (“Jefferson”) is a Texas limited liability company formed on June 21, 2007 to own, operate, and develop a diversified portfolio of complementary energy logistics assets located in Texas. Jefferson and its consolidated subsidiaries (as described below) are collectively referred to as the “Company” within these consolidated financial statements. The Company is headquartered in The Woodlands, Texas, and its planned principal operations are to engage in the business of terminalling, storage, throughput and transloading of crude oil and petroleum products, primarily from the North American shale plays.
The Company’s activities are subject to significant risk and uncertainties, including failure to secure additional funding to fully operationalize the Company’s current planned principal operations and failure to secure long-term revenue contracts with third parties. There can be no assurance that the Company will be successful in accomplishing its objectives.
NOTE B – SUMMARY OF SIGNIFICANT ACCOUNTING POLICIES
Basis of Presentation and Principles of Consolidation: The accompanying consolidated financial statements are prepared in accordance with accounting principles generally accepted in the United States of America (“US GAAP”) and include the accounts of the Company’s wholly and majority-owned subsidiaries. As of December 31, 2013, the Company owned approximately 78.0% of Port of Beaumont Petroleum Transload Terminal, LLC (“PBPTT I”) and 97.3% of Port of Beaumont Petroleum Transload Terminal II, LLC (“PBPTT II”), and accounted for each as a consolidated subsidiary. All intercompany transactions and balances have been eliminated in consolidation.
Non-controlling interests are the portion of the equity in PBPTT I and PBPTT II that is not attributable, directly or indirectly, to the Company. Non-controlling interests are presented as a separate component of equity in the consolidated balance sheets. In addition, the accompanying consolidated statements of operations and comprehensive loss includes an allocation of net loss to the non-controlling interest holders in the consolidated subsidiaries.
Use of Estimates: The preparation of consolidated financial statements in conformity with US GAAP requires management to make estimates and assumptions that affect the reported amounts of assets and liabilities and disclosure of contingent assets and liabilities at the date of the consolidated financial statements, and the reported amounts of revenue and expenses during the reporting period. Actual results could differ from those estimates and assumptions used in preparing the accompanying consolidated financial statements. The Company’s significant accounting estimates are those related to depreciation of property and equipment, amortization of debt issuance costs and fair value of financial instruments. Further information can be found in Note C, Property and Equipment, and Note H, Fair Value Measurements.
Revenue Recognition: The Company recognizes revenue when it is realized and earned. The Company considers revenue to be realized and earned when services have been provided to the customer, the product has been delivered, the sales price is considered to be fixed or determinable and collectability is reasonably assured. Prepayments for services are deferred until the period in which the service is performed. No revenue has been recognized for the periods presented.
Cash and Cash Equivalents: The Company considers all liquid investment instruments purchased with a maturity of three months or less to be cash equivalents.
F-74
Table of Contents
JEFFERSON REFINERY, LLC AND SUBSIDIARIES
NOTES TO CONSOLIDATED FINANCIAL STATEMENTS
DECEMBER 31, 2013 AND 2012
NOTE B – SUMMARY OF SIGNIFICANT ACCOUNTING POLICIES (Continued)
Property and Equipment: Property and equipment are stated at cost. Maintenance and repair costs are charged to expense as incurred; costs of major additions and betterments are capitalized. Interest costs directly related to and incurred during the construction period of property and equipment are capitalized. During the years ended December 31, 2013 and 2012, the Company capitalized interest costs of $5,440,431 and $5,280,256, respectively. Depreciation is recorded using the straight-line method over the estimated useful lives of the related assets, which ranges from three to five years. Estimated useful lives are as follows:
| Furniture and fixtures |
5 years | |
| Computer equipment and software |
3 years | |
| Previously-owned vehicles |
3 years |
Impairment of Long-Lived Assets: The Company reviews the recoverability of its long-lived assets, such as property and equipment, when events or changes in circumstances occur that indicate the carrying value of the asset or asset group may not be recoverable. The assessment of possible impairment is based on the Company’s ability to recover the carrying value of the asset or asset group from the expected future undiscounted cash flows of the related operations. If these cash flows are less than the carrying value of such asset, an impairment loss is recognized for the difference between the estimated fair value and carrying value of the asset or asset group. For the years presented, no such impairments were recorded.
Debt Issue Costs: Costs related to the issuance of the on-demand notes are capitalized and amortized on a straight-line basis over the life of the related note. The Company capitalized $282,787 and $720,286 of amortization expense pertaining to debt issue costs into construction in progress as a result of significant construction activities during the years ended December 31, 2013 and 2012, respectively.
Issue costs related to the bonds payable are capitalized and amortized using the effective interest method. The Company capitalized $101,884 and $80,604 of amortization expense pertaining to debt issue costs related to bonds payable into construction in progress as a result of significant construction activities during the years ended December 31, 2013 and 2012, respectively.
The accumulated amortization of debt issue costs as of December 31, 2013 and 2012 was $2,178,643 and $1,827,289, respectively.
Restricted Cash: Cash that is subject to legal restrictions or is unavailable for general operating purposes is classified as restricted cash in the consolidated balance sheets. The Company’s restricted cash is comprised of unused proceeds from industrial bonds that were issued in 2010 and 2012 and are held at various financial institutions. Each of the Company’s bonds is intended to stimulate the economy of the respective beneficiary counties and have a specific purpose to that end. The unused proceeds are held in trust to ensure adherence to the restrictions of use. The Company must submit a request to a trustee for release of the funds. The Company considers all restricted cash to be long-term.
Federal Income Taxes: The Company is a limited liability company, which is considered a pass-through entity for federal income tax purposes, and thus no provision for federal income taxes has been recorded in the accompanying consolidated financial statements.
The Company is subject to state income tax expense related to the Texas margin tax. The margin tax applies to legal entities conducting business in Texas. The margin tax is based on Texas sourced taxable margin. The tax is
F-75
Table of Contents
JEFFERSON REFINERY, LLC AND SUBSIDIARIES
NOTES TO CONSOLIDATED FINANCIAL STATEMENTS
DECEMBER 31, 2013 AND 2012
NOTE B – SUMMARY OF SIGNIFICANT ACCOUNTING POLICIES (Continued)
calculated by applying a tax rate to a base that considers both revenues and expenses and therefore has the characteristics of an income tax. The margin tax expense was nil for the years ended December 31, 2013 and 2012.
The Company follows the guidance in FASB ASC 740, Income Taxes, for accounting for uncertainty in income taxes. The guidance clarifies the accounting for income taxes by prescribing the minimum recognition threshold an income tax position is required to meet before being recognized in the financial statements and applies to all income tax positions. Each income tax position is assessed using a two-step process. A determination is made as to whether it is more likely than not that an income tax position will be sustained, based upon technical merits, upon examination by the taxing authorities. If the income tax position is expected to meet the more likely than not criteria, the benefit recorded in the financial statements equals the largest amount that is greater than 50% likely to be realized upon its ultimate settlement.
The income tax positions taken by the Company for any years open under the various statutes of limitations is that the Company continues to be exempt from federal income taxes by virtue of its pass through status, and that income tax is attributable to the Members. Management believes that this income tax position meets the more likely than not threshold, and accordingly, the tax benefit of this income tax position (no federal income tax expense or liability) has been recognized for the years ended December 31, 2013 and 2012.
The Company records income tax related interest and penalties as a component of operating expenses. For the years ended December 31, 2013 and 2012, the Company recorded $4,144 and $168,308, respectively, for penalties and interest incurred as result of delinquent filing of prior years’ federal tax returns.
None of the Company’s federal or state income tax filings are currently under examination by the Internal Revenue Service (“IRS”) or state authorities. The Company’s federal income tax filings from 2010 forward and state income tax filings from 2009 forward remain subject to examination by the IRS and the State of Texas, respectively.
Concentrations of Credit Risk: Financial instruments that potentially subject the Company to credit risk are cash and cash equivalents and restricted cash. The Company maintains cash balances in high credit quality financial institutions which exceed federally insured limits. The Company monitors the financial condition of these institutions and has experienced no losses associated with these accounts.
Comprehensive Loss: The Company has no components of comprehensive loss other than its net loss, and accordingly, comprehensive loss is equal to net loss for all periods presented.
Recently Issued Accounting Pronouncements: On May 28, 2014, the FASB issued ASU No. 2014-09, Revenue from Contracts with Customers (“ASU 2014-09”). ASU 2014-09 will eliminate transaction and industry-specific revenue recognition guidance under current US GAAP and replace it with a principle-based approach for determining revenue recognition. ASU 2014-09 will require that companies recognize revenue based on the value of transferred goods or services as they occur in the contract. The ASU also will require additional disclosure about the nature, amount, timing and uncertainty of revenue and cash flows arising from customer contracts, including significant judgments and changes in judgments and assets recognized from costs incurred to obtain or fulfill a contract. ASU 2014-09 is effective for reporting periods beginning after December 15, 2016, and early adoption is not permitted. Entities can transition to the standard either retrospectively or as a cumulative-effect adjustment as of the date of adoption. Management has not determined the effect of adopting ASU 2014-09 on the Company’s ongoing financial reporting.
F-76
Table of Contents
JEFFERSON REFINERY, LLC AND SUBSIDIARIES
NOTES TO CONSOLIDATED FINANCIAL STATEMENTS
DECEMBER 31, 2013 AND 2012
NOTE B – SUMMARY OF SIGNIFICANT ACCOUNTING POLICIES (Continued)
On June 10, 2014, the FASB issued ASU No. 2014-10, Development Stage Entities (Topic 915): Elimination of Certain Financial Reporting Requirements, Including an Amendment to Variable Interest Entities Guidance in Topic 810, Consolidation (“ASU 2014-10”). ASU 2014-10 eliminates the requirement to present inception-to-date information about income statement line items, cash flows, and equity transactions, and clarifies how entities should disclose the risks and uncertainties related to their activities. ASU 2014-10 also eliminates an exception provided to development stage entities in determining whether an entity is a variable interest entity on the basis of the amount of investment equity that is at risk. The presentation and disclosure requirements in Topic 915 are no longer required for interim and annual reporting periods beginning after December 15, 2014. The revised consolidation standards will take effect in annual periods beginning after December 15, 2015; however, early adoption is permitted. The Company adopted the provisions of ASU 2014-10 in its consolidated financial statements for the years ended December 31, 2013 and 2012.
NOTE C – PROPERTY AND EQUIPMENT
Property and equipment consisted of the following:
| December 31, | ||||||||
| 2013 | 2012 | |||||||
| Land |
$ | 5,804,138 | $ | 5,804,138 | ||||
| Furniture and fixtures |
134,508 | 134,508 | ||||||
| Computer equipment and software |
44,492 | 41,929 | ||||||
| Previously-owned vehicles |
230,027 | 112,789 | ||||||
|
|
|
|
|
|||||
| 6,213,165 | 6,093,364 | |||||||
| Less: accumulated depreciation |
(244,468 | ) | (174,175 | ) | ||||
|
|
|
|
|
|||||
| 5,968,697 | 5,919,189 | |||||||
| Construction in process |
111,687,525 | 28,827,220 | ||||||
|
|
|
|
|
|||||
| Total property and equipment |
$ | 117,656,222 | $ | 34,746,409 | ||||
|
|
|
|
|
|||||
Depreciation expense was $70,293 and $59,322 for the years ended December 31, 2013, and 2012, respectively.
NOTE D – ACCRUED EXPENSES
Accrued expenses consisted of the following:
| December 31, | ||||||||
| 2013 | 2012 | |||||||
| Interest |
$ | 5,207,609 | $ | 4,356,952 | ||||
| Payroll and bonuses |
1,857,104 | 1,292,781 | ||||||
| Other |
1,019,936 | 407,714 | ||||||
|
|
|
|
|
|||||
| $ | 8,084,649 | $ | 6,057,447 | |||||
|
|
|
|
|
|||||
As of December 31, 2013 and 2012, the Company has recorded approximately $1,418,000 and $850,000, respectively, of accrued back pay (including applicable payroll taxes) dating back to 2008 for the Company’s Chief Executive Officer and Chief Financial Officer, which are included within payroll and bonuses. The back pay represents normal salaries to be paid; it is neither conditional nor part of any deferred compensation arrangement. Additionally, the back pay does not accrue interest.
F-77
Table of Contents
JEFFERSON REFINERY, LLC AND SUBSIDIARIES
NOTES TO CONSOLIDATED FINANCIAL STATEMENTS
DECEMBER 31, 2013 AND 2012
NOTE E – DEFERRED REVENUE
On August 8, 2013, a subsidiary of the Company, Jeffco Holdings, LLC (“Jeffco”), entered into the Terminals and Gas Plant Intermediation and Liquidity Facility agreement (the “Intermediation Agreement”) with Merrill Lynch Commodities, Inc. (“MLC”) to obtain certain commodity intermediation and other services. Under this agreement, MLC would provide the Company with a credit facility of up to $115,000,000 for the sole use of repurchasing the 2013 bonds (if issued) and the 2010 Processing Bonds, at an interest rate of 3-month LIBOR plus 12%, with equal annual installment payments over the five year maturity period commencing the date on which the credit facility is drawn upon. In addition, MLC would lease or sublease certain storage tanks for crude oil and other refined products and have exclusive rights to use all related storage capacity, tanks, pipelines, track, rail loading/offloading facilities and docks during the term of the Intermediation Agreement.
On October 11, 2013, the Intermediation Agreement was amended in its entirety by the Prepaid Physical Throughput Capacity Purchase and Sale Agreements (the “Terminalling Agreements”) with MLC, whereby MLC would provide the Company with prefunding of up to $35,000,000 to be applied against future terminalling services to be provided by the Company at $1.50 per barrel at its gas processing plant in Hampshire, Texas and terminal facilities at the Port of Beaumont. The effective date of this agreement is August 8, 2014 and terminates on August 8, 2019. The Terminalling Agreements contain an early termination provision whereby the Terminalling Agreements terminate upon receipt of at least $75,000,000 of debt or equity financing by the Company. In addition, once triggered, the remaining unsettled amount of prefunding incurs interest at 9% per annum. As of December 31, 2013, MLC has prefunded $21,297,086 to the Company for future settlements, and such amounts have been classified as deferred revenue within the accompanying consolidated balance sheets. The Terminalling Agreements were assigned to a third party on August 7, 2014. Please refer to Note L for further detail.
NOTE F – LONG-TERM DEBT
Long-term debt consisted of the following:
| December 31, | ||||||||||||
| Rates |
Stated Maturity Dates |
2013 | 2012 | |||||||||
| Note Payable (“Raven” Note) by JML |
18.0% | April 2014 | $ | 6,900,175 | $ | — | ||||||
| Collateralized Notes Payable to Sellers |
5.0% - 30.0% | 2013 - January 2032 | 2,356,551 | 5,400,000 | ||||||||
| Collateralized Notes Payable to Members |
12.0% - 15.0% | Various dates through 2012 | 6,000,000 | 6,000,000 | ||||||||
| Subordinated Note Payable to Members |
Prime + 7.0% (or minimum of 12.0%) | August 2013 - February 2014 | 5,785,000 | 5,785,000 | ||||||||
| Subordinated Note Payable to Seller |
4.0% | June 2014 | 1,100,000 | 2,500,000 | ||||||||
| Uncollateralized Notes Payable to Members |
11.0% - 24.0% | Payable on-demand - October 2014 | 7,057,000 | 1,682,000 | ||||||||
| Other Obligations |
4.5% - 6.7% | October 2018 | 161,180 | 102,171 | ||||||||
|
|
|
|
|
|||||||||
| Total |
29,359,906 | 21,469,171 | ||||||||||
| Less: Current Maturities |
(27,021,129 | ) | (15,509,796 | ) | ||||||||
|
|
|
|
|
|||||||||
| Total Long-Term Debt |
$ | 2,338,777 | $ | 5,959,375 | ||||||||
|
|
|
|
|
|||||||||
F-78
Table of Contents
JEFFERSON REFINERY, LLC AND SUBSIDIARIES
NOTES TO CONSOLIDATED FINANCIAL STATEMENTS
DECEMBER 31, 2013 AND 2012
Raven Note: This note relates to the purchase of railcars during 2013 with interest accruing at 18.0% per annum, is due April 2014 and is collateralized by the purchased railcars. The note includes rights to receive 2.5% of the membership interests of PBPTT I and PBPTT II. The rights to receive membership interests may be exercised at any time, are freely assignable, and are protected from dilution until the Company receives $165 million in third party equity financing. Of the $9,000,000 total consideration received, $6,900,175 was allocated to the carrying value of the note and the $2,099,825 allocable to the rights to receive membership interests was recorded in Members’ Equity. As of December 31, 2013, the rights to receive membership interests had not been exercised. This note was purchased by a third party subsequent to year end, see Note L.
Collateralized Notes Payable to Sellers: This balance consists of a note payable to the seller of the land in High Island, Texas, which is collateralized by a deed of trust owned by the Company. The note payable to the seller of the land of $2,356,551 accrues interest at 5.0% per annum, is subordinate to the Series 2010 and 2012 bonds, and matures in January 2032. For the year-ended December 31, 2012, collateralized notes payable to sellers also included a note payable to the seller of the gas processing plant of $2.7 million, which accrued interest at 30% per annum, and was repaid during 2013.
Collateralized Notes Payable to Members: This balance includes notes that accrue at 12.0% per annum, increasing to 15.0% during 2012, which matured at various dates during 2012. These notes are collateralized by deeds of trust and security agreements in land and equipment owned by the Company. For each $250,000 of principal, the note holder received 0.25% of equity interests of the Company.
Subordinated Notes Payable to Members: This balance consists of two notes, which both accrue interest at a rate equal to the greater of prime plus 7.0% or 12.0% and is due monthly. The first of the two notes, which has a balance of $4,685,000, matured in August 2013 and is due on demand. Of this balance, $4,600,000 is collateralized by a secondary lien on land and equipment (the remaining $85,000 is unsecured). The second of the two notes, which has a balance of $1.1 million, is due to mature in February 2014, and is collateralized by a primary lien on property.
Subordinated Note Payable to Seller: This balance represents a note payable to the seller of the purchased refinery, with interest that accrues at 4.0% per annum and is due monthly. This note is collateralized by a secondary lien on property. This note matured in September 2012; however, the maturity date was extended to June 2014.
Uncollateralized Notes Payable to Members: This balance is comprised of eleven notes that have interest accruing from 11.0% to 24.0% per annum. Of the eleven notes, six notes have an aggregate principal balance of $5,375,000, accrue interest at 11.0% per annum, and entitle the holder to a 0.125% Membership Interest in the Company for each $250,000 of principal. Three notes have an aggregate principal balance of $1,117,000 and accrue interest at 12.0% per annum, which is due monthly. Additionally, this balance includes one note with a principal balance of $165,000 that accrues interest at 24.0% per annum, which is due monthly. Ten of these notes matured prior to December 31, 2013, and are on demand as of that date. The remaining note matures in October 2014, has a principal balance of $400,000, and accrues interest at 12.0% per annum.
Other Obligations: This balance consists of an uncollateralized line of credit and notes payable to various finance companies. The line of credit is with an affiliate of a Member with 6.0% interest compounded annually. The unpaid balance of $71,000 was due on January 2013. The remaining notes payable of $90,180 to various finance companies accrue interest between 4.5% and 6.7% per annum and mature at various dates between October 2016 and October 2018.
F-79
Table of Contents
JEFFERSON REFINERY, LLC AND SUBSIDIARIES
NOTES TO CONSOLIDATED FINANCIAL STATEMENTS
DECEMBER 31, 2013 AND 2012
NOTE F – LONG-TERM DEBT (Continued)
Cash principal repayments on long-term debt obligations are due as follows:
| Year Ending December 31, |
||||
| 2014 |
$ | 29,120,954 | ||
| 2015 |
96,177 | |||
| 2016 |
94,749 | |||
| 2017 |
97,126 | |||
| 2018 |
91,871 | |||
| Thereafter |
1,958,854 | |||
|
|
|
|||
| $ | 31,459,731 | |||
|
|
|
|||
As of December 31, 2013 and 2012, the Company had pledged $41,084,566 and $23,006,903 of assets as collateral against long term notes, respectively. These assets are long term in nature and include land, equipment and property owned by the Company. The long term notes contain security agreements and liens entitling the holders of the notes to such assets.
NOTE G – BONDS PAYABLE
Series 2010 Bonds
The Company’s development projects will be partially funded with tax-exempt industrial development bonds issued by the Jefferson County Development Corporation, pursuant to the Tax Extenders and Alternative Minimum Tax Relief Act of 2008 (“Series 2010 Bonds”), which provides tax-exempt financing for businesses impacted by Hurricane Ike. Through Jefferson County Development Corporation, the Company issued an initial principal amount of $300,000,000 on December 1, 2010. The bonds have a stated maturity date of December 1, 2040, and the principal amount is due at maturity. Interest on the bonds is subject to being remarketed and the bondholders have the right to tender the bonds at each remarketing date.
As of December 31, 2013, $299,995,000 is payable at 0.55% per annum, and use of the proceeds is restricted for the benefit of Jefferson County. The restricted cash proceeds are currently invested with financial institutions and the amount will be held in trust pending remarketing of some or all of the bonds to long-term investors willing to assume the risks associated with construction and development of the Company’s projects. Interest on the bonds will be at a higher rate when remarketed to long-term investors.
Series 2012 Bonds
On August 1, 2012, the Company issued tax-exempt industrial development bonds by the Jefferson County (Texas) Industrial Development Corporation with principal of $46,875,000 at a 6.90% discount for a net of $43,640,625, with an interest rate of 8.25% per annum. The bond discount is amortized using the effective interest method to interest expense over the contractual term of the bond; however, the Company has capitalized the related interest costs during the construction period. For the years ended December 31, 2013 and 2012, the Company recorded amortization of bond discounts of $235,616 and $78,404, respectively, which were capitalized into construction in progress.
The Series 2012 Bonds have a stated maturity of July 1, 2032, and require scheduled principal payments. The use of the bond proceeds is restricted to funding construction and operation of an intermodal transfer facility for crude oil and refined petroleum products. The principal of the Series 2012 Bonds are payable annually at varying amounts.
F-80
Table of Contents
JEFFERSON REFINERY, LLC AND SUBSIDIARIES
NOTES TO CONSOLIDATED FINANCIAL STATEMENTS
DECEMBER 31, 2013 AND 2012
NOTE G – BONDS PAYABLE (Continued)
The face amount of bonds payable consisted of the following:
| December 31, | ||||||||
| 2013 | 2012 | |||||||
| Series 2010 bonds |
$ | 299,995,000 | $ | 300,000,000 | ||||
| Series 2012 bonds |
46,805,000 | 46,875,000 | ||||||
|
|
|
|
|
|||||
| Total bonds payable |
$ | 346,800,000 | $ | 346,875,000 | ||||
|
|
|
|
|
|||||
| December 31, | ||||||||
| 2013 | 2012 | |||||||
| Current portion of bonds payable |
$ | 80,000 | $ | 70,000 | ||||
| Long-term bonds payable |
346,720,000 | 346,805,000 | ||||||
|
|
|
|
|
|||||
| Total bonds payable |
346,800,000 | 346,875,000 | ||||||
| Less: bond discounts, net of amortization |
(2,920,355 | ) | (3,155,971 | ) | ||||
|
|
|
|
|
|||||
| Carrying amount of bonds payable |
$ | 343,879,645 | $ | 343,719,029 | ||||
|
|
|
|
|
|||||
Future principal payments required under the bonds as of December 31, 2013 are as follows:
| Year Ending December 31, |
||||
| 2014 |
$ | 80,000 | ||
| 2015 |
1,225,000 | |||
| 2016 |
1,325,000 | |||
| 2017 |
1,430,000 | |||
| 2018 |
1,550,000 | |||
| Thereafter |
341,190,000 | |||
|
|
|
|||
| $ | 346,800,000 | |||
|
|
|
|||
NOTE H – FAIR VALUE MEASUREMENTS
The Company does not measure any assets or liabilities at fair value on a recurring basis in its consolidated balance sheets. The Company categorizes assets and liabilities disclosed at fair value into one of three different levels depending on the observability of the inputs employed in the measurement (the fair value hierarchy).
| • | Level 1 inputs are quoted prices in active markets for identical assets or liabilities. |
| • | Level 2 inputs are observable inputs other than Level 1 prices, for example, quoted prices for similar assets and liabilities in active markets, quoted prices for identical or similar assets or liabilities in markets that are not active, and inputs that are observable or can be corroborated, either directly or indirectly, for substantially the full term of the financial instrument. |
| • | Level 3 inputs are unobservable inputs for the asset or liability reflecting significant modifications to observable related market data or our assumptions about pricing by market participants. |
F-81
Table of Contents
JEFFERSON REFINERY, LLC AND SUBSIDIARIES
NOTES TO CONSOLIDATED FINANCIAL STATEMENTS
DECEMBER 31, 2013 AND 2012
NOTE H – FAIR VALUE MEASUREMENTS (Continued)
The Company utilizes valuation techniques that maximize the use of observable inputs (Levels 1 and 2) and minimize the use of unobservable inputs (Level 3) within the fair value hierarchy. The level within the fair value hierarchy is based on the lowest level of input that is significant to the fair value measurements.
The fair values of the Company’s cash and cash equivalents, accounts receivable, restricted cash, accounts payable, and accounts payable – related parties approximate their carrying values due to their short-term or on-demand nature, or market rates of interest.
The Company’s long-term debt is comprised of the following classes: the Raven note, collateralized notes payable to sellers, collateralized notes payable to members, subordinated notes payable to members, subordinated note payable to seller, uncollateralized notes payable to members, and other obligations.
The fair value of the collateralized notes payable to members was estimated to approximate carrying value as they all matured in 2012 and the Company has positive equity.
The fair value of the subordinated notes payable to members and the subordinated note payable to seller were estimated to approximate carrying value based upon a market rate of interest adjusted for necessary risks, including the Company’s business enterprise value.
The fair value of uncollateralized notes payable to members was estimated to approximate carrying value as of December 31, 2013 as the notes are both pre-payable by the Company and due on demand by the investor. This was also the case for all but two of the uncollateralized notes payable to members as of December 31, 2012, as the two exceptions had not yet matured as of December 31, 2012 and were not yet on-demand. These two notes were estimated to approximate carrying value as of that date because their interest rate of 12% was estimated to approximate their required yield on that date.
Bonds payable consist of Series 2012 Bonds and Series 2010 Bonds. The fair value of the bonds payable was estimated to approximate carrying value based on an evaluation of pricing data, vendor quotes, and historical trading activity.
The table below shows the fair value and fair value hierarchy for the Raven note and collateralized notes payable to sellers as of December 31, 2013 and 2012.
|
|
December 31, 2013 | |||||||||||||||
| Description |
Level 1 | Level 2 | Level 3 | Total | ||||||||||||
| Raven note |
$ | — | $ | — | $ | 7,719,338 | $ | 7,719,338 | ||||||||
|
|
|
|
|
|
|
|
|
|||||||||
| Collateralized note payable to sellers |
$ | — | $ | — | $ | 1,316,200 | $ | 1,316,200 | ||||||||
|
|
|
|
|
|
|
|
|
|||||||||
| December 31, 2012 | ||||||||||||||||
| Description |
Level 1 | Level 2 | Level 3 | Total | ||||||||||||
| Raven note |
$ | — | $ | — | $ | — | $ | — | ||||||||
|
|
|
|
|
|
|
|
|
|||||||||
| Collateralized note payable to sellers |
$ | — | $ | — | $ | 1,295,764 | $ | 1,295,764 | ||||||||
|
|
|
|
|
|
|
|
|
|||||||||
The fair value of the Raven note was estimated at $7,719,338 at December 31, 2013, based on an evaluation of changes in market interest rates between the issuance date (i.e., October 11, 2013) and December 31, 2013. Accordingly, the Raven note is classified within Level 3 of the fair value hierarchy.
F-82
Table of Contents
JEFFERSON REFINERY, LLC AND SUBSIDIARIES
NOTES TO CONSOLIDATED FINANCIAL STATEMENTS
DECEMBER 31, 2013 AND 2012
NOTE H – FAIR VALUE MEASUREMENTS (Continued)
The fair value of the collateralized note payable to sellers was estimated at $1,316,200 and $1,295,764 as of December 31, 2013 and 2012, respectively, based on a discounted cash flow model. Accordingly, the collateralized note payable to sellers is classified within Level 3 of the fair value hierarchy.
NOTE I – MEMBERS’ EQUITY
Jefferson Refinery, LLC
The authorized equity membership units of Jefferson consist of six tiers. With respect to distributions, when and if made by Jefferson, each tier is subordinate to all preceding tiers, and all classes of debt.
Tiers I and II are authorized for 10 units each, at $150,000 per unit, and each unit represents one half of one percent of total membership in Jefferson. Both tiers have been fully funded and have a preferential right to distributions at multiples of the original investment amount. Tier I has a right to 5.25 times the original investment amount. Tier II has a right to 2 times the original investment amount.
Tiers III, IV and V are authorized for 20 units each, at $100,000 per unit, and each unit represents 0.25% of total membership. All three tiers have been fully funded. With respect to distributions, Tiers II, III and IV are interest bearing, and interest accrued is also subordinate to distributions to preceding tiers, and all classes of debt. Tier II has a preferential interest rate of 10% for the first two years, and 15% each year thereafter. Tiers III and IV have a preferential interest rate of 12% for the first two years, and 15% each year thereafter.
After preferential distributions to Tiers I through V have been satisfied, all further Member distributions (the sixth tier) will be made to all Members in proportion to their ownership percentage with no further consideration of preference.
Port of Beaumont Petroleum Transload Terminal, LLC
At formation of the entity, PBPTT I was a wholly-owned subsidiary of Jefferson, and the Company has since issued additional membership interests to third party investors, representing the non-controlling interests of Members’ Equity. As of December 31, 2013 and 2012, the Company owned a controlling interest in PBPTT I of 78% and 91.5%, respectively. Non-controlling interest holders are entitled to receive preference distributions made by PBPTT I until the non-controlling interest holders have recovered their initial investment. In addition, the non-controlling interest holders are entitled to receive interest on their initial investment amounts that remain outstanding at a rate of 11% per annum.
Port of Beaumont Petroleum Transload Terminal II, LLC
At formation of the entity, PBPTT II was a wholly-owned subsidiary of Jefferson, and the Company has since issued additional membership interests through a financing agreement with third party investors, representing the non-controlling interests of Members’ equity. Each loan has a $250,000 denomination and provides for a membership interest of 0.125%. Non-controlling interest holders are entitled to receive preference distributions made by PBPTT II until the non-controlling interest holders have recovered their initial investment. In addition, the non-controlling interest holders are entitled to receive interest on their initial investment amounts that remain outstanding at a rate of 11% per annum.
F-83
Table of Contents
JEFFERSON REFINERY, LLC AND SUBSIDIARIES
NOTES TO CONSOLIDATED FINANCIAL STATEMENTS
DECEMBER 31, 2013 AND 2012
NOTE J – RELATED PARTY TRANSACTIONS
The Company has a significant related party vendor which provides construction services for the Company’s facilities, and accounts for approximately 74.1% and 45.9% of total purchases during the years ended December 31, 2013 and 2012, respectively. As of December 31, 2013 and 2012, accounts payable to this vendor totaled $17,542,537 and $278,015, respectively.
The Company conducted various transactions and activities with a number of related parties with such expenses included in the accompanying consolidated financial statements as follows:
| Year Ended December 31, | ||||||||
| 2013 | 2012 | |||||||
| Financial services |
$ | 30,000 | $ | 89,775 | ||||
| Commissions |
334,150 | 116,591 | ||||||
| Legal services |
61,760 | 127,840 | ||||||
| Construction services |
38,009,913 | — | ||||||
|
|
|
|
|
|||||
| Total |
$ | 38,435,823 | $ | 334,206 | ||||
|
|
|
|
|
|||||
The Company also holds various notes payable with its Members, which are included in long-term debt on the accompanying consolidated balance sheets. The carrying amounts are summarized below:
| December 31, | ||||||||
| 2013 | 2012 | |||||||
| Current portion of long-term debt – related parties |
$ | 18,913,000 | $ | 12,438,000 | ||||
| Long-term debt – related parties, net of current portion |
— | 1,100,000 | ||||||
|
|
|
|
|
|||||
| Total |
$ | 18,913,000 | $ | 13,538,000 | ||||
|
|
|
|
|
|||||
NOTE K – COMMITMENTS AND CONTINGENCIES
Operating Leases
The Company has non-cancellable operating lease agreements for certain equipment and office facilities. As of December 31, 2013, the estimated future minimum rental payments required by these leases are as follows:
| Year Ending December 31, |
|
|||
| 2014 |
$ | 2,791,376 | ||
| 2015 |
1,250,774 | |||
| 2016 |
1,105,768 | |||
| 2017 |
1,106,732 | |||
| 2018 |
1,067,639 | |||
| Thereafter |
24,947,160 | |||
|
|
|
|||
| $ | 32,269,449 | |||
|
|
|
|||
For the years ended December 31, 2013 and 2012, rent expense under all operating leases was $1,164,943 and $190,886, respectively.
F-84
Table of Contents
JEFFERSON REFINERY, LLC AND SUBSIDIARIES
NOTES TO CONSOLIDATED FINANCIAL STATEMENTS
DECEMBER 31, 2013 AND 2012
NOTE L – SUBSEQUENT EVENTS
The Company evaluates events and transactions occurring after the consolidated balance sheet date, but before the consolidated financial statements are available to be issued. The Company has evaluated such events and transactions through August 27, 2014, the date the consolidated financial statements were available for issuance.
Asset Purchase Agreement
On June 5, 2014, the Company entered into an asset purchase agreement (the “Fundamental Transaction”) with certain subsidiaries of Fortress Investment Group LLC and its related affiliates (collectively, “Fortress”), namely FTAI Energy Partners LLC, FTAI Energy Midstream Holdings LLC, FTAI Energy Downstream Holdings LLC, and FTAI Energy Development Holdings LLC (collectively the “Purchaser”), whereby the Purchaser acquired substantially all of the Company’s assets and assumed substantially all of the Company’s liabilities. The Fundamental Transaction closed on August 27, 2014.
January Credit Agreement
On January 22, 2014, a subsidiary of the Company, Jeffco, entered into a $15,100,000 credit agreement (the “January Credit Agreement”) with FTAI Energy Co 1 Ltd. (“Energyco”), a Fortress affiliate, bearing interest at 8% per annum through April 21, 2014 and 12% per annum subsequent to April 21, 2014. The January Credit Agreement is collateralized by substantially all of the Jeffco assets, including a pledge of all of the equity interests of its subsidiaries. In addition, Jefferson has guaranteed the obligations of Jeffco by granting a lien on substantially all of its assets, including a pledge of all of the equity interests of its subsidiaries. The January Credit Agreement matures on the earliest of: 1) December 31, 2014, 2) the maturity extension option date (April 22, 2014), or 3) the date on which amounts become due and payable in full under the January Credit Agreement, whether by acceleration or otherwise. Borrowings under the January Credit Agreement, including accrued interest thereon totaled approximately $16 million through August 27, 2014.
February Credit Agreement
On February 25, 2014, Jefferson entered into a $15,100,000 credit agreement (the “February Credit Agreement”) with Energyco, bearing interest at 8% per annum through April 21, 2014 and 12% per annum subsequent to April 21, 2014. On February 25, 2014, the Company received $6,100,000 under the February Credit Agreement. The February Credit Agreement is collateralized by substantially all of Jefferson’s assets, including a pledge of all of the equity interests of its subsidiaries. The February Credit Agreement matures on the earliest of: 1) December 31, 2014, 2) the maturity extension option date (April 22, 2014), or 3) the date on which amounts become due and payable in full under the February Credit Agreement, whether by acceleration or otherwise.
On March 17, 2014, the Company received $6,400,000 in additional funds under the February Credit Agreement. In connection with this additional advance, Jefferson Railcars, LLC (“Jefferson Railcars”) granted an option to Energyco to purchase 15 railcars for $2,250,000 (the “Option”). The Option was then assigned by Energyco to FTAI Railcar Holdings LLC (“FTAI Holdings”), a Fortress affiliate.
On April 24, 2014, FTAI Holdings exercised the Option and paid the $2,250,000 to Jefferson Railcars by directing Energyco to set off and apply the $2,250,000 to the principal amount of the loans outstanding under the Credit Agreement, in lieu of paying the option fee in cash.
F-85
Table of Contents
JEFFERSON REFINERY, LLC AND SUBSIDIARIES
NOTES TO CONSOLIDATED FINANCIAL STATEMENTS
DECEMBER 31, 2013 AND 2012
NOTE L – SUBSEQUENT EVENTS (Continued)
The February Credit Agreement was subsequently amended in June 2014 and the line of credit was increased to $70,100,000. Borrowings under the February Credit Agreement, including accrued interest thereon totaled approximately $60 million through August 27, 2014.
Jefferson Credit Agreements
On April 21, 2014, Jeffco and Jefferson elected to extend the January Credit Agreement and February Credit Agreement (collectively, the “Jefferson Credit Agreements”) to December 31, 2014. In connection with these extensions, both Jeffco and Jefferson incurred extension fees of $200,000 ($400,000 in the aggregate) to Energyco. In lieu of paying cash, the $400,000 of extension fees were added to the outstanding principal balance of the February Credit Agreement.
The Company is in default on the Jefferson Credit Agreements as a result of non-compliance with certain financial reporting requirements. No waivers for these events of non-compliance have been provided.
Purchase of Tendered Bonds
On January 15, 2014, one of the original bondholders tendered $115,000,000 of the Series 2010 Bonds and a buyer for the tendered bonds could not be found. As a result, and per the terms of the trust indenture and security agreements, on January 15, 2014, the Company purchased the $115,000,000 of Series 2010 Bonds from the original bondholder utilizing the restricted cash proceeds from original issuance.
Raven Note
On April 21, 2014, the Raven note, as described in Note F, was purchased by a third party, FTAI Holdings, for $10,186,670 (the “Railcar Purchase Agreement”). The terms of the Railcar Purchase Agreement stipulate that the holder of the rights to receive membership interests under the Raven note may not exercise such rights to receive membership interests until the earlier of: 1) Fundamental Transaction closing (generally defined as a sale or change in control of PBPTT I and PBPTT II), 2) December 31, 2014, or 3) the abandonment date of the contemplated Fundamental Transaction, which is the date, if any, on which FTAI Holdings or any of its affiliates provide notice to Jefferson indicating FTAI Holdings and its affiliates are no longer pursuing a Fundamental Transaction. In connection with the closing of the Fundamental Transaction, the rights to receive membership interests were be deemed exercised and converted to cash that the holder would have been entitled to as a holder of Membership interests in PBPTT I and PBPTT II.
Terminalling Agreements Assignment
On August 7, 2014, the Company and Energyco entered into an assignment and assumption agreement whereby MLC assigned to Energyco its right, title and interest in, and Energyco assumed all obligations and liabilities with respect to, the Terminalling Agreements (please refer to Note E for further detail on these agreements). As part of the Terminalling Agreements Assignment, MLC also assigned to Energyco certain Deed of Trust, Security Agreement and Fixture Filings for Jefferson Processing, LLC (a Jefferson subsidiary) and PBPTT II related to certain processing tract assets.
F-86
Table of Contents
JEFFERSON REFINERY, LLC AND SUBSIDIARIES
| June 30, 2014 | December 31, 2013 | |||||||
| (Unaudited) | ||||||||
| ASSETS |
||||||||
| CURRENT ASSETS |
||||||||
| Cash and cash equivalents |
$ | 371,037 | $ | 170,439 | ||||
| Accounts receivable |
203,500 | — | ||||||
| Other receivables |
— | 90,300 | ||||||
| Prepaid expenses |
— | 183,823 | ||||||
| Inventory |
70,894 | — | ||||||
| Other current assets |
5,349 | 5,349 | ||||||
|
|
|
|
|
|||||
| TOTAL CURRENT ASSETS |
650,780 | 449,911 | ||||||
| PROPERTY AND EQUIPMENT, NET |
146,403,190 | 117,656,222 | ||||||
| DEBT ISSUE COSTS, NET |
5,230,776 | 4,351,040 | ||||||
| RESTRICTED CASH |
191,888,268 | 307,862,582 | ||||||
| TENDERED BONDS HELD |
115,000,000 | — | ||||||
| OTHER ASSETS |
3,730 | 3,730 | ||||||
|
|
|
|
|
|||||
| TOTAL ASSETS |
$ | 459,176,744 | $ | 430,323,485 | ||||
|
|
|
|
|
|||||
| LIABILITIES AND MEMBERS’ EQUITY (DEFICIT) |
||||||||
| CURRENT LIABILITIES |
||||||||
| Accounts payable |
$ | 5,138,570 | $ | 5,479,919 | ||||
| Accounts payable - related parties |
19,540,910 | 18,202,303 | ||||||
| Accrued expenses |
33,460,607 | 8,084,649 | ||||||
| Notes payable |
50,288,976 | — | ||||||
| Current portion of long-term debt |
20,541,295 | 27,021,129 | ||||||
| Current portion of bonds payable |
80,000 | 80,000 | ||||||
| Deferred revenue |
21,297,086 | 21,297,086 | ||||||
|
|
|
|
|
|||||
| TOTAL CURRENT LIABILITIES |
150,347,444 | 80,165,086 | ||||||
| LONG-TERM LIABILITIES |
||||||||
| Long-term debt, net of current portion |
2,271,085 | 2,338,777 | ||||||
| Bonds payable, net of discount and current portion |
343,917,655 | 343,799,645 | ||||||
|
|
|
|
|
|||||
| TOTAL LONG-TERM LIABILITIES |
346,188,740 | 346,138,422 | ||||||
|
|
|
|
|
|||||
| TOTAL LIABILITIES |
496,536,184 | 426,303,508 | ||||||
| COMMITMENTS AND CONTINGENCIES |
||||||||
| MEMBERS’ EQUITY (DEFICIT) |
||||||||
| Members’ deficit |
(39,307,509 | ) | (1,200,378 | ) | ||||
| Non-controlling interests |
1,948,069 | 5,220,355 | ||||||
|
|
|
|
|
|||||
| TOTAL MEMBERS’ EQUITY (DEFICIT) |
(37,359,440 | ) | 4,019,977 | |||||
|
|
|
|
|
|||||
| TOTAL LIABILITIES AND MEMBERS’ EQUITY (DEFICIT) |
$ | 459,176,744 | $ | 430,323,485 | ||||
|
|
|
|
|
|||||
See accompanying notes to interim consolidated financial statements.
F-87
Table of Contents
JEFFERSON REFINERY, LLC AND SUBSIDIARIES
INTERIM CONSOLIDATED STATEMENTS OF OPERATIONS AND COMPREHENSIVE LOSS
| Six Months Ended June 30, | ||||||||
| 2014 | 2013 | |||||||
| (Unaudited) | (Unaudited) | |||||||
| REVENUE |
||||||||
| Terminal services fees |
$ | 550,531 | $ | — | ||||
| Lease revenue |
1,170,125 | — | ||||||
| OPERATING EXPENSES |
||||||||
| General and administrative |
7,404,602 | 2,478,775 | ||||||
| Depreciation and amortization |
513,433 | 33,244 | ||||||
| Loss on disposal of property and equipment |
6,172,678 | — | ||||||
| Transaction expenses |
24,798,450 | — | ||||||
|
|
|
|
|
|||||
| LOSS FROM OPERATIONS |
(37,168,507 | ) | (2,512,019 | ) | ||||
| OTHER INCOME (EXPENSE) |
||||||||
| Interest expense |
(3,890,958 | ) | (27,548 | ) | ||||
| Interest income |
86,330 | — | ||||||
| Other income |
17,218 | — | ||||||
|
|
|
|
|
|||||
| TOTAL OTHER EXPENSE |
(3,787,410 | ) | (27,548 | ) | ||||
|
|
|
|
|
|||||
| NET LOSS AND COMPREHENSIVE LOSS |
(40,955,917 | ) | (2,539,567 | ) | ||||
| LESS: NET LOSS AND COMPREHENSIVE LOSS ATTRIBUTABLE TO NON-CONTROLLING INTERESTS |
2,848,786 | 37,901 | ||||||
|
|
|
|
|
|||||
| NET LOSS AND COMPREHENSIVE LOSS ATTRIBUTABLE TO JEFFERSON REFINERY, LLC |
$ | (38,107,131 | ) | $ | (2,501,667 | ) | ||
|
|
|
|
|
|||||
| COMPREHENSIVE LOSS |
$ | (40,955,917 | ) | $ | (2,539,567 | ) | ||
|
|
|
|
|
|||||
See accompanying notes to interim consolidated financial statements.
F-88
Table of Contents
JEFFERSON REFINERY, LLC AND SUBSIDIARIES
INTERIM CONSOLIDATED STATEMENTS OF MEMBERS’ EQUITY (DEFICIT) (UNAUDITED)
| Members’ Deficit |
Tier I & II |
Tier III, IV, V |
Total Non-Controlling Interests |
Total Members’ Equity |
||||||||||||||||
| Balance at December 31, 2012 |
(7,096,674 | ) | 1,804,957 | 4,507,989 | 2,343,658 | 1,559,930 | ||||||||||||||
| Member contributions, net of commissions |
— | — | — | 3,769,091 | 3,769,091 | |||||||||||||||
| Distributions |
— | — | — | (247,222 | ) | (247,222 | ) | |||||||||||||
| Net loss |
(1,852,796 | ) | (250,167 | ) | (398,703 | ) | (37,901 | ) | (2,539,567 | ) | ||||||||||
|
|
|
|
|
|
|
|
|
|
|
|||||||||||
| Balance at June 30, 2013 (unaudited) |
$ | (8,949,470 | ) | $ | 1,554,790 | $ | 4,109,286 | $ | 5,827,626 | $ | 2,542,232 | |||||||||
|
|
|
|
|
|
|
|
|
|
|
|||||||||||
| Members’ Deficit |
Tier I & II |
Tier III, IV, V |
Total Non-Controlling Interests |
Total Members’ Equity (Deficit) |
||||||||||||||||
| Balance at December 31, 2013 |
(7,140,713 | ) | 1,661,300 | 4,279,035 | 5,220,355 | 4,019,977 | ||||||||||||||
| Member contributions, net of commissions |
— | — | — | — | — | |||||||||||||||
| Distributions |
— | — | — | (423,500 | ) | (423,500 | ) | |||||||||||||
| Net loss |
(28,223,094 | ) | (3,810,713 | ) | (6,073,324 | ) | (2,848,786 | ) | (40,955,917 | ) | ||||||||||
|
|
|
|
|
|
|
|
|
|
|
|||||||||||
| Balance at June 30, 2014 (unaudited) |
$ | (35,363,807 | ) | $ | (2,149,413 | ) | $ | (1,794,289 | ) | $ | 1,948,069 | $ | (37,359,440 | ) | ||||||
|
|
|
|
|
|
|
|
|
|
|
|||||||||||
See accompanying notes to interim consolidated financial statements.
F-89
Table of Contents
JEFFERSON REFINERY, LLC AND SUBSIDIARIES
INTERIM CONSOLIDATED STATEMENTS OF CASH FLOWS (UNAUDITED)
| Six Months Ended June 30, | ||||||||
| 2014 | 2013 | |||||||
| (Unaudited) | (Unaudited) | |||||||
| CASH FLOWS FROM OPERATING ACTIVITIES |
||||||||
| Net loss |
$ | (40,955,917 | ) | $ | (2,539,567 | ) | ||
| Adjustments to reconcile net loss to net cash used in operating activities: |
||||||||
| Depreciation and amortization |
513,433 | 33,244 | ||||||
| Amortization of bond discount |
118,010 | — | ||||||
| Loss on disposal of property and equipment |
6,172,678 | — | ||||||
| Changes in operating assets and liabilities: |
||||||||
| Prepaid expenses, other current assets and other assets |
(271 | ) | (3,730 | ) | ||||
| Accounts payable and accrued expenses |
4,668,598 | (2,157,556 | ) | |||||
|
|
|
|
|
|||||
| NET CASH USED IN OPERATING ACTIVITIES |
(29,483,469 | ) | (4,667,609 | ) | ||||
| CASH FLOWS FROM INVESTING ACTIVITIES |
||||||||
| Purchase of property and equipment |
(19,349,610 | ) | (16,825,904 | ) | ||||
| Release of restricted cash |
115,974,314 | 22,619,510 | ||||||
|
|
|
|
|
|||||
| NET CASH PROVIDED BY INVESTING ACTIVITIES |
96,624,704 | 5,793,606 | ||||||
| CASH FLOWS FROM FINANCING ACTIVITIES |
||||||||
| Payments for debt issue costs |
(1,758,762 | ) | (369,556 | ) | ||||
| Proceeds from long-term debt |
761,504 | 41,157 | ||||||
| Proceeds from notes payable |
49,888,976 | — | ||||||
| Purchase of tendered bonds |
(115,000,000 | ) | — | |||||
| Repayments on long-term debt |
(408,855 | ) | (409,534 | ) | ||||
| Members’ contributions, net of commissions |
— | 3,769,091 | ||||||
| Members’ distributions |
(423,500 | ) | (247,222 | ) | ||||
|
|
|
|
|
|||||
| NET CASH (USED IN) PROVIDED BY FINANCING ACTIVITIES |
(66,940,637 | ) | 2,783,936 | |||||
|
|
|
|
|
|||||
| NET INCREASE IN CASH AND CASH EQUIVALENTS |
200,598 | 3,909,933 | ||||||
| CASH AND CASH EQUIVALENTS |
||||||||
| Beginning of period |
170,439 | 157,921 | ||||||
|
|
|
|
|
|||||
| End of period |
$ | 371,037 | $ | 4,067,854 | ||||
|
|
|
|
|
|||||
| SUPPLEMENTAL CASH FLOW INFORMATION |
||||||||
| Interest paid, net of amount capitalized |
$ | 3,285 | $ | 3,285 | ||||
|
|
|
|
|
|||||
| NON-CASH INVESTING AND FINANCING ACTIVITIES |
||||||||
| Property and equipment purchased on account |
$ | 20,395,104 | $ | 3,609,604 | ||||
|
|
|
|
|
|||||
| Repayment of long-term debt by third party (Note E) |
$ | 9,000,000 | $ | — | ||||
|
|
|
|
|
|||||
| Debt incurred to settle financing costs |
$ | 400,000 | $ | — | ||||
|
|
|
|
|
|||||
| Capitalization of interest costs |
$ | 1,309,514 | $ | 3,814,651 | ||||
|
|
|
|
|
|||||
| Capitalization of bond discount amortization |
$ | — | $ | 117,808 | ||||
|
|
|
|
|
|||||
| Capitalization of debt issue costs amortization |
$ | 879,026 | $ | 225,252 | ||||
|
|
|
|
|
|||||
See accompanying notes to interim consolidated financial statements.
F-90
Table of Contents
JEFFERSON REFINERY, LLC AND SUBSIDIARIES
NOTES TO INTERIM CONSOLIDATED FINANCIAL STATEMENTS (UNAUDITED)
NOTE A - NATURE OF OPERATIONS
Jefferson Refinery, LLC (“Jefferson”) is a Texas limited liability company formed on June 21, 2007 to own, operate, and develop a diversified portfolio of complementary energy logistics assets located in Texas. Jefferson and its consolidated subsidiaries (as described below) are collectively referred to as the “Company” within these interim consolidated financial statements. The Company is headquartered in The Woodlands, Texas, and its planned principal operations are to engage in the business of terminalling, storage, throughput and transloading of crude oil and petroleum products, primarily from the North American shale plays. The Company commenced operations in January 2014.
The Company’s activities are subject to significant risk and uncertainties, including failure to secure additional funding to fully operationalize the Company’s current planned principal operations and failure to secure long-term revenue contracts with third parties. There can be no assurance that the Company will be successful in accomplishing its objectives.
On June 5, 2014, the Company entered into an asset purchase agreement (the “Fundamental Transaction”) with certain subsidiaries of Fortress Investment Group LLC and its related affiliates (collectively, “Fortress”), namely FTAI Energy Partners LLC, FTAI Energy Midstream Holdings LLC, FTAI Energy Downstream Holdings LLC, and FTAI Energy Development Holdings LLC (collectively the “Purchaser”), whereby the Purchaser acquired substantially all of the Company’s assets and assumed substantially all of the Company’s liabilities. As discussed in Note K, the Fundamental Transaction closed on August 27, 2014.
NOTE B - SUMMARY OF SIGNIFICANT ACCOUNTING POLICIES
Basis of Presentation and Principles of Consolidation: The accompanying interim unaudited consolidated financial statements are prepared in accordance with accounting principles generally accepted in the United States of America (“US GAAP”) and include the accounts of the Company’s wholly and majority-owned subsidiaries. Accordingly, they do not include all of the information and footnotes required by GAAP for complete financial statements. In the opinion of management, all material adjustments, which are of a normal and recurring nature necessary for a fair presentation of the results for the periods presented, have been reflected. The interim unaudited consolidated financial statements should be read in conjunction with the Company’s annual audited consolidated financial statements, which were issued on August 27, 2014.
As of June 30, 2014, the Company owned approximately 78.0% of Port of Beaumont Petroleum Transload Terminal, LLC (“PBPTT I”) and 97.3% of Port of Beaumont Petroleum Transload Terminal II, LLC (“PBPTT II”), and accounted for each as a consolidated subsidiary. All intercompany transactions and balances have been eliminated in consolidation.
Non-controlling interests are the portion of the equity in PBPTT I and PBPTT II that is not attributable, directly or indirectly, to the Company. Non-controlling interests are presented as a separate component of equity in the consolidated balance sheets. In addition, the accompanying interim consolidated statements of operations and comprehensive loss includes an allocation of net loss to the non-controlling interest holders in the consolidated subsidiaries.
Use of Estimates: The preparation of interim consolidated financial statements in conformity with US GAAP requires management to make estimates and assumptions that affect the reported amounts of assets and liabilities and disclosure of contingent assets and liabilities at the date of the interim consolidated financial statements, and the reported amounts of revenue and expenses during the reporting period. Actual results could differ from those estimates and assumptions used in preparing the accompanying interim consolidated financial statements. The Company’s significant accounting estimates are those related to depreciation of property and equipment,
F-91
Table of Contents
JEFFERSON REFINERY, LLC AND SUBSIDIARIES
NOTES TO INTERIM CONSOLIDATED FINANCIAL STATEMENTS (UNAUDITED)
NOTE B - SUMMARY OF SIGNIFICANT ACCOUNTING POLICIES
amortization of debt issuance costs and fair value of financial instruments. Further information can be found in Note C, Property and Equipment, and Note H, Fair Value Measurements.
Revenue Recognition: The Company recognizes revenue when it is realized and earned. The Company considers revenue to be realized and earned when services have been provided to the customer, the product has been delivered, the sales price is considered to be fixed or determinable and collectability is reasonably assured. Prepayments for services are deferred until the period in which the service is performed. Terminal services fees include services provided by the Company to third-party customers related to receipt and redelivery of crude oil products. Lease revenue relates to sub-leases of certain property and equipment assets leased by the Company from third parties.
Cash and Cash Equivalents: The Company considers all liquid investment instruments purchased with a maturity of three months or less to be cash equivalents.
Inventory: Crude oil inventory is carried at the lower of current market value or cost (generally determined under the last-in, first-out method - LIFO). Inventory costs include expenditures and other charges directly and indirectly incurred in bringing the inventory to its existing condition and location.
Property and Equipment: Property and equipment are stated at cost. Maintenance and repair costs are charged to expense as incurred; costs of major additions and betterments are capitalized. Interest costs directly related to and incurred during the construction period of property and equipment are capitalized. During the six months ended June 30, 2014 and 2013, the Company capitalized interest costs of $1,309,514 and $3,814,651, respectively. Depreciation is recorded using the straight-line method over the estimated useful lives of the related assets, which ranges from three to thirty years. Estimated useful lives are as follows:
| Plant |
30 years | |||
| Furniture and fixtures |
5 years | |||
| Computer equipment and software |
3 years | |||
| Previously-owned vehicles |
3 years |
Impairment of Long-Lived Assets: The Company reviews the recoverability of its long-lived assets, such as property and equipment, when events or changes in circumstances occur that indicate the carrying value of the asset or asset group may not be recoverable. The assessment of possible impairment is based on the Company’s ability to recover the carrying value of the asset or asset group from the expected future undiscounted cash flows of the related operations. If these cash flows are less than the carrying value of such asset, an impairment loss is recognized for the difference between the estimated fair value and carrying value of the asset or asset group. For the periods presented, no such impairments were recorded.
Debt Issue Costs: Costs related to the issuance of the on-demand notes are capitalized and amortized on a straight-line basis over the life of the related note. The Company amortized $273,188 and $0 of debt issue costs during the six months ended June 30, 2014 and 2013, respectively, which is included in interest expense within the interim consolidated statements of operations and comprehensive loss. Additionally, during the six months ended June 30, 2014 and 2013, the Company capitalized $879,026 and $225,252 of amortization expense pertaining to debt issue costs into construction in progress as a result of significant construction activities, respectively.
Issue costs related to the bonds payable are capitalized and amortized using the effective interest method. The Company amortized $118,010 of amortization expense pertaining to bond issue costs related to bonds payable
F-92
Table of Contents
JEFFERSON REFINERY, LLC AND SUBSIDIARIES
NOTES TO INTERIM CONSOLIDATED FINANCIAL STATEMENTS (UNAUDITED)
NOTE B - SUMMARY OF SIGNIFICANT ACCOUNTING POLICIES (Continued)
during the six month ended June 30, 2014, which is included in interest expense. Additionally, the Company capitalized $117,808 of amortization expense pertaining to debt issue costs related to bonds payable into construction in progress as a result of significant construction activities during the six months ended June 30, 2013.
The accumulated amortization of debt issue costs as of June 30, 2014 and December 31, 2013 was $3,057,669 and $2,178,643, respectively.
Restricted Cash: Cash that is subject to legal restrictions or is unavailable for general operating purposes is classified as restricted cash in the consolidated balance sheets. The Company’s restricted cash is comprised of unused proceeds from industrial bonds that were issued in 2010 and 2012 and are held at various financial institutions. Each of the Company’s bonds is intended to stimulate the economy of the respective beneficiary counties and have a specific purpose to that end. The unused proceeds are held in trust to ensure adherence to the restrictions of use. The Company must submit a request to a trustee for release of the funds. The Company considers all restricted cash to be long-term.
Federal Income Taxes: The Company is a limited liability company, which is considered a pass-through entity for federal income tax purposes, and thus no provision for federal income taxes has been recorded in the accompanying interim consolidated financial statements.
The Company is subject to state income tax expense related to the Texas margin tax. The margin tax applies to legal entities conducting business in Texas. The margin tax is based on Texas sourced taxable margin. The tax is calculated by applying a tax rate to a base that considers both revenues and expenses and therefore has the characteristics of an income tax. The margin tax expense was nil for the six months ended June 30, 2014 and 2013.
The Company follows the guidance in FASB ASC 740, Income Taxes, for accounting for uncertainty in income taxes. The guidance clarifies the accounting for income taxes by prescribing the minimum recognition threshold an income tax position is required to meet before being recognized in the financial statements and applies to all income tax positions. Each income tax position is assessed using a two-step process. A determination is made as to whether it is more likely than not that an income tax position will be sustained, based upon technical merits, upon examination by the taxing authorities. If the income tax position is expected to meet the more likely than not criteria, the benefit recorded in the financial statements equals the largest amount that is greater than 50% likely to be realized upon its ultimate settlement.
The income tax positions taken by the Company for any years open under the various statutes of limitations is that the Company continues to be exempt from federal income taxes by virtue of its pass through status, and that income tax is attributable to the Members. Management believes that this income tax position meets the more likely than not threshold, and accordingly, the tax benefit of this income tax position (no federal income tax expense or liability) has been recognized for the six months ended June 30, 2014 and 2013.
The Company records income tax related interest and penalties as a component of operating expenses. The Company recorded $0 and $1,251 for penalties and interest incurred as result of delinquent filing of prior years’ federal tax returns for the six month periods ended June 30, 2014 and 2013, respectively.
None of the Company’s federal or state income tax filings are currently under examination by the Internal Revenue Service (“IRS”) or state authorities. The Company’s federal income tax filings from 2010 forward and state income tax filings from 2009 forward remain subject to examination by the IRS and the State of Texas, respectively.
F-93
Table of Contents
JEFFERSON REFINERY, LLC AND SUBSIDIARIES
NOTES TO INTERIM CONSOLIDATED FINANCIAL STATEMENTS (UNAUDITED)
NOTE B - SUMMARY OF SIGNIFICANT ACCOUNTING POLICIES (Continued)
Concentrations of Credit Risk: Financial instruments that potentially subject the Company to credit risk are cash and cash equivalents and restricted cash. The Company maintains cash balances in high credit quality financial institutions which exceed federally insured limits. The Company monitors the financial condition of these institutions and has experienced no losses associated with these accounts.
Comprehensive Loss: The Company has no components of comprehensive loss other than its net loss, and accordingly, comprehensive loss is equal to net loss for all periods presented.
Recently Issued Accounting Pronouncements: On May 28, 2014, the FASB issued ASU No. 2014-09, Revenue from Contracts with Customers (“ASU 2014-09”). ASU 2014-09 will eliminate transaction and industry-specific revenue recognition guidance under current US GAAP and replace it with a principle-based approach for determining revenue recognition. ASU 2014-09 will require that companies recognize revenue based on the value of transferred goods or services as they occur in the contract. The ASU also will require additional disclosure about the nature, amount, timing and uncertainty of revenue and cash flows arising from customer contracts, including significant judgments and changes in judgments and assets recognized from costs incurred to obtain or fulfill a contract. ASU 2014-09 is effective for reporting periods beginning after December 15, 2016 for public entities, and early adoption is not permitted. Entities can transition to the standard either retrospectively or as a cumulative-effect adjustment as of the date of adoption. Management has not determined the effect of adopting ASU 2014-09 on the Company’s ongoing financial reporting.
NOTE C - PROPERTY AND EQUIPMENT
Property and equipment consisted of the following:
| June 30, 2014 | December 31, 2013 | |||||||
| (Unaudited) | ||||||||
| Plant |
$ | 68,535,540 | $ | — | ||||
| Land |
5,804,137 | 5,804,138 | ||||||
| Furniture and fixtures |
137,133 | 134,508 | ||||||
| Computer equipment and software |
44,491 | 44,492 | ||||||
| Previously-owned vehicles |
317,672 | 230,027 | ||||||
|
|
|
|
|
|||||
| 74,838,973 | 6,213,165 | |||||||
| Less: accumulated depreciation |
(757,901 | ) | (244,468 | ) | ||||
|
|
|
|
|
|||||
| 74,081,072 | 5,968,697 | |||||||
| Construction in process |
72,322,118 | 111,687,525 | ||||||
|
|
|
|
|
|||||
| Total property and equipment |
$ | 146,403,190 | $ | 117,656,222 | ||||
|
|
|
|
|
|||||
Depreciation expense was $513,433 and $33,244 for the six month periods ended June 30, 2014 and 2013, respectively.
F-94
Table of Contents
JEFFERSON REFINERY, LLC AND SUBSIDIARIES
NOTES TO INTERIM CONSOLIDATED FINANCIAL STATEMENTS (UNAUDITED)
NOTE D - ACCRUED EXPENSES
Accrued expenses consisted of the following:
| June 30, 2014 | December 31, 2013 | |||||||
| (Unaudited) | ||||||||
| Fundamental Transaction costs |
$ | 23,481,712 | $ | — | ||||
| Interest |
7,708,952 | 5,207,609 | ||||||
| Payroll and bonuses |
1,884,858 | 1,857,104 | ||||||
| Other |
385,085 | 1,019,936 | ||||||
|
|
|
|
|
|||||
| $ | 33,460,607 | $ | 8,084,649 | |||||
|
|
|
|
|
|||||
As described in Note A, the Fundamental Transaction was entered into on June 5, 2014. As a result, the Company incurred various costs directly related to the Fundamental Transaction, including breakage (i.e., early termination) fees of $3,150,476, financial settlement fees of $2,859,537 related to settlement of commissions and the Company’s purchase of Membership Interests in the Company from certain members, management fees to the Company’s Chief Executive Officer of $10,387,564, and other transaction expenses of $7,084,135 as of June 30, 2014.
As of June 30, 2014 and December 31, 2013, the Company has recorded approximately $1,420,000 and $1,418,000, respectively, of accrued back pay (including applicable payroll taxes) dating back to 2008 for the Company’s Chief Executive Officer and Chief Financial Officer, which are included within payroll and bonuses. The back pay represents normal salaries to be paid; it is neither conditional nor part of any deferred compensation arrangement. Additionally, the back pay does not accrue interest.
NOTE E - LONG-TERM DEBT
Long-term debt consisted of the following:
| Rates |
Stated Maturity Dates |
June 30, 2014 | December 31, 2013 | |||||||||
| (Unaudited) | ||||||||||||
| Note Payable (“Raven” Note) by JML |
18.0% | April 2014 | $ | — | $ | 6,900,175 | ||||||
| Collateralized Note Payable to Seller |
5.0% | January 2032 | 2,356,551 | 2,356,551 | ||||||||
| Collateralized Notes Payable to Members |
12.0% - 15.0% | Various dates through 2012 | 6,000,000 | 6,000,000 | ||||||||
| Subordinated Notes Payable to Members |
Prime + 7.0% (or minimum of 12.0%) | August 2013 - February 2014 | 5,785,000 | 5,785,000 | ||||||||
| Subordinated Note Payable to Seller |
4.0% | June 2014 | 1,100,000 | 1,100,000 | ||||||||
| Uncollateralized Notes Payable to Members |
11.0% - 24.0% | Payable on-demand - October 2014 | 7,347,000 | 7,057,000 | ||||||||
| Other Obligations |
0.0% - 6.7% | Payable on-demand - October 2018 | 223,829 | 161,180 | ||||||||
|
|
|
|
|
|||||||||
| Total |
22,812,380 | 29,359,906 | ||||||||||
| Less: Current Maturities |
(20,541,295 | ) | (27,021,129 | ) | ||||||||
|
|
|
|
|
|||||||||
| Total Long-Term Debt |
$ | 2,271,085 | $ | 2,338,777 | ||||||||
|
|
|
|
|
|||||||||
F-95
Table of Contents
JEFFERSON REFINERY, LLC AND SUBSIDIARIES
NOTES TO INTERIM CONSOLIDATED FINANCIAL STATEMENTS (UNAUDITED)
NOTE E - LONG-TERM DEBT (Continued)
Raven Note: This note relates to the purchase of railcars during 2013 with interest accruing at 18.0% per annum, was due April 2014 and was collateralized by the purchased railcars. The note includes rights to receive 2.5% of the membership interests of PBPTT I and PBPTT II. The rights to receive membership interests may be exercised at any time, are freely assignable, and are protected from dilution until the Company receives $165,000,000 in third party equity financing. Of the $9,000,000 total consideration received, $6,900,175 was allocated to the carrying value of the note and the $2,099,825 allocable to the rights to receive membership interests was recorded in Members’ Equity.
On April 21, 2014, the Raven note was purchased by a third party, FTAI Railcar Holdings LLC (“FTAI Holdings”), a Fortress affiliate, for $10,186,670 (the “Railcar Purchase Agreement”). The terms of the Railcar Purchase Agreement stipulate that the holder of the rights to receive membership interests under the Raven note may not exercise such rights to receive membership interests until the earlier of: 1) Fundamental Transaction closing (generally defined as a sale or change in control of PBPTT I and PBPTT II), 2) December 31, 2014, or 3) the abandonment date of the contemplated Fundamental Transaction, which is the date, if any, on which FTAI Holdings or any of its affiliates provide notice to Jefferson indicating FTAI Holdings and its affiliates are no longer pursuing a Fundamental Transaction. Prior to the closing of the Fundamental Transaction, the rights to receive membership interests will be deemed exercised and converted to cash that the holder would have been entitled to as a holder of Membership interests in PBPTT I and PBPTT II. As noted in Note A, the Fundamental Transaction closed on August 27, 2014.
Collateralized Note Payable to Seller: This balance consists of a note payable to the seller of the land in High Island, Texas, which is collateralized by a deed of trust owned by the Company. The note payable to the seller of the land of $2,356,551 accrues interest at 5.0% per annum, is subordinate to the Series 2010 and 2012 bonds, and matures in January 2032.
Collateralized Notes Payable to Members: This balance includes notes that accrue at 12.0% per annum, increasing to 15.0% during 2012, which matured at various dates during 2012. These notes are collateralized by deeds of trust and security agreements in land and equipment owned by the Company. For each $250,000 of principal, the note holder received 0.25% of equity interests of the Company.
Subordinated Notes Payable to Members: This balance consists of two notes, which both accrue interest at a rate equal to the greater of prime plus 7.0% or 12.0% and is due monthly. The first of the two notes, which has a balance of $4,685,000, matured in August 2013 and is due on demand. Of this balance, $4,600,000 is collateralized by a secondary lien on land and equipment (the remaining $85,000 is unsecured). The second of the two notes, which has a balance of $1,100,000, matured in February 2014, is due on demand, and is collateralized by a primary lien on property.
Subordinated Note Payable to Seller: This balance represents a note payable to the seller of the purchased refinery, with interest that accrues at 4.0% per annum and is due monthly. This note is collateralized by a secondary lien on property. This note matured in September 2012; however, the maturity date was extended to June 2014 and is due on demand as of June 30, 2014.
Uncollateralized Notes Payable to Members: This balance is comprised of twelve notes that have interest accruing from 11.0% to 24.0% per annum. Of the twelve notes, six notes have an aggregate principal balance of $5,375,000, accrue interest at 11.0% per annum, and entitle the holder to a 0.125% Membership Interest in the Company for each $250,000 of principal. Three notes have an aggregate principal balance of $1,117,000 and accrue interest at 12.0% per annum, which is due monthly. Additionally, this balance includes one note with a
F-96
Table of Contents
JEFFERSON REFINERY, LLC AND SUBSIDIARIES
NOTES TO INTERIM CONSOLIDATED FINANCIAL STATEMENTS (UNAUDITED)
NOTE E - LONG-TERM DEBT (Continued)
principal balance of $165,000 that accrues interest at 24.0% per annum, which is due monthly. These ten notes matured prior to June 30, 2014, and are on demand as of that date. One note matured on June 1, 2014, has a principal balance of $290,000, accrues interest at 15% per annum and is due on demand as of that date. Additionally, one note matures in October 2014, has a principal balance of $400,000, and accrues interest at 12.0% per annum.
Other Obligations: This balance consists of an uncollateralized line of credit and notes payable to various finance companies. The line of credit is with an affiliate of a Member with 6.0% interest compounded annually. The unpaid balance of $71,000 was due on January 2013. The remaining notes payable of $152,829 to various finance companies accrue interest between 0.0% and 6.7% per annum and mature at various dates between October 2016 and October 2018.
As of June 30, 2014 and December 31, 2013, the Company had pledged $30,758,538 and $41,084,566 of assets as collateral against long term notes, respectively. These assets are long term in nature and include land, equipment and property owned by the Company. The long term notes contain security agreements and liens entitling the holders of the notes to such assets.
NOTE F - BONDS PAYABLE
Series 2010 Bonds
The Company’s development projects will be partially funded with tax-exempt industrial development bonds issued by the Jefferson County Development Corporation (“Issuer”), pursuant to the Tax Extenders and Alternative Minimum Tax Relief Act of 2008 (“Series 2010 Bonds”), which provides tax-exempt financing for businesses impacted by Hurricane Ike. Through Jefferson County Development Corporation, the Company issued an initial principal amount of $300,000,000 on December 1, 2010. The bonds have a stated maturity date of December 1, 2040, and the principal amount is due at maturity. Interest on the bonds is subject to being remarketed and the bondholders have the right to tender the bonds at each remarketing date.
On January 15, 2014, one of the original bondholders tendered $115,000,000 of the Series 2010 Bonds and a buyer for the tendered bonds could not be found. As a result, and per the terms of the trust indenture and security agreements, on January 15, 2014, the Company purchased the $115,000,000 of Series 2010 Bonds from the original bondholder utilizing the restricted cash proceeds from the original issuance. The tendered bonds do not convey principal or interest payments while held by the Company.
As of June 30, 2014 and December 31, 2013, $299,995,000 is payable at 0.55% per annum, and use of the proceeds is restricted for the benefit of Jefferson County. The restricted cash proceeds are currently invested with financial institutions and the amount will be held in trust pending remarketing of some or all of the bonds to long-term investors willing to assume the risks associated with construction and development of the Company’s projects. Interest on the bonds will be at a higher rate when remarketed to long-term investors.
Series 2012 Bonds
On August 1, 2012, the Company issued tax-exempt industrial development bonds by the Jefferson County (Texas) Industrial Development Corporation with principal of $46,875,000 at a 6.90% discount for a net of $43,640,625, with an interest rate of 8.25% per annum. The bond discount is amortized using the effective interest method to interest expense over the contractual term of the bond; however, the Company has capitalized the related interest costs during the construction period into property and equipment (specifically, construction in
F-97
Table of Contents
JEFFERSON REFINERY, LLC AND SUBSIDIARIES
NOTES TO INTERIM CONSOLIDATED FINANCIAL STATEMENTS (UNAUDITED)
NOTE F - BONDS PAYABLE (Continued)
progress). For the six months ended June 30, 2013, the Company capitalized bond discount amortization of $117,808 and for the six months ended June 30, 2014, the Company recorded amortization of bond discount of $118,010 to interest expense.
The Series 2012 Bonds have a stated maturity of July 1, 2032, and require scheduled principal payments. The use of the bond proceeds is restricted to funding construction and operation of an intermodal transfer facility for crude oil and refined petroleum products. The principal of the Series 2012 Bonds are payable annually at varying amounts.
The face amount of bonds payable consisted of the following:
| June 30, 2014 | December 31, 2013 | |||||||
| (Unaudited) | ||||||||
| Series 2010 bonds |
$ | 299,995,000 | $ | 299,995,000 | ||||
| Series 2012 bonds |
46,805,000 | 46,805,000 | ||||||
|
|
|
|
|
|||||
| Total bonds payable |
$ | 346,800,000 | $ | 346,800,000 | ||||
|
|
|
|
|
|||||
| June 30, 2014 | December 31, 2013 | |||||||
| (Unaudited) | ||||||||
| Current portion of bonds payable |
$ | 80,000 | $ | 80,000 | ||||
| Long-term bonds payable |
346,720,000 | 346,720,000 | ||||||
|
|
|
|
|
|||||
| Total bonds payable |
346,800,000 | 346,800,000 | ||||||
| Less: bond discounts, net of amortization |
(2,802,345 | ) | (2,920,355 | ) | ||||
|
|
|
|
|
|||||
| Carrying amount of bonds payable |
$ | 343,997,655 | $ | 343,879,645 | ||||
|
|
|
|
|
|||||
NOTE G - NOTES PAYABLE
January Credit Agreement
On January 22, 2014, a subsidiary of the Company, Jeffco, entered into a $15,100,000 credit agreement (the “January Credit Agreement”) with FTAI Energy Co 1 Ltd. (“Energyco”), a Fortress affiliate, bearing interest at 8% per annum through April 21, 2014 and 12% per annum subsequent to April 21, 2014. The January Credit Agreement is collateralized by substantially all of the Jeffco assets, including a pledge of all of the equity interests of its subsidiaries. In addition, Jefferson has guaranteed the obligations of Jeffco by granting a lien on substantially all of its assets, including a pledge of all of the equity interests of its subsidiaries. The January Credit Agreement matures on the earliest of: 1) December 31, 2014, 2) the maturity extension option date (April 22, 2014), or 3) the date on which amounts become due and payable in full under the January Credit Agreement, whether by acceleration or otherwise. Borrowings under the January Credit Agreement totaled $15,100,000 through June 30, 2014.
February Credit Agreement
On February 25, 2014, Jefferson entered into a $15,100,000 credit agreement (the “February Credit Agreement”) with Energyco, bearing interest at 8% per annum through April 21, 2014 and 12% per annum subsequent to April 21, 2014. On February 25, 2014, the Company received $6,100,000 under the February Credit Agreement. The February Credit Agreement is collateralized by substantially all of Jefferson’s assets, including a pledge of
F-98
Table of Contents
JEFFERSON REFINERY, LLC AND SUBSIDIARIES
NOTES TO INTERIM CONSOLIDATED FINANCIAL STATEMENTS (UNAUDITED)
NOTE G - NOTES PAYABLE (Continued)
all of the equity interests of its subsidiaries. The February Credit Agreement matures on the earliest of: 1) December 31, 2014, 2) the maturity extension option date (April 22, 2014), or 3) the date on which amounts become due and payable in full under the February Credit Agreement, whether by acceleration or otherwise.
On March 17, 2014, the Company received $6,400,000 in additional funds under the February Credit Agreement. In connection with this additional advance, Jefferson Railcars, LLC (“Jefferson Railcars”) granted an option to Energyco to purchase 15 railcars for $2,250,000 (the “Option”). The Option was then assigned by Energyco to FTAI Holdings.
On April 24, 2014, FTAI Holdings exercised the Option and paid the $2,250,000 to Jefferson Railcars by directing Energyco to set off and apply the $2,250,000 to the principal amount of the loans outstanding under the Credit Agreement, in lieu of paying the option fee in cash.
The February Credit Agreement was subsequently amended in June 2014 and the line of credit was increased to $70,100,000. Borrowings under the February Credit Agreement totaled $35,188,976 through June 30, 2014.
Jefferson Credit Agreements
On April 21, 2014, Jeffco and Jefferson elected to extend the January Credit Agreement and February Credit Agreement (collectively, the “Jefferson Credit Agreements”) to December 31, 2014. In connection with these extensions, both Jeffco and Jefferson incurred extension fees of $200,000 ($400,000 in the aggregate) to Energyco. In lieu of paying cash, the $400,000 of extension fees was added to the outstanding principal balance of the February Credit Agreement.
The Company is in default on the Jefferson Credit Agreements as a result of non-compliance with certain financial reporting requirements. No waivers for these events of non-compliance have been provided.
NOTE H - FAIR VALUE MEASUREMENTS
The Company does not measure any assets or liabilities at fair value on a recurring basis in its consolidated balance sheets. The Company categorizes assets and liabilities disclosed at fair value into one of three different levels depending on the observability of the inputs employed in the measurement (the fair value hierarchy).
| • | Level 1 inputs are quoted prices in active markets for identical assets or liabilities. |
| • | Level 2 inputs are observable inputs other than Level 1 prices, for example, quoted prices for similar assets and liabilities in active markets, quoted prices for identical or similar assets or liabilities in markets that are not active, and inputs that are observable or can be corroborated, either directly or indirectly, for substantially the full term of the financial instrument. |
| • | Level 3 inputs are unobservable inputs for the asset or liability reflecting significant modifications to observable related market data or our assumptions about pricing by market participants. |
The Company utilizes valuation techniques that maximize the use of observable inputs (Levels 1 and 2) and minimize the use of unobservable inputs (Level 3) within the fair value hierarchy. The level within the fair value hierarchy is based on the lowest level of input that is significant to the fair value measurements.
The fair values of the Company’s cash and cash equivalents, accounts receivable, restricted cash, accounts payable, accounts payable - related parties, and notes payable approximate their carrying values due to their short-term or on-demand nature, or market rates of interest.
F-99
Table of Contents
JEFFERSON REFINERY, LLC AND SUBSIDIARIES
NOTES TO INTERIM CONSOLIDATED FINANCIAL STATEMENTS (UNAUDITED)
NOTE H - FAIR VALUE MEASUREMENTS (Continued)
As of June 30, 2014, the Company’s long-term debt is comprised of the following classes: collateralized notes payable to sellers, collateralized notes payable to members, subordinated notes payable to members, subordinated note payable to seller, uncollateralized notes payable to members, and other obligations. As of December 31, 2013, the Company’s long-term debt also included the Raven note.
The fair value of the collateralized notes payable to members was estimated to approximate carrying value as they all matured in 2012 and the fair value of the Company’s equity is positive.
The fair value of the subordinated notes payable to members and the subordinated note payable to seller were estimated to approximate carrying value based upon a market rate of interest adjusted for necessary risks, including the Company’s business enterprise value.
The fair value of uncollateralized notes payable to members was estimated to approximate carrying value as of June 30, 2014 and December 31, 2013 as the notes are pre-payable by the Company and due on demand by the investor.
Bonds payable consist of Series 2012 Bonds and Series 2010 Bonds. The fair value of the bonds payable was estimated to approximate carrying value based on an evaluation of pricing data, vendor quotes, and historical trading activity.
As of June 30, 2014, the fair value of the collateralized note payable to sellers approximates carrying value as the note contains a change in control provision, triggered by the Fundamental Transaction, which requires redemption at par. The table below shows the fair value and fair value hierarchy for the Raven note and the collateralized notes payable to sellers as of December 31, 2013.
| December 31, 2013 | ||||||||||||||||
| Description |
Level 1 | Level 2 | Level 3 | Total | ||||||||||||
| Raven Note |
$ | — | $ | — | $ | 7,719,338 | $ | 7,719,338 | ||||||||
|
|
|
|
|
|
|
|
|
|||||||||
| Collateralized note payable to sellers |
$ | — | $ | — | $ | 1,316,200 | $ | 1,316,200 | ||||||||
|
|
|
|
|
|
|
|
|
|||||||||
The fair value of the Raven note was estimated at $7,719,338 at December 31, 2013, based on an evaluation of changes in market interest rates between the issuance date (i.e., October 11, 2013) and December 31, 2013. Accordingly, the Raven note is classified within Level 3 of the fair value hierarchy.
The fair value of the collateralized note payable to sellers was estimated at $1,316,200 as of December 31, 2013 based on a discounted cash flow model. Accordingly, the collateralized note payable to sellers is classified within Level 3 of the fair value hierarchy.
NOTE I - RELATED PARTY TRANSACTIONS
The Company has a significant related party vendor which provides construction services for the Company’s facilities, and accounts for approximately 77.0% and 53.0% of total purchases during the six months ended June 30, 2014 and 2013, respectively. As of June 30, 2014 and December 31, 2013, accounts payable to this vendor totaled $19,324,537 and $17,542,537, respectively.
F-100
Table of Contents
JEFFERSON REFINERY, LLC AND SUBSIDIARIES
NOTES TO INTERIM CONSOLIDATED FINANCIAL STATEMENTS (UNAUDITED)
NOTE I - RELATED PARTY TRANSACTIONS (Continued)
The Company conducted various transactions and activities with a number of related parties with such expenses included in the accompanying interim consolidated financial statements. These amounts represent approximately $0 and $198,220 of the Company’s operating expenses for the six month periods ended June 30, 2014 and 2013, respectively.
The Company also holds various notes payable with its Members, which are included in the current portion of long-term debt on the accompanying consolidated balance sheets, and have carrying amounts of $19,203,000 and $18,913,000 as of June 30, 2014 and December 31, 2013, respectively.
NOTE J - COMMITMENTS AND CONTINGENCIES
Operating Leases
The Company has non-cancellable operating lease agreements for certain equipment and office facilities.
For the six month periods ended June 30, 2014 and 2013, rent expense under all operating leases was $2,630,876 and $501,623, respectively.
NOTE K - SUBSEQUENT EVENTS
The Company evaluates events and transactions occurring after the consolidated balance sheet date, but before the interim consolidated financial statements are available to be issued. The Company has evaluated such events and transactions through September 26, 2014, the date the interim consolidated financial statements were available for issuance.
Terminalling Agreements Assignment
On August 7, 2014, the Company and Energyco entered into an assignment and assumption agreement whereby Merrill Lynch Commodities, Inc. (“MLC”) assigned to Energyco its right, title and interest in, and Energyco assumed all obligations and liabilities with respect to, the Prepaid Physical Throughput Capacity Purchase and Sale Agreement (the “Terminalling Agreements”). As part of the Terminalling Agreements Assignment, MLC also assigned to Energyco certain Deed of Trust, Security Agreement and Fixture Filings for Jefferson Processing, LLC (a Jefferson subsidiary) and PBPTT II related to certain processing tract assets.
Acquisition of Jefferson by Fortress Investment Group
On August 27, 2014, the Company completed its acquisition by Fortress Investment Group LLC and its related affiliates (collectively, “Fortress”) (i.e., the Fundamental Transaction). In connection with the acquisition by Fortress, the Company sold substantially all of its assets and liabilities to Fortress for total consideration of $422,064,669.
F-101
Table of Contents
The Board of Directors and Stockholders
Montreal, Maine & Atlantic Railway, Ltd.
and Montreal, Maine & Atlantic Canada Co.
We have audited the accompanying combined financial statements of Montreal, Maine & Atlantic Railway, Ltd. and Montreal, Maine & Atlantic Canada Co. (the Company) which comprise the combined balance sheets as of December 31, 2013 and 2012, and the related combined statements of operations and comprehensive (loss) income, combined statements of equity and combined statements of cash flows for the years then ended and the related notes to the financial statements.
Management’s Responsibility for the Financial Statements
Management is responsible for the preparation and fair presentation of these combined financial statements in accordance with accounting principles generally accepted in the United States of America; this includes the design, implementation, and maintenance of internal control relevant to the preparation and fair presentation of combined financial statements that are free from material misstatement, whether due to fraud or error.
Auditors’ Responsibility
Our responsibility is to express an opinion on these combined financial statements based on our audits. We conducted our audits in accordance with auditing standards generally accepted in the United States of America. Those standards require that we plan and perform the audit to obtain reasonable assurance about whether the combined financial statements are free of material misstatement.
An audit involves performing procedures to obtain audit evidence about the amounts and disclosures in the combined financial statements. The procedures selected depend on the auditors’ judgment, including the assessment of the risks of material misstatement of the combined financial statements, whether due to fraud or error. In making those risk assessments, the auditor considers internal control relevant to the Company’s preparation and fair presentation of the combined financial statements in order to design audit procedures that are appropriate in the circumstances, but not for the purpose of expressing an opinion on the effectiveness of the Company’s internal control. Accordingly, we express no such opinion. An audit also includes evaluating the appropriateness of accounting policies used and the reasonableness of significant accounting estimates made by management, as well as evaluating the overall presentation of the combined financial statements.
We believe that the audit evidence we have obtained is sufficient and appropriate to provide a reasonable basis for our audit opinion.
F-102
Table of Contents
The Board of Directors and Stockholders
Montreal, Maine & Atlantic Railway, Ltd.
and Montreal, Maine & Atlantic Canada Co.
Opinion
In our opinion, the combined financial statements referred to above present fairly, in all material respects, the financial position of the Company as of December 31, 2013 and 2012, and the results of their operations and their cash flows for the years then ended in accordance with accounting principles generally accepted in the United States of America.
Emphasis of Matters
The accompanying financial statements have been prepared assuming that the Company will continue as a going concern. As described in notes 1, 13 and 14 of the combined financial statements, the Company was involved in a train derailment accident, which caused significant environmental and property damage and is presumed to have caused the death of 47 people. As a result, the Company faces litigation and claims for amounts far in excess of the value of its assets. The Company was also forced to close a significant portion of its track, which substantially impacted revenues. Consequently, the Company has filed for creditor protection under relevant jurisdictions of the United States and Canada. In 2014, substantially all of the Company’s assets were sold at auction. These matters raise substantial doubt about the Company’s ability to continue as a going concern. The financial statements do not include any adjustments that might result from the outcome of these matters. Our opinion is not modified with respect to these matters.
| /s/ Baker Newman & Noyes, LLC | ||
| Portland, Maine September 9, 2014 |
Limited Liability Company | |
F-103
Table of Contents
MONTREAL, MAINE & ATLANTIC RAILWAY, LTD.
(Under Creditor Protection Proceedings as of August 7, 2013)
Combined Balance Sheets
December 31, 2013 and 2012
(dollars in thousands)
| 2013 | 2012 | |||||||
| Assets |
||||||||
| Current assets: |
||||||||
| Cash and temporary cash investments |
$ | 148 | $ | 234 | ||||
| Restricted cash |
4,490 | — | ||||||
| Receivables: |
||||||||
| Trade accounts receivable |
2,903 | 8,668 | ||||||
| Due from government agency |
— | 2,000 | ||||||
| Related party |
— | 3,340 | ||||||
| Material and supplies |
297 | 1,378 | ||||||
| Prepaid expenses and other |
50 | 89 | ||||||
|
|
|
|
|
|||||
| Total current assets |
7,888 | 15,709 | ||||||
| Property and equipment – net |
17,060 | 59,460 | ||||||
| Other long-term assets |
83 | 228 | ||||||
|
|
|
|
|
|||||
| Total assets |
$ | 25,031 | $ | 75,397 | ||||
|
|
|
|
|
|||||
| Liabilities and Shareholders’ Deficit |
||||||||
| Current liabilities: |
||||||||
| Current portion of notes payable |
$ | — | $ | 6,000 | ||||
| Current portion of long-term debt |
— | 30,005 | ||||||
| Post-petition financing line of credit |
2,042 | — | ||||||
| Accounts payable |
153 | 6,726 | ||||||
| Accrued liabilities: |
||||||||
| Wages and benefits |
1,218 | 771 | ||||||
| Income tax payable |
— | 213 | ||||||
| Restructuring and related charges |
4,457 | — | ||||||
| Accrued interest |
— | 1,256 | ||||||
| Accrued liabilities, related party |
— | 3,466 | ||||||
| Other |
811 | 3,369 | ||||||
|
|
|
|
|
|||||
| Total current liabilities |
8,681 | 51,806 | ||||||
| Long-term liabilities: |
||||||||
| Long-term debt and other obligations |
— | 993 | ||||||
| Deferred credits |
— | 7,751 | ||||||
|
|
|
|
|
|||||
| Total long-term liabilities |
— | 8,744 | ||||||
| Liabilities subject to compromise |
44,704 | — | ||||||
|
|
|
|
|
|||||
| Total liabilities |
53,385 | 60,550 | ||||||
| Commitments and contingencies (note 13) |
||||||||
| Stockholders’ deficit: |
||||||||
| Parent investment |
40,147 | 40,270 | ||||||
| Accumulated other comprehensive income |
3,379 | 3,761 | ||||||
| Accumulated deficit |
(71,880 | ) | (29,184 | ) | ||||
|
|
|
|
|
|||||
| Total stockholders’ deficit |
(28,354 | ) | 14,847 | |||||
|
|
|
|
|
|||||
| Total liabilities and stockholders’ deficit |
$ | 25,031 | $ | 75,397 | ||||
|
|
|
|
|
|||||
See accompanying notes.
F-104
Table of Contents
MONTREAL, MAINE & ATLANTIC RAILWAY, LTD.
(Under Creditor Protection Proceedings as of August 7, 2013)
Combined Statements of Operations and Comprehensive (Loss) Income
For the Years Ended December 31, 2013 and 2012
(dollars in thousands)
| 2013 | 2012 | |||||||
| Revenues: |
||||||||
| Freight transportation revenue |
$ | 23,210 | $ | 31,407 | ||||
| Switching and miscellaneous railroad revenue |
3,360 | 5,249 | ||||||
|
|
|
|
|
|||||
| Total revenues |
26,570 | 36,656 | ||||||
| Operating expenses: |
||||||||
| Payroll and related expenses |
13,299 | 13,324 | ||||||
| Materials and supplies expense |
2,392 | 2,875 | ||||||
| Locomotive diesel fuel expense |
7,014 | 9,233 | ||||||
| Freight car expense |
1,621 | 3,059 | ||||||
| Equipment lease expense |
621 | 557 | ||||||
| Outside services |
2,175 | 1,921 | ||||||
| General and administrative |
8,364 | 3,842 | ||||||
| Depreciation and impairment |
33,170 | 1,961 | ||||||
| Track maintenance expense reimbursement |
(1,942 | ) | (3,032 | ) | ||||
|
|
|
|
|
|||||
| Total operating expenses |
66,714 | 33,740 | ||||||
|
|
|
|
|
|||||
| Operating (loss) income |
(40,144 | ) | 2,916 | |||||
| Foreign currency gain |
— | 6 | ||||||
| Gain (loss) on sale of assets |
398 | (12 | ) | |||||
| Nonoperating income |
4,204 | 171 | ||||||
| Interest expense |
(1,136 | ) | (1,647 | ) | ||||
| Reorganization items, net |
(6,018 | ) | — | |||||
|
|
|
|
|
|||||
| (Loss) income from operations |
(42,696 | ) | 1,434 | |||||
| Income taxes |
— | — | ||||||
|
|
|
|
|
|||||
| Net (loss) income from operations |
(42,696 | ) | 1,434 | |||||
| Other comprehensive income: |
||||||||
| Currency translation adjustment |
(382 | ) | 288 | |||||
|
|
|
|
|
|||||
| Comprehensive (loss) income |
$ | (43,078 | ) | $ | 1,722 | |||
|
|
|
|
|
|||||
See accompanying notes.
F-105
Table of Contents
MONTREAL, MAINE & ATLANTIC RAILWAY, LTD.
(Under Creditor Protection Proceedings as of August 7, 2013)
Combined Statements of Equity
December 31, 2013 and 2012
(dollars in thousands)
| Parent Company Investment |
Accumulated Deficit |
Accumulated Other Comprehensive (Loss) Income |
Total | |||||||||||||
| Balance, December 31, 2011 |
$ | 40,284 | $ | (30,618 | ) | $ | 3,473 | $ | 13,139 | |||||||
| Net income |
— | 1,434 | — | 1,434 | ||||||||||||
| Comprehensive income |
— | — | 288 | 288 | ||||||||||||
| Net decrease in parent company investment |
(14 | ) | — | — | (14 | ) | ||||||||||
|
|
|
|
|
|
|
|
|
|||||||||
| Balance, December 31, 2012 |
40,270 | (29,184 | ) | 3,761 | 14,847 | |||||||||||
| Net loss |
— | (42,696 | ) | — | (42,696 | ) | ||||||||||
| Comprehensive loss |
— | — | (382 | ) | (382 | ) | ||||||||||
| Net decrease in parent company investment |
(123 | ) | — | — | (123 | ) | ||||||||||
|
|
|
|
|
|
|
|
|
|||||||||
| Balance, December 31, 2013 |
$ | 40,147 | $ | (71,880 | ) | $ | 3,379 | $ | (28,354 | ) | ||||||
|
|
|
|
|
|
|
|
|
|||||||||
See accompanying notes.
F-106
Table of Contents
MONTREAL, MAINE & ATLANTIC RAILWAY, LTD.
(Under Creditor Protection Proceedings as of August 7, 2013)
Combined Statements of Cash Flows
For the Years Ended December 31, 2013 and 2012
(dollars in thousands)
| 2013 | 2012 | |||||||
| Cash flows from operating activities: |
||||||||
| Net (loss) income |
$ | (42,696 | ) | $ | 1,434 | |||
| Adjustments to reconcile net (loss) income to net cash (used) provided by operating activities: |
||||||||
| Foreign currency gain |
— | (6 | ) | |||||
| Depreciation and impairment |
33,170 | 1,960 | ||||||
| (Gain) loss on sale of property and equipment |
(398 | ) | 12 | |||||
| Reorganization items, net |
4,594 | — | ||||||
| Amortization of deferred financing costs and debt discount |
8 | 8 | ||||||
| Amortization of deferred credits |
(617 | ) | (1,360 | ) | ||||
| Provision for uncollectible accounts |
4,364 | 72 | ||||||
| Change in assets and liabilities: |
||||||||
| Restricted cash |
(4,490 | ) | — | |||||
| Accounts receivable |
4,741 | (4,919 | ) | |||||
| Material and supplies |
451 | (17 | ) | |||||
| Prepaid expenses |
39 | 26 | ||||||
| Accounts payable |
2,184 | 2,629 | ||||||
| Accrued and other current liabilities |
(2,003 | ) | 3,194 | |||||
| Income taxes payable |
(213 | ) | (137 | ) | ||||
|
|
|
|
|
|||||
| Net cash (used) provided by operating activities |
(866 | ) | 2,896 | |||||
| Cash flows from investing activities: |
||||||||
| Acquisition of capital assets |
(848 | ) | (3,807 | ) | ||||
| Deferred credits |
179 | 171 | ||||||
| Proceed from sale of property and equipment |
3,000 | 149 | ||||||
| Principal payments received on notes receivable |
— | 66 | ||||||
|
|
|
|
|
|||||
| Net cash provided (used) by investing activities |
2,331 | (3,421 | ) | |||||
| Cash flows from financing activities: |
||||||||
| Repayment of long-term debt |
(2,926 | ) | (669 | ) | ||||
| Payments on line of credit |
(567 | ) | — | |||||
| Borrowings on line of credit |
— | 950 | ||||||
| Borrowings on post-petition financing |
2,042 | — | ||||||
| Net transfers to Parent and affiliates |
(123 | ) | (14 | ) | ||||
|
|
|
|
|
|||||
| Net cash (used) provided by financing activities |
(1,574 | ) | 267 | |||||
| Effect of exchange rate changes on cash |
23 | (12 | ) | |||||
|
|
|
|
|
|||||
| Net decrease in cash |
(86 | ) | (270 | ) | ||||
| Cash and cash equivalents at beginning of year |
234 | 504 | ||||||
|
|
|
|
|
|||||
| Cash and cash equivalents at end of year |
$ | 148 | $ | 234 | ||||
|
|
|
|
|
|||||
Supplemental disclosure of cash flow information:
Reorganization costs paid: $1,424.
See accompanying notes.
F-107
Table of Contents
MONTREAL, MAINE & ATLANTIC RAILWAY, LTD.
(Under Creditor Protection Proceedings as of August 7, 2013)
Notes to Combined Financial Statements
December 31, 2013 and 2012
| 1. | Organization and Creditor Protection Proceedings |
Description of Business
Montreal, Maine & Atlantic Railway, Ltd. is a privately held Delaware corporation formed in 2002 for the purpose of acquiring the assets from the bankruptcy estate of Bangor & Aroostook Railroad Debtor in 2003. Montreal, Maine & Atlantic Railway, Ltd. and its wholly owned Canadian subsidiary, Montreal, Maine & Atlantic Canada Co. (collectively, MMA, Company, or we), operate an integrated, international short-line freight railroad system consisting of 510 route miles of track in Maine, Vermont and Quebec. Approximately 40.0% and 37.0% of the Company’s revenue in 2013 and 2012, respectively, was earned from one customer for freight transportation and switching services.
These combined financial statements were prepared on a stand-alone basis derived from the financial statements and accounting records of the Company and its parent, Montreal, Maine & Atlantic Corporation (Parent), and reflect the combined historical financial position, results of operations, and cash flows of the Company’s businesses in accordance with U.S. generally accepted accounting principles (GAAP). Certain costs that were incurred centrally by Parent for functions such as administrative services have been allocated to the Company and included in the combined financial statements. We believe the assumptions underlying such allocations were made on a reasonable basis.
The Company was previously consolidated under Montreal, Maine & Atlantic Corporation. On August 7, 2013 (the Petition Date), Montreal, Maine & Atlantic Railway, Ltd. filed a petition for relief under Chapter 11 of the United States Bankruptcy Code in the United States Bankruptcy Court for the District of Maine (the Bankruptcy Court) and on the same date, Montreal, Maine & Atlantic Canada Co. commenced a proceeding in the Superior Court of the Province of Quebec, District of Montreal (the Quebec Court) pursuant to the Canadian Companies’ Creditor Arrangement Act. On August 21, 2013, Robert J. Keach was appointed as Chapter 11 trustee in the U.S. proceedings (the Trustee) and was authorized to operate the Montreal, Maine & Atlantic Railway, Ltd business. Richter Advisory Group, Inc. acts as the court-appointed monitor (the Monitor) in the Canadian Proceeding. In accordance with Financial Accounting Standards Board Accounting Standards Codification (ASC), Topic 810, Consolidations (ASC 810), the Montreal, Maine & Atlantic Corporation deconsolidated Montreal, Maine & Atlantic Railway, Ltd. due to the loss of control to the Trustee.
The combined financial statements of MMA include the following organizations:
| • | Montreal, Maine & Atlantic Railway, Ltd. |
| • | Montreal, Maine & Atlantic Canada Co. |
Creditor Protection Proceedings
On July 6, 2013, a train belonging to MMA, with 72 tank cars carrying combustible petroleum products derailed in the small Quebec town of Lac-Mégantic, which set off several massive explosions causing millions of dollars of environmental and property damage and is presumed to have killed 47 people (the Derailment). The track was closed, the Company’s revenues plummeted, and lawsuits were filed against the Company, its affiliates and other firms alleged to have caused the disaster, leading Montreal, Maine &
F-108
Table of Contents
MONTREAL, MAINE & ATLANTIC RAILWAY, LTD.
(Under Creditor Protection Proceedings as of August 7, 2013)
Notes to Combined Financial Statements
December 31, 2013 and 2012
| 1. | Organization and Creditor Protection Proceedings (Continued) |
Atlantic Railway, Ltd. and Montreal, Maine & Atlantic Canada Co. (collectively the Debtors) to file for creditor protection under the relevant jurisdictions of the U.S. and Canada (collectively Creditor Protection Proceedings) on the Petition Date. The jurisdictions adopted a protocol to (i) harmonize and coordinate the activities of the courts, (ii) promote the orderly and efficient administration of the cases to reduce the costs associated and avoid duplication of effort, and (iii) facilitate the fair, open and efficient administration of the proceedings for the benefit of the Debtors’ creditors and other interested parties.
As a consequence of the Creditor Protection Proceedings, substantially all prepetition litigation and claims against the Debtors have been stayed. Accordingly, no party may take any action to collect prepetition claims or to pursue litigation arising as a result of prepetition acts or omissions except pursuant to an order of the Bankruptcy Court.
First Day Motions
On August 9, 2013, the Bankruptcy Court approved the Debtors’ “first day” motions which included, amongst others, i) use of cash collateral, ii) payment of prepetition employee obligations, iii) utility relief and iv) authorizing to continue business operations with the appointment of a Chapter 11 Trustee. Specifically, the first day motions allowed the Company to preserve the business as a going concern. The cash collateral allowed the Debtors to meet its payroll obligations to employees whose services benefitted the line of credit lender, Wheeling & Lake Erie Railway Company, which has a security interest in the accounts receivable and inventory.
Post-Petition Financing
On October 21, 2013, the Bankruptcy Court granted the Debtors approval to obtain post-petition financing. The Debtors entered a $3.0 million revolving line of credit for working capital needs. The loan is secured by a first mortgage and security interest on all assets, located in the United States, that secure the debt administered by the Federal Railroad Administration. Refer to Note 6 – Debt for further information.
Claims Process
The Bankruptcy Court established June 13, 2014 as the deadline for filing proofs of claim against the Debtors (the Bar Date) for claims other than wrongful death claims. Wrongful death claims have a bar date of July 14, 2014. Under the Bankruptcy Code, claims of wrongful death and personal injury victims are provided a special priority at the same level as administrative expenses of the estate. The majority of the proofs of claim have been asserted in “unliquidated” amounts or contain an unliquidated component that are treated as being asserted in “unliquidated” amounts. See Note 13 – Legal Proceedings and Contingencies for a discussion of the proofs of claim against the Debtors.
The Trustee and the Monitor are in the process of evaluating the amounts asserted in and the factual and legal basis of the proofs of claim filed against the Debtors. Because of the substantial number of claims, as to which the review and analysis is ongoing, there is no assurance as to the ultimate value of claims that will be allowed in the Creditor Protection Proceedings. The differences between amounts recorded by the
F-109
Table of Contents
MONTREAL, MAINE & ATLANTIC RAILWAY, LTD.
(Under Creditor Protection Proceedings as of August 7, 2013)
Notes to Combined Financial Statements
December 31, 2013 and 2012
| 1. | Organization and Creditor Protection Proceedings (Continued) |
Debtors and proofs of claims filed by the creditors will continue to be investigated and resolved through the claims reconciliation and negotiation process.
As the Company completes the process of evaluating and resolving the proofs of claim, appropriate adjustments to the Company’s Combined Financial Statements will be made.
Sale of Assets
The Trustee and the Monitor, in consultation with the primary secured lender of both Debtors, determined that investigation of a sale of the Debtors’ assets, on a going concern basis, was in the best interest of the creditors. The Trustee and the Monitor anticipated an expedited sale process substantially as follows: (a) identify and obtain expressions of interest from potential bidders by October 31, 2013; (b) identify the initial bid which establishes the floor, also known as the “stalking horse bidder” and obtain approval of bid and cure procedures by December 18, 2013; (c) conduct an auction on or before January 21, 2014; and (d) have a sale hearing on or before January 23, 2014.
Multiple parties submitted initial bids for the assets of the Debtors. The stalking horse bidder was identified as Railroad Acquisition Holdings LLC (the Stalking Horse). Under the stalking horse asset purchase agreement (the Stalking Horse APA) the Stalking Horse proposed to purchase substantially all of the assets of the Debtors and assume certain contracts and leases for a purchase price of $14.3 million. On January 21, 2014, the Trustee performed the asset auction and the Stalking Horse was the winning bidder. On January 23, 2014, the Superior Court for the Province of Quebec entered the approval and vesting order and on January 24, 2014, the Bankruptcy Court entered an order (the Sale Order) approving the sale to the Stalking Horse. Refer to Note 14 – Subsequent Events for further information on the sale.
Basis of Presentation
These financial statements are presented as if the businesses of the Company had been combined for all periods presented and are presented with consideration that the Company will continue as a going concern. All inter-company transactions and accounts within MMA have been eliminated in combination.
The matters discussed in notes 1, 13 and 14 raise substantial doubt about the Company’s ability to continue as a going concern. Actions and events that have occurred since the derailment and subsequent to December 31, 2013 related to these matters are also discussed in the notes that follow, including notes 1, 13 and 14. The Company has not recorded any adjustments that might be required as a result of these matters other than the adjustments to record an impairment loss on long-lived assets.
The combined financial statements have been prepared in accordance with Accounting Standards Codification (ASC) 852, Reorganizations (ASC 852). ASC 852 requires the Company to distinguish transactions and events that are directly associated with the reorganization in connection with the Creditor Protection Proceedings from the ongoing operations of the business. Expenses incurred and settlement impacts due to the Creditor Protection Proceedings are reported separately as reorganization items, net on the combined statements of operations. Interest expense related to prepetition indebtedness has been
F-110
Table of Contents
MONTREAL, MAINE & ATLANTIC RAILWAY, LTD.
(Under Creditor Protection Proceedings as of August 7, 2013)
Notes to Combined Financial Statements
December 31, 2013 and 2012
| 1. | Organization and Creditor Protection Proceedings (Continued) |
reported only to the extent that it will be paid during the pendency of the Creditor Protection Proceedings or is permitted by Bankruptcy Court approval or is expected to be an allowed claim. The prepetition liabilities subject to compromise are disclosed separately on the combined balance sheet and are recorded at the estimated amount of services provided and/or goods received prepetition. The Company has not yet estimated the amount of allowed claims.
Adjustments may also result from actions of the Bankruptcy Court, settlement negotiations, rejection of executory contracts and real property leases, determination as to the value of any collateral securing claims and other events. Any such adjustments could be material to the Company’s results of operations and financial condition in any given period. For additional information on liabilities subject to compromise, see Note 3 – Liabilities Subject to Compromise and Reorganization Items, Net.
| 2. | Summary of Significant Accounting Policies |
Principles of Combination
The combined financial statements include certain assets and liabilities that have historically been held at the Parent’s corporate level, but are specifically identifiable or otherwise attributable to MMA. All significant intercompany transactions between Parent and MMA have been included within parent company investment in these combined financial statements.
Cash and Cash Equivalents
Cash equivalents include all highly liquid investments with maturities of three months or less from the date of acquisition and are stated at cost, which approximates market value.
Restricted Cash
Restricted cash at December 31, 2013 primarily consists of $3.8 million of proceeds from a business interruption insurance policy and $0.7 million escrow account held in accounts controlled by the Trustee and the Monitor for payments related to the reorganization. There was no restricted cash at December 31, 2012.
Accounts Receivable
Accounts receivable are recorded at the invoiced amount and do not bear interest. The allowance for doubtful accounts is the Company’s best estimate of the amount of probable credit losses in the Company’s existing accounts receivable. The Company determines the allowance through analysis of specific customer balances. Accounts that are determined to be uncollectible are written off against the allowance for doubtful accounts. Trade accounts receivable are presented net of an allowance for doubtful accounts of $1.6 million and $0.2 million at December 31, 2013 and 2012, respectively. Related party receivable is with Logistics Management Systems Acquisition Corporation, a subsidiary of the Parent and is presented net of an allowance for doubtful accounts of $3.3 million and $0 at December 31, 2013 and 2012, respectively.
F-111
Table of Contents
MONTREAL, MAINE & ATLANTIC RAILWAY, LTD.
(Under Creditor Protection Proceedings as of August 7, 2013)
Notes to Combined Financial Statements
December 31, 2013 and 2012
| 2. | Summary of Significant Accounting Policies (Continued) |
Materials and Supplies
Materials and supplies consist primarily of fuel, repair and replacement parts and material, which are stated at the lower of cost or market. Under the lower of cost or market, market value is defined as the current replacement cost and cost is determined by using an average cost.
Property and Equipment
Road property and equipment are stated at cost net of accumulated depreciation. Road property and equipment are depreciated on a group basis using the straight-line method over the estimated useful life of 5 to 42 years for machinery and equipment, 40 to 60 years for trackage and 14 years for buildings and improvements. See Note 5 – Property and Equipment for additional information.
Asset Impairment
The Company accounts for long-lived assets in accordance with the provisions of ASC 360, Property, Plant and Equipment (ASC 360). Management assesses the recoverability of our long-lived assets, including property, plant and equipment and definite lived intangible assets, whenever events or changes in business circumstances indicate the carrying amount of the assets, or related group of assets, may not be fully recoverable. Factors leading to impairment include significant under-performance relative to historical or projected results, significant changes in the manner of use of the acquired assets or the strategy for our overall business and significant negative industry or economic trends. The assessment of recoverability is based on management’s estimates by comparing the sum of the estimated undiscounted cash flows generated by the underlying asset, or other appropriate grouping of assets, to its carrying value to determine whether an impairment existed at its lowest level of identifiable cash flows. If the carrying amount of the asset is greater than the expected undiscounted cash flows to be generated by such asset, an impairment is recognized to the extent the carrying value of such asset exceeds its fair value. Considerable management judgment is necessary to estimate the fair value of assets; accordingly, actual results could vary significantly from such estimates.
The Derailment was considered a triggering event to assess the recoverability of our long-lived assets. As a result, impairment charges related to long-lived assets were approximately $30.3 million, net of deferred credits of $7.1 million, for the year ended December 31, 2013. Management determined there was no impairment during 2012. See Note 5 – Property and Equipment for additional information.
Deferred Credits
The Company receives reimbursements from state and provincial governments for portions of capital expenditures for improvements in track and other infrastructure. Based on the available accounting guidance for government grants, these reimbursements are accounted for as deferred credits that are amortized to income at amounts identical to the depreciation of the associated capital items so reimbursed.
F-112
Table of Contents
MONTREAL, MAINE & ATLANTIC RAILWAY, LTD.
(Under Creditor Protection Proceedings as of August 7, 2013)
Notes to Combined Financial Statements
December 31, 2013 and 2012
| 2. | Summary of Significant Accounting Policies (Continued) |
The deferred credits as of the Derailment were written-off in conjunction with the impairment of the long-lived assets as the corresponding assets were written-down. The Company had total unamortized deferred credits of approximately $7.8 million as of December 31, 2012.
For the years ended December 31, 2013 and December 31, 2012, $0.6 million and $1.4 million of deferred credits were amortized to operations and reported in track maintenance expense reimbursement.
Revenue Recognition
We recognize freight revenues as freight moves from origin to destination. The allocation of revenue between reporting periods is based on the relative transit time in each reporting period with expenses recognized as incurred. Other revenues are recognized as service is performed or contractual obligations are met.
Fair Value of Financial Instruments
The carrying value of the Company’s cash equivalents, accounts receivable, accounts payable, and accrued expenses approximate fair value due to the short maturity of these instruments. An estimate of the fair value of the Company’s debt is disclosed in Note 6 – Debt and Other Obligations.
Foreign Currency Translation
Assets and liabilities of the Company’s Canadian operations have been translated to U.S. dollars at the exchange rate on the balance sheet date and income statement amounts have been translated at the average exchange rate during the period. The functional currency of the Company’s Canadian subsidiary is the Canadian dollar. Translation adjustments to inter-company balances that are not considered permanent in nature are recognized in earnings as foreign currency gains or losses. The Company recognized a minimal gain on foreign currency translation of its inter-company balance as of December 31, 2012. The remaining net translation adjustment is reflected as a component of stockholders’ equity.
Income Taxes
The Company accounts for income taxes in accordance with ASC 740, Income Taxes, (ASC 740). ASC 740 requires an asset and liability approach for financial accounting and reporting for income taxes. Deferred tax assets and liabilities are recognized for the future tax consequences attributable to (a) differences between the financial statement carrying amounts of existing assets and liabilities and their respective tax bases and (b) operating loss carryforwards. Deferred tax assets and liabilities are measured using enacted tax rates expected to apply to taxable income in the years in which those temporary differences are expected to be recovered or settled. The effect on deferred tax assets and liabilities of a change in tax rates is recognized as income in the period that includes the enactment date.
The Company files consolidated tax returns with its Parent. Income taxes have been calculated as if the Company filed separate tax returns and operates as a stand-alone business.
F-113
Table of Contents
MONTREAL, MAINE & ATLANTIC RAILWAY, LTD.
(Under Creditor Protection Proceedings as of August 7, 2013)
Notes to Combined Financial Statements
December 31, 2013 and 2012
| 2. | Summary of Significant Accounting Policies (Continued) |
Assets and liabilities are established for uncertain tax positions taken or positions expected to be taken in income tax returns when such positions are judged to not meet the “more-likely-than-not” threshold, based upon the technical merits of the position. Estimated interest and penalties, if applicable, related to uncertain tax positions are included as a component of income tax expense. Management has determined that the Company has not taken, nor does it expect to take, any uncertain tax positions in any income tax return. Generally, tax returns for prior years are open for examination and subject to adjustment by all taxing authorities in all jurisdictions as the Company has reported net operating losses in each tax year. See Note 7 – Income Taxes for additional information.
Personal Injury and Casualty Claims
The Company has a $50.0 million insurance policy per period for personal injury and other liability and casualty claims which it retains $0.3 million per occurrence and is capped at $25.0 million per incident. For each claim, the Company records its best estimate of the ultimate costs that will be incurred, including estimates of incurred but not reported costs, within accrued liabilities on the combined balance sheet. Changes in estimates with respect to these claims are reported in the period in which such changes occur. Included in accrued wages is an estimate for employee medical expenses of $0.6 million and $0.1 million at December 31, 2013 and 2012, respectively.
Nonoperating Income
The Company records miscellaneous nonoperating transactions within the nonoperating income line item in the combined statement of operations. For the year ended December 31, 2013, the balance primarily represents $3.9 million of income recognized from the collection of business interruption insurance held in accounts controlled by the Trustee and the Monitor.
Environmental Expenditures
Environmental expenditures that relate to current operations are expensed or capitalized as appropriate. Expenditures that relate to an existing condition caused by past operations, which do not contribute to current or future revenue generation, are expensed. Liabilities are recorded when environmental assessments and/or remedial efforts are probable, and the costs can be reasonably estimated. See note 13 – Legal Proceedings and Contingencies.
Use of Estimates
The preparation of financial statements in conformity with GAAP requires management to make estimates and assumptions that affect the reported amounts of assets and liabilities and disclosure of contingent assets and liabilities at the date of the financial statements, and reported amounts of revenues and expenses during the reporting period. Actual results could differ from those estimates.
ASC 450, Contingencies (ASC 450) governs the disclosure and recognition of loss contingencies, including pending claims, lawsuits, disputes with third parties, investigations and other actions that are incidental to
F-114
Table of Contents
MONTREAL, MAINE & ATLANTIC RAILWAY, LTD.
(Under Creditor Protection Proceedings as of August 7, 2013)
Notes to Combined Financial Statements
December 31, 2013 and 2012
| 2. | Summary of Significant Accounting Policies (Continued) |
the operation of the business. ASC 450 contains certain requirements with respect to how the Company accrues for and discloses information concerning loss contingencies. We accrue for a loss contingency when we conclude that the likelihood of a loss is probable and the amount of the loss can be reasonably estimated. When the reasonable estimate of the loss is within a range of amounts, and no amount in the range constitutes a better estimate than any other amount, we accrue for the amount at the low end of the range. We adjust our accruals from time to time as we receive additional information, but the loss we incur may be significantly greater than or less than the amount we have accrued. We disclose loss contingencies if there is at least a reasonable possibility that a loss has been incurred. No accrual or disclosure is required for losses that are remote.
Liabilities Subject to Compromise
As a consequence of the Creditor Protection Proceedings, substantially all claims and litigations against the Debtors in existence prior to the filing of the petitions for relief or relating to acts or omissions prior to the filing of the petitions for relief are stayed. The Debtor’s estimate of known or potential prepetition liabilities that are estimable and probable of resulting in an allowed claim against the Debtors in connection with the Creditor Protection Proceedings are reflected in the combined balance sheet as liabilities subject to compromise as of December 31, 2013. The estimated amount of the allowed claim which may be different from the amount for which the liability will be settled. Such claims remain subject to future adjustments. Adjustments may result from (i) negotiations, (ii) actions of the Bankruptcy Court, (iii) further developments with respect to disputed claims, (iv) rejection of executory contracts and unexpired leases, (v) proofs of claim (vi) effect of any legislation which may be enacted or (vii) other events.
| 3. | Liabilities Subject to Compromise and Reorganization Items, Net |
The amounts shown below for liabilities subject to compromise reflect the Debtors’ prepetition estimate of liabilities which are reasonable and able to be estimated. Certain claims, including but not limited to wrongful death, personal injury, and environmental claims, are not presently ascertainable. While the Debtors maintained liability insurance, this will only cover a small fraction of the injury and damage caused by the Derailment. These claims are the subject of significant legal proceedings and negotiation in the Creditor Protection Proceedings. See Note 13 – Legal Proceedings and Contingencies for additional information on the background of the litigation, developments in the Debtors proceeding and estimated cost.
| December 31 2013 |
||||
| Railroad Rehabilitation and Improvement Financing Program (RRIF) |
$ | 27,189 | ||
| Notes payable to the State of Maine under Local Rail Freight Assistance Program |
450 | |||
| Wheeling & Erie Line of Credit |
5,433 | |||
| Capital lease obligation – engineering equipment |
7 | |||
| Capital lease obligation – locomotives |
426 | |||
|
|
|
|||
| Total debt subject to compromise |
33,505 | |||
F-115
Table of Contents
MONTREAL, MAINE & ATLANTIC RAILWAY, LTD.
(Under Creditor Protection Proceedings as of August 7, 2013)
Notes to Combined Financial Statements
December 31, 2013 and 2012
| 3. | Liabilities Subject to Compromise and Reorganization Items, Net (Continued) |
| December 31 2013 |
||||
| Accounts payable |
8,681 | |||
| Accrued interest payable |
452 | |||
| Liabilities – related party |
1,176 | |||
| Other miscellaneous liabilities |
890 | |||
|
|
|
|||
| Total liabilities subject to compromise |
$ | 44,704 | ||
|
|
|
|||
Reorganization Items, Net
In accordance with ASC 852, reorganization items are presented separately in the combined statements of operations on a net basis and represent items realized or incurred by the Company as a direct result of the Creditor Protection Proceedings.
The reorganization items, net recorded in the combined statements of operations consist of the following:
| Year Ended December 31, 2013 |
||||
| Professional fees |
$ | 5,888 | ||
| Write-off of deferred financing costs |
130 | |||
|
|
|
|||
| Total reorganization items, net |
$ | 6,018 | ||
|
|
|
|||
For year ended December 31, 2013, the Company paid approximately $1.4 million for reorganization items.
| 4. | Sale of Assets |
On June 10, 2013, the Company closed a purchase deal with a third party selling approximately 28 miles of rail line extending from Madawaska, Maine to Van Buren, Maine. The purchase price was $3.0 million minus assumption of the Local Freight Rail Assistance Loan with the State of Maine in an amount of $0.3 million. The sale resulted in a realized gain of $1.0 million as of December 31, 2013. The proceeds of the sale were used in full to pay back principal and interest for the long-term debt described in Note 6 – Debt and Other Obligations of these financial statements.
F-116
Table of Contents
MONTREAL, MAINE & ATLANTIC RAILWAY, LTD.
(Under Creditor Protection Proceedings as of August 7, 2013)
Notes to Combined Financial Statements
December 31, 2013 and 2012
| 5. | Property and Equipment |
Property and equipment consists of the following:
| Life in Years(a) |
2013 | 2012 | ||||||||
| Land and improvements |
$ | 5,516 | $ | 12,259 | ||||||
| Buildings |
4 | 155 | 5,055 | |||||||
| Trackage |
2 –5 | 6,200 | 46,889 | |||||||
| Machinery and equipment |
2 –6 | 6,722 | 10,896 | |||||||
|
|
|
|
|
|||||||
| 18,593 | 75,099 | |||||||||
| Less accumulated depreciation |
(1,838 | ) | (16,235 | ) | ||||||
|
|
|
|
|
|||||||
| Property and equipment – net |
16,755 | 58,864 | ||||||||
| Construction in progress |
305 | 596 | ||||||||
|
|
|
|
|
|||||||
| Total |
$ | 17,060 | $ | 59,460 | ||||||
|
|
|
|
|
|||||||
| (a) | Useful lives were adjusted based on physical deterioration, estimated economic useful life and age of the assets due to the impairment. |
As previously disclosed, the Company experienced deteriorated financial performance resulting from the Derailment. The Derailment occurred at Lac-Mégantic Canadian province of Quebec, the center of the Company’s main track. With the main service line inoperable, Management determined the Derailment was an indicator for potential impairment. Management assessed the recoverability of the long-lived assets by comparing the sum of the estimated undiscounted cash flows generated by the underlying asset, or other appropriate grouping of assets, to its carrying value to determine whether an impairment existed at its lowest level of identifiable cash flows.
The estimated cash flows were determined to be the pending purchase price of the property and equipment assets through the auction process. The Company allocated the purchase price based on the fair value of the underlying assets. The Company obtained third party independent appraisals to assist in the determination of the fair values of property and equipment. The property and equipment appraisal included an analysis of recent comparable sales and offerings of land parcels in each of the subject’s markets. The appraised value is supported with consideration and use of standard accepted appraisal practices and valuation procedures including:
| • | Cost approach—used for equipment where an active secondary market is not available and building improvements. |
| • | Direct sales comparison (market) approach—used for land and equipment where an active secondary market is available. |
These approaches used are based on the cost to reproduce assets, market exchanges for comparable assets and the capitalization of income.
F-117
Table of Contents
MONTREAL, MAINE & ATLANTIC RAILWAY, LTD.
(Under Creditor Protection Proceedings as of August 7, 2013)
Notes to Combined Financial Statements
December 31, 2013 and 2012
| 5. | Property and Equipment (Continued) |
Management also adjusted the remaining useful lives of the assets based on physical deterioration and estimated economic useful life and age of the assets.
For the year ended December 31, 2013, the Company recorded asset impairment charges of $30.3 million, net of deferred credits of $7.1 million, related to the Derailment.
Depreciation expense was $2,903 and $1,961 for the years ended December 31, 2013 and 2012.
| 6. | Debt and Other Obligations |
The Company’s debt is comprised of the following:
| 2013 | 2012 | |||||||
| Railroad Rehabilitation and Improvement Financing Program (RRIF) (a) |
$ | 27,189 | $ | 29,680 | ||||
| Notes payable to the State of Maine under Local Rail Freight Assistance Program (a) |
450 | 818 | ||||||
| Wheeling & Erie Line of Credit (a) |
5,433 | 6,000 | ||||||
| Camden Line of Credit |
2,042 | — | ||||||
| Capital lease obligation – engineering equipment (a) |
7 | 38 | ||||||
| Capital lease obligation – locomotives (a) |
426 | 463 | ||||||
|
|
|
|
|
|||||
| Total debt and leases |
35,547 | 36,999 | ||||||
| Less current portion |
(2,042 | ) | (36,006 | ) | ||||
| Liabilities subject to compromise, debt |
(33,505 | ) | — | |||||
|
|
|
|
|
|||||
| Total long-term debt and leases |
$ | — | $ | 993 | ||||
|
|
|
|
|
|||||
| (a) | Outstanding balance is classified as liabilities subject to compromise on the combined balance sheet at December 31, 2013. |
Post-Petition Financing
On October 21, 2013, the Bankruptcy Court granted the Debtors approval to obtain post-petition financing. The Debtors entered a $3.0 million revolving line of credit for working capital needs. The revolving line of credit is secured by a first mortgage and security interest on all assets, located in the United States, that secure the debt administered by the Federal Railroad Administration. The revolving line of credit bears interest of 5.0% with a maturity date of August 30, 2014. In February 2014, the revolving line of credit was increased to $4.8 million. As of March 31, 2014, the Company had drawn approximately $3.8 million of the revolver. The revolver was paid in full on May 15, 2014 with the proceeds from the sale of the Company’s US assets.
F-118
Table of Contents
MONTREAL, MAINE & ATLANTIC RAILWAY, LTD.
(Under Creditor Protection Proceedings as of August 7, 2013)
Notes to Combined Financial Statements
December 31, 2013 and 2012
| 6. | Debt and Other Obligations (Continued) |
Prepetition Debt
The Chapter 11 filing constituted an event of default under, or otherwise triggered repayment obligations with respect to, several of the debt instruments and agreements relating to direct and indirect financial obligations of the Debtors (collectively Prepetition Debt). All obligations under the Prepetition Debt have become automatically and immediately due and payable. The Debtors believe that any efforts to enforce the payment obligations under the Prepetition Debt have been stayed as a result of the Creditor Protection Proceedings. Accordingly, interest accruals and payments for the under secured Prepetition Debt have ceased as of the petition date.
The Company has a $6.0 million line of credit agreement with a related party with an interest rate of prime plus 2% (5.25% as of December 31, 2013) which expired on June 15, 2013. The Wheeling & Erie Line of Credit was used as part of the Debtors cash collateral and the Debtors provided adequate protection for the post-petition use by the Debtors of the cash collateral until October 18, 2013, prior to entering into the post-petition financing. Thereafter, the Debtors paid Wheeling & Erie the proceeds from the collection of accounts receivable and the usage of inventory related to the period prior to October 18, 2013. The balance remaining was classified as liabilities subject to compromise. The Company had an outstanding balance of $5.4 million and $6.0 million as of December 31, 2013 and 2012, respectively.
On March 24, 2005, Montreal, Maine & Atlantic Railway, Ltd. entered into a $34.0 million Direct Loan Financing Agreement under the Railroad Rehabilitation and Improvement Financing Program (RRIF). The program is administered by the Federal Railroad Administration (FRA), United States Department of Transportation. The agreement provides for a commitment to lend for approved projects, evidenced by notes bearing interest at 4.81%, amortizing in equal quarterly payments of principal and interest over twenty-five years. The notes are secured by a first security interest in track and real estate located in the United States. There were no new borrowings under this agreement during 2013 or 2012. The outstanding balance on the RRIF loans of approximately $27.2 million is classified as liabilities subject to compromise.
On April 21, 2009, the Company entered into a $0.8 million loan with the State of Maine in order to provide for infrastructure improvements to the branch lines under the local rail freight assistance program (LRFAP). The agreement was interest free with twenty equal semiannual installments of $37,500 commencing on December 31, 2009. The outstanding balance of approximately $0.5 million is classified as liabilities subject to compromise.
On November 16, 2006, the Company borrowed $0.7 million under the LRFAP from the State of Maine. The agreement was interest free with twenty equal semiannual installments of $32,500 commencing June 30, 2007. The loan was paid off in 2013 with the proceeds from the sale of the Van Buren assets.
Cash paid for interest totaled $2.0 million and $1.5 million in 2013 and 2012, respectively.
In accordance with ASC 852, effective August 7, 2013, the Company ceased accruing interest expense on its Prepetition Debt classified as subject to compromise. The Company’s contractual interest not accrued or paid in 2013 was $0.7 million.
F-119
Table of Contents
MONTREAL, MAINE & ATLANTIC RAILWAY, LTD.
(Under Creditor Protection Proceedings as of August 7, 2013)
Notes to Combined Financial Statements
December 31, 2013 and 2012
| 6. | Debt and Other Obligations (Continued) |
Fair Value
The fair values of borrowings would generally approximate carrying values as interest rates are variable or otherwise approximate current rates for similar borrowings; however, borrowings that are subject to compromise will likely settle for amounts less than carrying value. While the fair value may approximate claim amounts, it cannot be determined at this time due to the ongoing bankruptcy proceedings.
| 7. | Income Taxes |
(Loss) income before income tax (benefit) expense was attributable to the following jurisdictions:
| For the Years Ended December 31 |
||||||||
| 2013 | 2012 | |||||||
| U.S. |
$ | (26,034 | ) | $ | 4,221 | |||
| Canada |
(16,662 | ) | (2,787 | ) | ||||
|
|
|
|
|
|||||
| (Loss) income before income tax (benefit) expense |
$ | (42,696 | ) | $ | 1,434 | |||
|
|
|
|
|
|||||
The Company has not reported income tax expense (benefit) as it has incurred a loss in 2013, used net operating losses to offset taxable income in 2012 and has provided a valuation allowance for the full amount of net deferred tax assets.
The tax effects of the significant temporary differences and net operating losses carried forward, which give rise to deferred tax assets and liabilities at December 31, 2013 and 2012 are as follows:
| 2013 | 2012 | |||||||
| Deferred tax assets attributed to: |
||||||||
| Net operating loss carryforward |
$ | 23,190 | $ | 21,810 | ||||
| Provision for doubtful accounts |
640 | 70 | ||||||
| Employee compensation accruals |
410 | 80 | ||||||
| Deferred grant revenue |
— | 3,100 | ||||||
| Property and equipment, principally due to depreciation and impairment |
6,690 | — | ||||||
| Restructuring costs |
2,230 | — | ||||||
| Track maintenance credit |
3,710 | 3,710 | ||||||
|
|
|
|
|
|||||
| Gross deferred income tax assets |
36,870 | 28,770 | ||||||
F-120
Table of Contents
MONTREAL, MAINE & ATLANTIC RAILWAY, LTD.
(Under Creditor Protection Proceedings as of August 7, 2013)
Notes to Combined Financial Statements
December 31, 2013 and 2012
| 7. | Income Taxes (Continued) |
| 2013 | 2012 | |||||||
| Deferred tax liabilities attributed to: |
||||||||
| Property and equipment, principally due to differences in depreciation |
— | 12,830 | ||||||
| Unrealized foreign currency gain |
540 | 30 | ||||||
| Prepaids and other |
20 | 540 | ||||||
|
|
|
|
|
|||||
| Gross deferred income tax liabilities |
560 | 13,400 | ||||||
|
|
|
|
|
|||||
| Net deferred tax asset |
36,310 | 15,370 | ||||||
| Valuation allowance |
(36,310 | ) | (15,370 | ) | ||||
|
|
|
|
|
|||||
| Net deferred taxes |
$ | — | $ | — | ||||
|
|
|
|
|
|||||
The Company has consolidated net operating losses of approximately $57.2 million in the aggregate for United States federal tax purposes, $60.5 for the State of Maine and approximately $19.9 million for Canadian jurisdictions as of December 31, 2013 that expire from 2023 through 2033. These net operating loss carryforwards are subject to review and possible adjustment by the Internal Revenue Service and Canadian taxing authorities. In the event of a change in ownership, net operating losses may be subject to limitations in accordance with the internal revenue code. Losses from Canadian operations are included in the consolidated U.S. income tax returns. Loss carryfowards cannot be used to offset both U.S. and Canadian taxable income in future years. Accordingly, the deferred tax asset for net operating losses has been determined using U.S. tax rates. In assessing the realization of deferred tax assets, management considers whether it is likely that some or all of the deferred tax assets will be realized. The ultimate realization of deferred tax assets is dependent upon the generation of future taxable income during the periods in which temporary differences become deductible and net operating losses can be applied to reduce taxable income. Management considered the scheduled reversal of deferred tax liabilities, projected future taxable income, and tax planning strategies in making this assessment.
Based upon its history of operating losses and the results of the current year, management has established a valuation allowance for the excess of deferred tax assets over deferred tax liabilities as of December 31, 2013 and 2012.
| 8. | Lease Commitments |
Prior to the filing for bankruptcy, the Company was obligated under noncancelable operating leases for rolling stock, vehicles, office equipment and real estate. The leases generally provided that the Company pay the cost of repairs, insurance and taxes. Rent expense under all operating leases was approximately $1.8 million and $2.5 million in 2013 and 2012, respectively. Also, prior to the Bankruptcy, the Company was obligated for automotive, locomotive and track maintenance machinery under capital lease agreements. The obligations totaled $0.5 million at December 31, 2012.
In connection with the Bankruptcy, the Company elected to reject certain lease agreements. After the Petition Date, the Company continued to lease locomotives from CIT on a per day basis. As the units were
F-121
Table of Contents
MONTREAL, MAINE & ATLANTIC RAILWAY, LTD.
(Under Creditor Protection Proceedings as of August 7, 2013)
Notes to Combined Financial Statements
December 31, 2013 and 2012
| 8. | Lease Commitments (Continued) |
rented on a “per day” basis, the Company was not obligated under any minimum future rental payments. Therefore, as of December 31, 2013, remaining noncancelable operating lease or capital lease obligations are classified as liabilities subject to compromise.
| 9. | Track Maintenance Expense Reimbursements |
The Company has an agreement to assign railroad track miles to an unrelated entity pursuant to Section 45G of the Internal Revenue Code. The Company is eligible for tax credit on qualifying track maintenance expenditures. As we are unable to fully utilize the tax credit, we sell the tax credit to a third party and use the proceeds of the sale to reduce operating expenses. The Company received $0.9 million and $0.8 million under this agreement in 2013 and 2012, respectively, which was allocated to track maintenance expenditures. The Company received additional reimbursement in 2012 from governmental and private entities of $2.2 million. The Company was entitled to receive an additional $2.0 million from governmental entities in 2013 but on the Petition Date, the receivable was deemed uncollectible as the governmental entities have claims in excess of the $2.0 million against the Company.
| 10. | Employees’ Pension and Retirement Plans |
The Montreal, Maine & Atlantic Corp. 401(k) Plan is open to all United States employees not subject to a collective bargaining agreement. Employees are eligible to participate after three months of creditable service. The Parent is the sponsor of the 401(k) Plan and provides matching contributions up to 100% of each dollar contributed by employees up to the first 1.5% percent of compensation contributed. The Company’s expense under the plan was approximately $38 and $42 for the years ended December 31, 2013 and 2012, respectively.
Canadian employees participate in a Registered Retirement Savings Plan (RRSP) and a Deferred Profit Sharing Plan (DPSP), comprising a defined contribution pension plan that is sponsored and maintained by the Company. Employees contribute 5% of wages to the RRSP, which is matched by the Company at 5% for employees represented by a collective bargaining agreement and at 10% for employees not so represented. The Company’s expense under the plan was approximately $199 and $175 for the years ended December 31, 2013 and 2012, respectively.
| 11. | Fair Values of Financial Instruments |
The Company measures and records in the accompanying combined financial statements certain assets and liabilities at fair value on a recurring basis. ASC 820, Fair Value Measurements (ASC 820) establishes a fair value hierarchy for those instruments measured at fair value that distinguishes between assumptions based on market data (observable inputs) and the Company’s own assumptions (unobservable inputs).
These inputs are prioritized as follows:
| • | Level 1: Observable inputs such as quoted prices in active markets for identical assets or liabilities. |
F-122
Table of Contents
MONTREAL, MAINE & ATLANTIC RAILWAY, LTD.
(Under Creditor Protection Proceedings as of August 7, 2013)
Notes to Combined Financial Statements
December 31, 2013 and 2012
| 11. | Fair Values of Financial Instruments (Continued) |
| • | Level 2: Inputs other than quoted prices included within Level 1 that are observable, either directly or indirectly, such as quoted prices for similar assets or liabilities or market corroborated inputs. |
| • | Level 3: Unobservable inputs for which there is little or no market data and which require the Company to develop their own assumptions about how market participants price the asset or liability. |
The valuation techniques that may be used to measure fair value are as follows:
| • | Market approach – Uses prices and other relevant information generated by market transactions involving identical or comparable assets or liabilities. |
| • | Income approach – Uses valuation techniques to convert future amounts to a single present amount based on current market expectation about those future amounts. |
| • | Cost approach – Based on the amount that currently would be required to replace the service capacity of an asset (replacement cost). |
The following table presents financial assets and liabilities measured or disclosed at fair value on a recurring basis for the periods presented:
| Fair Value Measurements at Reporting Date Using |
||||||||||||||||||||
| Quoted Prices in Active Markets for Identical (Level 1) |
Significant Other Observable Inputs (Level 2) |
Significant Unobservable Inputs (Level 3) |
Total Fair Value Measurements |
Valuation Technique |
||||||||||||||||
| As of December 31, 2013 |
||||||||||||||||||||
| Assets: |
||||||||||||||||||||
| Cash and cash equivalents |
$ | 148 | $ | — | $ | — | $ | 148 | Income | |||||||||||
| Restricted cash |
4,490 | — | — | 4,490 | Income | |||||||||||||||
| As of December 31, 2012 |
||||||||||||||||||||
| Assets: |
||||||||||||||||||||
| Cash and cash equivalents |
$ | 234 | $ | — | $ | — | $ | 234 | Income | |||||||||||
| Restricted cash |
— | — | — | — | Income | |||||||||||||||
Certain assets are measured at fair value on a nonrecurring basis; that is, the instruments are not measured at fair value on an ongoing basis but are subject to fair value adjustments only in certain circumstances (for example, when there is evidence of impairment). During the year ended December 31, 2013, the Company recorded an impairment charge in the amount of $30.3 million related to property and equipment. The Company used assessed values and current market data, Level 2 inputs, to determine fair value.
F-123
Table of Contents
MONTREAL, MAINE & ATLANTIC RAILWAY, LTD.
(Under Creditor Protection Proceedings as of August 7, 2013)
Notes to Combined Financial Statements
December 31, 2013 and 2012
| 11. | Fair Values of Financial Instruments (Continued) |
Refer to Note 6 – Debt and other Obligations, for the discussion on the fair value of the Company’s long-term debt.
| 12. | Related Party Transactions |
Rail World, Inc. (RWI) and Rail World Holdings, L.L.C. are controlled by Mr. Edward Burkhardt (E.A. Burkhardt), the Chairman of the Board of Directors of the Company. RWI is the General Partner of Earlston Associates, L.P., a major stockholder of the Company. RWI was retained to provide management services to the Company under a Management Agreement providing for fees of $0.2 million per year and reasonable expenses. On the Petition Date, the Company rejected the Management Agreement and the agreement was terminated. The management fee expense was $0.1 million and $0.2 million in 2013 and 2012, respectively.
Prior to the bankruptcy petition date, the Company leased locomotives from RWI for $150 per unit per day. Total expense for these locomotive rentals was $0.09 million and $0.04 million in 2013 and 2012, respectively. The Company also leased locomotives from RWI under the terms of a capital lease. Total payments under this agreement were approximately $0.05 million and $0.03 million in 2013 and 2012, respectively.
Accrued liabilities – related party at December 31, 2013 and 2012 are comprised of amounts payable to companies controlled by E.A. Burkhardt of $1.1 million and $3.5 million, respectively. The December 31, 2013 balance of $1.1 million is classified as liabilities subject to compromise.
Wheeling & Lake Erie Railway Company is controlled by Mr. Larry Parsons, a member of the Board of Directors and a stockholder of the Company through a WLER subsidiary and directly. WLER is the counterparty to the Company’s line of credit agreement, which is classified as liabilities subject to compromise as of December 31, 2013.
| 13. | Legal Proceedings and Contingencies |
Derailment and Related Creditor Protection Proceedings Litigation
The Debtors are involved in claims, litigation, administrative proceedings and investigations of various types in a number of jurisdictions. A number of such matters involve, or may involve, claims for a material amount of damages and relate to or allege wrongful death, personal injury, property damage, contribution, and/or indemnity claims, and environmental liabilities, among others. As a result of the Creditor Protection Proceedings, substantially all prepetition litigation and claims against the Debtors have been stayed.
The Company has not finished its assessment of valid claims; however, more than 5,000 claims in excess of $3.9 billion have been filed alleging wrongful death, personal injury, property damage and other claims related to the Derailment. Most of the lawsuits against the Debtors seek punitive damages for wrongful death and in some cases not resulting in death, or personal injury. The wrongful death claimants have the right to a jury trial to determine their claims, a process that could take years. Litigation asserting claims arising from the Derailment have been filed in several courts and most claims filed to date are “unliquidated” claims, which is a claim for which a specific value cannot be precisely determined or that it
F-124
Table of Contents
MONTREAL, MAINE & ATLANTIC RAILWAY, LTD.
(Under Creditor Protection Proceedings as of August 7, 2013)
Notes to Combined Financial Statements
December 31, 2013 and 2012
| 13. | Legal Proceedings and Contingencies (Continued) |
cannot be determined without an evidentiary hearing. In these cases, the Trustee and the Monitor will negotiate a settlement or adjudicate the claim in the Bankruptcy Court.
Wrongful Death Cases
The unofficial committee of wrongful death claimants consist of representatives of the estates of those killed in the Derailment. These claims may be asserted against any person or entity that had a hand in causing the Derailment. The plaintiffs in the wrongful death cases allege, among other things, that the Derailment resulted in a fire that killed 47 people.
The plaintiffs in the wrongful death cases seek an unspecified amount of damages. Some of the claims in the pending litigation may be entitled to priority pursuant to Chapter 11 Bankruptcy Code section 1171, Priority Claims.
The Quebec Class Action Litigation
On July 15, 2013, Yannick Gagné and Guy Ouellet (the Petitioners), served on the Debtors and other parties a motion to authorize the bringing of a class action and to ascribe the status of representative in the Superior Court of Quebec. The motion has been amended on four occasions, most recently on February 12, 2014. In the motion, the Petitioners request that they be attributed the status of representative of the proposed class and that the court authorize the bringing of a class action. The motion seeks damages on behalf of all members of the proposed class, but does not specifically detail the amount of damages claimed.
In addition, the motion also claims from the respondents an unspecified amount of punitive damages for each of the members of the class, plus interest and additional indemnity on the sums to be awarded as well as the costs of the class action, including expert and notice fees.
Clean-up Order Litigation
On July 29, 2013, the Quebec Minister of Sustainable Development, Environment, Wildlife and Parks issued an order under the authority of section 114.1 of the Quebec Environmental Quality Act which required the Debtors, along with third party co-defendants, to remediate and clean up the Lac-Mégantic Derailment site. The amount of the clean-up expenses related to the Derailment has not yet been determined.
Property Damage Claims
Persons who have suffered property damage as a consequence of the Derailment and who are not plaintiffs or members of the class in the class action litigation have filed claims against the Debtors and other defendants in either their personal capacity or through property insurers.
Co-defendant Claims
The co-defendants in the Creditor Protection Proceedings have filed claims against the Debtors, holding the Debtors responsible for the losses related to the Derailment due to their assertion of the chain of ownership.
F-125
Table of Contents
MONTREAL, MAINE & ATLANTIC RAILWAY, LTD.
(Under Creditor Protection Proceedings as of August 7, 2013)
Notes to Combined Financial Statements
December 31, 2013 and 2012
| 13. | Legal Proceedings and Contingencies (Continued) |
These claims include but are not limited to: (i) value of lost freight, (ii) all prospective losses with respect to the damaged or destroyed railcars, and (iii) other potential liabilities related to the Derailment. The asserted amounts of these co-defendant claims have not yet been determined.
Also, the Debtors may recover monies from co-defendants as part of the Debtors’ settlement. This recovery would be passed to the claimants against the Debtors’ estates.
Bar Date and Estimation
The amounts of the Debtors’ present and future liabilities arising from all claim disputes are the subject of significant dispute in Debtors’ Creditor Protection Proceedings. The Bankruptcy Court established June 13, 2014 as the Bar Date for claims other than the wrongful death claims. Wrongful death claims have a bar date of July 14, 2014. Under the Bankruptcy Code, claims of wrongful death and personal injury victims are provided a special priority at the same level as administrative expenses of the estate. Administrative expenses are the highest priority of unsecured claims in a Chapter 11. Under the Bankruptcy Code, other prepetition unsecured creditors are not entitled to a distribution until all wrongful death and personal injury claims have been paid. The amount of damages associated with these claims has not yet been determined, but will likely be significant.
The Debtors have $25.0 million of indemnity coverage but believe this will only cover a small fraction of all claims. At this stage in the proceedings, the Debtors do not have sufficient information to estimate the amount, or range of amounts of the claims related to wrongful death, personal injury, property damage, business interruption and environmental claims, among others. Such amounts are expected to be far in excess of the value of the Company’s assets and insurance coverage.
Other
Prior to the declaration of bankruptcy, Montreal, Maine & Atlantic Railway, Ltd. provided a guarantee on certain obligations of a former affiliate, Logistics Management Services (LMS), regarding a promissory note secured by a building owned by LMS. LMS’s obligation was further collateralized by a lien on 25 locomotives owned by Montreal, Maine & Atlantic Railway, Ltd. that were excluded from the sale to Railroad Acquisition Holdings LLC. Management considered that future claims against the guarantee would be contingent claims and that a liability, if any, cannot be estimated at this time. Therefore, no liability has been recorded as of December 31, 2013 and 2012.
| 14. | Subsequent Events |
These financial statements include a discussion of material events which have occurred subsequent to December 31, 2013 (referred to as subsequent events) through September 9, 2014, the issuance date of these combined financial statements. Events subsequent to that date have not been considered in these financial statements.
On December 12, 2013, the Trustee filed a motion with the Bankruptcy Court (the Sale Motion), pursuant to Section 363 of the Bankruptcy Code, concurrently with the Superior Court for the Province of Quebec,
F-126
Table of Contents
MONTREAL, MAINE & ATLANTIC RAILWAY, LTD.
(Under Creditor Protection Proceedings as of August 7, 2013)
Notes to Combined Financial Statements
December 31, 2013 and 2012
| 14. | Subsequent Events (Continued) |
pursuant to Canada’s Company Creditors Arrangement Act, seeking, among other things, the approval of an auction process and bidding procedures that would govern the sale of substantially all of the Debtors’ assets to the Stalking Horse or another bidder with the highest or otherwise best offer and approval of the sale of substantially all of the Debtors’ assets in accordance with the auction process and bidding procedures. On December 21, 2013, the Trustee and the Stalking Horse entered into the Stalking Horse Asset Purchase Agreement (the APA) for a purchase price of $14.3 million less certain assumed liabilities including accrued vacation and employee related obligations and environmental liabilities. The Stalking Horse provided a $0.8 million security deposit, at the agreement date to be allocated to the U.S. and Canada, $0.6 million and $0.2 million, respectively.
On January 23, 2014, the Superior Court for the Province of Quebec entered the approval and vesting order and on January 24, 2014, the Bankruptcy Court approved the sale. The APA provided for a closing date of the U.S. and Canadian assets upon certain conditions being met. As the conditions differed between the U.S. and Canada, the closing dates occurred on different dates. The U.S. and Canada portions of the sale were effectuated on May 15, 2014 and June 30, 2014, respectively.
The assets of Montreal, Maine and Atlantic Railway, Ltd. were sold on May 15, 2014 for a total purchase price of $11.1 million. The assets of Montreal Maine and Atlantic Canada Co were sold on June 30, 2014 for $3.2 million.
In April 2014, the promissory note holder submitted a proof of claim against Montreal, Maine & Atlantic Railway, Ltd. in the amount of $3.69 million based on its obligations under the LMS guarantee. Based on an interim settlement between Montreal, Maine & Atlantic Railway, Ltd. and the secured promissory note holder, the bankruptcy court granted a motion to remit the 25 locomotives to the promissory note holder who completed a sale via auction on August 5, 2014 for $1.09 million. In the event LMS is unable to perform under the terms of the debt through its operations, the note holder could force a liquidation of the building used to secure the promissory note. If the proceeds from the sale of the building results in an amount less than the amount currently owed under the promissory note, the note holder will retain up to $1.09 million as fulfillment of its secured deficiency claim and any remaining balance would be classified as an unsecured prepetition claim.
F-127
Table of Contents
MONTREAL, MAINE & ATLANTIC RAILWAY, LTD.
AND MONTREAL, MAINE & ATLANTIC CANADA CO.
(Under Creditor Protection Proceedings as of August 7, 2013)
Condensed Combined Balance Sheets
March 31, 2014 and December 31, 2013
(dollars in thousands)
| 2014 | 2013 | |||||||
| (Unaudited) | ||||||||
| Assets |
||||||||
| Current assets: |
||||||||
| Cash and temporary cash investments |
$ | 404 | $ | 148 | ||||
| Restricted cash |
4,409 | 4,490 | ||||||
| Accounts receivable |
2,832 | 2,903 | ||||||
| Material and supplies |
264 | 297 | ||||||
| Prepaid expenses and other |
274 | 50 | ||||||
|
|
|
|
|
|||||
| Total current assets |
8,183 | 7,888 | ||||||
| Property and equipment – net |
16,025 | 17,060 | ||||||
| Other long-term assets |
81 | 83 | ||||||
|
|
|
|
|
|||||
| Total assets |
$ | 24,289 | $ | 25,031 | ||||
|
|
|
|
|
|||||
| Liabilities and Shareholders’ Deficit |
||||||||
| Current liabilities: |
||||||||
| Post-petition financing line of credit |
$ | 3,826 | $ | 2,042 | ||||
| Accounts payable |
697 | 153 | ||||||
| Accrued liabilities: |
||||||||
| Wages and benefits |
1,164 | 1,218 | ||||||
| Restructuring and related charges |
6,247 | 4,457 | ||||||
| Other |
1,412 | 811 | ||||||
|
|
|
|
|
|||||
| Total current liabilities |
13,346 | 8,681 | ||||||
| Liabilities subject to compromise |
44,109 | 44,704 | ||||||
|
|
|
|
|
|||||
| Total liabilities |
57,455 | 53,385 | ||||||
| Commitments and contingencies (notes 12 and 13) |
||||||||
| Stockholders’ deficit: |
||||||||
| Parent investment |
40,140 | 40,147 | ||||||
| Accumulated other comprehensive income |
3,473 | 3,379 | ||||||
| Accumulated deficit |
(76,779 | ) | (71,880 | ) | ||||
|
|
|
|
|
|||||
| Total stockholders’ deficit |
(33,166 | ) | (28,354 | ) | ||||
|
|
|
|
|
|||||
| Total liabilities and stockholders’ deficit |
$ | 24,289 | $ | 25,031 | ||||
|
|
|
|
|
|||||
See accompanying notes.
F-128
Table of Contents
MONTREAL, MAINE & ATLANTIC RAILWAY, LTD.
AND MONTREAL, MAINE & ATLANTIC CANADA CO.
(Under Creditor Protection Proceedings as of August 7, 2013)
Unaudited Condensed Combined Statements of Operations and Comprehensive Loss
Three Months Ended March 31, 2014 and 2013
(dollars in thousands)
| 2014 | 2013 | |||||||
| Revenues: |
||||||||
| Freight transportation revenue |
$ | 2,764 | $ | 9,753 | ||||
| Switching and miscellaneous railroad revenue |
437 | 1,113 | ||||||
|
|
|
|
|
|||||
| Total revenues |
3,201 | 10,866 | ||||||
| Operating expenses: |
||||||||
| Payroll and related expenses |
2,471 | 3,744 | ||||||
| Materials and supplies expense |
331 | 806 | ||||||
| Locomotive diesel fuel expense |
920 | 3,357 | ||||||
| Freight car expense |
55 | 589 | ||||||
| Equipment lease expense |
25 | 341 | ||||||
| Outside services |
267 | 425 | ||||||
| General and administrative |
1,018 | 1,622 | ||||||
| Depreciation |
922 | 527 | ||||||
| Track maintenance expense reimbursement |
(51 | ) | (487 | ) | ||||
|
|
|
|
|
|||||
| Total operating expenses |
5,958 | 10,924 | ||||||
|
|
|
|
|
|||||
| Operating loss |
(2,757 | ) | (58 | ) | ||||
| Foreign currency loss |
(7 | ) | (5 | ) | ||||
| Nonoperating loss |
(12 | ) | (7 | ) | ||||
| Interest expense |
(37 | ) | (411 | ) | ||||
| Reorganization items, net |
(2,086 | ) | — | |||||
|
|
|
|
|
|||||
| Loss from operations |
(4,899 | ) | (481 | ) | ||||
| Income taxes |
— | — | ||||||
|
|
|
|
|
|||||
| Net loss from operations |
(4,899 | ) | (481 | ) | ||||
| Other comprehensive income: |
||||||||
| Currency translation adjustment |
94 | 71 | ||||||
|
|
|
|
|
|||||
| Comprehensive loss |
$ | (4,805 | ) | $ | (410 | ) | ||
|
|
|
|
|
|||||
See accompanying notes.
F-129
Table of Contents
MONTREAL, MAINE & ATLANTIC RAILWAY, LTD.
AND MONTREAL, MAINE & ATLANTIC CANADA CO.
(Under Creditor Protection Proceedings as of August 7, 2013)
Unaudited Condensed Combined Statements of Equity
Three Months Ended March 31, 2014 and 2013
(dollars in thousands)
| Parent Company Investment |
Accumulated Deficit |
Accumulated Other Comprehensive Income |
Total | |||||||||||||
| Balance, December 31, 2012 |
$ | 40,270 | $ | (29,184 | ) | $ | 3,761 | $ | 14,847 | |||||||
| Net income |
— | (481 | ) | — | (481 | ) | ||||||||||
| Comprehensive income |
— | — | 71 | 71 | ||||||||||||
| Net decrease in parent company investment |
(65 | ) | — | — | (65 | ) | ||||||||||
|
|
|
|
|
|
|
|
|
|||||||||
| Balance, March 31, 2013 |
$ | 40,205 | $ | (29,665 | ) | $ | 3,832 | $ | 14,372 | |||||||
|
|
|
|
|
|
|
|
|
|||||||||
| Balance, December 31, 2013 |
$ | 40,147 | $ | (71,880 | ) | $ | 3,379 | $ | (28,354 | ) | ||||||
| Net loss |
— | (4,899 | ) | — | (4,899 | ) | ||||||||||
| Comprehensive income |
— | — | 94 | 94 | ||||||||||||
| Net decrease in parent company investment |
(7 | ) | — | — | (7 | ) | ||||||||||
|
|
|
|
|
|
|
|
|
|||||||||
| Balance, March 31, 2014 |
$ | 40,140 | $ | (76,779 | ) | $ | 3,473 | $ | (33,166 | ) | ||||||
|
|
|
|
|
|
|
|
|
|||||||||
See accompanying notes.
F-130
Table of Contents
MONTREAL, MAINE & ATLANTIC RAILWAY, LTD.
AND MONTREAL, MAINE & ATLANTIC CANADA CO.
(Under Creditor Protection Proceedings as of August 7, 2013)
Unaudited Condensed Combined Statements of Cash Flows
Three Months Ended March 31, 2014 and 2013
(dollars in thousands)
| 2014 | 2013 | |||||||
| Cash flows from operating activities: |
||||||||
| Net loss |
$ | (4,899 | ) | $ | (481 | ) | ||
| Adjustments to reconcile net loss to net cash (used) provided by operating activities: |
||||||||
| Foreign currency loss |
7 | 5 | ||||||
| Depreciation |
922 | 527 | ||||||
| Reorganization items, net |
1,790 | — | ||||||
| Amortization of deferred credits |
— | (260 | ) | |||||
| Change in assets and liabilities: |
||||||||
| Accounts receivable |
71 | 290 | ||||||
| Material and supplies |
33 | (89 | ) | |||||
| Prepaid expenses and other |
(222 | ) | 18 | |||||
| Accounts payable |
530 | (846 | ) | |||||
| Accrued and other current liabilities |
547 | 1,116 | ||||||
| Income taxes payable |
— | (213 | ) | |||||
|
|
|
|
|
|||||
| Net cash (used) provided by operating activities |
(1,221 | ) | 67 | |||||
| Cash flows from investing activities: |
||||||||
| Acquisition of capital assets |
9 | 149 | ||||||
| Principal payments received on notes receivable |
— | 2 | ||||||
|
|
|
|
|
|||||
| Net cash provided by investing activities |
9 | 151 | ||||||
| Cash flows from financing activities: |
||||||||
| Repayment of long-term debt |
— | (353 | ) | |||||
| Payments on line of credit |
(595 | ) | (300 | ) | ||||
| Borrowings on post-petition financing |
1,784 | — | ||||||
| Net transfers to Parent and affiliates |
(7 | ) | (65 | ) | ||||
|
|
|
|
|
|||||
| Net cash provided (used) by financing activities |
1,182 | (718 | ) | |||||
| Effect of exchange rate changes on cash |
286 | 283 | ||||||
|
|
|
|
|
|||||
| Net increase (decrease) in cash |
256 | (217 | ) | |||||
| Cash and cash equivalents at beginning of year |
148 | 234 | ||||||
|
|
|
|
|
|||||
| Cash and cash equivalents at end of year |
$ | 404 | $ | 17 | ||||
|
|
|
|
|
|||||
| Supplemental disclosure of cash flow information: |
||||||||
| Cash paid during the period for interest |
$ | 37 | $ | 410 | ||||
| Reorganization items paid |
296 | — | ||||||
See accompanying notes.
F-131
Table of Contents
MONTREAL, MAINE & ATLANTIC RAILWAY, LTD.
AND MONTREAL, MAINE & ATLANTIC CANADA CO.
(Under Creditor Protection Proceedings as of August 7, 2013)
Notes to Unaudited Condensed Combined Financial Statements
March 31, 2014 and December 31, 2013
| 1. | Background and Creditor Protection Proceedings |
Montreal, Maine & Atlantic Railway, Ltd. is a privately held Delaware corporation formed in 2002 for the purpose of acquiring the assets from the bankruptcy estate of Bangor & Aroostook Railroad Debtor in 2003. Montreal, Maine & Atlantic Railway, Ltd. and its wholly owned Canadian subsidiary, Montreal, Maine & Atlantic Canada Co. (collectively, MMA, Company, or we), operate an integrated, international short-line freight railroad system consisting of 510 route miles of track in Maine, Vermont and Quebec.
On July 6, 2013, a train belonging to MMA, with 72 tank cars carrying combustible petroleum products derailed in the small Quebec town of Lac-Mégantic, which set off several massive explosions causing millions of dollars of environmental and property damage and is presumed to have killed 47 people (the Derailment).
The Company was previously consolidated under Montreal Maine & Atlantic Corporation. On August 7, 2013 (the Petition Date), Montreal Maine & Atlantic Railway, Ltd. filed a petition for relief under Chapter 11 of the United States Bankruptcy Code in the United States Bankruptcy Court for the District of Maine (the Bankruptcy Court) and on the same date, Montreal Maine & Atlantic Canada Co. commenced a proceeding in the Superior Court of the Province of Quebec, District of Montreal (the Quebec Court) pursuant to the Canadian Companies’ Creditor Arrangement Act. On August 21, 2013, Robert J. Keach was appointed as Chapter 11 trustee in the U.S. proceedings (the Trustee) and was authorized to operate the Montreal Maine & Atlantic Railway, Ltd. business. Richter Advisory Group, Inc. acts as the court-appointed monitor (the Monitor) in the Canadian Proceeding. In accordance with Financial Accounting Standards Board Accounting Standards Codification (ASC), Topic 810, Consolidations (ASC 810), the Montreal Maine & Atlantic Corporation deconsolidated Montreal Maine & Atlantic Railway, Ltd. due to the loss of control to the Trustee.
Creditor Protection Proceedings
On the Petition Date, Montreal Maine & Atlantic Railway, Ltd. and Montreal Maine & Atlantic Canada Co. (collectively the Debtors) filed for creditor protection under the relevant jurisdictions of the U.S. and Canada (collectively Creditor Protection Proceedings). The jurisdictions adopted a protocol to (i) harmonize and coordinate the activities of the courts, (ii) promote the orderly and efficient administration of the cases to reduce the costs associated and avoid duplication of effort, and (iii) facilitate the fair, open and efficient administration of the proceedings for the benefit of the Debtors’ creditors and other interested parties.
As a consequence of the Creditor Protection Proceedings, substantially all prepetition litigation and claims against the Debtors have been stayed. Accordingly, no party may take any action to collect prepetition claims or to pursue litigation arising as a result of prepetition acts or omissions except pursuant to an order of the Bankruptcy Court.
First Day Motions
On August 9, 2013, the Bankruptcy Court approved the Debtors’ “first day” motions which included, amongst others, i) use of cash collateral, ii) payment of prepetition employee obligations, iii) utility relief
F-132
Table of Contents
MONTREAL, MAINE & ATLANTIC RAILWAY, LTD.
AND MONTREAL, MAINE & ATLANTIC CANADA CO.
(Under Creditor Protection Proceedings as of August 7, 2013)
Notes to Unaudited Condensed Combined Financial Statements
March 31, 2014 and December 31, 2013
| 1. | Background and Creditor Protection Proceedings (Continued) |
and iv) authorizing to continue business operations with the appointment of a Chapter 11 Trustee. Specifically, the first day motions allowed the Company to preserve the business as a going concern. The cash collateral allowed the Debtors to meet its payroll obligations to employees whose services benefitted the line of credit lender, Wheeling & Lake Erie Railway Company (Wheeling & Erie), which has a security interest in the accounts receivable and inventory.
Post-Petition Financing
On October 21, 2013, the Bankruptcy Court granted the Debtors approval to obtain post-petition financing. The Debtors entered a $3.0 million revolving line of credit for working capital needs. The loan is secured by a first mortgage and security interest on all assets, located in the United States, that secure the debt administered by the Federal Railroad Administration. Refer to Note 5 – Debt and Other Obligations for further information.
Claims Process
The Bankruptcy Court established June 13, 2014 as the deadline for filing proofs of claim against the Debtors (the Bar Date) for claims other than wrongful death claims. Wrongful death claims have a bar date of July 14, 2014. Under the Bankruptcy Code, claims of wrongful death and personal injury victims are provided a special priority at the same level as administrative expenses of the estate. The majority of the proofs of claim have been asserted in “unliquidated” amounts or contain an unliquidated component that are treated as being asserted in “unliquidated” amounts. See Note 12 – Legal Proceedings and Contingencies for a discussion of the proofs of claim against the Debtors.
The Trustee and the Monitor are in the process of evaluating the amounts asserted in and the factual and legal basis of the proofs of claim filed against the Debtors. Because of the substantial number of claims, as to which the review and analysis is ongoing, there is no assurance as to the ultimate value of claims that will be allowed in the Creditor Protection Proceedings. The differences between amounts recorded by the Debtors and proofs of claims filed by the creditors will continue to be investigated and resolved through the claims reconciliation and negotiation process.
As the Company completes the process of evaluating and resolving the proofs of claim, appropriate adjustments to the Company’s Combined Financial Statements will be made.
Sale of Assets
The Trustee and the Monitor, in consultation with the primary secured lender of both Debtors, determined that investigation of a sale of the Debtors’ assets, on a going concern basis, was in the best interest of the creditors. The Trustee and the Monitor anticipated an expedited sale process substantially as follows: (a) identify and obtain expressions of interest from potential bidders by October 31, 2013; (b) identify the initial bid which establishes the floor, also known as the “stalking horse bidder” and obtain approval of bid and cure procedures by December 18, 2013; (c) conduct an auction on or before January 21, 2014; and (d) have a sale hearing on or before January 23, 2014.
F-133
Table of Contents
MONTREAL, MAINE & ATLANTIC RAILWAY, LTD.
AND MONTREAL, MAINE & ATLANTIC CANADA CO.
(Under Creditor Protection Proceedings as of August 7, 2013)
Notes to Unaudited Condensed Combined Financial Statements
March 31, 2014 and December 31, 2013
| 1. | Background and Creditor Protection Proceedings (Continued) |
Multiple parties submitted initial bids for the assets of the Debtors. The stalking horse bidder was identified as Railroad Acquisition Holdings LLC (the Stalking Horse). Under the stalking horse asset purchase agreement (the Stalking Horse APA), the Stalking Horse proposed to purchase substantially all of the assets of the Debtors and assume certain contracts and leases for a purchase price of $14.3 million. On January 21, 2014, the Trustee performed the asset auction and the Stalking Horse was the winning bidder. On January 23, 2014, the Superior Court for the Province of Quebec entered the approval and vesting order and on January 24, 2014, the Bankruptcy Court entered an order (the Sale Order) approving the sale to the Stalking Horse. The U.S. and Canada sales were effectuated on May 15, 2014 and June 30, 2014, respectively. Refer to Note 13 – Subsequent Events for further information on the sale.
| 2. | Basis of Presentation and Accounting Policies |
Basis of Presentation
The accompanying unaudited condensed combined financial statements of Montreal Maine & Atlantic Railway, Ltd. and its wholly owned Canadian subsidiary, Montreal Maine & Atlantic Canada Co. have been prepared in accordance with U.S. generally accepted accounting principles (GAAP) for interim financial information. Certain information and note disclosures normally included in comprehensive annual financial statements presented in accordance with GAAP have generally been condensed or omitted consistent with Securities and Exchange Commission (SEC) rules and regulations.
Management believes that the accompanying condensed combined financial statements contain all adjustments that, in the opinion of management, are necessary to present fairly the Company’s combined financial condition, results of operations and cash flows for the periods presented. The results of operations for interim periods are not necessarily indicative of the results that may be expected for the full year. These condensed combined financial statements do not represent complete financial statements and should be read in conjunction with the audited combined financial statements and accompanying notes for the year ended December 31, 2013.
The preparation of financial statements in conformity with GAAP requires management to make estimates and assumptions that affect the reported amounts of assets and liabilities and disclosure of contingent assets and liabilities at the date of the financial statements and the reported amounts of revenues and expenses during the reporting period. Actual results could differ from those estimates.
These condensed combined financial statements were prepared on a stand-alone basis derived from the financial statements and accounting records of the Company and its parent, Montreal Maine & Atlantic Corporation (Parent). All inter-company transactions and accounts within MMA have been eliminated in combination. Certain costs that were incurred centrally by Parent for functions such as administrative services have been allocated to the Company and included in the combined financial statements. We believe the assumptions underlying such allocations were made on a reasonable basis.
The condensed combined financial statements have been prepared in accordance with ASC 852, Reorganizations (ASC 852). ASC 852 requires the Company to distinguish transactions and events that are
F-134
Table of Contents
MONTREAL, MAINE & ATLANTIC RAILWAY, LTD.
AND MONTREAL, MAINE & ATLANTIC CANADA CO.
(Under Creditor Protection Proceedings as of August 7, 2013)
Notes to Unaudited Condensed Combined Financial Statements
March 31, 2014 and December 31, 2013
| 2. | Basis of Presentation and Accounting Policies (Continued) |
directly associated with the reorganization in connection with the Creditor Protection Proceedings from the ongoing operations of the business. Expenses incurred and settlement impacts due to the Creditor Protection Proceedings are reported separately as reorganization items, net on the combined statements of operations. Interest expense related to prepetition indebtedness has been reported only to the extent that it will be paid during the pendency of the Creditor Protection Proceedings or is permitted by Bankruptcy Court approval or is expected to be an allowed claim. The prepetition liabilities subject to compromise are disclosed separately on the combined balance sheet and are recorded at the estimated amount of services provided and/or goods received prepetition. The Company has not yet estimated the amount of allowed claims.
Adjustments may also result from actions of the Bankruptcy Court, settlement negotiations, rejection of executor contracts and real property leases, determination as to the value of any collateral securing claims and other events. Any such adjustments could be material to the Company’s results of operations and financial condition in any given period. For additional information on liabilities subject to compromise, see Note 3 – Liabilities Subject to Compromise and Reorganization Items, Net.
The matters discussed in notes 1, 12 and 13 raise substantial doubt about the Company’s ability to continue as a going concern. Actions and events that have occurred since the Derailment and subsequent to March 31, 2014 related to these matters are also discussed in the notes that follow, including notes 1, 12 and 13. The Company has not recorded any adjustments that might be required as a result of these matters other than the adjustments to record an impairment loss on long-lived assets.
All amounts in the notes are presented in thousands unless otherwise indicated.
Principles of Combination
The combined financial statements include certain assets and liabilities that have historically been held at the Parent’s corporate level, but are specifically identifiable or otherwise attributable to MMA. All significant intercompany transactions between Parent and MMA have been included within parent company investment in these combined financial statements.
Restricted Cash
Restricted cash of $4.4 and $4.5 million as of March 31, 2014 and December 31, 2013 primarily consists of $3.7 million of proceeds from a business interruption insurance policy ($3.8 million at December 31, 2013 due to foreign exchange fluctuations) and $0.7 million escrow account held in accounts controlled by the Trustee and the Monitor for payments related to the reorganization for both periods.
Accounts Receivable
Trade accounts receivable are presented net of an allowance for doubtful accounts of $1.6 million at March 31, 2014 and December 31, 2013.
F-135
Table of Contents
MONTREAL, MAINE & ATLANTIC RAILWAY, LTD.
AND MONTREAL, MAINE & ATLANTIC CANADA CO.
(Under Creditor Protection Proceedings as of August 7, 2013)
Notes to Unaudited Condensed Combined Financial Statements
March 31, 2014 and December 31, 2013
| 2. | Basis of Presentation and Accounting Policies (Continued) |
Revenue Recognition
We recognize freight revenues as freight moves from origin to destination. The allocation of revenue between reporting periods is based on the relative transit time in each reporting period with expenses recognized as incurred. Other revenues are recognized as service is performed or contractual obligations are met.
| 3. | Liabilities Subject to Compromise and Reorganizations Items, Net |
Liabilities Subject to Compromise
As a consequence of the Creditor Protection Proceedings, substantially all claims and litigations against the Debtors in existence prior to the filing of the petitions for relief or relating to acts or omissions prior to the filing of the petitions for relief are stayed. The Debtor’s estimate of known or potential prepetition liabilities that are estimable and probable of resulting in an allowed claim against the Debtors in connection with the Creditor Protection Proceedings are reflected in the combined balance sheets as liabilities subject to compromise as of March 31, 2014 and December 31, 2013. The estimated amount of the allowed claim may be different from the amount for which the liability will be settled. Such claims remain subject to future adjustments. Adjustments may result from (i) negotiations, (ii) actions of the Bankruptcy Court, (iii) further developments with respect to disputed claims, (iv) rejection of executory contracts and unexpired leases, (v) proofs of claim (vi) effect of any legislation which may be enacted or (vii) other events.
The amounts shown below for liabilities subject to compromise reflect the Debtors’ prepetition estimate of liabilities which are reasonable and able to be estimated. Certain claims, including but not limited to wrongful death, personal injury, and environmental claims, are not presently ascertainable. While the Debtors maintained liability insurance, this will only cover a small fraction of the injury and damage caused by the Derailment. These claims are the subject of significant legal proceedings and negotiation in the Creditor Protection Proceedings. See Note 12 – Legal Proceedings and Contingencies for additional information on the background of the litigation, developments in the Debtors proceeding and estimated cost.
F-136
Table of Contents
MONTREAL, MAINE & ATLANTIC RAILWAY, LTD.
AND MONTREAL, MAINE & ATLANTIC CANADA CO.
(Under Creditor Protection Proceedings as of August 7, 2013)
Notes to Unaudited Condensed Combined Financial Statements
March 31, 2014 and December 31, 2013
| 3. | Liabilities Subject to Compromise and Reorganizations Items, Net (Continued) |
| December 31, 2013 |
Change in the Quarter |
March 31, 2014 |
||||||||||
| Railroad Rehabilitation and Improvement Financing Program (RRIF) |
$ | 27,189 | $ | — | $ | 27,189 | ||||||
| Notes payable to the State of Maine under Local Rail Freight Assistance Program |
450 | — | 450 | |||||||||
| Wheeling & Erie Line of Credit |
5,433 | (595 | )(a) | 4,838 | ||||||||
| Capital lease obligation – engineering equipment |
7 | — | 7 | |||||||||
| Capital lease obligation – locomotives |
426 | — | 426 | |||||||||
|
|
|
|
|
|
|
|||||||
| Total debt subject to compromise |
33,505 | (595 | ) | 32,910 | ||||||||
| Accounts payable |
8,681 | — | 8,681 | |||||||||
| Accrued interest payable |
452 | — | 452 | |||||||||
| Liabilities – related party |
1,176 | — | 1,176 | |||||||||
| Other miscellaneous liabilities |
890 | — | 890 | |||||||||
|
|
|
|
|
|
|
|||||||
| Total liabilities subject to compromise |
$ | 44,704 | $ | (595 | ) | $ | 44,109 | |||||
|
|
|
|
|
|
|
|||||||
| (a) | The change in the quarter primarily resulted from payments made on the Wheeling & Erie Line of Credit as discussed in Note 5 – Debt and Other Obligations. |
Reorganization items, net
In accordance with ASC 852, reorganization items are presented separately in the combined statements of operations on a net basis and represent items realized or incurred by the Company as a direct result of the Creditor Protection Proceedings.
The reorganization items, net recorded in the combined statements of operations consist of the following:
| For the Three Months Ended March 31, 2014 |
||||
| Professional fees |
$ | 2,086 | ||
|
|
|
|||
| Total reorganization items, net |
$ | 2,086 | ||
|
|
|
|||
For three months ended March 31, 2014, the Company paid approximately $0.3 million for reorganization items.
F-137
Table of Contents
MONTREAL, MAINE & ATLANTIC RAILWAY, LTD.
AND MONTREAL, MAINE & ATLANTIC CANADA CO.
(Under Creditor Protection Proceedings as of August 7, 2013)
Notes to Unaudited Condensed Combined Financial Statements
March 31, 2014 and December 31, 2013
| 4. | Property and Equipment |
Property and equipment consists of the following:
| Life in Years |
2014 | 2013 | ||||||||||
| Land and improvements |
$ | 5,465 | $ | 5,516 | ||||||||
| Buildings |
4 | 154 | 155 | |||||||||
| Trackage |
2 – 5 | 6,139 | 6,200 | |||||||||
| Machinery and equipment |
2 – 6 | 6,718 | 6,722 | |||||||||
|
|
|
|
|
|||||||||
| 18,476 | 18,593 | |||||||||||
| Less accumulated depreciation |
(2,748 | ) | (1,838 | ) | ||||||||
|
|
|
|
|
|||||||||
| Property and equipment – net |
15,728 | 16,755 | ||||||||||
| Construction in progress |
297 | 305 | ||||||||||
|
|
|
|
|
|||||||||
| Total |
$ | 16,025 | $ | 17,060 | ||||||||
|
|
|
|
|
|||||||||
As previously disclosed, management determined property and equipment was impaired as of December 31, 2013 as a result of the Derailment. The Company recorded asset impairment charges of $30.3 million, net of deferred credits of $7.1 million, related to the Derailment in July 2013.
Depreciation expense was $0.9 million and $0.5 million for the three months ended March 31, 2014 and March 31, 2013.
| 5. | Debt and Other Obligations |
The Company’s debt is comprised of the following:
| 2014 | 2013 | |||||||
| Railroad Rehabilitation and Improvement Financing Program (RRIF) (a) |
$ | 27,189 | $ | 27,189 | ||||
| Notes payable to the State of Maine under Local Rail Freight Assistance Program (a) |
450 | 450 | ||||||
| Wheeling & Erie Line of Credit (a) |
4,838 | 5,433 | ||||||
| Camden Line of Credit |
3,826 | 2,042 | ||||||
| Capital lease obligation – engineering equipment (a) |
7 | 7 | ||||||
| Capital lease obligation – locomotives (a) |
426 | 426 | ||||||
|
|
|
|
|
|||||
| Total debt and leases |
36,736 | 35,547 | ||||||
| Less current portion |
(3,826 | ) | (2,042 | ) | ||||
| Liabilities subject to compromise, debt |
(32,910 | ) | (33,505 | ) | ||||
|
|
|
|
|
|||||
| Total long-term debt and leases |
$ | — | $ | — | ||||
|
|
|
|
|
|||||
| (a) | Outstanding balance is classified as liabilities subject to compromise on the combined balance sheet at March 31, 2014 and December 31, 2013. |
F-138
Table of Contents
MONTREAL, MAINE & ATLANTIC RAILWAY, LTD.
AND MONTREAL, MAINE & ATLANTIC CANADA CO.
(Under Creditor Protection Proceedings as of August 7, 2013)
Notes to Unaudited Condensed Combined Financial Statements
March 31, 2014 and December 31, 2013
| 5. | Debt and Other Obligations (Continued) |
Post-petition financing
On October 21, 2013, the Bankruptcy Court granted the Debtors approval to obtain post-petition financing. The Debtors entered a $3.0 million revolving line of credit for working capital needs. The revolving line of credit is secured by a first mortgage and security interest on all assets, located in the United States, that secure the debt administered by the Federal Railroad Administration. The revolving line of credit bears interest of 5.0% with a maturity date of August 30, 2014. In February 2014, the revolving line of credit was increased to $4.8 million. As of March 31, 2014, the Company had drawn approximately $3.8 million of the revolver. The revolver was paid in full on May 15, 2014 with the proceeds from the sale of the Company’s US assets.
Prepetition debt
The Chapter 11 filing constituted an event of default under, or otherwise triggered repayment obligations with respect to, several of the debt instruments and agreements relating to direct and indirect financial obligations of the Debtors (collectively, Prepetition Debt). All obligations under the Prepetition Debt have become automatically and immediately due and payable. The Debtors believe that any efforts to enforce the payment obligations under the Prepetition Debt have been stayed as a result of the Creditor Protection Proceedings. Accordingly, interest accruals and payments for the under secured Prepetition Debt have ceased as of the petition date.
The Company has a $6.0 million line of credit agreement with a related party with an interest rate of prime plus 2% (5.25% as of March 31, 2014) which expired on June 15, 2013. The Wheeling & Erie Line of Credit was used as part of the Debtors cash collateral and the Debtors provided adequate protection for the post-petition use by the Debtors of the cash collateral until October 18, 2013 prior to entering into the post-petition financing. Thereafter, the Debtors used the proceeds from the collection of accounts receivable and the usage of inventory related to the period prior to October 18, 2013 to pay Wheeling & Erie. The balance remaining was classified as liabilities subject to compromise. The Company had an outstanding balance of $4.8 million and $5.4 million as of March 31, 2014 and December 31, 2013, respectively.
On March 24, 2005, Montreal, Maine & Atlantic Railway, Ltd. entered into a $34.0 million Direct Loan Financing Agreement under the Railroad Rehabilitation and Improvement Financing Program (RRIF). The program is administered by the Federal Railroad Administration (FRA), United States Department of Transportation. The agreement provides for a commitment to lend for approved projects, evidenced by notes bearing interest at 4.81%, amortizing in equal quarterly payments of principal and interest over twenty-five years. The notes are secured by a first security interest in track and real estate located in the United States. There were no new borrowings under this agreement during the three months ended March 31, 2014 and the year ended December 31, 2013. The outstanding balance on the RRIF loans of approximately $27.2 million is classified as liabilities subject to compromise.
On April 21, 2009, the Company entered into a $0.8 million loan with the State of Maine in order to provide for infrastructure improvements to the branch lines under the local rail freight assistance program (LRFAP).
F-139
Table of Contents
MONTREAL, MAINE & ATLANTIC RAILWAY, LTD.
AND MONTREAL, MAINE & ATLANTIC CANADA CO.
(Under Creditor Protection Proceedings as of August 7, 2013)
Notes to Unaudited Condensed Combined Financial Statements
March 31, 2014 and December 31, 2013
| 5. | Debt and Other Obligations (Continued) |
The agreement was interest free with twenty equal semiannual installments of $37,500 commencing on December 31, 2009. The outstanding balance of approximately $0.5 million is classified as liabilities subject to compromise.
On November 16, 2006, the Company borrowed $0.7 million under the LRFAP from the State of Maine. The agreement was interest free with twenty equal semiannual installments of $32,500 commencing June 30, 2007. The loan was paid off in June 2013 with the proceeds from the sale of the Van Buren assets.
During the three months ended March 31, 2014 and March 31, 2013, the Company made interest payments of $0.04 million and $0.40 million, respectively.
In accordance with ASC 852, effective August 7, 2013, the Company ceased accruing interest expense on its Prepetition Debt classified as subject to compromise. The Company’s contractual interest not accrued or paid for the three months ended March 31, 2014 was $0.4 million.
Fair Value
The fair values of borrowings would generally approximate carrying values as interest rates are variable or otherwise approximate current rates for similar borrowings; however, borrowings that are subject to compromise will likely settle for amounts less than carrying value. While the fair value may approximate claim amounts, it cannot be determined at this time due to the ongoing bankruptcy proceedings.
| 6. | Income Taxes |
Loss before income tax (benefit) expense was attributable to the following jurisdictions for the three months ended March 31, 2014 and March 31, 2013:
| 2014 | 2013 | |||||||
| U.S. |
$ | (3,130 | ) | $ | 468 | |||
| Canada |
(1,769 | ) | (949 | ) | ||||
|
|
|
|
|
|||||
| Loss before income tax benefit |
$ | (4,899 | ) | $ | (481 | ) | ||
|
|
|
|
|
|||||
The Company has not reported income tax benefit as it has incurred losses in 2014 and 2013 and has provided a valuation allowance for the full amount of net deferred tax assets.
| 7. | Lease Commitments |
Prior to the filing for bankruptcy, the Company was obligated under noncancelable operating leases for rolling stock, vehicles, office equipment and real estate. The leases generally provided that the Company pay the cost of repairs, insurance and taxes. Rent expense under all operating leases was approximately $0.1 million and $0.8 million for the three months ended March 31, 2014 and March 31, 2013, respectively.
F-140
Table of Contents
MONTREAL, MAINE & ATLANTIC RAILWAY, LTD.
AND MONTREAL, MAINE & ATLANTIC CANADA CO.
(Under Creditor Protection Proceedings as of August 7, 2013)
Notes to Unaudited Condensed Combined Financial Statements
March 31, 2014 and December 31, 2013
| 7. | Lease Commitments (Continued) |
In connection with the Bankruptcy, the Company elected to reject certain lease agreements. After the Petition Date, the Company continued to lease locomotives from CIT on a per-day basis. As the units were rented on a “per day” basis, the Company was not obligated under any minimum future rental payments. Therefore, as of the Petition Date, remaining noncancelable operating lease or capital lease obligations are classified as liabilities subject to compromise.
| 8. | Track Maintenance Expense Reimbursements |
The Company has an agreement to assign railroad track miles to an unrelated entity pursuant to Section 45G of the Internal Revenue Code. The Company is eligible for tax credit on qualifying track maintenance expenditures. As we are unable to fully utilize the tax credit, we sell the tax credit to a third party and use the proceeds of the sale to reduce operating expenses. The Company received $0.1 million and $0.5 million under this agreement for the three months ended March 31, 2014 and March 31, 2013, respectively, which was allocated to track maintenance expenditures.
| 9. | Employees’ Pension and Retirement Plans |
The Montreal, Maine & Atlantic Corp. 401(k) Plan is open to all United States employees not subject to a collective bargaining agreement. Employees are eligible to participate after three months of creditable service. The Parent is the sponsor of the 401(k) Plan and provides matching contributions up to 100% of each dollar contributed by employees up to the first 1.5% percent of compensation contributed. The Company’s expense under the plan was approximately $6 and $10 for the three months ended March 31, 2014 and March 31, 2013, respectively.
Canadian employees participate in a Registered Retirement Savings Plan (RRSP) and a Deferred Profit Sharing Plan (DPSP), comprising a defined contribution pension plan that is sponsored and maintained by the Company. Employees contribute 5% of wages to the RRSP, which is matched by the Company at 5% for employees represented by a collective bargaining agreement and at 10% for employees not so represented. The Company’s expense under the plan was approximately $36 and $52 for the three months ended March 31, 2014 and March 31, 2013, respectively.
| 10. | Fair Values of Financial Instruments |
The Company measures and records in the accompanying combined financial statements certain assets and liabilities at fair value on a recurring basis. ASC 820, Fair Value Measurements (ASC 820) establishes a fair value hierarchy for those instruments measured at fair value that distinguishes between assumptions based on market data (observable inputs) and the Company’s own assumptions (unobservable inputs).
These inputs are prioritized as follows:
| • | Level 1: Observable inputs such as quoted prices in active markets for identical assets or liabilities. |
| • | Level 2: Inputs other than quoted prices included within Level 1 that are observable, either directly or indirectly, such as quoted prices for similar assets or liabilities or market corroborated inputs. |
F-141
Table of Contents
MONTREAL, MAINE & ATLANTIC RAILWAY, LTD.
AND MONTREAL, MAINE & ATLANTIC CANADA CO.
(Under Creditor Protection Proceedings as of August 7, 2013)
Notes to Unaudited Condensed Combined Financial Statements
March 31, 2014 and December 31, 2013
| 10. | Fair Values of Financial Instruments (Continued) |
| • | Level 3: Unobservable inputs for which there is little or no market data and which require the Company to develop their own assumptions about how market participants price the asset or liability. |
The valuation techniques that may be used to measure fair value are as follows:
| • | Market approach – Uses prices and other relevant information generated by market transactions involving identical or comparable assets or liabilities. |
| • | Income approach – Uses valuation techniques to convert future amounts to a single present amount based on current market expectation about those future amounts. |
| • | Cost approach – Based on the amount that currently would be required to replace the service capacity of an asset (replacement cost). |
The following table presents financial assets and liabilities measured or disclosed at fair value on a recurring basis for the periods presented:
| Fair Value Measurements at Reporting Date Using | ||||||||||||||||||||
| Quoted Prices in Active Markets for Identical Assets (Level 1) |
Significant Other Observable Inputs (Level 2) |
Significant Unobservable Inputs (Level 3) |
Total Fair Value Measurements |
Valuation Technique |
||||||||||||||||
| As of March 31, 2014 |
||||||||||||||||||||
| Assets: |
||||||||||||||||||||
| Cash and cash equivalents |
$ | 404 | $ | — | $ | — | $ | 404 | Income | |||||||||||
| Restricted cash |
4,409 | — | — | 4,409 | Income | |||||||||||||||
| As of December 31, 2013 |
||||||||||||||||||||
| Assets: |
||||||||||||||||||||
| Cash and cash equivalents |
$ | 148 | $ | — | $ | — | $ | 148 | Income | |||||||||||
| Restricted cash |
4,490 | — | — | 4,490 | Income | |||||||||||||||
Certain assets are measured at fair value on a nonrecurring basis; that is, the assets are not measured at fair value on an ongoing basis but are subject to fair value adjustments only in certain circumstances (for example, when there is evidence of impairment). During the year ended December 31, 2013, the Company recorded an impairment charge in the amount of $30.3 million related to property and equipment. The Company used assessed values and current market data, Level 2 inputs, to determine fair value. There were no additional impairments recorded during the three month period ended March 31, 2014.
Refer to Note 5 – Debt and Other Obligations, for the discussion on the fair value of the Company’s long-term debt.
F-142
Table of Contents
MONTREAL, MAINE & ATLANTIC RAILWAY, LTD.
AND MONTREAL, MAINE & ATLANTIC CANADA CO.
(Under Creditor Protection Proceedings as of August 7, 2013)
Notes to Unaudited Condensed Combined Financial Statements
March 31, 2014 and December 31, 2013
| 11. | Related Party Transactions |
Rail World, Inc. (RWI) and Rail World Holdings, L.L.C. are controlled by Mr. Edward Burkhardt (E.A. Burkhardt), the Chairman of the Board of Directors of the Company. RWI is the General Partner of Earlston Associates, L.P., a major stockholder of the Company. RWI was retained to provide management services to the Company under a Management Agreement providing for fees of $0.2 million per year and reasonable expenses. On the Petition Date, the Company rejected the Management Agreement and the agreement was terminated. The management fee expense was $0.06 million for the three months ended March 31, 2013.
Prior to the Petition Date, the Company leased locomotives from RWI for $150 per unit per day. Total expense for these locomotive rentals was $0 and $0.04 million for the three months ended March 31, 2014 and March 31, 2013, respectively. The Company also leased locomotives from RWI under the terms of a capital lease. Total payments under this agreement were approximately $0 and $0.01 million for the three months ended March 31, 2014 and March 31, 2013, respectively.
Accrued liabilities – related party at March 31, 2014 and December 31, 2013 are comprised of amounts payable to companies controlled by E.A. Burkhardt of $1.1 million and $1.1 million, respectively which were reclassified to liabilities subject to compromise on the Petition Date.
Wheeling & Lake Erie Railway Company is controlled by Mr. Larry Parsons, a member of the Board of Directors and a stockholder of the Company through a WLER subsidiary and directly. WLER is the counterparty to the Company’s line of credit agreement, which is classified as liabilities subject to compromise as of the Petition Date.
| 12. | Legal Proceedings and Contingencies |
Derailment and Related Creditor Protection Proceedings Litigation
The Debtors are involved in claims, litigation, administrative proceedings and investigations of various types in a number of jurisdictions. A number of such matters involve, or may involve, claims for a material amount of damages and relate to or allege wrongful death, personal injury, property damage, contribution, and/or indemnity claims, and environmental liabilities, among others. As a result of the Creditor Protection Proceedings, substantially all prepetition litigation and claims against the Debtors have been stayed.
The Company has not finished its assessment of valid claims, however, more than 5,000 claims in excess of $3.9 billion have been filed alleging wrongful death, personal injury, property damage and other claims related to the Derailment. Most of the lawsuits against the Debtors seek punitive damages for wrongful death and in some cases not resulting in death, personal injury. The wrongful death claimants have the right to a jury trial to determine their claims, a process that could take years. Litigation asserting claims arising from the Derailment have been filed in several courts and most claims filed to date are “unliquidated” claims, which is a claim for which a specific value cannot be precisely determined or that cannot be determined without an evidentiary hearing. In these cases, the Trustee and the Monitor will negotiate a settlement or adjudicate the claim in the Bankruptcy Court.
F-143
Table of Contents
MONTREAL, MAINE & ATLANTIC RAILWAY, LTD.
AND MONTREAL, MAINE & ATLANTIC CANADA CO.
(Under Creditor Protection Proceedings as of August 7, 2013)
Notes to Unaudited Condensed Combined Financial Statements
March 31, 2014 and December 31, 2013
| 12. | Legal Proceedings and Contingencies (Continued) |
Wrongful Death Cases
The unofficial committee of wrongful death claimants consist of representatives of the estates of those killed in the Derailment. These claims may be asserted against any person or entity that had a hand in causing the Derailment. The plaintiffs in the wrongful death cases allege, among other things, that the Derailment resulted in a fire that killed 47 people.
The plaintiffs in the wrongful death cases seek an unspecified amount of damages. Some of the claims in the pending litigation may be entitled to priority pursuant to Chapter 11 Bankruptcy Code section 1171, Priority Claims.
The Quebec Class Action Litigation
On July 15, 2013, Yannick Gagné and Guy Ouellet (the Petitioners), served on the Debtors and other parties a motion to authorize the bringing of a class action and to ascribe the status of representative in the Superior Court of Quebec. The motion has been amended on four occasions, most recently on February 12, 2014. In the motion, the Petitioners request that they be attributed the status of representative of the proposed class and that the court authorize the bringing of a class action. The motion seeks damages on behalf of all members of the proposed class, but does not specifically detail the amount of damages claimed.
In addition, the motion also claims from the respondents an unspecified amount of punitive damages for each of the members of the class, plus interest and additional indemnity on the sums to be awarded as well as the costs of the class action, including expert and notice fees.
Clean-up Order Litigation
On July 29, 2013, the Quebec Minister of Sustainable Development, Environment, Wildlife and Parks issued an order under the authority of section 114.1 of the Quebec Environmental Quality Act which required the Debtors, along with third party co-defendants, to remediate and clean up the Lac-Mégantic Derailment site. The amount of the clean-up expenses related to the Derailment has not yet been determined.
Property Damage Claims
Persons who have suffered property damage as a consequence of the Derailment and who are not plaintiffs or members of the class in the class action litigation have filed claims against the Debtors and other defendants in either their personal capacity or through property insurers.
Co-Defendant Claims
The co-defendants in the Creditor Protection Proceedings have filed claims against the Debtors, holding the Debtors responsible for the losses related to the Derailment due to their assertion of the chain of ownership. These claims include but are not limited to: (i) value of lost freight, (ii) all prospective losses with respect to the damage or destroyed railcars, and (iii) other potential liabilities related to the Derailment. The asserted amounts of these co-defendant claims have not yet been determined.
F-144
Table of Contents
MONTREAL, MAINE & ATLANTIC RAILWAY, LTD.
AND MONTREAL, MAINE & ATLANTIC CANADA CO.
(Under Creditor Protection Proceedings as of August 7, 2013)
Notes to Unaudited Condensed Combined Financial Statements
March 31, 2014 and December 31, 2013
| 12. | Legal Proceedings and Contingencies (Continued) |
Also, the Debtors may recover monies from co-defendants as part of the Debtors’ settlement. This recovery would be passed to the claimants against the Debtors’ estates.
Bar Date and Estimation
The amounts of the Debtors’ present and future liabilities arising from all claim disputes are the subject of significant dispute in Debtors’ Creditor Protection Proceedings. The Bankruptcy Court established June 13, 2014 as the Bar Date for claims other than the wrongful death claims. Wrongful death claims have a bar date of July 14, 2014. Under the Bankruptcy Code, claims of wrongful death and personal injury victims are provided a special priority at the same level as administrative expenses of the estate. Administrative expenses are the highest priority of unsecured claims in a Chapter 11. Under the Bankruptcy Code, other prepetition unsecured creditors are not entitled to a distribution until all wrongful death and personal injury claims have been paid. The amount of damages associated with these claims has not yet been determined, but will likely be significant.
The Debtors have $25.0 million of indemnity coverage but believe this will only cover a small fraction of all claims. At this stage in the proceedings, the Debtors do not have sufficient information to estimate the amount, or range of amounts of the claims related to wrongful death, personal injury, property damage, business interruption and environmental claims, among others. Such amounts are expected to be far in excess of the value of the Company’s assets and insurance coverage.
Other
Prior to the declaration of bankruptcy, the Montreal, Maine & Atlantic Railway, Ltd. provided a guarantee on certain obligations of a former affiliate, Logistics Management Services (LMS), regarding a promissory note secured by a building owned by LMS. LMS’s obligation was further collateralized by a lien on 25 locomotives owned by the Montreal, Maine & Atlantic Railway, Ltd. that were excluded from the sale to Railroad Acquisition Holdings LLC. Management considered that any claims against the guarantee would be contingent claims and that a liability, if any, cannot be estimated. Therefore, no liability has been recorded as of March 31, 2014 and December 31, 2013.
| 13. | Subsequent Events |
These financial statements include a discussion of material events which have occurred subsequent to March 31, 2014 (referred to as subsequent events) through September 16, 2014, the issuance date of these condensed combined financial statements. Events subsequent to that date have not been considered in these financial statements.
On December 12, 2013, the Trustee filed a motion with the Bankruptcy Court (the Sale Motion), pursuant to Section 363 of the Bankruptcy Code, concurrently with the Superior Court for the Province of Quebec, pursuant to Canada’s Company Creditors Arrangement Act, seeking, among other things, the approval of an auction process and bidding procedures that would govern the sale of substantially all of the Debtors’ assets to the Stalking Horse or another bidder with the highest or otherwise best offer and approval of the sale of
F-145
Table of Contents
MONTREAL, MAINE & ATLANTIC RAILWAY, LTD.
AND MONTREAL, MAINE & ATLANTIC CANADA CO.
(Under Creditor Protection Proceedings as of August 7, 2013)
Notes to Unaudited Condensed Combined Financial Statements
March 31, 2014 and December 31, 2013
| 13. | Subsequent Events (Continued) |
substantially all of the Debtors’ assets in accordance with the auction process and bidding procedures. On December 21, 2013, the Trustee and the Stalking Horse entered into the Stalking Horse Asset Purchase Agreement (the APA) for a purchase price of $14.3 million less certain assumed liabilities including accrued vacation and employee related obligations and environmental liabilities. The Stalking Horse provided a $0.8 million security deposit at the agreement date to be allocated to the U.S. and Canada, $0.6 million and $0.2 million, respectively.
On January 23, 2014, the Superior Court for the Province of Quebec entered the approval and vesting order and on January 24, 2014, the Bankruptcy Court approved the sale. The APA provided for a closing date of the U.S. and Canadian assets upon certain conditions being met. As the conditions differed between the U.S. and Canada, the closing dates occurred on different dates. The U.S. and Canada portions of the sale were effectuated on May 15, 2014 and June 30, 2014, respectively.
The assets of Montreal Maine and Atlantic Railway, Ltd. were sold on May 15, 2014 for a total purchase price of $11.1 million. The assets of Montreal Maine and Atlantic Canada Co. were sold on June 30, 2014 for $3.2 million.
In April 2014, the promissory note holder submitted a proof of claim against Montreal, Maine & Atlantic Railway, Ltd. in the amount of $3.69 million based on its obligations under the LMS guarantee. Based upon an interim settlement between Montreal, Maine & Atlantic Railway, Ltd. and the secured promissory note holder, the bankruptcy court granted a motion to remit the 25 locomotives to the promissory note holder who completed a sale via auction on August 5, 2014 for $1.09 million. In the event LMS is unable to perform under the terms of the debt through its operations, the note holder could force a liquidation of the building used to secure the promissory note. If the proceeds from the sale of the building results in an amount less than the amount currently owed under the promissory note, the note holder will retain up to $1.09 million as fulfillment of its secured deficiency claim and any remaining balance would be classified as an unsecured prepetition claim.
F-146
Table of Contents
Fortress Transportation and Infrastructure Investors LLC
20,000,000 Common Shares
Representing Limited Liability Company Interests
PRELIMINARY PROSPECTUS
Joint Book-Running Managers
Citigroup
BofA Merrill Lynch
Barclays
Deutsche Bank Securities
UBS Investment Bank
Co-Managers
JMP Securities
Raymond James
Stephens Inc.
Wolfe Research Securities
, 2015
Until , 2015 (25 days after the date of this prospectus), all dealers that buy, sell or trade our common shares, whether or not participating in this offering, may be required to deliver a prospectus. This is in addition to the dealers’ obligation to deliver a prospectus when acting as underwriters and with respect to their unsold allotments or subscriptions.
Table of Contents
PART II
INFORMATION NOT REQUIRED IN PROSPECTUS
| Item 13. | Other Expenses of Issuance and Distribution. |
The following table sets forth the estimated fees and expenses (except for the SEC registration fee) paid or payable by the registrants in connection with the distribution of the common shares:
| SEC registration fee |
$ | 56,125 | ||
| FINRA filing fee |
15,500 | |||
| Printing and engraving costs |
350,000 | |||
| Legal fees and expenses |
1,850,000 | |||
| Accountants’ fees and expenses |
1,315,000 | |||
| Transfer agent fees |
7,000 | |||
|
|
|
|||
| Total |
$ | 3,593,625 | ||
|
|
|
| Item 14. | Indemnification of Directors and Officers. |
Our operating agreement provides that we will indemnify, to the fullest extent permitted by the Delaware LLC Act, each person who was or is made a party or is threatened to be made a party in any legal proceeding by reason of the fact that he or she is or was our or our subsidiary’s director or officer. However, such indemnification is permitted only if such person acted in good faith and lawfully. Indemnification is authorized on a case-by-case basis by (1) our board of directors by a majority vote of disinterested directors, (2) a committee of the disinterested directors, (3) independent legal counsel in a written opinion if (1) and (2) are not available, or if disinterested directors so direct, or (4) the shareholders. Indemnification of former directors or officers shall be determined by any person authorized to act on the matter on our behalf. Expenses incurred by a director or officer in defending against such legal proceedings are payable before the final disposition of the action, provided that the director or officer undertakes to repay us if it is later determined that he or she is not entitled to indemnification.
Indemnification Agreements. Our operating agreement provides that we may indemnify any person who is or was a director, officer, employee or agent of us to the fullest extent permitted by Delaware law. The indemnification provisions contained in our operating agreement are not exclusive of any other rights to which a person may be entitled by law, agreement, vote of shareholders or disinterested directors or otherwise. In addition, we have entered into separate indemnification agreements with each of our directors and executive officers, which are broader than the specific indemnification provisions contained in the Delaware LLC Act. These indemnification agreements require us, among other things, to indemnify our directors and officers against liabilities that may arise by reason of their status or service as directors or officers, other than liabilities arising from willful misconduct.
Insurance. We maintain directors’ and officers’ liability insurance, which covers directors and officers of our Company against certain claims or liabilities arising out of the performance of their duties.
Underwriting Agreement. Our underwriting agreement with the underwriters will provide for the indemnification of the directors and officers of our Company against specified liabilities related to this prospectus under the Securities Act in certain Circumstances.
| Item 15. | Recent Sales of Unregistered Securities. |
The Company is a Delaware limited liability company formed for the purpose of this offering and has not engaged in any business or other activities except in connection with its formation and its ownership of Holdco.
II-1
Table of Contents
| Item 16. | Exhibits and Financial Statement Schedules. |
| (a) | Exhibits. |
See the Index to Exhibits included in this Registration Statement.
| (b) | Financial Statement Schedules. |
None.
| Item 17. | Undertakings. |
The undersigned registrant hereby undertakes to provide to the underwriters at the closing specified in the underwriting agreement, certificates in such denominations and registered in such names as required by the underwriters to permit prompt delivery to each purchaser.
Insofar as indemnification for liabilities arising under the Securities Act may be permitted to directors, officers, and controlling persons of the registrant pursuant to the foregoing provisions, or otherwise, the registrant has been advised that in the opinion of the SEC such indemnification is against public policy as expressed in the Securities Act and is, therefore, unenforceable. In the event that a claim for indemnification against such liabilities (other than the payment by the registrant of expenses incurred or paid by a director, officer, or controlling person of the registrant in the successful defense of any action, suit or proceeding) is asserted by such director, officer, or controlling person in connection with the securities being registered, the registrant will, unless in the opinion of its counsel the matter has been settled by controlling precedent, submit to a court of appropriate jurisdiction the question whether such indemnification by it is against public policy as expressed in the Securities Act and will be governed by the final adjudication of such issue.
The undersigned registrant hereby undertakes that:
| • | For purposes of determining any liability under the Securities Act, the information omitted from the form of prospectus filed as part of this registration statement in reliance upon Rule 430A and contained in a form of prospectus filed by us pursuant to Rule 424(b)(1) or (4) or 497(h) under the Securities Act shall be deemed to be part of this registration statement as of the time it was declared effective. |
| • | For the purpose of determining any liability under the Securities Act, each post-effective amendment that contains a form of prospectus shall be deemed to be a new registration statement relating to the securities offered therein, and the offering of such securities at that time shall be deemed to be the initial bona fide offering thereof. |
II-2
Table of Contents
SIGNATURES
Pursuant to the requirements of the Securities Act, the registrant has duly caused this Registration Statement to be signed on its behalf by the undersigned, thereunto duly authorized, in the City of New York, State of New York, on May 14, 2015.
| Fortress Transportation and | ||
| Infrastructure Investors LLC | ||
| By: |
/s/ Joseph Adams | |
| Name: Joseph Adams | ||
| Title: Chief Executive Officer and Director | ||
Pursuant to the requirements of the Securities Act, this Registration Statement has been signed below by the following persons in the capacities and on the dates indicated below.
| Name |
Title |
Date | ||
| /s/ Joseph Adams Joseph Adams |
Chief Executive Officer and Director (Principal Executive Officer) |
May 14, 2015 | ||
| /s/ Jonathan G. Atkeson Jonathan G. Atkeson |
Chief Financial Officer (Principal Financial Officer and Principal Accounting Officer) |
May 14, 2015 | ||
| * Wesley R. Edens |
Director | May 14, 2015 | ||
| * Paul R. Goodwin |
Director | May 14, 2015 | ||
| * Ray M. Robinson |
Director | May 14, 2015 | ||
| * |
Director | May 14, 2015 | ||
| Martin Tuchman | ||||
| *By | /s/ Cameron D. MacDougall | |
| Cameron D. MacDougall Attorney-in-fact | ||
II-3
Table of Contents
INDEX TO EXHIBITS
| Exhibit No. |
Description | |
| *1.1 | Form of Underwriting Agreement | |
| *3.1 | Certificate of Formation | |
| *3.2 | Amended and Restated Limited Liability Company Agreement of Fortress Transportation and Infrastructure Investors LLC | |
| *5.1 | Opinion of Skadden, Arps, Slate, Meagher & Flom LLP | |
| *8.1 | Tax opinion of Skadden, Arps, Slate, Meagher & Flom LLP | |
| *10.1 | Fourth Amended and Restated Partnership Agreement of Fortress Worldwide Transportation and Infrastructure General Partnership | |
| *†10.2 | Management and Advisory Agreement, dated as of , 2015, between Fortress Transportation and Infrastructure Investors LLC and FIG LLC | |
| *†10.3 | Fortress Transportation and Infrastructure Investors LLC Nonqualified Stock Option and Incentive Award Plan | |
| *10.4 | Registration Rights Agreement, dated as of , 2015, among Fortress Transportation and Infrastructure Investors LLC, FIG LLC and Fortress Transportation and Infrastructure Master GP LLC | |
| *10.5 | Form of director and officer indemnification agreement of Fortress Transportation and Infrastructure Investors LLC | |
| *10.6 | Credit Agreement, dated as of August 27, 2014, among Morgan Stanley Senior Funding, Inc., as administrative agent, Jefferson Gulf Coast Energy Partners LLC and the other lenders party thereto | |
| *21.1 | Subsidiaries of the Registrant | |
| *23.1 | Consent of Skadden, Arps, Slate, Meagher & Flom LLP (included in Exhibit 5.1 and Exhibit 8.1) | |
| 23.2 | Consent of PricewaterhouseCoopers LLP | |
| 23.3 | Consent of PricewaterhouseCoopers LLP | |
| *23.4 | Consent of Harrison Consulting | |
| *23.5 | Consent of Wesley R. Edens | |
| *23.6 | Consent of Paul R. Goodwin | |
| *23.7 | Consent of Ray M. Robinson | |
| *23.8 | Consent of Martin Tuchman | |
| 23.9 | Consent of UHY LLP | |
| 23.10 | Consent of Baker Newman & Noyes, LLC | |
| *24.1 | Powers of Attorney | |
| * | Previously filed. |
| † | Management contracts and compensatory plans or arrangements. |
II-4