Attached files
| file | filename |
|---|---|
| 8-K - CURRENT REPORT - COSI INC | co32851664-8k.htm |
| EX-99.1 - PRESS RELEASE - COSI INC | co32851664-ex99_1.htm |
Exhibit 99.2

Proprietary and confidential. For internal use only. © 2009 Così, Inc. All rights reserved. * Q1 2015 Investor Teleconference Supplemental InformationMay 14, 2015

Proprietary and confidential. For internal use only. © 2009 Così, Inc. All rights reserved. * Q1 2015 Teleconference Agenda Introductory CommentsFinancial ResultsSlide 3 – Restaurant Margin Performance Q1Slide 4 – Reconciliation of Non-GAAP Measures To Net Income Q1Questions and Answers
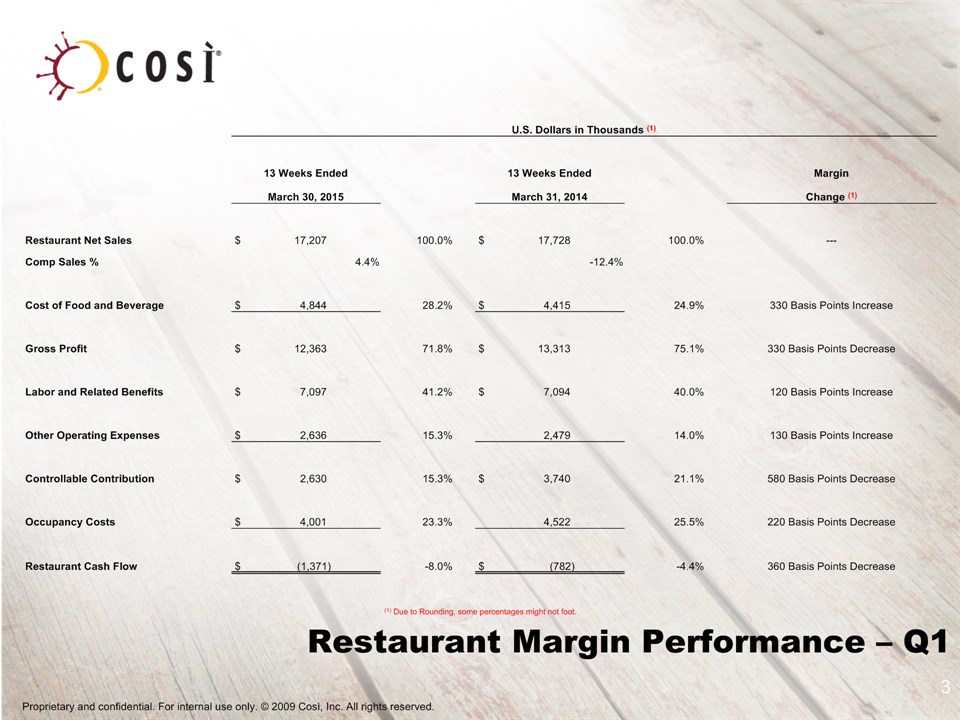
Proprietary and confidential. For internal use only. © 2009 Così, Inc. All rights reserved. * Restaurant Margin Performance – Q1 U.S. Dollars in Thousands (1) U.S. Dollars in Thousands (1) U.S. Dollars in Thousands (1) U.S. Dollars in Thousands (1) U.S. Dollars in Thousands (1) U.S. Dollars in Thousands (1) U.S. Dollars in Thousands (1) 13 Weeks Ended 13 Weeks Ended Margin March 30, 2015 March 31, 2014 Change (1) Restaurant Net Sales $ 17,207 100.0% $ 17,728 100.0% --- Comp Sales % 4.4% -12.4% Cost of Food and Beverage $ 4,844 28.2% $ 4,415 24.9% 330 Basis Points Increase Gross Profit $ 12,363 71.8% $ 13,313 75.1% 330 Basis Points Decrease Labor and Related Benefits $ 7,097 41.2% $ 7,094 40.0% 120 Basis Points Increase Other Operating Expenses $ 2,636 15.3% 2,479 14.0% 130 Basis Points Increase Controllable Contribution $ 2,630 15.3% $ 3,740 21.1% 580 Basis Points Decrease Occupancy Costs $ 4,001 23.3% 4,522 25.5% 220 Basis Points Decrease Restaurant Cash Flow $ (1,371) -8.0% $ (782) -4.4% 360 Basis Points Decrease (1) Due to Rounding, some percentages might not foot. (1) Due to Rounding, some percentages might not foot. (1) Due to Rounding, some percentages might not foot. (1) Due to Rounding, some percentages might not foot. (1) Due to Rounding, some percentages might not foot. (1) Due to Rounding, some percentages might not foot. (1) Due to Rounding, some percentages might not foot. (1) Due to Rounding, some percentages might not foot.
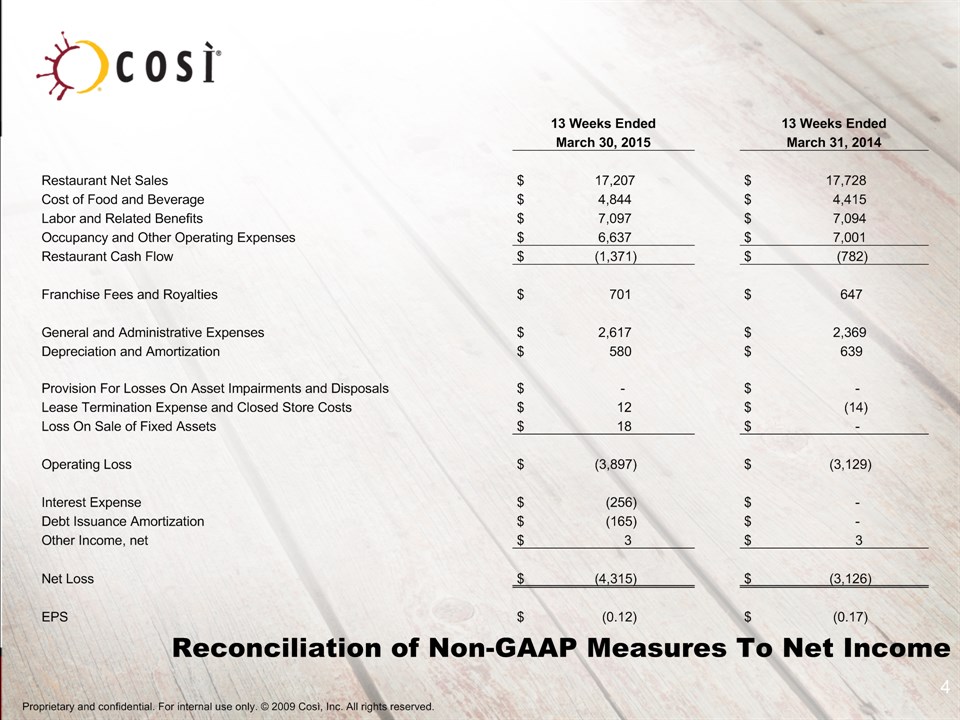
Proprietary and confidential. For internal use only. © 2009 Così, Inc. All rights reserved. * Reconciliation of Non-GAAP Measures To Net Income 13 Weeks Ended 13 Weeks Ended March 30, 2015 March 31, 2014 Restaurant Net Sales $ 17,207 $ 17,728 Cost of Food and Beverage $ 4,844 $ 4,415 Labor and Related Benefits $ 7,097 $ 7,094 Occupancy and Other Operating Expenses $ 6,637 $ 7,001 Restaurant Cash Flow $ (1,371) $ (782) Franchise Fees and Royalties $ 701 $ 647 General and Administrative Expenses $ 2,617 $ 2,369 Depreciation and Amortization $ 580 $ 639 Provision For Losses On Asset Impairments and Disposals $ - $ - Lease Termination Expense and Closed Store Costs $ 12 $ (14) Loss On Sale of Fixed Assets $ 18 $ - Operating Loss $ (3,897) $ (3,129) Interest Expense $ (256) $ - Debt Issuance Amortization $ (165) $ - Other Income, net $ 3 $ 3 Net Loss $ (4,315) $ (3,126) EPS $ (0.12) $ (0.17)