Attached files
| file | filename |
|---|---|
| 8-K - FORM 8-K - AMERIANA BANCORP | d925826d8k.htm |
 1
AMERIANA BANCORP
ANNUAL MEETING
THURSDAY, MAY 14,
|
CEO PRESENTATION
: ASBI
Exhibit 99.1
2015 |
 2
FORWARD-LOOKING STATEMENT
This presentation contains forward-looking statements, which
include statements about Ameriana’s future financial performance,
business plans and strategies. They often include words like
“believe,”
“expect,”
“anticipate,”
“estimate,”
and “intend”
or future or
conditional verbs such as “will,”
“would,”
“should,”
“could”
or “may.”
Forward-looking statements involve future risks and uncertainties
because of factors that could cause actual results to differ
materially from those expressed or implied. Specific risk factors
and other uncertainties that could affect the accuracy of forward-
looking statements are included in Ameriana’s Form 10-K for the
year ended December 31, 2014. Ameriana does not undertake any
obligation to update forward-looking statements made in this
document. |
 3
AMERIANA BANCORP
ANNUAL FINANCIAL PERFORMANCE
(IN THOUSANDS)
Year Ended
December 31,
Interest Income
Interest Expense
Net Interest Income
Provision for Loan Losses
Non-Interest Income
Non-Interest Expense
Income before Income Taxes
Income Tax Expense
Net Income
2014
2013
$18,146
$ 16,980
2,997
3,003
15,149
13,977
322
5,617
17,211
3,233
867
755
5,801
16,095
2,928
741
$ 2,187
$ 2,366 |
 4
AMERIANA BANCORP
QUARTERLY FINANCIAL PERFORMANCE
(IN THOUSANDS)
Three Months
Ended March 31,
2015
2014
$ 4,169
$ 4,474
646
758
3,523
3,716
105
150
1,559
1,364
4,318
3,917
659
1,013
157
284
$ 502
$ 729
Interest Income
Interest Expense
Net Interest Income
Provision for Loan Losses
Non-Interest Income
Non-Interest Expense
Income before Income Taxes
Income Tax Expense
Net Income |
 5
AMERIANA BANK CAPITAL
(AS OF 3/31/15)
Bank
Peer*
Tier 1 Leverage Capital
9.40%
10.18%
Common Equity Tier 1 Capital
13.67
14.47
Tier 1 RBC/Risk Wtd. Assets
13.67
14.54
Total RBC/Risk Wtd. Assets
14.90
15.66
Source: FDIC UBPR 3/31/2015
*Peer group defined by FDIC for Ameriana is “Peer Group 3”
–
insured
commercial banks having assets between $300 million and $1 billion
|
 6
AMERIANA BANK
KEY METRICS
(AS OF 3/31/15)
Bank
Peer*
Non-accrual Loans/Total Loans
1.41%
0.94%
NCL+ OREO/Lns. + OREO
3.37
1.64
Net Loss/Avg. Loans (1
st
Qtr Annualized)
0.03
0.07
ALLL/Total Loans
1.23
1.44
Current Rest. Loans/Total Loans
1.85
0.55
Source: FDIC UBPR 3/31/2015
*Peer
group
defined
by
FDIC
for
Ameriana
is
“Peer
Group
3”
–
insured
commercial
banks having assets between $300 million and $1 billion |
 7
AMERIANA BANCORP
FINANCIAL PERFORMANCE
(FIRST QUARTER 2015)
Positive Factors:
•
•
•
Net income of $502,000, or $0.17 per diluted share for the
first quarter of 2015
Declared a quarterly dividend of $0.04 per share, which
represented a $0.02 per share increase
Continued growth in tangible book value per share to $13.35
|
 8
AMERIANA BANK
FINANCIAL PERFORMANCE
(FIRST QUARTER 2015)
Positive Factors:
•
•
•
o
•
Source: FDIC UBPR 3/31/2015
Total loans increased $3.7 million and strong pipeline at the end
of the first quarter
Total
deposits
increased
$11.6
million
–
growing
momentum
in
new Indianapolis metropolitan market banking centers
Assets per employee is improving ($ per million)
$3.34 compared to $3.33 in the same quarter in 2014,
($3.28 at 12/31/2014 and $3.23 at 12/31/2013)
Non-Interest income as a percent of Average Assets was higher
than
peer
at
1.31%
compared
to
peer
at
0.74%
for
1
st
Qtr.
2015.
*Peer
group
defined
by
FDIC
for
Ameriana
is
“Peer
Group
3”
–
insured
commercial
banks
having
assets
between
$300
million and $1 billion |
 9
AMERIANA BANK
FINANCIAL PERFORMANCE
(FIRST QUARTER 2015)
Negative Factors:
•
•
•
•
•
Source: FDIC UBPR 3/31/2015
*Peer
group
defined
by
FDIC
for
Ameriana
is
“Peer
Group
3”
–
insured
commercial
banks
having
assets between $300 million and $1 billion
Funding costs are somewhat higher than peer
Assets per employee remains lower than peer (i.e. excess
capacity)
DDAs, although increasing, remain below high-performing peer
banks
Other non-personnel expenses are higher than peer
Personnel and occupancy expense, due to number of new
offices, is higher than peer |
 10
AMERIANA BANK
FINANCIAL PERFORMANCE
(FIRST QUARTER 2015)
Profitability: (% of Avg. Assets)
Bank
Peer*
Interest Expense
Other Operating Expense
Occupancy Expense
Personnel Expense
Total Overhead Expense
Efficiency Ratio
Assets Per Employee ($ in millions)
Average Personnel Expense
Source: FDIC UBPR 3/31/2015
*Peer
group
defined
by
FDIC
for
Ameriana
is
“Peer
Group
3”
–
insured
commercial
banks
having
assets
between
$300 million and $1 billion
0.51%
0.40%
1.02
0.87
0.56
0.35
1.88
1.60
3.46
2.83
79.76
66.70
$3.34
$4.92
61.94
74.75
Per Employee
($ in thousands) |
 11
AMERIANA BANK
FINANCIAL PERFORMANCE
(FIRST QUARTER 2015)
Profitability: (%)
Bank
Peer
Avg. Earning Assets/Avg. Assets
87.98%
93.93%
Avg. Int. Bearing Fds/Avg. Assets
82.57
75.59
Int. Income/Avg. Earning Assets
4.01
4.13
NII/Average Earning Assets
3.44
3.70
Net Loans/Avg. Assets
66.76
65.07
Source: FDIC UBPR 3/31/2015
*Peer
group
defined
by
FDIC
for
Ameriana
is
“Peer
Group
3”
–
insured
commercial
banks
having assets between $300 million and $1 billion |
 12
AMERIANA BANK
FINANCIAL PERFORMANCE
(FIRST QUARTER 2015)
Profitability: (%)
Bank
Peer
AFS Securities/Avg. Assets
10.18%
18.79%
DDA/Avg. Assets
6.62
12.05
Core Deposits/Avg. Assets
79.92
77.08
FHLB/Avg. Assets
5.58
2.60
Source: FDIC UBPR 3/31/2015
*Peer
group
defined
by
FDIC
for
Ameriana
is
“Peer
Group
3”
–
insured
commercial
banks
having
assets
between $300 million and $1 billion |
 13
TOTAL LOANS
(DOLLARS IN THOUSANDS)
$326,573
$317,595
$317,087
$318,287
$316,960
$321,025
$324,723
12/31/2009
12/31/2010
12/31/2011
12/31/2012
12/31/2013
12/31/2014
3/31/2015 |
 14
TOTAL DEPOSITS
(DOLLARS IN THOUSANDS)
$338,381
$337,978
$337,250
$356,703
$362,701
$378,947
$390,577
12/31/2009
12/31/2010
12/31/2011
12/31/2012
12/31/2013
12/31/2014
3/31/2015 |
 15
NET INTEREST INCOME
(DOLLARS IN THOUSANDS)
$12,689
$13,411
$13,924
$14,187
$13,977
$15,149
$3,523
2009
2010
2011
2012
2013
2014
1Q2015 |
 16
NET INTEREST MARGIN
(ON A FULLY TAX-EQUIVALENT BASIS)
3.08%
3.63%
3.73%
3.71%
3.63%
3.68%
3.45%
2009
2010
2011
2012
2013
2014
1Q2015 |
 17
NON-PERFORMING LOANS
(DOLLARS IN THOUSANDS)
$9,053
$11,247
$8,828
$7,604
$5,067
$4,391
$4,571
12/31/2009
12/31/2010
12/31/2011
12/31/2012
12/31/2013
12/31/2014
3/31/2015 |
 18
NON-ACCRUAL LOANS
(AS OF 3/31/2015)
($ in thousands)
Single-family residences –
Countrywide
originations (8 loans)
$ 1,762
Land for commercial development
836
Commercial real estate
812
Commercial
495
3,905
Single-family residences (13 loans)
607
HELOCs (6
loans)
58
$ 4,570
Sub-total
Total |
 19
NON-PERFORMING LOANS/TOTAL LOANS
2.78%
3.54%
2.79%
2.39%
1.60%
1.37%
1.41%
12/31/2009
12/31/2010
12/30/2011
12/31/2012
12/31/2013
12/31/2014
3/31/2015 |
 20
OREO
(DOLLARS IN THOUSANDS)
$3,881
$9,067
$9,067
$6,326
$5,172
$6,639
$6,606
12/31/2009
12/31/2010
12/31/2011
12/31/2012
12/31/2013
12/31/2014
3/31/2015 |
 OTHER REAL ESTATE OWNED
(AS OF 3/31/2015)
($ in thousands)
Retail strip center (partially occupied) and one outlot
$
1,985
Residential condominium development
1,536
Single
family
residence
–
rented
781
Developed commercial land
820
Undeveloped land and developed residential building lots
721
Commercial real estate
251
Undeveloped land
214
Developed commercial lot
113
Sub-total
6,421
Three single-family residences (unrelated)
185
Total
21
$ 6,606 |
 22
OREO/TOTAL LOANS
1.19%
2.85%
2.38%
1.99%
1.63%
2.07%
2.03%
12/31/2009
12/31/2010
12/31/2011
12/31/2012
12/31/2013
12/31/2014
3/31/2015 |
 23
NET CHARGE-OFFS
(DOLLARS IN THOUSANDS)
$1,166
$1,726
$1,465
$1,038
$1,001
$412
$24
2009
2010
2011
2012
2013
2014
1Q2015 |
 24
NET CHARGE-OFFS/AVG. LOANS
0.35%
0.54%
0.47%
0.33%
0.31%
0.13%
0.01%
2009
2010
2011
2012
2013
2014
1Q2015 |
 ALLOWANCE FOR LOAN LOSSES
(DOLLARS IN THOUSANDS)
$4,005
$4,212
$4,212
$4,239
$3,993
$3,903
$3,984
12/31/2009
12/31/2010
12/31/2011
12/31/2012
12/31/2013
12/31/2014
3/31/2015
25 |
 ALLOWANCE FOR LOAN LOSSES/TOTAL LOANS
1.23%
1.33%
1.30%
1.30%
1.26%
1.22%
1.23%
12/31/2009
12/31/2010
12/31/2011
12/31/2012
12/31/2013
12/31/2014
3/31/2015
26 |
 TROUBLED DEBT RESTRUCTURINGS (TDRS)
(DOLLARS IN THOUSANDS)
$268
$8,393
$9,016
$12,171
$11,558
$7,455
$7,395
12/31/2009
12/31/2010
12/31/2011
12/31/2012
12/31/2013
12/31/2014
3/31/2015
27 |
 28
TROUBLED DEBT RESTRUCTURINGS
(TDRS -
AS OF 3/31/2015)
($ in thousands)
Hotel
loan
$
3,676 Substandard
Developed commercial
land
915
Pass
Commercial (3
loans)
186
Non-accrual
Subtotal
4,777
Single-family residence –
Countrywide
origination 240
Pass
Single-family residence –
Countrywide
origination 206
Substandard
Single-family residence –
Countrywide origination (4 loans) 986
Non-accrual
Single-family
residence
967
Pass
Single-family
residence
219
Substandard
$7,395
Total |
 29
•
To be a relevant and robust
alternative to “banking as
usual”
in central Indiana
•
To grow into new markets by
doing what it takes to
become a fully established,
leading citizen and business
advocate in each
neighborhood we serve
•
To uphold and act on the
core values of a true
community bank
OUR VISION |
 30
To engage every
customer in a meaningful
dialogue regarding their
financial needs and
provide advice and
financial solutions that
assist them in achieving
their goals
OUR MISSION |
 31 |
 32 |
 33 |
 AMERIANA BUSINESS STRATEGY
•
Customer needs client strategy focused on building
long-term relationships
•
Disciplined, relationship-building culture along all
business units
•
Business units
o
Commercial
o
Consumer
o
Mortgage
o
Insurance
o
Financial Management
•
Primary focus is value creation through growth in
Indianapolis and legacy markets
34 |
 AMERIANA COMMERCIAL STRATEGY
•
C&I / Owner-Occupied CRE / Investment Real Estate
•
Focused on small business and middle market clients
•
Target
loan
size
is
$25,000
-
$5
million
•
Working capital lines, equipment financing, letters of credit, term
real estate and interest rate risk tools available
•
SBA Lending expertise
•
Experienced lending team, primarily focused on Indianapolis
market
•
Full suite of depository products, mobile and online money
management tools, merchant processing, insurance and 401(k)
plan expertise
35 |
 AMERIANA CONSUMER LENDING STRATEGY
•
Consumer lending focused on residential mortgage,
home equity, auto and other closed-end loans
•
Mortgage originators located in key markets within
our footprint
•
Fully-automated Loan Origination System in
compliance with all current regulations
•
Online consumer application system
36 |
 AMERIANA RETAIL STRATEGY
•
Develop relationships focused on meeting financial
lifecycle needs and building products per household
•
On-The-Go Checking is key acquisition product
•
Focused on omni channel customer experience to
provide seamless integration between branch and
electronic delivery channels.
o
ATM access
o
Telephone Banking
o
Call Center
o
Online Banking
o
Mobile
Banking
–
check
deposit,
bill
pay,
alerts,
etc.
o
e-Account Opening
37 |
 REGULATORY AND ENTERPRISE
RISK MANAGEMENT
•
Experienced ERM Team
o
Janelle
Gamble,
SVP
–
Chief
Risk
Officer
+
Compliance
and
CRA Officer
Gloria Corbin, BSA
Stephanie Cunningham, Compliance
Ron Holloway, Loan Review
Joan Kerulis and Debra Hay, Audit
38 |
 CUSTOMER GROWTH TREND
Total
Customers
–
Business
&
Personal
16334
16942
17136
17788
18267
18558
19262
14500
15000
15500
16000
16500
17000
17500
18000
18500
19000
19500
2008 -
2014
39 |
 5
YEAR GROWTH IN CHECKING ACCOUNTS 40
12,389
13,266
14,610
15,592
16,465
10000
11000
12000
13000
14000
15000
16000
17000
2010
2011
2012
2013
2014 |
 SHIFT IN DEPOSIT MIX
Non-Maturity
Deposits
39%
41
12/31/08
CDs
61%
12/31/14
CDs
36%
Deposits
64%
Non-Maturity |
 5
YEAR GROWTH IN DEBIT CARD INTERCHANGE
$568,609.01
$687,884.99
$737,072.89
$843,756.85
$960,203.49
$400,000.00
$500,000.00
$600,000.00
$700,000.00
$800,000.00
$900,000.00
$1,000,000.00
2010
2011
2012
2013
2014
42 |
 5
YEAR GROWTH IN NSF/FOREIGN ATM $400,000.00
$500,000.00
$600,000.00
$700,000.00
$800,000.00
$900,000.00
$1,000,000.00
$1,100,000.00
$1,200,000.00
2010
2011
2012
2013
2014
43
$827,900.73
$827,897.54
$914,066.58
$960,912.88
$1,068,849.82 |
 INCREASE IN MOBILE BANKING USAGE
25% Increase in Mobile Banking Users
44 |
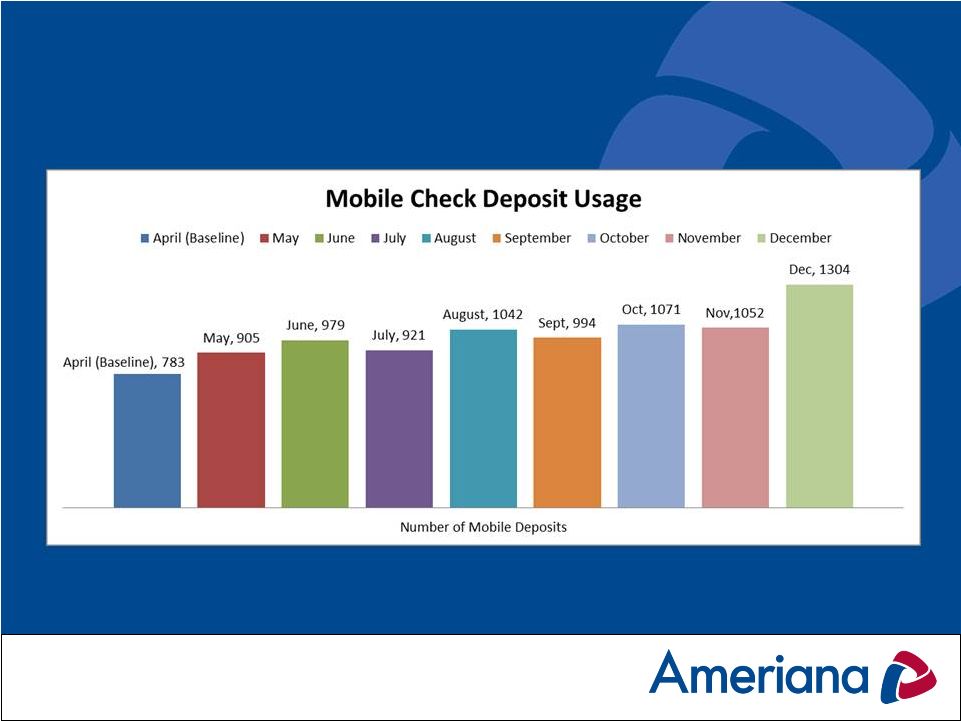 INCREASE IN MOBILE CHECK DEPOSIT
67% Increase in Mobile Deposits
45 |
 INCREASE IN MOBILE PICTURE PAY
156% Increase in Picture Pay usage
46 |
 Rating of Account Opening Experience
100% of those surveyed rated Ameriana at “Good”
or “Excellent”
CUSTOMER SURVEY RESULTS
47
0%
10%
20%
30%
40%
50%
60%
70%
80%
90%
100%
Poor
Fair
Good
Excellent
2008
2009
2010
2011
2013
2014 |
 Likelihood of Using Additional
Ameriana Products and Services
In 2014, 92% said they would use additional services, compared to 84%
in 2013, 93% in 2011, 99% in 2010, 79% in 2009 and 74% in 2008.
CUSTOMER SURVEY RESULTS
0%
10%
20%
30%
40%
50%
60%
70%
80%
90%
Very Unlikely
Unlikely
Likely
Very Likely
Not Sure
2008
2009
2010
2011
2013
2014
48 |
 Likelihood of Recommending Ameriana
In 2014, 96% said they would use additional services, compared to
95% in 2013, 98% in 2011, 95% in 2010, 95% in 2009 and 98% in 2008.
CUSTOMER SURVEY RESULTS
49
0%
10%
20%
30%
40%
50%
60%
70%
80%
90%
100%
Very Unlikely
Unlikely
Likely
Very Likely
Not Sure
2008
2009
2010
2011
2013
2014 |
 Name recognition and awareness built with
Ameriana name campaign.
AMERIANA’S TV SPOT
50 |
 REDESIGNED WEBSITE
51 |
 52 |
 53 |
 54 |
 55 |
 COMMUNITY SERVICE &
OUTREACH
56 |
 New
Castle Optimist of the Year Cathy Crabtree
Ameriana Insurance Agency
57 |
 Henry County United Fund’s
Spirit of Caring Business of the Year Award
COMMUNITY OUTREACH
58 |
 Paul
W. Prior Scholarship Winner Ashley Criswell (Diana
Criswell’s daughter, New Castle Main)
COMMUNITY OUTREACH
59 |
 •
Knightstown recognized as a Small Business Saturday Champion
•
Donated a total of $38,625 to 49 different area non-profit
organizations via
Checking It Forward
®
•
Sponsored Geist Half for 5
th
Year
which
raises
funds
to
fight
childhood
obesity
•
Westfield Banking Center held its 6th Annual Fall Festival to support the
Westfield Youth Assistance Program
60
Community
for the 3
rd
year in a row |
 Fishers Crossing
11991 FISHERS CROSSING
OPENED 2 BANKING CENTERS
Noblesville
107 W. LOGAN STREET
61 |
 BROAD RIPPLE BANKING CENTER
59
TH
& COLLEGE AVENUE
Opening Fall 2015
62 |
 2015
EARNINGS TARGETS BANK
BANCORP
$3,208,000
$2,497,000
CHALLENGES FOR 2015
•
•
•
•
63
Fragile, slow moving economic recovery
Extremely competitive commercial loan market
Net interest margin compression resulting from ongoing low
interest rate environment
Initial costs associated with retail expansion strategy
|
 STOCK PERFORMANCE
(July 2012 –
Present)
Source: SNL Financial 5/11/2015
64 |
 STOCK PERFORMANCE
Change %
As of 5/11/2015
YTD
1 Year
3 Years
ASBI
(9.73)
19.29
212.15
SNL Bank & Thrift
0.82
13.13
62.81
SNL Bank < $500mm
6.31
10.14
58.03
KBW Bank
1.12
10.36
58.95
NASDAQ Bank
1.00
9.59
49.69
SNL Micro Cap
2.22
10.41
52.34
Source: SNL Financial
65 |
 AMERIANA FRANCHISE HIGHLIGHTS
•
Focused on improving shareholder value
•
Increased dividend
•
Growth strategies focused on building relationships, growing
deposits and fee revenue
•
Investments in Indianapolis area are producing results
•
Well-capitalized with ability to support further organic growth
•
Able to effectively manage to increased regulatory requirements
66 |
 DONALD C. “DANNY”
DANIELSON
1919-2015
•
Director of Ameriana Bank
since 1971
•
Director of Ameriana
Bancorp since 1990
67 |
 QUESTIONS?
68 |