Attached files
| file | filename |
|---|---|
| 8-K - FORM 8-K - Truett-Hurst, Inc. | v410189_8-k.htm |
| EX-99.1 - EXHIBIT 99.1 - Truett-Hurst, Inc. | v410189_ex99-1.htm |
Exhibit 99.2
Truett - Hurst, Inc. FY15Q3 Earnings Call May 13, 2015 NASDAQ: THST 1
2 Safe Harbor Statement This presentation (including the presentation and any subsequent questions and answers) contains statements that are forward - looking within the meaning of Section 27 A of the Securities Act of 1933 and Section 21 E of the Securities Exchange Act of 1934 . Such forward - looking statements are only predictions and are not guarantees of future performance . Any such forward - looking statements are and will be, as the case may be, subject to many risks, uncertainties, certain assumptions and factors relating to the operations and business environments of Truett - Hurst, Inc . and its subsidiaries that may cause the actual results of the companies to be materially different from any future results expressed or implied in such forward - looking statements . These risk factors, include, but are not limited to, a reduction in the supply of grapes and bulk wine available to us ; significant competition ; any change in our relationships with retailers could harm our business ; we may not achieve or maintain profitability in the future ; the loss of key employees ; a reduction in our access to, or an increase in the cost of, the third - party services we use to produce our wine could harm our business ; credit facility restrictions on our current and future operations ; failure to protect, or infringement of, trademarks and proprietary rights ; these factors should not be construed as exhaustive and should be read in conjunction with the other cautionary statements that are included in this report or detailed in our periodic filings (including Forms 8 - K, 10 - K and 10 - Q) or other documents filed with the Securities and Exchange Commission . For more detailed information on us, please refer to our filings with the Securities and Exchange Commission, which are readily available at http : //www . sec . gov, or through the our Investor Relations website at http : //www . truetthurstinc . com . For additional information, see our annual report for the year ended June 30 , 2014 on Form 10 - K filed on September 29 , 2014 , or our other reports currently on file with the Securities and Exchange Commission, which contain a more detailed discussion of risks and uncertainties that may affect future results . We do not undertake to update any forward - looking statements unless otherwise required by law .
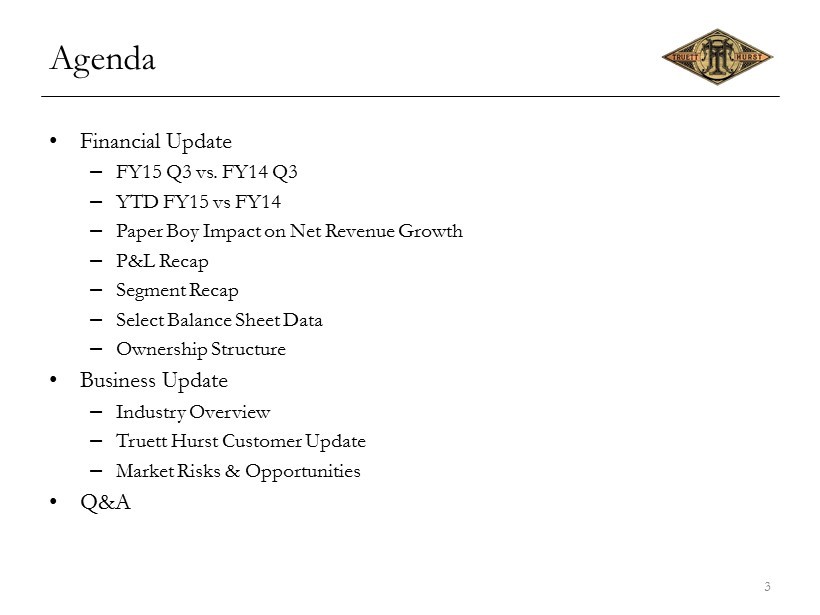
Agenda • Financial Update – FY15 Q3 vs. FY14 Q3 – YTD FY15 vs FY14 – Paper Boy Impact on Net Revenue Growth – P&L Recap – Segment Recap – Select Balance Sheet Data – Ownership Structure • Business Update – Industry Overview – Truett Hurst Customer Update – Market Risks & Opportunities • Q&A 3

FINANCIAL UPDATE 4
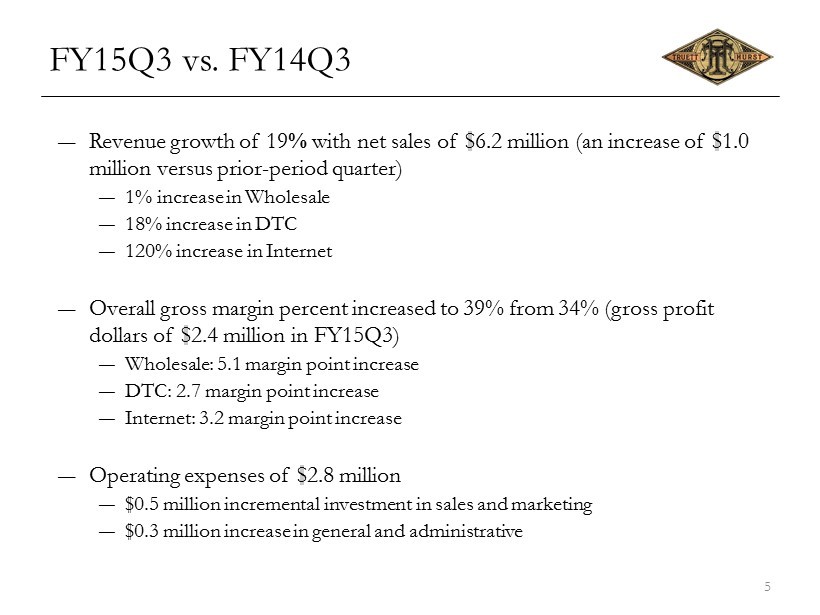
FY15Q3 vs. FY14Q3 ― Revenue growth of 19 % with net sales of $6.2 million (an increase of $1.0 million versus prior - period quarter) ― 1% increase in Wholesale ― 18% increase in DTC ― 120% increase in Internet ― Overall gross margin percent increased to 39% from 34% (gross profit dollars of $2.4 million in FY15Q3) ― Wholesale: 5.1 margin point increase ― DTC: 2.7 margin point increase ― Internet: 3.2 margin point increase ― Operating expenses of $2.8 million ― $0.5 million incremental investment in sales and marketing ― $0.3 million increase in general and administrative 5
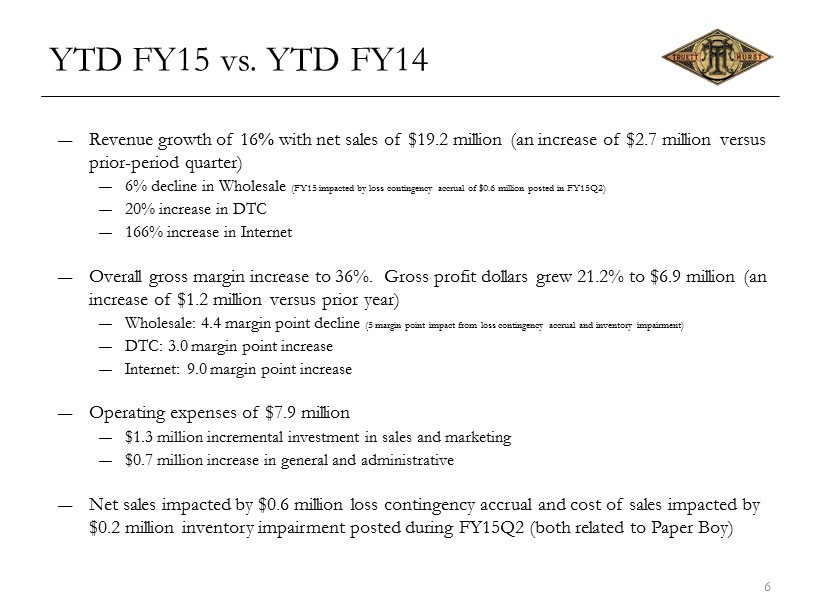
YTD FY15 vs. YTD FY14 ― Revenue growth of 16 % with net sales of $19.2 million (an increase of $2.7 million versus prior - period quarter) ― 6% decline in Wholesale (FY15 impacted by loss contingency accrual of $0.6 million posted in FY15Q2) ― 20% increase in DTC ― 166% increase in Internet ― Overall gross margin increase to 36%. Gross profit dollars grew 21.2% to $6.9 million (an increase of $1.2 million versus prior year) ― Wholesale: 4.4 margin point decline (5 margin point impact from loss contingency accrual and inventory impairment) ― DTC: 3.0 margin point increase ― Internet: 9.0 margin point increase ― Operating expenses of $7.9 million ― $1.3 million incremental investment in sales and marketing ― $0.7 million increase in general and administrative ― Net sales impacted by $0.6 million loss contingency accrual and cost of sales impacted by $0.2 million inventory impairment posted during FY15Q2 (both related to Paper Boy) 6
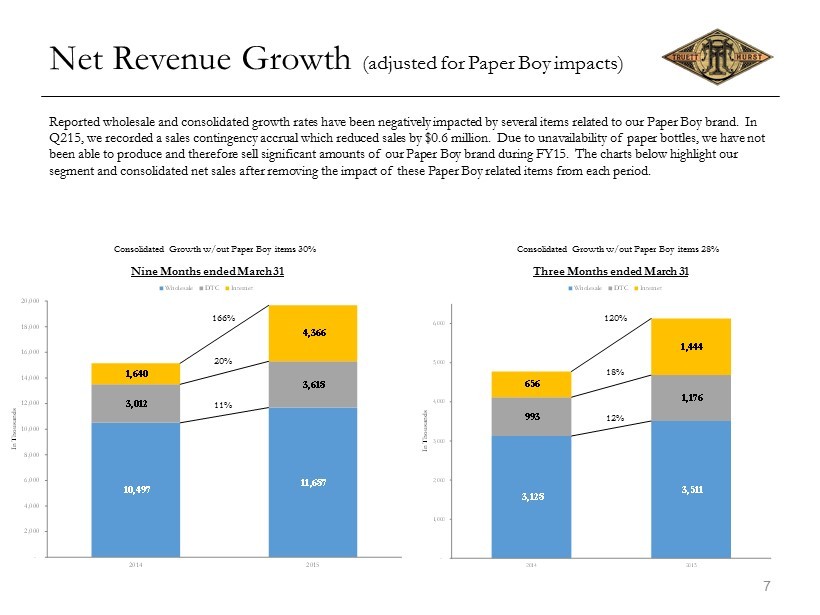
7 Net Revenue Growth (adjusted for Paper Boy impacts) Nine Months ended March 31 Three Months ended March 31 Reported wholesale and consolidated growth rates have been negatively impacted by several items related to our Paper Boy bran d. In Q215, we recorded a sales contingency accrual which reduced sales by $0.6 million. Due to unavailability of paper bottles, w e h ave not been able to produce and therefore sell significant amounts of our Paper Boy brand during FY15. The charts below highlight o ur segment and consolidated net sales after removing the impact of these Paper Boy related items from each period. 10,497 11,687 3,012 3,618 1,640 4,366 - 2,000 4,000 6,000 8,000 10,000 12,000 14,000 16,000 18,000 20,000 2014 2015 In Thousands Wholesale DTC Internet 3,128 3,511 993 1,176 656 1,444 - 1,000 2,000 3,000 4,000 5,000 6,000 2014 2015 In Thousands Wholesale DTC Internet 11% 12% 20% 166% 18% 120% Consolidated Growth w/out Paper Boy items 30% Consolidated Growth w/out Paper Boy items 28%
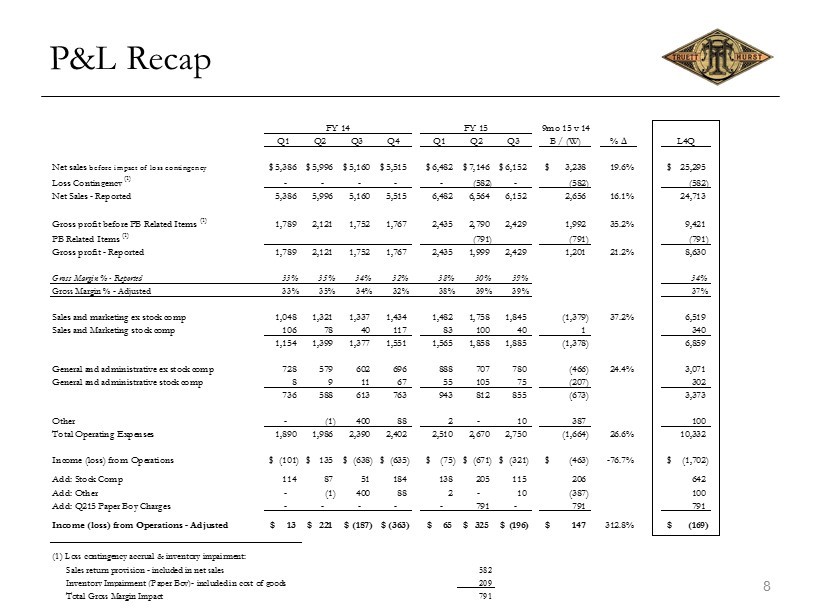
P&L Recap 8 FY 14 FY 15 9mo 15 v 14 Q1 Q2 Q3 Q4 Q1 Q2 Q3 B / (W) % L4Q Net sales before impact of loss contingency 5,386$ 5,996$ 5,160$ 5,515$ 6,482$ 7,146$ 6,152$ 3,238$ 19.6% 25,295$ Loss Contingency (1) - - - - - (582) - (582) (582) Net Sales - Reported 5,386 5,996 5,160 5,515 6,482 6,564 6,152 2,656 16.1% 24,713 Gross profit before PB Related Items (1) 1,789 2,121 1,752 1,767 2,435 2,790 2,429 1,992 35.2% 9,421 PB Related Items (1) (791) (791) (791) Gross profit - Reported 1,789 2,121 1,752 1,767 2,435 1,999 2,429 1,201 21.2% 8,630 Gross Margin % - Reported 33% 35% 34% 32% 38% 30% 39% 34% Gross Margin % - Adjusted 33% 35% 34% 32% 38% 39% 39% 37% Sales and marketing ex stock comp 1,048 1,321 1,337 1,434 1,482 1,758 1,845 (1,379) 37.2% 6,519 Sales and Marketing stock comp 106 78 40 117 83 100 40 1 340 1,154 1,399 1,377 1,551 1,565 1,858 1,885 (1,378) 6,859 General and administrative ex stock comp 728 579 602 696 888 707 780 (466) 24.4% 3,071 General and administrative stock comp 8 9 11 67 55 105 75 (207) 302 736 588 613 763 943 812 855 (673) 3,373 Other - (1) 400 88 2 - 10 387 100 Total Operating Expenses 1,890 1,986 2,390 2,402 2,510 2,670 2,750 (1,664) 26.6% 10,332 Income (loss) from Operations (101)$ 135$ (638)$ (635)$ (75)$ (671)$ (321)$ (463)$ -76.7% (1,702)$ Add: Stock Comp 114 87 51 184 138 205 115 206 642 Add: Other - (1) 400 88 2 - 10 (387) 100 Add: Q215 Paper Boy Charges - - - - - 791 - 791 791 Income (loss) from Operations - Adjusted 13$ 221$ (187)$ (363)$ 65$ 325$ (196)$ 147$ 312.8% (169)$ (1) Loss contingency accrual & inventory impairment: Sales return provision - included in net sales 582 Inventory Impairment (Paper Boy)- included in cost of goods 209 Total Gross Margin Impact 791
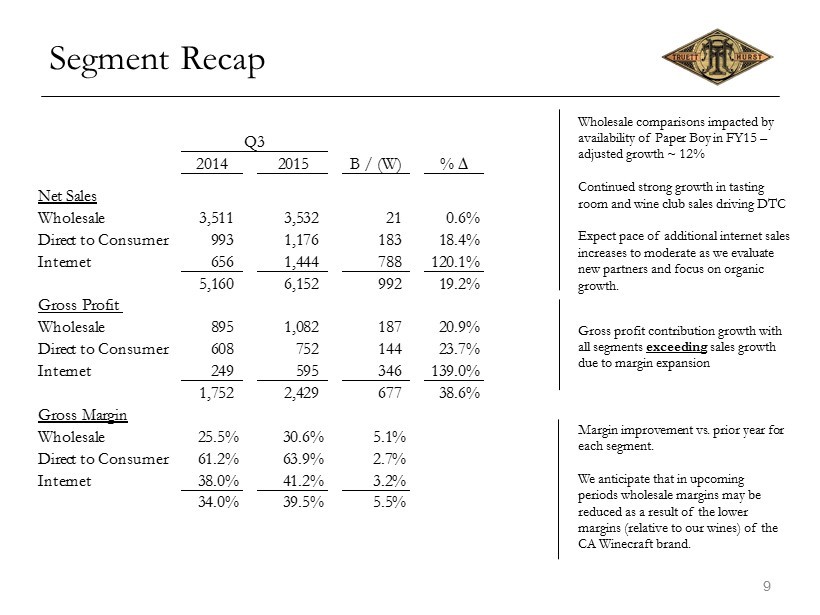
9 Segment Recap Gross profit contribution growth with all segments exceeding sales growth due to margin expansion Wholesale comparisons impacted by availability of Paper Boy in FY15 – adjusted growth ~ 12% Continued strong growth in tasting room and wine club sales driving DTC Expect pace of additional internet sales increases to moderate as we evaluate new partners and focus on organic growth. Q3 2014 2015 B / (W) % Net Sales Wholesale 3,511 3,532 21 0.6% Direct to Consumer 993 1,176 183 18.4% Internet 656 1,444 788 120.1% 5,160 6,152 992 19.2% Gross Profit Wholesale 895 1,082 187 20.9% Direct to Consumer 608 752 144 23.7% Internet 249 595 346 139.0% 1,752 2,429 677 38.6% Gross Margin Wholesale 25.5% 30.6% 5.1% Direct to Consumer 61.2% 63.9% 2.7% Internet 38.0% 41.2% 3.2% 34.0% 39.5% 5.5% Margin improvement vs. prior year for each segment. We anticipate that in upcoming periods wholesale margins may be reduced as a result of the lower margins (relative to our wines) of the CA Winecraft brand.
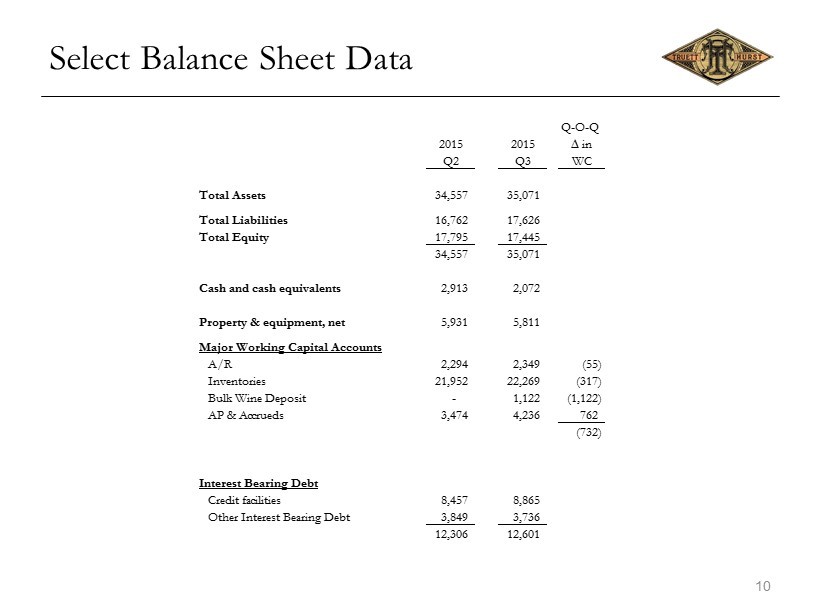
10 Select Balance Sheet Data Q-O-Q 2015 2015 in Q2 Q3 WC Total Assets 34,557 35,071 Total Liabilities 16,762 17,626 Total Equity 17,795 17,445 34,557 35,071 Cash and cash equivalents 2,913 2,072 Property & equipment, net 5,931 5,811 Major Working Capital Accounts A/R 2,294 2,349 (55) Inventories 21,952 22,269 (317) Bulk Wine Deposit - 1,122 (1,122) AP & Accrueds 3,474 4,236 762 (732) Interest Bearing Debt Credit facilities 8,457 8,865 Other Interest Bearing Debt 3,849 3,736 12,306 12,601
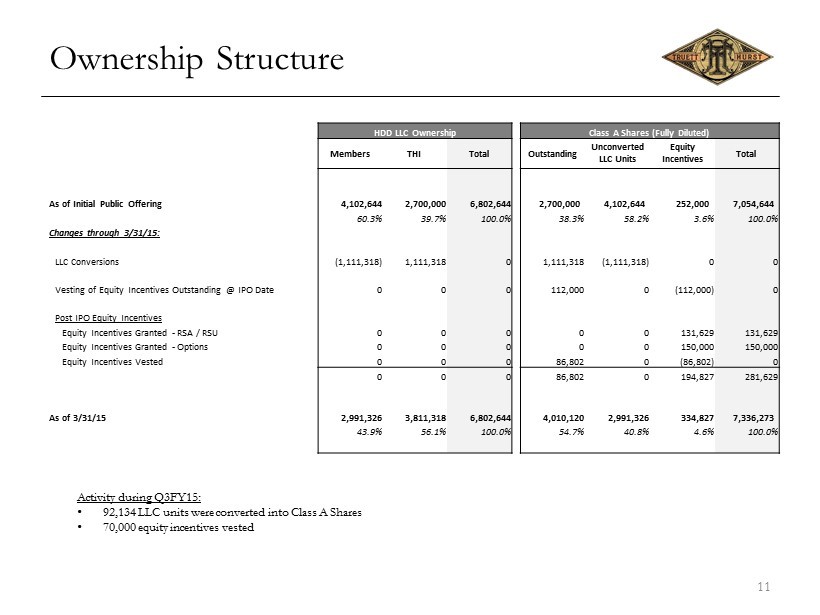
11 Ownership Structure Activity during Q3FY15: • 92,134 LLC units were converted into Class A Shares • 70,000 equity incentives vested HDD LLC Ownership Class A Shares (Fully Diluted) Members THI Total Outstanding Unconverted LLC Units Equity Incentives Total As of Initial Public Offering 4,102,644 2,700,000 6,802,644 2,700,000 4,102,644 252,000 7,054,644 60.3% 39.7% 100.0% 38.3% 58.2% 3.6% 100.0% Changes through 3/31/15: LLC Conversions (1,111,318) 1,111,318 0 1,111,318 (1,111,318) 0 0 Vesting of Equity Incentives Outstanding @ IPO Date 0 0 0 112,000 0 (112,000) 0 Post IPO Equity Incentives Equity Incentives Granted - RSA / RSU 0 0 0 0 0 131,629 131,629 Equity Incentives Granted - Options 0 0 0 0 0 150,000 150,000 Equity Incentives Vested 0 0 0 86,802 0 (86,802) 0 0 0 0 86,802 0 194,827 281,629 As of 3/31/15 2,991,326 3,811,318 6,802,644 4,010,120 2,991,326 334,827 7,336,273 43.9% 56.1% 100.0% 54.7% 40.8% 4.6% 100.0%

BUSINESS UPDATE 12
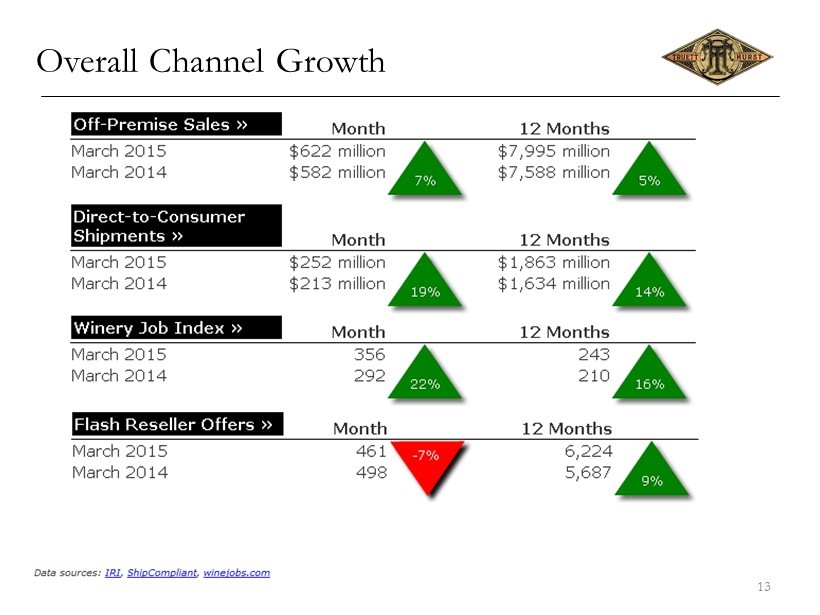
Overall Channel Growth 13
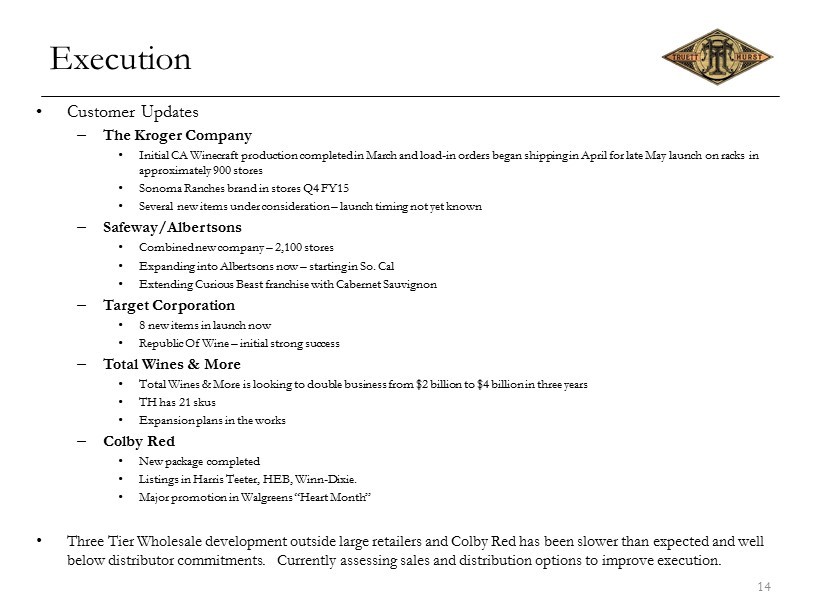
Execution • Customer Updates – The Kroger Company • Initial CA Winecraft production completed in March and load - in orders began shipping in April for late May launch on racks in approximately 900 stores • Sonoma Ranches brand in stores Q4 FY15 • Several new items under consideration – launch timing not yet known – Safeway/Albertsons • Combined new company – 2,100 stores • Expanding into Albertsons now – starting in So. Cal • Extending Curious Beast franchise with Cabernet Sauvignon – Target Corporation • 8 new items in launch now • Republic Of Wine – initial strong success – Total Wines & More • Total Wines & More is looking to double business from $2 billion to $4 billion in three years • TH has 21 skus • Expansion plans in the works – Colby Red • New package completed • Listings in Harris Teeter, HEB, Winn - Dixie. • Major promotion in Walgreens “Heart Month” • Three Tier Wholesale development outside large retailers and Colby Red has been slower than expected and well below distributor commitments. Currently assessing sales and distribution options to improve execution. 14
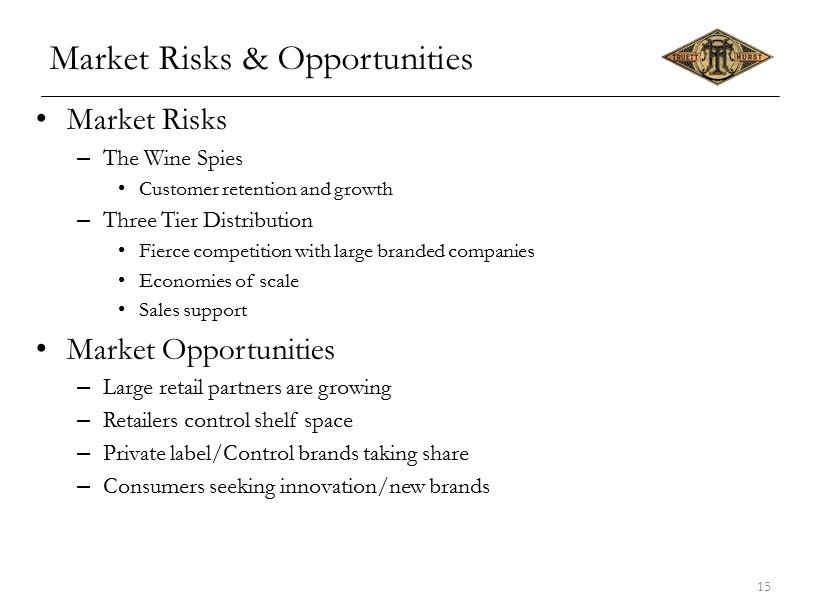
Market Risks & Opportunities • Market Risks – The Wine Spies • Customer retention and growth – Three Tier Distribution • Fierce competition with large branded companies • Economies of scale • Sales support • Market Opportunities – Large retail partners are growing – Retailers control shelf space – Private label/Control brands taking share – Consumers seeking innovation/new brands 15

Q & A 16
17 APPENDIX I. Contact Information II. Conference Call Playback Information III. Third Quarter and Nine - Month Fiscal 2015 Pro forma Diluted EPS & Market Cap
Appendix I - Contact Information 18 Phillip L. Hurst Chief Executive Officer, President Email: phil@truetthurst.com T: 707.431.4408 M: 707.318.7480 Paul A. Forgue Chief Financial Officer & Chief Operations Officer Email: paul@truetthurst.com T: 707.431.4423 M: 707.494.3452 www.truetthurstinc.com ir@truetthurstinc.com
Appendix II – Call Playback Information Webcast/PowerPoint/Replay available at: http://www.truetthurstinc.com/index.php?s=151&cat=3 Replay available until May 21, 2015. 19
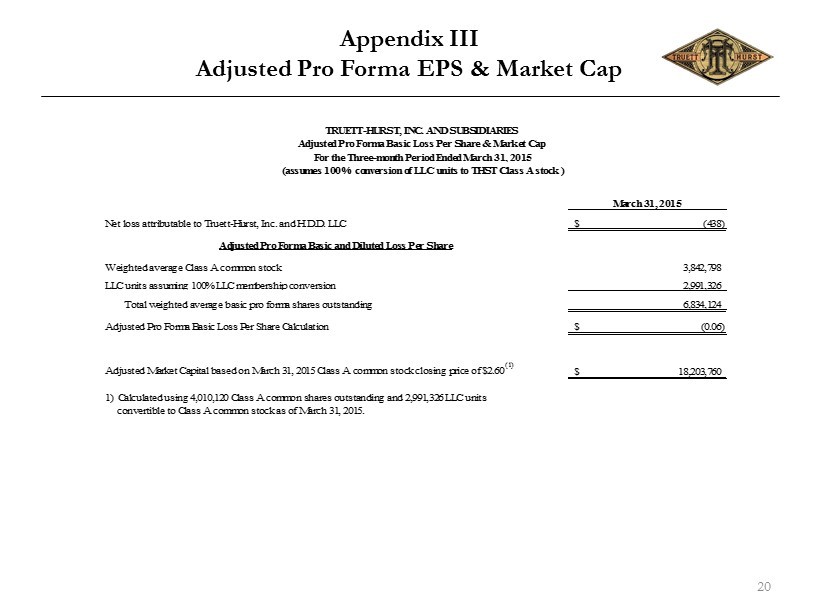
Appendix III Adjusted Pro Forma EPS & Market Cap March 31, 2015 Net loss attributable to Truett-Hurst, Inc. and H.D.D. LLC (438)$ Adjusted Pro Forma Basic and Diluted Loss Per Share Weighted average Class A common stock 3,842,798 LLC units assuming 100% LLC membership conversion 2,991,326 Total weighted average basic pro forma shares outstanding 6,834,124 Adjusted Pro Forma Basic Loss Per Share Calculation (0.06)$ Adjusted Market Capital based on March 31, 2015 Class A common stock closing price of $2.60 (1) 18,203,760$ 1) Calculated using 4,010,120 Class A common shares outstanding and 2,991,326 LLC units convertible to Class A common stock as of March 31, 2015. TRUETT-HURST, INC. AND SUBSIDIARIES Adjusted Pro Forma Basic Loss Per Share & Market Cap For the Three-month Period Ended March 31, 2015 (assumes 100% conversion of LLC units to THST Class A stock ) 20
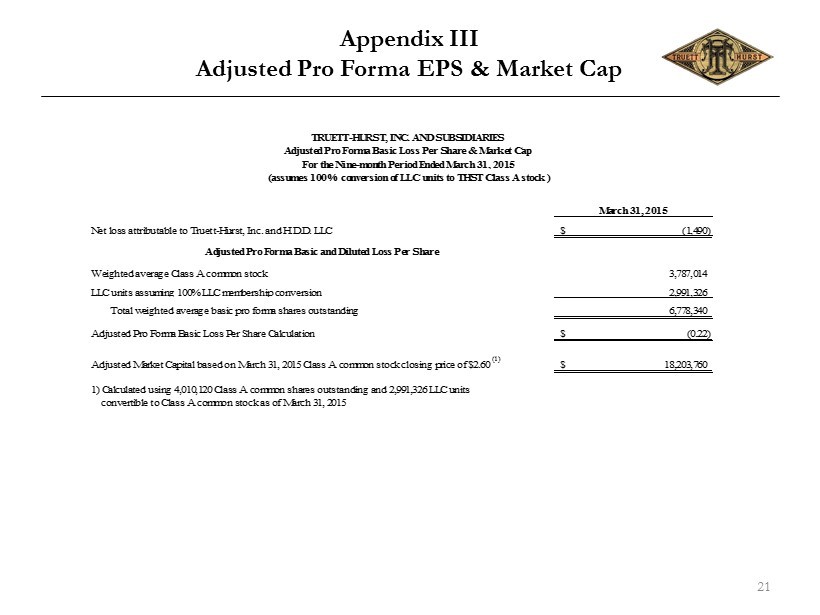
Appendix III Adjusted Pro Forma EPS & Market Cap March 31, 2015 Net loss attributable to Truett-Hurst, Inc. and H.D.D. LLC (1,490)$ Adjusted Pro Forma Basic and Diluted Loss Per Share Weighted average Class A common stock 3,787,014 LLC units assuming 100% LLC membership conversion 2,991,326 Total weighted average basic pro forma shares outstanding 6,778,340 Adjusted Pro Forma Basic Loss Per Share Calculation (0.22)$ Adjusted Market Capital based on March 31, 2015 Class A common stock closing price of $2.60 (1) 18,203,760$ 1) Calculated using 4,010,120 Class A common shares outstanding and 2,991,326 LLC units convertible to Class A common stock as of March 31, 2015 TRUETT-HURST, INC. AND SUBSIDIARIES Adjusted Pro Forma Basic Loss Per Share & Market Cap For the Nine-month Period Ended March 31, 2015 (assumes 100% conversion of LLC units to THST Class A stock ) 21