Attached files
| file | filename |
|---|---|
| 8-K - 8-K - Premier, Inc. | d923923d8k.htm |
| EX-99.1 - EX-99.1 - Premier, Inc. | d923923dex991.htm |
| EX-99.2 - EX-99.2 - Premier, Inc. | d923923dex992.htm |
 Third Quarter Fiscal 2015
Financial Results and Update
May 11, 2015
Exhibit 99.3 |
 2
©
2015 PREMIER, INC.
Forward-looking statements and Non-GAAP financial
measures |
 Susan DeVore, President & CEO
Overview and Business Update |
 4
©
2015 PREMIER, INC.
Third-quarter highlights
*
*See non-GAAP Adjusted EBITDA, Segment Adjusted EBITDA, and Adjusted Fully
Distributed Earnings Per Share reconciliations to GAAP equivalents in Appendix.
Strong overall financial performance
Total net revenue up 16% YoY, driven by double-digit
growth in both business segments
Adjusted EBITDA up 14% YoY
Adjusted fully distributed earnings per share of
$0.38 up 13% YoY
On track to achieve 99% GPO retention rate and 94%
SaaS institutional renewal rate for FY2015
Raising full-year guidance |
 5
©
2015 PREMIER, INC.
Third-quarter revenue growth drivers
Supply Chain Services revenue up 15%
»
Net administrative fees revenue up 9.1%
»
Products revenue up 25%
Performance Services revenue up 19%
»
Continued growth of PremierConnect
Saas-based subscriptions and renewals,
and growth in Advisory Services
»
Finished quarter with solid bookings &
strong sales pipeline |
 6
©
2015 PREMIER, INC.
Addressing member needs for continuous improvement
Manage
Populations
Improve
Quality and Safety
Reduce
Costs
BILLING
PURCHASING
CLAIMS
CLINICAL
FINANCIAL
Combines People, Process, and Technology |
 7
©
2015 PREMIER, INC.
Medicare payment reform –
a watershed event
Payment reform rewarding value, promoting
population health and discouraging fee-for-service
»
»
Bill permanently reforms the Medicare physician
payment system (Sustainable Growth Rate formula)
»
Alters the economic incentives in market, pushing
providers to embrace population health and risk-based
contracts for cost and quality outcomes
We believe Premier is well positioned to lead health
systems through this transformation
Congress passes Medicare Access and
CHIP
Reauthorization Act of 2015 (MACRA) |
 8
©
2015 PREMIER, INC.
Recognized leader in population health management
Premier Population Health Management Advisory
Services ranked #1 by KLAS
The PACT Population Health Collaborative
is the model for integrated care delivery,
bringing together approx. 400 hospitals in
30 states
The Bundled Payment Collaborative works
to reduce the cost of an episode of care,
improve patient outcomes and redesign
care delivery with approximately 120
hospitals in 27 states
Pioneered data-driven performance improvement
collaboratives and technologies focused on
accountable care organizations and alternate
payment models |
 Michael Alkire, Chief Operating Officer
Operations Update |
 10
©
2015 PREMIER, INC.
A platform for continuous performance improvement
Manage
Populations
Improve
Quality and Safety
Reduce
Costs
BILLING
PURCHASING
CLAIMS
CLINICAL
FINANCIAL
Combines People, Process, and Technology |
 11
©
2015 PREMIER, INC.
Third-quarter Supply Chain Services revenue
Supply Chain Services revenue
increased 15%
»
»
Expanding contract penetration in
both acute and alternate site
»
Continuing impact of the
recruitment and conversion of new
members
»
Improved utilization trends
»
Timing of cash receipts
»
»
Ongoing member support for direct
sourcing and specialty pharmacy
businesses
$108.1
$118.0
$58.7
$73.4
3Q'14
3Q'15
Net Admin Fees
Products
Other Services and Support
15%
$167.0
$192.1
Supply Chain Services
Net revenue
(millions)
GPO net admin fees revenue
increased 9.1%
Products revenue increased 25% |
 12
©
2015 PREMIER, INC.
High-growth Supply Chain Products businesses
Direct sourcing
»
Helping our members
achieve significant savings
on basic commodity products
Specialty pharmacy
»
Helping our members
manage chronic, high-cost
patients in a population
health environment
$ 58.7
$ 73.4
3Q'14
3Q'15
Supply Chain Products
Net revenue
(millions)
25% |
 13
©
2015 PREMIER, INC.
A platform for continuous performance improvement
Manage
Populations
Improve
Quality and Safety
Reduce
Costs
BILLING
PURCHASING
CLAIMS
CLINICAL
FINANCIAL
Combines People, Process, and Technology |
 14
©
2015 PREMIER, INC.
Supply
Analytics
Sourcing &
Contract
Management
Catalog
Management
ERP / Materials
Management
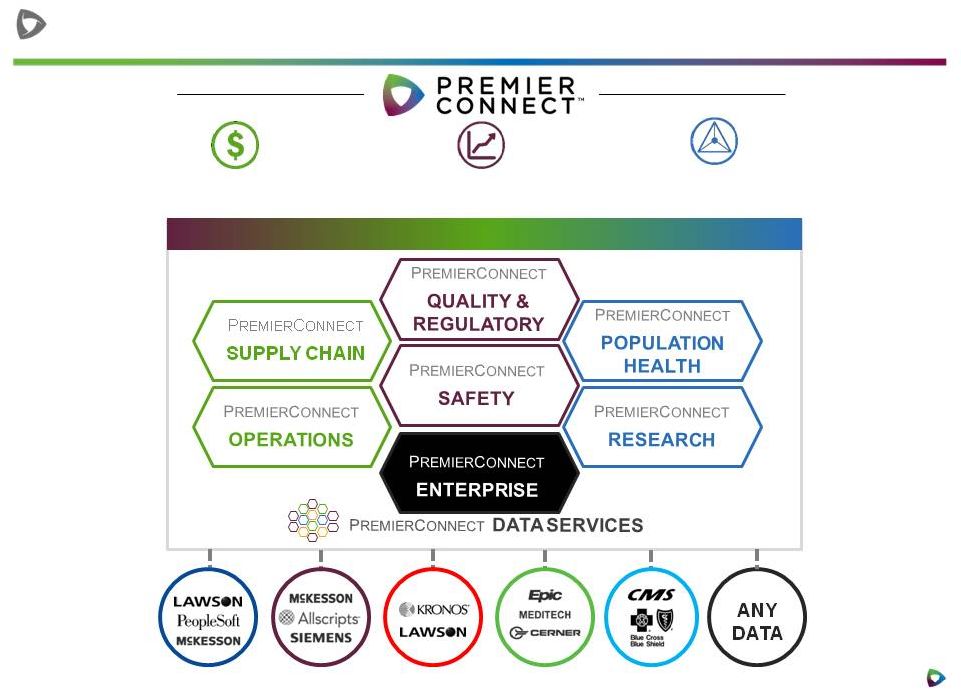
PREMIERCONNECT
SUPPLY CHAIN
PremierConnect
®
Supply Chain
Supply Chain Workflow
Plan
Source
Contract
Buy
Receive
Pay
Manage |
 15
©
2015 PREMIER, INC.
Supply
Analytics
Complete Visibility
Categorize ALL
transactions
Contract Optimization
Identify trends and
variation
Actionable Information
Understand Why spend
is changing
Sourcing &
Contract
Management
Optimize & Manage
GPO, regional and local
contracts
Source of Truth
Right product, right time,
best price
Data Integration
Insights across all
your facilities
Catalog
Management
Drive Standardization
Cleanse, standardize &
control item master
Customized Catalog
Supports your
standards across acute
& non-acute
Price Accuracy
Maintains pricing
across multiple ERPs
ERP / Materials
Management
Manage Process
Supply chain &
operations
End to End
Procurement
Financial, Fixed Assets &
Purchasing
Flexible & Scalable
Cloud
based
–
connect
your growing facilities
Technology enabled supply chain |
 16
©
2015 PREMIER, INC.
Expanding Population Health Advisory Services relationships
Innovate
Health
Alliance
–
Albany
NY
North
Shore-LIJ
Health
System
–
New
York
LifeBridge
Health
–
Baltimore |
 17
©
2015 PREMIER, INC.
SYMMEDRx providing solutions for physician preference
Physician
preference contract
management and
data services
Partnership with large academic member
health system delivers savings of ~24% on
medical devices related to just one disease
state
Three-year agreement with Greater New York
Hospital Association to provide comprehensive
data analysis and consultative support to drive
savings across all disease states |
 Craig McKasson, Chief Financial Officer
Financial Review |
 19
©
2015 PREMIER, INC.
the
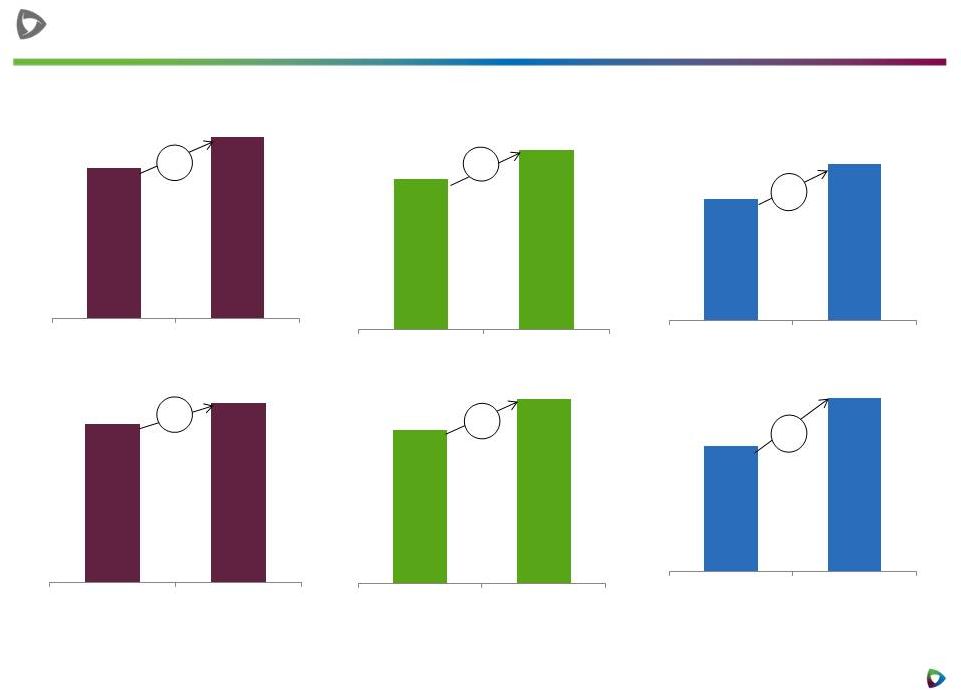
Third-quarter consolidated and segment highlights
*
Consolidated
Net revenue (millions)
Supply Chain Services
Net revenue (millions)
Performance Services
Net revenue (millions)
Adjusted
EBITDA
(millions)
Adjusted EBITDA (millions)
Adjusted EBITDA (millions)
*See
non-GAAP
Adjusted
EBITDA
and
non-GAAP
Segment
Adjusted
EBITDA
reconciliations
to
GAAP
equivalents
in
Appendix.
16%
15%
19%
14%
11%
29%
$20.3
$26.2
3Q'14
3Q'15
$91.3
$103.7
3Q'14
3Q'15
$58.6
$69.6
3Q'14
3Q'15
$91.5
$101.6
3Q'14
3Q'15
$167.0
$192.1
3Q'14
3Q'15
$225.6
$261.7
3Q'14
3Q'15 |
 20
©
2015 PREMIER, INC.
Third-quarter Supply Chain Services revenue
Supply Chain Services revenue
increased 15%
»
GPO net admin fees revenue
increased 9.1%
»
Expanding contract penetration in
both acute and alternate site
»
Continuing impact of the
recruitment and conversion of new
members
»
Improved utilization trends
»
Timing of cash receipts
»
Products revenue increased 25%
»
Ongoing member support for direct
sourcing and specialty pharmacy
businesses
$58.7
$73.4
3Q'14
3Q'15
Net Admin Fees
Products
Other Services and Support
15%
$167.0
$192.1
Supply Chain Services
Net
revenue
(millions)
$108.1
$118.0 |
 21
©
2015 PREMIER, INC.
Third-quarter Performance Services revenue
»
Performance Services revenue
increased 19%
»
Continued growth of PremierConnect
SaaS-based subscriptions and
renewals
»
Continued growth of Advisory
Services led by engagements tied to:
»
Cost management
»
Population health
»
Physician preference
»
Capital equipment planning
$58.6
$69.6
3Q'14
3Q'15
19%
Performance Services
Net
revenue
(millions) |
 22
©
2015 PREMIER, INC.
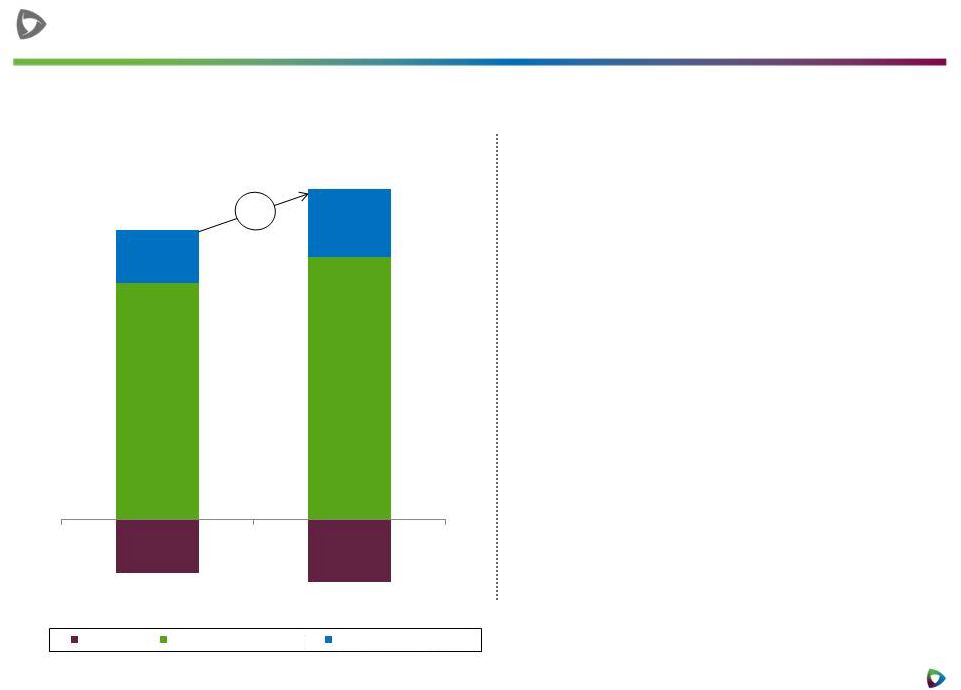
Third-quarter adjusted EBITDA*
Consolidated adjusted EBITDA
increased 14%
»
»
Strong net admin fee revenue
growth
»
Expanding direct sourcing
activities
»
»
New PremierConnect SaaS-based
subscription sales
»
Contribution from Aperek and
Theradoc acquisitions
»
Effective management of operating
expenses
Supply Chain Services adjusted
EBITDA increased 11%
Performance Services adjusted
EBITDA increased 29%
($20.5)
($24.0)
$91.5
$101.6
$20.3
$26.2
3Q'14
3Q'15
Corporate
Supply Chain Services
Performance Services
14%
Adjusted EBITDA
(millions)
$91.3
$103.7
* See non-GAAP adjusted fully distributed net income and non-GAAP earnings per share on
fully distributed net income reconciliations to GAAP equivalents in Appendix |
 23
©
2015 PREMIER, INC.
Third-quarter non-GAAP adjusted fully distributed net
income*
$0.34
$0.38
Non-GAAP earnings per share on adjusted fully
distributed net income –
diluted
»
Calculates income taxes at
40% on pre-tax income,
assuming taxable C corporate
structure
»
Calculates adjusted fully
distributed earnings per
share, assuming total Class A
and B common shares held
by public
$49.1
$55.3
3Q'14
3Q'15
(in millions, except per share data)
13%
* See non-GAAP adjusted fully distributed net income and non-GAAP earnings per share on
fully distributed net income reconciliations to GAAP equivalents in Appendix |
 24
©
2015 PREMIER, INC.
Cash flow and capital flexibility at March 31, 2015
CONSIDERABLE CASH AND
DEBT CAPACITY
AVAILABLE
AMPLE CAPITAL
FLEXIBILITY FOR FUTURE
ACQUISITIONS AND
BUSINESS GROWTH
*Three
months
ended
March
31,
2015.
Company
defines
free
cash
flow
as
cash
provided
by
operating
activities
less
distributions
to
limited
partners
and
purchases of property and equipment. See non-GAAP free cash flow
reconciliation to GAAP equivalent in Appendix. Year-to-date cash flow
from operations of $255.6 million
Third-quarter free cash flow of $59.5 million
*
Cash, cash equivalents & marketable securities
of $503.3 million
No outstanding borrowings on $750 million five-
year unsecured revolving credit facility |
 25
©
2015 PREMIER, INC.
Fiscal 2015 annual guidance*
*
Guidance is based on comparisons with prior-year non-GAAP pro forma
results, which have been adjusted to reflect the impact of the company’s reorganization and IPO. The
Company does not reconcile guidance for adjusted EBITDA and non-GAAP adjusted
fully distributed net income per-share to net income (loss) or GAAP earnings per share
because the Company does not provide guidance for reconciling items between net
income (loss) and adjusted EBITDA and non-GAAP adjusted fully distributed earnings per
share. The Company is unable to provide guidance for these reconciling items since
certain items that impact net income (loss) are outside of the Company’s control and cannot be
reasonably predicted. Accordingly, a reconciliation to net income (loss) or GAAP
earnings per share is not available without unreasonable effort. Financial
guidance for year ending June 30, 2015: »
6%-7% net administrative fee revenue growth
»
27%-32% product revenue growth
»
Continued high GPO retention rates
Guidance Assumptions:
»
Continued demand for integrated offerings of SaaS-based
subscription and licensed products, advisory services and
collaboratives
»
Continuation of high SaaS institutional renewal rates
Updated
Pro Forma
Previous
(in millions, except per share data)
FY 2015
% YoY Change
FY 2015
Net Revenue:
Supply Chain Services segment
$720.0 -
$733.0
13% -
15%
$706.0 -
$725.0
Performance Services segment
$268.0 -
$275.0
15% -
18%
$268.0 -
$275.0
Total Net Revenue
$988.0 -
$1008.0
14% -
16%
$974.0 -
$1000.0
Non-GAAP adjusted EBITDA
$384.0 -
$392.0
9% -
12%
$382.0 -
$390.0
Non-GAAP adjusted fully distributed EPS
$1.40 -
$1.44
8% -
11%
$1.40 -
$1.44
Premier, Inc. updates full-year fiscal 2015 financial guidance, as
follows: Fiscal 2015 Financial Guidance
Supply Chain Services growth driven by:
Performance Services growth driven by: |
 26
©
2015 PREMIER, INC.
Exchange update
On April 30, 2015, approximately 276,000
Class B units were exchanged for Class A
common shares on 1-for-1 basis; equal
number of Class B common shares retired
Next exchange on July 31, 2015 |
 27
©
2015 PREMIER, INC.
Targeted and disciplined acquisition strategy
We expect acquisitions to play major role in
providing solutions for member health systems
to thrive in the healthcare environment of
tomorrow
»
Evaluating multiple opportunities
»
Seeking innovative and unique solutions
»
Employing well-defined, diligent process
»
Continue to evaluate all types of acquisitions,
from strategic tuck-ins to transformational |
 Questions |
 Appendix |
 30
©
2015 PREMIER, INC.
Year-to-date nine-month financial highlights
*
Consolidated
Supply Chain Services
Net revenue (millions)
Performance Services
Net revenue (millions)
Adjusted
EBITDA
(millions)
Adjusted EBITDA (millions)
Adjusted EBITDA (millions)
*Comparisons are with year-ago non-GAAP pro forma information that reflects
the impact of the company’s reorganization and initial public offering.
See Adjusted EBITDA, Segment Adjusted EBITDA and Adjusted Fully Distributed Net
Income reconciliations to GAAP equivalents in Appendix. $633.8
$740.5
$464.1
$542.0
$169.8
$198.4
$257.8
$293.1
3Q'14
3Q'15
$260.8
$290.2
3Q'14
3Q'15
$54.4
$67.7
3Q'14
3Q'15
3Q'14
3Q'15
3Q'14
3Q'15
3Q'14
3Q'15
17%
17%
14%
17%
11%
25%
Consolidated
Net revenue (millions) |
 31
©
2015 PREMIER, INC.
Fiscal 2015 and fiscal 2014 non-GAAP reconciliations
2015*
2014*
2015*
2014
Reconciliation of Pro Forma Net Revenue to Net Revenue:
Pro Forma Net Revenue
261,723
$
225,598
$
740,476
$
633,820
$
Pro forma adjustment for revenue share post-IPO
—
—
—
41,263
Net Revenue
261,723
$
225,598
$
740,476
$
675,083
$
Net income
72,029
$
101,980
$
202,724
$
265,985
$
Pro forma adjustment for revenue share post-IPO
—
—
—
(41,263)
Interest and investment income, net
(204)
(400)
(517)
(641)
Income tax expense
2,026
9,413
12,107
24,461
Depreciation and amortization
11,538
9,396
33,107
26,952
Amortization of purchased intangible assets
2,554
802
6,598
2,158
EBITDA
87,943
121,191
254,019
277,652
Stock-based compensation
7,285
6,299
21,129
13,118
Acquisition related expenses
2,863
984
6,408
1,303
Strategic and financial restructuring expenses
2
733
1,281
3,614
Loss (gain) on investment
1,000
(37,850)
1,000
(37,850)
Adjustment to tax receivable agreement liability
1,073
—
—
—
Acquisition related adjustment -
deferred revenue
3,563
—
9,224
—
Other expense (income), net
16
(52)
10
(56)
Adjusted EBITDA
103,745
$
91,305
$
293,071
$
257,781
$
Segment Adjusted EBITDA:
Supply Chain Services
101,600
$
91,477
$
290,210
$
302,076
$
Pro forma adjustment for revenue share post-IPO
—
—
—
(41,263)
Supply Chain Services
(including pro forma adjustment)
101,600
$
91,477
$
290,210
$
260,813
$
Performance Services
26,166
20,307
67,717
54,367
Corporate
(24,021)
(20,479)
(64,856)
(57,399)
Adjusted EBITDA
103,745
$
91,305
$
293,071
$
257,781
$
Depreciation and amortization
(11,538)
(9,396)
(33,107)
(26,952)
Amortization of purchased intangible assets
(2,554)
(802)
(6,598)
(2,158)
Stock-based compensation
(7,285)
(6,299)
(21,129)
(13,118)
Acquisition related expenses
(2,863)
(984)
(6,408)
(1,303)
Strategic and financial restructuring expenses
(2)
(733)
(1,281)
(3,614)
Adjustment to tax receivable agreement liability
(1,073)
—
—
—
Acquisition related adjustment -
deferred revenue
(3,563)
—
(9,224)
—
Equity in net income of unconsolidated affiliates
(5,197)
(3,566)
(14,812)
(12,171)
Deferred compensation plan (income) expense
(759)
—
209
—
68,911
69,525
200,721
198,465
Pro forma adjustment for revenue share post-IPO
—
—
—
41,263
Operating income
68,911
$
69,525
$
200,721
$
239,728
$
Equity in net income of unconsolidated affiliates
5,197
3,566
14,812
12,171
Interest and investment income, net
204
400
517
641
(Loss) gain on investment
(1,000)
37,850
(1,000)
37,850
Other income (expense), net
743
52
(219)
56
Income before income taxes
74,055
$
111,393
$
214,831
$
290,446
$
Three Months Ended
March 31,
Nine Months Ended
March 31,
Supplemental Financial Information -
Reporting of Pro Forma Adjusted EBITDA
(Unaudited)
(In thousands)
Reconciliation of Selected Non-GAAP Measures to GAAP Measures
and Non-GAAP Adjusted Fully Distributed Net Income
Reconciliation of Net Income to Adjusted EBITDA and Reconciliation of
Segment Adjusted EBITDA to Income Before Income Taxes: * Note
that no pro forma adjustments were made for the three and nine months ended March 31, 2015 and the three months
ended March 31, 2014; as such, actual results are presented for each of
these periods. |
 32
©
2015 PREMIER, INC.
Fiscal 2015 and fiscal 2014 non-GAAP reconciliations
2015*
2014*
2015*
2014
Reconciliation of Non-GAAP Pro Forma Adjusted Fully Distributed Net
Income: Net income attributable to shareholders
12,209
$
13,525
$
30,753
$
19,453
$
Pro forma adjustment for revenue share post-IPO
—
—
—
(41,263)
Income tax expense
2,026
9,413
12,107
24,461
Stock-based compensation
7,285
6,299
21,129
13,118
Acquisition related expenses
2,863
984
6,408
1,303
Strategic and financial restructuring expenses
2
733
1,281
3,614
Loss (gain) on investment
1,000
(37,850)
1,000
(37,850)
Adjustment to tax receivable agreement liability
1,073
—
—
—
Acquisition related adjustment -
deferred revenue
3,563
—
9,224
—
Amortization of purchased intangible assets
2,554
802
6,598
2,158
Net income attributable to noncontrolling interest in Premier LP
59,568
87,925
170,135
246,055
Non-GAAP pro forma adjusted fully distributed income before income
taxes 92,143
81,831
258,635
231,049
Income tax expense on fully distributed income before income
taxes 36,857
32,732
103,454
92,420
Non-GAAP Pro Forma Adjusted Fully Distributed Net Income
55,286
$
49,099
$
155,181
$
138,629
$
*
Note
that
no
pro
forma
adjustments
were
made
for
the
three
and
nine
months
ended
March
31,
2015
and
the
three
months
ended
March
31,
2014; as such, actual results are presented for each of these
periods. Three Months Ended
March 31,
Nine Months Ended
March 31,
(Unaudited)
(In thousands)
Reconciliation of Selected Non-GAAP Measures to GAAP Measures
and Non-GAAP Adjusted Fully Distributed Net Income
Supplemental Financial Information - Reporting of Pro Forma Adjusted
EBITDA |
 33
©
2015 PREMIER, INC.
Fiscal 2015 and fiscal 2014 non-GAAP reconciliations
2015
2014
Reconciliation of Non-GAAP Free Cash Flow to Net Cash Provided by
Operating Activities: Net cash provided by operating
activities 101,860
$
90,173
$
Purchases of property and equipment
(18,653)
(13,823)
Distributions to limited partners
(23,701)
(17,419)
Non-GAAP free cash flow
59,506
$
58,931
$
Non-GAAP Adjusted EBITDA
103,745
$
91,305
$
Supplemental Financial Information -
Reporting of Non-GAAP Free Cash Flow
Reconciliation of Selected Non-GAAP Measures to GAAP Measures
(Unaudited)
(In thousands)
Three Months Ended
March 31, |
 34
©
2015 PREMIER, INC.
Fiscal 2015 and fiscal 2014 non-GAAP reconciliations
2015*
2014*
2015*
2014
Reconciliation of numerator for GAAP EPS to Non-GAAP EPS on Adjusted
Fully Distributed Net Income Net income (loss) attributable to
shareholders after adjustment of redeemable limited partners'
capital to redemption amount (374,853)
$
509,239
$
(781,216)
$
(3,204,645)
$
Adjustment of redeemable limited partners' capital to redemption
amount
387,062
(495,714)
811,969
3,224,098
Net income attributable to shareholders
12,209
13,525
30,753
19,453
Pro forma adjustment for revenue share post-IPO
—
—
—
(41,263)
Income tax expense
2,026
9,413
12,107
24,461
Stock-based compensation
7,285
6,299
21,129
13,118
Acquisition related expenses
2,863
984
6,408
1,303
Strategic and financial restructuring expenses
2
733
1,281
3,614
Loss (gain) on investment
1,000
(37,850)
1,000
(37,850)
Adjustment to tax receivable agreement liability
1,073
—
—
—
Acquisition related adjustment -
deferred revenue
3,563
—
9,224
—
Amortization of purchased intangible assets
2,554
802
6,598
2,158
Net income attributable to noncontrolling interest in Premier LP
59,568
87,925
170,135
246,055
Non-GAAP pro forma adjusted fully distributed income before income
taxes 92,143
81,831
258,635
231,049
Income tax expense on fully distributed income before income
taxes 36,857
32,732
103,454
92,420
Non-GAAP pro forma adjusted fully distributed net income
55,286
$
49,099
$
155,181
$
138,629
$
Reconciliation of denominator for GAAP EPS to Non-GAAP Adjusted Fully
Distributed Net Income Weighted Average:
Common shares used for basic and diluted earnings per share
37,316
32,375
35,066
23,394
Potentially dilutive shares
1,148
181
845
100
Class A common shares outstanding
-
-
-
8,981
Conversion of Class B common units
106,706
112,608
109,184
112,608
Weighted average fully distributed shares outstanding -
diluted
145,170
145,164
145,095
145,083
Reconciliation of GAAP EPS to Adjusted Fully Distributed EPS
GAAP earnings (loss) per share
$
(10.05) $
15.73 $
(22.28) $
(136.99) Impact of adjustment of redeemable limited partners'
capital to redemption amount
$
10.37 $
(15.31)
$ 23.16
$ 137.82
Impact of additions:
Pro forma adjustment for revenue share post-IPO
$
-
$
-
$
-
$
(1.76) Income tax expense
$
0.05
$
0.29
$
0.35
$
1.05 Stock-based compensation
$
0.20
$
0.19
$
0.60
$
0.56 Acquisition related expenses
$
0.08
$
0.03
$
0.18
$
0.06 Strategic and financial restructuring expenses
$
0.00
$
0.02
$
0.04
$
0.15 Loss (gain) on investment
$
0.03
$
(1.17)
$
0.03
$
(1.62) Adjustment to tax receivable agreement liability
$
0.03
$
-
$
-
$
- Acquisition related
adjustment - deferred revenue
$
0.10
$
-
$
0.26
$
- Amortization of purchased
intangible assets
$
0.07
$
0.02
$
0.19
$
0.09 Net income attributable to noncontrolling interest in
Premier LP
$
1.60
$
2.72
$
4.85
$ 10.52
Impact of corporation taxes
$
(0.99)
$
(1.01)
$
(2.95)
$
(3.95) Impact of increased share count
$
(1.11)
$
(1.17)
$
(3.36)
$
(4.97) Non-GAAP earnings per share on adjusted fully
distributed net income -
diluted
$
0.38
$ 0.34
$
1.07
$
0.96
Three Months Ended
March 31,
Nine Months Ended
March 31,
(Unaudited)
(In thousands, except per share data)
Reconciliation of Selected Non-GAAP Measures to GAAP Measures
* Note that no pro forma adjustments were made for the three and nine
months ended March 31, 2015 and the three months ended March 31,
2014; as such, actual results are presented for each of these periods.
Supplemental Financial Information - Reporting of Net Income and
Earnings Per Share |