Attached files
| file | filename |
|---|---|
| 8-K - FORM 8-K - HEMISPHERE MEDIA GROUP, INC. | eh1500634_8k.htm |
EXHIBIT 99.1

Investor Presentation May 2015

2 2 2 Forward - Looking Statements This presentation may contain certain statements about Hemisphere Media Group, Inc. (“Hemisphere”) that do not directly or exclusively relate to historical facts. These statements are “forward - looking statements” within the meaning of the U.S. Private Securities Litigation Reform Act of 1995. Without limitation, any statements preceded or followed by or that include the words “targets,” “plans,” “believes,” “expects,” “intends,” “will,” “likely,” “may,” “anticip ate s,” “estimates,” “projects,” “should,” “would,” “expect,” “positioned,” “strategy,” “future,” or words, phrases or terms of similar substance or the negative thereof, are forward - looking statements. These statements are based on the current expectations of the management of Hemisphere and are subject to uncertainty and changes in circumstance and involve r isk s and uncertainties that could cause actual results to differ materially from those expressed or implied in such forward - looking statements. In addition, these statements are based on a number of assumptions that are subject to change. Such risks, uncertainties and assumptions include: (1) risks relating to any unforeseen liabilities of Hemis phere and the assets acquired in the acquisition of Media World, LLC’s Spanish - language television network business (the “Acquired Cable Networks”); (2) future capital expenditures, expenses, revenues, earnings, synergies, economic performance, indebtedness, financial condition, losses and future prospects, businesses and management strategies an d t he expansion and growth of the operations of Hemisphere; (3) Hemisphere’s ability to successfully integrate the Acquired Cable Networks and achieve anticipated synergies; (4) the risk that disruptions from the transaction will harm Hemisphere’s business; and (5) Hemisphere’s, plans, objectives, expectations and intentions generally. Ad ditionally, factors that could cause actual results to differ materially from those expressed or implied by the forward - looking statements are discussed under the heading “Risk Fac tors” and “Forward - Looking Statements” in Hemisphere’s most recent Annual Report on Form 10 - K filed with the Securities and Exchange Commission (“SEC ”), as they may be updated in any future reports filed with the SEC. Forward - looking statements included herein are made as of the date hereof, and Hemisphere does not undertake any obligation to update publicly such statements to reflect subsequent events or circumstances. DISCLAIMER The information contained in this presentation is being provided for your convenience and information only . Our Annual Reports on Form 10 - K, Quarterly Reports on Form 10 - Q, Current Reports on Form 8 - K and amendments to reports filed pursuant to Sections 13(a) and 15(d) of the Securities Exchange Act of 1934, as amended (the "Exchange Act") are made available free of charge on or through our website at www.hemispheretv.com as soon as reasonably practicable after suc h reports are filed with, or furnished to, the SEC. The information on our website is not, and shall not be deemed to be, or incorporated into any other filings we make with the SEC. You may read and copy any materials we file with the SEC at the SEC’s Public Reference Room at 100 F Street, NE, Washington, DC 20549. You may obtain information on the operation of the Public Re fer ence Room by calling the Commission at 1 - 800 - SEC - 0330. The SEC also maintains a website that contains our reports, proxy statements a nd other information at www.sec.gov. Hemisphere assumed no duty to update or revised the information contained in this presentation and the information presented herein is h ist orical and may not be updated for recent events. You may not reproduce the information in this presentation . TRADEMARKS This document may contain registered and unregistered trademarks, service marks and copyrights of Hemisphere’s television net wo rks, Cinelatino, WAPA America, WAPA, Pasiones, Centroamerica TV and TV Dominicana and their affiliates, as well as trademarks, service marks and copyrights of thi rd parties. All brand names, trademarks, service marks and copyrights appearing in this document are the property of their respective holders. RECONCILIATION OF GAAP TO NON - GAAP FINANCIAL MEASURES In addition to financial information presented in accordance with U.S. GAAP, Hemisphere has presented the non - GAAP financial me asure Adjusted EBITDA. Management uses this measure to assess the operating results and performance of the business, perform analytical comparisons and identify str ate gies to improve performance. Hemisphere believes Adjusted EBITDA is relevant to investors because it allows them to analyze the operating performance of each busines s u sing the same metrics used by management. When presenting Adjusted EBITDA, Hemisphere’s management adds back (deducts) from net income, if any, depreciation expense, amortization of intangibles, loss (ga in) on disposition of assets, non - recurring expenses, income tax expense, interest expense, loss on early extinguishment of debt and st ock - based compensation. Hemisphere believes that this non - GAAP presentation is important to investors’ understanding of our businesses. A reconciliation of this measure to GAAP can be found in the Appendix hereto.

Introduction

4 4 4 Company Overview Only publicly - traded pure - play U.S. media company targeting the fast growing and highly attractive U.S. Hispanic and Latin American markets Unique portfolio of assets led by a strong management team positions the Company for robust organic growth and accretive strategic acquisition opportunities Hemisphere’s unique Spanish - language media portfolio is comprised of five leading U.S. Hispanic cable networks, two Latin American cable networks and the #1 broadcast television network in Puerto Rico – Leading movie and telenovela channels, two of the most popular Hispanic entertainment genres – Leading cable networks targeting the 2 nd , 3 rd , and 4 th largest U.S. Hispanic groups – Three of its cable networks were acquired on April 1, 2014 as part of Hemisphere’s strategy to strengthen and expand its port fol io Generated LTM 3/31/15 revenues and adjusted EBITDA $121 million and $55 million (a) , respectively – ~45% adjusted EBITDA margins – High level of visible, contractual subscriber and retransmission revenue, which made up nearly 50% of the Company’s total net revenue Hemisphere is committed to providing unique programming to highly attractive U.S. Hispanics and Latin American markets (a) See the Appendix hereto for reconciliation to the most directly comparable financial measures prepared in accordance with GAAP.

5 5 5 Attractive Financial Model ▪ Approximately 50% of consolidated revenue is derived from contracted subscriber and retransmission fees ▪ Multi - year contracts with distributors High level of visible, contractual revenue stream ▪ ~45% adjusted EBITDA margin ▪ Controlled and stable programming costs ▪ Scaled distribution and efficient cost structure generate high margins consistently ▪ Minimal marginal cost to serve incremental subscribers High operating leverage ▪ Low capital expenditure requirements Low capital intensity ▪ Businesses are cash flow generative ▪ Cash flows are received primarily in USD Favorable working capital Generates significant cash flow

6 6 6 Best - in - class Management Team Unparalleled Hispanic Media Expertise and Track Record Alan Sokol Chief Executive Officer Has managed the company since InterMedia acquired WAPA and Cinelatino in 2007 Over 20 years of experience in the television and film industries as an operator, advisor and investor, with specific focus on Hispanic media Former Senior Partner at InterMedia Partners and architect of InterMedia’s Hispanic strategy – First identified Cinelatino and WAPA as acquisition targets – Created and oversaw execution of turnaround strategy for Cinelatino and WAPA Together with James McNamara, oversaw growth of Telemundo from a $0.7bn asset to a $2.7bn asset in only four years Craig Fischer Chief Financial Officer Has managed the company since InterMedia acquired WAPA and Cinelatino in 2007 Over 15 years of experience in the media and entertainment industry as an operator, advisor and investor Former Partner at InterMedia responsible for investments in Cinelatino and WAPA Member of the executive team that launched the YES Network Former media banker at Goldman Sachs, and accountant at Ernst & Young James McNamara Vice Chairman and Consultant, Hemisphere Media Over 26 years of executive experience in the media and entertainment industry Consultant to Cinelatino and non - executive Chairman of Pantelion Films; Founder of Panamax Films Together with Alan Sokol, oversaw growth of Telemundo from a $0.7bn asset to a $2.7bn asset in only four years José Ramos President , WAPA Over 31 years of television experience Most experienced television executive in Puerto Rico 16 years as President and General Manager of WAPA 13 years at Telemundo, serving in various senior positions including Senior Vice President, General Manager and President

Investment H ighlights
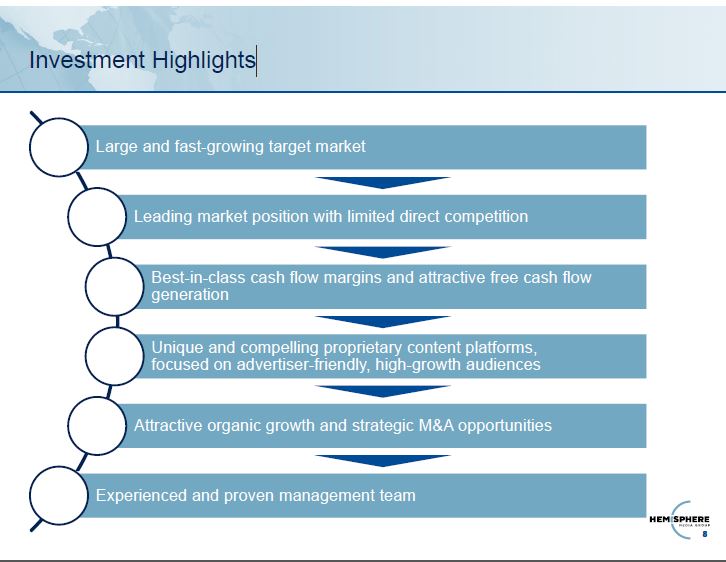
8 8 8 Investment Highlights Large and fast - growing target market Leading market position with limited direct competition Best - in - class cash flow margins and attractive free cash flow generation Unique and compelling proprietary content platforms, focused on advertiser - friendly, high - growth audiences Attractive organic growth and strategic M&A opportunities Experienced and proven management team

9 9 9 9% 13% 17% 19% 22% 1990 2000 2013 2020E 2030E 22 35 54 66 86 1990 2000 2013 2020E 2030E U.S. Hispanics are the largest minority group in the U.S. and growing rapidly Dynamic U.S. Hispanic Demographic Fast growing demographic Contributed approximately half of the total U.S. population growth from 2000 – 2013 U.S. Hispanic population growth (Figures in millions) U.S. Hispanic population as % of total U.S. population Source: U.S. Census Bureau U.S. Hispanic market is the second largest Hispanic economy in the world
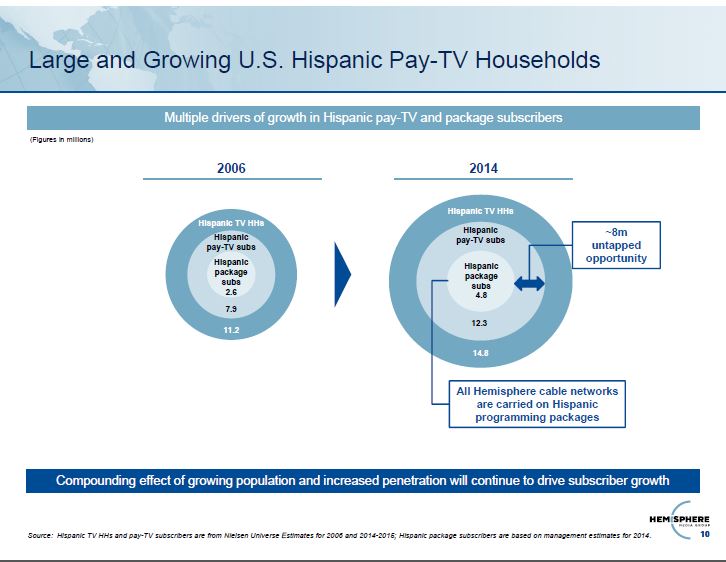
10 10 10 Large and Growing U.S. Hispanic Pay - TV Households Multiple drivers of growth in Hispanic pay - TV and package subscribers 2014 Hispanic TV HHs Hispanic package subs 4.8 Hispanic pay - TV subs 14.8 12.3 (Figures in millions) Hispanic TV HHs Hispanic package subs 2.6 Hispanic pay - TV subs 11.2 7.9 2006 ~8m untapped opportunity Source: Hispanic TV HHs and pay - TV subscribers are from Nielsen Universe Estimates for 2006 and 2014 - 2015; Hispanic package subs cribers are based on management estimates for 2014. Compounding effect of growing population and increased penetration will continue to drive subscriber growth All Hemisphere cable networks are carried on Hispanic programming packages

11 11 11 Significant U.S. Hispanic Cable A dvertising O pportunity Advertising market does not yet reflect Hispanic economic impact U.S. Hispanic Buying P ower vs. Hispanic M edia S pend Comparison of Hispanic C able Advertising to Viewing S hare Source: U.S. Census ( 2013), The Shelby Report ( 2013), Kantar Media ( 2013), Nielsen (2014), SNL Kagan (2013) Note: % Hispanic buying power and media spend data as of 2013. 17% 10% 5% Hispanic % of U.S. population % Hispanic buying power % Hispanic media spend 11% 17% 6% 11% 2% 4% 6% 8% 10% 12% 14% 16% 18% 20% 2007 2014 Spanish-language cable viewing as a % of total Spanish-language TV viewing U.S. Hispanic cable advertising as % of total U.S. Hispanic TV advertising Similar gap as U.S. general market cable 25 years ago Opportunity gap
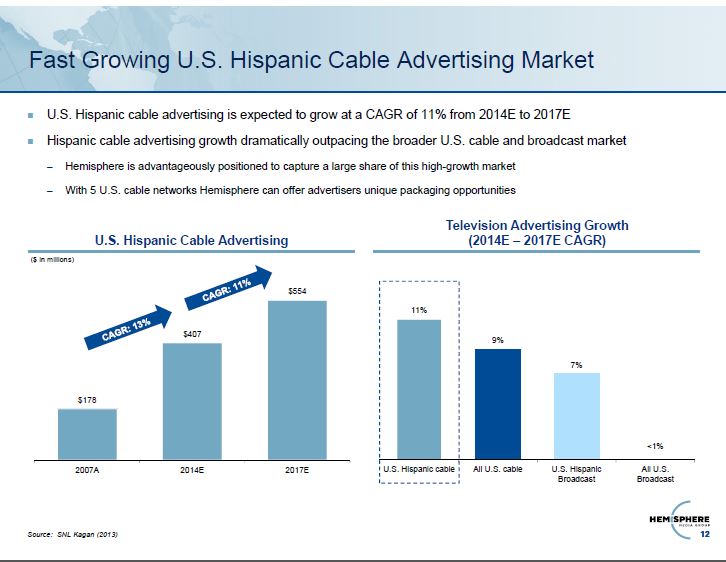
12 12 12 U.S. Hispanic cable advertising is expected to grow at a CAGR of 11% from 2014E to 2017E Hispanic cable advertising growth dramatically outpacing the broader U.S. cable and broadcast market – Hemisphere is advantageously positioned to capture a large share of this high - growth market – With 5 U.S. cable networks Hemisphere can offer advertisers unique packaging opportunities Fast Growing U.S. Hispanic Cable A dvertising M arket U.S. Hispanic Cable A dvertising Television Advertising G rowth ( 2014E – 2017E CAGR) ($ in millions) Source: SNL Kagan (2013) $178 $407 $554 2007A 2014E 2017E 11% 9% 7% <1% U.S. Hispanic cable All U.S. cable U.S. Hispanic Broadcast All U.S. Broadcast

13 13 13 Hemisphere portfolio Targeting Underserved and Rapidly Growing Segments of the U.S. Hispanic Audience All Hispanics, primarily Mexicans Puerto Ricans and other Caribbeans All Hispanics Central Americans Dominicans and other Caribbeans Source: Geoscape (2014) Note: Caribbean Hispanics include Dominicans, Colombians, Cubans, and Venezuelans; Other includes Argentinean, Bolivian, C hil ean, Ecuadorian, Paraguayan, Peruvian, Uruguayan and other Hispanics. U.S. Hispanic population Hemisphere addresses a deeper and broader U.S. Hispanic demographic than its competition Primary target demographic Mexican 67% Puerto Rican and Caribbean Hispanics 18% Central American 10% Other 5% Current Total U.S Hispanic Population Significant 2000 - 2014 growth among Hemisphere’s targeted audiences… 253 % Central American 195% Dominican 72% Caribbean Hispanic 52% Puerto Rican Mexican 32% [CATEGO RY NAME] 37% [CATEGO RY NAME] 23% Other 8% Hispanics Living in the U.S 5 Years or Less
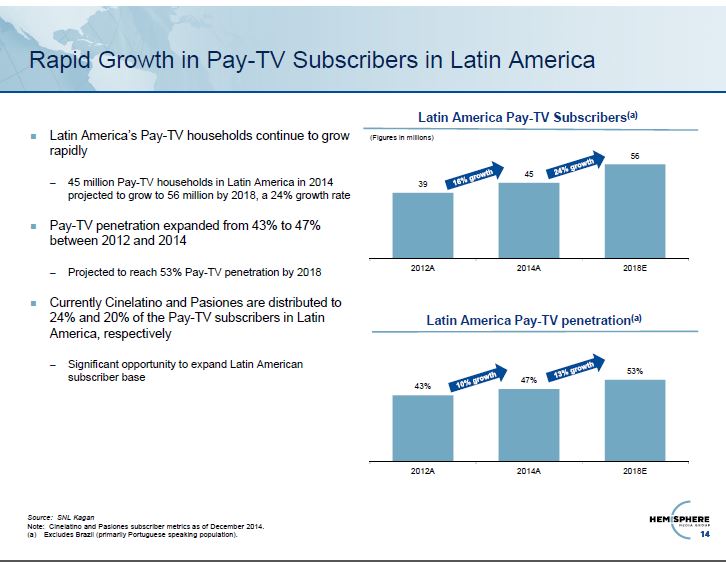
14 14 14 Latin America’s P ay - TV households continue to grow rapidly – 45 million Pay - TV households in Latin America in 2014 projected to grow to 56 million by 2018, a 24% growth rate Pay - TV penetration expanded from 4 3% to 47% between 2012 and 2014 – Projected to reach 53% Pay - TV penetration by 2018 Currently Cinelatino and Pasiones are distributed to 24% and 20% of the Pay - TV subscribers in Latin America, respectively – Significant opportunity to expand Latin American subscriber base Rapid Growth in Pay - TV S ubscribers in Latin America Source: SNL Kagan Note: Cinelatino and Pasiones subscriber metrics as of December 2014. (a) Excludes Brazil (primarily Portuguese speaking population). Latin America Pay - TV penetration (a) Latin America Pay - TV S ubscribers (a) (Figures in millions) 39 45 56 2012A 2014A 2018E 43% 47% 53% 2012A 2014A 2018E

15 15 15 Strong Track Record of Portfolio Expansion and Cultivation Acquired three Spanish - language cable networks on April 1, 2014 Purchase price was approximately $101.9 million, paid in cash In 2013, the networks generated net recurring revenue of $22.7 million and pro forma operating income (a) of $12.2 million – Implied purchase price multiple of 8.4x The acquired networks are distributed on Hispanic programming packages in the U.S., generally packaged with Cinelatino , WAPA America and other major Spanish - language cable networks Key milestones since the acquisition x Meaningfully expanded distribution of all three networks − All three networks launched on Cablevision late in 2014 − Expanded distribution of Centroamerica TV to full national coverage on COX Cable in Q1 2015 − Television Dominicana was recently launched on Choice Cable and DISH Network in Puerto Rico x Enhanced content at all three networks − Acquired exclusive professional soccer rights in El Salvador for Centroamerica TV − Entered into a programming license agreement with #1 Broadcaster in El Salvador − Licensed novelas from Televisa , Sony and Venevision for Pasiones − Invested capital to improve the signal quality of Television Dominicana Source: U.S. Census (2012) (a) EBITDA equivalent given no D&A; See Exhibit 99.3 to Hemisphere’s Current Report on Form 8 - K filed with the SEC on April 1, 2014. Strengthens and expands portfolio of market leading and highly complementary cable networks, and builds on commitment to provide unique programming focused on U.S. Hispanics

16 16 16 Leading Portfolio of Spanish - language Networks and Content Platforms #1 - rated Spanish - language cable movie network in the U.S. #2 - rated Spanish - language cable network overall Over 15 million subscribers across the U.S., Mexico, Latin America, and Canada Migrating the network to advertising - supported (2015) Best contemporary films from Mexico, Latin America, the U.S. and Spain Library of over 600 titles Cinelatino #1 - rated television network in Puerto Rico for the last 6 years ~30% share of primetime audience – Average primetime rating of 17.6 in 2014 (a) Produces ~70 hours per week of top rated news and entertainment programming Puerto Rico’s broadcast television market is uniquely attractive with the top three networks collectively garnering ~70% of all TV viewership – Top 4 U.S. broadcast networks garner less than 40% of viewership WAPA Fully - distributed, general entertainment Spanish - language cable television network in the U.S. Programmed for Puerto Rican and Caribbean Hispanics – Target audience of 10.3 million people – Univision and Telemundo focus on programming for the Mexican audience Widely distributed to over 5 million U.S. subscribers Leverages ~70 hours per week of local programs from WAPA The network is Nielsen - rated as of August 2014 WAPA America Dedicated to showcasing the most popular telenovelas and series Distributed in the U.S. and Latin America to over 13 million subscribers Separate U.S. and Latin American feeds Programming deals with top suppliers: Televisa, Sony, Globo, Caracol and Telemundo Pasiones Leading network targeting Central Americans, the third largest U.S. Hispanic group – As of 2014, 5.6 million target audience – Central American population in U.S. grew by 253% from 2000 - 2014 Over 3.7 million subscribers in the U.S. Featuring the most popular news, entertainment and soccer programming from Central America Centroamericatv Leading network targeting Dominicans living in the U.S. – Dominican population in U.S. grew by 195% from 2000 - 2014 Over 2.6 million subscribers in the U.S. Featuring the most popular news, entertainment and baseball programming from the Dominican Republic Television Dominicana Source: Nielsen for ratings data, and U.S. Census (2012) estimates for population size and growth rates (a) Represents 2014 total household figures, M - Fri 6:00 - 11:00PM.

17 17 17 Compelling Growth P latform Multiple Avenues of Growth Macroeconomic Growth Organic Growth Acquisition - Driven G rowth Growth in U.S. Hispanic population driving: – Growth in pay - TV HHs – Growth in Hispanic programming package subscribers Significant and growing Hispanic cable advertising opportunity in the U.S. Growth in Latin America pay - TV subscribers Continue to drive ratings at all networks, which in turn drives advertising sales Monetize advertising sales upside – Convert Cinelatino to ad - supported model – Leverage Nielsen ratings on Cinelatino and WAPA America to access national advertisers – Create unique packaging opportunities across our five U.S. cable networks Grow retransmission revenue in Puerto Rico Grow U.S. subscriber revenue through organic subscriber growth, new launches and fee increases Grow Latin America subscribers – Launch in new markets and on additional systems in under - penetrated markets Leverage expertise of management team and portfolio of assets to drive growth through acquisitions – U.S. Spanish - language cable networks – Latin American broadcast and cable television networks – Production companies – Content libraries Recent acquisition is template for our M&A strategy – Improve programming, marketing and distribution efforts – Cross - selling opportunities – Augment Latin American offerings – Expand commercial inventory

18 18 18 Cinelatino The Leading Spanish - Language C able M ovie N etwork in the U.S. #1 - rated Hispanic cable movie network #2 - rated Hispanic cable network overall Exclusive rights to a vast majority of the highest - grossing Spanish - language films released in the last five years The only Spanish - language cable movie network distributed by all major U.S. multichannel providers With over 4 million U.S. subscribers, Cinelatino has the largest subscriber base of any Spanish - language cable movie network Offered on the Hispanic programming package (i.e. WAPA America, Pasiones, Centroamerica TV, TV Dominicana, CNN en Español, Discovery en Español, History en Español, ESPN Deportes and Fox Deportes) A highly - rated platform for Hispanic - targeted advertisers as the Company transitions to an advertising supported model Primetime R atings: A18 - 49 Primetime Ratings: HHs Note: Represents Q4 2014 M - Sun 9:00PM - 3:00AM ET Source: Nielsen Ratings Leadership R eflects Strength of the Network 1.64 0.86 0.58 0.54 0.53 0.26 0.06 0.05 0.05 Discovery en Español ESPN Deportes Fox Deportes Galavision Mun2 Fox Life TR3S NUVO 0.77 0.37 0.30 0.24 0.23 0.14 0.03 0.02 0.02 Discovery en Español ESPN Deportes Fox Deportes Galavision Mun2 Fox Life TR3S NUVO
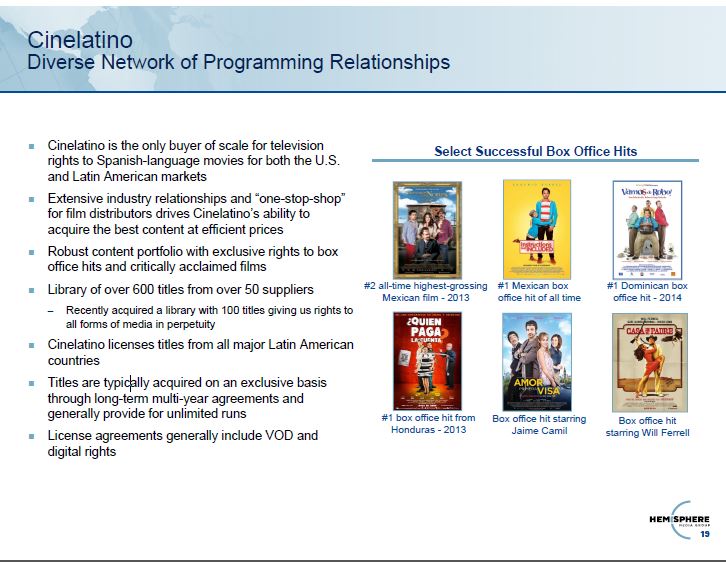
19 19 19 Cinelatino is the only buyer of scale for television rights to Spanish - language movies for both the U.S. and Latin American markets Extensive industry relationships and “one - stop - shop” for film distributors drives Cinelatino’s ability to acquire the best content at efficient prices Robust content portfolio with exclusive rights to box office hits and critically acclaimed films Library of over 600 titles from over 50 suppliers – Recently acquired a library with 100 titles giving us rights to all forms of media in perpetuity Cinelatino licenses titles from all major Latin American countries Titles are typically acquired on an exclusive basis through long - term multi - year agreements and generally provide for unlimited runs License agreements generally include VOD and digital rights Select Successful B ox O ffice H its Cinelatino Diverse Network of Programming Relationships Box office hit starring Jaime Camil #1 box office hit from Honduras - 2013 #1 Mexican box office hit of all time Box office hit starring Will Ferrell #1 Dominican box office hit - 2014 #2 all - time highest - grossing Mexican film - 2013

20 20 20 Cinelatino Platform in Latin America DISH Mexico – 20 Highest - Rated C able N etworks Latin America Distribution Subscribers Pay - TV Subscribers (a) Penetration (%) Colombia 2.8 5.1 55% Mexico 2.5 15.8 16% Argentina 2.0 8.9 22% Chile 0.5 2.5 21% Peru 0.3 1.6 16% Other (b) 2.7 10.9 25% Total Latin America 10.8 44.9 24% (Subscribers in millions) Source: Nielsen Ibope Mexico, represents full year 2014, M - Sun 6:00AM - 1:00AM (excludes children’s networks ). Note: Cinelatino subscriber metrics based on remittances as of December 2014. (a) Represents 2014 data; excluding Brazil (primarily Portuguese speaking population). (b) Other category includes subscribers from Bolivia, Costa Rica, Dominican Republic, Ecuador, El Salvador, Guatemala, Honduras, Nic aragua, Panama, Paraguay, Puerto Rico, Uruguay and Venezuela. Cinelatino has significant opportunity to grow its 10.8 million Latin American subscriber base Strong performance in Mexico is expected to translate into high growth in Latin America 1.11 0.87 0.66 0.65 0.65 0.62 0.62 0.62 0.58 0.57 0.56 0.51 0.51 0.51 0.48 0.44 0.42 0.41 0.37 0.36

21 21 21 4.8 4.4 3.6 2.7 17.6 15.5 Fox ABC NBC CBS "Big 4" With 1.4 million TV households, Puerto Rico is the third largest U.S. Hispanic market behind Los Angeles and New York The top 3 broadcasters in Puerto Rico (WAPA, Univision and Telemundo) garner approximately 70% of the audience share during primetime – In comparison, U.S. top 4 English language broadcast networks garner less than 40% of the audience share during primetime WAPA’s 17.6 primetime rating is three times higher than even the most highly rated English language U.S. broadcast network (a) Pay - TV is not highly penetrated in Puerto Rico with levels stable around 50% WAPA Puerto Rico is an Extremely A ttractive TV Broadcasting M arket Source: Nielsen, Actual remittances (a) Based on full year 2014 household ratings, live viewing, M - F 6:00 - 11:00PM for WAPA and M - Fri 8:00 - 11:00PM for U.S. networks (M - Fri 8:00 - 10:00PM for Fox). WAPA’s Primetime Ratings Are Higher than the Four Major U.S. TV Networks Combined ( a) Pay - TV P enetration in Puerto Rico 45% 47% 47% 46% 49% 51% 52% 52% 52% 2006 2007 2008 2009 2010 2011 2012 2013 2014

22 22 22 #1 - rated television network in Puerto Rico for six consecutive years – Grew from #3 - rated network in 2007 to #1 in 2009 – ~30% share of the primetime audience Primetime Ratings (a) Primetime Audience Share (a) WAPA is the highest revenue generating television network in Puerto Rico Diversified portfolio of advertising partners, including many Fortune 500 companies across a variety of industries The Company earns retransmission revenue pursuant to multi - year agreements, with annual rate escalators WAPA’s recent contract renewals have yielded significant retransmission fee increases – WAPA is a “must have” network 100% margin dollars WAPA Ratings Leadership D riving S trong A dvertising and Retransmission R evenue Clear Ratings L eader Highest TV Broadcasting A dvertising M arket S hare Robust G rowth in Retransmission R evenue Source: Nielsen (a) Represents 2014 total household figures, Mon - Fri 6:00 - 11:00pm. 17.6 14.5 9.9 WAPA Telemundo Univision 30% 25% 17% WAPA Telemundo Univision
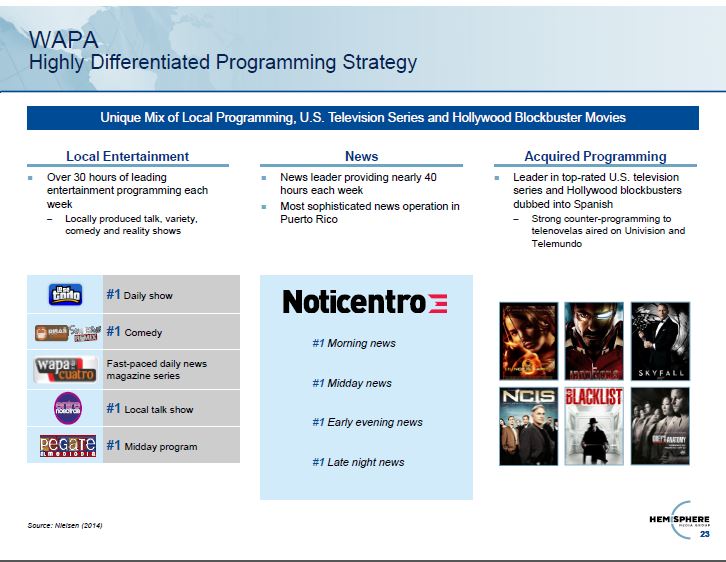
23 23 23 Over 30 hours of leading entertainment programming each week – Locally produced talk, variety, comedy and reality shows News leader providing nearly 40 hours each week Most sophisticated news operation in Puerto Rico WAPA Highly Differentiated P rogramming S trategy Leader in top - rated U.S. television series and Hollywood blockbusters dubbed into Spanish – Strong counter - programming to telenovelas aired on Univision and Telemundo Local Entertainment News Acquired Programming Unique Mix of Local P rogramming, U.S. Television Series and Hollywood Blockbuster M ovies #1 Daily show #1 Comedy Fast - paced daily news magazine series #1 Local talk show #1 Midday program #1 Morning news #1 Midday news #1 Early evening news #1 Late night news Source: Nielsen (2014)

24 24 24 Puerto Ricans & other Caribbean Hispanics 65% Central Americans 17% Mexicans 7% Other 11% Puerto Ricans & other Caribbean Hispanics 66% Central Americans 8% Mexicans 20% Other 6% Puerto Ricans & other Caribbean Hispanics 63% Central Americans 14% Mexicans 11% Other 12% Puerto Ricans & other Caribbean Hispanics 63% Central Americans 9% Mexicans 22% Other 7% WAPA America Fully - Distributed Spanish - Language C able N etwork in the U.S. WAPA America’s Distribution (a) Cable television network targeting Puerto Rican and Caribbean Hispanics in the U.S. – Leverages ~70 hours of weekly local programming produced by WAPA to create a unique cable network in the U.S. – Launched first nightly newscast from Puerto Rico targeted at U.S. Hispanics – Supplemented by acquired popular live sports from Puerto Rico, telenovelas, entertainment programming and WAPA’s library Widely distributed to over 5 million U.S. subscribers – Primarily distributed on Hispanic programming packages nationally and on the digital basic package in the major markets of Orlando and Tampa Nielsen - rated as of August 2014 – #1 - rated Spanish - language cable network M - F, 5 - 7PM (c) Puerto Rican and Caribbean Hispanics as a whole represent 18% of the U.S. Hispanic population – In select key U.S. markets, Puerto Rican and Caribbean Hispanics are the largest population group, exceeding Mexican - Americans Note: Caribbean Hispanics include Dominicans, Colombians, Cubans, and Venezuelans; Other includes Argentinean, Bolivian, Chilean, E cua dorian, Paraguayan, Peruvian, Uruguayan and other Hispanics. (a) Nationwide distribution on satellite operators. (b) Geoscape 2014 Series. (c) Nielsen – TVHH rating M - F 5PM - 7PM for Q4 2014. DMA #1 New York (b) DMA #18 Orlando (b) DMA #16 Miami (b) DMA #4 Philadelphia (b) Hispanic programming packages Digital basic

25 25 25 Pasiones Dedicated Telenovelas and Drama Channel Launched in August 2008 and acquired by Hemisphere Media Group in April 2014 Dedicated to showcasing the most popular telenovelas and drama series – Telenovelas are one of the most popular Hispanic genres – Showcases telenovelas produced in Latin America and Asia (dubbed into Spanish). Most competitor networks focus exclusively on Mexican telenovelas Featuring the best novelas from the top suppliers, including Televisa , Sony, Globo , Venevision , Caracol and Telemundo Distributed in the U.S. and Latin America – 4.2 million subscribers in the U.S . – 8.9 million subscribers in Latin America Distributed to only 20% of total pay - TV subscribers throughout Latin America (excluding Brazil), representing a significant growth opportunity Latin America Distribution Subscribers Pay - TV Subscribers (a) Penetration (%) Colombia 2.9 5.1 56% Argentina 2.5 8.9 28% Chile 0.5 2.5 18% Peru 0.2 1.6 13% Mexico 0.1 15.8 <1% Other (b) 2.8 10.9 26% Total Latin America 8.9 44.9 20% (Subscribers in millions) Source: Nielsen Ibope Mexico. Note: Pasiones subscriber metrics based on remittances as of December 2014. (a) Represents 2014 data; excluding Brazil (primarily Portuguese speaking population). (b) Other category includes subscribers from Bolivia, Costa Rica, Dominican Republic, Ecuador, El Salvador, Guatemala, Honduras, Nic aragua, Panama, Paraguay, Puerto Rico, Uruguay and Venezuela. Pasiones has significant opportunity to grow its 8.9 million Latin American subscriber base
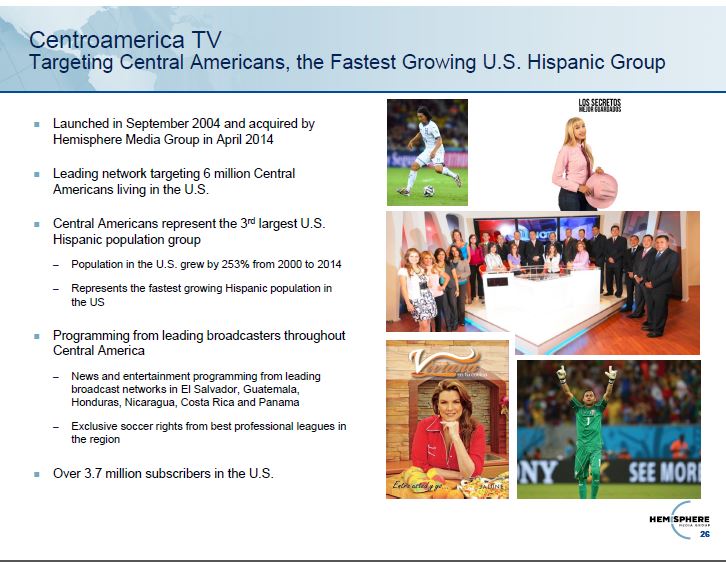
26 26 26 Centroamerica TV Targeting Central Americans, the Fastest Growing U.S. Hispanic Group Launched in September 2004 and acquired by Hemisphere Media Group in April 2014 Leading network targeting 6 million Central Americans living in the U.S. Central Americans represent the 3 rd largest U.S. Hispanic population group – Population in the U.S. grew by 253% from 2000 to 2014 – Represents the fastest growing Hispanic population in the US Programming from leading broadcasters throughout Central America – News and entertainment programming from leading broadcast networks in El Salvador, Guatemala, Honduras, Nicaragua, Costa Rica and Panama – Exclusive soccer rights from best professional leagues in the region Over 3.7 million subscribers in the U.S .
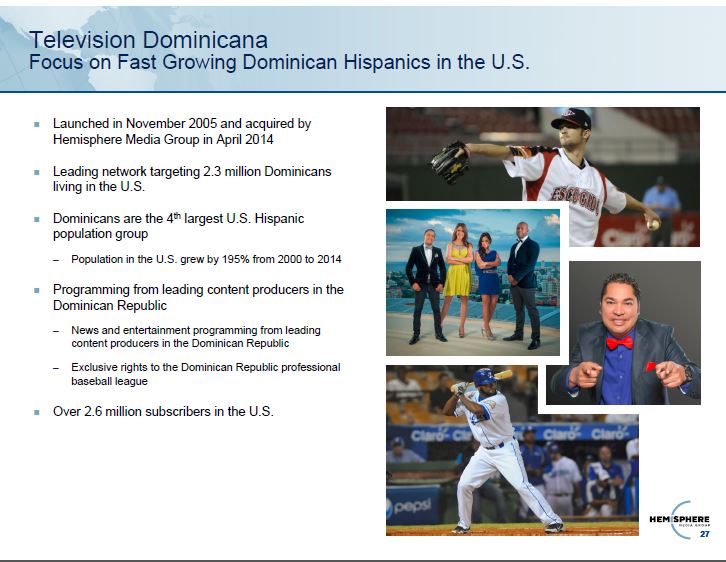
27 27 27 Television Dominicana Focus on Fast Growing Dominican Hispanics in the U.S. Launched in November 2005 and acquired by Hemisphere Media Group in April 2014 Leading network targeting 2.3 million Dominicans living in the U.S. Dominicans are the 4 th largest U.S. Hispanic population group – Population in the U.S. grew by 195% from 2000 to 2014 Programming from leading content producers in the Dominican Republic – News and entertainment programming from leading content producers in the Dominican Republic – Exclusive rights to the Dominican Republic professional baseball league Over 2.6 million subscribers in the U.S.

Financial Overview

29 29 29 Financial Profile Overview Strong organic growth with demographic trends in Hemisphere’s favor – Substantial growth projected in U.S Hispanic population which is expected to drive growth in subscribers – Significant projected growth in U.S. Hispanic cable advertising – Growth opportunities in Latin America through projected growth in pay - TV subscribers – Meaningful growth in core assets Strong cash flow generation – ~45% adjusted EBITDA margin – Low capital expenditure requirements – Positive working capital Stability of earnings – Approximately 50% of revenue derived from subscriber and retransmission fees on an annual basis – Long - term relationships with key distributors with staggered maturities Commitment to reinvest capital back into the business through further acquisitions – We continue to look at further opportunities to expand our network portfolio Conservative financial profile – Net leverage of only 1.4x, as of 3/31/2015 – Intention to use free cash flow to make accretive strategic acquisitions and/or de - lever
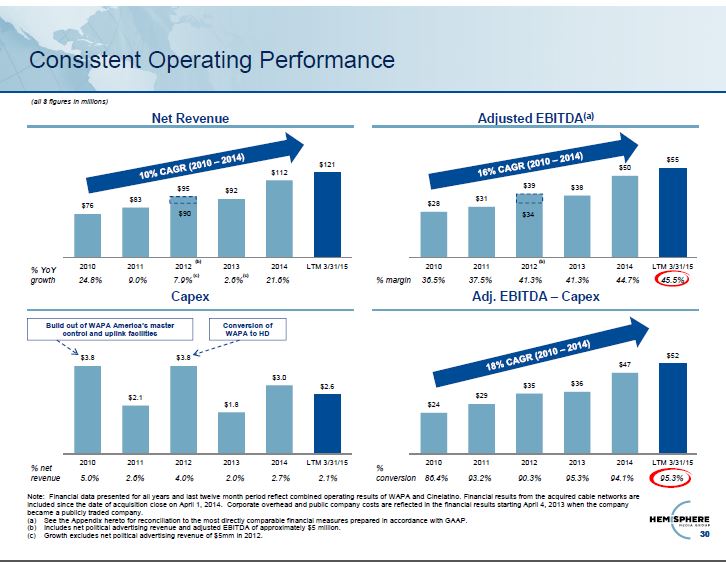
30 30 30 Consistent O perating Performance $28 $31 $39 $38 $50 $55 2010 2011 2012 2013 2014 LTM 3/31/15 $76 $83 $95 $92 $112 $121 2010 2011 2012 2013 2014 LTM 3/31/15 $3.8 $2.1 $3.8 $1.8 $3.0 $2.6 2010 2011 2012 2013 2014 LTM 3/31/15 $24 $29 $35 $36 $47 $52 2010 2011 2012 2013 2014 LTM 3/31/15 Net Revenue Adjusted EBITDA (a) (all $ figures in millions) Build out of WAPA America’s master control and uplink facilities Conversion of WAPA to HD Capex Adj. EBITDA – Capex Note: Financial data presented for all years and last twelve month period reflect combined operating results of WAPA and Cinelatino . Financial results from the acquired cable networks are included since the date of acquisition close on April 1, 2014. Corporate overhead and public company costs are reflected in the financial results starting April 4, 2013 when the company became a publicly traded company . (a) See the Appendix hereto for reconciliation to the most directly comparable financial measures prepared in accordance with GAA P. (b) Includes net political advertising revenue and adjusted EBITDA of approximately $5 million. (c) Growth excludes net political advertising revenue of $5mm in 2012. (b) % net revenue 5.0% 2.6% 4.0% 2.0% 2.7% 2.1% % YoY growth 24.8% 9.0% 7.9% 2.6% 21.6% $90 $34 (c) (c) (b) % conversion 86.4% 93.2% 90.3% 95.3% 94.1% 95.3% % margin 36.5% 37.5% 41.3% 41.3% 44.7% 45.5%

31 31 31 Review of 1Q 2015 Performance $21 $29 1Q 2014 1Q 2015 Net Revenue Adjusted EBITDA (a) (all $ figures in millions) (b) $8 $13 1Q 2014 1Q 2015 (b) (a) See the Appendix hereto for reconciliation to the most directly comparable financial measures prepared in accordance with GAA P. (b) As reported results, excludes the operating results of the Acquired Cable Networks.

Appendix
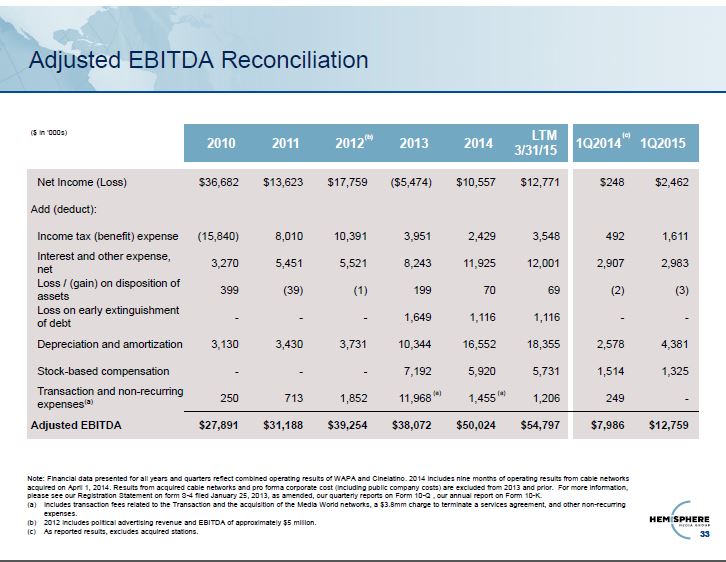
33 33 33 Adjusted EBITDA Reconciliation ($ in ‘000s) 2010 2011 2012 2013 2014 LTM 3/31/15 1Q2014 1Q2015 Net Income (Loss) $ 36,682 $13,623 $17,759 ($5,474) $10,557 $12,771 $248 $2,462 Add (deduct): Income tax (benefit) expense (15,840) 8,010 10,391 3,951 2,429 3,548 492 1,611 Interest and other expense, net 3,270 5,451 5,521 8,243 11,925 12,001 2,907 2,983 Loss / (gain) on disposition of assets 399 (39) (1) 199 70 69 (2) (3) Loss on early extinguishment of debt - - - 1,649 1,116 1,116 - - Depreciation and amortization 3,130 3,430 3,731 10,344 16,552 18,355 2,578 4,381 Stock - based compensation - - - 7,192 5,920 5,731 1,514 1,325 Transaction and non - recurring expenses (a) 250 713 1,852 11,968 1,455 1,206 249 - Adjusted EBITDA $27,891 $31,188 $39,254 $38,072 $50,024 $54,797 $7,986 $12,759 Note: Financial data presented for all years and quarters reflect combined operating results of WAPA and Cinelatino. 2014 includes nine months of operating results from cable networks acquired on April 1, 2014. Results from acquired cable networks and pro forma corporate cost (including public company costs) ar e excluded from 2013 and prior. For more information, please see our Registration Statement on form S - 4 filed January 25, 2013, as amended, our quarterly reports on Form 10 - Q , our a nnual report on Form 10 - K. (a) Includes transaction fees related to the Transaction and the acquisition of the Media World networks, a $3.8mm charge to term ina te a services agreement, and other non - recurring expenses. (b) 2012 includes political advertising revenue and EBITDA of approximately $5 million. (c) As reported results, excludes acquired stations. (a) (a) (c) (b)