Attached files
| file | filename |
|---|---|
| 8-K - 8-K - Starwood Waypoint Homes | d924486d8k.htm |
| EX-99.1 - EX-99.1 - Starwood Waypoint Homes | d924486dex991.htm |
Exhibit 99.2
|
|

FIRST QUARTER 2015
supplemental Operating & Finanical Data
|
|
Table of Contents
Pages
ABOUT SWAY 1-6
FINANCIAL INFORMATION
Selected Financial & Other Information 7
Consolidated Balance Sheets 8
Consolidated Statements of Operations 9
FFO & Core FFO 10
NOI and Same Store Growth 11
CAPITAL MARKETS 12
PORTFOLIO INFORMATION
Total Rental Homes Portfolio 13
Leasing Statistics 14
NPL Portfolio 15
TRANSACTION ACTIVITY
Acquisitions 16
DEFINITIONS AND RECONCILIATIONS 17-19
|
|
ABOUT SWAY
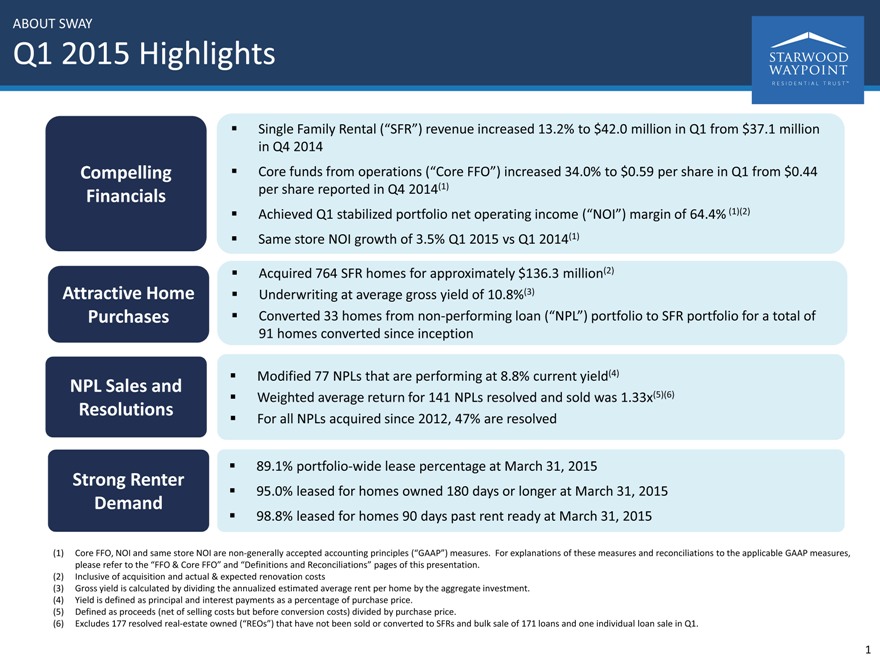
Q1 2015 Highlights
Single Family Rental (“SFR”) revenue increased 13.2% to $42.0 million in Q1 from $37.1 million
in Q4 2014
Compelling Core funds from operations (“Core FFO”) increased 34.0% to $0.59 per share in Q1 from $0.44
Financials per share reported in Q4 2014(1)
Achieved Q1 stabilized portfolio net operating income (“NOI”) margin of 64.4% (1)(2)
Same store NOI growth of 3.5% Q1 2015 vs Q1 2014(1)
Acquired 764 SFR homes for approximately $136.3 million(2)
Attractive Home Underwriting at average gross yield of 10.8%(3)
Purchases Converted 33 homes from non-performing loan (“NPL”) portfolio to SFR portfolio for a total of
91 homes converted since inception
NPL Sales and Modified 77 NPLs that are performing at 8.8% current yield(4)
Weighted average return for 141 NPLs resolved and sold was 1.33x(5)(6)
Resolutions For all NPLs acquired since 2012, 47% are resolved
89.1% portfolio-wide lease percentage at March 31, 2015
Strong Renter
Demand 95.0% leased for homes owned 180 days or longer at March 31, 2015
98.8% leased for homes 90 days past rent ready at March 31, 2015
(1) Core FFO, NOI and same store NOI are non-generally accepted accounting principles (“GAAP”) measures. For explanations of these measures and reconciliations to the applicable GAAP measures, please refer to the “FFO & Core FFO” and “Definitions and Reconciliations” pages of this presentation.
(2) Inclusive of acquisition and actual & expected renovation costs
(3) Gross yield is calculated by dividing the annualized estimated average rent per home by the aggregate investment. (4) Yield is defined as principal and interest payments as a percentage of purchase price.
(5) Defined as proceeds (net of selling costs but before conversion costs) divided by purchase price.
(6) Excludes 177 resolved real-estate owned (“REOs”) that have not been sold or converted to SFRs and bulk sale of 171 loans and one individual loan sale in Q1.
1
|
|
ABOUT SWAY
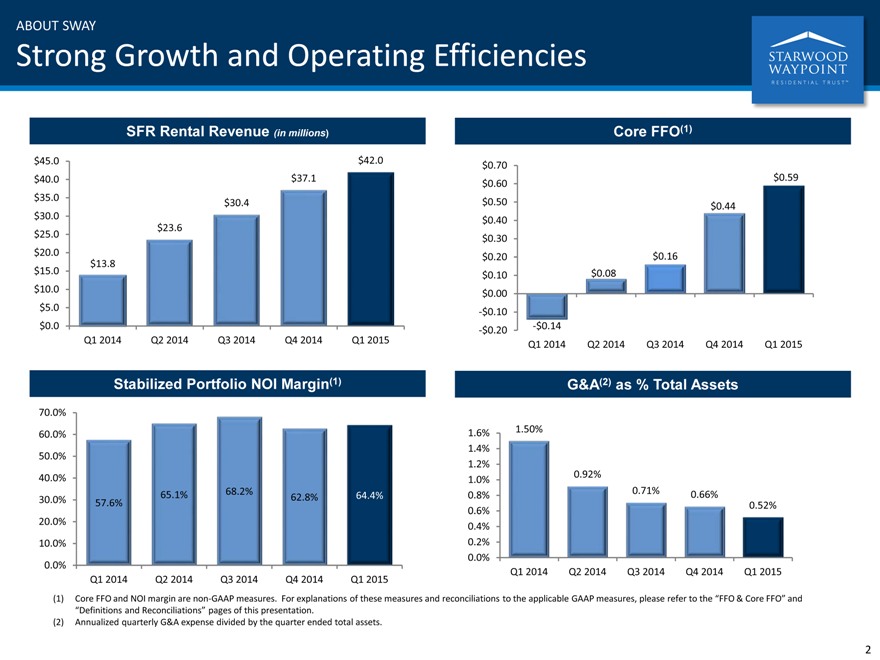
Strong Growth and Operating Efficiencies
SFR Rental Revenue (in millions) Core FFO(1)
$45.0 $ 42.0 $ 0.70
$40.0 $37.1 $ 0.60 $ 0.59
$35.0 $30.4 $ 0.50 $ 0.44
$30.0 $ 0.40
$23.6
$25.0 $ 0.30
$20.0 $ 0.20 $ 0.16
$13.8
$15.0 $ 0.10 $ 0.08
$10.0 $ 0.00
$5.0 -$ 0.10
$0.0 -$ 0.20 -$ 0.14
Q1 2014 Q2 2014 Q3 2014 Q4 2014 Q1 2015 Q1 2014 Q2 2014 Q3 2014 Q4 2014 Q1 2015
Stabilized Portfolio NOI Margin(1) G&A(2) as % Total Assets
70.0%
60.0% 1.6% 1.50%
50.0% 1.4%
1.2%
40.0% 1.0% 0.92%
30.0% 57.6% 65.1% 68.2% 62.8% 64.4% 0.8% 0.71% 0.66% 0.52%
0.6%
20.0% 0.4%
10.0% 0.2%
0.0%
0.0% Q1 2014 Q2 2014 Q3 2014 Q4 2014 Q1 2015
Q1 2014 Q2 2014 Q3 2014 Q4 2014 Q1 2015
(1) Core FFO and NOI margin are non-GAAP measures. For explanations of these measures and reconciliations to the applicable GAAP measures, please refer to the “FFO & Core FFO” and “Definitions and Reconciliations” pages of this presentation.
(2) Annualized quarterly G&A expense divided by the quarter ended total assets.
2
|
|
ABOUT SWAY
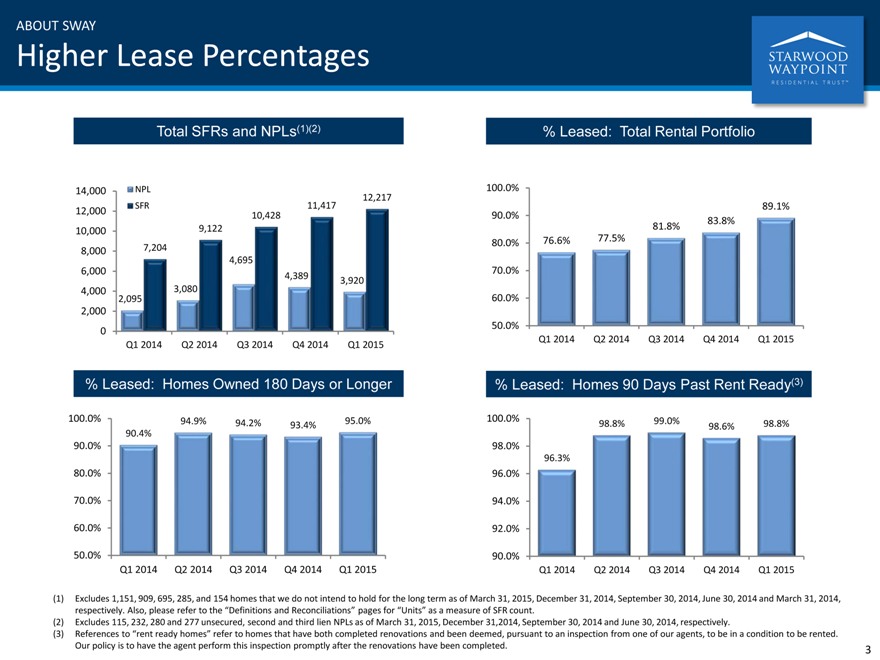
Higher Lease Percentages
Total SFRs and NPLs(1)(2)% Leased: Total Rental Portfolio
14,000 NPL 100.0%
12,217
SFR 11,417 89.1%
12,000 10,428 90.0% 83.8%
10,000 9,122 81.8%
8,000 7,204 80.0% 76.6% 77.5%
4,695
6,000 4,389 70.0%
3,920
4,000 3,080
2,095 60.0%
2,000
0 50.0%
Q1 2014 Q2 2014 Q3 2014 Q4 2014 Q1 2015 Q1 2014 Q2 2014 Q3 2014 Q4 2014 Q1 2015
% Leased: Homes Owned 180 Days or Longer% Leased: Homes 90 Days Past Rent Ready(3)
100.0% 94.9% 94.2% 93.4% 95.0% 100.0% 98.8% 99.0% 98.6% 98.8%
90.4%
90.0% 98.0%
96.3%
80.0% 96.0%
70.0% 94.0%
60.0% 92.0%
50.0% 90.0%
Q1 2014 Q2 2014 Q3 2014 Q4 2014 Q1 2015 Q1 2014 Q2 2014 Q3 2014 Q4 2014 Q1 2015
(1) Excludes 1,151, 909, 695, 285, and 154 homes that we do not intend to hold for the long term as of March 31, 2015, December 31, 2014, September 30, 2014, June 30, 2014 and March 31, 2014, respectively. Also, please refer to the “Definitions and Reconciliations” pages for “Units” as a measure of SFR count.
(2) Excludes 115, 232, 280 and 277 unsecured, second and third lien NPLs as of March 31, 2015, December 31,2014, September 30, 2014 and June 30, 2014, respectively.
(3) References to “rent ready homes” refer to homes that have both completed renovations and been deemed, pursuant to an inspection from one of our agents, to be in a condition to be rented. Our policy is to have the agent perform this inspection promptly after the renovations have been completed.
3
|
|
ABOUT SWAY
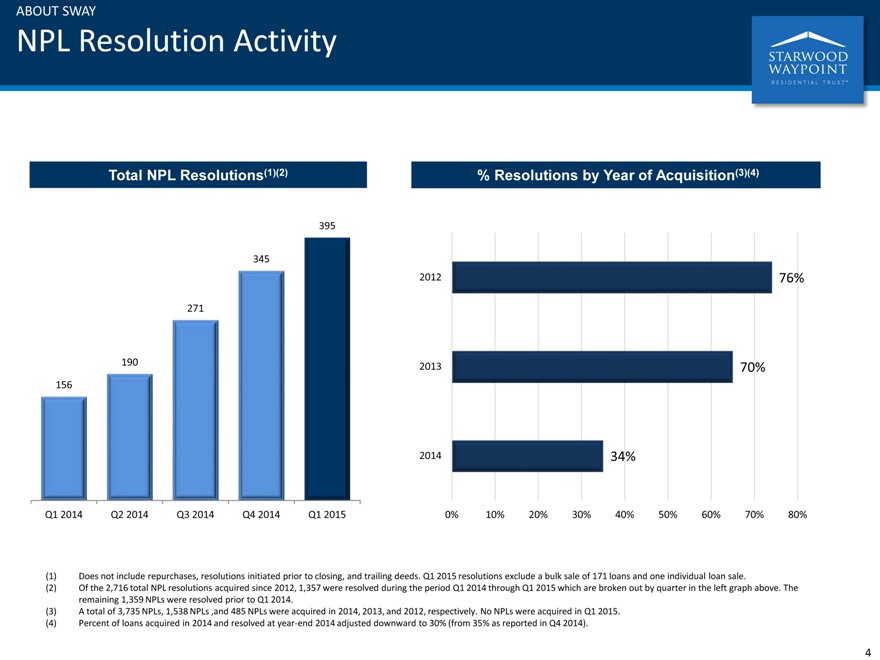
NPL Resolution Activity
Total NPL Resolutions(1)(2)% Resolutions by Year of Acquisition(3)(4)
395
345
2012 76%
271
190 2013 70%
156
2014 34%
Q1 2014 Q2 2014 Q3 2014 Q4 2014 Q1 2015 0% 10% 20% 30% 40% 50% 60% 70% 80%
(1) Does not include repurchases, resolutions initiated prior to closing, and trailing deeds. Q1 2015 resolutions exclude a bulk sale of 171 loans and one individual loan sale.
(2) Of the 2,716 total NPL resolutions acquired since 2012, 1,357 were resolved during the period Q1 2014 through Q1 2015 which are broken out by quarter in the left graph above. The remaining 1,359 NPLs were resolved prior to Q1 2014.
(3) A total of 3,735 NPLs, 1,538 NPLs ,and 485 NPLs were acquired in 2014, 2013, and 2012, respectively. No NPLs were acquired in Q1 2015. (4) Percent of loans acquired in 2014 and resolved at year-end 2014 adjusted downward to 30% (from 35% as reported in Q4 2014).
4
|
|
ABOUT SWAY
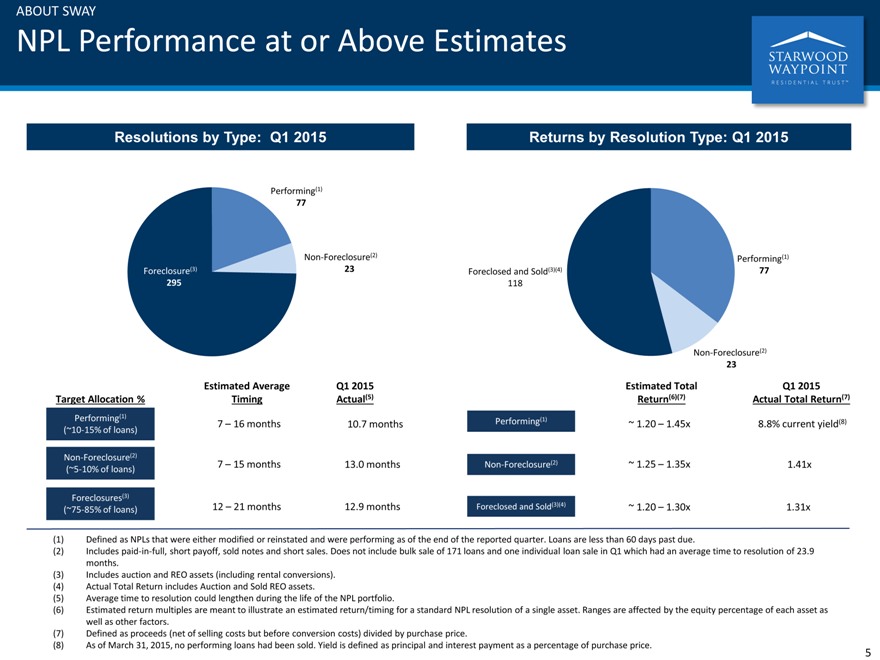
NPL Performance at or Above Estimates
Resolutions by Type: Q1 2015 Returns by Resolution Type: Q1 2015
Performing(1)
77
Non-Foreclosure(2) Performing(1)
Foreclosure(3) 23 Foreclosed and Sold(3)(4) 77
295 118
Non-Foreclosure(2)
23
Estimated Average Q1 2015 Estimated Total Q1 2015
Target Allocation % Timing Actual(5) Return(6)(7) Actual Total Return(7)
Performing(1) 7 – 16 months 10.7 months Performing(1) ~ 1.20 – 1.45x 8.8% current yield(8)
(~10-15% of loans)
Non-Foreclosure(2)
(~5-10% of loans) 7 – 15 months 13.0 months Non-Foreclosure(2) ~ 1.25 – 1.35x 1.41x
Foreclosures(3)
(~75-85% of loans) 12 – 21 months 12.9 months Foreclosed and Sold(3)(4) ~ 1.20 – 1.30x 1.31x
(1) Defined as NPLs that were either modified or reinstated and were performing as of the end of the reported quarter. Loans are less than 60 days past due.
(2) Includes paid-in-full, short payoff, sold notes and short sales. Does not include bulk sale of 171 loans and one individual loan sale in Q1 which had an average time to resolution of 23.9 months.
(3) Includes auction and REO assets (including rental conversions).
(4) Actual Total Return includes Auction and Sold REO assets.
(5) Average time to resolution could lengthen during the life of the NPL portfolio.
(6) Estimated return multiples are meant to illustrate an estimated return/timing for a standard NPL resolution of a single asset. Ranges are affected by the equity percentage of each asset as well as other factors.
(7) Defined as proceeds (net of selling costs but before conversion costs) divided by purchase price.
(8) As of March 31, 2015, no performing loans had been sold. Yield is defined as principal and interest payment as a percentage of purchase price.
5
|
|
ABOUT SWAY
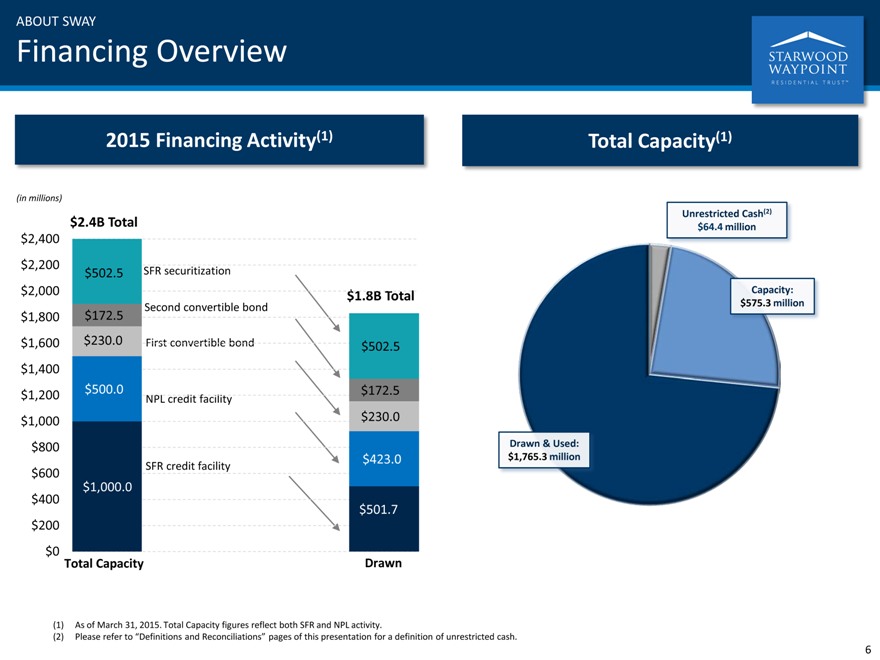
Financing Overview
2015 Financing Activity(1) Total Capacity(1)
(in millions)
Unrestricted Cash(2)
$2.4B Total $64.4 million
$2,400
$2,200 $502.5 SFR securitization
$2,000 $1.8B Total Capacity:
Second convertible bond $575.3 million
$1,800 $172.5
$1,600 $230.0 First convertible bond $502.5
$1,400
$1,200 $500.0 NPL credit facility $172.5
$1,000 $230.0
$800 Drawn & Used:
$423.0 $1,765.3 million
$600 SFR credit facility
$1,000.0
$400
$501.7
$200
$0
Total Capacity Drawn
(1) As of March 31, 2015. Total Capacity figures reflect both SFR and NPL activity.
(2) Please refer to “Definitions and Reconciliations” pages of this presentation for a definition of unrestricted cash.
6
|
|
FINANCIAL INFORMATION
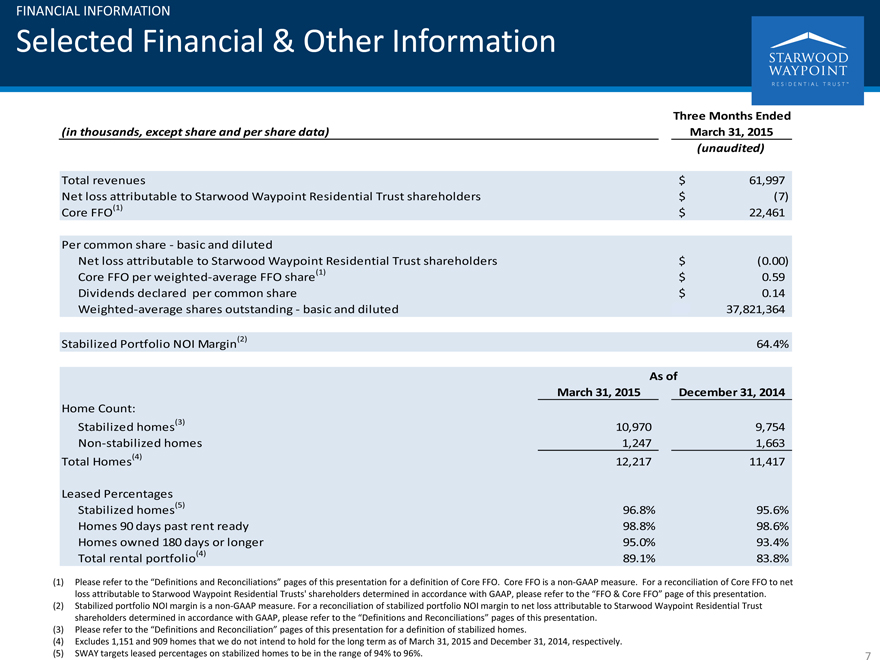
Selected Financial & Other Information
Three Months Ended
(in thousands, except share and per share data) March 31, 2015
(unaudited)
Total revenues $ 61,997
Net loss attributable to Starwood Waypoint Residential Trust shareholders $(7)
Core FFO(1) $ 22,461
Per common share—basic and diluted
Net loss attributable to Starwood Waypoint Residential Trust shareholders $(0.00)
Core FFO per weighted-average FFO share(1) $ 0.59
Dividends declared per common share $ 0.14
Weighted-average shares outstanding—basic and diluted 37,821,364
Stabilized Portfolio NOI Margin(2) 64.4%
As of
March 31, 2015 December 31, 2014
Home Count:
Stabilized homes(3) 10,970 9,754
Non-stabilized homes 1,247 1,663
Total Homes(4) 12,217 11,417
Leased Percentages
Stabilized homes(5) 96.8% 95.6%
Homes 90 days past rent ready 98.8% 98.6%
Homes owned 180 days or longer 95.0% 93.4%
Total rental portfolio(4) 89.1% 83.8%
(1) Please refer to the “Definitions and Reconciliations” pages of this presentation for a definition of Core FFO. Core FFO is a non-GAAP measure. For a reconciliation of Core FFO to net loss attributable to Starwood Waypoint Residential Trusts’ shareholders determined in accordance with GAAP, please refer to the “FFO & Core FFO” page of this presentation.
(2) Stabilized portfolio NOI margin is a non-GAAP measure. For a reconciliation of stabilized portfolio NOI margin to net loss attributable to Starwood Waypoint Residential Trust shareholders determined in accordance with GAAP, please refer to the “Definitions and Reconciliations” pages of this presentation.
(3) Please refer to the “Definitions and Reconciliation” pages of this presentation for a definition of stabilized homes.
(4) Excludes 1,151 and 909 homes that we do not intend to hold for the long term as of March 31, 2015 and December 31, 2014, respectively.
(5) SWAY targets leased percentages on stabilized homes to be in the range of 94% to 96%.
7
|
|
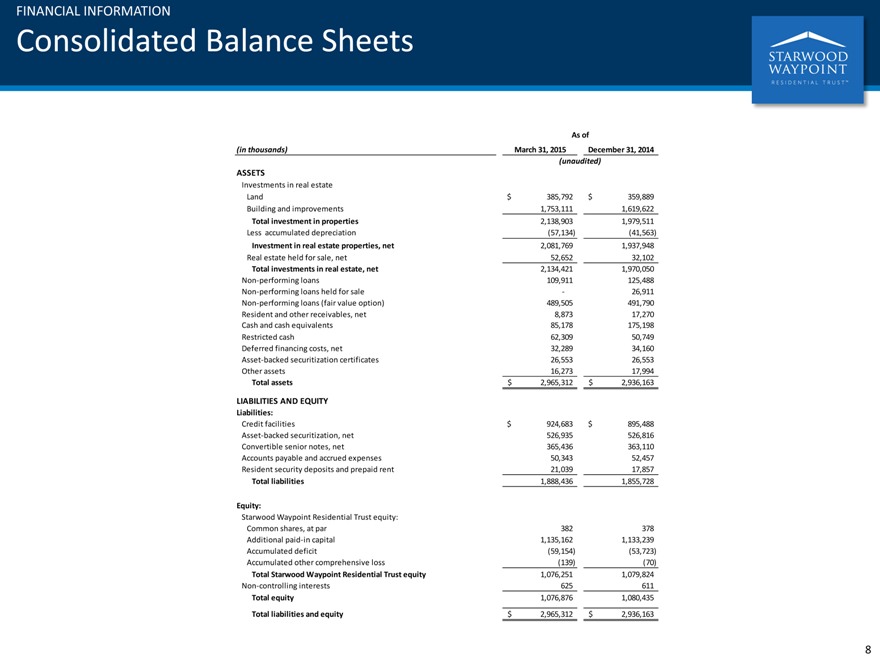
FINANCIAL INFORMATION
Consolidated Balance Sheets
As of
(in thousands) March 31, 2015 December 31, 2014
(unaudited)
ASSETS
Investments in real estate
Land $ 385,792 $ 359,889
Building and improvements 1,753,111 1,619,622
Total investment in properties 2,138,903 1,979,511
Less accumulated depreciation(57,134)(41,563)
Investment in real estate properties, net 2,081,769 1,937,948
Real estate held for sale, net 52,652 32,102
Total investments in real estate, net 2,134,421 1,970,050
Non-performing loans 109,911 125,488
Non-performing loans held for sale—26,911
Non-performing loans (fair value option) 489,505 491,790
Resident and other receivables, net 8,873 17,270
Cash and cash equivalents 85,178 175,198
Restricted cash 62,309 50,749
Deferred financing costs, net 32,289 34,160
Asset-backed securitization certificates 26,553 26,553
Other assets 16,273 17,994
Total assets $ 2,965,312 $ 2,936,163
LIABILITIES AND EQUITY
Liabilities:
Credit facilities $ 924,683 $ 895,488
Asset-backed securitization, net 526,935 526,816
Convertible senior notes, net 365,436 363,110
Accounts payable and accrued expenses 50,343 52,457
Resident security deposits and prepaid rent 21,039 17,857
Total liabilities 1,888,436 1,855,728
Equity:
Starwood Waypoint Residential Trust equity:
Common shares, at par 382 378
Additional paid-in capital 1,135,162 1,133,239
Accumulated deficit(59,154)(53,723)
Accumulated other comprehensive loss(139)(70)
Total Starwood Waypoint Residential Trust equity 1,076,251 1,079,824
Non-controlling interests 625 611
Total equity 1,076,876 1,080,435
Total liabilities and equity $ 2,965,312 $ 2,936,163
8
|
|
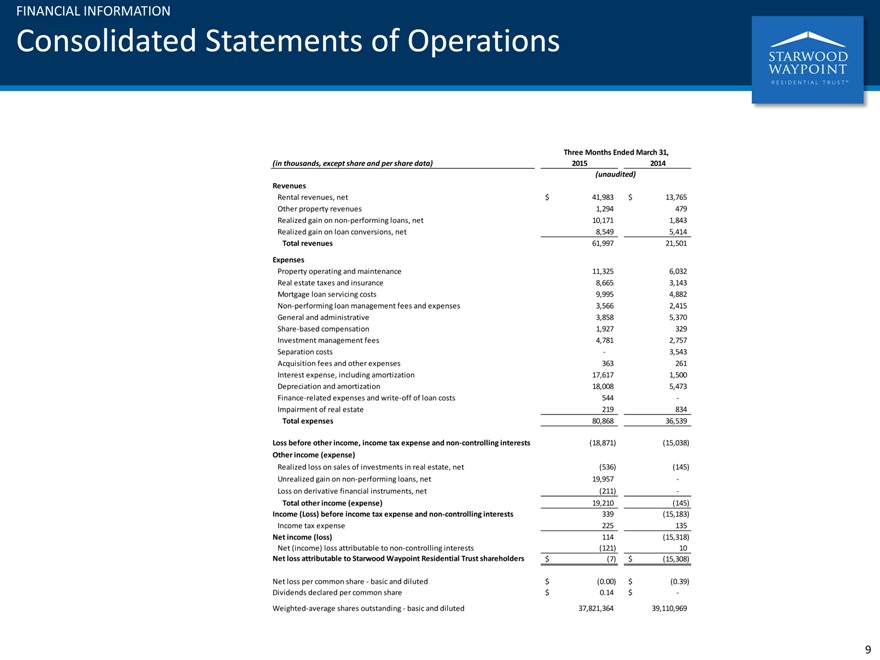
FINANCIAL INFORMATION
Consolidated Statements of Operations
Three Months Ended March 31,
(in thousands, except share and per share data) 2015 2014
(unaudited)
Revenues
Rental revenues, net $ 41,983 $ 13,765
Other property revenues 1,294 479
Realized gain on non-performing loans, net 10,171 1,843
Realized gain on loan conversions, net 8,549 5,414
Total revenues 61,997 21,501
Expenses
Property operating and maintenance 11,325 6,032
Real estate taxes and insurance 8,665 3,143
Mortgage loan servicing costs 9,995 4,882
Non-performing loan management fees and expenses 3,566 2,415
General and administrative 3,858 5,370
Share-based compensation 1,927 329
Investment management fees 4,781 2,757
Separation costs—3,543
Acquisition fees and other expenses 363 261
Interest expense, including amortization 17,617 1,500
Depreciation and amortization 18,008 5,473
Finance-related expenses and write-off of loan costs 544 -
Impairment of real estate 219 834
Total expenses 80,868 36,539
Loss before other income, income tax expense and non-controlling interests(18,871)(15,038)
Other income (expense)
Realized loss on sales of investments in real estate, net(536)(145)
Unrealized gain on non-performing loans, net 19,957 -
Loss on derivative financial instruments, net(211) -
Total other income (expense) 19,210(145)
Income (Loss) before income tax expense and non-controlling interests 339(15,183)
Income tax expense 225 135
Net income (loss) 114(15,318)
Net (income) loss attributable to non-controlling interests(121) 10
Net loss attributable to Starwood Waypoint Residential Trust shareholders $(7) $(15,308)
Net loss per common share—basic and diluted $(0.00) $(0.39)
Dividends declared per common share $ 0.14 $ -
Weighted-average shares outstanding—basic and diluted 37,821,364 39,110,969
9
|
|
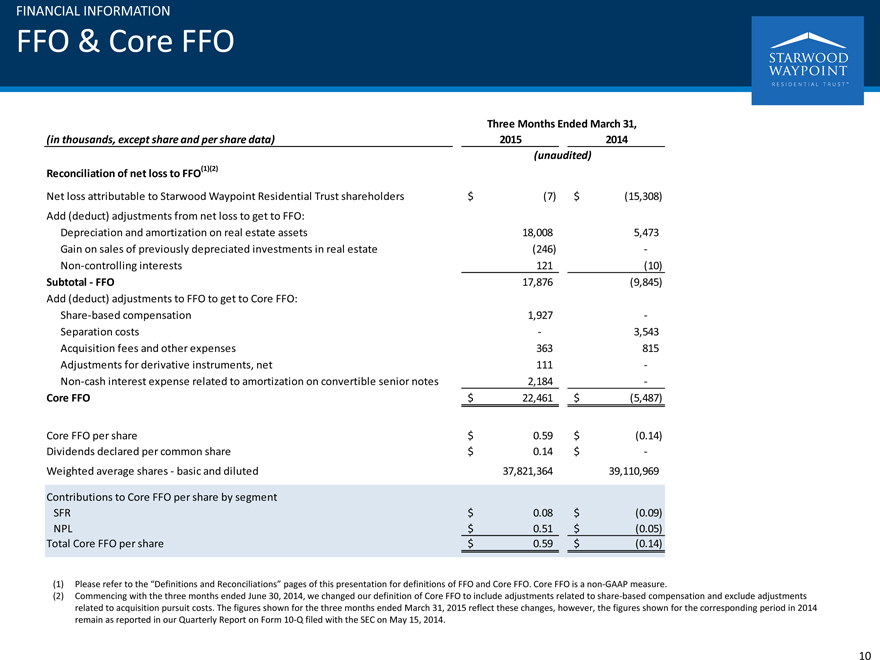
FINANCIAL INFORMATION
FFO & Core FFO
Three Months Ended March 31,
(in thousands, except share and per share data) 2015 2014
(unaudited)
Reconciliation of net loss to FFO(1)(2)
Net loss attributable to Starwood Waypoint Residential Trust shareholders $ (7) $ (15,308)
Add (deduct) adjustments from net loss to get to FFO:
Depreciation and amortization on real estate assets 18,008 5,473
Gain on sales of previously depreciated investments in real estate (246) -
Non-controlling interests 121 (10)
Subtotal - FFO 17,876 (9,845)
Add (deduct) adjustments to FFO to get to Core FFO:
Share-based compensation 1,927 -
Separation costs - 3,543
Acquisition fees and other expenses 363 815
Adjustments for derivative instruments, net 111 -
Non-cash interest expense related to amortization on convertible senior notes 2,184 -
Core FFO $ 22,461 $ (5,487)
Core FFO per share $ 0.59 $ (0.14)
Dividends declared per common share $ 0.14 $ -
Weighted average shares - basic and diluted 37,821,364 39,110,969
Contributions to Core FFO per share by segment
SFR $ 0.08 $ (0.09)
NPL $ 0.51 $ (0.05)
Total Core FFO per share $ 0.59 $ (0.14)
(1) Please refer to the “Definitions and Reconciliations” pages of this presentation for definitions of FFO and Core FFO. Core FFO is a non-GAAP measure.
(2) Commencing with the three months ended June 30, 2014, we changed our definition of Core FFO to include adjustments related to share-based compensation and exclude adjustments related to acquisition pursuit costs. The figures shown for the three months ended March 31, 2015 reflect these changes, however, the figures shown for the corresponding period in 2014 remain as reported in our Quarterly Report on Form 10-Q filed with the SEC on May 15, 2014.
10
|
|
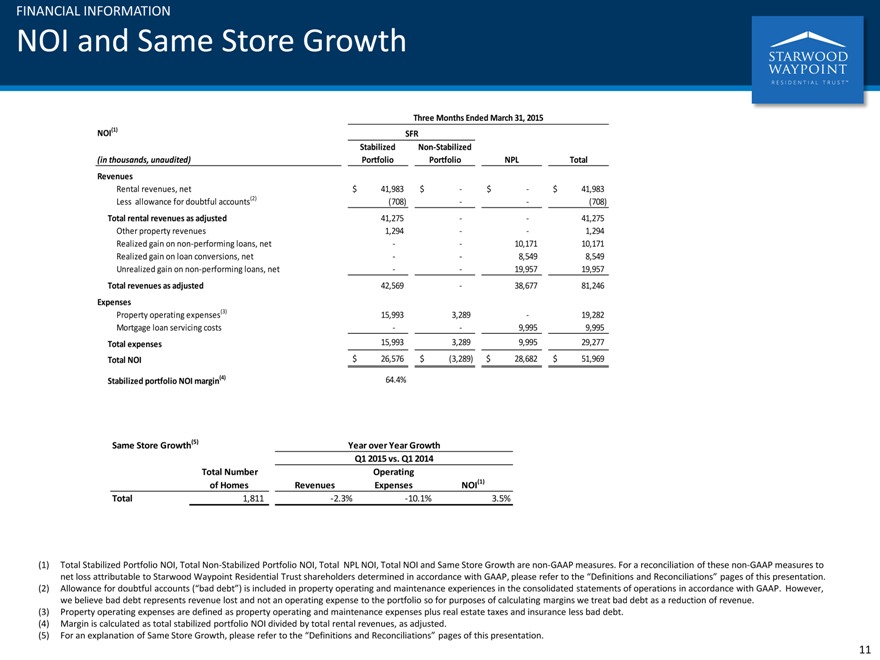
FINANCIAL INFORMATION
NOI and Same Store Growth
Three Months Ended March 31, 2015
NOI(1) SFR
Stabilized Non-Stabilized
(in thousands, unaudited) Portfolio Portfolio NPL Total
Revenues
Rental revenues, net $ 41,983 $—$—$ 41,983
Less allowance for doubtful accounts(2)(708) —(708)
Total rental revenues as adjusted 41,275 — 41,275
Other property revenues 1,294 — 1,294
Realized gain on non-performing loans, net — 10,171 10,171
Realized gain on loan conversions, net — 8,549 8,549
Unrealized gain on non-performing loans, net — 19,957 19,957
Total revenues as adjusted 42,569—38,677 81,246
Expenses
Property operating expenses(3) 15,993 3,289—19,282
Mortgage loan servicing costs — 9,995 9,995
Total expenses 15,993 3,289 9,995 29,277
Total NOI $ 26,576 $(3,289) $ 28,682 $ 51,969
Stabilized portfolio NOI margin(4) 64.4%
Same Store Growth(5) Year over Year Growth
Q1 2015 vs. Q1 2014
Total Number Operating
of Homes Revenues Expenses NOI(1)
Total 1,811 -2.3% -10.1% 3.5%
(1) Total Stabilized Portfolio NOI, Total Non-Stabilized Portfolio NOI, Total NPL NOI, Total NOI and Same Store Growth are non-GAAP measures. For a reconciliation of these non-GAAP measures to net loss attributable to Starwood Waypoint Residential Trust shareholders determined in accordance with GAAP, please refer to the “Definitions and Reconciliations” pages of this presentation.
(2) Allowance for doubtful accounts (“bad debt”) is included in property operating and maintenance experiences in the consolidated statements of operations in accordance with GAAP. However, we believe bad debt represents revenue lost and not an operating expense to the portfolio so for purposes of calculating margins we treat bad debt as a reduction of revenue.
(3) Property operating expenses are defined as property operating and maintenance expenses plus real estate taxes and insurance less bad debt.
(4) Margin is calculated as total stabilized portfolio NOI divided by total rental revenues, as adjusted.
(5) For an explanation of Same Store Growth, please refer to the “Definitions and Reconciliations” pages of this presentation.
11
|
|
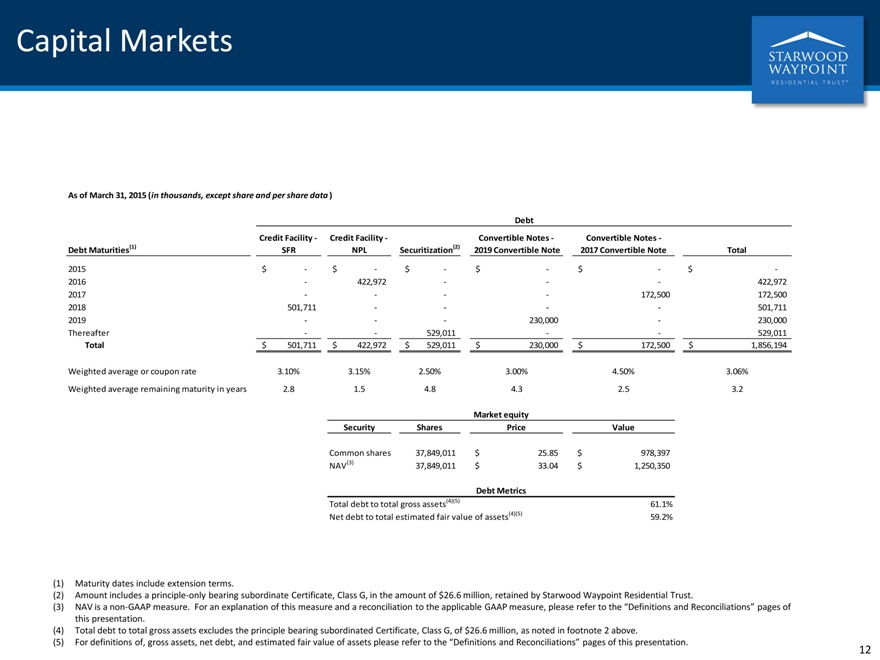
Capital Markets
As of March 31, 2015 (in thousands, except share and per share data )
Debt
Credit Facility—Credit Facility—Convertible Notes—Convertible Notes -
Debt Maturities(1) SFR NPL Securitization(2) 2019 Convertible Note 2017 Convertible Note Total
2015 $—$—$—$—$—$ -
2016—422,972 ——422,972
2017 — — 172,500 172,500
2018 501,711 — — 501,711
2019 ——230,000—230,000
Thereafter — 529,011 — 529,011
Total $ 501,711 $ 422,972 $ 529,011 $ 230,000 $ 172,500 $ 1,856,194
Weighted average or coupon rate 3.10% 3.15% 2.50% 3.00% 4.50% 3.06%
Weighted average remaining maturity in years 2.8 1.5 4.8 4.3 2.5 3.2
Market equity
Security Shares Price Value
Common shares 37,849,011 $ 25.85 $ 978,397
NAV(3) 37,849,011 $ 33.04 $ 1,250,350
Debt Metrics
Total debt to total gross assets(4)(5) 61.1%
Net debt to total estimated fair value of assets(4)(5) 59.2%
(1) Maturity dates include extension terms.
(2) Amount includes a principle-only bearing subordinate Certificate, Class G, in the amount of $26.6 million, retained by Starwood Waypoint Residential Trust.
(3) NAV is a non-GAAP measure. For an explanation of this measure and a reconciliation to the applicable GAAP measure, please refer to the “Definitions and Reconciliations” pages of this presentation.
(4) Total debt to total gross assets excludes the principle bearing subordinated Certificate, Class G, of $26.6 million, as noted in footnote 2 above.
(5) For definitions of, gross assets, net debt, and estimated fair value of assets please refer to the “Definitions and Reconciliations” pages of this presentation.
12
|
|
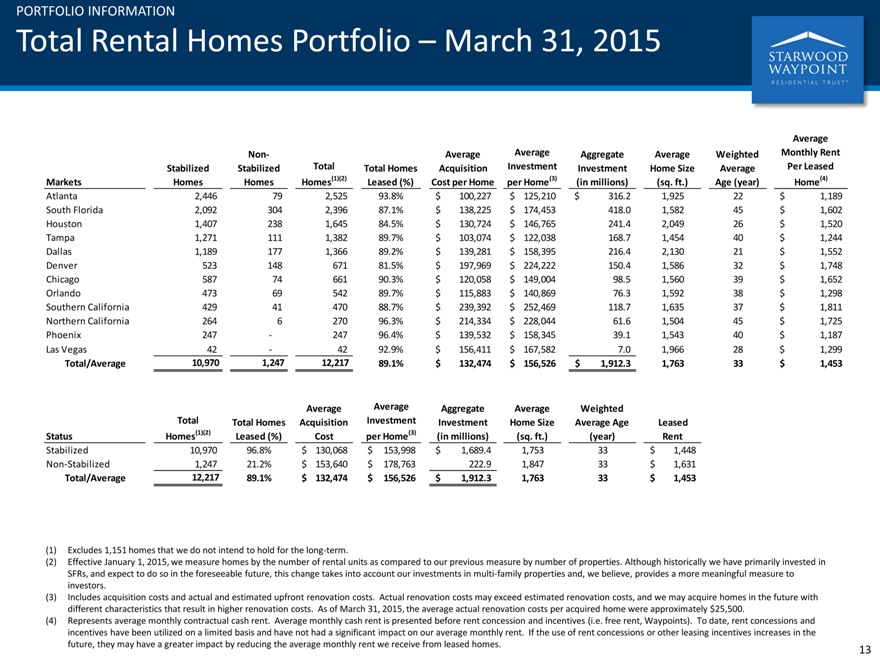
PORTFOLIO INFORMATION
Total Rental Homes Portfolio – March 31, 2015
Average
Non- Average Average Aggregate Average Weighted Monthly Rent
Stabilized Stabilized Total Total Homes Acquisition Investment Investment Home Size Average Per Leased
Markets Homes Homes Homes(1)(2) Leased (%) Cost per Home per Home(3)(in millions)(sq. ft.) Age (year) Home(4)
Atlanta 2,446 79 2,525 93.8% $ 100,227 $ 125,210 $ 316.2 1,925 22 $ 1,189
South Florida 2,092 304 2,396 87.1% $ 138,225 $ 174,453 418.0 1,582 45 $ 1,602
Houston 1,407 238 1,645 84.5% $ 130,724 $ 146,765 241.4 2,049 26 $ 1,520
Tampa 1,271 111 1,382 89.7% $ 103,074 $ 122,038 168.7 1,454 40 $ 1,244
Dallas 1,189 177 1,366 89.2% $ 139,281 $ 158,395 216.4 2,130 21 $ 1,552
Denver 523 148 671 81.5% $ 197,969 $ 224,222 150.4 1,586 32 $ 1,748
Chicago 587 74 661 90.3% $ 120,058 $ 149,004 98.5 1,560 39 $ 1,652
Orlando 473 69 542 89.7% $ 115,883 $ 140,869 76.3 1,592 38 $ 1,298
Southern California 429 41 470 88.7% $ 239,392 $ 252,469 118.7 1,635 37 $ 1,811
Northern California 264 6 270 96.3% $ 214,334 $ 228,044 61.6 1,504 45 $ 1,725
Phoenix 247—247 96.4% $ 139,532 $ 158,345 39.1 1,543 40 $ 1,187
Las Vegas 42—42 92.9% $ 156,411 $ 167,582 7.0 1,966 28 $ 1,299
Total/Average 10,970 1,247 12,217 89.1% $ 132,474 $ 156,526 $ 1,912.3 1,763 33 $ 1,453
Average Average Aggregate Average Weighted
Total Total Homes Acquisition Investment Investment Home Size Average Age Leased
Status Homes(1)(2) Leased (%) Cost per Home(3)(in millions)(sq. ft.)(year) Rent
Stabilized 10,970 96.8% $ 130,068 $ 153,998 $ 1,689.4 1,753 33 $ 1,448
Non-Stabilized 1,247 21.2% $ 153,640 $ 178,763 222.9 1,847 33 $ 1,631
Total/Average 12,217 89.1% $ 132,474 $ 156,526 $ 1,912.3 1,763 33 $ 1,453
(1) Excludes 1,151 homes that we do not intend to hold for the long-term.
(2) Effective January 1, 2015, we measure homes by the number of rental units as compared to our previous measure by number of properties. Although historically we have primarily invested in SFRs, and expect to do so in the foreseeable future, this change takes into account our investments in multi-family properties and, we believe, provides a more meaningful measure to investors.
(3) Includes acquisition costs and actual and estimated upfront renovation costs. Actual renovation costs may exceed estimated renovation costs, and we may acquire homes in the future with different characteristics that result in higher renovation costs. As of March 31, 2015, the average actual renovation costs per acquired home were approximately $25,500.
(4) Represents average monthly contractual cash rent. Average monthly cash rent is presented before rent concession and incentives (i.e. free rent, Waypoints). To date, rent concessions and incentives have been utilized on a limited basis and have not had a significant impact on our average monthly rent. If the use of rent concessions or other leasing incentives increases in the future, they may have a greater impact by reducing the average monthly rent we receive from leased homes.
13
|
|
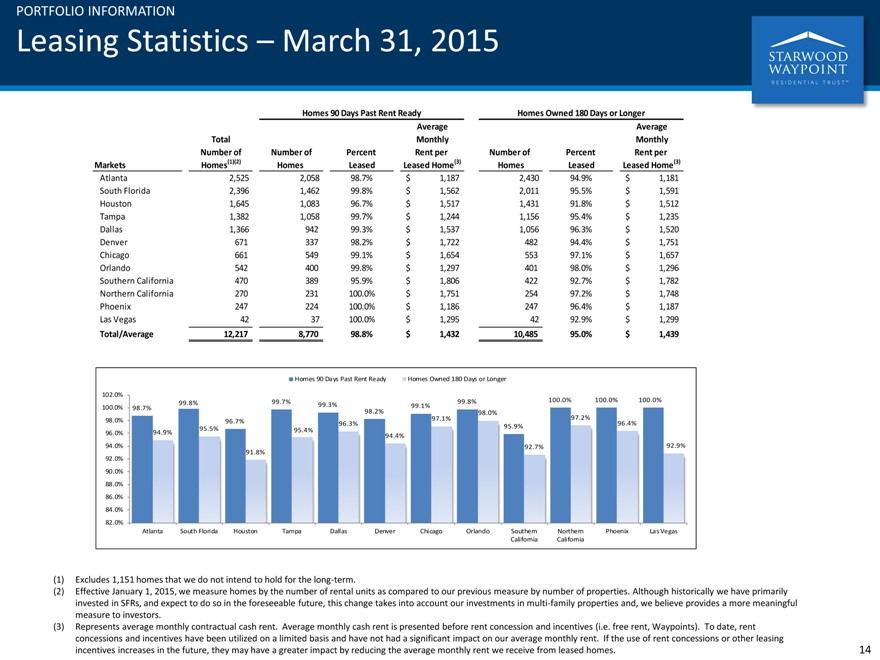
PORTFOLIO INFORMATION
Leasing Statistics – March 31, 2015
Homes 90 Days Past Rent Ready Homes Owned 180 Days or Longer
Average Average
Total Monthly Monthly
Number of Number of Percent Rent per Number of Percent Rent per
Markets Homes(1)(2) Homes Leased Leased Home(3) Homes Leased Leased Home(3)
Atlanta 2,525 2,058 98.7% $ 1,187 2,430 94.9% $ 1,181
South Florida 2,396 1,462 99.8% $ 1,562 2,011 95.5% $ 1,591
Houston 1,645 1,083 96.7% $ 1,517 1,431 91.8% $ 1,512
Tampa 1,382 1,058 99.7% $ 1,244 1,156 95.4% $ 1,235
Dallas 1,366 942 99.3% $ 1,537 1,056 96.3% $ 1,520
Denver 671 337 98.2% $ 1,722 482 94.4% $ 1,751
Chicago 661 549 99.1% $ 1,654 553 97.1% $ 1,657
Orlando 542 400 99.8% $ 1,297 401 98.0% $ 1,296
Southern California 470 389 95.9% $ 1,806 422 92.7% $ 1,782
Northern California 270 231 100.0% $ 1,751 254 97.2% $ 1,748
Phoenix 247 224 100.0% $ 1,186 247 96.4% $ 1,187
Las Vegas 42 37 100.0% $ 1,295 42 92.9% $ 1,299
Total/Average 12,217 8,770 98.8% $ 1,432 10,485 95.0% $ 1,439
Homes 90 Days Past Rent Ready Homes Owned 180 Days or Longer
102.0%
100.0% 98.7% 99.8% 99.7% 99.3% 99.1% 99.8% 100.0% 100.0% 100.0%
98.2% 98.0%
98.0% 96.7% 97.1% 97.2% 96.4%
95.5% 95.4% 96.3% 95.9%
96.0% 94.9% 94.4%
94.0% 92.7% 92.9%
91.8%
92.0%
90.0%
88.0%
86.0%
84.0%
82.0%
Atlanta South Florida Houston Tampa Dallas Denver Chicago Orlando Southern Northern Phoenix Las Vegas
California California
(1) Excludes 1,151 homes that we do not intend to hold for the long-term.
(2) Effective January 1, 2015, we measure homes by the number of rental units as compared to our previous measure by number of properties. Although historically we have primarily invested in SFRs, and expect to do so in the foreseeable future, this change takes into account our investments in multi-family properties and, we believe provides a more meaningful measure to investors.
(3) Represents average monthly contractual cash rent. Average monthly cash rent is presented before rent concession and incentives (i.e. free rent, Waypoints). To date, rent concessions and incentives have been utilized on a limited basis and have not had a significant impact on our average monthly rent. If the use of rent concessions or other leasing incentives increases in the future, they may have a greater impact by reducing the average monthly rent we receive from leased homes.
14
|
|
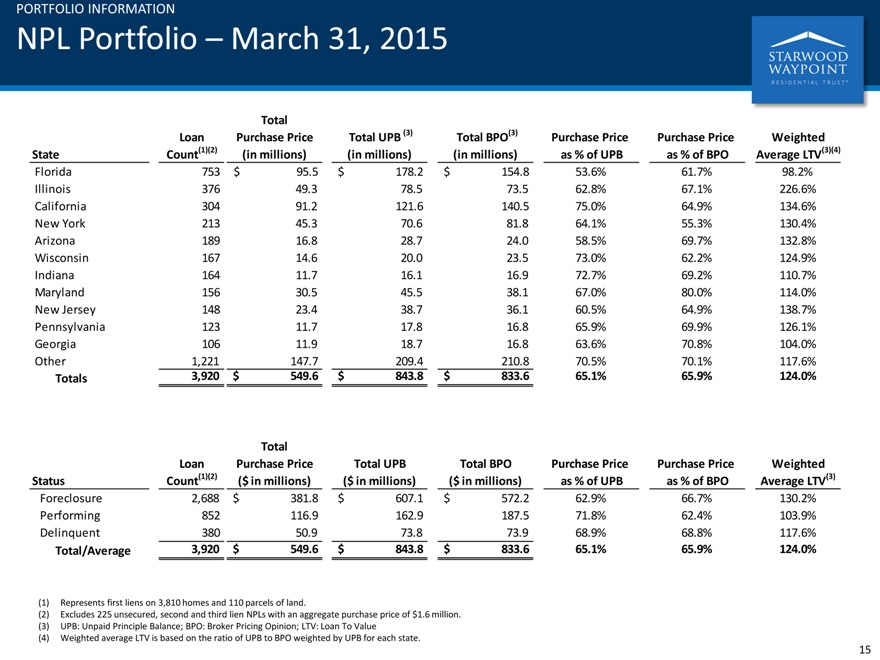
PORTFOLIO INFORMATION
NPL Portfolio – March 31, 2015
Total
Loan Purchase Price Total UPB (3) Total BPO(3) Purchase Price Purchase Price Weighted
State Count(1)(2)(in millions)(in millions)(in millions) as % of UPB as % of BPO Average LTV(3)(4)
Florida 753 $ 95.5 $ 178.2 $ 154.8 53.6% 61.7% 98.2%
Illinois 376 49.3 78.5 73.5 62.8% 67.1% 226.6%
California 304 91.2 121.6 140.5 75.0% 64.9% 134.6%
New York 213 45.3 70.6 81.8 64.1% 55.3% 130.4%
Arizona 189 16.8 28.7 24.0 58.5% 69.7% 132.8%
Wisconsin 167 14.6 20.0 23.5 73.0% 62.2% 124.9%
Indiana 164 11.7 16.1 16.9 72.7% 69.2% 110.7%
Maryland 156 30.5 45.5 38.1 67.0% 80.0% 114.0%
New Jersey 148 23.4 38.7 36.1 60.5% 64.9% 138.7%
Pennsylvania 123 11.7 17.8 16.8 65.9% 69.9% 126.1%
Georgia 106 11.9 18.7 16.8 63.6% 70.8% 104.0%
Other 1,221 147.7 209.4 210.8 70.5% 70.1% 117.6%
Totals 3,920 $ 549.6 $ 843.8 $ 833.6 65.1% 65.9% 124.0%
Total
Loan Purchase Price Total UPB Total BPO Purchase Price Purchase Price Weighted
Status Count(1)(2)($ in millions)($ in millions)($ in millions) as % of UPB as % of BPO Average LTV(3)
Foreclosure 2,688 $ 381.8 $ 607.1 $ 572.2 62.9% 66.7% 130.2%
Performing 852 116.9 162.9 187.5 71.8% 62.4% 103.9%
Delinquent 380 50.9 73.8 73.9 68.9% 68.8% 117.6%
Total/Average 3,920 $ 549.6 $ 843.8 $ 833.6 65.1% 65.9% 124.0%
(1) Represents first liens on 3,810 homes and 110 parcels of land.
(2) Excludes 225 unsecured, second and third lien NPLs with an aggregate purchase price of $1.6 million.
(3) UPB: Unpaid Principle Balance; BPO: Broker Pricing Opinion; LTV: Loan To Value
(4) Weighted average LTV is based on the ratio of UPB to BPO weighted by UPB for each state.
15
|
|
TRANSACTION ACTIVITY
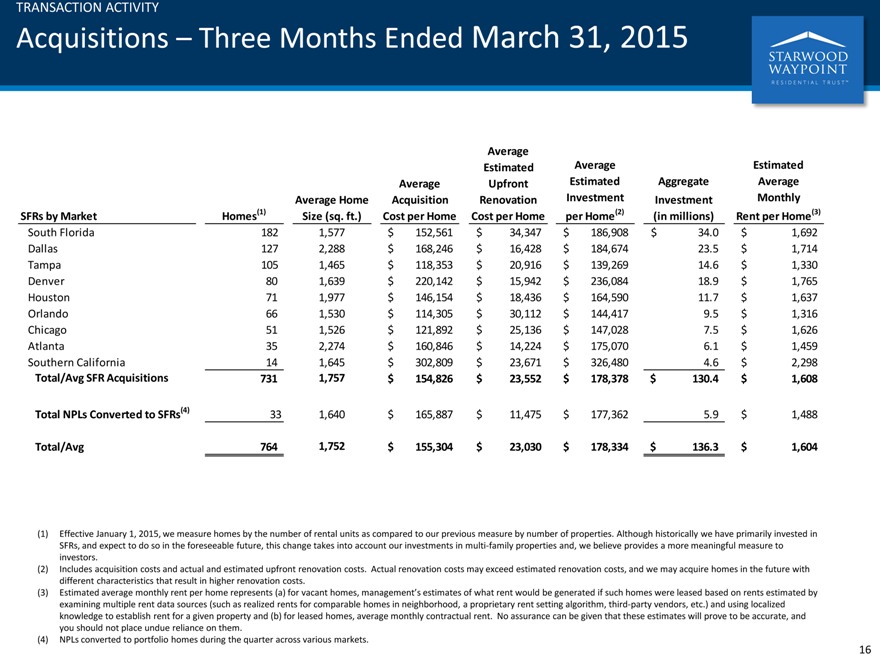
Acquisitions – Three Months Ended March 31, 2015
Average
Estimated Average Estimated
Average Upfront Estimated Aggregate Average
Average Home Acquisition Renovation Investment Investment Monthly
SFRs by Market Homes(1) Size (sq. ft.) Cost per Home Cost per Home per Home(2)(in millions) Rent per Home(3)
South Florida 182 1,577 $ 152,561 $ 34,347 $ 186,908 $ 34.0 $ 1,692
Dallas 127 2,288 $ 168,246 $ 16,428 $ 184,674 23.5 $ 1,714
Tampa 105 1,465 $ 118,353 $ 20,916 $ 139,269 14.6 $ 1,330
Denver 80 1,639 $ 220,142 $ 15,942 $ 236,084 18.9 $ 1,765
Houston 71 1,977 $ 146,154 $ 18,436 $ 164,590 11.7 $ 1,637
Orlando 66 1,530 $ 114,305 $ 30,112 $ 144,417 9.5 $ 1,316
Chicago 51 1,526 $ 121,892 $ 25,136 $ 147,028 7.5 $ 1,626
Atlanta 35 2,274 $ 160,846 $ 14,224 $ 175,070 6.1 $ 1,459
Southern California 14 1,645 $ 302,809 $ 23,671 $ 326,480 4.6 $ 2,298
Total/Avg SFR Acquisitions 731 1,757 $ 154,826 $ 23,552 $ 178,378 $ 130.4 $ 1,608
Total NPLs Converted to SFRs(4) 33 1,640 $ 165,887 $ 11,475 $ 177,362 5.9 $ 1,488
Total/Avg 764 1,752 $ 155,304 $ 23,030 $ 178,334 $ 136.3 $ 1,604
(1) Effective January 1, 2015, we measure homes by the number of rental units as compared to our previous measure by number of properties. Although historically we have primarily invested in SFRs, and expect to do so in the foreseeable future, this change takes into account our investments in multi-family properties and, we believe provides a more meaningful measure to investors.
(2) Includes acquisition costs and actual and estimated upfront renovation costs. Actual renovation costs may exceed estimated renovation costs, and we may acquire homes in the future with different characteristics that result in higher renovation costs.
(3) Estimated average monthly rent per home represents (a) for vacant homes, management’s estimates of what rent would be generated if such homes were leased based on rents estimated by examining multiple rent data sources (such as realized rents for comparable homes in neighborhood, a proprietary rent setting algorithm, third-party vendors, etc.) and using localized knowledge to establish rent for a given property and (b) for leased homes, average monthly contractual rent. No assurance can be given that these estimates will prove to be accurate, and you should not place undue reliance on them.
(4) NPLs converted to portfolio homes during the quarter across various markets.
16
|
|
Definitions and Reconciliations
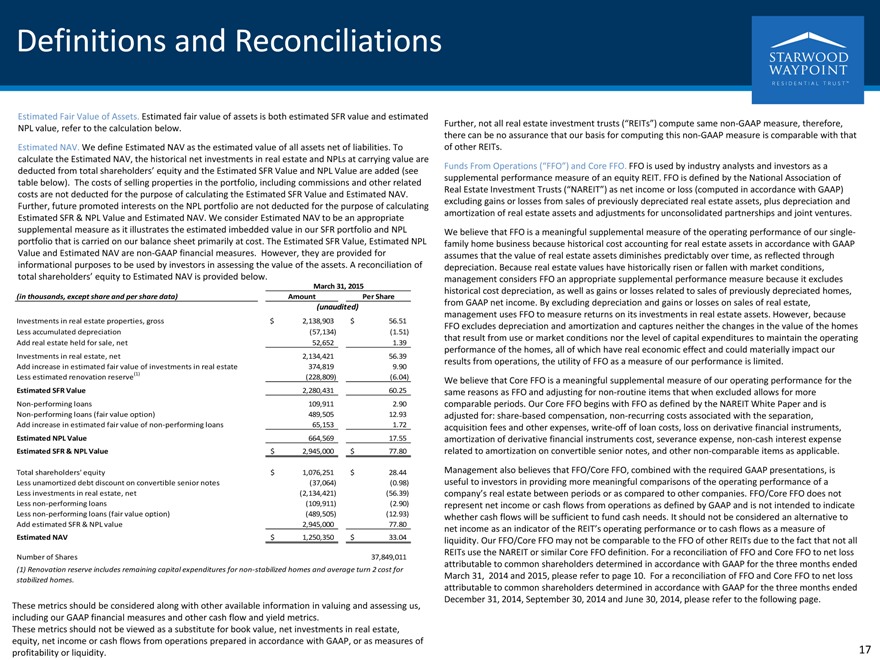
Estimated Fair Value of Assets. Estimated fair value of assets is both estimated SFR value and estimated
NPL value, refer to the calculation below.
Estimated NAV. We define Estimated NAV as the estimated value of all assets net of liabilities. To
calculate the Estimated NAV, the historical net investments in real estate and NPLs at carrying value are
deducted from total shareholders’ equity and the Estimated SFR Value and NPL Value are added (see
table below). The costs of selling properties in the portfolio, including commissions and other related
costs are not deducted for the purpose of calculating the Estimated SFR Value and Estimated NAV.
Further, future promoted interests on the NPL portfolio are not deducted for the purpose of calculating
Estimated SFR & NPL Value and Estimated NAV. We consider Estimated NAV to be an appropriate
supplemental measure as it illustrates the estimated imbedded value in our SFR portfolio and NPL
portfolio that is carried on our balance sheet primarily at cost. The Estimated SFR Value, Estimated NPL
Value and Estimated NAV are non-GAAP financial measures. However, they are provided for
informational purposes to be used by investors in assessing the value of the assets. A reconciliation of
total shareholders’ equity to Estimated NAV is provided below.
March 31, 2015
(in thousands, except share and per share data) Amount Per Share
(unaudited)
Investments in real estate properties, gross $ 2,138,903 $ 56.51
Less accumulated depreciation(57,134)(1.51)
Add real estate held for sale, net 52,652 1.39
Investments in real estate, net 2,134,421 56.39
Add increase in estimated fair value of investments in real estate 374,819 9.90
Less estimated renovation reserve(1)(228,809)(6.04)
Estimated SFR Value 2,280,431 60.25
Non-performing loans 109,911 2.90
Non-performing loans (fair value option) 489,505 12.93
Add increase in estimated fair value of non-performing loans 65,153 1.72
Estimated NPL Value 664,569 17.55
Estimated SFR & NPL Value $ 2,945,000 $ 77.80
Total shareholders’ equity $ 1,076,251 $ 28.44
Less unamortized debt discount on convertible senior notes(37,064)(0.98)
Less investments in real estate, net(2,134,421)(56.39)
Less non-performing loans(109,911)(2.90)
Less non-performing loans (fair value option)(489,505)(12.93)
Add estimated SFR & NPL value 2,945,000 77.80
Estimated NAV $ 1,250,350 $ 33.04
Number of Shares 37,849,011
(1) Renovation reserve includes remaining capital expenditures for non-stabilized homes and average turn 2 cost for
stabilized homes.
These metrics should be considered along with other available information in valuing and assessing us,
including our GAAP financial measures and other cash flow and yield metrics.
These metrics should not be viewed as a substitute for book value, net investments in real estate,
equity, net income or cash flows from operations prepared in accordance with GAAP, or as measures of
profitability or liquidity.
Further, not all real estate investment trusts (“REITs”) compute same non-GAAP measure, therefore, there can be no assurance that our basis for computing this non-GAAP measure is comparable with that of other REITs.
Funds From Operations (“FFO”) and Core FFO.
FFO is used by industry analysts and investors as a supplemental performance measure of an equity REIT. FFO is defined by the National Association of Real Estate Investment Trusts (“NAREIT”) as net income or loss (computed in accordance with GAAP) excluding gains or losses from sales of previously depreciated real estate assets, plus depreciation and amortization of real estate assets and adjustments for unconsolidated partnerships and joint ventures.
We believe that FFO is a meaningful supplemental measure of the operating performance of our single-family home business because historical cost accounting for real estate assets in accordance with GAAP assumes that the value of real estate assets diminishes predictably over time, as reflected through depreciation. Because real estate values have historically risen or fallen with market conditions, management considers FFO an appropriate supplemental performance measure because it excludes historical cost depreciation, as well as gains or losses related to sales of previously depreciated homes, from GAAP net income. By excluding depreciation and gains or losses on sales of real estate, management uses FFO to measure returns on its investments in real estate assets. However, because FFO excludes depreciation and amortization and captures neither the changes in the value of the homes that result from use or market conditions nor the level of capital expenditures to maintain the operating performance of the homes, all of which have real economic effect and could materially impact our results from operations, the utility of FFO as a measure of our performance is limited.
We believe that Core FFO is a meaningful supplemental measure of our operating performance for the same reasons as FFO and adjusting for non-routine items that when excluded allows for more comparable periods. Our Core FFO begins with FFO as defined by the NAREIT White Paper and is adjusted for: share-based compensation, non-recurring costs associated with the separation, acquisition fees and other expenses, write-off of loan costs, loss on derivative financial instruments, amortization of derivative financial instruments cost, severance expense, non-cash interest expense related to amortization on convertible senior notes, and other non-comparable items as applicable. Management also believes that FFO/Core FFO, combined with the required GAAP presentations, is useful to investors in providing more meaningful comparisons of the operating performance of a company’s real estate between periods or as compared to other companies. FFO/Core FFO does not represent net income or cash flows from operations as defined by GAAP and is not intended to indicate whether cash flows will be sufficient to fund cash needs. It should not be considered an alternative to net income as an indicator of the REIT’s operating performance or to cash flows as a measure of liquidity. Our FFO/Core FFO may not be comparable to the FFO of other REITs due to the fact that not all REITs use the NAREIT or similar Core FFO definition. For a reconciliation of FFO and Core FFO to net loss attributable to common shareholders determined in accordance with GAAP for the three months ended March 31, 2014 and 2015, please refer to page 10. For a reconciliation of FFO and Core FFO to net loss attributable to common shareholders determined in accordance with GAAP for the three months ended December 31, 2014, September 30, 2014 and June 30, 2014, please refer to the following page.
17
|
|
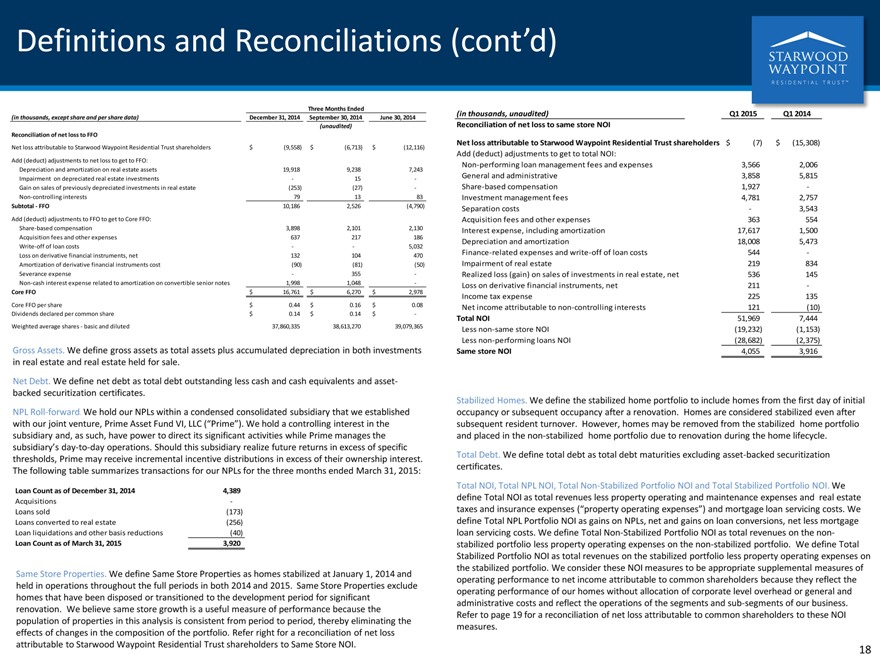
Definitions and Reconciliations (cont’d)
Three Months Ended
(in thousands, except share and per share data) December 31, 2014 September 30, 2014 June 30, 2014
(unaudited)
Reconciliation of net loss to FFO
Net loss attributable to Starwood Waypoint Residential Trust shareholders $(9,558) $(6,713) $(12,116)
Add (deduct) adjustments to net loss to get to FFO:
Depreciation and amortization on real estate assets 19,918 9,238 7,243
Impairment on depreciated real estate investments—15 -
Gain on sales of previously depreciated investments in real estate(253)(27) -
Non-controlling interests 79 13 83
Subtotal—FFO 10,186 2,526(4,790)
Add (deduct) adjustments to FFO to get to Core FFO:
Share-based compensation 3,898 2,101 2,130
Acquisition fees and other expenses 637 217 186
Write-off of loan costs — 5,032
Loss on derivative financial instruments, net 132 104 470
Amortization of derivative financial instruments cost(90)(81)(50)
Severance expense—355 -
Non-cash interest expense related to amortization on convertible senior notes 1,998 1,048 -
Core FFO $ 16,761 $ 6,270 $ 2,978
Core FFO per share $ 0.44 $ 0.16 $ 0.08
Dividends declared per common share $ 0.14 $ 0.14 $ -
Weighted average shares—basic and diluted 37,860,335 38,613,270 39,079,365
Gross Assets. We define gross assets as total assets plus accumulated depreciation in both investments
in real estate and real estate held for sale.
Net Debt. We define net debt as total debt outstanding less cash and cash equivalents and asset-
backed securitization certificates.
NPL Roll-forward. We hold our NPLs within a condensed consolidated subsidiary that we established
with our joint venture, Prime Asset Fund VI, LLC (“Prime”). We hold a controlling interest in the
subsidiary and, as such, have power to direct its significant activities while Prime manages the
subsidiary’s day-to-day operations. Should this subsidiary realize future returns in excess of specific
thresholds, Prime may receive incremental incentive distributions in excess of their ownership interest.
The following table summarizes transactions for our NPLs for the three months ended March 31, 2015:
Loan Count as of December 31, 2014 4,389
Acquisitions -
Loans sold(173)
Loans converted to real estate(256)
Loan liquidations and other basis reductions(40)
Loan Count as of March 31, 2015 3,920
Same Store Properties. We define Same Store Properties as homes stabilized at January 1, 2014 and
held in operations throughout the full periods in both 2014 and 2015. Same Store Properties exclude
homes that have been disposed or transitioned to the development period for significant
renovation. We believe same store growth is a useful measure of performance because the
population of properties in this analysis is consistent from period to period, thereby eliminating the
effects of changes in the composition of the portfolio. Refer right for a reconciliation of net loss
attributable to Starwood Waypoint Residential Trust shareholders to Same Store NOI.
(in thousands, unaudited) Q1 2015 Q1 2014
Reconciliation of net loss to same store NOI
Net loss attributable to Starwood Waypoint Residential Trust shareholders $(7) $ (15,308)
Add (deduct) adjustments to get to total NOI:
Non-performing loan management fees and expenses 3,566 2,006
General and administrative 3,858 5,815
Share-based compensation 1,927 -
Investment management fees 4,781 2,757
Separation costs—3,543
Acquisition fees and other expenses 363 554
Interest expense, including amortization 17,617 1,500
Depreciation and amortization 18,008 5,473
Finance-related expenses and write-off of loan costs 544 -
Impairment of real estate 219 834
Realized loss (gain) on sales of investments in real estate, net 536 145
Loss on derivative financial instruments, net 211 -
Income tax expense 225 135
Net income attributable to non-controlling interests 121(10)
Total NOI 51,969 7,444
Less non-same store NOI(19,232)(1,153)
Less non-performing loans NOI(28,682)(2,375)
Same store NOI 4,055 3,916
Stabilized Homes. We define the stabilized home portfolio to include homes from the first day of initial
occupancy or subsequent occupancy after a renovation. Homes are considered stabilized even after
subsequent resident turnover. However, homes may be removed from the stabilized home portfolio
and placed in the non-stabilized home portfolio due to renovation during the home lifecycle.
Total Debt. We define total debt as total debt maturities excluding asset-backed securitization
certificates.
Total NOI, Total NPL NOI, Total Non-Stabilized Portfolio NOI and Total Stabilized Portfolio NOI. We
define Total NOI as total revenues less property operating and maintenance expenses and real estate
taxes and insurance expenses (“property operating expenses”) and mortgage loan servicing costs. We
define Total NPL Portfolio NOI as gains on NPLs, net and gains on loan conversions, net less mortgage
loan servicing costs. We define Total Non-Stabilized Portfolio NOI as total revenues on the non-
stabilized portfolio less property operating expenses on the non-stabilized portfolio. We define Total
Stabilized Portfolio NOI as total revenues on the stabilized portfolio less property operating expenses on
the stabilized portfolio. We consider these NOI measures to be appropriate supplemental measures of
operating performance to net income attributable to common shareholders because they reflect the
operating performance of our homes without allocation of corporate level overhead or general and
administrative costs and reflect the operations of the segments and sub-segments of our business.
Refer to page 19 for a reconciliation of net loss attributable to common shareholders to these NOI
measures.
18
|
|
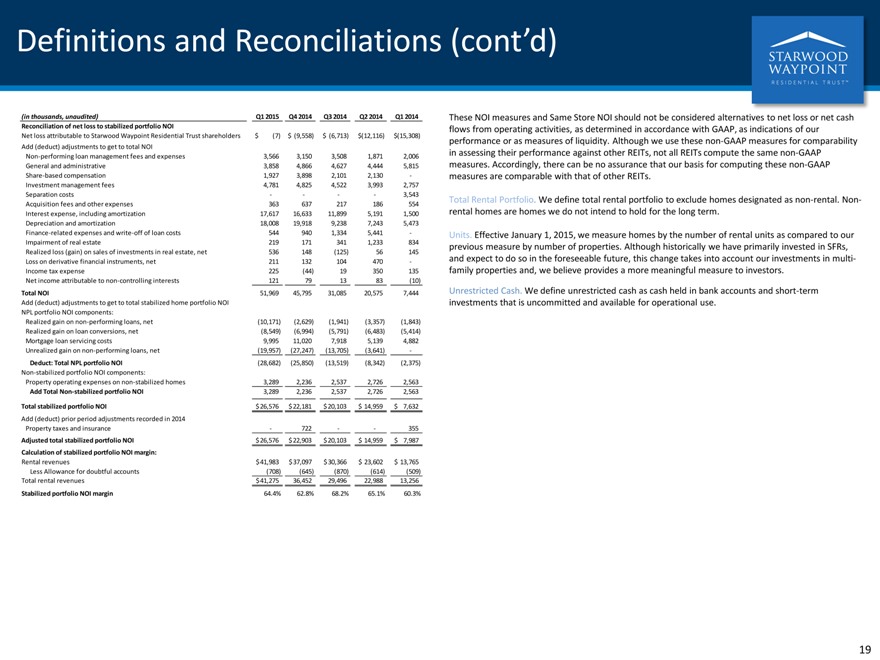
Definitions and Reconciliations (cont’d)
(in thousands, unaudited) Q1 2015 Q4 2014 Q3 2014 Q2 2014 Q1 2014
Reconciliation of net loss to stabilized portfolio NOI
Net loss attributable to Starwood Waypoint Residential Trust shareholders $ (7) $ (9,558) $ (6,713) $(12,116) $(15,308)
Add (deduct) adjustments to get to total NOI
Non-performing loan management fees and expenses 3,566 3,150 3,508 1,871 2,006
General and administrative 3,858 4,866 4,627 4,444 5,815
Share-based compensation 1,927 3,898 2,101 2,130 -
Investment management fees 4,781 4,825 4,522 3,993 2,757
Separation costs — — 3,543
Acquisition fees and other expenses 363 637 217 186 554
Interest expense, including amortization 17,617 16,633 11,899 5,191 1,500
Depreciation and amortization 18,008 19,918 9,238 7,243 5,473
Finance-related expenses and write-off of loan costs 544 940 1,334 5,441 -
Impairment of real estate 219 171 341 1,233 834
Realized loss (gain) on sales of investments in real estate, net 536 148(125) 56 145
Loss on derivative financial instruments, net 211 132 104 470 -
Income tax expense 225(44) 19 350 135
Net income attributable to non-controlling interests 121 79 13 83(10)
Total NOI 51,969 45,795 31,085 20,575 7,444
Add (deduct) adjustments to get to total stabilized home portfolio NOI
NPL portfolio NOI components:
Realized gain on non-performing loans, net(10,171)(2,629)(1,941)(3,357)(1,843)
Realized gain on loan conversions, net(8,549)(6,994)(5,791)(6,483)(5,414)
Mortgage loan servicing costs 9,995 11,020 7,918 5,139 4,882
Unrealized gain on non-performing loans, net(19,957)(27,247)(13,705)(3,641) -
Deduct: Total NPL portfolio NOI(28,682)(25,850)(13,519)(8,342)(2,375)
Non-stabilized portfolio NOI components:
Property operating expenses on non-stabilized homes 3,289 2,236 2,537 2,726 2,563
Add Total Non-stabilized portfolio NOI 3,289 2,236 2,537 2,726 2,563
Total stabilized portfolio NOI $26,576 $22,181 $20,103 $ 14,959 $ 7,632
Add (deduct) prior period adjustments recorded in 2014
Property taxes and insurance—722 — 355
Adjusted total stabilized portfolio NOI $26,576 $22,903 $20,103 $ 14,959 $ 7,987
Calculation of stabilized portfolio NOI margin:
Rental revenues $41,983 $37,097 $30,366 $ 23,602 $ 13,765
Less Allowance for doubtful accounts(708)(645)(870)(614)(509)
Total rental revenues $41,275 36,452 29,496 22,988 13,256
Stabilized portfolio NOI margin 64.4% 62.8% 68.2% 65.1% 60.3%
These NOI measures and Same Store NOI should not be considered alternatives to net loss or net cash flows from operating activities, as determined in accordance with GAAP, as indications of our performance or as measures of liquidity. Although we use these non-GAAP measures for comparability in assessing their performance against other REITs, not all REITs compute the same non-GAAP measures. Accordingly, there can be no assurance that our basis for computing these non-GAAP measures are comparable with that of other REITs.
Total Rental Portfolio. We define total rental portfolio to exclude homes designated as non-rental. Non-rental homes are homes we do not intend to hold for the long term.
Units. Effective January 1, 2015, we measure homes by the number of rental units as compared to our previous measure by number of properties. Although historically we have primarily invested in SFRs, and expect to do so in the foreseeable future, this change takes into account our investments in multi-family properties and, we believe provides a more meaningful measure to investors.
Unrestricted Cash. We define unrestricted cash as cash held in bank accounts and short-term investments that is uncommitted and available for operational use.
19
|
|
Forward-Looking Statements
The statements herein that are not historical facts, and the assumptions upon which those statements are based, are forward-looking statements within the meaning of the Private Securities Litigation Reform Act of 1995,Section 27A of the Securities Act of 1933, as amended, and Section 21E of the Securities Exchange Act of 1934, as amended. These forward-looking statements involve significant risks and uncertainties, which are difficult to predict, and are not guarantees of future performance. Such statements can generally be identified by words such as “anticipates,” “expects,” “intends,” “will,” “could,” “believes,” “estimates,” “continue,” and similar expressions. Forward-looking statements are based on certain assumptions, discuss future expectations, describe future plans and strategies, contain financial and operating projections or state other forward-looking information. Our ability to predict results or the actual effect of future events, actions, plans or strategies is inherently uncertain. Although we believe that the expectations reflected in such forward-looking statements are based on reasonable assumptions, our actual results and performance could differ materially from those set forth in, or implied by, the forward-looking statements. Factors that could materially and adversely affect our business, financial condition, liquidity, results of operations and prospects, as well as our ability to make distributions to our shareholders, include, but are not limited to: expectations regarding the timing of generating revenues; changes in our business and growth strategies; volatility in the real estate industry, interest rates and spreads, the debt or equity markets, the economy generally or the rental home market specifically; events or circumstances that undermine confidence in the financial markets or otherwise have a broad impact on financial markets; declines in the value of homes, and macroeconomic shifts in demand for, and competition in the supply of, rental homes; the availability of attractive investment opportunities in homes that satisfy our investment objective and business and growth strategies; the impact of changes to the supply of, value of and the returns on NPLs; our ability to convert the homes and NPLs we acquire into rental homes generating attractive returns; our ability to successfully modify or otherwise resolve NPLs; our ability to lease or re-lease our rental homes to qualified residents on attractive terms or at all; the failure of residents to pay rent when due or otherwise perform their lease obligations; our ability to manage our portfolio of rental homes; the concentration of credit risks to which we are exposed; the availability, terms and deployment of short-term and long-term capital; the adequacy of our cash reserves and working capital; our relationships with Starwood Capital Group, L.P., and our manager and their ability to retain qualified personnel; potential conflicts of interest; unanticipated increases in financing and other costs; our expected leverage; changes in governmental regulations, tax laws and rates and similar matters; limitations imposed on our business and our ability to satisfy complex rules in order for us to qualify as a REIT for U.S. federal income tax purposes; and estimates relating to our ability to make distributions to our shareholders in the future. You should not place undue reliance on any forward-looking statement and should consider all of the uncertainties and risks described above, as well as those more fully discussed in reports and other documents filed by us with the Securities and Exchange Commission from time to time. Furthermore, except as required by law, we are under no duty to, and we do not intend to, update any of our forward-looking statements appearing herein, whether as a result of new information, future events or otherwise.