Attached files
| file | filename |
|---|---|
| EX-23.3 - EX-23.3 - PAR PHARMACEUTICAL HOLDINGS, INC. | d880840dex233.htm |
| EX-23.2 - EX-23.2 - PAR PHARMACEUTICAL HOLDINGS, INC. | d880840dex232.htm |
| EX-23.4 - EX-23.4 - PAR PHARMACEUTICAL HOLDINGS, INC. | d880840dex234.htm |
Table of Contents
As filed with the Securities and Exchange Commission on May 11, 2015
Registration No. 333-202710
UNITED STATES
SECURITIES AND EXCHANGE COMMISSION
Washington, D.C. 20549
AMENDMENT NO. 2
TO
FORM S-1
REGISTRATION STATEMENT
UNDER
THE SECURITIES ACT OF 1933
Par Pharmaceutical Holdings, Inc.
(Exact name of registrant as specified in its charter)
| Delaware | 2834 | 46-0634834 | ||
| (State or other jurisdiction of incorporation or organization) |
(Primary Standard Industrial Classification Code Number) |
(I.R.S. Employer Identification Number) |
One Ram Ridge Road
Chestnut Ridge, New York 10977
(845) 573-5500
(Address, including zip code, and telephone number, including area code, of registrant’s principal executive offices)
Paul V. Campanelli
Chief Executive Officer
Par Pharmaceutical Holdings, Inc.
One Ram Ridge Road
Chestnut Ridge, New York 10977
(845) 573-5500
(Name, address, including zip code, and telephone number, including area code, of agent for service)
Copies to:
| Patrick O’Brien, Esq. Ropes & Gray LLP Prudential Tower 800 Boylston Street Boston, MA 02199 (617) 951-7000 |
Barry J. Gilman, Esq. Par Pharmaceutical Holdings, Inc. One Ram Ridge Road Chestnut Ridge, New York 10977 (845) 573-5500 |
William V. Fogg, Esq. Cravath, Swaine & Moore LLP Worldwide Plaza 825 Eighth Avenue New York, New York 10019 (212) 474-1000 |
Approximate date of commencement of proposed sale to public: As soon as practicable after this Registration Statement is declared effective.
If any of the securities being registered on this Form are to be offered on a delayed or continuous basis pursuant to Rule 415 under the Securities Act of 1933, check the following box. ¨
If this Form is filed to register additional securities for an offering pursuant to Rule 462(b) under the Securities Act, check the following box and list the Securities Act registration statement number of the earlier effective registration statement for the same offering. ¨
If this Form is a post-effective amendment filed pursuant to Rule 462(c) under the Securities Act, check the following box and list the Securities Act registration statement number of the earlier effective registration statement for the same offering. ¨
If this Form is a post-effective amendment filed pursuant to Rule 462(d) under the Securities Act, check the following box and list the Securities Act registration statement number of the earlier effective registration statement for the same offering. ¨
Indicate by check mark whether the registrant is a large accelerated filer, an accelerated filer, a non-accelerated filer, or a smaller reporting company. See the definitions of “large accelerated filer,” “accelerated filer” and “smaller reporting company” in Rule 12b-2 of the Exchange Act.
|
Large accelerated filer ¨ |
Accelerated filer ¨ | Non-accelerated filer x | Smaller reporting company ¨ | |||
| (Do not check if a smaller reporting company) |
The Registrant hereby amends this Registration Statement on such date or dates as may be necessary to delay its effective date until the Registrant shall file a further amendment which specifically states that this Registration Statement shall thereafter become effective in accordance with Section 8(a) of the Securities Act of 1933 or until the Registration Statement shall become effective on such date as the Securities and Exchange Commission, acting pursuant to said Section 8(a), may determine.
Table of Contents
The information in this prospectus is not complete and may be changed. These securities may not be sold until the registration statement filed with the Securities and Exchange Commission is effective. This prospectus is not an offer to sell these securities and we are not soliciting an offer to buy these securities in any jurisdiction where the offer or sale is not permitted.
Subject to completion
Preliminary prospectus dated May 11, 2015
Prospectus
shares

Par Pharmaceutical Holdings, Inc.
Common stock
This is the initial public offering of common stock of Par Pharmaceutical Holdings, Inc. We are selling shares of our common stock and the selling stockholders identified in this prospectus are selling shares of our common stock. We will not receive any proceeds from the sale of shares being sold by the selling stockholders.
Prior to the offering, there has been no public market for our common stock. We expect the public offering price to be between $ and $ per share. We intend to apply to have our common stock listed on the New York Stock Exchange under the symbol “PRX.”
We and the selling stockholders have granted the underwriters an option to purchase up to an additional shares of our common stock at the public offering price, less the underwriting discount, for 30 days after the date of this prospectus.
After the completion of this offering, investment funds affiliated with TPG Global, LLC will continue to own a majority of the voting power of our outstanding shares of common stock. As a result, we expect to be a “controlled company” within the meaning of the corporate governance standards of the New York Stock Exchange. See “Principal and selling stockholders.”
Investing in the common stock involves risks. See ‘‘Risk factors’’ beginning on page 19 of this prospectus.
Neither the Securities and Exchange Commission nor any state securities commission has approved or disapproved of these securities or determined if this prospectus is truthful and complete. Any representation to the contrary is a criminal offense.
| Per share | Total | |||||||
| Public offering price |
$ | $ | ||||||
| Underwriting discount |
$ | $ | ||||||
| Proceeds to us, before expenses(1) |
$ | $ | ||||||
| Proceeds to selling stockholders, before expenses |
$ | $ | ||||||
| (1) | We have agreed to reimburse the underwriters for certain expenses in connection with this offering. See “Underwriting (conflicts of interest).” |
The underwriters expect to deliver the shares of common stock to investors on or about , 2015.
| J.P. Morgan | Goldman, Sachs & Co. | |||||
| Citigroup | Morgan Stanley | |||||
| BofA Merrill Lynch | Deutsche Bank Securities | Evercore ISI | ||
| RBC Capital Markets | TPG Capital BD, LLC | BMO Capital Markets | Mizuho | |||
Prospectus dated , 2015.
Table of Contents
| 1 | ||||
| 19 | ||||
| 52 | ||||
| 54 | ||||
| 55 | ||||
| 56 | ||||
| 57 | ||||
| 59 | ||||
| Management’s discussion and analysis of financial condition and results of operations |
65 | |||
| 115 | ||||
| 147 | ||||
| 155 | ||||
| 180 | ||||
| 182 | ||||
| 184 | ||||
| 189 | ||||
| 193 | ||||
| Material United States federal income tax considerations for non-U.S. holders |
195 | |||
| 200 | ||||
| 212 | ||||
| 212 | ||||
| 212 | ||||
| F-1 | ||||
You should rely only on the information contained in this prospectus or in any free writing prospectus that we authorize to be distributed to you. Neither we nor the underwriters have authorized anyone to provide you with different information, and neither we nor the underwriters take responsibility for any other information others may give you. We are not, and the underwriters are not, making an offer to sell these securities in any jurisdiction where the offer or sale is not permitted. You should not assume that the information contained in this prospectus is accurate as of any date other than the date on the front cover, regardless of time of delivery of this prospectus or of any sale of our common stock. Our business, prospects, financial condition and results of operations may have changed since that date.
i
Table of Contents
Industry and market data
This prospectus includes market share, ranking, industry data and forecasts that we obtained from industry publications and surveys, including from IMS Health Incorporated (“IMS Health”) and EvaluatePharma, a service of Evaluate Ltd., public filings and internal company sources. Industry publications, surveys and forecasts generally state that the information contained therein has been obtained from sources believed to be reliable, although they do not guarantee the accuracy or completeness of such information. Statements as to our market position and ranking are based on market data currently available to us, management’s estimates, and assumptions we have made regarding the size of our markets within our industry.
Trademarks and service marks
We own or have rights to trademarks, service marks or trade names that we use in connection with the operation of our business. For example, our names and logos are protected. Some of the trademarks we own or have the right to use include “Par,” “Par Pharmaceutical,” “Par Pharmaceutical Companies, Inc.,” “Par Formulations,” “Nascobal,” “Megace,” “Vasostrict,” “Adrenalin” and “Aplisol.” We have applied for trademarks of “Par Specialty Pharmaceuticals” and “Par Sterile Products.” All other trademarks or service marks appearing in this prospectus that are not identified as marks owned by us are the property of their respective owners.
Solely for convenience, the trademarks, service marks and trade names referred to in this prospectus may be listed without the ®, SM and TM symbols, but we will assert, to the fullest extent under applicable law, our rights or the rights of the applicable licensors to these trademarks, service marks and trade names.
ii
Table of Contents
This summary highlights information contained in other parts of this prospectus. Because it is only a summary, it does not contain all of the information that you should consider before investing in shares of our common stock and it is qualified in its entirety by, and should be read in conjunction with, the more detailed information appearing elsewhere in this prospectus. You should read the entire prospectus carefully, especially “Risk factors” and our financial statements and the related notes, before deciding to buy shares of our common stock. This summary contains forward-looking statements that involve risks and uncertainties. Our actual results may differ significantly from the results discussed in the forward-looking statements as a result of certain factors, including those set forth in “Risk factors” and “Cautionary note regarding forward-looking statements.”
In this prospectus, the terms “we,” “us,” “our,” “Company,” “Issuer” and other similar terms refer to Par Pharmaceutical Holdings, Inc. and its subsidiaries, including Par Pharmaceutical Companies, Inc. (“Par Pharmaceutical Companies”), unless expressly stated otherwise or the context otherwise requires. References in this prospectus to fiscal years are to our fiscal years, which end on December 31.
On September 28, 2012, pursuant to an Agreement and Plan of Merger, we were acquired by investment funds affiliated with TPG Global, LLC (together with its affiliates, “TPG” or the “Sponsor”) and certain co-investors (the “Merger”). Please note that our discussion of certain financial information for the year ended December 31, 2012 includes data from the “Predecessor” period, which covers the period preceding the Merger (January 1, 2012 to September 28, 2012) and data from the “Successor” period, which covers the period following the inception of the Company (July 12, 2012 (date of “inception”) to December 31, 2012), on a combined basis. Although this presentation of financial information on a combined basis does not comply with U.S. generally accepted accounting principles (“GAAP”), we believe it provides a reasonable method of comparison to the other periods presented in this prospectus. The data is being presented for analytical purposes only. Combined operating results (i) have not been prepared on a pro forma basis as if the Merger occurred on the first day of the period, (ii) may not reflect the actual results we would have achieved absent the Merger and (iii) may not be predictive of future results of operations.
Our company
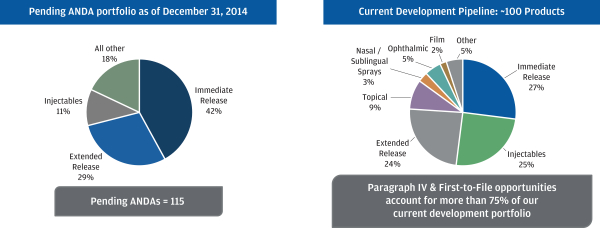
We are a leading U.S. pharmaceutical company specializing in developing, licensing, manufacturing, marketing and distributing generic drugs. We have a generics portfolio of approximately 95 products across an extensive range of dosage forms and delivery systems, including immediate and extended release oral solids (tablets, orally disintegrating tablets, capsules and powders), injectables, nasal sprays, ophthalmics (which are sterile pharmaceutical preparations administered for ocular conditions) and transdermal patches (which are medicated adhesive patches designed to deliver the drug through the skin). Our focus is on high-barrier-to-entry products that are difficult to formulate, difficult to manufacture or face complex legal and regulatory challenges. These products often see limited competition, tend to be more profitable than commoditized generic drugs and often have longer life cycles. We have an integrated team-based approach to product development that combines our formulation, regulatory, legal, manufacturing and commercial capabilities. As of December 31, 2014, we had over 200 products in our pipeline, which included 115 Abbreviated New Drug Applications (“ANDA”) pending with the U.S. Food and Drug Administration (the “FDA”) representing $36.7 billion of combined annual sales for the corresponding branded products (“branded product sales”) in 2014, including 32 potential first-to-file and six potential first-to-market opportunities.
Our company operates in two business segments, Par Pharmaceutical, which includes generic products marketed under Par Pharmaceutical and sterile products marketed under Par Sterile Products, LLC (“Par
1
Table of Contents
Sterile,” formerly known as JHP Pharmaceuticals, LLC), and Par Specialty Pharmaceuticals (“Par Specialty,” formerly known as Strativa Pharmaceuticals), which markets two branded products. For the year ended December 31, 2014, we had revenue of $1,308.6 million and adjusted EBITDA of $433.8 million. Our product development strategy and ability to execute strategic transactions has resulted in a compound annual revenue growth rate of 12.2% and an adjusted EBITDA compound annual growth rate of 20.4% over the last three years. Our goal is to strengthen our position as a leading pharmaceutical company by developing and commercializing generic drugs with limited competition, significant barriers to entry and longer life cycles.
Our approach to product development is to target high-barrier-to-entry generic products, including first-to-file or first-to-market opportunities. A “first-to-file” product refers to an ANDA that is the first ANDA filed containing a Paragraph IV patent challenge to the corresponding branded product, which offers the opportunity for 180 days of generic marketing exclusivity if approved by the FDA and if we are successful in litigating the patent challenge. A “first-to-market” product refers to a product that is the first marketed generic equivalent of a branded product for reasons apart from statutory marketing exclusivity, such as the generic equivalent of a branded product that is difficult to formulate or manufacture. Our potential first-to-file and first-to-market opportunities account for 33% of our pipeline of 115 ANDAs, which we believe is one of the highest in the industry and demonstrates our differentiated development capabilities. As a result, more than half of our generic adjusted gross margin in 2014 was earned from products that are either exclusive or have two or fewer competitors, which we believe leads to more sustainable market share and profitability for our product portfolio.
We have invested significant resources and focus to expand our technology capabilities to develop a range of products in-house, including immediate release oral solids and alternate dosage forms such as extended-release oral solids, injectables, topicals, nasal sprays, ophthalmics, films and transdermal patches. Our development pipeline reflects these efforts. As of December 31, 2014, our pipeline included over 200 products, 115 of which are pending at the FDA and approximately 100 of which are in development. In addition to development capabilities, we have acquired bioequivalence and clinical end point study capabilities. We also entered into an agreement to acquire a dedicated, lower-cost active pharmaceutical ingredient (“API”) development and manufacturing facility in India, which we plan to operate upon the closing of the acquisition. As a result of these investments, we have the flexibility to more fully control the management and development of key products from formulation stage to commercialization. The following charts demonstrate our pipeline of new product opportunities and our portfolio of alternate dosage products:
We are committed to high product quality standards and allocate significant resources and focus to quality assurance, quality control and manufacturing excellence. We operate five FDA approved manufacturing
2
Table of Contents
facilities, four of which are located in the United States and one in India, with ample capacity and room for expansion. In addition, our facilities have passed all recent FDA inspections. As a result of our operational excellence and high quality and compliance standards, we have not received any warning letters from the FDA with respect to manufacturing plants we have operated since before 2000, which we believe differentiates us from other generic manufacturers. Our track record in high-quality manufacturing and supply reliability is most recently demonstrated by the 2014 CVS Health Supplier Partner Award based on providing innovative product offerings, commitment to customer service and consistency of supply.
Our senior management team has a strong track record and established history of executing and integrating business development opportunities and strategic acquisitions. Since 2011, we have completed and integrated over 20 business development transactions and six company acquisitions. These transactions have enhanced and deepened our presence in the industry by expanding our portfolio of products in development and manufacturing capabilities. We believe we are a partner of choice to brand companies seeking an authorized generics partner. Authorized generics are generic versions of branded drugs licensed to generic drug companies by brand drug companies that may be sold during (and after) the statutory exclusivity period granted to the first-to-file generic equivalent to the branded product. We also believe we are a partner of choice to large generic companies for product divestitures that arise as a result of industry consolidation, and for smaller development organizations looking for a partner that has deep experience with product development, patent litigation strategy and a strong market presence.
Recent performance
Paul Campanelli was appointed as our Chief Executive Officer in September 2012 following the Merger. Prior to the Merger, Mr. Campanelli served as Par’s Chief Operating Officer, having held positions of increasing responsibility since joining the Company in 2001. Over the past two years, under Mr. Campanelli’s leadership, we have made significant investments in expanding our research, development and manufacturing capabilities. These investments have resulted in:
| • | submitting 61 ANDAs since the Merger, resulting in a total of 115 ANDAs pending at the FDA as of December 31, 2014, compared to 89 ANDAs pending as of December 31, 2012; |
| • | diversifying our development portfolio from 83 development projects with 60 alternate dosage forms (including extended release solid oral dose) at December 31, 2012 to approximately 100 products in development with 70 alternate dosage forms (including extended release solid oral dose) at December 31, 2014; |
| • | diversifying our manufacturing capabilities from largely solid oral dose capabilities in 2012 to capabilities covering almost all generic presentations, such as gels, nasal sprays, ophthalmics, films, transdermal patches and injectable products; |
| • | expanding our core competencies to provide us the flexibility to more fully control key product development by acquiring Par Biosciences Private Limited (“Par Biosciences” formerly known as Ethics Bio Lab Private Limited), a Chennai, India-based clinical research organization (“CRO”) that conducts bioequivalence and clinical end point studies, and by lowering development and manufacturing costs for a portion of our product portfolio through the utilization of Par Formulations Private Limited (formerly known as Edict Pharmaceuticals Private Limited), a Chennai, India-based developer and manufacturer of generic pharmaceuticals; |
| • | enhancing our portfolio through business development and product acquisitions, including our November 2012 acquisition of a mix of marketed products, ANDAs awaiting FDA approval and one late-stage development product in connection with Watson Pharmaceuticals, Inc.’s (“Watson”) acquisition of Actavis Group; |
3
Table of Contents
| • | diversifying our revenue base such that over half of our total adjusted gross margin is derived from products that are either exclusive or have two or fewer competitors for the year ended December 31, 2014; and |
| • | establishing Par Laboratories Europe, Ltd. in 2015, a U.K.-based business office which will serve as an entry point into the European generics market. |
In addition, the following financial metrics highlight improvements since the fiscal year ended December 31, 2011:
| • | total revenue increased from $926.1 million for the year ended December 31, 2011 to $1,308.6 million for the year ended December 31, 2014, representing a compounded annual growth rate (“CAGR”) of 12.2%; |
| • | adjusted gross margin increased from $406.0 million for the year ended December 31, 2011 to $674.7 million for the year ended December 31, 2014, representing a CAGR of 18.5%; |
| • | adjusted gross margin as a percentage of revenue increased from 43.8% for the year ended December 31, 2011 to 51.2% for the year ended December 31, 2014; |
| • | adjusted EBITDA increased from $248.5 million for the year ended December 31, 2011 to $433.8 million for the year ended December 31, 2014, representing a CAGR of 20.4%; and |
| • | adjusted EBITDA as a percentage of revenue increased from 26.8% for the year ended December 31, 2011 to 33.1% for the year ended December 31, 2014. |
Adjusted gross margin and adjusted EBITDA are non-GAAP financial measures and should not be considered substitutes for and are not comparable with net income or net operating income as determined in accordance with GAAP. We recorded a net loss of $105.5 million for the year ended December 31, 2014, a net loss of $105.9 million for the year ended December 31, 2013 and a net loss of $33.5 million for the combined 2012 year-end period. For additional information regarding these financial measures, including an explanation and reconciliation of our non-GAAP measures to the most directly comparable measure presented in accordance with GAAP, see “Summary historical and pro forma condensed consolidated financial data” included elsewhere in this prospectus. The Merger was accounted for as a business combination and therefore resulted in a new accounting basis. Our results of operations for the year ended 2012 presented elsewhere in this prospectus are presented for the predecessor and successor periods, which relate to the periods preceding the Merger (January 1, 2012 through September 28, 2012) and succeeding (July 12, 2012 (inception) through December 31, 2012) the inception date, respectively. The successor period reflects the new accounting basis established for us as of the inception date. In the discussion above, we present our net loss for the combined 2012 full year period for comparative purposes, using the mathematical sum of the net loss reported for the successor and predecessor periods. In addition, throughout the document we present certain other 2012 measures on a combined basis. Such information represents non-GAAP measures because Successor is on a new basis of accounting. These measures should not be considered substitutes for and are not compatible with GAAP measures. The information is presented in this manner as we believe it enables a reasonable comparison. This financial information may not reflect the actual financial results we would have achieved absent the Merger and may not be predictive of future financial results. For a presentation of our results of operations for the year ended 2012 on a GAAP basis, showing the separate predecessor and successor periods, see “Selected historical consolidated financial data.”
Our capabilities
Since 2011, we have strategically expanded our technology, manufacturing, handling and development capabilities, shifting from primarily solid oral immediate and extended release products to a diversified array of dosage forms. These expanded technologies represent a sizeable market opportunity, with 2014 branded
4
Table of Contents
product sales utilizing these technologies of approximately $110 billion, according to IMS Health . As of December 31, 2014, our development product portfolio included 26 immediate-release oral solids, 24 injectables, 23 extended-release oral solids, eight topicals, five ophthalmics, three nasal sprays and two films. As of December 31, 2014, approximately 70% of our development portfolio targets alternate dosage forms such as extended-release oral solids, injectables, topicals, nasal sprays, ophthalmics, films and transdermal patches.
The following graphic shows Par Pharmaceutical’s current capabilities and new in-process opportunities:
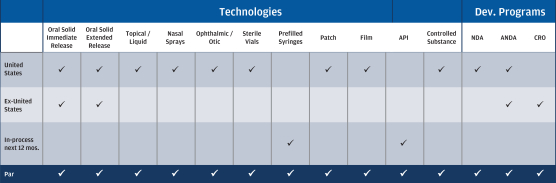
Our comprehensive suite of technology, manufacturing and development capabilities increases the likelihood of success in commercializing high-barrier-to-entry products and obtaining first-to-file and first-to-market status on our products, yielding more sustainable market share and profitability.
Our strengths
Our senior executive team has a strong track record of product selection and development, and has launched 47 new products since 2011, eight of which have been first-to-file and one of which has been first-to-market. We have an integrated team-based approach to product development that combines our formulation, regulatory, legal, manufacturing and commercial capabilities. We believe that the strengths of Par are as follows:
Focused approach to product selection targeting high-barrier-to-entry products with long-term value. We specialize in high-barrier-to-entry products that are difficult to formulate, difficult to manufacture or face complex legal and regulatory challenges. These products often see limited competition and tend to be more profitable than commoditized generic drugs. A large portion of our generics gross margin comes from products where we are either the exclusive generic or have two or fewer competitors. As of December 31, 2014, among our top ten generic drugs by revenue, more than half maintain market shares in excess of 50%.
Full suite of technology capabilities. We have a full suite of dosage forms, including immediate release oral solids and alternate dosage forms such as extended release oral solids, injectables, topicals, nasal sprays, ophthalmics, films and transdermal patches. Our acquisition of Par Biosciences provides us with bioequivalence study capabilities, which allows us to control the speed, cost and execution of development. In addition, we are in the process of acquiring an API development and manufacturing facility. These expanded capabilities provide the flexibility to more fully control the management and development of key products from formulation stage to commercialization.
Diverse portfolio of products. We have a generics portfolio of approximately 95 products across an extensive range of dosage forms and delivery systems. In addition to our current products, our pipeline consists of new products that will further expand and diversify our portfolio. We believe our broad suite of products has allowed us to increase our market presence and develop long term relationships with customers.
5
Table of Contents
Deep, targeted pipeline with high visibility into future launches. We have a large number of products pending regulatory approval and a robust pipeline of products in development. As of December 31, 2014, we had 115 ANDAs pending with the FDA representing $36.7 billion of combined branded product sales in 2014, including 32 potential first-to-file and six potential first-to-market opportunities representing $14.8 billion of combined branded product sales in 2014. Our potential first-to-file and first-to-market opportunities account for 33% of our pending ANDA pipeline, which we believe is one of the highest in the industry and differentiates our development capabilities. As of December 31, 2014, our Paragraph IV opportunities accounted for approximately 55% of our current development portfolio, and 70% of the development portfolio targets alternate dosage forms.
Commitment to manufacturing excellence with a culture of quality and compliance. We have invested significant resources and focus on quality assurance, quality control and manufacturing excellence. As of December 31, 2014, we operated five FDA approved manufacturing facilities, four of which are located in the United States and one in India, with ample capacity and room for expansion. As a result of our commitment to operational excellence and high quality and compliance standards, we have not received any warning letters from the FDA with respect to manufacturing plants we have operated since before 2000, which we believe differentiates us from other generic manufacturers.
Proven success in identifying and executing on business development and strategic acquisitions. We have successfully completed and integrated over 20 business development transactions and six company acquisitions since 2011, which has expanded our product portfolio, development capabilities and manufacturing platforms. Our experience and extensive network of relationships in the industry allows us to identify a significant number of opportunities and execute on them quickly and efficiently. Given our strong track record of success in executing similar transactions in the past in an effective and efficient manner, we believe that we are well positioned to compete for these potential opportunities.
Track record of strong top-line revenue growth and significant cash flow generation. We submitted 11, 21, 21 and 30 new ANDA filings during 2011, 2012, 2013 and 2014, respectively, and introduced 38 new generic products during that period. Driven by our diversification into alternate dosage forms and targeted product selection, our net product revenue has grown from $887.5 million in 2011 to $1,278.1 million in 2014, which represents a CAGR of 12.9% over that period, and our adjusted EBITDA has grown from $248.5 million in 2011 to $433.8 million in 2014, which represents a CAGR of 20.4% over that period. Our adjusted gross margin as a percentage of revenue has expanded from 43.8% in 2011 to 51.2% in 2014.
Experienced management team with a strong track record of operational execution. We have a highly experienced leadership team that is committed to developing, manufacturing, marketing and distributing safe, innovative and quality pharmaceuticals. The four members of our executive management team average approximately 25 years of experience in the pharmaceutical industry, and each has been with us for at least nine years, with the exception of Terrance Coughlin, our Chief Operating Officer, who joined us in April 2014. Our leadership team has a proven track record of high quality manufacturing and supply reliability. This leadership team has enabled us to successfully execute on our business strategy, growing revenue and enhancing profitability.
6
Table of Contents
Our strategy
Our goal is to strengthen our position as a leading pharmaceutical company by developing and commercializing generic drugs with limited competition, high barriers to entry and longer life cycles. In implementing our strategy, we are focused on the following:
Grow our core business in attractive high-value segments. Our strategy focuses on high-value generic products, including first-to-file and first-to-market opportunities. By specializing in high-barrier-to-entry products that are either difficult to manufacture and/or present complex legal and regulatory challenges, we are able to market products that are more profitable and longer-lived relative to our competitors. As a result, over half of our generic adjusted gross margin as of December 31, 2014 was earned from products that are either exclusive or have two or fewer competitors.
Advance our pipeline to continue building our portfolio. We have expanded our development portfolio from approximately 60 products in development at December 31, 2011 to 100 as of December 31, 2014. We have also further diversified our product pipeline from approximately 30 to 70 products in alternate dosage forms as of the same periods. We have grown our ANDAs pending with the FDA from 57 products at December 31, 2011 to 115 products at December 31, 2014, including 32 potential first-to-file and six potential first-to-market opportunities. We expect to continue our research and development efforts to strengthen and grow our portfolio and we expect to submit approximately 20 to 25 new ANDA filings during each of 2015, 2016 and 2017.
Strategically expand our technology capabilities across development and manufacturing. We have made significant investments to enhance our technology platforms and have expanded our capabilities to manufacture products in alternate dosage forms. We believe this will become an increasingly strategic asset over time. We will continue to invest in expanding our technology capabilities across development and manufacturing to develop high-barrier-to-entry products.
Build upon our success in strategic acquisitions and business development. We have an established history of successfully executing and integrating strategic acquisitions that have enhanced and deepened our presence in our industry. Through these acquisitions, we have expanded our portfolio of products, pipeline, manufacturing and technological capabilities. We expect business development to remain a priority for us as we continue to identify and execute on transactions that fit our strategy and focus on high-barrier-to-entry products.
Leverage existing platform to drive operational efficiency. As a well-established industry player, we have built broad infrastructure in areas of technology, manufacturing, development, sales and distribution. This enables us to go from product selection to commercialization in an efficient manner, driving sales growth and enhancing profitability. As our portfolio expands, we can leverage these existing capabilities to accelerate bottom-line growth and margin expansion.
Risk factors
An investment in our common stock involves a high degree of risk. Any of the factors set forth under “Risk factors” may limit our ability to successfully execute our business strategy. You should carefully consider all of the information set forth in this prospectus and, in particular, should evaluate the specific factors set forth under “Risk factors” in deciding whether to invest in our common stock. Among these important risks are the following:
| • | If we are unable to successfully develop or commercialize new products, our operating results will suffer. |
| • | If we fail to obtain exclusive marketing rights for our generic products or fail to introduce these generic products on a timely basis, our revenues, gross margin and operating results may decline significantly. |
7
Table of Contents
| • | We face intense competition in the pharmaceutical industry from both brand and generic companies, which could significantly limit our growth and materially adversely affect our financial results. |
| • | Due to our dependence on a limited number of products, our business could be materially adversely affected if our key products do not perform as well as expected. |
| • | Our profitability depends on our major customers. If these relationships do not continue as expected, our business, condition (financial and otherwise), prospects and results of operations could materially suffer. |
| • | Our competitors, including brand pharmaceutical companies, or other third parties may allege that we are infringing their intellectual property, forcing us to expend substantial resources in resulting litigation, the outcome of which is uncertain. Any unfavorable outcome of such litigation, including losses related to “at-risk” product launches, could have a material adverse effect on our business, financial position and results of operations. |
| • | We are, and will continue to be in the future, a party to legal proceedings that could result in unexpected adverse outcomes. |
| • | Due to extensive regulation and enforcement in the pharmaceutical industry, we face significant uncertainties and potentially significant costs associated with our efforts to comply with applicable regulations. Failure to comply could result in material adverse effects to our business, financial position and results of operations. |
| • | The substantial indebtedness of our indirect subsidiary, Par Pharmaceutical Companies, could adversely affect our ability to raise additional capital to fund our operations, limit our ability to react to changes in the economy or our industry and prevent us from meeting obligations on our indebtedness. |
For additional information about the risks we face, please see the section of this prospectus captioned “Risk factors” beginning on page 18 of this prospectus.
Our sponsor
TPG is a leading global private investment firm founded in 1992 with over $67 billion of assets under management as of December 31, 2014, and offices in San Francisco, Fort Worth, Austin, Beijing, Dallas, Hong Kong, Houston, London, Luxembourg, Melbourne, Moscow, Mumbai, New York, São Paulo, Shanghai, Singapore, Tokyo and Toronto. TPG has extensive experience with global public and private investments executed through leveraged buyouts, recapitalizations, spinouts, growth investments, joint ventures and restructurings. The firm’s investments span a variety of industries, including healthcare, financial services, travel and entertainment, technology, energy, industrials, retail, consumer, real estate and media and communications.
Following the completion of this offering, TPG will own approximately % of our common stock, or % if the underwriters’ option to purchase additional shares of our common stock is fully exercised. As a result, we expect to be a “controlled company” within the meaning of the corporate governance standards of the New York Stock Exchange (the “NYSE”). As a result, we will qualify for, and continue to rely on, exemptions from certain corporate governance requirements and you will not have the same protections afforded to stockholders of companies that are subject to such requirements. Additionally, TPG will continue to have significant influence over us and decisions made by stockholders and may have interests that differ from yours. See “Risk factors—Risks related to our common stock and this offering—TPG will continue to have significant influence over us after this offering, including control over decisions that require the approval of stockholders, which could limit your ability to influence the outcome of matters submitted to stockholders for a vote.”
8
Table of Contents
Corporate information and structure
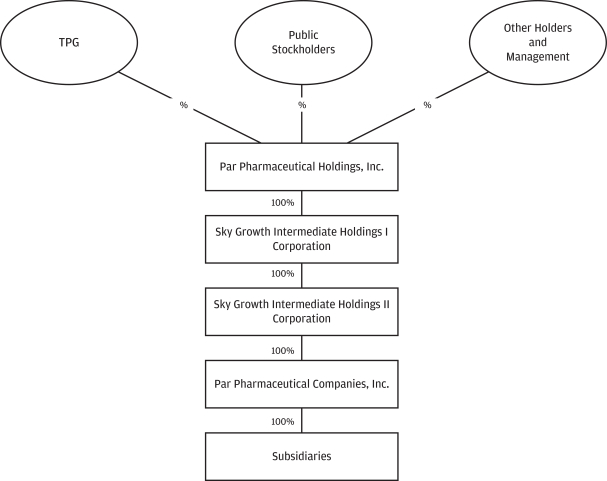
Par Pharmaceutical Holdings, Inc. is a Delaware corporation that was formed on July 12, 2012 in connection with the Merger under the name Sky Growth Holdings Corporation. On March 4, 2015, Sky Growth Holdings Corporation changed its name to Par Pharmaceutical Holdings, Inc. The only material asset of Par Pharmaceutical Holdings, Inc. is the equity interest of Sky Growth Intermediate Holdings I Corporation, which is the holder of 100% of the equity interest of Sky Growth Intermediate Holdings II Corporation, which is the holder of 100% of the equity of Par Pharmaceutical Companies, Inc. and was the holding company prior to the Merger. Prior to the Merger, we conducted our operations through the subsidiaries of Par Pharmaceutical Companies, Inc. and we continue to do so subsequent to the Merger. Our principal executive offices are located at One Ram Ridge Road, Chestnut Ridge, New York 10977, and our telephone number at that address is (845) 573-5500. Our website is located at http://www.parpharm.com. Our website and the information contained on our website do not constitute part of this prospectus.
The following chart shows our simplified organization structure immediately following the consummation of this offering assuming no exercise of the underwriters’ option to purchase additional shares.
9
Table of Contents
The offering
| Common stock offered by us |
shares |
| Common stock offered by the selling stockholders |
shares |
| Common stock to be outstanding after this offering |
shares (or shares if the underwriters exercise their option to purchase additional shares in full) |
| Option to purchase additional shares |
The underwriters have an option for a period of 30 days to purchase up to additional shares of our common stock from us and additional shares of our common stock from the selling stockholders. |
| Use of proceeds |
We estimate that the net proceeds to us from this offering will be approximately $ million, or approximately $ million if the underwriters exercise their option to purchase additional shares in full, at an assumed initial public offering price of $ per share, the midpoint of the price range set forth on the cover of this prospectus, after deducting the estimated underwriting discounts and commissions and estimated offering expenses payable by us. We intend to use the net proceeds of this offering to repay indebtedness. We intend to use the remainder of the net proceeds, if any, for working capital and other general corporate purposes, including supporting our strategic growth opportunities in the future. We will not receive any of the proceeds from the sale of our common stock by the selling stockholders named in this prospectus. See “Use of proceeds.” |
| Dividend policy |
Our board of directors does not currently intend to pay dividends on our common stock. However, we expect to reevaluate our dividend policy on a regular basis following the offering and may, subject to compliance with the covenants contained in the agreements governing our indebtedness and other considerations, determine to pay dividends in the future. The declaration, amount and payment of any future dividends on shares of our common stock will be at the sole discretion of our board of directors, which may take into account general and economic conditions, our financial condition and results of operations, our available cash and current and anticipated cash needs, capital requirements, contractual, legal, tax and regulatory restrictions, the implications of the payment of dividends by us to our stockholders or by our subsidiaries to us, and any other factors that our board of directors may deem relevant. See “Dividend policy” and “Description of indebtedness.” |
| Principal stockholders |
Upon completion of this offering, TPG will continue to beneficially own a controlling interest in us. As a result, we intend to avail ourselves of the controlled company exemption under the rules of the NYSE. See “Risk factors” and “Management.” |
10
Table of Contents
| Risk factors |
You should read the “Risk factors” section of this prospectus for a discussion of factors to consider carefully before deciding to invest in shares of our common stock. |
| Proposed NYSE ticker symbol |
“PRX” |
| Conflicts of Interest |
Affiliates of TPG Capital BD, LLC, an underwriter of this offering, own in excess of 10% of our issued and outstanding common stock. Therefore, a “conflict of interest” is deemed to exist under Rule 5121(f)(5)(B) of the Financial Industry Regulatory Authority (“FINRA”). In addition, because the TPG Funds (as defined under “Principal and selling stockholder”) are affiliates of TPG Capital BD, LLC and, as selling stockholders, will receive more than 5% of the net proceeds of this offering, a “conflict of interest” is also deemed to exist under FINRA Rule 5121(f)(5)(C)(ii). Accordingly, this offering will be made in compliance with the applicable provisions of FINRA Rule 5121. In accordance with FINRA Rule 5121(c), no sales of the shares will be made to any discretionary account over which TPG Capital BD, LLC exercises discretion without the prior specific written approval of the account holder. However, no “qualified independent underwriter” is required because the underwriters primarily responsible for managing this offering are free of any “conflict of interest,” as that term is defined in the rule. See “Use of proceeds” and “Underwriting (conflicts of interest).” |
The number of shares of common stock to be outstanding after this offering is based on 784,251,980 shares of common stock outstanding as of March 31, 2015 and excludes the following:
| • | 74,370,679 shares reserved for future issuance in connection with the exercise of outstanding stock options at a weighted-average exercise price of $0.82 per share; |
| • | 344,531 shares reserved for issuance upon vesting of restricted stock units; |
| • | 184,060 shares of common stock reserved for future issuance under our 2012 Equity Incentive Plan (the “2012 EIP”); and |
| • | shares of common stock reserved for future issuance under the 2015 Equity Incentive Plan (the “2015 EIP”), which shall take effect prior to the consummation of this offering. |
Unless otherwise indicated, this prospectus reflects and assumes the following:
| • | a -for- stock split on our common stock effected on , 2015; |
| • | the adoption of our amended and restated certificate of incorporation and our amended and restated bylaws, to be effective upon the closing of this offering; |
| • | no exercise by the underwriters of their option to purchase up to additional shares of our common stock in this offering; and |
| • | an initial public offering price of $ per share, the midpoint of the price range set forth on the cover of this prospectus. |
11
Table of Contents
Summary historical and pro forma condensed consolidated financial data
The following table sets forth summary historical consolidated financial data for the periods ended and at the dates indicated below. Our summary historical consolidated financial data as of December 31, 2013 (Successor) and December 31, 2014 (Successor) and for the years ended December 31, 2013 (Successor) and December 31, 2014 (Successor) and for the period from January 1, 2012 to September 28, 2012 (Predecessor) and from July 12, 2012 (inception) to December 31, 2012 (Successor) presented in this table has been derived from our historical audited consolidated financial statements included elsewhere in this prospectus. We derived the summary historical consolidated balance sheet data presented below as of December 31, 2012 (Successor) from our unaudited consolidated financial statements that are not included in this prospectus. Our summary historical condensed consolidated financial data for the periods as of and for the three months ended March 31, 2015 (Successor) and March 31, 2014 (Successor) presented in this table has been derived from our historical unaudited condensed consolidated financial statements included elsewhere in this prospectus. Our historical operating results are not necessarily indicative of future operating results.
On September 28, 2012, Sky Growth Acquisition Corporation, our wholly owned subsidiary, merged with and into Par Pharmaceutical Companies, which resulted in a change in basis of our assets and liabilities. Periods following our inception are referred to as the “Successor” periods. As a result of the Merger and the resulting change in basis of our assets and liabilities, the Predecessor and Successor period financial data is not comparable. Refer to “—Recent performance” for more information.
The summary historical and unaudited pro forma combined financial data set forth below is not necessarily indicative of the results of future operations and should be read in conjunction with “Selected historical consolidated financial data,” “Capitalization,” “Management’s discussion and analysis of financial condition and results of operations” and the financial statements and related notes included elsewhere in this prospectus.
12
Table of Contents
| Three months ended March 31, |
Fiscal year ended December 31, |
Period from July 12 to December 31, |
Period from January 1 to September 28, |
|||||||||||||||||||||||
| 2015 | 2014 | 2014 | 2013 | 2012 | 2012 | |||||||||||||||||||||
| (Successor) | (Successor) | (Successor) | (Successor) | (Successor) | (Predecessor) | |||||||||||||||||||||
| ($ in thousands, except per share amounts) | ||||||||||||||||||||||||||
| Statement of Operations Data: |
||||||||||||||||||||||||||
| Net product sales |
$ | 353,119 | $ | 282,833 | $ | 1,278,106 | $ | 1,062,453 | $ | 237,338 | $ | 780,797 | ||||||||||||||
| Other product related revenues |
6,125 | 6,251 | 30,515 | 35,014 | 8,801 | 23,071 | ||||||||||||||||||||
|
|
|
|
|
|
|
|
|
|
|
|
|
|||||||||||||||
| Total revenues |
359,244 | 289,084 | 1,308,621 | 1,097,467 | 246,139 | 803,868 | ||||||||||||||||||||
| Cost of goods sold, excluding amortization expense |
165,379 | 150,668 | 643,851 | 595,166 | 157,893 | 431,174 | ||||||||||||||||||||
| Amortization expense |
48,792 | 44,102 | 185,655 | 184,258 | 42,801 | 30,344 | ||||||||||||||||||||
|
|
|
|
|
|
|
|
|
|
|
|
|
|||||||||||||||
| Total cost of goods sold |
214,171 | 194,770 | 829,506 | 779,424 | 200,694 | 461,518 | ||||||||||||||||||||
|
|
|
|
|
|
|
|
|
|
|
|
|
|||||||||||||||
| Gross margin |
145,073 | 94,314 | 479,115 | 318,043 | 45,445 | 342,350 | ||||||||||||||||||||
| Research and development |
26,850 | 34,624 | 119,095 | 100,763 | 19,383 | 66,606 | ||||||||||||||||||||
| Selling, general and administrative |
56,386 | 50,941 | 181,136 | 155,164 | 73,760 | 165,604 | ||||||||||||||||||||
| Intangible asset impairment |
— | 41,758 | 146,934 | 100,093 | — | 5,700 | ||||||||||||||||||||
| Settlements and loss contingencies, net |
(25 | ) | — | 90,107 | 25,650 | 10,059 | 45,000 | |||||||||||||||||||
| Restructuring costs |
363 | 1,146 | 5,413 | 1,816 | 241 | — | ||||||||||||||||||||
|
|
|
|
|
|
|
|
|
|
|
|
|
|||||||||||||||
| Total operating expenses |
83,574 | 128,469 | 542,685 | 383,486 | 103,443 | 282,910 | ||||||||||||||||||||
|
|
|
|
|
|
|
|
|
|
|
|
|
|||||||||||||||
| Loss on sale of product rights |
— | — | (3,042 | ) | — | — | — | |||||||||||||||||||
|
|
|
|
|
|
|
|
|
|
|
|
|
|||||||||||||||
| Operating income (loss) |
61,499 | (34,155 | ) | (66,612 | ) | (65,443 | ) | (57,998 | ) | 59,440 | ||||||||||||||||
| Other (expense) income, net |
— | — | (3,489 | ) | (6,213 | ) | 5,500 | — | ||||||||||||||||||
| Interest income |
17 | 14 | 18 | 87 | 50 | 424 | ||||||||||||||||||||
| Interest expense |
(29,511 | ) | (25,467 | ) | (108,427 | ) | (95,484 | ) | (25,985 | ) | (9,159 | ) | ||||||||||||||
|
|
|
|
|
|
|
|
|
|
|
|
|
|||||||||||||||
| Income (loss) before (benefit) provision for income tax |
32,005 | (63,597 | ) | (178,510 | ) | (167,053 | ) | (78,433 | ) | 50,705 | ||||||||||||||||
| Provision (benefit) for income taxes |
11,720 | (24,232 | ) | (72,993 | ) | (61,182 | ) | (23,727 | ) | 29,530 | ||||||||||||||||
|
|
|
|
|
|
|
|
|
|
|
|
|
|||||||||||||||
| Net income (loss) |
$ | 20,285 | $ | (39,365 | ) | $ | (105,517 | ) | $ | (105,871 | ) | $ | (54,706 | ) | $ | 21,175 | ||||||||||
|
|
|
|
|
|
|
|
|
|
|
|
|
|||||||||||||||
| Basic income (loss) per common share |
$ | 0.03 | $ | (0.05 | ) | $ | (0.14 | ) | $ | (0.15 | ) | $ | (0.08 | ) | $ | 0.58 | ||||||||||
| Diluted income (loss) per common share |
$ | 0.02 | $ | (0.05 | ) | $ | (0.14 | ) | $ | (0.15 | ) | $ | (0.08 | ) | $ | 0.57 | ||||||||||
| Weighted average common share outstanding: |
||||||||||||||||||||||||||
| Basic |
784,048 | 737,839 | 772,728 | 704,009 | 698,047 | 36,449 | ||||||||||||||||||||
| Diluted |
814,578 | 737,839 | 772,728 | 704,009 | 698,047 | 37,231 | ||||||||||||||||||||
| Other Financial Data: |
||||||||||||||||||||||||||
| Cash provided by (used in) |
||||||||||||||||||||||||||
| Operating activities |
$ | 100,207 | $ | 89,139 | $ | 145,245 | $ | 113,045 | $ | (54,745 | ) | $ | 153,760 | |||||||||||||
| Investing activities |
(51,285 | ) | (490,859 | ) | (519,575 | ) | (12,198 | ) | (2,026,531 | ) | (46,602 | ) | ||||||||||||||
| Financing activities |
(107,482 | ) | 492,200 | 488,690 | (9,631 | ) | 1,841,261 | 9,205 | ||||||||||||||||||
| Capital expenditures |
(8,492 | ) | (13,212 | ) | (45,460 | ) | (17,465 | ) | (10,306 | ) | (11,454 | ) | ||||||||||||||
| Adjusted EBITDA(1) |
131,523 | 77,182 | 433,804 | 306,872 | 63,519 | 239,853 | ||||||||||||||||||||
| Adjusted gross margin(2) |
194,595 | 141,506 | 674,729 | 510,117 | 110,013 | 387,788 | ||||||||||||||||||||
| Unaudited Pro Forma Data(3): |
||||||||||||||||||||||||||
| Basic loss per common share |
$ | $ | ||||||||||||||||||||||||
| Diluted loss per common share |
$ | $ | ||||||||||||||||||||||||
| Weighted average common shares outstanding: |
||||||||||||||||||||||||||
| Basic |
||||||||||||||||||||||||||
| Diluted |
||||||||||||||||||||||||||
| Balance Sheet Data (at period end): |
||||||||||||||||||||||||||
| Cash and cash equivalents |
$ | 185,880 | $ | 220,560 | $ | 244,440 | $ | 130,080 | $ | 38,864 | ||||||||||||||||
| Total assets |
2,875,935 | 3,174,813 | 3,007,134 | 2,637,569 | 2,846,687 | |||||||||||||||||||||
| Total long-term debt, including current maturities (gross) |
2,346,148 | 1,931,678 | 1,925,837 | 1,545,340 | 1,542,363 | |||||||||||||||||||||
| Stockholders’ equity |
71,462 | 623,032 | 566,080 | 553,436 | 651,169 | |||||||||||||||||||||
|
|
|
|
||||||||||||||||||||||||
13
Table of Contents
| (1) | “Adjusted EBITDA” is a financial measure that is not defined under GAAP. We present adjusted EBITDA because we consider it an important supplemental measure of our performance and our ability to service our indebtedness and we believe that it provides greater transparency into our results of operations and is frequently used by investors in the evaluation of companies in the industry. In addition, our management believes that adjusted EBITDA is a useful financial metric to assess our operating performance from period to period by excluding certain material unusual items and certain other adjustments we believe are not reflective of our ongoing operations and our performance. Adjusted EBITDA represents net (loss) income before interest expense, net, provision (benefit) for income taxes, depreciation and amortization, intangible asset impairment, restructuring costs, settlements and loss contingencies, net transaction related costs including severance, upfront and development milestones, stock-based compensation expense and certain other non-recurring, non-cash and other cash expenses. Adjusted EBITDA does not represent and should not be considered as an alternative to net income or cash flow from operations, as determined by GAAP, and our calculations thereof may not be comparable to that reported by other companies. Adjusted EBITDA has limitations as an analytical tool and you should not consider it in isolation, or as a substitute for analysis of our results as reported under GAAP. For example, adjusted EBITDA: |
| • | does not reflect our capital expenditures or future requirements for capital expenditures or contractual commitments; |
| • | does not reflect expenditures related to current business development and product acquisition activities, including payments due under existing agreements related to products in various stages of development or contingent payments tied to the achievement of sales milestones; |
| • | does not reflect changes in, or cash requirements for, our working capital needs; |
| • | does not reflect significant interest expense or the cash requirements necessary to service interest or principal payments on our debt; |
| • | excludes income tax payments that represent a reduction in cash available to us; |
| • | does not reflect any cash requirements for assets being depreciated and amortized that may have to be replaced in the future; |
| • | does not reflect the impact of earnings or charges resulting from matters we consider not be indicative of our ongoing operations; and |
| • | may be calculated differently by other companies in our industry, thereby limiting the usefulness as a comparative measure. |
Because of these limitations, adjusted EBITDA should not be considered as a measure of discretionary cash available to us to invest in the growth of our business or as measures of cash that will be available to us to meet our obligations. We compensate for these limitations by using adjusted EBITDA along with other comparative tools, together with GAAP measurements, to assist in the evaluation of operating performance. These GAAP measurements include net (loss) income, cash flow from operating activities and other cash flow data. We have significant uses of cash flow from operating activities, including capital expenditures, interest payments, debt principal repayments, transaction related costs including severance, upfront and development milestones, taxes and other non-recurring charges, which are not reflected in adjusted EBITDA. Adjusted EBITDA should not be considered in isolation or as an alternative to net (loss) income, cash flow generated by operating, investing, or financing activities or other financial statement data presented in the consolidated financial statements as an indicator of financial performance or liquidity. You should therefore not place undue reliance on adjusted EBITDA or ratios calculated using this measure. Our GAAP-based measures can be found in our consolidated financial statements and related notes included elsewhere in this prospectus.
14
Table of Contents
The table below reconciles net income (loss) to adjusted EBITDA for the periods presented. Adjusted EBITDA excludes the impact of discontinued operations for all periods.
| Three months ended March 31, |
Fiscal year ended December 31, |
Period from July 12 to December 31, |
Period from January 1 to September 28, |
|||||||||||||||||||||||
| 2015 | 2014 | 2014 | 2013 | 2012 | 2012 | |||||||||||||||||||||
| (Successor) | (Successor) | (Successor) | (Successor) | (Successor) | (Predecessor) | |||||||||||||||||||||
| (unaudited) | (unaudited) | (unaudited) | (unaudited) | (unaudited) | (unaudited) | |||||||||||||||||||||
| ($ in thousands) | ||||||||||||||||||||||||||
| Statement of Operations Data: |
||||||||||||||||||||||||||
| Net income (loss) |
$ | 20,285 | $ | (39,365 | ) | $ | (105,517 | ) | $ | (105,871 | ) | $ | (54,706 | ) | $ | 21,175 | ||||||||||
| Interest expense, net |
29,494 | 25,453 | 108,409 | 95,397 | 25,935 | 8,735 | ||||||||||||||||||||
| Provision (benefit) for income taxes |
11,720 | (24,232 | ) | (72,993 | ) | (61,182 | ) | (23,727 | ) | 29,530 | ||||||||||||||||
| Depreciation and amortization |
57,083 | 50,663 | 213,564 | 207,646 | 50,348 | 44,426 | ||||||||||||||||||||
| Cost of goods on acquired inventory step-up(a) |
— | 2,986 | 9,031 | 6,557 | 21,543 | 4,048 | ||||||||||||||||||||
|
|
|
|
|
|
|
|
|
|
|
|
|
|||||||||||||||
| EBITDA |
118,582 | 15,505 | 152,494 | 142,547 | 19,393 | 107,914 | ||||||||||||||||||||
| Litigation and loss contingencies, net(b) |
— | — | 90,107 | 25,650 | 10,059 | 45,000 | ||||||||||||||||||||
| AWP and DOJ litigation costs(c) |
901 | 1,676 | 4,269 | 9,131 | 3,110 | 7,757 | ||||||||||||||||||||
| Restructuring costs(d) |
363 | 1,146 | 5,413 | 1,816 | 241 | — | ||||||||||||||||||||
| Transaction related costs including severance(e) |
1,365 | 3,786 | 7,461 | 5,447 | 32,951 | 45,882 | ||||||||||||||||||||
| Upfront and development milestones(f) |
— | — | — | — | 350 | 10,000 | ||||||||||||||||||||
| Inventory write-downs related to patent litigation(g) |
— | — | — | — | — | 10,318 | ||||||||||||||||||||
| Intangible asset impairment(h) |
— | 41,758 | 146,934 | 100,093 | — | 5,700 | ||||||||||||||||||||
| Loss on sale of product rights(i) |
— | — | 3,042 | — | — | — | ||||||||||||||||||||
| Gain on sale of securities and other investments(j) |
— | — | — | (1,122 | ) | — | — | |||||||||||||||||||
| Cost associated with refinancing of senior term loan |
— | 7,136 | 7,136 | 1,411 | — | — | ||||||||||||||||||||
| Loss on debt extinguishment(k) |
— | 3,989 | 3,989 | 7,335 | — | — | ||||||||||||||||||||
| Gain on bargain purchase(l) |
— | — | — | — | (5,500 | ) | — | |||||||||||||||||||
| Stock based compensation expense(m) |
5,213 | 942 | 8,678 | 9,154 | 2,240 | 7,282 | ||||||||||||||||||||
| Management fee(n) |
1,000 | 935 | 4,000 | 3,611 | 675 | — | ||||||||||||||||||||
| Special discretionary dividend equivalent bonus |
4,185 | — | — | — | — | — | ||||||||||||||||||||
| Other(o) |
(86 | ) | 309 | 281 | 1,799 | — | — | |||||||||||||||||||
|
|
|
|
|
|
|
|
|
|
|
|
|
|||||||||||||||
| Adjusted EBITDA |
$ | 131,523 | $ | 77,182 | $ | 433,804 | $ | 306,872 | $ | 63,519 | $ | 239,853 | ||||||||||||||
|
|
|
|
||||||||||||||||||||||||
| (a) | Represents the charge associated with acquisitions for acquired inventory which was increased to its estimated selling price, less the cost of disposal and a reasonable profit allowance for the selling effort (the “inventory step-up”), as required under GAAP. The inventory step-up was recognized into earnings based on normal inventory turns and resulted in costs above standard post-acquisition costs. |
| (b) | During the period from January 1, 2012 to September 28, 2012 (Predecessor), we recorded an accrual of $45.0 million as management’s best estimate of a potential loss related to a potential global settlement with respect to an inquiry by the U.S. Department of Justice (the “DOJ”) into Par Specialty’s promotional practices in the sales and marketing of Megace® ES. In the period from July 12, 2012 (inception) to December 31, 2012 (Successor), we recorded additional estimated amounts for accrued interest and legal expenses that we are liable for paying in the final settlement. We also accrued for a contingent liability of $9.0 million related to omeprazole/sodium bicarbonate patent litigation during this period. In 2013, we recorded an incremental provision of $25.7 million related to the settlement of average wholesale price (“AWP”) litigation claims (Illinois $19.8 million, Louisiana $3.3 million, Utah $1.7 million and Kansas $0.9 million). In 2014, we recorded an incremental provision of $91.0 million related to the settlement of omeprazole/sodium bicarbonate patent litigation for $100.0 million. During 2014, we also received an arbitration award of approximately $0.9 million from a former partner related to a discontinued project. |
| (c) | Consists of external legal costs incurred in conjunction with our defense of the actions brought by various states and the DOJ as it relates to the AWP litigation and the promotional practices of Par Specialty’s marketing of Megace® ES. |
| (d) | In January 2013, we initiated a restructuring of Par Specialty, in anticipation of entering into a settlement agreement and corporate integrity agreement (“CIA”) that terminated the DOJ ongoing investigation of Par Specialty’s marketing of Megace® ES. We reduced our Par Specialty workforce by approximately 70 people, with the majority of the reductions in the sales force. The remaining Par Specialty sales force has been reorganized into a single sales team of approximately 60 professionals that focus their marketing efforts principally on Nascobal® Nasal Spray. In connection with these actions, we incurred expenses for severance and other employee-related costs as well as the termination of certain contracts. In 2014, subsequent to the Par Sterile acquisition, we eliminated 25 redundant positions within Par |
15
Table of Contents
| Pharmaceutical and accrued severance and other employee-related costs for those employees affected by the workforce reduction. Additionally, due to a change in our product development strategy, we eliminated 36 redundant positions within our Irvine location and accrued severance and other employee-related costs for these employees affected by the workforce reduction. |
| (e) | Consists of transaction-related expenses incurred in connection with the acquisition of Anchen Incorporated and its subsidiary Anchen Pharmaceuticals, Inc. (collectively, “Anchen”), Par Formulations and Par Sterile as well as transaction-related expenses incurred in connection with the Merger and related transactions. |
| (f) | Represents the initial payments made to acquire generic ANDAs and/or distribution rights from various other pharmaceutical manufacturers prior to the product achieving legal and/or regulatory approval. |
| (g) | Represents the write down of certain pre-launch and commercial inventory resulting from the loss of patent litigation including omeprazole/sodium bicarbonate and omega-3 acid ethyl esters oral capsules. |
| (h) | During the period from January 1, 2012 to September 28, 2012 (Predecessor), we abandoned an in-process research and development project and exited the market of a commercial product both of which were acquired in the Anchen acquisition and recorded a total corresponding intangible asset impairment of $5.7 million. During the year ended December 31, 2013, we recorded intangible asset impairments totaling approximately $100.1 million for in-process research and development (“IPR&D”) relating to classes of products and projects that were evaluated as part of the annual evaluation of indefinite lived intangible assets, as well as five products not expected to achieve their originally forecasted operating results, and we ceased selling a product that had been acquired with the divested products from the merger of Watson and Actavis Group. During the year ended December 31, 2014 we recorded intangible asset impairments totaling approximately $146.9 million related to an adjustment to the forecasted operating results for two IPR&D intangible asset groups and eight Par Pharmaceutical segment products compared to their originally forecasted operating results at date of acquisition, inclusive of one discontinued product, one partially impaired product primarily due to the contract ending with the partner and a partially impaired IPR&D project from the Par Sterile acquisition due to an adverse court ruling pertaining to related patent litigation. The estimated fair values of the assets were determined by completing updated discounted cash flow models. |
| (i) | We recognized a loss on the sale of product rights of $3.0 million during the fiscal year ended December 31, 2014, related to the sale of multiple ANDAs. |
| (j) | During the year ended December 31, 2013, we recorded a gain on sale of stock of a public pharmaceutical company of $1.1 million. |
| (k) | In February 2013, we refinanced our term loan facility. In accordance with the applicable accounting guidance for debt modifications and extinguishments, approximately $5.9 million of the existing unamortized deferred financing costs and $1.4 million of the related $10.5 million soft call premium were written off in connection with this refinancing. In February 2014, in conjunction with our acquisition of Par Sterile, we amended certain senior facilities. In accordance with the applicable accounting guidance for debt modifications and extinguishments, approximately $4.0 million of the existing unamortized deferred financing costs were written off in connection with this repricing. |
| (l) | During the period from July 12, 2012 (inception) to December 31, 2012 (Successor), we acquired U.S. marketing rights to five generic products that were marketed by Watson or Actavis Group, as well as eight ANDAs awaiting regulatory approval at that time and a generic product in late-stage development, in connection with the merger of Watson and Actavis Group. The acquisition resulted in a bargain purchase under FASB ASC 805, Business Combinations. The purchase price of the acquisition was allocated to the assets acquired, with the excess of the fair value of assets acquired over the purchase price recorded as a gain. The gain was mainly attributed to the FTC mandated divestiture of products by Watson and Actavis Group in conjunction with the approval of the Watson and Actavis Group merger. |
| (m) | Represents the non-cash expense associated with stock-based compensation awards issued to various executive and non-executive employees. |
| (n) | In connection with the Merger and related transactions, we entered into a management services agreement with an affiliate of TPG (the “Manager”) pursuant to such agreement, and in exchange for on-going consulting and management advisory services, the Manager receives an annual monitoring fee paid quarterly equal to 1% of EBITDA as defined under the credit agreement for the Senior Credit Facilities. There is an annual cap of $4.0 million for this fee. The Manager also receives reimbursement for out-of-pocket expenses incurred in connection with services provided pursuant to the agreement. We recorded an expense of $4.0 million and $3.6 million for consulting and management advisory service fees and out-of-pocket expenses in the years ended December 31, 2014 and December 31, 2013, respectively, and $0.7 million in the period from July 12, 2012 (inception) to December 31, 2012 (Successor). |
| (o) | Other includes costs associated with our CIA (2013 and 2014) and additional pharmaceutical manufacturer’s fee charges recorded under PPACA due to final IRS regulations issued in 2014. |
16
Table of Contents
| (2) | We present adjusted gross margin because we believe it is a useful indicator of our operating performance and facilitates a meaningful comparison to our peers. In particular, we believe that adjusted gross margin is a useful indicator of our operating performance because adjusted gross margin measures our operating performance without regard to acquisition transaction-related amortization expenses. In addition, our management uses adjusted gross margin for planning purposes, including the preparation of our annual operating budget and assessment of performance. The table below reconciles gross margin to adjusted gross margin for the periods presented. “Adjusted gross margin” is a financial measure that is not defined under GAAP. Adjusted gross margin represents gross margin plus amortization expense, stock based compensation expense related to cost of goods, inventory write-downs related to patent litigation and cost of goods acquired on inventory step up. Adjusted gross margin does not represent and should not be considered as an alternative to gross margin, as determined by GAAP, and our calculations thereof may not be comparable to that reported by other companies. |
| Three months ended March 31, |
Fiscal year ended December 31, |
Period from July 12 to December 31, |
Period from January 1 to September 28, |
|||||||||||||||||||||||
| 2015 | 2014 | 2014 | 2013 | 2012 | 2012 | |||||||||||||||||||||
| (Successor) (unaudited) |
(Successor) (unaudited) |
(Successor) (unaudited) |
(Successor) (unaudited) |
(Successor) (unaudited) |
(Predecessor) (unaudited) |
|||||||||||||||||||||
| ($ in thousands) | ||||||||||||||||||||||||||
| Statement of Operations Data: |
||||||||||||||||||||||||||
| Gross margin |
$ | 145,073 | $ | 94,315 | $ | 479,115 | $ | 318,043 | $ | 45,445 | $ | 342,350 | ||||||||||||||
| Amortization expense |
48,792 | 44,102 | 185,655 | 184,258 | 42,801 | 30,344 | ||||||||||||||||||||
| Stock based compensation expense related to cost of goods |
253 | 89 | 858 | 902 | 224 | 728 | ||||||||||||||||||||
| Inventory write-downs related to patent litigation(a) |
— | — | — | — | — | 10,318 | ||||||||||||||||||||
| Cost of goods acquired on inventory step up(b) |
— | 2,986 | 9,031 | 6,557 | 21,543 | 4,048 | ||||||||||||||||||||
| Special discretionary dividend equivalent bonus |
460 | — | ||||||||||||||||||||||||
| Other |
17 | 14 | 70 | 357 | — | — | ||||||||||||||||||||
|
|
|
|
|
|
|
|
|
|
|
|
|
|||||||||||||||
| Adjusted gross margin |
$ | 194,595 | $ | 141,506 | $ | 674,729 | $ | 510,117 | $ | 110,013 | $ | 387,788 | ||||||||||||||
|
|
|
|
||||||||||||||||||||||||
| (a) | Represents the write down of certain pre-launch and commercial inventory resulting from the loss of patent litigation including omeprazole/sodium bicarbonate and omega-3 acid ethyl esters oral capsules. |
| (b) | Represents the charge associated with acquisitions for acquired inventory which was increased to its estimated selling price, less the cost of disposal and a reasonable profit allowance for the selling effort (the “inventory step-up”), as required under GAAP. The inventory step-up was recognized into earnings based on normal inventory turns and resulted in costs above standard post-acquisition costs. |
| (3) | Pro Forma Earnings Per Share: |
In February 2015, we amended our credit agreement governing the Senior Credit Facilities, which included new borrowings in an aggregate principal amount of $425.0 million that were used to pay a cash dividend to our stockholders of $494.3 million and, pursuant to the terms of the Sky Growth Holdings Corporation 2012 Equity Incentive Plan, dividend-equivalent payments to certain employees of $36.5 million and a special discretionary dividend-equivalent bonus totaling $4.2 million to certain employees (the “Dividend Recapitalization”). For the purposes of the pro forma earnings per share of common stock calculations, we have assumed that the Dividend Recapitalization had occurred as of January 1, 2014. The basic and diluted pro forma per share of common stock calculations presented below give effect to the Dividend Recapitalization and the number of shares whose proceeds would be necessary to fund the Dividend Recapitalization in addition to historical EPS. The basic pro forma earnings per share of common stock is computed by dividing net loss available to common shareholders by the pro forma weighted average number of shares of common stock outstanding during the period. The diluted pro forma earnings per share of common stock calculation also assumes the conversion, exercise or issuance of all potential shares of common stock, unless the effect of inclusion would be anti-dilutive.
17
Table of Contents
The following presents the computation of pro forma basic and diluted earnings per share:
| (In thousands, except per share data) | March 31, 2015 |
December 31, 2014 |
||||||
| Numerator: |
||||||||
| Net income/(loss) as reported |
$ | $ | ||||||
| Net income/(loss) pro forma adjustments: |
||||||||
| Interest expense, net of tax |
||||||||
| Amortization of debt issuance costs and discount, net of tax |
||||||||
|
|
|
|
|
|||||
| Pro forma net income/(loss) |
$ | $ | ||||||
|
|
|
|
|
|||||
| Denominator: |
||||||||
| Weighted average common shares used in computing basic and diluted loss per common share outstanding |
||||||||
| Adjustment for common stock issued whose proceeds will be used to fund the Dividend Recapitalization |
||||||||
| Pro forma weighted average common shares used in computing basic income per common share outstanding |
||||||||
|
|
|
|
|
|||||
| Pro forma basic income per common share |
$ | $ | ||||||
|
|
|
|
|
|||||
| Pro forma weighted average common shares used in computing diluted income per common share outstanding |
||||||||
|
|
|
|
|
|||||
| Pro forma diluted income per common share |
$ | $ | ||||||
|
|
||||||||
18
Table of Contents
This offering and investing in our common stock involves a high degree of risk. You should carefully consider the risks and uncertainties described below together with all of the other information contained in this prospectus, including our consolidated financial statements and the related notes appearing at the end of this prospectus, before deciding to invest in our common stock. We have presented the below risks as “Risks related to our business,” “Risks common to our industry,” “Risks related to our indebtedness” and “Risks related to our common stock and this offering.” If any of the following risks actually occurs, our business, prospects, operating results and financial condition could suffer materially, and the factors that we identify as risks to a particular segment of our business could materially affect another segment of our business or our company generally. The risks described below are not the only risks we face. Additional risks and uncertainties not currently known to us or those we currently view to be immaterial also may materially and adversely affect our business, prospects, operating results or financial condition. In any such a case, the trading price of our common stock could decline and you could lose all or part of your investment.
Risks related to our business
If we are unable to successfully develop or commercialize new products, our operating results will suffer.
Developing and commercializing a new product is time consuming, costly and subject to numerous factors that may delay or prevent development and commercialization. Our future results of operations will depend to a significant extent upon our ability to successfully commercialize new products in a timely manner. There are numerous difficulties in developing and commercializing new products, including:
| • | the ability to develop products in a timely manner and in compliance with regulatory requirements; |
| • | the success of the clinical testing process to assure that new products are safe and effective or the bioequivalent to the reference listed drug; |
| • | the risk that any of our products presently under development, if and when fully developed and tested, will not perform as expected; |
| • | delays or unanticipated costs, including delays associated with the FDA listing and approval process and the ability to obtain in a timely manner and maintain required regulatory approvals; |
| • | legal actions against our generic products brought by brand competitors, and legal challenges to our branded product intellectual property; |
| • | the availability, on commercially reasonable terms, of raw materials, including APIs and other key ingredients; and |
| • | our ability to scale-up manufacturing methods to successfully manufacture commercial quantities of products in compliance with regulatory requirements. |
As a result of these and other difficulties, products currently in development may or may not receive necessary regulatory approvals on a timely basis or at all. This risk exists particularly with respect to the introduction of branded products because of the uncertainties, higher costs and lengthy time frames associated with research and development of such products and the inherent unproven market acceptance of such products. If any of our products, when acquired or developed and approved, cannot be successfully or timely commercialized, our operating results could be adversely affected. We cannot guarantee that any investment we make in developing products will be recouped, even if we are successful in commercializing those products.
19
Table of Contents
If we fail to obtain exclusive marketing rights for our generic products or fail to introduce these generic products on a timely basis, our revenues, gross margin and operating results may decline significantly.
The Hatch-Waxman amendments to the Federal Food, Drug, and Cosmetic Act (the “FDCA”) provide for a period of 180 days of generic marketing exclusivity for any applicant that is first to file an ANDA containing a certification of invalidity, non-infringement or unenforceability related to a patent listed with respect to the corresponding branded drug (commonly referred to as a “Paragraph IV certification”). “First filers” are often able to price the applicable generic drug to yield relatively high gross margins during this 180-day marketing exclusivity period. At various times in the past, a large portion of our revenues have been derived from the sales of generic drugs during such 180-day marketing exclusivity period and from the sale of other generic products for which there otherwise was limited competition.
ANDAs that contain Paragraph IV certifications generally become the subject of patent litigation that can be both lengthy and costly. There is no certainty that we will prevail in any such litigation, that we will be the first to file and granted the 180-day marketing exclusivity period, or, if we are granted the 180-day marketing exclusivity period, that we will not forfeit such period. Even where we are awarded marketing exclusivity, we may be required to share our exclusivity period with other first filers. In addition, brand companies often authorize a generic version of the corresponding branded drug to be sold during any period of marketing exclusivity that is awarded (described further below), which reduces gross margins during the marketing exclusivity period. Brand companies may also reduce the price of their branded product to compete directly with generics entering the market, which would similarly have the effect of reducing gross margins. Furthermore, timely commencement of the litigation by the patent owner imposes an automatic stay of ANDA approval by the FDA for 30 months, unless the case is decided in the ANDA applicant’s favor during that period. Finally, if the court decision is adverse to the ANDA applicant, the ANDA approval will be delayed until the challenged patent expires, and the applicant forfeits the 180-day marketing exclusivity.
The majority of our revenues are generated by our generic products division. Our future profitability depends, to a significant extent, upon our ability to introduce, on a timely basis, new generic products that are either the first-to-market (or among the first-to-market) or that otherwise can gain significant market share. The timeliness of our product introductions is dependent upon, among other things, the timing of regulatory approval of our products, which to a large extent is outside of our control, as well as the timing of competing products. As additional distributors introduce comparable generic pharmaceutical products, price competition intensifies, market access narrows, and product sales prices and gross margins decline, often significantly and rapidly. Accordingly, our revenues and future profitability are dependent, in large part, upon our ability or the ability of our development partners to file ANDAs with the FDA timely and effectively or to enter into contractual relationships with other parties that have obtained marketing exclusivity. No assurances can be given that we will be able to develop and introduce successful products in the future within the time constraints necessary to be successful. If we or our development partners are unable to continue to timely and effectively file ANDAs with the FDA or to partner with other parties that have obtained marketing exclusivity, our revenues, gross margin and operating results may decline significantly, and our prospects and business may be materially adversely affected.
We face intense competition in the pharmaceutical industry from both brand and generic companies, which could significantly limit our growth and materially adversely affect our financial results.
The pharmaceutical industry is highly competitive. The principal competitive factors in the pharmaceutical market include:
| • | introduction of other generic drug manufacturers’ products in direct competition with our products; |
| • | introduction of authorized generic products in direct competition with our products, particularly during exclusivity periods; |
20
Table of Contents
| • | ability of generic competitors to quickly enter the market after the expiration of patents or exclusivity periods, diminishing the amount and duration of significant profits; |
| • | consolidation among distribution outlets through mergers and acquisitions and the formation of buying groups; |
| • | the willingness of generic drug customers, including wholesale and retail customers, to switch among products of different pharmaceutical manufacturers; |
| • | pricing pressures by competitors and customers; |
| • | a company’s reputation as a manufacturer and distributor of quality products; |
| • | a company’s level of service (including maintaining sufficient inventory levels for timely deliveries); |
| • | product appearance and labeling; and |
| • | a company’s breadth of product offerings. |
Many of our competitors have longer operating histories and greater financial, research and development, marketing and other resources than we do. Consequently, many of our competitors may be able to develop products and/or processes competitive with, or superior to, our own. Furthermore, we may not be able to differentiate our products from those of our competitors; to successfully develop or introduce new products—on a timely basis or at all—that are less costly than those of our competitors; or to offer customers payment and other commercial terms as favorable as those offered by our competitors. The markets in which we compete and intend to compete are undergoing, and are expected to continue to undergo, rapid and significant change. We expect competition to intensify as technological advances and consolidations continue. New developments by other manufacturers and distributors could render our products uncompetitive or obsolete.
We believe that our principal generic competitors are Teva Pharmaceutical Industries Limited (“Teva”), Sandoz (a division of Novartis AG) (“Sandoz”), Mylan Inc. (“Mylan”) and Actavis plc (“Actavis”). These companies, among others, collectively compete with the majority of our products. We also face price competition generally as other generic manufacturers enter the market. Any such price competition may be especially pronounced where our competitors source their products from jurisdictions where production costs may be lower (sometimes significantly) than our production costs, especially lower-cost foreign jurisdictions. Any of these factors, in turn, could result in reductions in our sales prices and gross margin. This price competition has led to an increase in customer demands for downward price adjustments by generic pharmaceutical distributors. Our principal strategy in addressing our competition is to offer customers a consistent supply of our generic drugs, as well as to pursue product opportunities with the potential for less competition, such as high-barrier-to-entry first-to-file or first-to-market products. There can be no assurance, however, that this strategy will enable us to compete successfully in the industry or that we will be able to develop and implement any new or additional viable strategies.
Competition in the generic drug industry has also increased due to the proliferation of authorized generic pharmaceutical products. Authorized generics are generic pharmaceutical products that are introduced by brand companies, either directly or through third parties, under the brand’s new drug application (“NDA”) approval for its own branded drug. Authorized generics do not face any regulatory barriers to introduction and are not prohibited from sale during the 180-day marketing exclusivity period granted to the first-to-file ANDA applicant. The sale of authorized generics adversely impacts the market share of a generic product that has been granted 180 days of marketing exclusivity. This is a significant source of competition for us, because an authorized generic can materially decrease the profits that we could receive as an otherwise exclusive marketer of a product. Such actions have the effect of reducing the potential market share and profitability of our generic products and may inhibit us from developing and introducing generic pharmaceutical products corresponding to certain branded drugs.
21
Table of Contents
As our competitors introduce their own generic equivalents of our generic pharmaceutical products, our revenues and gross margin from such products generally decline, often rapidly.
Revenues and gross margin derived from generic pharmaceutical products often follow a pattern based on regulatory and competitive factors that we believe are unique to the generic pharmaceutical industry. As the patent(s) for a brand name product or the statutory marketing exclusivity period (if any) expires, the first generic manufacturer to receive regulatory approval for a generic equivalent of the product often is able to capture a substantial share of the market. However, as other generic manufacturers receive regulatory approvals for their own generic versions, that market share, and the price of that product, will typically decline depending on several factors, including the number of competitors, the price of the branded product and the pricing strategy of the new competitors. We cannot provide assurance that we will be able to continue to develop such products or that the number of competitors with such products will not increase to such an extent that we may stop marketing a product for which we previously obtained approval, which may have a material adverse impact on our revenues and gross margin.
Due to our dependence on a limited number of products, our business could be materially adversely affected if our key products do not perform as well as expected.
We generate a significant portion of our total revenues and gross margin from the sale of a limited number of products. For the year ended December 31, 2014, our top ten revenue products accounted for approximately 50% of our total net revenues and a significant portion of our gross margin. For the year ended December 31, 2011, our top ten revenue products accounted for approximately 70% of our total net revenues. Any material adverse developments, including increased competition and supply shortages, with respect to the sale or use of these products, or our failure to successfully introduce new key products, could have a material adverse effect on our revenues and gross margin.
The majority of our products are produced at a few locations and a business interruption at one or more of these locations could have a material adverse effect on our business, financial position and results of operations.
We produce the majority of the products that we manufacture at our manufacturing facility in New York, and a significant number at our manufacturing facilities in California and India. Our recently acquired facility in Michigan produces all of our injectable products. Most of our inventory passes through our warehouse in New York. A significant disruption at any of these facilities, even on a short-term basis, could impair our ability to produce and ship products to the market on a timely basis, which could have a material adverse effect on our business, financial position and results of operations.
Our profitability depends on our major customers. If these relationships do not continue as expected, our business, condition (financial and otherwise), prospects and results of operations could materially suffer.
We have approximately 120 customers, some of which are part of larger buying groups. Our four largest customers in terms of our consolidated total revenues accounted for approximately 70% of our total revenues for the year ended December 31, 2014, as follows: McKesson Drug Co. (24.7%), Cardinal Health Inc. (18.3%), CVS Health Corporation (14.5%) and AmerisourceBergen Corporation (13.4%). The loss of any one or more of these or any other major customer or the substantial reduction in orders from any one or more of our major customers could have a material adverse effect upon our future operating results and financial condition.
We may experience declines in the sales volume and prices of our products as a result of the continuing trend of consolidation of certain customer groups, which could have a material adverse effect on our business, financial position and results of operations.
Our ability to successfully commercialize any generic or branded pharmaceutical product depends in large part upon the acceptance of the product by third parties, including pharmacies, government formularies, other
22
Table of Contents
retailers, physicians and patients. Therefore, our success will depend in large part on market acceptance of our products. We make a significant amount of our sales to a relatively small number of drug wholesalers and retail drug chains. These customers represent an essential part of the distribution chain of our pharmaceutical products. Drug wholesalers and retail drug chains have undergone, and are continuing to undergo, significant consolidation. This consolidation may result in these groups gaining additional purchasing leverage and consequently increasing the product pricing pressures facing our business. Additionally, the emergence of large buying groups representing independent retail pharmacies and other drug distributors, and the prevalence and influence of managed care organizations and similar institutions, potentially enable those groups to demand larger price discounts on our products. For example, there has been a recent trend of large wholesalers and retailer customers forming partnerships, such as the alliance between Walgreens and AmerisourceBergen Corporation, the alliance between Rite Aid and McKesson Drug Company and the alliance between CVS and Cardinal Health. The result of these developments may have a material adverse effect on our business, financial position and results of operations.
We depend to a large extent on third-party suppliers and distributors for the raw materials for our products, particularly the chemical compounds comprising the APIs that we use to manufacture our products, as well as for certain finished goods. A prolonged interruption in the supply of such products could have a material adverse effect on our business, financial position and results of operations.
The raw materials essential to our manufacturing business are purchased primarily from U.S. distributors of bulk pharmaceutical chemicals manufactured by foreign companies. If we experience supply interruptions or delays, we may have to obtain substitute materials or products, which in turn would require us to obtain amended or additional regulatory approvals, subjecting us to additional expenditures of significant time and resources. In addition, changes in our raw material suppliers could result in significant delays in production, higher raw material costs and loss of sales and customers, because regulatory authorities must generally approve raw material sources for pharmaceutical products, which may be time consuming. Any significant supply interruption could have a material adverse effect on our business, condition (financial and other), prospects and results of operations. To date, we have experienced no significant difficulties in obtaining raw materials. However, because the federal drug application process requires specification of raw material suppliers, if raw materials from a specified supplier were to become unavailable, FDA approval of a new supplier would be required. A delay in the manufacture and marketing of the drug involved while a new supplier becomes qualified by the FDA and its manufacturing process is determined to meet FDA standards could, depending on the particular product, have a material adverse effect on our results of operations and financial condition. Generally, we attempt to mitigate the potential effects of any such situation by providing for, where economically and otherwise feasible, two or more suppliers of raw materials for the drugs that we manufacture. In addition, we may attempt to enter into a contract with a raw material supplier in an effort to ensure adequate supply for certain of our products.
The testing required for the regulatory approval of our products is conducted primarily by independent third parties. Any failure by any of these third parties to perform this testing properly and in a timely manner may have an adverse effect upon our ability to obtain regulatory approvals.
Our applications for the regulatory approval of our products, including both internally-developed and in-licensed products, incorporate the results of testing and other information that is conducted or gathered primarily by independent third parties (including, for example, manufacturers of raw materials, testing laboratories, CROs or independent research facilities). Our ability to obtain and maintain regulatory approval of the products being tested is dependent upon the quality of the work performed by these third parties, the quality of the third parties’ facilities, and the accuracy of the information provided by third parties. We have little or no control over any of these factors. If this testing is not performed properly, our ability to obtain or maintain regulatory approvals, and to launch or continue selling products, could be restricted or delayed.
23
Table of Contents
Additionally, while we recently acquired our own CRO in India that may supplant a portion of these services provided by third parties, we have no experience running a CRO and may need to continue to rely on third parties to provide a majority of these services.
We depend on third-party agreements for a portion of our product offering, including certain key products, and any failure to maintain these arrangements or enter into similar arrangements with new partners could result in a material adverse effect.
We have broadened our product offering by entering into a variety of third-party agreements covering any combination of joint development, supply, marketing and/or distribution of products. For example, we have entered into an agreement with Croda Europe, Ltd. for development and supply of API used in our generic omega-3-acid ethyl esters oral capsules product, and with Glenmark Generics (“Glenmark”) to market and distribute Glenmark’s generic ezetimibe product. For the year ended December 31, 2014, 57% of our total net product revenues were generated from products manufactured under contract or under license. We cannot provide assurance that the development or supply efforts of our contractual partners will continue to be successful, that we will be able to renew such agreements or that we will be able to enter into new agreements for additional products. Any alteration to or termination of our current distribution and marketing agreements, any failure to enter into new and similar agreements, or interruption of our product supply under the distribution and marketing agreements, could materially adversely affect our business, condition (financial and otherwise), prospects or results of operations.
Our recent acquisitions and any acquisitions we may undertake in the future involve numerous risks, including the risks that we may be unable to integrate the acquired businesses successfully and that we may assume liabilities that could adversely affect us.
We recently completed several important acquisitions, including our acquisitions of Par Sterile in February 2014 and Innoteq, Inc. (“Innoteq”) and Par Biosciences in January 2015. We also entered into an agreement to acquire an API development and manufacturing facility from Nuray Chemicals Private Limited (“Nuray”). We expect to continue to evaluate strategic acquisitions in the future. Acquisitions involve numerous risks, including operational risks associated with the integration of acquired businesses. These risks include, but are not limited to:
| • | difficulties in achieving identified financial revenue synergies, growth opportunities, operating synergies and cost savings; |
| • | difficulties in assimilating the personnel, operations and products of an acquired company, and the potential loss of key employees; |
| • | difficulties in consolidating information technology platforms, business applications and corporate infrastructure; |
| • | difficulties in integrating our corporate culture with local customs and cultures; |
| • | possible overlap between our products or customers and those of an acquired entity that may create conflicts in relationships or other commitments detrimental to the integrated businesses; |
| • | our inability to achieve expected revenues and gross margins for any products we may acquire; |
| • | possible contingent liability that includes, among others, known or unknown environmental, patent or product liability claims; |
| • | the diversion of management’s attention from other business concerns; and |
| • | risks and challenges of entering or operating in markets in which we have limited or no prior experience, including the unanticipated effects of export controls, exchange rate fluctuations, foreign legal and regulatory requirements, and foreign political and economic conditions. |
24
Table of Contents
In addition, foreign acquisitions involve numerous risks, including those related to the absence of policies and procedures sufficient to assure compliance by a foreign entity with U.S. regulatory and legal requirements. There can be no assurance that we will not be subject to liability arising from conduct which occurred prior to our acquisition of any entity.
We incur significant transaction costs associated with our acquisitions, including substantial fees for investment bankers, attorneys, and accountants. Any acquisition could result in our assumption of unknown and/or unexpected, and perhaps material, liabilities. Additionally, in any acquisition agreement, the negotiated representations, warranties and agreements of the selling parties may not entirely protect us, and liabilities resulting from any breaches may not be subject to indemnification by the suing parties and/or could exceed negotiated indemnity limitations. These factors could impair our growth and ability to compete; divert resources from other potentially more profitable areas; or otherwise cause a material adverse effect on our business, financial position and results of operations.
The financial statements of the companies we have acquired or may acquire in the future are prepared by management of such companies and are not independently verified by our management. In addition, any pro forma financial statements prepared by us to give effect to such acquisitions may not accurately reflect the results of operations of such companies that would have been achieved had the acquisition of such entities been completed at the beginning of the applicable financial reporting periods. Finally, we cannot guarantee that we will continue to acquire businesses at valuations consistent with our prior acquisitions or that we will complete acquisitions at all.
We may make acquisitions of, or investments in, complementary businesses or products, which may be on terms that may not turn out to be commercially advantageous, may require additional debt or equity financing, and may involve numerous risks, including those set forth above.
We regularly review the potential acquisition of technologies, products, product rights and complementary businesses and are currently evaluating, and intend to continue to evaluate, potential product and/or company acquisitions and other business development opportunities. We may choose to enter into such transactions at any time. Nonetheless, we cannot provide assurance that we will be able to identify suitable acquisition or investment candidates. To the extent that we do identify candidates that we believe to be suitable, we cannot provide assurance that we will be able to reach an agreement with the selling party or parties, that the terms we may agree to will be commercially advantageous to us, or that we will be able to successfully consummate such investments or acquisitions even after definitive documents have been signed. If we make any acquisitions or investments, we may finance such acquisitions or investments through our cash reserves, debt financing (such as borrowings available to us under Par Pharmaceutical Companies’ senior credit facilities (the “Senior Credit Facilities”), including any incremental facilities thereunder), which may increase our leverage, or by issuing additional equity securities, which could dilute the holdings of our then-existing stockholders. If we require financing, we cannot provide assurance that we will be able to obtain required financing when needed on acceptable terms or at all. Any future acquisitions may involve numerous risks, including but not limited to the types of risks set forth above with respect to our recent acquisitions.
Our expansion into international markets subjects us to increased regulatory oversight and regulatory, economic, social and political uncertainties, which could cause a material adverse effect on our business, financial position and results of operations.
We are subject to certain risks associated with our plans to commercialize products in the U.K. and other European markets and with having assets and operations located in foreign jurisdictions, including our operations in India and England. We are inexperienced operating in these jurisdictions, and we have no experience in seeking regulatory approvals, marketing or selling products in the U.K. or other European
25
Table of Contents
markets. Our operations in these jurisdictions may be adversely affected by general economic conditions and economic and fiscal policy, including changes in exchange rates and controls, interest rates and taxation policies, increased government regulation, and, with respect to India, any reversal of India’s recent economic liberalization and deregulation policies, as well as social stability and political, economic or diplomatic developments in the future. Certain jurisdictions have, from time to time, experienced instances of civil unrest and hostilities, both internally and with neighboring countries. Rioting, military activity, terrorist attacks, or armed hostilities could cause our operations there to be adversely affected or suspended. We generally do not have insurance for losses and interruptions caused by terrorist attacks, military conflicts and wars. In addition, India is known to have experienced governmental corruption and, in some circumstances, anti-bribery laws may conflict with some local customs and practices. Our international operations may subject us to heightened scrutiny under the U.S. Foreign Corrupt Practices Act (“FCPA”), the UK Bribery Act and similar anti-bribery laws, and could subject us to liability under such laws despite our best efforts to comply with such laws. As a result of our policy to comply with the FCPA, the UK Bribery Act and similar anti-bribery laws, we may be at a competitive disadvantage to competitors that are not subject to, or do not comply with, such laws.
Our competitors or other third parties may allege that we are infringing their intellectual property, forcing us to expend substantial resources in litigation, the outcome of which is uncertain. Any unfavorable outcome of such litigation, including losses related to “at-risk” product launches, could have a material adverse effect on our business, financial position and results of operations.
Companies that produce branded pharmaceutical products routinely bring litigation against ANDA or similar applicants that seek regulatory approval to manufacture and market generic forms of their branded products alleging patent infringement or other violations of intellectual property rights. Patent holders may also bring patent infringement suits against companies that are currently marketing and selling approved generic products. Litigation often involves significant expense and can delay or prevent introduction or sale of our generic products. If patents are held valid, enforceable and infringed by our products, we would, unless we could obtain a license from the patent holder, need to delay selling our corresponding generic product and, if we are already selling our product, cease selling and potentially destroy existing product stock.
There may be situations in which we may make business and legal judgments to market and sell products that are subject to claims of alleged patent infringement prior to final resolution of those claims by the courts, based upon our belief that such patents are invalid, unenforceable, or are not infringed by our marketing and sale of such products. This is referred to in the pharmaceutical industry as an “at-risk” launch. The risk involved in an at-risk launch can be substantial because, if a patent holder ultimately prevails against us, the remedies available to such holder may include, among other things, damages measured by the profits lost by the patent holder, which can be significantly higher than the profits we make from selling the generic version of the product. For example, in September 2014, we paid $100 million to settle claims relating to our at-risk launch of our generic omeprazole/sodium bicarbonate capsules. Par Sterile and its development partner are currently engaged in patent litigation in the U.S. District Court for the District of New Jersey with respect to two zoledronic acid products that Par Sterile, as well as several other generic manufacturers, launched in 2013, following FDA approval of their respective ANDAs but prior to the District Court reaching a finding on the merits of the alleged claims in the litigation. See discussion under “Business—Legal Proceedings—Patent Related Matters.” We could face substantial damages from adverse court decisions in such matters. We could also be at risk for the value of such inventory that we are unable to market or sell.
We are, and will continue to be in the future, a party to legal proceedings that could result in unexpected adverse outcomes.
We are a party to other legal proceedings, including matters involving personnel and employment issues, breach of contract claims and other proceedings arising in the ordinary course of business. In addition, there
26
Table of Contents
are an increasing number of investigations and proceedings in the health care industry generally that seek recovery under the statutes and regulations identified in “Business—Government Regulation.” We evaluate our exposure to these legal proceedings and establish reserves for the estimated liabilities in accordance with GAAP. Assessing and predicting the outcome of these matters involves substantial uncertainties. Unexpected outcomes in these legal proceedings, or changes in management’s evaluations or predictions and accompanying changes in established reserves, could have a material adverse impact on our financial results.
The use of legal, regulatory and legislative strategies by brand competitors, including authorized generics and citizen’s petitions, as well as the potential impact of proposed legislation, may increase our costs associated with the introduction or marketing of our generic products, delay or prevent such introduction and/or significantly reduce the profit potential of our products.
Brand drug companies often pursue strategies that may serve to prevent or delay competition from generic alternatives to their branded products. These strategies include, but are not limited to:
| • | marketing an authorized generic version of a branded product at the same time that we introduce a generic equivalent of that product, directly or through agreement with a generic competitor; |
| • | filing “citizen’s petitions” with the FDA to thwart generic competition by causing delays of our product approvals; |
| • | using risk evaluation and mitigation strategies (“REMS”) — related distribution restrictions or other means of limiting access to their branded products to prevent us from obtaining product samples needed to conduct bioequivalence testing required for ANDA approval, thereby delaying or preventing us from obtaining FDA approval of a generic version of such branded products; |
| • | seeking to secure patent protection of certain “Elements to Assure Safe Use” of a REMS program, which are required medical interventions or other actions healthcare professionals need to execute prior to prescribing or dispensing the drug to the patient, in an attempt to thwart the generic company’s ability to avoid infringement of the patents in question or secure approval; |
| • | seeking to establish regulatory and legal obstacles that would make it more difficult to demonstrate a generic product’s bioequivalence or “sameness” to the related branded product; |
| • | initiating legislative and administrative efforts in various states to limit the substitution of generic versions of branded pharmaceutical products for the corresponding branded products; |
| • | filing suits for patent infringement that automatically delay FDA approval of generic products; |
| • | introducing “next-generation” products prior to the expiration of market exclusivity for their branded product, which often materially reduces the demand for the generic product for which we may be seeking FDA approval; |
| • | obtaining extensions of market exclusivity by conducting clinical trials of branded drugs in pediatric populations or by other methods as discussed below; |
| • | persuading the FDA to withdraw the approval of branded drugs for which the patents are about to expire, thus allowing the brand company to develop and launch new patented products serving as substitutes for the withdrawn products; |
| • | seeking to obtain new patents on drugs for which patent protection is about to expire; |
| • | filing patent applications that are more complex and costly to challenge; |
27
Table of Contents
| • | seeking temporary restraining orders and injunctions against selling a generic equivalent of their branded product based on alleged misappropriation of trade secrets or breach of confidentiality obligations; |
| • | seeking temporary restraining orders and injunctions against a generic company that has received final FDA approval for a product and is attempting to launch at risk prior to resolution of related patent litigation; |
| • | reducing the marketing of the branded product to healthcare providers, thereby reducing the branded drug’s commercial exposure and market size, which in turn adversely affects the market potential of the equivalent generic product; and |
| • | converting branded prescription drugs that are facing potential generic competition to over-the-counter products, thereby significantly impeding the growth of the generic prescription market for the drugs. |
The Food and Drug Modernization Act of 1997 includes a pediatric exclusivity provision that may provide an additional six months of market exclusivity for indications of new or currently marketed drugs if certain agreed upon pediatric studies are completed by the applicant. Brand companies are utilizing this provision to extend periods of market exclusivity. Some companies have lobbied Congress for amendments to the Hatch-Waxman legislation that would give them additional advantages over generic competitors. For example, although the term of a company’s drug patent can be extended to reflect a portion of the time an NDA is under regulatory review, some companies have proposed extending the patent term by a full year for each year spent in clinical trials, rather than the one-half year that is currently permitted. If proposals like these were to become effective, our entry into the market and our ability to generate revenues associated with new generic products may be delayed, reduced or eliminated, which could have a material adverse effect on our business.
We expend a significant amount of resources on research and development, including milestones on in-licensed products, which may not lead to successful product introductions.
Much of our development effort is focused on technically difficult-to-formulate products and/or products that require advanced manufacturing technology. We expend resources on research and development primarily to enable us to manufacture and market FDA-approved pharmaceuticals in accordance with FDA regulations. Typically, research expenses related to the development of innovative compounds and the filing of NDAs are significantly greater than those expenses associated with ANDAs. We have entered into, and may in the future enter into, agreements that require us to make significant milestone payments upon achievement of various research and development events and regulatory approvals. As we continue to develop and in-license new products, we will likely incur increased research and licensing expenses. Because of the inherent risk associated with research and development efforts in the industry, particularly with respect to new drugs, our research and development expenditures may not result in the successful introduction of FDA-approved new pharmaceutical products. Also, after we or our development partners submit an ANDA or NDA, the FDA may request that we conduct additional studies. As a result, we may be unable to reasonably determine the total research and development costs required to develop a particular product. Finally, we cannot be certain that any investment made in developing products will be recovered, even if we are successful in commercialization. To the extent that we expend significant resources on research and development efforts and are not ultimately able to introduce successful new products as a result of those efforts, our business, financial position and results of operations may be materially adversely affected.
Our branded pharmaceutical expenditures may not result in commercially successful products.
Commercializing branded pharmaceutical products is more costly than generic products. We have made significant investments in the development of the branded segment of our business, Par Specialty. This has led to increased infrastructure costs. We cannot be certain that these business expenditures will result in the successful development or launch of branded products that will prove to be commercially successful or will
28
Table of Contents
improve the long-term profitability of our business. Just as our generic products take market share from the corresponding branded products, we will confront the same competitive pressures from other generic pharmaceutical companies that may seek to introduce generic versions of our branded products. Generic products are generally sold at a significantly lower cost than the branded version, and, where available, may be required or encouraged in preference to the branded version under third party reimbursement programs, or may be required by law to be substituted for branded versions by pharmacies. Competition from generic equivalents, accordingly, could have an adverse effect on our Par Specialty segment. While we have endeavored (with our relevant partners, as applicable) to protect our branded assets by securing regulatory exclusivities and intellectual property protections, such exclusivities and protections are subject to expiry and to legal challenges. For example, on February 21, 2014, a U.S. District Court issued an opinion invalidating on obviousness grounds the single patent we asserted in a litigation we brought against a Paragraph IV challenge to our Megace® ES product. We appealed the District Court’s decision and on December 3, 2014, the U.S. Court of Appeals for the Federal Circuit reversed and remanded the case to the District Court for further findings. See discussion under “Business—Legal proceedings—Patent related matters.” The launch of a generic version of Megace® ES or Nascobal® Nasal Spray would have a material adverse impact on our branded product sales of such product.
We continue to consider product or business acquisitions or licensing arrangements to expand our brand product line. Any growth of the Par Specialty segment will be based largely on the successful commercialization of our existing products and the acquisition or in-licensing of new product opportunities. Our current and future investments in acquisition or license arrangements may not lead to expected, adequate or any returns on investment. In the past, we have invested significant sums in license arrangements for products under development, which have been terminated unsuccessfully. We also may not be able to execute future license or acquisition agreements on reasonable or favorable terms in order to continue to grow or sustain Par Specialty. In addition, we cannot be certain that our branded product expenditures will result in commercially successful launches of these products or will improve the long-term profitability of Par Specialty. For example, in 2010, we launched two branded products that did not meet our commercial expectations, and in 2011 we returned all rights to these two products to our respective third-party development partners, resulting in a write-down of assets specifically related to these products. Any future commercialization efforts that do not meet expectations could similarly result in a write-down of assets related to the relevant products.
Our reporting and payment obligations under the Medicaid rebate program and other governmental purchasing and rebate programs are complex and may involve subjective decisions. Any determination that we have failed to comply with those obligations could subject us to penalties and sanctions, which could have a material adverse effect.
The regulations regarding reporting and payment obligations with respect to Medicaid reimbursement and rebates and other governmental programs are complex and, as discussed elsewhere in this prospectus, we and other pharmaceutical companies are defendants in a number of suits filed by state attorneys general and have been notified of an investigation by the DOJ with respect to Medicaid reimbursement and rebates. Our calculations and methodologies are subject to review and challenge by the applicable governmental agencies, and it is possible that such reviews could result in material changes. In addition, because our processes for these calculations and the judgments involved in making these calculations involve, and will continue to involve, subjective decisions and complex methodologies, these calculations are subject to the risk of errors. Any governmental agencies that have commenced (or that may commence) an investigation of our company could impose, based on a claim of violation of fraud and false claims laws or otherwise, civil and/or criminal sanctions, including fines, penalties and possible exclusion from federal health care programs (including Medicaid and Medicare). Some of the applicable laws may impose liability even in the absence of specific intent to defraud. Furthermore, should there be ambiguity with regard to how to properly calculate and report
29
Table of Contents
payments, and even in the absence of any such ambiguity, a governmental authority may take a position contrary to a position that we have taken and may impose civil and/or criminal sanctions on us. Any such penalties, sanctions, or exclusion from federal health care programs could have a material adverse effect on our business, financial position and results of operations. From time to time we conduct routine reviews of our government pricing calculations. These reviews may have an impact on government price reporting and rebate calculations used to comply with various government regulations regarding reporting and payment obligations.
Our operating results are affected by many factors and may fluctuate significantly on a quarterly basis.
Our operating results may vary substantially from quarter to quarter and may be greater or less than those achieved in the immediately preceding period or in the comparable period of the prior year. Factors that may cause quarterly results to vary include, but are not limited to, the following:
| • | the amount of new product introductions; |
| • | losses related to inventory write-offs; |
| • | marketing exclusivity, if any, which may be obtained on certain new products; |
| • | the level of competition in the marketplace for certain products; |
| • | our ability to create demand in the marketplace for our branded products; |
| • | availability of raw materials and finished products from suppliers; |
| • | our ability to manufacture products at our manufacturing facilities; |
| • | the scope and outcome of governmental regulatory actions; |
| • | our dependence on a small number of products for a significant portion of net revenue or income; |
| • | legal actions against our generic products brought by brand competitors, and legal challenges to our intellectual property rights brought against our branded products by generic competitors; |
| • | price erosion and customer consolidation; and |
| • | significant payments (such as milestones) payable by us under collaboration, licensing, and development agreements to our partners before the related product has received FDA approval. |
The profitability of our product sales is also dependent upon the prices we are able to charge for our products, the costs to purchase products from third parties, and our ability to manufacture our products in a cost effective manner. If our revenues decline or do not grow as anticipated, we may not be able to reduce our operating expenses to offset such declines. Failure to achieve anticipated levels of revenues could, therefore, significantly harm our operating results for a particular fiscal period.
In certain circumstances, we issue price adjustments and other sales allowances to our customers. Although we may establish reserves based on our estimates of these amounts, if estimates are incorrect and the reserves are inadequate, it may result in adjustments to these reserves that may have a material adverse effect on our financial position and results of operations.
As described above, the first company to file an ANDA containing a Paragraph IV certification that successfully challenges the patent(s) on a branded product may be granted 180 days of generic market exclusivity by the FDA for that generic product. At the expiration of such exclusivity period, other generic distributors may enter the market, resulting in a significant price decline for the drug (in some instances, price declines have exceeded
30
Table of Contents
90%). When we experience price declines following a period of generic marketing exclusivity, or at any time when a competitor enters the market or offers a lower price with respect to a product we are selling, we may at our discretion decide to lower the price of our product to retain market share and provide price adjustments to our customers for the difference between our new (lower) price and the price at which we previously sold the product which is still held in inventory by our customers. Because the entry of a competitive generic product is unpredictable, we do not establish reserves for such potential adjustments, and therefore the full effect of such adjustments are not reflected in our operating results until they actually occur. There are also circumstances under which we may decide not to provide price adjustments to certain customers, and consequently, as a matter of business strategy, we may risk a greater level of sale returns of products in the customer’s existing inventory and lose future sales volume to competitors rather than reduce our pricing.
We establish reserves for chargebacks, rebates and incentives, other sales allowances, and product returns at the time of sale, based on estimates. Although we believe our reserves are adequate as of the date of this prospectus, we cannot provide assurances that our reserves will ultimately prove to be adequate. Increases in sales allowances may exceed our estimates due to a variety of reasons, including unanticipated competition or an unexpected change in one or more of our contractual relationships. We will continue to evaluate the effects of competition and will record a price adjustment reserve if and when we deem it necessary. Any failure to establish adequate reserves with respect to sales allowances may result in a material adverse effect on our financial position and results of operations.
If we determine that our goodwill and other intangible assets have become impaired, we may record significant impairment charges, which would adversely affect our results of operations.
Goodwill and other intangible assets represent a significant portion of our assets. Goodwill is the excess of cost over the fair market value of net assets acquired in business combinations. In the future, goodwill and intangible assets may increase as a result of future acquisitions. We review our goodwill and indefinite lived intangible assets at least annually for impairment. Impairment may result from, among other things, deterioration in the performance of acquired businesses, adverse market conditions and adverse changes in applicable laws or regulations, including changes that restrict the activities of an acquired business. Any impairment of goodwill or other intangible assets would result in a non-cash charge against earnings, which would adversely affect our results of operations. For the year ended December 31, 2014, we recorded a non-cash impairment charge of $146.9 million related to an adjustment to the forecasted operating results for two IPR&D intangible asset groups and eight Par Pharmaceutical segment products compared to their originally forecasted operating results at the date of acquisition, inclusive of one discontinued product, one partially impaired product primarily due to the contract ending with the partner and a partially impaired IPR&D project from the acquisition of Par Sterile due to an adverse court ruling pertaining to related patent litigation.
We are subject to additional costs and burdens to comply with the terms of the March 5, 2013 resolution of the DOJ’s investigation into sales and marketing activities for Megace® ES, and we could be subject to increased monetary penalties and/or other sanctions, including exclusion from federal health care programs, if we fail to comply with its terms.
On March 5, 2013, we settled U.S. federal and 49 state investigations into Par Specialty’s sales and marketing activities for Megace® ES by pleading guilty to a misdemeanor misbranding violation of the FDCA and agreeing to pay approximately $45 million in criminal fines and forfeitures and to resolve civil claims. In addition, we entered into a five-year CIA with the Office of Inspector General of the U.S. Department of Health & Human Services (“OIG”). The effective date of the CIA was March 12, 2013. The CIA requires enhancements to our compliance program, fulfillment of reporting and monitoring obligations, and management certifications, among other requirements. Compliance with the terms of the CIA has imposed and will continue to impose additional costs and burdens on us, including in the form of employee training, third party reviews, compliance
31
Table of Contents
monitoring, reporting obligations and management attention. If we fail to comply with the CIA, the OIG may impose monetary penalties or exclude us from federal health care programs, including Medicare and Medicaid, which could have a material adverse effect on our cash flows, financial position and results of operations. We may be subject to third party claims and shareholder lawsuits in connection with the settlement.
We have increased exposure to tax liabilities, including foreign tax liabilities.
As a U.S. corporation with subsidiaries in India and England, we are subject to income taxes as well as non-income based taxes in the United States, India and England. Significant judgment is required in determining our worldwide provision for income taxes and other tax liabilities. Changes in tax laws or tax rulings may have a significantly adverse impact on our effective tax rate. Recent proposals by the current U.S. administration for fundamental U.S. international tax reform, if enacted, could have a significant adverse impact on our effective tax rate. In addition, we have potential tax exposures resulting from the varying application of statutes, regulations and interpretations, which include exposures on intercompany terms of cross-border arrangements among any foreign subsidiaries in relation to various aspects of our business, including research and development activities and manufacturing. Tax authorities in various jurisdictions may disagree with and subsequently challenge the amount of profits taxed in their country, which may result in increased tax liability, including accrued interest and penalties, which would cause our tax expense to increase. This could have a material adverse effect on our business, financial position and results of operations and our ability to satisfy our debt obligations.
Risks common to our industry
Healthcare reform and a reduction in the reimbursement levels by governmental authorities, HMOs, MCOs or other third-party payers may adversely affect our business.
In order to assist us in commercializing products, we have obtained from governmental authorities and private health insurers and other organizations, such as health maintenance organizations (“HMOs”) and managed care organizations (“MCOs”), authorization to receive reimbursement at varying levels for the cost of certain products and related treatments. Third party payers increasingly challenge pricing of pharmaceutical products. The trend toward managed healthcare in the United States, the growth of organizations such as HMOs and MCOs, and legislative proposals to reform healthcare and government insurance programs could significantly influence the purchase of pharmaceutical products, resulting in lower prices and a reduction in product demand. The Patient Protection and Affordable Care Act (“PPACA”) and the Health Care and Education Reconciliation Act of 2010 were signed into law on March 23, 2010 and March 30, 2010, respectively. These laws are referred to herein as “healthcare reform.” A number of provisions of the healthcare reform laws continue to have a negative impact on the price of our products sold to U.S. government entities. As examples, the legislation includes measures that (i) significantly increase Medicaid rebates through both the expansion of the program and significant increases in rebates; (ii) substantially expand the Public Health System (340B) program to allow other entities to purchase prescription drugs at substantial discounts; (iii) extend the Medicaid rebate rate to a significant portion of Managed Medicaid enrollees; (iv) apply a 50% discount to Medicare Part D beneficiary spending in the coverage gap for branded and authorized generic prescription drugs; and (v) levy a significant excise tax on the industry to fund the healthcare reform. Such cost containment measures and healthcare reform affect our ability to sell our products and have a material adverse effect on our business, results of operations and financial condition. Additionally, the Medicare Part D Prescription Drug Benefit established a voluntary outpatient prescription drug benefit for Medicare beneficiaries (primarily the elderly over 65 and the disabled). These beneficiaries may enroll in private drug plans. There are multiple types of Part D plans and numerous plan sponsors, each with its own formulary and product access requirements. The plans have considerable discretion in establishing formularies and tiered co-pay structures and in placing prior authorization and other restrictions on the utilization of specific products. In addition, Part D plan sponsors are
32
Table of Contents
permitted and encouraged to negotiate rebates with manufacturers. The Medicare Part D program, which went into effect January 1, 2006, is administered by the Centers for Medicare & Medicaid Services (“CMS”) within the Department of Health and Human Services.
CMS has issued extensive regulations and other sub-regulatory guidance documents implementing the Medicare Part D benefit, and the OIG has issued regulations and other guidance in connection with the Medicare Part D program. The federal government can be expected to continue to issue guidance and regulations regarding the obligations of Part D sponsors and their subcontractors. Participating drug plans may establish drug formularies that exclude coverage of specific drugs, and payment levels for drugs negotiated with Part D drug plans may be lower than reimbursement levels available through private health plans or other payers. Moreover, beneficiary co-insurance requirements could influence which products are recommended by physicians and selected by patients. There is no assurance that any drug that we market will be offered by drug plans participating under the Medicare Part D program or of the terms of any such coverage, or that covered drugs will be reimbursed at amounts that reflect current or historical levels. Additionally, any reimbursement granted may not be maintained, or limits on reimbursement available from third-party payers may reduce the demand for, or negatively affect the price of those products, and could significantly harm our business, results of operations, financial condition and cash flows. We may also be subject to lawsuits relating to reimbursement programs that could be costly to defend, divert management’s attention and adversely affect our operating results. Most state Medicaid programs have established preferred drug lists, and the process, criteria and timeframe for obtaining placement on the preferred drug list varies from state to state. Under the Medicaid drug rebate program, a manufacturer must pay a rebate for Medicaid utilization of a product. The rebate for single source products (including authorized generics) is based on the greater of (i) a specified percentage of the product’s average manufacturer price or (ii) the difference between the product’s average manufacturer price and the best price offered by the manufacturer. The rebate for multiple source products is a specified percentage of the product’s average manufacturer price. In addition, many states have established supplemental rebate programs as a condition for including a drug product on a preferred drug list. The profitability of our products may depend on the extent to which they appear on the preferred drug lists of a significant number of state Medicaid programs and the amount of the rebates that must be paid to such states. In addition, there is significant fiscal pressure on the Medicaid program, and amendments to lower the pharmaceutical costs of the program are possible. Such amendments could materially adversely affect our anticipated revenues and results of operations. Due to the uncertainties regarding the outcome of future healthcare reform initiatives and their enactment and implementation, we cannot predict which, if any, of the future reform proposals will be adopted or the effect such adoption may have on us. Additionally, future healthcare legislation could also have a significant impact on our business.
Implementation of healthcare reform and changes in the health care regulatory environment may adversely affect our business.
A number of the provisions of the healthcare reform laws required rulemaking action by governmental agencies to be implemented. The laws changed access to health care products and services and created new fees for the pharmaceutical and medical device industries. Future rulemaking could increase rebates, reduce prices or the rate of price increases for health care products and services, or require additional reporting and disclosure. We cannot predict the timing or impact of any future rulemaking.
Due to extensive regulation and enforcement in the pharmaceutical industry, we face significant uncertainties and potentially significant costs associated with our efforts to comply with applicable regulations. Failure to comply could result in material adverse effects to our business, financial position and results of operations.
The pharmaceutical industry operates in a highly regulated environment subject to the actions of courts and governmental agencies that influence the ability of a company to successfully operate its business and is
33
Table of Contents
subject to regulation by various governmental authorities at the federal, state and local levels with respect to the development, manufacture, labeling, sale, distribution, marketing, advertising and promotion of pharmaceutical products. Many of these factors are beyond our control and are, therefore, difficult to predict. These risks, along with others, have the potential to materially and adversely affect our business, financial position, results of operations and prospects. Failure to comply with governmental regulations can result in fines, disgorgement of profits, unanticipated compliance expenditures, recall or seizure of products, total or partial suspension of production and/or distribution, suspension of the FDA’s review of NDAs or ANDAs, enforcement actions, injunctions and criminal prosecution. Although we have developed compliance programs to address the regulatory environment, there is no guarantee that these programs will meet regulatory agency standards now or in the future. Additionally, despite our efforts at compliance, there is no guarantee that we may not be deemed to be deficient in some manner in the future. If we are deemed to be deficient in any significant way, our business, financial position and results of operations could be materially affected.
Litigation is common in our industry, can be protracted and expensive, and could delay and/or prevent entry of our products into the market, which could have a material adverse effect on our business.
Litigation concerning intellectual property rights in the pharmaceutical industry can be protracted and expensive. Pharmaceutical companies with patented branded products regularly sue companies that file applications to produce generic equivalents of their patented branded products for alleged patent infringement or other violations of intellectual property rights, which are expensive to defend and may delay or prevent the entry of such generic products into the market. Generally, a generic drug may not be marketed until the applicable patent(s) on the brand name drug expire or are held to be invalid, unenforceable or not infringed by the generic product at issue. When we or our development partners submit an ANDA to the FDA for approval of a generic drug, we and/or our development partners must certify either (1) that there is no patent listed with the FDA as covering the relevant branded product, (2) that any patent listed as covering the branded product has expired, (3) that the patent listed as covering the branded product will expire prior to the marketing of the generic product, in which case the ANDA will not be finally approved by the FDA until the expiration of such patent, or (4) that any patent listed as covering the branded drug is invalid or will not be infringed by the manufacture, sale or use of the generic product for which the ANDA is submitted (a “Paragraph IV” certification). Whenever we file an ANDA with a Paragraph IV certification, there is a high likelihood that a brand pharmaceutical company will sue us for alleged patent infringement and/or other violations of intellectual property rights. Also, competing pharmaceutical companies may file lawsuits against us or our strategic partners alleging patent infringement or other violations of intellectual property rights or may file declaratory judgment actions against us alleging non-infringement, invalidity, or unenforceability of our own patents. Because substantially all of our current business involves the development and marketing of products that are subject to potential claims of patent infringement by third parties or, with respect to our own branded products, are subject to third party challenges, the threat of litigation, the outcome of which is inherently uncertain, is always present. Such litigation is often costly and time-consuming and could result in a substantial delay in, or prevent, the introduction and/or marketing of our products, which could have a material adverse effect on our business, condition (financial and other), prospects and results of operations. For more information on our material pending litigation, please see “Business—Legal proceedings.”
We are susceptible to product liability claims that may not be covered by insurance, which, if successful, could require us to pay substantial sums.
Like all pharmaceutical companies, we face the risk of loss resulting from, and the adverse publicity associated with, product liability lawsuits, whether or not such claims are valid. We likely cannot avoid such claims. Unanticipated side effects or unfavorable publicity concerning any of our products or product candidates would likely have an adverse effect on our ability to achieve acceptance by prescribing physicians, managed care providers, pharmacies and other retailers, customers, patients and clinical trial participants. Even unsuccessful
34
Table of Contents
product liability claims could require us to spend money on litigation, divert management’s time, damage our reputation and impair the marketability of our products. In addition, although we believe that we have adequate product liability insurance coverage, we cannot be certain that our insurance will, in fact, be sufficient to cover such claims or that we will be able to obtain or maintain adequate insurance coverage in the future at acceptable prices. A successful product liability claim that is excluded from coverage or exceeds our policy limits could require us to pay substantial sums. In addition, insurance coverage for product liability may become prohibitively expensive in the future or, with respect to certain high-risk products, may not be available at all, and as a result we may not be able to maintain adequate product liability insurance coverage to mitigate the risk of large claims, or we may be required to maintain a larger self-insured retention than we would otherwise choose.
We are subject to extensive governmental regulation, and any non-compliance may result in fines and/or other sanctions, including product seizures, product recalls, injunctive actions and criminal prosecutions.
As a pharmaceutical manufacturer and distributor, we are subject to extensive regulation by the federal government, principally the FDA and the Drug Enforcement Administration, as well as by state governments. The FDCA, the Controlled Substances Act, the Generic Drug Enforcement Act of 1992 (the “Generic Drug Act”), and other federal, state and local statutes and regulations govern the testing, manufacture, safety, labeling, storage, disposal, tracking, recordkeeping, approval, advertising and promotion (including to the healthcare community) of our products. The Generic Drug Act, a result of legislative hearings and investigations into the generic drug approval process, is particularly relevant to our business. Under the Generic Drug Act, the FDA is authorized to impose debarment and other penalties on individuals and companies that commit illegal acts relating to the generic drug approval process. In some situations, the Generic Drug Act requires the FDA not to accept or review for a period of time any ANDAs submitted by a company that has committed certain violations and provides for temporary denial of approval of such ANDAs during its investigation. Additionally, non-compliance with other applicable regulatory requirements may result in fines, perhaps significant in amount, and other sanctions imposed by courts and/or regulatory bodies, including the initiation of product seizures, product recalls, injunctive actions and criminal prosecutions. From time to time, we have voluntarily recalled our products and may do so in the future. In addition, administrative remedies may involve the refusal of the government to enter into supply contracts with, and/or to approve NDAs and ANDAs of, a non-complying entity. The FDA also has the authority to withdraw its approval of drugs in accordance with statutory procedures.
Because of the chemical ingredients of pharmaceutical products and the nature of the manufacturing process, the pharmaceutical industry is subject to extensive environmental laws and regulation and the risk of incurring liability for damages and/or the costs of remedying environmental problems. These requirements include regulation of the handling, manufacture, transportation, storage, use and disposal of materials, including the discharge of hazardous materials and pollutants into the environment. In the normal course of our business, we are exposed to risks relating to possible releases of hazardous substances into the environment, which could cause environmental or property damage or personal injuries, and which could result in (i) our noncompliance with such environmental and occupational health and safety laws and regulations and (ii) regulatory enforcement actions or claims for personal injury and property damage against us. If an unapproved or illegal environmental discharge or accident occurred or if we were to discover contamination caused by prior operations, including by prior owners and operators of properties we acquire, then we could be liable for cleanup, damages or fines, which could have a material adverse effect on our business, financial position, results of operations, and cash flow. In the future, we may be required to increase expenditures in order to remedy environmental problems and/or comply with changes in applicable environmental laws and regulations. We could also become a party to environmental remediation investigations and activities. These obligations may relate to sites that we currently or in the future may own or lease, sites that we formerly owned or operated, or sites where waste from our operations was disposed. Additionally, if we fail to comply with environmental regulations to use, discharge or dispose of hazardous materials appropriately or otherwise to
35
Table of Contents
comply with the provisions of our operating licenses, the licenses could be revoked, and we could be subject to criminal sanctions and/or substantial civil liability or be required to suspend or modify our manufacturing operations. We currently operate in New Jersey, New York, California, Connecticut and Michigan, which are often recognized for having very aggressive public health and environmental protection laws. We also operate in India, where environmental, health and safety regulations are developing and expanding, and we cannot determine how these laws will be implemented and the impact of such regulation on our Indian operations. We may in the future establish or acquire operations in other jurisdictions subject to equally or more stringent laws and regulations. Stricter environmental, safety and health laws and enforcement policies could result in substantial costs and liabilities to us, and could subject our handling, manufacture, use, reuse or disposal of substances or pollutants to more rigorous scrutiny than is currently the case. Consequently, compliance with these laws could result in significant capital expenditures, as well as other costs and liabilities, which could materially adversely affect us.
As part of the Medicare Prescription Drug, Improvement, and Modernization Act of 2003, companies are now required to file with the Federal Trade Commission (the “FTC”) and the DOJ certain types of agreements entered into between brand and generic pharmaceutical companies related to the settlement of patent litigation or the manufacture, marketing and sale of generic versions of branded drugs. This requirement could affect the manner in which generic drug manufacturers resolve intellectual property litigation and other disputes with brand pharmaceutical companies and could result generally in an increase in private-party litigation against pharmaceutical companies or additional investigations or proceedings by the FTC or other governmental authorities. The potential for FTC investigations and litigation and private-party lawsuits associated with arrangements between brand and generic drug manufacturers could adversely affect our business. In recent years, the FTC has expressed its intention to take aggressive action to challenge settlements that include an alleged payment from the brand company to the generic company (so-called “pay for delay” patent litigation settlements) and to call on legislators to pass stronger laws prohibiting such settlements. In 2013, the U.S. Supreme Court held that certain of such settlements could violate anti-trust laws and must be evaluated under a “rule of reason” standard of review. We are currently, and we have been in the past and may be in the future, the subject of investigation and litigation by the FTC in which violations of antitrust laws are alleged stemming from our settlement of patent litigation with brand pharmaceutical companies and other activities. This litigation has also resulted, and may in the future result, in follow-on litigation against us by private plaintiffs alleging similar claims. We could be subject to similar investigations and litigation in the future, which would likely result in substantial costs and divert our management’s attention and resources and could have a material adverse effect on our business activities and condition (financial or otherwise). For more information on our material pending litigation, please see “Business—Legal proceedings.”
We are subject to the effects of changes in statutes, regulations and/or interpretative guidance that may adversely affect our business and/or that could require us to devote increased time and resources to our compliance efforts, which may not be successful. For example, the FDA has proposed revisions to regulations governing generic drugs with respect to both when and how a labeling change would be required, which could have negative consequences for our business. The proposed revisions could create a regulatory framework whereby multiple, different labeling, including different warnings, could simultaneously exist in the marketplace for multiple generic versions of a drug, which could adversely affect our customers’ acceptance of our generic products or could place our products at a competitive disadvantage. Moreover, the proposed revisions could expose us to substantial new tort liability costs, which could cause us to withdraw or decline to pursue certain products. These or any other changes in statutes, regulations and/or interpretative guidance could have a material adverse effect on our business, condition (financial and other), prospects and results of operations.
36
Table of Contents
Investigations and litigation concerning the calculation of average wholesale prices may adversely affect our business.
Many government and third-party payors, including Medicare, Medicaid, HMOs and others, reimburse doctors and others for the purchase of certain prescription drugs based on a drug’s average wholesale price (“AWP”). In the past several years, state and federal government agencies have conducted ongoing investigations of manufacturers’ reporting practices with respect to AWP, in which the agencies have suggested that reporting of inflated AWPs by manufacturers have led to excessive payments for prescription drugs. For example, beginning in September 2003, we, along with numerous other pharmaceutical companies, had been named as a defendant in actions brought by the Attorneys General of Illinois, Kansas, Louisiana and Utah, as well as a state law qui tam action brought on behalf of the state of Wisconsin by Peggy Lautenschlager and Bauer & Bach, LLC, alleging generally that the defendants defrauded the state Medicaid systems by purportedly reporting or causing the reporting of AWP and/or “Wholesale Acquisition Costs” that exceeded the actual selling price of the defendants’ prescription drugs. These cases generally sought some combination of actual damages, and/or double damages, treble damages, compensatory damages, statutory damages, civil penalties, disgorgement of excessive profits, restitution, disbursements, counsel fees and costs, litigation expenses, investigative costs, injunctive relief, punitive damages, imposition of a constructive trust, accounting of profits or gains derived through the alleged conduct, expert fees, interest and other relief that the court may have deemed proper.
On January 28, 2014, we settled the claims brought by the State of Kansas for $1.8 million. On February 5, 2014, we settled the claims brought by the State of Utah for $2.1 million. On June 2, 2014, we settled the claims brought by the State of Illinois for $28.5 million. For the status of the Wisconsin state law qui tam action brought by Peggy Lautenschlager and Bauer & Bach, LLC, please see “Business—Legal proceedings—Industry related matters.”
We can give no assurance that we will be able to settle the current or future actions on terms that we deem reasonable, or that such settlements or adverse judgments, if entered, will not exceed the amount of any reserve. Accordingly, such actions could adversely affect us and may have a material adverse effect on our business, results of operations, financial condition and cash flows.
Investigations and litigations related to allegations that our sales and marketing practices caused providers of pharmacy services to substitute or switch prescriptions written for specific drug formulations may adversely affect our business.
At various times between 2006 and 2010, the Attorneys General of Florida, Indiana and Virginia and the United States Office of Personnel Management issued subpoenas to us, and the Attorneys General of Michigan, Tennessee, Texas, and Utah issued civil investigative demands to us. These demands pertained to allegations that certain of our sales and marketing practices caused providers of pharmacy services to substitute or switch prescriptions written for specific drug formulations under circumstances in which some state Medicaid programs at various times reimbursed the new dosage form at a higher rate than the dosage form being substituted. The aforementioned subpoenas and civil investigative demands culminated in the federal and state law qui tam action brought on behalf of the United States and several states by Bernard Lisitza. The DOJ intervened in this action on July 8, 2011 and filed a separate complaint against us on September 9, 2011, alleging claims for violations of the Federal False Claims Act and common law fraud. The states of Michigan and Indiana have also intervened as to claims arising under their respective state false claims acts, common law fraud, and unjust enrichment. See “Business—Legal proceedings—Industry related matters.”
If the plaintiffs in any of these or future actions are ultimately successful, it could adversely affect us and may have a material adverse effect on our business, results of operations, financial condition and cash flows.
37
Table of Contents
We are increasingly dependent on information technology, and our systems and infrastructure face certain risks, including cybersecurity and data leakage risks.
Significant disruptions to our information technology systems or breaches of information security could adversely affect our business. In the ordinary course of business, we collect, store and transmit large amounts of confidential information, and it is critical that we do so in a secure manner to maintain the confidentiality and integrity of such confidential information. We also have outsourced significant elements of our information technology infrastructure, and as a result we are managing independent vendor relationships with third parties who are responsible for maintaining significant elements of our information technology systems and infrastructure and who may or could have access to our confidential information. The size and complexity of our information technology systems, and those of our third party vendors with whom we contract, make such systems potentially vulnerable to service interruptions and security breaches from inadvertent or intentional actions by our employees, partners or vendors, from attacks by malicious third parties, or from intentional or accidental physical damage to our systems infrastructure maintained by us or by third parties. Maintaining the secrecy of this confidential, proprietary, and/or trade secret information is important to our competitive business position. While we have taken steps to protect such information and invested in information technology, there can be no assurance that our efforts will prevent service interruptions or security breaches in our systems or the unauthorized or inadvertent wrongful use or disclosure of confidential information that could adversely affect our business operations or result in the loss, dissemination, or misuse of critical or sensitive information. A breach of our security measures or the accidental loss, inadvertent disclosure, unapproved dissemination, misappropriation or misuse of trade secrets, proprietary information, or other confidential information, whether as a result of theft, hacking, fraud, trickery or other forms of deception, or for any other cause, could enable others to produce competing products, use our proprietary technology or information, and/or adversely affect our business position. Further, any such interruption, security breach, loss or disclosure of confidential information, could result in financial, legal, business, and reputational harm to us and could have a material adverse effect on our business, financial position, results of operations and/or cash flow.
Our future success depends on our ability to attract and retain key employees and consultants.
Our future success depends, to a substantial degree, upon the continued service of the key members of our management team. The loss of the services of key members of our management team including Paul V. Campanelli, our Chief Executive Officer, Thomas J. Haughey, our General Counsel and Chief Administrative Officer, Michael A. Tropiano, our Chief Financial Officer, and Terrance J. Coughlin, our Chief Operating Officer, or their inability to perform services on our behalf, could have a material adverse effect on our business, condition (financial and other), prospects and results of operations. Our success also depends, to a large extent, upon the contributions of our sales, marketing, scientific and quality assurance staff. We compete for qualified personnel against other brand and generic pharmaceutical manufacturers, who may offer more favorable employment opportunities. If we are not able to attract and retain the necessary personnel to accomplish our business objectives, we could experience constraints that would adversely affect our ability to sell and market our products effectively, to meet the demands of our strategic partners in a timely fashion and to support research and development programs. In particular, sales and marketing efforts depend on the ability to attract and retain skilled and experienced sales, marketing and quality assurance representatives. Although we believe that we have been successful in attracting and retaining skilled personnel in all areas of our business, we cannot provide assurance that we can continue to attract, train and retain such personnel. Any failure in this regard could limit the rates at which we generate sales and develop or acquire new products.
38
Table of Contents
We depend on our ability to protect our intellectual property and proprietary rights. We cannot be certain of our ability to keep confidential and protect such rights.
Our success depends on our ability to protect and defend the intellectual property rights associated with our current and future products. If we fail to protect our intellectual property adequately, competitors may manufacture and market products similar to, or that may be confused with, our products, and our generic competitors may obtain regulatory approval to make and distribute generic versions of our branded products. Some patent applications in the United States are maintained in secrecy or are not published until the resulting patents issue. We also cannot be certain that patents will be issued with respect to any of our patent applications or that any existing or future patents issued to or licensed by us will provide competitive advantages for our products or will not be challenged, invalidated, circumvented or held unenforceable in proceedings commenced by our competitors or other third parties. Furthermore, our patent rights may not prevent or limit our present and future competitors from developing, making, importing, using or commercializing products that are functionally similar to our products. We rely particularly on trade secrets, trademarks, unpatented proprietary expertise and continuing innovation that we seek to protect, in part, by registering and using marks, and, with regard to other intellectual property, by entering into confidentiality agreements with licensees, suppliers, employees, consultants and other parties. This is done in large part because few of our products are protected by patents. We cannot provide assurance that these agreements will not be breached or circumvented. We also cannot be certain that we will have recourse to adequate remedies in the event of a breach. Disputes may arise concerning the ownership of intellectual property or the applicability of confidentiality agreements. We cannot be sure that our trade secrets and proprietary technology will not be independently developed or otherwise become known by our competitors or, if patents are not issued with respect to internally-developed products, that we will be able to maintain the confidentiality of information relating to these products. In addition, efforts to ensure our intellectual property rights can be costly, time-consuming and/or ultimately unsuccessful.
Risks related to our indebtedness
The substantial indebtedness of our indirect subsidiary, Par Pharmaceutical Companies, could adversely affect our ability to raise additional capital to fund our operations, limit our ability to react to changes in the economy or our industry and prevent us from meeting obligations on our indebtedness.
We currently have a substantial amount of indebtedness. As of March 31, 2015, our total debt was $2,346.1 million (excluding original issue discount or upfront payments), with unused commitments of $150 million under the Senior Credit Facilities. We may also incur significant additional indebtedness in the future.
Subject to the limits contained in the credit agreement governing the Senior Credit Facilities and the indenture governing the Notes, we may be able to incur substantial additional debt from time to time to finance working capital, capital expenditures, investments or acquisitions, or for other purposes. If we do so, the risks related to this high level of debt could intensify. Specifically, the high level of debt could have important consequences, including, but not limited to:
| • | making it more difficult for Par Pharmaceutical Companies to satisfy its obligations with respect to its debt; |
| • | requiring a substantial portion of our cash flows to be dedicated to debt service payments instead of other purposes, thereby reducing the amount of cash flows available for working capital, capital expenditures, acquisitions and other general corporate purposes; |
| • | limiting our ability to obtain additional financing to fund future working capital, capital expenditures, acquisitions or other general corporate requirements; |
39
Table of Contents
| • | increasing our vulnerability to general adverse economic and industry conditions; |
| • | exposing us to the risk of increased interest rates as certain of our borrowings, including borrowings under the Senior Credit Facilities, are at variable rates of interest; |
| • | limiting our flexibility in planning for and reacting to changes in the industry in which we compete; |
| • | placing us at a disadvantage compared to other, less leveraged competitors; and |
| • | increasing our cost of borrowing. |
In addition, the indenture that governs the Notes and the credit agreement governing the Senior Credit Facilities contain restrictive covenants that limit Par Pharmaceutical Companies’ ability to engage in activities that may be in our long-term best interest. Our failure to comply with those covenants could result in an event of default which, if not cured or waived, could result in the acceleration of all our debt.
Our leveraged business model includes constituents (e.g., the Sponsor and debt holders) that by the nature of their relationship to our enterprise may have different points of view on the use of company resources as compared to our management. The financial and contractual obligations related to our debt also represent a natural constraint on any intended use of company resources.
The terms of the credit agreement governing the Senior Credit Facilities and the indenture governing the Notes restrict our current and future operations, particularly our ability to respond to changes or to take certain actions.
The indenture governing the Notes and the credit agreement governing the Senior Credit Facilities contain a number of restrictive covenants that impose significant operating and financial restrictions on Par Pharmaceutical Companies and may limit our ability to engage in acts that may be in our long-term best interest, including restrictions on our ability to:
| • | incur additional indebtedness; |
| • | pay dividends or make other distributions or repurchase or redeem our capital stock; |
| • | prepay, redeem or repurchase certain debt; |
| • | make loans and investments; |
| • | sell assets; |
| • | incur liens; |
| • | enter into transactions with affiliates; |
| • | alter the businesses we conduct; |
| • | enter into agreements restricting our subsidiaries’ ability to pay dividends; and |
| • | consolidate, merge or sell all or substantially all of our assets. |
In addition, the restrictive covenants in the credit agreement governing the Senior Credit Facilities require Par Pharmaceutical Companies to maintain a specified financial ratio if there are outstanding borrowings under the revolving credit facility portion of the Senior Credit Facilities. Par Pharmaceutical Companies’ ability to meet those financial ratios can be affected by events beyond our control.
A breach of the covenants under the indenture governing the Notes or under the credit agreement governing the Senior Credit Facilities could result in an event of default under the applicable indebtedness. Such a default may allow the creditors to accelerate the related debt and may result in the acceleration of any other debt to
40
Table of Contents
which a cross-acceleration or cross-default provision applies which could have a material adverse effect on our business, operations and financial results. In addition, an event of default under the credit agreement governing the Senior Credit Facilities would permit the lenders under the Senior Credit Facilities to terminate all commitments to extend further credit under that facility. Furthermore, if Par Pharmaceutical Companies were unable to repay the amounts due and payable under the Senior Credit Facilities, those lenders could proceed against the collateral granted to them to secure that indebtedness which could force us into bankruptcy or liquidation. In the event Par Pharmaceutical Companies’ lenders or noteholders accelerate the repayment of the borrowings, we and our subsidiaries may not have sufficient assets to repay that indebtedness. Any acceleration of amounts due under the credit agreement governing the Senior Credit Facilities or the indenture governing the Notes or the exercise by the applicable lenders of their rights under the related security documents would likely have a material adverse effect on us. As a result of these restrictions, we may be:
| • | limited in how we conduct our business; |
| • | unable to raise additional debt or equity financing to operate during general economic or business downturns; or |
| • | unable to compete effectively or to take advantage of new business opportunities. |
These restrictions may affect our ability to grow in accordance with our strategy.
We may not be able to generate sufficient cash to service all of our indebtedness and may be forced to take other actions to satisfy our obligations under our indebtedness, which may not be successful.
Our ability to make scheduled payments on or refinance our debt obligations depends on our financial condition and operating performance, which are subject to prevailing economic and competitive conditions and to certain financial, business, legislative, regulatory and other factors beyond our control. We may be unable to maintain a level of cash flows from operating activities sufficient to permit us to pay the principal, premium, if any, and interest on our indebtedness.
If our cash flows and capital resources are insufficient to fund our debt service obligations, we could face substantial liquidity problems and could be forced to reduce or delay investments and capital expenditures or to dispose of material assets or operations, seek additional debt or equity capital or restructure or refinance our indebtedness. We may not be able to effect any such alternative measures on commercially reasonable terms or at all and, even if successful, those alternative actions may not allow us to meet our scheduled debt service obligations. The credit agreement governing the Senior Credit Facilities and the indenture governing the Notes restrict Par Pharmaceutical Companies’ ability to dispose of assets and use the proceeds from those dispositions and also restrict our ability to raise debt or equity capital to be used to repay other indebtedness when it becomes due. We may not be able to consummate those dispositions or to obtain proceeds in an amount sufficient to meet any debt service obligations when due.
Our inability to generate sufficient cash flows to satisfy our debt obligations, or to refinance our indebtedness on commercially reasonable terms or at all, would materially and adversely affect our financial position and results of operations and our ability to satisfy our obligations, including our indebtedness.
If we cannot make scheduled payments on our debt, we will be in default and, as a result:
| • | our debt holders could declare all outstanding principal and interest to be due and payable; |
| • | the lenders under the Senior Credit Facilities could terminate their commitments to loan Par Pharmaceutical Companies money and foreclose against the assets securing the borrowings; and |
| • | we could be forced into bankruptcy or liquidation. |
41
Table of Contents
We will require a significant amount of cash to service our indebtedness. The ability to generate cash or refinance our indebtedness as it becomes due depends on many factors, some of which are beyond our control.
We are a holding company, and as such have no independent operations or material assets other than our ownership of equity interests in our subsidiaries, and our subsidiaries’ contractual arrangements with customers, and we will depend on our subsidiaries to distribute funds to us so that we may pay our obligations and expenses. We anticipate that Par Pharmaceutical Holdings, Inc. will become a guarantor under the Notes after completion of this offering. Our ability to make scheduled payments on, or to refinance our respective obligations under, our indebtedness and to fund planned capital expenditures and other corporate expenses will depend on the ability of our subsidiaries to make distributions, dividends or advances to us, which in turn will depend on our subsidiaries’ future operating performance and on economic, financial, competitive, legislative, regulatory and other factors and any legal and regulatory restrictions on the payment of distributions and dividends to which they may be subject. Many of these factors are beyond our control. We cannot assure our creditors that our business will generate sufficient cash flow from operations, that currently anticipated cost savings and operating improvements will be realized or that future borrowings will be available to us in an amount sufficient to enable us to satisfy our respective obligations under our indebtedness or to fund our other needs. In order for us to satisfy our obligations under our indebtedness and fund planned capital expenditures, we must continue to execute our business strategy. If we are unable to do so, we may need to reduce or delay our planned capital expenditures or refinance all or a portion of our indebtedness on or before maturity. Significant delays in our planned capital expenditures may materially and adversely affect our future revenue prospects. In addition, we cannot assure our creditors that we will be able to refinance any of our indebtedness on commercially reasonable terms or at all.
Despite our current level of indebtedness, we and our subsidiaries may still be able to incur substantially more debt. This could further exacerbate the risks to our financial condition described above.
We and our subsidiaries may be able to incur significant additional indebtedness in the future. Although the indenture governing the Notes and the credit agreement governing the Senior Credit Facilities contain restrictions on the incurrence of additional indebtedness, these restrictions are subject to a number of qualifications and exceptions, and the additional indebtedness incurred in compliance with these restrictions could be substantial. These restrictions also will not prevent us from incurring obligations that do not constitute indebtedness. If new debt is added to our current debt levels, the related risks that we and the guarantors now face could intensify.
Our variable rate indebtedness subjects us to interest rate risk, which could cause our debt service obligations to increase significantly.
Borrowings under the Senior Credit Facilities are at variable rates of interest and expose us to interest rate risk. The Senior Credit Facility includes a London Inter-Bank Offered Rates (“LIBOR”) floor of 1.00%, which at December 31, 2014 is in excess of LIBOR which at December 31, 2014 was 0.25% for an interest period of three months. The interest period can be set at one, two, three or six months as selected by us in accordance with the terms of the Senior Credit Facilities. If the three month LIBOR spot rate were to increase or decrease by 0.125% from current rates, interest expense would not change due to application of the 1.00% floor previously mentioned. If the specified LIBOR rate were to increase above 1.00%, our debt service obligations on the variable rate indebtedness would increase even though the amount borrowed remained the same, and our net income and cash flows, including cash available for servicing our indebtedness, would correspondingly decrease. An increase of 0.125% over the 1.00% floor previously mentioned would result in a $1.0 million increase in our annual interest expense associated with the Senior Credit Facilities.
During 2013, Par Pharmaceutical Companies entered into derivatives to hedge the variable cash flows associated with existing variable-rate debt under the credit agreement governing the Senior Credit Facilities beginning as of September 30, 2013. Our objective in using interest rate derivatives is to add certainty to
42
Table of Contents
interest expense amounts and to manage our exposure to interest rate movements, specifically to protect us from variability in cash flows attributable to changes in LIBOR interest rates. To accomplish this objective, Par Pharmaceutical Companies entered into interest rate caps. Interest rate caps designated as cash flow hedges involve the receipt of variable-rate amounts from a counterparty if LIBOR exceeds the strike rate in exchange for the company making fixed-rate payments over the life of the agreements without exchange of the underlying notional amount. As of December 31, 2014, we had eight outstanding interest rate caps with two counterparties with various termination dates and notional amounts, which we deemed to be effective for accounting purposes. The derivatives had a combined notional value of $750.0 million, all with effective dates as of either September 30, 2013 or 2014 and with termination dates each September 30th beginning in 2015 and ending in 2018. Consistent with the terms of the credit agreement governing the Senior Credit Facilities, the interest rate caps have a strike of 1% which matches the LIBOR floor of 1.0% on the debt. The premium is deferred and paid over the life of the instrument. The effective annual interest rate related to these interest rate caps was a fixed weighted average rate of approximately 4.8% at December 31, 2014. These instruments are designated for accounting purposes as cash flow hedges of interest rate risk related to credit agreement governing the Senior Credit Facilities. In addition, amounts reported in “Accumulated other comprehensive loss” on our consolidated balance sheet related to derivatives will be reclassified to interest expense as interest payments are made on our variable-rate debt under credit agreement governing the Senior Credit Facilities. Approximately 35% of our total outstanding debt at December 31, 2014 remains subject to variability in cash flows attributable to changes in LIBOR interest rates. During fiscal year 2015, we estimate that $5.8 million will be reclassified from “Accumulated other comprehensive loss” on our consolidated balance sheet at December 31, 2014 to interest expense.
In the future, Par Pharmaceutical Companies may enter into additional interest rate swaps that involve the exchange of floating for fixed rate interest payments in order to reduce interest rate volatility. However, we may not maintain interest rate swaps with respect to all of our variable rate indebtedness, and any swaps we enter into may not fully mitigate our interest rate risk.
A lowering or withdrawal of the ratings assigned to the Notes or our other debt by rating agencies may increase our future borrowing costs and reduce our access to capital.
The Notes and the term loans under our Senior Credit Facilities have been rated by Moody’s and Standard & Poor’s and may in the future be rated by additional rating agencies. On February 9, 2015, Standard & Poor’s affirmed our Corporate Credit Rating and outlook at B/Stable, while Moody’s affirmed our Corporate Family Rating at B2 and changed our rating outlook to stable from negative. These actions were taken after each rating agency reassessed our risk profile in conjunction with the Dividend Recapitalization and the related additional borrowings. Any ratings assigned to our debt could be lowered or withdrawn entirely by a rating agency if, in that rating agency’s judgment, future circumstances relating to the basis of the rating, such as adverse changes, so warrant. Any such fluctuation in the ratings of the Company may impact our ability to access debt markets in the future or increase the cost of future debt which could have a material adverse effect on the operations and financial condition of the Company, which in return may adversely affect the trading price of shares of our common stock.
Risks related to our common stock and this offering
TPG will continue to have significant influence over us after this offering, including control over decisions that require the approval of stockholders, which could limit your ability to influence the outcome of matters submitted to stockholders for a vote.
We are currently controlled, and after this offering is completed will continue to be controlled, by TPG. Upon completion of this offering, investment funds affiliated with TPG will beneficially own % of our outstanding
43
Table of Contents
common stock (or % if the underwriters exercise in full their option to purchase additional shares). As long as TPG owns or controls at least a majority of our outstanding voting power, it will have the ability to exercise substantial control over all corporate actions requiring stockholder approval, irrespective of how our other stockholders may vote, including the election and removal of directors and the size of our board, any amendment of our certificate of incorporation or bylaws, or the approval of any merger or other significant corporate transaction, including a sale of substantially all of our assets. Even if its ownership falls below 50%, TPG will continue to be able to strongly influence or effectively control our decisions.
Additionally, TPG’s interests may not align with the interests of our other stockholders. TPG is in the business of making investments in companies and may acquire and hold interests in businesses that compete directly or indirectly with us. TPG may also pursue acquisition opportunities that may be complementary to our business, and, as a result, those acquisition opportunities may not be available to us.
Upon the listing of our shares, we will be a “controlled company” within the meaning of the rules of and, as a result, will qualify for, and intend to rely on, exemptions from certain corporate governance requirements; you will not have the same protections afforded to stockholders of companies that are subject to such requirements.
Because TPG will continue to control a majority of the voting power of our outstanding common stock after completion of this offering, we will be a “controlled company” within the meaning of the corporate governance standards of NYSE. Under these rules, a company of which more than 50% of the voting power for the election of directors is held by an individual, group or another company is a “controlled company” and may elect not to comply with certain corporate governance requirements, including the requirements that, within one year of the date of the listing of our common stock:
| • | we have a board that is composed of a majority of “independent directors,” as defined under the rules of ; |
| • | we have a compensation committee that is composed entirely of independent directors; and |
| • | we have a nominating and corporate governance committee that is composed entirely of independent directors. |
Following this offering, we intend to utilize all of these exemptions. Accordingly, for so long as we are a “controlled company,” you will not have the same protections afforded to stockholders of companies that are subject to all of the corporate governance requirements of NYSE. Our status as a controlled company could make our common stock less attractive to some investors or otherwise harm our stock price.
Our directors who have relationships with TPG may have conflicts of interest with respect to matters involving our company.
Following this offering, of our directors will be affiliated with TPG. Our TPG-affiliated directors have fiduciary duties to us and, in addition, will have duties to TPG. As a result, these directors may face real or apparent conflicts of interest with respect to matters affecting both us and TPG, whose interests, in some circumstances, may be adverse to ours.
Provisions of Delaware Law and our corporate governance documents could make an acquisition of our company more difficult and may prevent attempts by our stockholders to replace or remove our current management, even if beneficial to our stockholders.
In addition to TPG’s beneficial ownership of a controlling percentage of our common stock, our certificate of incorporation and bylaws and the Delaware General Corporation Law (the “DGCL”) contain provisions that could make it more difficult for a third party to acquire us, even if doing so might be beneficial to our stockholders. These provisions include:
| • | the division of our board of directors into three classes and the election of each class for three-year terms; |
44
Table of Contents
| • | advance notice requirements for stockholder proposals and director nominations; |
| • | the ability of the board of directors to fill a vacancy created by the expansion of the board of directors; |
| • | the ability of our board of directors to issue new series of, and designate the terms of, preferred stock, without stockholder approval, which could be used to, among other things, institute a rights plan that would have the effect of significantly diluting the stock ownership of a potential hostile acquirer, likely preventing acquisitions that have not been approved by our board of directors; |
| • | limitations on the ability of stockholders to call special meetings and to take action by written consent following the date that the TPG Funds no longer beneficially own a majority of our common stock; and |
| • | the required approval of holders of at least 75% of the voting power of the outstanding shares of our capital stock to adopt, amend or repeal certain provisions of our certificate of incorporation and bylaws or remove directors for cause, in each case following the date that the TPG Funds no longer beneficially own a majority of our common stock. |
In addition, Section 203 of the DGCL may affect the ability of an “interested stockholder” to engage in certain business combinations, for a period of three years following the time that the stockholder becomes an “interested stockholder.” While we have elected in our certificate of incorporation not to be subject to Section 203 of the DGCL, our certificate of incorporation contains provisions that have the same effect as Section 203 of the DGCL, except that they provide that investment funds affiliated with TPG will not be deemed to be an “interested stockholder,” and accordingly will not be subject to such restrictions.
In addition, because our board is responsible for appointing the members of our management team, these provisions may frustrate or prevent any attempts by our stockholders to replace or remove our current management by making it more difficult for stockholders to replace members of our board. As a result, you may lose your ability to sell your stock for a price in excess of the prevailing market price due to these protective measures, and efforts by stockholders to change the direction or management of the Company may be unsuccessful. See “Description of capital stock.”
If you purchase shares of common stock in this offering, you will suffer immediate and substantial dilution of your investment.
The initial public offering price of our common stock is substantially higher than the net tangible book deficit per share of our common stock. Therefore, if you purchase shares of our common stock in this offering, you will pay a price per share that substantially exceeds our net tangible book deficit per share after this offering. Based on an assumed initial public offering price of $ per share, the midpoint of the range set forth on the cover page of this prospectus, you will experience immediate dilution of $ per share, representing the difference between our pro forma net tangible book deficit per share after giving effect to this offering and the initial public offering price. In addition, purchasers of common stock in this offering will have contributed % of the aggregate price paid by all purchasers of our stock but will own only approximately % of our common stock outstanding after this offering. We also have a large number of outstanding stock options to purchase common stock with exercise prices that are below the estimated initial public offering price of our common stock. To the extent that these options are exercised, you will experience further dilution. See “Dilution” for more detail.
Your percentage ownership in us may be diluted by future issuances of capital stock, which could reduce your influence over matters on which stockholders vote.
Pursuant to our certificate of incorporation and bylaws, our board of directors has the authority, without action or vote of our stockholders, to issue all or any part of our authorized but unissued shares of common stock,
45
Table of Contents
including shares issuable upon the exercise of options, or shares of our authorized but unissued preferred stock. Issuances of common stock or voting preferred stock would reduce your influence over matters on which our stockholders vote and, in the case of issuances of preferred stock, would likely result in your interest in us being subject to the prior rights of holders of that preferred stock.
An active, liquid trading market for our common stock may not develop, which may limit your ability to sell your shares.
Prior to this offering, there was no public market for our common stock. Although we intend to list our common stock on the NYSE under the symbol “PRX,” an active trading market for our shares may never develop or be sustained following this offering. The initial public offering price will be determined by negotiations between us and the underwriters and may not be indicative of market prices of our common stock that will prevail in the open market after the offering. A public trading market having the desirable characteristics of depth, liquidity and orderliness depends upon the existence of willing buyers and sellers at any given time, such existence being dependent upon the individual decisions of buyers and sellers over which neither we nor any market maker has control. The failure of an active and liquid trading market to develop and continue would likely have a material adverse effect on the value of our common stock. The market price of our common stock may decline below the initial public offering price, and you may not be able to sell your shares of our common stock at or above the price you paid in this offering, or at all. An inactive market may also impair our ability to raise capital to continue to fund operations by selling shares and may impair our ability to acquire other companies or technologies by using our shares as consideration.
As a public company, we will become subject to additional laws, regulations and stock exchange listing standards, which will impose additional costs on us and may strain our resources and divert our management’s attention.
Prior to this offering, although Par Pharmaceutical Companies has filed periodic and current reports with the United States Securities and Exchange Commission (the “SEC”) to satisfy obligations under our debt instruments, we operated our company on a private basis. After this offering, we will be subject to the reporting requirements of the Securities Exchange Act of 1934, as amended (the “Exchange Act”), the Sarbanes-Oxley Act, the Dodd-Frank Wall Street Reform and Consumer Protection Act of 2010, the listing requirements of the NYSE, and other applicable securities laws and regulations. Compliance with these laws and regulations will increase our legal and financial compliance costs and make some activities more difficult, time-consuming or costly. In particular, we estimate that we will incur incremental costs in connection with the requirements to obtain an attestation report on our internal controls from our independent auditors under Section 404 of the Sarbanes-Oxley Act. In connection with preparation for providing this attestation, our independent auditors may identify deficiencies or weaknesses in our controls. We also expect that being a public company and being subject to new rules and regulations will make it more expensive for us to obtain director and officer liability insurance, and we may be required to accept reduced coverage or incur substantially higher costs to obtain coverage. These factors may therefore strain our resources, divert management’s attention and affect our ability to attract and retain qualified board members.
Maintaining and improving our financial controls and the requirements of being a public company may strain our resources, divert management’s attention and affect our ability to attract and retain qualified board members.
The Sarbanes-Oxley Act requires, among other things, that we maintain disclosure controls and procedures and internal control over financial reporting. Ensuring that we have adequate internal financial and accounting controls and procedures in place is a costly and time-consuming effort that needs to be re-evaluated frequently. Section 404 of the Sarbanes-Oxley Act will require that we evaluate our internal control over financial reporting
46
Table of Contents
to enable management to report on, and our independent auditors to audit as of the end of our fiscal year ended December 31, 2016, the effectiveness of those controls. Both we and our independent registered public accounting firm will be testing our internal controls in connection with the Section 404 of the Sarbanes-Oxley Act requirements and could, as part of that documentation and testing, identify material weaknesses, significant deficiencies or other areas for further attention or improvement.
Implementing any appropriate changes to our internal controls may require specific compliance training for our directors, officers and employees, require the hiring of additional finance, accounting and other personnel, entail substantial costs to modify our existing accounting systems, and take a significant period of time to complete. Such changes may not, however, be effective in maintaining the adequacy of our internal controls, and any failure to maintain that adequacy, or consequent inability to produce accurate financial statements on a timely basis, could increase our operating costs and could materially impair our ability to operate our business. Moreover, adequate internal controls are necessary for us to produce reliable financial reports and are important to help prevent fraud. As a result, our failure to satisfy the requirements of Section 404 of the Sarbanes-Oxley Act on a timely basis could result in the loss of investor confidence in the reliability of our financial statements, which in turn could cause the market value of our common stock to decline.
Various rules and regulations applicable to public companies make it more difficult and more expensive for us to maintain directors’ and officers’ liability insurance, and we may be required to accept reduced coverage or incur substantially higher costs to maintain coverage. If we are unable to maintain adequate directors’ and officers’ liability insurance, our ability to recruit and retain qualified officers and directors, especially those directors who may be deemed independent for purposes of the rules, will be significantly curtailed.
Our operating results and share price may be volatile, and the market price of our common stock after this offering may drop below the price you pay.
Our quarterly operating results are likely to fluctuate in the future as a publicly traded company. In addition, securities markets worldwide have experienced, and are likely to continue to experience, significant price and volume fluctuations. This market volatility, as well as general economic, market or political conditions, could subject the market price of our shares to wide price fluctuations regardless of our operating performance. We and the underwriters will negotiate to determine the initial public offering price. You may not be able to resell your shares at or above the initial public offering price or at all. Our operating results and the trading price of our shares may fluctuate in response to various factors, including:
| • | market conditions in the broader stock market; |
| • | actual or anticipated fluctuations in our quarterly financial and operating results; |
| • | introduction of new products or services by us or our competitors; |
| • | issuance of new or changed securities analysts’ reports or recommendations; |
| • | results of operations that vary from expectations of securities analysts and investors; |
| • | results of operations that vary from those of our competitors; |
| • | guidance, if any, that we provide to the public, any changes in this guidance or our failure to meet this guidance; |
| • | strategic actions by us or our competitors; |
| • | announcement by us, our competitors or our vendors of significant contracts or acquisitions; |
| • | sales, or anticipated sales, of large blocks of our stock; |
47
Table of Contents
| • | additions or departures of key personnel; |
| • | regulatory, legal or political developments; |
| • | public response to press releases or other public announcements by us or third parties, including our filings with the SEC; |
| • | litigation and governmental investigations; |
| • | changing economic conditions; |
| • | changes in accounting principles; |
| • | default under agreements governing our indebtedness; |
| • | exchange rate fluctuations; and |
| • | other events or factors, including those from natural disasters, war, acts of terrorism or responses to these events. |
These and other factors, many of which are beyond our control, may cause our operating results and the market price and demand for our shares to fluctuate substantially. While we believe that operating results for any particular quarter are not necessarily a meaningful indication of future results, fluctuations in our quarterly operating results could limit or prevent investors from readily selling their shares and may otherwise negatively affect the market price and liquidity of our shares. In addition, in the past, when the market price of a stock has been volatile, holders of that stock have sometimes instituted securities class action litigation against the company that issued the stock. If any of our stockholders brought a lawsuit against us, we could incur substantial costs defending the lawsuit. Such a lawsuit could also divert the time and attention of our management from our business, which could significantly harm our profitability and reputation.
A significant portion of our total outstanding shares are restricted from immediate resale but may be sold into the market in the near future. This could cause the market price of our common stock to drop significantly, even if our business is doing well.
Sales of a substantial number of shares of our common stock in the public market could occur at any time. These sales, or the perception in the market that the holders of a large number of shares intend to sell shares, could reduce the market price of our common stock. After this offering, we will have outstanding shares of common stock based on the number of shares outstanding as of , 2015. This includes shares that we are selling in this offering, as well as the shares that the selling stockholders are selling, which may be resold in the public market immediately, and assumes no exercises of outstanding options. Substantially all of the shares that are not being sold in this offering will be subject to a 180-day lock-up period provided under agreements executed in connection with this offering. These shares will, however, be able to be resold after the expiration of the lock-up agreement as described in the “Shares Eligible for Future Sale” section of this prospectus. We also intend to file a Form S-8 under the Securities Act of 1933, as amended (the “Securities Act”), to register all shares of common stock that we may issue under our equity compensation plans. In addition, the TPG Funds have certain demand registration rights that could require us in the future to file registration statements in connection with sales of our stock by them. See “Certain Relationships and Related Party Transactions—Registration Rights Agreement.” Such sales could be significant. Once we register these shares, they can be freely sold in the public market upon issuance, subject to the lock-up agreements described in the “Underwriting (conflicts of interest)” section of this prospectus. As restrictions on resale end, the market price of our stock could decline if the holders of currently restricted shares sell them or are perceived by the market as intending to sell them.
48
Table of Contents
Since we have no current plans to pay regular cash dividends on our common stock following this offering, you may not receive any return on investment unless you sell your common stock for a price greater than that which you paid for it.
Although we have previously declared a dividend to our stockholders, we do not anticipate paying any regular cash dividends on our common stock following this offering. Any decision to declare and pay dividends in the future will be made at the discretion of our board and will depend on, among other things, our results of operations, financial condition, cash requirements, contractual restrictions and other factors that our board may deem relevant. In addition, our ability to pay dividends is, and may be, limited by covenants of existing and any future outstanding indebtedness we or our subsidiaries incur. Therefore, any return on investment in our common stock is solely dependent upon the appreciation of the price of our common stock on the open market, which may not occur. See “Dividend policy” for more detail.
We are a holding company with nominal net worth and will depend on dividends and distributions from our subsidiaries, which are restricted from paying dividends and distributions to Par Pharmaceutical Holdings, Inc. pursuant to the terms of our existing indebtedness and may be restricted pursuant to the terms of future indebtedness, which as a result may restrict us from paying dividends to you.
We are a holding company with nominal net worth. We do not have any material assets or conduct any business operations other than our investments in our subsidiaries. Our business operations are conducted primarily out of our indirect operating subsidiary, Par Pharmaceutical, Inc. and its subsidiaries. As a result, notwithstanding any restrictions on payment of dividends under our existing indebtedness, our ability to pay dividends, if any, will be dependent upon cash dividends and distributions or other transfers from our subsidiaries, including from Par Pharmaceutical Companies. Payments to us by our subsidiaries will be contingent upon their respective earnings and subject to any limitations on the ability of such entities to make payments or other distributions to us. The indenture governing the Notes and the credit agreement governing the Senior Credit Facilities restrict Par Pharmaceutical Companies and its subsidiaries from paying dividends and making distributions to its direct or indirect equity holders unless there are available exceptions thereunder such as was permitted in February 2015 in connection with the Dividend Recapitalization. If we are not able to meet such available exceptions to pay a dividend or make a distribution to Par Pharmaceutical Holdings, Inc., which would allow us to pay a dividend to you, then we will need to obtain a waiver from the holders of Notes and/or the lenders under the Senior Credit Facilities to pay such dividend.
If securities or industry analysts do not publish research or reports about our business, if they adversely change their recommendations regarding our shares or if our results of operations do not meet their expectations, our share price and trading volume could decline.
The trading market for our shares will be influenced by the research and reports that industry or securities analysts publish about us or our business. We do not have any control over these analysts. If one or more of these analysts cease coverage of our company or fail to publish reports on us regularly, we could lose visibility in the financial markets, which in turn could cause our share price or trading volume to decline. Moreover, if one or more of the analysts who cover us downgrade our stock, or if our results of operations do not meet their expectations, our share price could decline.
A ratings downgrade or other negative action by a ratings organization could adversely affect the trading price of the shares of our common stock.
Credit rating agencies continually revise their ratings for companies they follow. The condition of the financial and credit markets and prevailing interest rates have fluctuated in the past and are likely to fluctuate in the future. In addition, developments in our business and operations could lead to a ratings downgrade for us or our subsidiaries. Any such fluctuation in the rating of us or our subsidiaries may impact our ability to access
49
Table of Contents
debt markets in the future or increase our cost of future debt which could have a material adverse effect on our operations and financial condition, which in return may adversely affect the trading price of shares of our common stock.
Our certificate of incorporation designates courts in the State of Delaware as the sole and exclusive forum for certain types of actions and proceedings that may be initiated by our stockholders, which could limit our stockholders’ ability to obtain a favorable judicial forum for disputes with us or our directors, officers or employees.
Our certificate of incorporation provides that, subject to limited exceptions, the Court of Chancery of the State of Delaware will be the sole and exclusive forum for (i) any derivative action or proceeding brought on our behalf, (ii) any action asserting a claim of breach of a fiduciary duty owed by any of our directors, officers or other employees to us or our stockholders, (iii) any action asserting a claim against us arising pursuant to any provision of the DGCL, our certificate of incorporation or our bylaws, (iv) any action to interpret, apply, enforce or determine the validity of our certificate of incorporation or bylaws or (v) any other action asserting a claim against us that is governed by the internal affairs doctrine (each, a “Covered Proceeding”). In addition, our certificate of incorporation provides that if any action the subject matter of which is a Covered Proceeding is filed in a court other than the specified Delaware courts without the approval of our board of directors (each, a “Foreign Action”), the claiming party will be deemed to have consented to (i) the personal jurisdiction of the specified Delaware courts in connection with any action brought in any such courts to enforce the exclusive forum provision described above and (ii) having service of process made upon such claiming party in any such enforcement action by service upon such claiming party’s counsel in the Foreign Action as agent for such claiming party. Our certificate of incorporation also provides that, except to the extent prohibited by the DGCL, in the event that a claiming party initiates, asserts, joins, offers substantial assistance to or has a direct financial interest in any Foreign Action without the prior approval of our board of directors, each such claiming party shall be obligated jointly and severally to reimburse us and any officer, director or other employee made a party to such proceeding for all fees, costs and expenses of every kind and description (including, but not limited to, all attorneys’ fees and other litigation expenses) that the parties may incur in connection with such Foreign Action. Any person or entity purchasing or otherwise acquiring any interest in shares of our capital stock shall be deemed to have notice of and to have consented to these provisions. These provisions may limit a stockholder’s ability to bring a claim in a judicial forum that it finds favorable for disputes with us or our directors, officers or other employees, which may discourage such lawsuits against us and our directors, officers and employees. Alternatively, if a court were to find these provisions of our certificate of incorporation inapplicable to, or unenforceable in respect of, one or more of the specified types of actions or proceedings, we may incur additional costs associated with resolving such matters in other jurisdictions, which could adversely affect our business and financial condition.
Our bylaws provide that if a claiming party brings certain actions against us and is not successful on the merits then they will be obligated to pay our litigation costs, which could have the effect of discouraging litigation, including claims brought by our stockholders.
Under our bylaws, except to the extent prohibited by the DGCL, and unless our board of directors otherwise approves, in the event that any claiming party (a) initiates, asserts, joins, offers substantial assistance to or has a direct financial interest in a Covered Proceeding and (b) such claiming party does not obtain a judgment on the merits that substantially achieves, in substance and amount, the full remedy sought by such claiming party, then each such claiming party shall be obligated to reimburse us and any applicable director, officer or other employee for all fees, costs and expenses of every kind and description (including, but not limited to, all attorneys’ fees and other litigation expenses) that we or any such director, officer or other employee actually incurs in connection with the Covered Proceeding. A claim that may be brought under the federal securities
50
Table of Contents
laws arising out of the sale of securities in this offering would not constitute a Covered Proceeding. In addition, any other claims that may be brought under the federal securities laws (or portions of actions involving such claims) would also not constitute Covered Proceedings. While application of this standard will necessarily need to take into account the particular facts, circumstances and equities of any particular claim, we would expect a claiming party to be required to prevail on the merits on substantially all of the claims asserted in the complaint and, as a result, receive substantially the full remedy that it was seeking (including, if applicable, any equitable remedy) in order to avoid responsibility for reimbursing such fees, costs and expenses, and we expect that we would seek to apply this standard in a manner most favorable to us. However, it is uncertain how a court will ultimately interpret this provision. Any person or entity purchasing or otherwise acquiring any interest in the shares of capital stock of the Company shall be deemed to have notice of and consented to this provision. This provision could have the effect of discouraging litigation against us, including claims brought by our stockholders and including claims that are partially (but not wholly) successful on the merits. However, it is currently unclear whether the Delaware legislature will take action to eliminate or limit the ability of stock corporations to implement provisions such as this, or whether Delaware courts will enforce in full a provision such as this for a Delaware stock corporation. If the Delaware legislature takes action to limit or eliminate our ability to include this provision in our bylaws or a court were to find this provision inapplicable to, or unenforceable in respect of, one or more of the specified types of actions or proceedings, we may incur additional costs associated with resolving such matters in other jurisdictions, which could adversely affect our business and financial condition.
51
Table of Contents
Cautionary note regarding forward-looking statements
This prospectus contains “forward-looking statements” within the meaning of the federal securities laws, which involve risks and uncertainties. Forward-looking statements are neither historical facts nor assurances of future performance. Instead, they are based on our current beliefs, expectations and assumptions regarding the future of our business, future plans and strategies, and other future conditions. Forward-looking statements can be identified by words such as “anticipate,” “believe,” “envision,” “estimate,” “expect,” “intend,” “may,” “plan,” “predict,” “project,” “target,” “potential,” “will,” “would,” “could,” “should,” “continue,” “contemplate” and other similar expressions, although not all forward-looking statements contain these identifying words. Examples of forward-looking statements include, among others, statements we make regarding our intentions, beliefs or current expectations concerning, among other things, future operations; future financial performance, trends and future events, particularly relating to sales of current products and the development, approval and introduction of new products; FDA and other regulatory applications, approvals and actions; market position and expenditures; the continuation of historical trends; our ability to operate our business under our new capital and operating structure; and the sufficiency of our cash balances and cash generated from operating and financing activities for future liquidity and capital resource needs.
We may not actually achieve the plans, intentions or expectations disclosed in our forward-looking statements, and you should not place significant reliance on our forward-looking statements. Actual results or events could differ materially from the plans, intentions and expectations disclosed in the forward-looking statements we make. Important factors that could cause actual results and events to differ materially from those indicated in the forward-looking statements include, among others, those discussed in the “Risk factors” section of this prospectus, which include the following:
| • | If we are unable to successfully develop or commercialize new products, our operating results will suffer. |
| • | If we fail to obtain exclusive marketing rights for our generic products or fail to introduce these generic products on a timely basis, our revenues, gross margin and operating results may decline significantly. |
| • | We face intense competition in the pharmaceutical industry from both brand and generic companies, which could significantly limit our growth and materially adversely affect our financial results. |
| • | Due to our dependence on a limited number of products, our business could be materially adversely affected if our key products do not perform as well as expected. |
| • | Our profitability depends on our major customers. If these relationships do not continue as expected, our business, condition (financial and otherwise), prospects and results of operations could materially suffer. |
| • | Our competitors, including brand pharmaceutical companies, or other third parties may allege that we are infringing their intellectual property, forcing us to expend substantial resources in resulting litigation, the outcome of which is uncertain. Any unfavorable outcome of such litigation, including losses related to “at-risk” product launches, could have a material adverse effect on our business, financial position and results of operations. |
| • | We are, and will continue to be in the future, a party to legal proceedings that could result in unexpected adverse outcomes. |
| • | Due to extensive regulation and enforcement in the pharmaceutical industry, we face significant uncertainties and potentially significant costs associated with our efforts to comply with applicable regulations. Failure to comply could result in material adverse effects to our business, financial position and results of operations. |
52
Table of Contents
| • | The substantial indebtedness of our indirect subsidiary, Par Pharmaceutical Companies, could adversely affect our ability to raise additional capital to fund our operations, limit our ability to react to changes in the economy or our industry and prevent us from meeting obligations on our indebtedness. |
Given these risks and uncertainties, you are cautioned not to place undue reliance on these forward-looking statements. Any forward-looking statement that we make in this prospectus speaks only as of the date of such statement, and we undertake no obligation to update any forward-looking statements or to publicly announce the results of any revisions to any of those statements to reflect future events or developments. Comparisons of results for current and any prior periods are not intended to express any future trends or indications of future performance, unless specifically expressed as such, and should only be viewed as historical data.
53
Table of Contents
We estimate that the net proceeds to us from our issuance and sale of shares of common stock in this offering will be approximately $ million, after deducting underwriting discounts and commissions and estimated offering expenses payable by us (or approximately $ million if the underwriters exercise their option to purchase additional shares of common stock in full). This estimate assumes an initial public offering price of $ per share, the midpoint of the price range set forth on the cover page of this prospectus.
We intend to use the net proceeds of this offering to repay indebtedness. We do not currently have a firm expectation as to how we will allocate the reduction of our indebtedness among these borrowing arrangements but intend to determine the allocation following the completion of this offering based on a number of factors, including amounts remaining at maturity, applicable interest rates, available pricing of repurchases, repayments or redemptions, outstanding balance and ability to reborrow.
We also intend to use the remainder of the net proceeds, if any, for working capital and other general corporate purposes, including supporting our strategic growth opportunities in the future.
We will not receive any proceeds from the sale of shares by the selling stockholders, including if the underwriters exercise their option to purchase additional shares. After deducting the underwriting discounts, the selling stockholders will receive approximately $ million of proceeds from this offering.
A $1.00 increase (decrease) in the assumed public offering price of $ , based upon the midpoint of the estimated price range set forth on the cover of this prospectus, would increase (decrease) the net proceeds to us from this offering by $ million (or approximately $ million if the underwriters exercise their option to purchase additional shares of common stock in full), assuming the number of shares we offer, as set forth on the cover page of this prospectus, remains the same and after deducting underwriting discounts and commissions and estimated offering expenses payable by us. A 1,000,000 share increase (decrease) in the number of shares offered by us would increase (decrease) the net proceeds to us from this offering by $ million (or approximately $ million if the underwriters exercise their option to purchase additional shares of common stock in full), assuming the aggregate offering price set forth on the cover page of this prospectus remains the same, and after deducting underwriting discounts and commissions and estimated offering expenses payable by us.
Affiliates of TPG Capital BD, LLC, an underwriter of this offering, own in excess of 10% of our issued and outstanding common stock. Therefore, a “conflict of interest” is deemed to exist under FINRA Rule 5121(f)(5)(B). In addition, because the TPG Funds (as defined below) are affiliates of TPG Capital BD, LLC and, as selling stockholders, will receive more than 5% of the net proceeds of this offering, a “conflict of interest” is also deemed to exist under FINRA Rule 5121(f)(5)(C)(ii). Accordingly, this offering will be made in compliance with the applicable provisions of FINRA Rule 5121. In accordance with FINRA Rule 5121(c), no sales of the shares will be made to any discretionary account over which TPG Capital BD, LLC exercises discretion without the prior specific written approval of the account holder. However, no “qualified independent underwriter” is required because the underwriters primarily responsible for managing this offering are free of any “conflict of interest,” as that term is defined in the rule. See “Underwriting (conflicts of interest).”
Under certain interpretations of the SEC, dividends declared in the year of an initial public offering are deemed to be in contemplation of the offering with the intention of repayment out of the offering proceeds to the extent that dividends exceeded earnings during such period. Accordingly, we have provided pro forma earnings per share information for 2014 that gives pro forma effect to the assumed issuance of a number of shares whose proceeds are deemed to be necessary to pay previous year’s dividends in excess of 2014 earnings ($494.3 million). See “Summary historical and pro forma condensed consolidated financial data” found elsewhere in this prospectus for pro forma earnings per share information.
54
Table of Contents
Following the completion of the offering, our board of directors does not intend to pay dividends on our common stock. However, we expect to reevaluate our dividend policy on a regular basis following the offering and may, subject to compliance with the covenants contained in our credit facilities and other instruments governing our indebtedness which limit our ability to pay dividends and other considerations, determine to pay dividends in the future. The declaration, amount and payment of any future dividends on shares of our common stock will be at the sole discretion of our board of directors, which may take into account general and economic conditions, our financial condition and results of operations, our available cash and current and anticipated cash needs, capital requirements, contractual, legal, tax and regulatory restrictions, the implications of the payment of dividends by us to our stockholders or by our subsidiaries to us, and any other factors that our board of directors may deem relevant. See “Description of Indebtedness” for restrictions on payment of dividends.
In February 2015, our board of directors declared a cash dividend of $0.6303 per share (or approximately $494.3 million in the aggregate) to stockholders of record as of February 25, 2015.
55
Table of Contents
The following table sets forth our cash and cash equivalents and capitalization at March 31, 2015:
| • | on an actual basis; |
| • | on an as adjusted basis to give effect to (1) the issuance of shares of common stock by us in this offering and our receipt of approximately $ million in net proceeds from the sale of such shares, assuming an initial public offering price of $ per share, the midpoint of the price range set forth on the cover page of this prospectus, after deducting underwriting discounts and commissions and estimated offering expenses, and (2) the application of the estimated net proceeds from the offering as described in “Use of proceeds.” |
You should read this table in conjunction with the information contained in “Use of proceeds,” “Summary historical and pro forma condensed consolidated financial data,” “Management’s discussion and analysis of financial condition and results of operations” and “Description of indebtedness” as well as our consolidated financial statements and the related notes included elsewhere in this prospectus.
| As of March 31, 2015 | ||||||||
| (dollars in thousands) | Actual | As adjusted (1)(2) |
||||||
| Cash and cash equivalents |
$ | 185,880 | $ | |||||
|
|
|
|||||||
| Long-term debt, including current portions: |
||||||||
| Senior secured credit facilities: |
||||||||
| Senior secured term loan |
$ | 1,856,148 | ||||||
| Senior secured revolving credit facility |
— | |||||||
| 7.375% senior notes |
490,000 | |||||||
|
|
|
|||||||
| Total debt |
2,346,148 | |||||||
|
|
|
|||||||
| Stockholders’ equity: |
||||||||
| Common stock, par value $0.001 per share; 900,000,000 shares authorized and 784,251,980 shares issued and outstanding on an actual basis, shares authorized and shares issued and outstanding on an as adjusted basis |
784 | |||||||
| Additional paid in capital |
323,828 | |||||||
| Accumulated deficit |
(245,809 | ) | ||||||
| Accumulated other comprehensive loss |
(5,380 | ) | ||||||
| Treasury stock |
(1,961 | ) | ||||||
|
|
|
|||||||
| Total stockholder’s equity |
71,462 | |||||||
|
|
|
|||||||
| Total capitalization |
$ | 2,603,490 | $ | |||||
|
|
||||||||
| (1) | As adjusted reflects a $ increase to stockholders equity and a $ million increase to cash and cash equivalents related to the issuance of shares of common stock in this offering and the application of the estimated proceeds of from the offering as described in “Use of proceeds.” |
| (2) | A $1.00 increase (decrease) in the assumed initial public offering price of $ per share, the midpoint of the price range set forth on the cover of this prospectus, would increase (decrease) the as adjusted amount of each of cash and cash equivalents and total stockholders’ equity by approximately $ million after deducting underwriting discounts and commissions and estimated offering expenses payable by us. Each 1,000,000 share increase or decrease in the number of shares offered by us would increase or decrease, as applicable, as our cash and cash equivalents, additional paid-in capital and stockholders’ equity by $ million assuming no change in the assumed initial public offering price of $ per share (the midpoint of the range listed on the cover page of this prospectus) and after deducting estimated underwriting discounts and commissions and estimated offering expenses payable by us. To the extent we raise more proceeds in this offering, we may repay additional indebtedness. To the extent we raise less proceeds in this offering, we may reduce the amount of indebtedness that will be repaid. |
56
Table of Contents
If you invest in our common stock in this offering, your interest will be diluted to the extent of the difference between the initial public offering price per share of our common stock in this offering and the pro forma as adjusted net tangible book value per share of our common stock after this offering. Dilution results from the fact that the initial public offering price per share of common stock is substantially in excess of the net tangible book deficit per share of our common stock attributable to the existing stockholders for our presently outstanding shares of common stock. Our net tangible book deficit per share represents the amount of our total tangible assets (total assets less intangible assets) less total liabilities, divided by the number of shares of common stock issued and outstanding.
As of March 31, 2015 we had a historical net tangible book deficit of $1,971.7 million, or $2.51 per share of common stock, based on 784,251,980 shares of our common stock outstanding as of March 31, 2015. Dilution is calculated by subtracting net tangible book deficit per share of our common stock from the assumed initial public offering price per share of our common stock.
Investors participating in this offering will incur immediate and substantial dilution. Without taking into account any other changes in such net tangible book deficit after March 31, 2015, after giving effect to the sale of shares of our common stock in this offering assuming an initial public offering price of $ per share (the midpoint of the offering range shown on the cover of this prospectus), less the underwriting discounts and commissions and estimated offering expenses payable by us, our pro forma net tangible book deficit as of March 31, 2015 would have been approximately $ million, or $ per share of common stock. This amount represents an immediate decrease in net tangible book deficit of $ per share of our common stock to the existing stockholders and immediate dilution in net tangible book deficit of $ per share of our common stock to investors purchasing shares of our common stock in this offering. The following table illustrates this dilution on a per share basis:
| Assumed initial public offering price per share |
$ | |||||||
| Net tangible book deficit per share as of March 31, 2015, before giving effect to this offering |
$ | 2.51 | ||||||
| Decrease in net tangible book deficit per share attributable to investors purchasing shares in this offering |
||||||||
|
|
|
|||||||
| Pro forma net tangible book value per share, after giving effect to this offering |
||||||||
| Dilution in as adjusted net tangible book deficit per share to investors in this offering |
$ | |||||||
|
|
||||||||
If the underwriters exercise their option in full to purchase additional shares, the pro forma as adjusted net tangible book deficit per share of our common stock after giving effect to this offering would be $ per share of our common stock. This represents an increase in pro forma as adjusted net tangible book deficit of $ per share of our common stock to existing stockholders and dilution in pro forma as adjusted net tangible book deficit of $ per share of our common stock to new investors.
Each $1.00 increase (decrease) in the assumed initial public offering price of $ per share would increase (decrease) the pro forma as adjusted net tangible book deficit per share of our common stock after giving effect to this offering by $ , or by $ per share of our common stock, assuming no change to the number of shares of our common stock offered by us as set forth on the front cover page of this prospectus and after deducting the estimated underwriting discounts and expenses payable by us. An increase or decrease of 1,000,000 shares in the number of shares offered by us would increase or decrease our net tangible deficit as adjusted to give effect to this offering by $ per share, assuming the assumed initial offering price of $ per share (the midpoint of the range listed on the cover page of this prospectus) remains the same, and after deducting the estimated underwriting discounts and commissions and estimated offering expenses payable by us.
57
Table of Contents
The following table summarizes, as of March 31, 2015, the total number of shares of our common stock purchased from us, the total consideration paid to us, and the average price per share of our common stock paid by purchasers of such shares and by new investors purchasing shares of our common stock in this offering.
| Shares purchased | Total consideration | Average price per share |
||||||||||||||
| Number | Percent | Amount | Percent | |||||||||||||
| Existing stockholders |
$ | % | $ | |||||||||||||
| New investors |
$ | % | $ | |||||||||||||
|
|
||||||||||||||||
| Total |
$ | % | ||||||||||||||
|
|
||||||||||||||||
The number of shares of common stock to be outstanding after this offering is based on 784,251,980 shares of common stock outstanding as of March 31, 2015 and excludes the following:
| • | 74,370,679 shares reserved for future issuance in connection with the exercise of outstanding stock options at a weighted-average exercise price of $0.82 per share; |
| • | 344,531 shares reserved for issuance upon vesting of restricted stock units; |
| • | 184,060 shares of common stock reserved for future issuance under the 2012 EIP; and |
| • | shares of common stock reserved for future issuance under the 2015 EIP, which shall take effect prior to the consummation of this offering. |
58
Table of Contents
Selected historical consolidated financial data
The following table sets forth selected historical consolidated financial data for the periods ended and at the dates indicated below. Our selected historical consolidated financial data as of December 31, 2013 (Successor) and December 31, 2014 (Successor) and for the years ended December 31, 2013 (Successor) and December 31, 2014 (Successor) and for the periods from January 1, 2012 to September 28, 2012 (Predecessor) and from July 12, 2012 (inception) to December 31, 2012 (Successor) presented in this table has been derived from our historical audited consolidated financial statements included elsewhere in this prospectus. Our selected historical consolidated financial data for the years ended December 31, 2010 (Predecessor), December 31, 2011 (Predecessor) and December 31, 2012 (Successor) were derived from our audited consolidated balance sheets as of December 31, 2010 (Predecessor) and December 31, 2011 (Predecessor), our unaudited consolidated balance sheet as of December 31, 2012 (Successor), our audited consolidated statements of operations and consolidated statements of cash flows for the years ended December 31, 2010 (Predecessor) and December 31, 2011 (Predecessor) that are not included in this prospectus. Our selected historical condensed consolidated financial data for the periods and for the three months ended March 31, 2015 (Successor) and March 31, 2014 (Successor) presented in this table has been derived from our historical unaudited condensed consolidated financial statements included elsewhere in this prospectus.
On September 28, 2012, Sky Growth Acquisition Corporation, our wholly owned subsidiary, merged with and into Par Pharmaceutical Companies, which resulted in a change in basis of our assets and liabilities. Periods following our inception are referred to as the “Successor” periods. As a result of the Merger and the resulting change in basis of our assets and liabilities, the Predecessor and Successor period financial data is not comparable. Refer to “Prospectus summary—Recent performance” for more information.
The historical results presented below are not necessarily indicative of the results to be expected for any future period. The following information should be read in conjunction with the sections entitled “Management’s discussion and analysis of financial condition and results of operations” and our financial statements and the notes thereto contained elsewhere in this prospectus.
59
Table of Contents
| For the period | ||||||||||||||||||||||||||||||||||
| Three months ended March 31, |
Fiscal year ended December 31, |
July 12
to December 31, 2012 |
January 1
to September 28 2012 |
Fiscal year ended December 31, |
||||||||||||||||||||||||||||||
| 2015 | 2014 | 2014 | 2013 | 2011 | 2010 | |||||||||||||||||||||||||||||
| (Successor) | (Successor) | (Successor) | (Successor) | (Successor) | (Predecessor) | (Predecessor) | (Predecessor) | |||||||||||||||||||||||||||
| ($ in thousands, except per share amounts) | ||||||||||||||||||||||||||||||||||
| Net product sales |
$ | 353,119 | $ | 282,833 | $ | 1,278,106 | $ | 1,062,453 | $ | 237,338 | $ | 780,797 | $ | 887,495 | $ | 980,631 | ||||||||||||||||||
| Other product related revenues |
6,125 | 6,251 | 30,515 | 35,014 | 8,801 | 23,071 | 38,643 | 28,243 | ||||||||||||||||||||||||||
|
|
|
|
|
|
|
|
|
|
|
|
|
|
|
|
|
|||||||||||||||||||
| Total Revenues |
359,244 | 289,084 | 1,308,621 | 1,097,467 | 246,139 | 803,868 | 926,138 | 1,008,874 | ||||||||||||||||||||||||||
| Cost of goods sold, excluding amortization expense |
165,379 | 150,668 | 643,851 | 595,166 | 157,893 | 431,174 | 526,288 | 620,904 | ||||||||||||||||||||||||||
| Amortization expense |
48,792 | 44,102 | 185,655 | 184,258 | 42,801 | 30,344 | 13,106 | 14,439 | ||||||||||||||||||||||||||
|
|
|
|
|
|
|
|
|
|
|
|
|
|
|
|
|
|||||||||||||||||||
| Total cost of goods sold |
214,171 | 194,770 | 829,506 | 779,424 | 200,694 | 461,518 | 539,394 | 635,343 | ||||||||||||||||||||||||||
|
|
|
|
|
|
|
|
|
|
|
|
|
|
|
|
|
|||||||||||||||||||
| Gross margin |
145,073 | 94,314 | 479,115 | 318,043 | 45,445 | 342,350 | 386,744 | 373,531 | ||||||||||||||||||||||||||
| Research and development |
26,850 | 34,624 | 119,095 | 100,763 | 19,383 | 66,606 | 46,538 | 50,369 | ||||||||||||||||||||||||||
| Selling, general and administrative |
56,386 | 50,941 | 181,136 | 155,164 | 73,760 | 165,604 | 173,378 | 192,504 | ||||||||||||||||||||||||||
| Intangible asset impairment |
— | 41,758 | 146,934 | 100,093 | — | 5,700 | — | — | ||||||||||||||||||||||||||
| Settlements and loss contingencies, net |
(25 | ) | — | 90,107 | 25,650 | 10,059 | 45,000 | 190,560 | 3,762 | |||||||||||||||||||||||||
| Restructuring costs |
363 | 1,146 | 5,413 | 1,816 | 241 | — | 26,986 | — | ||||||||||||||||||||||||||
|
|
|
|
|
|
|
|
|
|
|
|
|
|
|
|
|
|||||||||||||||||||
| Total operating expenses |
83,574 | 128,469 | 542,685 | 383,486 | 103,443 | 282,910 | 437,462 | 246,635 | ||||||||||||||||||||||||||
| (Loss) gain on sale of product rights and other |
— | — | (3,042 | ) | — | — | — | 125 | 6,025 | |||||||||||||||||||||||||
|
|
|
|
|
|
|
|
|
|
|
|
|
|
|
|
|
|||||||||||||||||||
| Operating income (loss) |
61,499 | (34,155 | ) | (66,612 | ) | (65,443 | ) | (57,998 | ) | 59,440 | (50,593 | ) | 132,921 | |||||||||||||||||||||
| Gain on bargain purchase |
— | — | — | — | 5,500 | — | — | — | ||||||||||||||||||||||||||
| Loss on debt extinguishment |
— | — | (3,989 | ) | (7,335 | ) | — | — | — | — | ||||||||||||||||||||||||
| Gain on marketable securities and other investments, net |
— | — | — | 1,122 | — | — | 237 | 3,459 | ||||||||||||||||||||||||||
| Interest income |
17 | 14 | 18 | 87 | 50 | 424 | 736 | 1,257 | ||||||||||||||||||||||||||
| Interest expense |
(29,511 | ) | (25,467 | ) | (108,427 | ) | (95,484 | ) | (25,985 | ) | (9,159 | ) | (2,676 | ) | (2,905 | ) | ||||||||||||||||||
| Other income |
— | — | 500 | — | — | — | — | — | ||||||||||||||||||||||||||
|
|
|
|
|
|
|
|
|
|
|
|
|
|
|
|
|
|||||||||||||||||||
| Income (loss) from continuing operations before tax |
32,005 | (63,597 | ) | (178,510 | ) | (167,053 | ) | (78,433 | ) | 50,705 | (52,296 | ) | 134,732 | |||||||||||||||||||||
| Provision (benefit) for income taxes |
11,720 | (24,232 | ) | (72,993 | ) | (61,182 | ) | (23,727 | ) | 29,530 | (5,996 | ) | 41,980 | |||||||||||||||||||||
|
|
|
|
|
|
|
|
|
|
|
|
|
|
|
|
|
|||||||||||||||||||
| Income (loss) from continuing operations after tax |
20,285 | (39,365 | ) | (105,517 | ) | (105,871 | ) | (54,706 | ) | 21,175 | (46,300 | ) | 92,752 | |||||||||||||||||||||
|
|
|
|
|
|
|
|
|
|
|
|
|
|
|
|
|
|||||||||||||||||||
| Discontinued operations: |
||||||||||||||||||||||||||||||||||
| Provision (benefit) for income taxes |
— | — | — | — | — | — | (20,155 | ) | 21 | |||||||||||||||||||||||||
|
|
|
|
|
|
|
|
|
|
|
|
|
|
|
|
|
|||||||||||||||||||
| Income (loss) from discontinued operations |
— | — | — | — | — | — | 20,155 | (21 | ) | |||||||||||||||||||||||||
|
|
|
|
|
|
|
|
|
|
|
|
|
|
|
|
|
|||||||||||||||||||
| Net income (loss) |
$ | 20,285 | $ | (39,365 | ) | $ | (105,517 | ) | $ | (105,871 | ) | $ | (54,706 | ) | $ | 21,175 | $ | (26,145 | ) | $ | 92,731 | |||||||||||||
|
|
|
|
|
|
|
|
|
|
|
|
|
|
|
|
|
|||||||||||||||||||
| Basic income (loss) per common share |
$ |
0.03 |
|
$ |
(0.05 |
) |
$ | (0.14 | ) | $ | (0.15 | ) | $ | (0.08 | ) | $ | 0.58 | $ | (0.73 | ) | $ | 2.70 | ||||||||||||
| Diluted income (loss) per common share |
$ |
0.02 |
|
$ |
(0.05 |
) |
$ | (0.14 | ) | $ | (0.15 | ) | $ | (0.08 | ) | $ | 0.57 | $ | (0.73 | ) | $ | 2.60 | ||||||||||||
| Weighted average common shares outstanding: |
||||||||||||||||||||||||||||||||||
| Basic |
784,048 | 737,839 | 772,728 | 704,009 | 698,047 | 36,449 | 35,950 | 34,307 | ||||||||||||||||||||||||||
| Diluted |
814,578 | 737,839 | 772,728 | 704,009 | 698,047 | 37,231 | 35,950 | 35,644 | ||||||||||||||||||||||||||
| Other Financial Data |
||||||||||||||||||||||||||||||||||
| Cash provided by (used in) |
||||||||||||||||||||||||||||||||||
| Operating activities |
$ | 100,207 | $ | 89,139 | $ | 145,245 | $ | 113,045 | $ | (54,745 | ) | $ | 153,760 | $ | 64,978 | $ | 164,309 | |||||||||||||||||
| Investing activities |
(51,285 | ) | (490,859 | ) | (519,575 | ) | (12,198 | ) | (2,026,531 | ) | (46,602 | ) | (457,856 | ) | (42,034 | ) | ||||||||||||||||||
| Financing activities |
(107,482 | ) | 492,200 | 488,690 | (9,631 | ) | 1,841,261 | 9,205 | 336,720 | (25,269 | ) | |||||||||||||||||||||||
| Capital expenditures |
(8,492 | ) | (13,212 | ) | (45,460 | ) | (17,465 | ) | (10,306 | ) | (11,454 | ) | (11,600 | ) | (10,685 | ) | ||||||||||||||||||
| Purchase of intangibles |
— | — | (153 | ) | (1,000 | ) | — | (15,000 | ) | (34,450 | ) | (42,000 | ) | |||||||||||||||||||||
| Adjusted EBITDA(1) |
131,523 | 77,182 | 433,804 | 306,872 | 63,519 | 239,853 | 248,511 | 226,501 | ||||||||||||||||||||||||||
| Adjusted gross margin(2) |
194,595 | 141,506 | 674,729 | 510,117 | 110,013 | 387,788 | 405,985 | 389,377 | ||||||||||||||||||||||||||
60
Table of Contents
| For the period | ||||||||||||||||||||||||||||||||
| Three months ended March 31, |
Fiscal year ended December 31, |
July 12
to December 31, 2012 |
January 1
to September 28 2012 |
Fiscal year ended December 31, |
||||||||||||||||||||||||||||
| 2015 | 2014 | 2014 | 2013 | 2011 | 2010 | |||||||||||||||||||||||||||
| (Successor) | (Successor) | (Successor) | (Successor) | (Successor) | (Predecessor) | (Predecessor) | (Predecessor) | |||||||||||||||||||||||||
| ($ in thousands) | ||||||||||||||||||||||||||||||||
| Unaudited pro forma Data (3): |
||||||||||||||||||||||||||||||||
| Basic loss per common share |
$ | $ | ||||||||||||||||||||||||||||||
|
|
|
|
|
|||||||||||||||||||||||||||||
| Diluted loss per common share |
$ | $ | ||||||||||||||||||||||||||||||
|
|
|
|
|
|||||||||||||||||||||||||||||
| Weighted average common shares outstanding: |
||||||||||||||||||||||||||||||||
| Basic |
||||||||||||||||||||||||||||||||
|
|
|
|
|
|||||||||||||||||||||||||||||
| Diluted |
||||||||||||||||||||||||||||||||
|
|
|
|
|
|||||||||||||||||||||||||||||
| Balance Sheet Data (at end of period) |
||||||||||||||||||||||||||||||||
| Cash and cash equivalents and marketable securities |
$ | 185,880 | $ | 220,560 | $ | 244,440 | $ | 130,080 | $ | 38,864 | $ | 162,516 | $ | 218,674 | ||||||||||||||||||
| Total assets |
2,875,935 | 3,174,813 | 3,007,134 | 2,637,569 | 2,846,687 | 1,231,453 | 783,232 | |||||||||||||||||||||||||
| Total long-term debt, including current maturities (gross) |
2,346,148 | 1,931,678 | 1,925,837 | 1,545,340 | 1,542,363 | 345,625 | — | |||||||||||||||||||||||||
| Stockholders’ equity |
71,462 | 623,032 | 566,080 | 553,436 | 651,169 | 609,581 | 628,444 | |||||||||||||||||||||||||
|
|
|
|
||||||||||||||||||||||||||||||
| (1) | “Adjusted EBITDA” is a financial measure that is not defined under GAAP. We present adjusted EBITDA because we consider it an important supplemental measure of our performance and our ability to service our indebtedness and we believe that it provides greater transparency into our results of operations and is frequently used by investors in the evaluation of companies in the industry. In addition, our management believes that adjusted EBITDA is a useful financial metric to assess our operating performance from period to period by excluding certain material unusual items and certain other adjustments we believe are not reflective of our ongoing operations and our performance. Adjusted EBITDA represents net (loss) income before interest expense, net, provision (benefit) for income taxes, depreciation and amortization, intangible asset impairment, restructuring costs, settlements and loss contingencies, net transaction related costs including severance, upfront and development milestones, stock-based compensation expense and certain other non-recurring, non-cash and other cash expenses. Adjusted EBITDA does not represent and should not be considered as an alternative to net income or cash flow from operations, as determined by GAAP, and our calculations thereof may not be comparable to that reported by other companies. Adjusted EBITDA has limitations as an analytical tool and you should not consider it in isolation, or as a substitute for analysis of our results as reported under GAAP. For example, adjusted EBITDA: |
| • | does not reflect our capital expenditures or future requirements for capital expenditures or contractual commitments; |
| • | does not reflect expenditures related to current business development and product acquisition activities, including payments due under existing agreements related to products in various stages of development or contingent payments tied to the achievement of sales milestones; |
| • | does not reflect changes in, or cash requirements for, our working capital needs; |
| • | does not reflect significant interest expense or the cash requirements necessary to service interest or principal payments on our debt; |
| • | excludes income tax payments that represent a reduction in cash available to us; |
| • | does not reflect any cash requirements for assets being depreciated and amortized that may have to be replaced in the future; |
| • | does not reflect the impact of earnings or charges resulting from matters we consider not be indicative of our ongoing operations; and |
| • | may be calculated differently by other companies in our industry, thereby limiting the usefulness as a comparative measure. |
Because of these limitations, adjusted EBITDA should not be considered as a measure of discretionary cash available to us to invest in the growth of our business or as measures of cash that will be available to us to meet our obligations. We compensate for these limitations by using adjusted EBITDA along with other comparative tools, together with GAAP measurements, to assist in the evaluation of operating performance. These GAAP measurements include net (loss) income, cash flow from operating activities and other cash flow data. We have significant uses of cash flow from operating activities, including capital expenditures, interest payments, debt principal repayments, transaction related costs, including severance, upfront and development milestones, taxes and other non-recurring charges, which are not reflected in adjusted EBITDA. Adjusted EBITDA should not be considered in isolation or as an alternative to net (loss) income, cash flow generated by operating, investing, or financing activities or other financial statement data presented in the consolidated financial statements as an indicator of financial performance or liquidity. You should therefore not place undue reliance on adjusted EBITDA or ratios calculated using this measure. Our GAAP-based measures can be found in our consolidated financial statements and related notes included elsewhere in this prospectus.
61
Table of Contents
The table below reconciles net (loss) income to adjusted EBITDA for the periods presented. Adjusted EBITDA excludes the impact of discontinued operations for all periods.
| For the period | ||||||||||||||||||||||||||||||||||
| Three months ended March 31, |
Fiscal years ended December 31, |
July 12, 2012 to December 31, 2012 |
January
1, 2012 to September 28, 2012 |
Fiscal years ended December 31, |
||||||||||||||||||||||||||||||
| 2015 | 2014 | 2014 | 2013 | 2011 | 2010 | |||||||||||||||||||||||||||||
| (Successor) | (Successor) | (Successor) | (Successor) | (Successor) | (Predecessor) | (Predecessor) | (Predecessor) | |||||||||||||||||||||||||||
| (unaudited) | (unaudited) | (unaudited) | (unaudited) | (unaudited) | (unaudited) | (unaudited) | (unaudited) | |||||||||||||||||||||||||||
| ($ in thousands) | ||||||||||||||||||||||||||||||||||
| Statement of Operations Data: |
||||||||||||||||||||||||||||||||||
| Net (loss) income |
$ | 20,285 | $ | (39,365 | ) | $ | (105,517 | ) | $ | (105,871 | ) | $ | (54,706 | ) | $ | 21,175 | $ | (26,145 | ) | $ | 92,731 | |||||||||||||
| Interest expense, net |
29,494 | 25,453 | 108,409 | 95,397 | 25,935 | 8,735 | 1,940 | 1,648 | ||||||||||||||||||||||||||
| Provision (benefit) for income taxes |
11,720 | (24,232 | ) | (72,993 | ) | (61,182 | ) | (23,727 | ) | 29,530 | (5,996 | ) | 41,980 | |||||||||||||||||||||
| (Benefit) provision for income taxes related to discontinued operations |
— | — | — | — | — | — | (20,155 | ) | 21 | |||||||||||||||||||||||||
| Depreciation and amortization |
57,083 | 50,663 | 213,564 | 207,646 | 50,348 | 44,426 | 28,036 | 29,389 | ||||||||||||||||||||||||||
| Cost of goods on acquired inventory |
— | 2,986 | 9,031 | 6,557 | 21,543 | 4,048 | 5,152 | — | ||||||||||||||||||||||||||
|
|
|
|
|
|
|
|
|
|
|
|
|
|
|
|
|
|||||||||||||||||||
| EBITDA |
118,582 | 15,505 | 152,494 | 142,547 | 19,393 | 107,914 | (17,168 | ) | 165,769 | |||||||||||||||||||||||||
| Litigation settlements and contingencies(b) |
— | — | 90,107 | 25,650 | 10,059 | 45,000 | 190,560 | 861 | ||||||||||||||||||||||||||
| AWP, DOJ and Pentech litigation costs(c) |
901 | 1,676 | 4,269 | 9,131 | 3,110 | 7,757 | 18,988 | 23,086 | ||||||||||||||||||||||||||
| Restructuring costs(d) |
363 | 1,146 | 5,413 | 1,816 | 241 | — | 27,660 | — | ||||||||||||||||||||||||||
| Transaction related costs including severance(e) |
1,365 | 3,768 | 7,461 | 5,447 | 32,951 | 45,882 | 11,048 | — | ||||||||||||||||||||||||||
| Upfront and development milestones(f) |
— | — | — | — | 350 | 10,000 | — | 19,000 | ||||||||||||||||||||||||||
| Inventory write-downs related to patent litigation(g) |
— | — | — | — | — | 10,318 | — | — | ||||||||||||||||||||||||||
| Intangible asset impairment(h) |
— | 41,758 | 146,934 | 100,093 | — | 5,700 | — | — | ||||||||||||||||||||||||||
| Loss (gain) on sale of product rights and other(i) |
— | — | 3,042 | — | — | — | (125 | ) | (6,025 | ) | ||||||||||||||||||||||||
| Gain on sale of securities and other investments(j) |
— | — | — | (1,122 | ) | — | — | (237 | ) | (3,459 | ) | |||||||||||||||||||||||
| Cost associated with refinancing of senior term loan |
— | 7,136 | 7,136 | 1,411 | — | — | — | — | ||||||||||||||||||||||||||
| Loss on extinguishment of debt(k) |
— | 3,989 | 3,989 | 7,335 | — | — | — | — | ||||||||||||||||||||||||||
| Gain on bargain purchase(l) |
— | — | — | — | (5,500 | ) | — | — | — | |||||||||||||||||||||||||
| Stock based compensation expense(m) |
5,213 | 942 | 8,678 | 9,154 | 2,240 | 7,282 | 9,830 | 14,074 | ||||||||||||||||||||||||||
| Run-rate impact of Par Specialty restructuring(n) |
— | — | — | — | — | — | 7,955 | 13,195 | ||||||||||||||||||||||||||
| Management fee(o) |
1,000 | 935 | 4,000 | 3,611 | 675 | — | — | — | ||||||||||||||||||||||||||
| Special discretionary dividend equivalent bonus |
4,185 | — | — | — | — | — | — | — | ||||||||||||||||||||||||||
| Other(p) |
(86 | ) | 309 | 281 | 1,799 | — | — | — | — | |||||||||||||||||||||||||
|
|
|
|
|
|
|
|
|
|
|
|
|
|
|
|
|
|||||||||||||||||||
| Adjusted EBITDA |
$ | 131,523 | $ | 77,182 | $ | 433,804 | $ | 306,872 | $ | 63,519 | $ | 239,853 | $ | 248,511 | $ | 226,501 | ||||||||||||||||||
|
|
|
|
||||||||||||||||||||||||||||||||
| (a) | Represents the charge associated with the acquisitions for acquired inventory which was increased to its estimated selling price, less the cost of disposal and a reasonable profit allowance for the selling effort (the “inventory step-up”), as required under GAAP. The inventory step-up was recognized into earnings based on normal inventory turns and resulted in costs above standard post-acquisition costs. |
| (b) | For the fiscal year ended December 31, 2011, we recorded the settlement in principle of AWP litigation claims related to federal contributions to state Medicaid programs in 49 states (excluding Illinois), and the claims of Texas, Florida, Alaska, South Carolina and Kentucky relating to their Medicaid programs for $154.0 million, recorded a settlement with the State of Idaho for $1.7 million and recorded an accrual for the remaining AWP matters. During the period from January 1, 2012 to September 28, 2012 (Predecessor), we recorded an accrual of $45.0 million as management’s best estimate of a potential loss related to a potential global settlement with respect to an inquiry by the DOJ into Par Specialty’s promotional practices in the sales and marketing of Megace® ES. In the period from July 12, 2012 (inception) to December 31, 2012 (Successor), we recorded additional estimated amounts for accrued interest and legal expenses that we are liable for paying in the final settlement. We also accrued for a contingent liability of $9.0 million related to omeprazole/sodium bicarbonate patent litigation during this period. In 2013, we recorded an incremental provision of $25.7 million related to the settlement of AWP litigation claims (Illinois $19.8 million, Louisiana $3.3 million, Utah $1.7 million and Kansas $0.9 million). In 2014, we recorded an incremental provision of $91.0 million related to the settlement of omeprazole/sodium bicarbonate patent litigation for $100.0 million. During 2014, we also received an arbitration award of approximately $0.9 million from a former partner related to a discontinued project. |
| (c) | Consists of external legal costs incurred in conjunction with our defense of litigation with Pentech Pharmaceuticals, the actions brought by various states and the DOJ as it relates to the AWP litigation and the promotional practices of Par Specialty’s marketing of Megace® ES. |
| (d) | During the fiscal year ended December 31, 2011, we announced our plans to resize our Par Specialty division. We reduced our Par Specialty workforce by approximately 90 positions. In connection with these actions, we incurred cash expenses for severance and other |
62
Table of Contents
| employee-related costs of $1.6 million, non-cash expenses of $24.2 million related to the impairment of products no longer a priority for our remaining Par Specialty sales force, and non-cash expenses of $1.9 million related to inventory write-downs for samples and products associated with the products no longer a priority for our remaining Par Specialty sales force. In January 2013, we initiated a restructuring of Par Specialty, in anticipation of entering into a settlement agreement and CIA that terminated the DOJ’s ongoing investigation of Par Specialty’s marketing of Megace® ES. We reduced our Par Specialty workforce by approximately 70 people, with the majority of the reductions in the sales force. The remaining Par Specialty sales force has been reorganized into a single sales team of approximately 60 professionals that focus their marketing efforts principally on Nascobal® Nasal Spray. In connection with these actions, we incurred expenses for severance and other employee-related costs as well as the termination of certain contracts. In 2014, subsequent to the Par Sterile acquisition, we eliminated 25 redundant positions within Par Pharmaceutical and accrued severance and other employee-related costs for those employees affected by the workforce reduction. Additionally, due to a change in our product development strategy, we eliminated 36 redundant positions within our Irvine location and accrued severance and other employee-related costs for these employees affected by the workforce reduction. |
| (e) | Consists of transaction-related expenses incurred in connection with the acquisition of Anchen, Par Formulations and Par Sterile as well as transaction-related expenses incurred in connection with the Merger and related transactions. |
| (f) | Represents the initial payments made to acquire generic ANDAs and/or distribution rights from various other pharmaceutical manufacturers prior to the product achieving legal and/or regulatory approval. |
| (g) | Represents the write down of certain pre-launch and commercial inventory resulting from the loss of patent litigation including omeprazole/sodium bicarbonate and omega-3 acid ethyl esters oral capsules. |
| (h) | During the period from January 1, 2012 to September 28, 2012 (Predecessor), we abandoned an in-process research and development project and exited the market of a commercial product both of which were acquired in the Anchen acquisition and recorded a total corresponding intangible asset impairment of $5.7 million. During the year ended December 31, 2013, we recorded intangible asset impairments totaling approximately $100.1 million for IPR&D classes of products and projects that were evaluated as part of the annual evaluation of indefinite lived intangible assets, as well as five products not expected to achieve their originally forecasted operating results, and we ceased selling a product that had been acquired with the divested products from the merger of Watson and Actavis Group. During the year ended December 31, 2014 we recorded intangible asset impairments totaling approximately $146.9 million related to an adjustment to the forecasted operating results for two IPR&D intangible asset groups and eight Par Pharmaceutical segment products compared to their originally forecasted operating results at date of acquisition, inclusive of one discontinued product, one partially impaired product primarily due to the contract ending with the partner and a partially impaired IPR&D project from the Par Sterile acquisition due to an adverse court ruling pertaining to related patent litigation. The estimated fair values of the assets were determined by completing updated discounted cash flow models. |
| (i) | In fiscal year 2005, we entered into a joint development and collaboration agreement with Optimer Pharmaceuticals (“Optimer”) to commercialize Difimicin (PAR 101), and then in 2007 in exchange for $20.0 million we returned the marketing rights to Optimer. During the fiscal year ended December 31, 2010, Optimer announced positive results from the second of two pivotal Phase 3 trials evaluating the safety and efficacy of fidaxomicin in patients with clostridium difficile infection, triggering a one-time $5.0 million milestone payment due to us under a termination agreement entered into by the parties in fiscal year 2007. In addition, we recognized a gain on the sale of product rights of $1.0 million and $0.1 million during the fiscal years ended December 31, 2010 and December 31, 2011, respectively, and a loss on the sale of product rights of $3.0 million during the fiscal year ended December 31, 2014, related to the sale of multiple ANDAs. |
| (j) | During the fiscal year ended 2010, we received a settlement of $3.6 million related to an “earnout” payment associated with our former investment in Abrika Pharmaceuticals Inc. (“Abrika”). Abrika merged with Actavis Group in 2007. During the year ended December 31, 2013, we recorded a gain on sale of stock of a public pharmaceutical company of $1.1 million. In addition, we recognized miscellaneous non-operating gains and losses for certain periods presented. |
| (k) | In February 2013, we refinanced our term loan facility. In accordance with the applicable accounting guidance for debt modifications and extinguishments, approximately $5.9 million of the existing unamortized deferred financing costs and $1.4 million of the related $10.5 million soft call premium were written off in connection with this refinancing. In February 2014, in conjunction with our acquisition of Par Sterile, we amended certain senior facilities. In accordance with the applicable accounting guidance for debt modifications and extinguishments, approximately $4.0 million of the existing unamortized deferred financing costs were written off in connection with this repricing. |
| (l) | During the period from July 12, 2012 (inception) to December 31, 2012 (Successor), we acquired U.S. marketing rights to five generic products that were marketed by Watson or Actavis Group, as well as eight ANDAs awaiting regulatory approval at that time and a generic product in late-stage development, in connection with the merger of Watson and Actavis Group. The acquisition resulted in a bargain purchase under FASB ASC 805, Business Combinations. The purchase price of the acquisition was allocated to the assets acquired, with the excess of the fair value of assets acquired over the purchase price recorded as a gain. The gain was mainly attributed to the FTC mandated divestiture of products by Watson and Actavis Group in conjunction with the approval of the Watson and Actavis Group merger. |
| (m) | Represents the non-cash expense associated with stock-based compensation awards issued to various executive and non-executive employees. |
| (n) | During the fiscal year ended December 31, 2011, we resized our Par Specialty division and discontinued two products, Oravig® and Zuplenz ®, that are no longer a priority for our remaining Par Specialty sales force. The historical periods include certain selling, general and administrative costs, including employee compensation, sales commissions, research and development and promotion and marketing expenses that were previously dedicated to supporting these two brands and will not be part of continuing operations prospectively. This adjustment has the effect of excluding product sales and operating expenses related to Oravig® and Zuplenz® as well as historical royalty revenue related to our co-promotion of Solvay’s brand product Androgel ® , which terminated in December 2010. |
| (o) | In connection with the Merger and related transactions, we entered into a management services agreement with the Manager pursuant to such agreement, and in exchange for on-going consulting and management advisory services, the Manager receives an annual |
63
Table of Contents
| monitoring fee paid quarterly equal to 1% of EBITDA as defined under the credit agreement for the Senior Credit Facilities. There is an annual cap of $4.0 million for this fee. The Manager also receives reimbursement for out-of-pocket expenses incurred in connection with services provided pursuant to the agreement. We recorded an expense of $4.0 million and $3.6 million for consulting and management advisory service fees and out-of-pocket expenses in the years ended December 31, 2014 and December 31, 2013, respectively, and $0.7 million in the period from July 12, 2012 (inception) to December 31, 2012 (Successor). |
| (p) | Other includes costs associated with our CIA (2013 and 2014) and additional pharmaceutical manufacturer’s fee charges recorded under PPACA due to final IRS regulations issued in 2014. |
| (2) | We present adjusted gross margin because we believe it is a useful indicator of our operating performance and facilitates a meaningful comparison to our peers. In particular, we believe that adjusted gross margin is a useful indicator of our operating performance because adjusted gross margin measures our operating performance without regard to acquisition transaction-related amortization expenses. In addition, our management uses adjusted gross margin for planning purposes, including the preparation of our annual operating budget and assessment of performance. The table below reconciles gross margin to adjusted gross margin for the periods presented. “Adjusted gross margin” is a financial measure that is not defined under GAAP. Adjusted gross margin represents gross margin plus amortization expense, stock based compensation expense related to cost of goods, inventory write-downs related to patent litigation and cost of goods acquired on inventory step up. Adjusted gross margin does not represent and should not be considered as an alternative to gross margin, as determined by GAAP, and our calculations thereof may not be comparable to that reported by other companies. |
| For the Period | ||||||||||||||||||||||||||||||||||
| Three months ended March 31, |
Fiscal years ended December 31, |
July 12, 2012 to December 31, 2012 |
January
1, 2012 to September 28 2012 |
Fiscal years ended December 31, |
||||||||||||||||||||||||||||||
| 2015 | 2014 | 2014 | 2013 | 2011 | 2010 | |||||||||||||||||||||||||||||
| (Successor) | (Successor) | (Successor) | (Successor) | (Successor) | (Predecessor) | (Predecessor) | (Predecessor) | |||||||||||||||||||||||||||
| (unaudited) | (unaudited) | (unaudited) | (unaudited) | (unaudited) | (unaudited) | (unaudited) | (unaudited) | |||||||||||||||||||||||||||
| ($ in thousands) | ||||||||||||||||||||||||||||||||||
| Gross margin |
$ | 145,073 | $ | 94,315 | $ | 479,115 | $ | 318,043 | $ | 45,445 | $ | 342,350 | $ | 386,744 | $ | 373,531 | ||||||||||||||||||
| Amortization expense |
48,792 | 44,102 | 185,655 | 184,258 | 42,801 | 30,344 | 13,106 | 14,439 | ||||||||||||||||||||||||||
| Stock based compensation expense related to cost of goods |
253 | 89 | 858 | 902 | 224 | 728 | 983 | 1,407 | ||||||||||||||||||||||||||
| Inventory write-downs related to patent litigation(a) |
— | — | — | — | — | 10,318 | — | — | ||||||||||||||||||||||||||
| Cost of goods acquired on inventory step up(b) |
— | 2,986 | 9,031 | 6,557 | 21,543 | 4,048 | 5,152 | — | ||||||||||||||||||||||||||
| Special discretionary dividend equivalent bonus |
460 | — | ||||||||||||||||||||||||||||||||
| Other |
17 | 14 | 70 | 357 | — | — | — | — | ||||||||||||||||||||||||||
|
|
|
|
|
|
|
|
|
|
|
|
|
|
|
|
|
|||||||||||||||||||
| Adjusted gross margin |
$ | 194,595 | $ | 141,506 | $ | 674,729 | $ | 510,117 | $ | 110,013 | $ | 387,788 | $ | 405,985 | $ | 389,377 | ||||||||||||||||||
|
|
|
|
||||||||||||||||||||||||||||||||
| (a) | Represents the write down of certain pre-launch and commercial inventory resulting from the loss of patent litigation including omeprazole/sodium bicarbonate and omega-3 acid ethyl esters oral capsules. |
| (b) | Represents the charge associated with acquisitions for acquired inventory which was increased to its estimated selling price, less the cost of disposal and a reasonable profit allowance for the selling effort (the “inventory step-up”), as required under GAAP. The inventory step-up was recognized into earnings based on normal inventory turns and resulted in costs above standard post-acquisition costs. |
| (3) | Pro Forma Earnings Per Share: |
In February 2015, we amended our credit agreement governing the Senior Credit Facilities, which included new borrowings in an aggregate principal amount of $425.0 million that were used to fund the Dividend Recapitalization. For the purposes of the pro forma earnings per share of common stock calculations, we have assumed that the Dividend Recapitalization had occurred as of January 1, 2014. The basic and diluted pro forma per share of common stock calculations presented below give effect to the Dividend Recapitalization and the number of shares whose proceeds would be necessary to fund the Dividend Recapitalization in addition to historical EPS. The basic pro forma earnings per share of common stock is computed by dividing net loss available to common shareholders by the pro forma weighted average number of shares of common stock outstanding during the period. The diluted pro forma earnings per share of common stock calculation also assumes the conversion, exercise or issuance of all potential shares of common stock, unless the effect of inclusion would be anti-dilutive.
The following presents the computation of pro forma basic and diluted earnings per share:
| (In thousands, except per share data) | March 31, 2015 | December 31, 2014 | ||||||
| Numerator: |
||||||||
| Net income/(loss) as reported |
$ | $ | ||||||
| Net income/(loss) pro forma adjustments: |
||||||||
| Interest expense, net of tax |
||||||||
| Amortization of debt issuance costs and discount, net of tax |
||||||||
|
|
|
|||||||
| Pro forma net income/(loss) |
$ | $ | ||||||
|
|
|
|||||||
| Denominator: |
||||||||
| Weighted average common shares used in computing basic and diluted loss per common share outstanding |
||||||||
| Adjustment for common stock issued whose proceeds will be used to fund the Dividend Recapitalization |
||||||||
| Pro forma weighted average common shares used in computing basic income per common share outstanding |
||||||||
|
|
|
|||||||
| Pro forma basic income per common share |
$ | $ | ||||||
|
|
|
|||||||
| Pro forma weighted average common shares used in computing diluted income per common share outstanding |
||||||||
|
|
|
|||||||
| Pro forma diluted income per common share |
$ | $ | ||||||
|
|
||||||||
64
Table of Contents
Management’s discussion and analysis of financial condition and results of operations
You should read the following discussion and analysis of our financial condition and results of operations, together with our consolidated financial statements and the related notes and our condensed consolidated financial statements and the related notes, included elsewhere in this prospectus. This discussion and analysis includes forward-looking statements that involve risks and uncertainties. You should read the “Cautionary note regarding forward-looking statements” and “Risk factors” sections of this prospectus for a discussion of important factors that could cause actual results to differ materially from the results described in or implied by the forward-looking statements contained in the following discussion and analysis.
Company overview and principal products
We are a leading U.S. pharmaceutical company specializing in developing, licensing, manufacturing, marketing and distributing generic drugs. As of December 31, 2014, we have a generics portfolio of approximately 95 products across an extensive range of dosage forms and delivery systems, including immediate and extended release oral solids (tablets, orally disintegrating tablets, capsules and powders), injectables, nasal sprays, ophthalmics and transdermal patches. For the year ended December 31, 2014, immediate release oral solids, extended release oral solids, injectables and other alternative dosage forms accounted for approximately 40%, 39%, 12% and 9% of our consolidated net revenues, respectively. Our focus is on high-barrier-to-entry generic products that are difficult to formulate, difficult to manufacture or face complex legal and regulatory challenges. We operate in two business segments, Par Pharmaceutical, which includes generic products marketed under Par Pharmaceutical and sterile products marketed under Par Sterile, and Par Specialty, which markets two branded products, Nascobal® Nasal Spray and Megace® ES. Our top ten revenue products accounted for approximately 50% of total consolidated revenues in 2014 and a significant percentage of total consolidated gross margins for the year ended December 31, 2014.
Merger overview
On September 28, 2012, Par Pharmaceutical Companies and its subsidiaries were acquired by investment funds affiliated with TPG and certain co-investors through the Merger, resulting in Par Pharmaceutical Companies and its subsidiaries becoming our wholly-owned subsidiaries. The Merger had a significant impact on our financial condition and our results of operations are significantly different after September 28, 2012. Also, the application of acquisition method accounting as a result of the Merger required that our assets and liabilities be adjusted to their fair value, which resulted in an increase in our depreciation and amortization expense. The excess of the purchase price over the fair value of our net assets and identified intangible assets was allocated to goodwill.
Certain financial information for the year ended December 31, 2012 includes data from the “Predecessor” period, which covers the period preceding the Merger (January 1, 2012 to September 28, 2012) and data from the “Successor” period, which covers the period following the inception of the Company (July 12, 2012 to December 31, 2012). Certain amounts in this prospectus combine the results of the Predecessor and the Successor. Such combination was performed by mathematical addition and does not comply with GAAP, although we believe it provides a reasonable method of comparison for certain accounts. The data is being presented for analytical purposes only. Combined operating results (i) have not been prepared on a pro forma basis as if the Merger occurred on the first day of the period, (ii) may not reflect the actual results we would have achieved absent the Merger and (iii) may not be predictive of future results of operations. Refer to “Prospectus summary—Recent performance” for more information.
65
Table of Contents
How we assess the performance of our business
In assessing the performance of our company, we consider a variety of performance and financial measures. These key measures include revenue and gross margin. We also review other metrics such as adjusted EBITDA and adjusted gross margin. For a discussion of our use of these measures and a reconciliation of adjusted EBITDA to net (loss) income and adjusted gross margin to gross margin, refer to “Prospectus summary— Summary historical and pro forma condensed consolidated financial data” and “Selected historical consolidated financial data.”
Components of our results of operations
Sales and gross margins
Sales and gross margins of our products depend principally on:
| • | the extent of market penetration for our existing product line, the introduction of other products in direct competition with our products, and the pricing practices of our competitors; |
| • | our ability to successfully develop, procure regulatory approvals of, overcome legal challenges to, manufacture commercial quantities of, launch and commercialize our products; |
| • | our ability to select products for development that prove to be valuable in terms of market size, pricing dynamics and limited competition, such as first-to-file and first-to-market products; |
| • | our ability to obtain marketing exclusivity periods for our products, and the pace at which our competitors enter the market after any applicable exclusivity period ends or during our exclusivity period with authorized generic products or products with shared exclusivity, which may diminish the amount and duration of significant profits we are able to generate from any such product; |
| • | our ability to obtain quality raw materials for our products at competitive prices, including the APIs necessary to manufacture our products; |
| • | the willingness of our customers to switch among generic drugs of different pharmaceutical manufacturers; |
| • | the consolidation our customer base through mergers, acquisitions and the formation of buying groups; |
| • | customer satisfaction with the breadth of our product line and with the level and quality of our customer service; |
| • | the continuation of our existing license, supply and distribution agreements and our ability to enter into new agreements; and |
| • | the market acceptance of our current and future branded products and our ability to maintain patent protection of our branded products. |
Net sales and gross margins derived from generic pharmaceutical products often follow a pattern based on regulatory and competitive factors that we believe to be unique to the generic pharmaceutical industry. As the patent protection for a branded product expires or is successfully challenged in court and the related exclusivity period terminates, the first generic manufacturer to receive regulatory approval from the FDA for a generic version of the product is often able to capture a substantial share of the generic market. However, the brand company may launch an authorized generic, directly or through a third party, in competition with the generic manufacturer’s version. As additional generic manufacturers receive regulatory approvals for their own generic versions of the product, the market share and the price of the generic products typically decline, often significantly and rapidly, depending on several factors, including the number and pricing strategy of competitors.
66
Table of Contents
Net sales and gross margins derived from branded pharmaceutical products typically follow a different pattern. Sellers of branded products benefit from being the exclusive supplier to the market due to patent protections for the branded products. The benefits include significantly higher gross margins relative to sellers of generic pharmaceutical products. However, commercializing branded pharmaceutical products is more costly than generic pharmaceutical products. Sellers of branded pharmaceutical products often have increased infrastructure costs relative to sellers of generic pharmaceutical products and make significant investments in the development and/or licensing of these products without a guarantee that these expenditures will result in the successful development or launch of branded products that will prove to be commercially successful. Selling branded products also tends to require greater sales and marketing expenses to create a market for the products than is necessary with respect to the sale of generic products. The patents protecting a branded product’s sales are also subject to attack by generic competitors. Specifically, after patent protections expire, or after a successful challenge to the patents protecting one of our branded products, generic products can be sold in the market at a significantly lower price than the branded version, and, where available, may be required or encouraged in preference to the branded version under third party reimbursement programs, or substituted by pharmacies for branded versions by law.
In addition to the substantial costs and uncertainty of product development, we incur significant legal costs in bringing our generic products to market. Litigation concerning patents and proprietary rights is often protracted and expensive, and the outcome of such suits is inherently uncertain. Pharmaceutical companies with patented branded products usually sue companies that seek approval to produce generic forms of their products for alleged patent infringement or other violations of intellectual property rights, which subjects the generic companies to expensive, protracted litigation that delays and may prevent the entry of such generic products into the market. In the case of an ANDA filed with a Paragraph IV certification, the overwhelming majority are subject to litigation by the brand company, because bringing suit triggers a 30-month statutory delay of FDA approval of the ANDA. Because we focus on developing first-to-file, Paragraph IV products, we are subject to a significant number of protracted and costly patent litigations, which can result in a substantial delay in, or prevent, the approval and sale of our generic products, which could have a material adverse effect on our business, financial condition, prospects and results of operations.
Par Pharmaceutical
Par Pharmaceutical includes generic products marketed under Par Pharmaceutical and sterile products marketed under Par Sterile. The focus of Par Pharmaceutical is to develop, license, manufacture, market and distribute generic prescription drugs in an extensive range of dosage forms and delivery systems, including immediate release oral solids and alternate dosage forms such as extended release oral solids, injectables, topicals, nasal sprays, ophthalmics, films and transdermal patches. As the percentage of branded pharmaceuticals that are expected to lose patent protection increasingly shifts towards alternate dosage forms (dosage forms other than immediate release oral solid dose), we have made investments in our development capabilities and technologies which better position us to take advantage of this change. On February 20, 2014, we completed our acquisition of Par Sterile, which expanded our capability and presence into the rapidly growing sterile drug market, including injectable products and ophthalmics. Par Pharmaceutical’s products are primarily sold through wholesalers, retailers and mail order pharmacies. Par Sterile’s products are primarily sold through wholesalers, often via an arrangement with a group purchasing organization, prior to being dispensed at hospitals or directly administered by physicians. The segment contributed $1,214.1 million in net product revenue and $620.6 million of adjusted gross margin in 2014.
Par Specialty Pharmaceuticals
Par Specialty Pharmaceuticals is focused on the marketing and distribution of two branded prescription products, Nascobal® Nasal Spray, and Megace® ES. Nascobal® is a prescription vitamin B12 treatment indicated for maintenance of remission in certain pernicious anemia patients in a once-weekly intranasal administration,
67
Table of Contents
which may be preferable to periodic subcutaneous or intramuscular injections. Megace® ES is indicated for the treatment of anorexia, cachexia or any unexplained significant weight loss in patients with a diagnosis of AIDS. These products are marketed by our branded field sales force of approximately 60 people in the United States, which communicates the therapeutic and health benefits of our products to healthcare providers and managed care organizations. The segment contributed $64.0 million in net product revenue and $54.1 million of adjusted gross margin in 2014.
Expenses
In addition to the substantial costs and uncertainty of product development, we typically incur significant legal costs in bringing certain generic products to market. Litigation concerning patents and proprietary rights is often protracted and expensive. Pharmaceutical companies with patented branded products routinely sue companies that seek approval to produce generic forms of their products for alleged patent infringement or other violations of intellectual property rights, which delays and may prevent the entry of such generic products into the market. In the case of an ANDA filed with a Paragraph IV certification, the overwhelming majority are subject to litigation by the brand company, because bringing suit triggers a 30-month statutory delay of FDA approval of the ANDA. Because the majority of our current business involves the development, approval and sale of generic versions of branded products, many with a Paragraph IV certification, the threat of litigation, the outcome of which is inherently uncertain, is always present. Such litigation is often costly and time-consuming, and could result in a substantial delay in, or prevent, the introduction and/or marketing of our generic products, which could have a material adverse effect on our business, financial condition, prospects and results of operations
Recent developments
On February 20, 2015, Par Pharmaceutical Companies entered into an amendment (“Amendment No. 5”) to its Senior Credit Facilities which was effective as of February 25, 2015 and increased the maximum first lien senior secured net leverage ratio levels included in the financial maintenance covenant, which covenant only applies to the extent there are borrowings under the Revolving Credit Facility (as defined below) (excluding undrawn letters of credit to the extent cash collateralized) outstanding.
On February 25, 2015, Par Pharmaceutical Companies entered into an amendment (“Amendment No. 6”) to its Senior Credit Facilities which authorized the funding of a new tranche of term loans (the “Incremental B-3 Term Loans”) in an aggregate principal amount of $425.0 million, the proceeds of which were used to pay the Dividend Recapitalization and related fees and expenses. The terms of the Incremental B-3 Term Loans are substantially the same as the terms of the Tranche B-2 Term Loans (as defined below), except that (1) the interest rate margins applicable to the Incremental B-3 Term Loans are 3.25% for LIBOR and 2.25% for base rate, a 25 basis point increase compared to the Tranche B-2 Term Loans and (2) the Incremental B-3 Term Loans are subject to a soft call provision applicable to the optional prepayment of the loans which requires a premium equal to 1.00% of the aggregate principal amount of the loans being prepaid if, on or prior to August 25, 2015, Par Pharmaceutical Companies enters into certain repricing transactions. Additionally, all voluntary and mandatory prepayments of outstanding term loans must be made pro rata among the Incremental B-3 Term Loans and the Tranche B-2 Term Loans.
In February 2015, our board of directors declared a cash dividend of $0.6303 per share (or approximately $494.3 million in the aggregate) to stockholders of record as of February 25, 2015.
On February 20, 2014, we completed our acquisition of Par Sterile, a privately-held, specialty sterile products pharmaceutical company. The consideration for the acquisition consisted of $487.0 million in cash, after
68
Table of Contents
finalization of certain customary working capital adjustments. We financed the acquisition with proceeds received in connection with the debt financing provided by third party lenders of $395.0 million and an equity contribution of $110 million from certain investment funds associated with the Sponsor. Among the primary reasons we acquired Par Sterile and the factors that contributed to the preliminary recognition of goodwill were that the acquisition immediately expanded our presence into the rapidly growing market for injectables and other sterile products, such as ophthalmics. The result is a broader and more diversified product portfolio, and an expanded development pipeline. With its high-barrier-to-entry products, Par Sterile represents a complement to our strategy and product line.
Results of operations
Three months ended March 31, 2015 and three months ended March 31, 2014
Results of operations, including segment net revenues, segment gross margin and segment operating loss information for our Par Pharmaceutical, our generic and sterile products division, and Par Specialty, our branded products division are detailed below.
Revenues
Total revenues of our top selling products were as follows:
| Three months ended | ||||||||||||
| ($ in thousands) | March 31, 2015 |
March 31, 2014 |
$ Change | |||||||||
| Product |
||||||||||||
| Par Pharmaceutical |
||||||||||||
| Budesonide (Entocort®) |
$ | 28,878 | $ | 37,349 | $ | (8,471 | ) | |||||
|
Vasostrict® |
26,823 | — | 26,823 | |||||||||
| Omega-3 acid ethyl esters (Lovaza®) |
23,434 | — | 23,434 | |||||||||
| Bupropion ER (Wellbutrin®) |
21,562 | 16,342 | 5,220 | |||||||||
| Amlodipine/Valsartan (Exforge®) |
18,762 | — | 18,762 | |||||||||
| Propafenone (Rythmol SR®) |
12,171 | 21,112 | (8,941 | ) | ||||||||
|
Aplisol® |
11,500 | 4,070 | 7,430 | |||||||||
| Metoprolol succinate ER (Toprol-XL®) |
11,022 | 14,117 | (3,095 | ) | ||||||||
| Divalproex (Depakote®) |
8,462 | 20,405 | (11,943 | ) | ||||||||
| Other |
179,038 | 154,972 | 24,066 | |||||||||
| Other product related revenues |
4,977 | 5,439 | (462 | ) | ||||||||
|
|
|
|||||||||||
| Total Par Pharmaceutical Revenues |
$ | 346,629 | $ | 273,806 | $ | 72,823 | ||||||
| Par Specialty |
||||||||||||
| Megace® ES |
$ | 4,986 | $ | 8,153 | $ | (3,167 | ) | |||||
| Nascobal® Nasal Spray |
6,504 | 6,325 | 179 | |||||||||
| Other and other product related revenues |
1,125 | 800 | 325 | |||||||||
|
|
|
|||||||||||
| Total Par Specialty Revenues |
$ | 12,615 | $ | 15,278 | $ | (2,663 | ) | |||||
|
|
||||||||||||
69
Table of Contents
| Three months ended | ||||||||||||||||||||||||
| Percentage of total revenues | ||||||||||||||||||||||||
| ($ in thousands) | March 31, 2015 |
March 31, 2014 |
$ Change | % Change | March 31, 2015 |
March 31, 2014 |
||||||||||||||||||
| Revenues: |
||||||||||||||||||||||||
| Par Pharmaceutical |
$ | 346,629 | $ | 273,806 | $ | 72,823 | 26.6% | 96.5% | 94.7% | |||||||||||||||
| Par Specialty |
12,615 | 15,278 | (2,663 | ) | (17.4% | ) | 3.5% | 5.3% | ||||||||||||||||
|
|
|
|||||||||||||||||||||||
| Total revenues |
$ | 359,244 | $ | 289,084 | $ | 70,160 | 24.3% | 100.0% | 100.0% | |||||||||||||||
|
|
||||||||||||||||||||||||
Par Pharmaceutical
The increase in generic segment revenues for the three months ended March 31, 2015, as compared to the prior year period was primarily due to the following:
| • | The launch of Vasostrict® in November 2014, which is the first and only vasopressin injection with an NDA approved by the FDA. As of March 31, 2015, we are the only supplier of Vasostrict® to the market; |
| • | the launch of omega-3 acid ethyl esters in July 2014; |
| • | the launch of amlodipine/valsartan in September 2014; |
| • | the full quarter impact of Aplisol, which was acquired with Par Sterile in February 2014; and |
| • | the increase in “Other”, primarily driven by the full quarter impact of a portfolio of products, excluding Aplisol®, as a result of the acquisition of Par Sterile in February 2014, the launch of entecavir in September 2014 and continued growth of travoprost. |
The increases noted above for the three months ended March 31, 2015 were tempered by:
| • | divalproex, principally due to price decline related to ongoing competition in the market; |
| • | propafenone, mainly related to both volume and price declines following additional competition in the fourth quarter 2014; and |
| • | budesonide, principally due to lower volume resulting from on-going competition in the market and anticipated new competitors in the near future. |
Net product sales of contract-manufactured products (which are manufactured for us by third parties under contract) comprised approximately 51% for the three months ended March 31, 2015 and approximately 68% of our total product revenues for the three months ended March 31, 2014. This is primarily driven by the launches/acquisitions of products like budesonide, metoprolol succinate ER, clonidine ER, lamotrigine, divalproex, and entecavir. We are substantially dependent upon contract-manufactured and licensed products for our overall sales, and any inability by our suppliers to meet demand could adversely affect our future sales.
Par Specialty
The decrease in the Par Specialty segment revenues for the three months ended March 31, 2015, as compared to the comparable periods in 2014 was primarily due to net sales declines of Megace® ES primarily as a result of decreased volume. These decreases were tempered by revenue growth for Nascobal® primarily due to increased volume.
70
Table of Contents
Gross revenues to total revenues
Generic drug pricing at the wholesale level can create significant differences between our invoice price and net selling price. Wholesale customers purchase product from us at invoice price, then resell the product to specific healthcare providers on the basis of prices negotiated between us and the providers. The difference between the wholesalers’ purchase price and the typically lower healthcare providers’ purchase price is refunded to the wholesalers through a chargeback credit. We record estimates for these chargebacks as well as sales returns, rebates and incentive programs, and the sales allowances for all our customers at the time of sale as deductions from gross revenues, with corresponding adjustments to our accounts receivable reserves and allowances.
We have the experience and the access to relevant information that we believe necessary to reasonably estimate the amounts of such deductions from gross revenues. Some of the assumptions we use for certain of our estimates are based on information received from third parties, such as wholesale customer inventory data and market data, or other market factors beyond our control. The estimates that are most critical to the establishment of these reserves, and therefore would have the largest impact if these estimates were not accurate, are estimates related to expected contract sales volumes, average contract pricing, customer inventories and return levels. We regularly review the information related to these estimates and adjust our reserves accordingly if and when actual experience differs from previous estimates. With the exception of the product returns allowance, the ending balances of account receivable reserves and allowances generally are eliminated during a two-month to four-month period, on average.
We recognize revenue for product sales when title and risk of loss have transferred to our customers and when collectability is reasonably assured. This is generally at the time that products are received by the customers. Upon recognizing revenue from a sale, we record estimates for chargebacks, rebates and incentives, returns, cash discounts and other sales reserves that reduce accounts receivable.
Our gross revenues for the three month periods ended March 31, 2015 and 2014 before deductions for chargebacks, rebates and incentive programs (including rebates paid under federal and state government Medicaid drug reimbursement programs), sales returns and other sales allowances were as follows:
| Three months ended | ||||||||||||||||
| ($ in thousands) | March 31, 2015 |
Percentage of gross revenues |
March 31, 2014 |
Percentage of gross revenues |
||||||||||||
| Gross revenues |
$ | 809,590 | $ | 650,261 | ||||||||||||
| Chargebacks |
(205,642 | ) | 25.4% | (189,919 | ) | 29.2% | ||||||||||
| Rebates and incentive programs |
(143,651 | ) | 17.7% | (92,684 | ) | 14.3% | ||||||||||
| Returns |
(21,949 | ) | 2.7% | (7,112 | ) | 1.1% | ||||||||||
| Cash discounts and other |
(66,577 | ) | 8.2% | (57,141 | ) | 8.8% | ||||||||||
| Medicaid rebates and rebates due under other U.S. Government pricing programs |
(12,527 | ) | 1.5% | (14,321 | ) | 2.2% | ||||||||||
|
|
|
|||||||||||||||
| Total deductions |
(450,346 | ) | 55.6% | (361,177 | ) | 55.5% | ||||||||||
|
|
|
|||||||||||||||
| Total revenues |
$ | 359,244 | 44.4% | $ | 289,084 | 44.5% | ||||||||||
|
|
||||||||||||||||
The total gross-to-net adjustments as a percentage of gross revenues increased for the three months ended March 31, 2015 compared to the three months ended March 31, 2014 primarily due to:
| • | Chargebacks: the increase was primarily driven by higher sales of products with lower discount rates, including entecavir, omega-3 acid ethyl esters, Vasostrict®, and amlodipine/valsartan, as well as the favorable impact of bupropion price increases in third quarter 2014 (price protection as result of price increase effective in June 2014). |
71
Table of Contents
| • | Rebates and incentive programs: the increase was primarily driven by divalproex, bupropion and lamotrigine, coupled with the impact of recent launches of products with higher rates, including entecavir and omega-3 acid ethyl esters. |
| • | Returns: the increase in rate was primarily driven by additional reserves for inventory in the wholesale channel due to competition, principally related to bupropion, resulting in the loss of a major customer. |
| • | Cash discounts and other: the decrease in rate was primarily driven by price adjustments for bupropion as a result of lost business which was partially offset by impact of shelf stock adjustments on amlodipine/valsartan in March 2015 due to competition. Additionally, the Company received lower than expected claims related to price adjustments accrued during the period September 2014 through December 2014. |
| • | Medicaid rebates and rebates due under other U.S. Government pricing programs: decrease as a percentage of gross revenues primarily due to decrease in sales of products subject to certain U.S. government and state pricing programs (e.g., TriCare, Managed Care and Medicare Part B), including Megace® ES, budesonide and modafinil, coupled with lower than expected utilization of oxycodone and Megace® ES. |
The following tables summarize the activity for the three months ended March 31, 2015 and March 31, 2014 in the accounts affected by the estimated provisions described above ($ in thousands):
| Three months ended March 31, 2015 | ||||||||||||||||||||
| Accounts receivable reserves | Beginning balance |
Provision period sales |
(Provision) reversal recorded for prior period sales |
Credits processed |
Ending balance |
|||||||||||||||
| Chargebacks |
$ | (96,492 | ) | $ | (205,642 | ) | $ | — | (1) | $ | 208,603 | $ | (93,531 | ) | ||||||
| Rebates and incentive programs |
(138,989 | ) | (143,651 | ) | — | 153,096 | (129,544 | ) | ||||||||||||
| Returns |
(84,330 | ) | (21,949 | ) | — | 8,081 | (98,198 | ) | ||||||||||||
| Cash discounts and other |
(86,797 | ) | (70,389 | ) | 3,812 | (3) | 82,039 | (71,335 | ) | |||||||||||
|
|
|
|||||||||||||||||||
| Total |
$ | (406,608 | ) | $ | (441,631 | ) | $ | 3,812 | $ | 451,819 | $ | (392,608 | ) | |||||||
|
|
|
|||||||||||||||||||
| Accrued liabilities(2) |
$ | (42,647 | ) | $ | (12,527 | ) | $ | — | $ | 31,232 | $ | (23,942 | ) | |||||||
|
|
||||||||||||||||||||
| Three months ended March 31, 2014 | ||||||||||||||||||||||||
| Accounts receivable reserves | Beginning balance |
Par Sterile beginning balance |
Provision period sales |
(Provision) reversal recorded for prior period sales |
Credits processed |
Ending balance |
||||||||||||||||||
| Chargebacks |
$ | (48,766 | ) | $ | (5,886 | ) | $ | (189,919 | ) | $ | — | (1) | $ | 186,461 | $ | (58,110 | ) | |||||||
| Rebates and incentive programs |
(75,321 | ) | (5,489 | ) | (92,684 | ) | — | 89,541 | (83,953 | ) | ||||||||||||||
| Returns |
(78,181 | ) | (4,398 | ) | (7,112 | ) | — | 5,101 | (84,590 | ) | ||||||||||||||
| Cash discounts and other |
(37,793 | ) | (1,792 | ) | (55,741 | ) | (1,399 | )(4) | 52,239 | (44,486 | ) | |||||||||||||
|
|
|
|||||||||||||||||||||||
| Total |
$ | (240,061 | ) | $ | (17,565 | ) | $ | (345,456 | ) | $ | (1,399 | ) | $ | 333,342 | $ | (271,139 | ) | |||||||
|
|
|
|||||||||||||||||||||||
| Accrued liabilities(2) |
$ | (35,829 | ) | $ | (382 | ) | $ | (16,076 | ) | $ | 1,755 | (5) | $ | 20,020 | $ | (30,512 | ) | |||||||
|
|
||||||||||||||||||||||||
| (1) | Unless specific in nature, the amount of provision or reversal of reserves related to prior periods for chargebacks is not determinable on a product or customer specific basis. Based upon historical analysis and analysis of activity in subsequent periods, we believe that our chargeback estimates remain reasonable. |
| (2) | Includes amounts due to indirect customers for which no underlying accounts receivable exists and is principally comprised of Medicaid rebates and rebates due under other U.S. Government pricing programs, such as TriCare and the Department of Veterans Affairs. |
72
Table of Contents
| (3) | The Company received lower than expected claims related to price adjustments accrued during the period September 2014 through December 2014. As a result, during the first quarter of 2015, the Company recorded a benefit of approximately $3.8 million. |
| (4) | During the three months ended March 31, 2014, the Company recorded additional reserves totaling approximately $1.4 million related to prior year claims from customers for various price decreases for the years 2009 through 2012. |
| (5) | During the three months ended March 31, 2014, we received further additional information related to Managed Medicaid utilization in California and performed a recalculation of average manufacturer’s price. As a result we reduced our Medicaid accruals by approximately $2.4 million related to the periods March 2010 through December 2013. This activity was partially offset by the expense of $0.7 million related to disputed TriCare claims for the period from January 2009 through December 2013. |
Use of estimates in reserves
We believe that our reserves, allowances and accruals for items that are deducted from gross revenues are reasonable and appropriate based on current facts and circumstances. It is possible, however, that other parties applying reasonable judgment to the same facts and circumstances could develop different allowance and accrual amounts for items that are deducted from gross revenues. Additionally, changes in actual experience or changes in other qualitative factors could cause our allowances and accruals to fluctuate, particularly with newly launched or acquired products. We review the rates and amounts in our allowance and accrual estimates on a quarterly basis. If future estimated rates and amounts are significantly greater than those reflected in our recorded reserves, the resulting adjustments to those reserves would decrease our reported net revenues; conversely, if actual product returns, rebates and chargebacks are significantly less than those reflected in our recorded reserves, the resulting adjustments to those reserves would increase our reported net revenues. If we were to change our assumptions and estimates, our reserves would change, which would impact the net revenues that we report. We regularly review the information related to these estimates and adjust our reserves accordingly, if and when actual experience differs from previous estimates.
Gross margin
| Three months ended | ||||||||||||||||||||
| Percentage of total revenues | ||||||||||||||||||||
| ($ in thousands) | March 31, 2015 |
March 31, 2014 |
$ Change | March 31, 2015 |
March 31, 2014 |
|||||||||||||||
| Gross margin: |
||||||||||||||||||||
| Par Pharmaceutical |
$ | 136,719 | $ | 83,644 | $ | 53,075 | 39.4% | 30.5% | ||||||||||||
| Par Specialty |
8,354 | 10,670 | (2,316 | ) | 66.2% | 69.8% | ||||||||||||||
|
|
|
|||||||||||||||||||
| Total gross margin |
$ | 145,073 | $ | 94,314 | $ | 50,759 | 40.4% | 32.6% | ||||||||||||
|
|
||||||||||||||||||||
The increase in Par Pharmaceutical gross margin dollars for the three months ended March 31, 2015 as compared to the prior year period was primarily due to gross margin dollars from launches of amlodipin/valsartan and omega-3-acid ethyl esters oral capsules in the third quarter of 2014 and Vasostrict® in the fourth quarter of 2014, coupled with the full quarter impact of all other Par Sterile products, which were acquired in February 2014. These increases were tempered by the revenue and associated gross margin dollar decline of propafenone and divalproex.
Par Specialty gross margin dollars decreased for the three months ended March 31, 2015 as compared to the prior year period, primarily due to the revenue decline of Megace® ES.
73
Table of Contents
Research and development
| Three months ended | ||||||||||||||||||||||||
| Percentage of total revenues | ||||||||||||||||||||||||
| ($ in thousands) | March 31, 2015 |
March 31, 2014 |
$ Change | % Change | March 31, 2015 |
March 31, 2014 |
||||||||||||||||||
| Research and development: |
||||||||||||||||||||||||
| Par Pharmaceutical |
$ | 26,653 | $ | 34,346 | $ | (7,693 | ) | (22.4)% | 7.7% | 12.5% | ||||||||||||||
| Par Specialty |
197 | 278 | (81 | ) | (29.1)% | 1.6% | 1.8% | |||||||||||||||||
|
|
|
|||||||||||||||||||||||
| Total research and development |
$ | 26,850 | $ | 34,624 | $ | (7,774 | ) | (22.5)% | 7.5% | 12.0% | ||||||||||||||
|
|
||||||||||||||||||||||||
Par Pharmaceutical:
The decrease in Par Pharmaceutical research and development expense for the three months ended March 31, 2015 was driven by:
| • | $11.1 million decrease in outside development costs primarily driven by payments related to a 2014 injectable product development agreement, combined with lower payments for existing development agreements; tempered by |
| • | $3.4 million of higher employment related and other costs due to Par Sterile acquisition and two recent acquisitions. |
Par specialty:
Par Specialty research and development principally reflects FDA filing fees for the three months ended March 31, 2015 and March 31, 2014.
Selling, general and administrative expenses
| Three months ended | ||||||||||||||||||||||||
| Percentage of total revenues | ||||||||||||||||||||||||
| ($ in thousands) | March 31, 2015 |
March 31, 2014 |
$ Change | % Change | March 31, 2015 |
March 31, 2014 |
||||||||||||||||||
| Selling, general and administrative: |
||||||||||||||||||||||||
| Par Pharmaceutical |
$ | 42,811 | $ | 38,005 | $ | 4,806 | 12.6% | 12.4% | 13.9% | |||||||||||||||
| Par Specialty |
13,575 | 12,936 | 639 | 4.9% | 107.6% | 84.7% | ||||||||||||||||||
|
|
|
|||||||||||||||||||||||
| Total selling, general and administrative |
$ | 56,386 | $ | 50,941 | $ | 5,445 | 10.7% | 15.7% | 17.6% | |||||||||||||||
|
|
||||||||||||||||||||||||
The net increase in selling, general and administrative expenditures for the three months ended March 31, 2015 principally reflects:
| • | $9.5 million of higher employment related costs due to Par Sterile acquisition, special discretionary dividend-equivalent bonuses paid to employees granted awards under long-term cash incentive award agreements and acceleration of option expense combined with stock option grants; |
| • | $2.6 million of higher legal expenses primarily due to increased ANDA-related activities; |
| • | $0.6 million increase in Par Specialty selling and marketing costs; tempered by |
74
Table of Contents
| • | $6.6 million of expense related to additional borrowings and repricing of our term loan facility plus associated transaction fees of $0.5 million in 2014. |
Intangible assets impairment
| Three months ended | ||||||||
| ($ in thousands) | March 31, 2015 |
March 31, 2014 |
||||||
| Intangible asset impairment |
$ | — | $ | 41,758 | ||||
|
|
||||||||
During the three months ended March 31, 2014, we recorded intangible asset impairments totaling $41.8 million for two products not expected to achieve their originally forecasted operating results.
Settlements and loss contingencies, net
| Three months ended | ||||||||
| ($ in thousands) | March 31, 2015 |
March 31, 2014 |
||||||
| Settlements and Loss Contingencies, net |
$ | (25 | ) | $ | — | |||
|
|
||||||||
During the three months ended March 31, 2015, we received a settlement payment from the Adrenalin litigation.
Restructuring costs
| Three months ended | ||||||||
| ($ in thousands) | March 31, 2015 |
March 31, 2014 |
||||||
| Restructuring costs |
$ | 363 | $ | 1,146 | ||||
|
|
||||||||
Restructuring initiated in the first quarter of 2014
Subsequent to the Par Sterile acquisition, we eliminated approximately 25 redundant positions within Par Pharmaceutical and accrued severance and other employee-related costs for those employees affected by the workforce reduction.
| ($ amounts in thousands) Restructuring activities | Initial charge |
Additional charge |
Cash payments |
Liabilities at March 31, 2015 |
||||||||||||
| Severance and employee benefits to be paid in cash |
$ | 1,146 | $ | 3,527 | $ | (3,610 | ) | $ | 1,063 | |||||||
|
|
|
|||||||||||||||
| Total restructuring costs line item |
$ | 1,146 | $ | 3,527 | $ | (3,610 | ) | $ | 1,063 | |||||||
|
|
||||||||||||||||
75
Table of Contents
Restructuring initiated in the fourth quarter of 2014
Due to the change in our product development strategy, we eliminated approximately 36 redundant positions within our Irvine location and accrued severance and other employee-related costs for these employees affected by the workforce reduction. During the three months ended March 31, 2015, we incurred approximately $0.4 million of additional net charges representing employees earning severance through their termination dates net of employees that were subsequently retained with their severance accruals reversed.
| ($ amounts in thousands) Restructuring activities |
Initial charge |
Additional charge |
Cash payments |
Reversals, reclass or transfers |
Liabilities at March 31, 2015 |
|||||||||||||||
| Severance and employee benefits to be paid in cash |
$ | 740 | $ | 523 | $ | (266 | ) | $ | (160 | ) | $ | 837 | ||||||||
|
|
|
|||||||||||||||||||
| Total restructuring costs line item |
$ | 740 | $ | 523 | $ | (266 | ) | $ | (160 | ) | $ | 837 | ||||||||
|
|
||||||||||||||||||||
Operating income (loss)
| Three months ended | ||||||||||||
| ($ in thousands) | March 31, 2015 |
March 31, 2014 |
$ Change | |||||||||
| Operating income (loss): |
||||||||||||
| Par Pharmaceutical |
$ | 66,990 | $ | (23,260 | ) | $ | 90,250 | |||||
| Par Specialty |
(5,491 | ) | (10,895 | ) | 5,404 | |||||||
|
|
|
|||||||||||
| Total operating income (loss) |
$ | 61,499 | $ | (34,155 | ) | $ | 95,654 | |||||
|
|
||||||||||||
For the three months ended March 31, 2015, the increase in our operating income as compared to prior year was primarily due to increased gross margin dollars for key products and new product launches subsequent to the first quarter of 2014, first quarter 2014 intangible asset impairments, and additional research and development expense payments related to an injectable product development agreement. The increase was tempered by additional selling, general and administrative expenditures related to the Par Sterile acquisition, Par Biosciences acquisition, Innoteq acquisition, and special discretionary dividend-equivalent bonuses totaling approximately $4.2 million paid to employees who were granted awards under long-term cash incentive award agreements.
Interest income
| Three months ended | ||||||||
| ($ in thousands) | March 31, 2015 |
March 31, 2014 |
||||||
| Interest income |
$ | 17 | $ | 14 | ||||
|
|
||||||||
Interest income principally includes interest income derived from money market and other short-term investments.
Interest expense
| Three months ended | ||||||||
| ($ in thousands) | March 31, 2015 |
March 31, 2014 |
||||||
| Interest expense |
$ | (29,511 | ) | $ | (25,467 | ) | ||
|
|
||||||||
76
Table of Contents
Interest expense for the three month periods ended March 31, 2015 and March 31, 2014 was principally comprised of interest related to the Notes and the Senior Credit Facilities. See “Financing” below for further details on the Senior Credit Facilities and the Notes.
Loss on debt extinguishment
| Three months ended | ||||||||
| ($ in thousands) | March 31, 2015 |
March 31, 2014 |
||||||
| Loss on debt extinguishment |
$ | — | $ | (3,989 | ) | |||
|
|
||||||||
During the three months ended March 31, 2014 and in conjunction with the Par Sterile acquisition, we entered into the Incremental Term B-2 Joinder Agreement (the “Joinder”) among us, and certain of our subsidiaries, and our lenders. Under the terms of the Joinder, we borrowed an additional $395.0 million of new tranche term loans from the lenders participating therein for the purpose of consummating our acquisition of Par Sterile. We also repriced our term loan facility at the same time lowering our effective borrowing rate by 25 basis points. Based on these actions and the decision of certain lenders not to remain a party to our term loan facility, we recorded a loss on debt extinguishment of approximately $4.0 million that represents a proportionate share of deferred financing costs that were written off.
Income taxes
| Three months ended | ||||||||
| ($ in thousands) | March 31, 2015 |
March 31, 2014 |
||||||
| Provision (benefit) for income taxes |
$ | 11,720 | $ | (24,232 | ) | |||
| Effective tax rate |
37% | 38% | ||||||
|
|
||||||||
The income tax benefit was based on the applicable federal and state tax rates for those periods (see notes to condensed consolidated financial statements—Note 13—“Income Taxes” included elsewhere in this prospectus).
The effective tax rate for the three months ended March 31, 2015 and 2014 reflects benefits for deductions specific to U.S. domestic manufacturing companies, offset by our nondeductible portion of the annual pharmaceutical manufacturers’ fee under the Patient Protection and Affordable Care Act.
Year ended December 31, 2014, year ended December 31, 2013, period from January 1, 2012 to September 28, 2012, and period from July 12, 2012 to December 31, 2012
Results of operations, including segment net revenues, segment gross margin and segment operating (loss) income information for Par Pharmaceutical, our generic and sterile products division, and Par Specialty, our branded products division are detailed below. Additionally, we have prepared discussion and analysis of the combination of the periods (a) January 1, 2012 to September 28, 2012 (Predecessor),and (b) July 12, 2012 (inception) to December 31, 2012 (Successor), on a combined basis (labeled “Total”) for purposes of comparison with 2014 and 2013. We believe this approach provides the most reasonable method of comparison to the other periods presented in this prospectus. Refer to “Prospectus summary—Recent performance” for more information.
77
Table of Contents
Revenues (2014 compared to 2013)
Total revenues of our top selling products were as follows ($ in thousands):
| For the year ended | ||||||||||||
| December 31, 2014 |
December 31, 2013 |
$ Change | ||||||||||
| (Successor) | (Successor) | |||||||||||
| Product |
||||||||||||
| Par Pharmaceutical |
||||||||||||
| Budesonide (Entocort® EC) |
$ | 142,853 | $ | 198,834 | $ | (55,981 | ) | |||||
| Bupropion ER (Wellbutrin®) |
84,467 | 45,403 | 39,064 | |||||||||
| Propafenone (Rythmol SR®) |
75,966 | 70,508 | 5,458 | |||||||||
| Amlodipine/Valsartan (Exforge®) |
60,784 | — | 60,784 | |||||||||
| Divalproex (Depakote®) |
59,052 | 46,635 | 12,417 | |||||||||
| Metoprolol succinate ER (Toprol-XL®) |
46,251 | 56,670 | (10,419 | ) | ||||||||
| Clonidine ER (Kapvay®) |
45,134 | 13,008 | 32,126 | |||||||||
| Lamotrigine (Lamictal XR®) |
40,673 | 54,577 | (13,904 | ) | ||||||||
|
Aplisol® |
35,228 | — | 35,228 | |||||||||
| Modafinil (Provigil®) |
2,123 | 27,688 | (25,565 | ) | ||||||||
| Chlorpheniramine/Hydrocodone (Tussionex®) |
26,899 | 33,518 | (6,619 | ) | ||||||||
| Other |
594,751 | 450,148 | 144,603 | |||||||||
| Other product related revenues |
26,950 | 31,429 | (4,479 | ) | ||||||||
|
|
|
|||||||||||
| Total Par Pharmaceutical Revenues |
$ | 1,241,131 | $ | 1,028,418 | $ | 212,713 | ||||||
| Par Specialty |
||||||||||||
| Nascobal® Nasal Spray |
$ | 32,332 | $ | 26,864 | $ | 5,468 | ||||||
| Megace® ES |
31,653 | 39,510 | (7,857 | ) | ||||||||
| Other and other product related revenues |
3,505 | 2,675 | 830 | |||||||||
|
|
|
|||||||||||
| Total Par Specialty Revenues |
$ | 67,490 | $ | 69,049 | $ | (1,559 | ) | |||||
|
|
||||||||||||
| For the years ended December 31, | ||||||||||||||||||||||||
| 2014 | 2013 | Percentage of total revenues | ||||||||||||||||||||||
| ($ in thousands) | (Successor) | (Successor) | $ Change | % Change | 2014 | 2013 | ||||||||||||||||||
| Revenues: |
||||||||||||||||||||||||
| Par Pharmaceutical |
$ | 1,241,131 | $ | 1,028,418 | $ | 212,713 | 20.7% | 94.8% | 93.7% | |||||||||||||||
| Par Specialty |
67,490 | 69,049 | (1,559 | ) | (2.3)% | 5.2% | 6.3% | |||||||||||||||||
|
|
|
|||||||||||||||||||||||
| Total revenues |
$ | 1,308,621 | $ | 1,097,467 | $ | 211,154 | 19.2% | 100.0% | 100.0% | |||||||||||||||
|
|
||||||||||||||||||||||||
Par Pharmaceutical
The increase in generic segment revenues in the year ended December 31, 2014 was primarily due to the launches of several products in 2014, coupled with products that benefited from competitor supply issues, including the following:
| • | The launch of amlodipine/valsartan in September 2014; |
| • | increase in bupropion ER, which benefited from competitors that were not able to supply product to the market; |
| • | the acquisition of Aplisol®, which was acquired with Par Sterile in February 2014; |
| • | the launch of clonidine HCl ER in the fourth quarter of 2013; |
78
Table of Contents
| • | divalproex, which benefited from a competitor exiting the market in June 2013 as the result of FDA compliance issues and the non-recurrence of a large contractual gross-to-net price adjustment to a major customer that occurred in the prior year; and |
| • | the net increase in “Other”, which is mainly driven by Par Sterile products, which were acquired in the February 20, 2014 Par Sterile acquisition; the launch of omega-3-acid ethyl esters oral capsules in July 2014; the September 2014 launch of entecavir; and oxycodone, which we sold beginning in September 2014 pursuant to a settlement agreement under which we receive a limited quantity of supply to sell once annually over a four year period ending in 2017. |
The increases noted above in 2014 were tempered by:
| • | revenue decline for modafinil as the result of competition, which had a negative impact on both price and volume; |
| • | revenue decline for budesonide principally due to price decline resulting from competition; |
| • | revenue decline for rizatriptan, as a result of several competitors entering the market in July 2013 after we launched in January 2013 as the authorized generic; and |
| • | revenue decline for lamotrigine, which experienced a higher level of competition in 2014 as compared to 2013 when it launched. |
Net product sales of contract-manufactured products (which are manufactured for us by third parties under contract) and licensed products (which are licensed to us from third-party development partners and also are generally manufactured by third parties) comprised 57% and 64% of our total net product revenues for 2014 and for 2013, respectively. The significance of the percentage of our net product revenues is primarily driven by the launches/acquisitions of products like entecavir, budesonide, divalproex, metoprolol succinate ER, clonidine HCI ER, and digoxin. We are substantially dependent upon contract-manufactured and licensed products for our overall sales, and any inability by our suppliers to meet demand could adversely affect our future sales.
Par Specialty
The decrease in the Par Specialty segment revenues in the year ended December 31, 2014 as compared to the same period of 2013 was primarily due to a net product sales decline of Megace® ES primarily as a result of decreased volume. These decreases were tempered by revenue growth of Nascobal® primarily due to increased volume.
79
Table of Contents
Revenues (2013 compared to 2012)
Total net revenues of our top selling products were as follows ($ in thousands):
| For the year ended |
For the period | For the
year ended |
||||||||||||||||||||
| December 31, 2013 |
July 12, 2012 to December 31, 2012 |
|
January 1, 2012 to September 28, 2012 |
(non-GAAP) | ||||||||||||||||||
| December 31, 2012 |
$ Change | |||||||||||||||||||||
| (Successor) | (Successor) | (Predecessor) | (Total) | |||||||||||||||||||
| Product |
||||||||||||||||||||||
| Par Pharmaceutical |
||||||||||||||||||||||
| Budesonide (Entocort® EC) |
$ | 198,834 | $ | 36,710 | $ | 103,762 | $ | 140,472 | $ | 58,362 | ||||||||||||
| Propafenone (Rythmol SR®) |
70,508 | 19,623 | 53,825 | 73,448 | (2,940 | ) | ||||||||||||||||
| Metoprolol succinate ER (Toprol-XL®) |
56,670 | 31,287 | 154,216 | 185,503 | (128,833 | ) | ||||||||||||||||
| Lamotrigine (Lamictal XR®) |
54,577 | — | — | — | 54,577 | |||||||||||||||||
| Divalproex (Depakote®) |
46,635 | 2,436 | 9,099 | 11,535 | 35,100 | |||||||||||||||||
| Rizatriptan (Maxalt®) |
45,598 | — | — | — | 45,598 | |||||||||||||||||
| Bupropion ER (Wellbutrin®) |
45,403 | 11,255 | 34,952 | 46,207 | (804 | ) | ||||||||||||||||
| Chlorpheniramine/Hydrocodone (Tussionex®) |
33,518 | 17,403 | 30,706 | 48,109 | (14,591 | ) | ||||||||||||||||
| Modafinil (Provigil®) |
27,688 | 16,956 | 88,831 | 105,787 | (78,099 | ) | ||||||||||||||||
| Diltiazem (Cardizem® CD) |
27,212 | 3,702 | — | 3,702 | 23,510 | |||||||||||||||||
| Other |
390,346 | 79,789 | 249,383 | 329,172 | 61,174 | |||||||||||||||||
| Other product related revenues |
31,429 | 8,151 | 18,586 | 26,737 | 4,692 | |||||||||||||||||
|
|
|
|
|
|
|
|
|
|
|
|||||||||||||
| Total Par Pharmaceutical Revenues |
$ | 1,028,418 | $ | 227,312 | $ | 743,360 | $ | 970,672 | $ | 57,746 | ||||||||||||
| Par Specialty |
||||||||||||||||||||||
| Megace® ES |
39,510 | 10,910 | 38,322 | 49,232 | (9,722 | ) | ||||||||||||||||
| Nascobal® Nasal Spray |
26,864 | 7,138 | 17,571 | 24,709 | 2,155 | |||||||||||||||||
| Other |
(910 | ) | 130 | 130 | 260 | (1,170 | ) | |||||||||||||||
| Other product related revenues |
3,585 | 649 | 4,485 | 5,134 | (1,549 | ) | ||||||||||||||||
|
|
|
|
|
|
|
|
|
|
|
|||||||||||||
| Total Par Specialty Revenues |
$ | 69,049 | $ | 18,827 | $ | 60,508 | $ | 79,335 | $ | (10,286 | ) | |||||||||||
|
|
||||||||||||||||||||||
| For the years ended December 31, | ||||||||||||||||||||||||
| 2013 | 2012 |
|
Percentage of total revenues | |||||||||||||||||||||
| ($ in thousands) | (Successor) | (Total) (non-GAAP) |
$ Change | % Change | 2013 | 2012 (non-GAAP) |
||||||||||||||||||
| Revenues: |
||||||||||||||||||||||||
| Par Pharmaceutical |
$ | 1,028,418 | $ | 970,672 | $ | 57,746 | 5.9% | 93.7% | 92.4% | |||||||||||||||
| Par Specialty |
69,049 | 79,335 | (10,286 | ) | (13.0)% | 6.3% | 7.6% | |||||||||||||||||
|
|
|
|||||||||||||||||||||||
| Total revenues |
$ | 1,097,467 | $ | 1,050,007 | $ | 47,460 | 4.5% | 100.0% | 100.0% | |||||||||||||||
|
|
||||||||||||||||||||||||
80
Table of Contents
| For the period | For the year ended |
|||||||||||||
| July 12, 2012 to December 31, 2012 |
January 1, 2012 to September 28, 2012 |
December 31, 2012 |
||||||||||||
| ($ in thousands) | (Successor) | (Predecessor) | Total (non-GAAP) | |||||||||||
| Revenues: |
||||||||||||||
| Par Pharmaceutical |
$ | 227,312 | $ | 743,360 | $ | 970,672 | ||||||||
| Par Specialty |
18,827 | 60,508 | 79,335 | |||||||||||
| Total revenues |
$ | 246,139 | $ | 803,868 | $ | 1,050,007 | ||||||||
|
|
||||||||||||||
Par Pharmaceutical
The increase in generic segment revenues in the year ended December 31, 2013 was primarily due to the products that benefited from competitor supply issues coupled with launches of several products in 2013, including:
| • | the increase in budesonide revenues, which benefited from a competitor’s supply issues; |
| • | the launch of lamotrigine in January 2013 coupled with a competitor exiting the market in the second quarter of 2013 due to FDA compliance issues; |
| • | the launch of rizatriptan in January 2013; |
| • | the increase in divalproex revenues, which benefited from a competitor exiting the market in June 2013 as the result of FDA compliance issues; |
| • | a full year of revenues from products acquired from the merger of Watson and Actavis Group in November 2012, primarily diltiazem, fentanyl patch (included in “Other”), and morphine (included in “Other”); and |
| • | the net increase in “Other” is mainly driven by the launches of fluvoxamine maleate ER in first quarter of 2013, fenofibric acid in the third quarter of 2013, and the fourth quarter launches of clonidine HCl ER and dexmethylphenidate. |
The increases noted above in 2013 were tempered by:
| • | the decrease in sale volume for modafinil, which launched in April 2012 and experienced high sale volume upon launch and subsequently experienced significant competition at the end of its exclusivity period, which had a negative impact on both price and volume; and |
| • | on-going competition on all SKUs (packaging sizes) of metoprolol succinate ER, which had a negative impact on both price and volume. |
Net product sales of contract-manufactured products (which are manufactured for us by third parties under contract) and licensed products (which are licensed to us from third-party development partners and also are generally manufactured by third parties) comprised 64% and 65% of our total net product revenues for 2013 and for 2012, respectively. The significance of the percentage of our net product revenues is primarily driven by the launches of products like rizatriptan, modafinil, budesonide and metoprolol succinate ER. We are substantially dependent upon contract-manufactured and licensed products for our overall sales, and any inability by our suppliers to meet demand could adversely affect our future sales.
81
Table of Contents
Par Specialty
The decrease in the Par Specialty segment revenues in the year ended December 31, 2013 as compared to the same period of 2012 was primarily due to a net product sales decline of Megace® ES primarily as a result of decreased volume and a decrease in royalties earned from milestone payments pertaining to an agreement with Optimer Pharmaceuticals related to fidaxomicin. The decreases were partially offset by the continued growth of Nascobal® due to better pricing.
Gross revenues to total revenues
Generic drug pricing at the wholesale level can create significant differences between our invoice price and net selling price. Wholesale customers purchase product from us at invoice price, then resell the product to specific healthcare providers on the basis of prices negotiated between us and the providers. The difference between the wholesalers’ purchase price and the typically lower healthcare providers’ purchase price is refunded to the wholesalers through a chargeback credit. We record estimates for these chargebacks as well as sales returns, rebates and incentive programs, and the sales allowances for all our customers at the time of sale as deductions from gross revenues, with corresponding adjustments to our accounts receivable reserves and allowances.
We have the experience and the access to relevant information that we believe necessary to reasonably estimate the amounts of such deductions from gross revenues. Some of the assumptions we use for certain of our estimates are based on information received from third parties, such as wholesale customer inventory data and market data, or other market factors beyond our control. The estimates that are most critical to the establishment of these reserves, and therefore would have the largest impact if these estimates were not accurate, are estimates related to expected contract sales volumes, average contract pricing, customer inventories and return levels. We regularly review the information related to these estimates and adjust our reserves accordingly if and when actual experience differs from previous estimates. With the exception of the product returns allowance, the ending balances of account receivable reserves and allowances generally are eliminated during a two-month to four-month period, on average.
We recognize revenue for product sales when title and risk of loss have transferred to our customers and when collectability is reasonably assured. This is generally at the time that products are received by the customers. Upon recognizing revenue from a sale, we record estimates for chargebacks, rebates and incentives, returns, cash discounts and other sales reserves that reduce accounts receivable.
82
Table of Contents
Our gross revenues for the year ended December 31, 2014 (Successor), the year ended December 31, 2013 (Successor), and the periods from July 12, 2012 (inception) to December 31, 2012 (Successor) and January 1, 2012 to September 28, 2012 (Predecessor), with the percentage of gross revenues on a combined basis (labeled “Total”) for purposes of comparison with 2014 and 2013, before deductions for chargebacks, rebates and incentive programs (including rebates paid under federal and state government Medicaid drug reimbursement programs), sales returns and other sales allowances were as follows:
| For the year ended | For the year ended | For the period | ||||||||||||||||||||||||||||
| December 31, 2014 |
Percentage of gross revenues |
December 31, 2013 |
Percentage of gross revenues |
July 12, 2012 to December 31, 2012 |
January 1, 2012 to September 28, 2012 |
Percentage of gross revenues |
||||||||||||||||||||||||
| ($ thousands) | (Successor) | (Successor) | (Successor) | (Predecessor) | (Total) (non-GAAP) |
|||||||||||||||||||||||||
| Gross revenues |
$ | 3,064,079 | $ | 2,327,023 | $ | 527,734 | $ | 1,436,704 | ||||||||||||||||||||||
| Chargebacks |
(868,511 | ) | 28.3% | (630,097 | ) | 27.1% | (132,834 | ) | (309,411 | ) | 22.5% | |||||||||||||||||||
| Rebates and incentive programs |
(480,949 | ) | 15.7% | (290,275 | ) | 12.5% | (69,749 | ) | (147,171 | ) | 11.0% | |||||||||||||||||||
| Returns |
(31,361 | ) | 1.0% | (37,956 | ) | 1.6% | (8,522 | ) | (23,191 | ) | 1.6% | |||||||||||||||||||
| Cash discounts and other |
(292,602 | ) | 9.5% | (194,068 | ) | 8.3% | (46,053 | ) | (103,527 | ) | 7.6% | |||||||||||||||||||
| Medicaid rebates and rebates due under other US Government pricing programs |
(82,035 | ) | 2.7% | (77,160 | ) | 3.3% | (24,437 | ) | (49,536 | ) | 3.8% | |||||||||||||||||||
|
|
|
|
|
|||||||||||||||||||||||||||
| Total deductions |
1,755,458 | 57.3% | (1,229,556 | ) | 52.8% | (281,595 | ) | (632,836 | ) | 46.5% | ||||||||||||||||||||
|
|
|
|
|
|||||||||||||||||||||||||||
| Total revenues |
$ | 1,308,621 | 42.7% | $ | 1,097,467 | 47.2% | $ | 246,139 | $ | 803,868 | 53.5% | |||||||||||||||||||
|
|
||||||||||||||||||||||||||||||
Gross revenues to total revenues (2014 compared to 2013)
The total gross-to-net deductions as a percentage of gross revenues increased for the year ended December 31, 2014 compared to the year ended December 31, 2013 primarily due to:
| • | Chargebacks: the increase was primarily driven by customer mix as a result of the shift in business from non-wholesalers to wholesalers in addition to a decrease in price for modafinil (higher volume and rate), tempered by impact of higher sales of products with lower discount rates, including amlodipine/valsartan and entecavir and favorable impact of divalproex and bupropion ER price increases. |
| • | Rebates and incentive programs: the increase was primarily driven by higher divalproex (volume and rate), bupropion ER (volume and rate), lamotrigine (rate) and budesonide (rate), coupled with the impact of various wholesaler and retailer alliances. |
| • | Returns: the decrease in the rate was primarily driven by the non-recurrence of an increase to the rizatriptan returns reserve in the prior year following additional competition, coupled with lower than expected returns for other products, primarily dronabinol, fluvoxamine and Megace® ES. |
| • | Cash discounts and other: the increase in rate was primarily due to customer mix, including the impact of various wholesaler and retailer alliances coupled with pricing adjustments for products that had competitive |
83
Table of Contents
| changes in their respective markets, primarily bupropion (price protection as result of price increase effective in June 2014), lamotrigine, metoprolol, and amlodipine/valsartan, partially offset by the impact of prior year price protection related to a divalproex and cholestyramine price increase. |
| • | Medicaid rebates and rebates due under other U.S. Government pricing programs: the decrease as a percentage of gross revenues was primarily due to a reduction in the Medicaid accrual based upon additional available information related to Managed Medicaid utilization in California, coupled with lower amounts due under certain U.S. Government and state pricing programs (e.g., TriCare and Medicaid) due to lower utilization of our subject drugs (e.g., modafinil, Megace® ES, Nascobal®, and rizatriptan). |
Gross revenues to total revenues (2013 compared to 2012)
The total gross-to-net deductions as a percentage of gross revenues increased for the year ended December 31, 2013 compared to the year ended December 31, 2012 (Total) primarily due to:
| • | Chargebacks: the increase was primarily driven by the impact of higher sales of products with higher discount rates, including buproprion ER and diltiazem coupled with higher chargeback rates for modafinil and other products due to competitive factors in each of the related markets and a higher percentage of our sales were to wholesalers in 2013 which resulted in more chargebacks, tempered by the favorable impact of the divalproex discount rate in 2013. |
| • | Rebates and incentive programs: the increase was primarily driven by higher rebatable sales, primarily divalproex and modafinil, partially offset by lower sales of metoprolol succinate ER. |
| • | Returns: the rate was flat with 2012. |
| • | Cash discounts and other: the increase in cash discounts and other was driven by price adjustments as a result of customer mix, including the higher percentage of our sales to wholesalers in 2013. |
| • | Medicaid rebates and rebates due under other U.S. Government pricing programs: decrease was primarily due to lower Medicaid from the non-recurrence of accruals for certain fees and managed care rebates due to lower sales of Megace® ES, tempered by higher expense related to Medicare Part-D “donut hole” rebates (a 50% discount on cost for certain Medicare Part D beneficiaries for certain drugs (e.g., budesonide and modafinil) purchased during the Part D Medicare coverage gap) in the 2013 as compared to the prior year. |
Gross-to-net deductions are discussed in the “Critical Accounting Policies and Use of Estimates” section below.
Gross margin (2014 compared to 2013)
| For the years ended December 31, | ||||||||||||||||||||
| 2014 | 2013 | Percentage of total revenues |
||||||||||||||||||
| ($ in thousands) | (Successor) | (Successor) | $ Change | 2014 | 2013 | |||||||||||||||
| Gross margin: |
||||||||||||||||||||
| Par Pharmaceutical |
$ | 436,078 | 271,396 | $ | 164,682 | 35.1% | 26.4% | |||||||||||||
| Par Specialty |
43,037 | 46,647 | (3,610 | ) | 63.8% | 67.6% | ||||||||||||||
|
|
|
|||||||||||||||||||
| Total gross margin |
$ | 479,115 | $ | 318,043 | $ | 161,072 | 36.6% | 29.0% | ||||||||||||
|
|
||||||||||||||||||||
The increase in Par Pharmaceutical gross margin dollars for the year ended December 31, 2014 as compared to the prior year period was primarily due to gross margin dollars from Par Sterile products, which were acquired in February 2014, coupled with the September 2014 launch of amlodipine/valsartan; bupropion ER, which
84
Table of Contents
benefited from competitors that were not able to supply product to the market; and the full year impact of the fourth quarter of 2013 launch of clonidine HCl ER. These increases were tempered by the revenue and associated gross margin dollar decline of modafinil.
Par Specialty gross margin dollars decreased for the year ended December 31, 2014, primarily due to the revenue decline of Megace® ES.
Gross margin (2013 compared to 2012)
| For the years ended December 31, | ||||||||||||||||||||
| 2013 | 2012 | Percentage of total revenues |
||||||||||||||||||
| ($ in thousands) | (Successor) | (Total) (non-GAAP) |
$ Change | 2013 | 2012 (non-GAAP) |
|||||||||||||||
| Gross margin: |
||||||||||||||||||||
| Par Pharmaceutical |
$ | 271,396 | 330,114 | $ | (58,718 | ) | 26.4% | 34.0% | ||||||||||||
| Par Specialty |
46,647 | 57,681 | (11,034 | ) | 67.6% | 72.7% | ||||||||||||||
|
|
|
|||||||||||||||||||
| Total gross margin |
$ | 318,043 | $ | 387,795 | $ | (69,752 | ) | 29.0% | 36.9% | |||||||||||
|
|
||||||||||||||||||||
| For the period | For the year ended |
|||||||||||||
| July 12, 2012 (Successor) |
January 1, (Predecessor) |
December 31, 2012 |
||||||||||||
| ($ in thousands) | Total (non-GAAP) |
|||||||||||||
| Gross margin: |
||||||||||||||
| Par Pharmaceutical |
$ | 33,776 | $ | 296,338 | $ | 330,114 | ||||||||
| Par Specialty |
11,669 | 46,012 | 57,681 | |||||||||||
| Total gross margin |
$ | 45,445 | $ | 342,350 | $ | 387,795 | ||||||||
|
|
||||||||||||||
The decrease in Par Pharmaceutical gross margin dollars for the year ended December 31, 2013 as compared to the prior year period was primarily due to increased amortization of intangible assets associated with the Merger (an increase of approximately $110.0 million for the Company) coupled with the revenue declines of modafinil and metoprolol succinate ER tempered by the launches of lamotrigine and fluvoxamine maleate ER in the first quarter of 2013 and the increase in divalproex gross margin dollars, which benefited from a competitor exiting the market in June 2013.
Par Specialty gross margin dollars decreased for the year ended December 31, 2013, primarily due to increased amortization of intangible assets associated with the Merger coupled with the revenue decline of Megace® ES.
Research and development (2014 compared to 2013)
| For the years ended December 31, | ||||||||||||||||||||||||
| 2014 | 2013 | Percentage of total revenues |
||||||||||||||||||||||
| ($ in thousands) | (Successor) | (Successor) | $ Change | % Change | 2014 | 2013 | ||||||||||||||||||
| Research and development: |
||||||||||||||||||||||||
| Par Pharmaceutical |
$ | 118,205 | $ | 99,177 | $ | 19,028 | 19.2% | 9.5% | 9.6% | |||||||||||||||
| Par Specialty |
890 | 1,586 | (696 | ) | (43.9)% | 1.3% | 2.3% | |||||||||||||||||
|
|
|
|||||||||||||||||||||||
| Total research and development |
$ | 119,095 | $ | 100,763 | $ | 18,332 | 18.2% | 9.1% | 9.2% | |||||||||||||||
|
|
||||||||||||||||||||||||
85
Table of Contents
Par Pharmaceutical:
The net increase in Par Pharmaceutical research and development expense for the year ended December 31, 2014 was driven by:
| • | $8.9 million of higher employment related and other costs due to the acquisition of Par Sterile; |
| • | $5.6 million increase in outside development costs primarily driven by payment related to one new agreement partially offset by lower payments for existing development agreements; |
| • | $2.5 million of higher expense for consulting and advisory services related to the acquisition of Par Sterile; and |
| • | $2.3 million in incremental user fees due to 30 ANDA filings. |
These increases were tempered by a $2.6 million decrease in biostudy, clinical trial and material costs related to ongoing internal development of generic products.
Par Specialty:
Par Specialty research and development principally reflects FDA filing fees for the years ended December 31, 2014 and December 31, 2013.
Research and development (2013 compared to 2012)
| For the years ended December 31, | ||||||||||||||||||||||||
| 2013 | 2012 | Percentage of total revenues |
||||||||||||||||||||||
| ($ in thousands) | (Successor) | (Total) (non-GAAP) |
$ Change | % Change | 2013 | 2012 (non-GAAP) |
||||||||||||||||||
| Research and development: |
||||||||||||||||||||||||
| Par Pharmaceutical |
$ | 99,177 | $ | 84,353 | $ | 14,824 | 17.6% | 9.6% | 8.7% | |||||||||||||||
| Par Specialty |
1,586 | 1,636 | (50 | ) | (3.1)% | 2.3% | 2.1% | |||||||||||||||||
|
|
|
|||||||||||||||||||||||
| Total research and development |
$ | 100,763 | $ | 85,989 | $ | 14,774 | 17.2% | 9.2% | 8.2% | |||||||||||||||
|
|
||||||||||||||||||||||||
| For the period | For the year ended | |||||||||||||
| July 12, 2012 to December 31, 2012 |
January 1, 2012 to September 28, 2012 |
December 31, 2012 | ||||||||||||
| ($ in thousands) | (Successor) | (Predecessor) | Total (non-GAAP) |
|||||||||||
| Research and development: |
||||||||||||||
| Par Pharmaceutical |
$ | 19,242 | $ | 65,111 | $ | 84,353 | ||||||||
| Par Specialty |
141 | 1,495 | 1,636 | |||||||||||
|
|
|
|
|
|||||||||||
| Total research and development |
$ | 19,383 | $ | 66,606 | $ | 85,989 | ||||||||
|
|
||||||||||||||
Par Pharmaceutical:
The increase in Par Pharmaceutical research and development expense for the year ended December 31, 2013 was driven by a $15.4 million increase in biostudy, clinical trial and material costs related to ongoing internal development of generic products.
86
Table of Contents
Par Specialty:
Par Specialty research and development principally reflects FDA filing fees for the years ended December 31, 2013 and December 31, 2012.
Selling, general and administrative (2014 compared to 2013)
| For the years ended December 31, | ||||||||||||||||||||||||
| 2014 | 2013 | Percentage of total revenues |
||||||||||||||||||||||
| ($ in thousands) | (Successor) | (Successor) | $ Change | % Change | 2014 | 2013 | ||||||||||||||||||
| Selling, general and administrative: |
||||||||||||||||||||||||
| Par Pharmaceutical |
$ | 134,393 | $ | 114,383 | $ | 20,010 | 17.5% | 10.8% | 11.1% | |||||||||||||||
| Par Specialty |
46,743 | 40,781 | 5,962 | 14.6% | 69.3% | 59.1% | ||||||||||||||||||
|
|
|
|||||||||||||||||||||||
| Total selling, general and administrative |
$ | 181,136 | $ | 155,164 | $ | 25,972 | 16.7% | 13.8% | 14.1% | |||||||||||||||
|
|
||||||||||||||||||||||||
The net increase in selling, general and administrative expenditures for the year ended December 31, 2014 principally reflects:
| • | $12.0 million of higher employment related costs due to the acquisition of Par Sterile, combined with higher accrued bonus; |
| • | $8.0 million of higher expense for consulting and advisory services related to acquisitions and other business development activities; |
| • | $6.6 million of expense related to additional borrowings and repricing of our term loan plus associated transaction fees of $0.5 million; and |
| • | $4.0 million increase in direct Par Specialty selling and marketing costs driven by Nascobal. |
These increases were tempered by a $5.1 million of lower legal expenses primarily due to decreased corporate related activities.
Selling, general and administrative (2013 compared to 2012)
| For the years ended December 31, | ||||||||||||||||||||||||
| 2013 | 2012 | Percentage of total revenues |
||||||||||||||||||||||
| ($ in thousands) | (Successor) | (Total) (non-GAAP) |
$ Change | % Change | 2013 | 2012 (non-GAAP) |
||||||||||||||||||
| Selling, general and administrative: |
||||||||||||||||||||||||
| Par Pharmaceutical |
$ | 114,383 | $ | 162,801 | $ | (48,418 | ) | (29.7)% | 11.1% | 16.8% | ||||||||||||||
| Par Specialty |
40,781 | 76,563 | (35,782 | ) | (46.7)% | 59.1% | 45.2% | |||||||||||||||||
|
|
|
|||||||||||||||||||||||
| Total selling, general and administrative |
$ | 155,164 | $ | 239,364 | $ | (84,200 | ) | (35.2)% | 14.1% | 20.1% | ||||||||||||||
|
|
||||||||||||||||||||||||
| For the period | For the year ended | |||||||||||||
| July 12, 2012 to December 31, 2012 |
January 1, 2012 to September 28, 2012 |
December 31, 2012 |
||||||||||||
| ($ in thousands) | (Successor) | (Predecessor) | Total (non-GAAP) |
|||||||||||
| Selling, general and administrative: |
||||||||||||||
| Par Pharmaceutical |
$ | 53,867 | $ | 108,934 | $ | 162,801 | ||||||||
| Par Specialty |
19,893 | 56,670 | 76,563 | |||||||||||
|
|
|
|
|
|||||||||||
| Total selling, general and administrative |
$ | 73,760 | $ | 165,604 | $ | 239,364 | ||||||||
|
|
||||||||||||||
87
Table of Contents
The net decrease in selling, general and administrative expenditures for the year ended December 31, 2013 principally reflects:
| • | $70.4 million of expenses incurred in 2012 non-recurring in 2013 for the transaction fees and other costs related to the Merger; |
| • | a $13.0 million reduction in direct Par Specialty selling and marketing costs driven by a 70 person reduction of headcount; and |
| • | $2.7 million of incremental employment and related costs associated with certain executive severance amounts. |
Intangible asset impairment (2014 compared to 2013 and 2013 compared to 2012)
| For the year ended |
For the year ended |
For the period | ||||||||||||||
| December 31, 2014 |
December 31, 2013 |
July 12, 2012 to December 31, 2012 |
January 1, 2012 to September 28, 2012 |
|||||||||||||
| ($ in thousands) | (Successor) | (Successor) | (Successor) | (Predecessor) | ||||||||||||
| Intangible asset impairment |
$ | 146,934 | $ | 100,093 | $ | — | $ | 5,700 | ||||||||
During the year ended December 31, 2014, we recorded intangible asset impairments totaling $146.9 million related to an adjustment to the forecasted operating results for two IPR&D intangible asset groups and eight Par Pharmaceutical segment products compared to their originally forecasted operating results at the date of acquisition, inclusive of one discontinued product, one partially impaired product primarily due to the contract ending with the partner and a partially impaired IPR&D project from the Par Sterile acquisition due to an adverse court ruling pertaining to related patent litigation. The estimated fair values of the assets were determined by completing updated discounted cash flow models.
During the year ended December 31, 2013, we recorded intangible asset impairments totaling approximately $100.1 million for IPR&D classes of products and projects that were evaluated as part of the annual evaluation of indefinite lived intangible assets, as well as five products not expected to achieve their originally forecasted operating results and we ceased selling a product that had been acquired with the divested products from the merger of Watson and Actavis Group. During the period from January 1, 2012 to September 28, 2012 (Predecessor), we abandoned an in-process research and development project that was acquired in the Anchen acquisition and recorded a corresponding intangible asset impairment of $2.0 million, and we exited the market of a commercial product that was acquired in the Anchen acquisition and recorded a corresponding intangible asset impairment of $3.7 million.
Settlements and loss contingencies, net (2014 compared to 2013 and 2013 compared to 2012)
| For the year ended |
For the year ended |
For the period | ||||||||||||||
| December 31, 2014 |
December 31, 2013 |
July 12, 2012 to December 31, 2012 |
January 1, 2012 to September 28, 2012 |
|||||||||||||
| ($ in thousands) | (Successor) | (Successor) | (Successor) | (Predecessor) | ||||||||||||
| Settlements and loss contingencies, net |
$ | 90,107 | $ | 25,650 | $ | 10,059 | $ | 45,000 | ||||||||
88
Table of Contents
In 2014, we recorded an incremental provision of $91.0 million related to the settlement of omeprazole/sodium bicarbonate patent litigation for $100.0 million. During the 2014, we also received an arbitration award of approximately $0.9 million from a former partner related to a discontinued project.
In 2013, we recorded an incremental provision of $25.7 million related to AWP litigation claims (Illinois $19.8 million, Louisiana $3.3 million, Utah $1.7 million and Kansas $0.9 million).
During the period from January 1, 2012 to September 28, 2012 (Predecessor), we recorded an accrual of $45.0 million as management’s best estimate of a potential loss related to a potential global settlement with respect to an inquiry by the DOJ into Par Specialty’s promotional practices in the sales and marketing of Megace® ES. In the period from July 12, 2012 (inception) to December 31, 2012 (Successor), we recorded additional estimated amounts for accrued interest and legal expenses that we are liable for paying in the final settlement and we also accrued for a contingent liability of $9.0 million related to omeprazole/sodium bicarbonate patent litigation.
Restructuring costs (2014 compared to 2013 and 2013 compared to 2012)
| For the year ended |
For the year ended |
For the period | ||||||||||||||
| December 31, 2014 |
December 31, 2013 |
July 12, 2012 to December 31, 2012 |
January 1, 2012 to September 28, 2012 |
|||||||||||||
| ($ in thousands) | (Successor) | (Successor) | (Successor) | (Predecessor) | ||||||||||||
| Restructuring costs |
$ | 5,413 | $ | 1,816 | $ | 241 | $ | — | ||||||||
|
|
||||||||||||||||
In 2014, subsequent to the Par Sterile acquisition, we eliminated 25 redundant positions within Par Pharmaceutical and accrued severance and other employee-related costs for those employees affected by the workforce reduction. Additionally, due to the change in our product development strategy, we eliminated 44 redundant positions within our Irvine location and accrued severance and other employee-related costs for these employees affected by the workforce reduction.
In January 2013, we initiated a restructuring of Par Specialty, our branded pharmaceuticals division, in anticipation of entering into a settlement agreement and CIA that terminated the DOJ’s ongoing investigation of Par Specialty’s marketing of Megace® ES. We reduced our Par Specialty workforce by approximately 70 people, with the majority of the reductions in the sales force. The remaining Par Specialty sales force has been reorganized into a single sales team of approximately 60 professionals that focus their marketing efforts principally on Nascobal® Nasal Spray. In connection with these actions, we incurred expenses for severance and other employee-related costs as well as the termination of certain contracts.
The following table summarizes the activity for 2014 and the remaining related restructuring liabilities balance (included in accrued expenses and other current liabilities on the consolidated balance sheet) as of December 31, 2014 ($ in thousands):
| Restructuring activities (Par Sterile) | Initial charge | Additional charge |
Cash payments |
Non-cash charge related to inventory and/or intangible assets |
Reversals, reclass or transfers |
Liabilities at December 31, 2014 |
||||||||||||||||||
| Severance and employee benefits to be paid in cash |
$ | 1,146 | $ | 3,527 | $ | (2,686 | ) | $ | — | $ | — | $ | 1,987 | |||||||||||
|
|
|
|||||||||||||||||||||||
| Total restructuring costs line item |
$ | 1,146 | $ | 3,527 | $ | (2,686 | ) | $ | — | $ | — | $ | 1,987 | |||||||||||
|
|
||||||||||||||||||||||||
89
Table of Contents
| Restructuring activities (Irvine) | Initial charge | Additional charge |
Cash payments |
Non-cash intangible |
Reversals, reclass or transfers |
Liabilities at December 31, 2014 |
||||||||||||||||||
| Severance and employee benefits to be paid in cash |
$ | 740 | $ | — | $ | (127 | ) | $ | — | $ | — | $ | 613 | |||||||||||
|
|
|
|||||||||||||||||||||||
| Total restructuring costs line item |
$ | 740 | $ | — | $ | (127 | ) | $ | — | $ | — | $ | 613 | |||||||||||
|
|
||||||||||||||||||||||||
The following table summarizes the activity for 2013 and the remaining related restructuring liabilities balance (included in accrued expenses and other current liabilities on the consolidated balance sheet) as of December 31, 2013 ($ in thousands):
| Restructuring activities | Initial charge | Cash payments |
Non-cash charge assets |
Reversals, reclass or transfers |
Liabilities at December 31, 2013 |
|||||||||||||||
| Severance and employee benefits to be paid in cash |
$ | 1,413 | $ | (1,409 | ) | $ | — | $ | (4 | ) | $ | — | ||||||||
| Asset impairments and other |
403 | — | (403 | ) | — | — | ||||||||||||||
|
|
|
|||||||||||||||||||
| Total restructuring costs line item |
$ | 1,816 | $ | (1,303 | ) | $ | (403 | ) | $ | (4 | ) | $ | — | |||||||
|
|
||||||||||||||||||||
Loss on sale of product rights and other (2014 compared to 2013 and 2013 compared to 2012)
| For the year ended |
For the year ended |
For the period | ||||||||||||||
| December 31, 2014 |
December 31, 2013 |
July 12, 2012 to December 31, 2012 |
January 1, 2012 to September 28, 2012 |
|||||||||||||
| ($ in thousands) | (Successor) | (Successor) | (Successor) | (Predecessor) | ||||||||||||
| Loss on sale of product rights and other |
$ | (3,042 | ) | $ | — | $ | — | $ | — | |||||||
|
|
||||||||||||||||
During the year ended December 31, 2014, we recorded a net provision of $3.0 million related to sale of three ANDAs for approximately $0.8 million that had an associated book value of approximately $3.8 million, which was previously reflected as intangible assets on the consolidated balance sheet. The agreement related to the sale of the three ANDAs, during the year ended December 31, 2014 and contains terms that specify future potential payments totaling $5.6 million related to the achievement by the buyer of certain regulatory approvals and product launches.
Operating loss (2014 compared to 2013)
| For the years ended December 31, | ||||||||||||
| 2014 | 2013 | |||||||||||
| ($ in thousands) | (Successor) | (Successor) | $ Change | |||||||||
| Operating loss: |
||||||||||||
| Par Pharmaceutical |
$ | (30,938 | ) | $ | (48,082 | ) | $ | 17,144 | ||||
| Par Specialty |
(35,674 | ) | (17,361 | ) | (18,313 | ) | ||||||
|
|
|
|||||||||||
| Total operating loss |
$ | (66,612 | ) | $ | (65,443 | ) | $ | (1,169 | ) | |||
|
|
||||||||||||
90
Table of Contents
For the year ended December 31, 2014, the increase in our operating loss as compared to the prior year was primarily due to the $100.0 million settlement of the omeprazole/sodium bicarbonate patent litigation coupled with intangible asset impairments, additional research and development expense for payments related to existing product development agreements and additional selling, general and administrative expenditures related to the acquisition of Par Sterile, tempered by increased gross margin dollars for key products and new product launches subsequent to the year ended December 31, 2013.
Operating (loss) income (2013 compared to 2012)
| For the years ended December 31, | ||||||||||||
| 2013 | 2012 | |||||||||||
| ($ in thousands) | (Successor) | (Total) (non-GAAP) |
$ Change | |||||||||
| Operating (loss) income: |
||||||||||||
| Par Pharmaceutical |
$ | (48,082 | ) | $ | 68,065 | $ | (116,147 | ) | ||||
| Par Specialty |
(17,361 | ) | (66,623 | ) | 49,262 | |||||||
|
|
|
|
|
|
|
|||||||
| Total operating (loss) income |
$ | (65,443 | ) | $ | 1,442 | $ | (66,885 | ) | ||||
|
|
||||||||||||
| For the period | For the year ended | |||||||||||
| July 12, 2012 to December 31, 2012 |
January 1, 2012 to September 28, 2012 |
December 31, 2012 | ||||||||||
| ($ in thousands) | (Successor) | (Predecessor) | Total (non-GAAP) |
|||||||||
| Operating (loss) income: |
||||||||||||
| Par Pharmaceutical |
$ | (48,526 | ) | $ | 116,591 | $ | 68,065 | |||||
| Par Specialty |
(9,472 | ) | (57,151 | ) | (66,623 | ) | ||||||
|
|
|
|
|
|
|
|||||||
| Total operating (loss) income |
$ | (57,998 | ) | $ | 59,440 | $ | 1,442 | |||||
|
|
||||||||||||
For the year ended December 31, 2013, the decrease in our operating income as compared to prior year was primarily due to increased amortization of intangible assets associated with the Merger coupled with intangible asset impairment, tempered by the non-recurrence of an accrual of $45.0 million during the three months ended March 31, 2012 related to the DOJ investigation coupled with the non-recurrence of $70.0 million of transaction fees and other costs related to the Merger.
Gain on bargain purchase (2014 compared to 2013 and 2013 compared to 2012)
| For the year ended |
For the year ended |
For the period | ||||||||||||||
| December 31, 2014 |
December 31, 2013 |
July 12, 2012 to December 31, 2012 |
January 1, 2012 to September 28, 2012 |
|||||||||||||
| ($ in thousands) | (Successor) | (Successor) | (Successor) | (Predecessor) | ||||||||||||
| Gain on bargain purchase |
$ | — | $ | — | $ | 5,500 | $ | — | ||||||||
|
|
||||||||||||||||
On November 6, 2012, Par Pharmaceutical acquired U.S. marketing rights to five generic products that were marketed by Watson or Actavis Group as well as eight ANDAs currently awaiting regulatory approval and a generic product in late-stage development, in connection with the merger of Watson and Actavis Group. The acquisition resulted in a bargain purchase under FASB ASC 805 Business Combinations. The purchase price of the acquisition was allocated to the assets acquired, with the excess of the fair value of assets acquired over the
91
Table of Contents
purchase price recorded as a gain. The gain was mainly attributed to the FTC mandated divestiture of products by Watson and Actavis Group in conjunction with the approval of the merger of Watson and Actavis Group in the fourth quarter of 2012.
Loss on debt extinguishment (2014 compared to 2013 and 2013 compared to 2012)
| For the year ended |
For the year ended |
For the period | ||||||||||||||
| December 31, 2014 |
December 31, 2013 |
July 12, 2012 to December 31, 2012 |
January 1, 2012 to September 28, 2012 |
|||||||||||||
| ($ in thousands) | (Successor) | (Successor) | (Successor) | (Predecessor) | ||||||||||||
| Loss on debt extinguishment |
$ | (3,989 | ) | $ | (7,335 | ) | $ | — | $ | — | ||||||
|
|
||||||||||||||||
During the year ended December 31, 2014, and in conjunction with the acquisition of Par Sterile, we entered into the Joinder among us, Par Pharmaceutical Companies, certain of our subsidiaries and our lenders. Under the terms of the Joinder, we borrowed an additional $395.0 million of new tranche term loans from the lenders participating therein for the purpose of consummating our acquisition of Par Sterile. We also repriced our term loan facility at the same time lowering our effective borrowing rate by 25 basis points. Based on these actions and the decision of certain lenders not to remain a party to our term loan facility, we recorded a loss on debt extinguishment of approximately $4.0 million that represents a proportionate share of deferred financing costs that were written off.
During the year ended December 31, 2013, we refinanced our $1,055 million senior secured term loan. As a result, $5.9 million of existing deferred financing costs and a portion of the related $10.5 million soft call premium were recorded as a loss on debt extinguishment for the portion of the associated transactions that were classified as extinguishment of debt.
Gain on sale of marketable securities and other investments, net (2014 compared to 2013 and 2013 compared to 2012)
| For the year ended |
For the year ended |
For the period | ||||||||||||||
| December 31, 2014 |
December 31, 2013 |
July 12, 2012 to December 31, 2012 |
January 1, 2012 to September 28, 2012 |
|||||||||||||
| ($ in thousands) | (Successor) | (Successor) | (Successor) | (Predecessor) | ||||||||||||
| Gain on sale of marketable securities and other investments, net |
$ | — | $ | 1,122 | $ | — | $ | — | ||||||||
|
|
||||||||||||||||
In 2013, we recorded a gain on sale of stock of a public pharmaceutical company of $1.1 million.
Other income, net (2014 compared to 2013 and 2013 compared to 2012)
| For the year ended | For the period | |||||||||||||||||
| December 31, 2014 |
December 31, 2013 |
July 12, 2012 to December 31, 2012 |
January 1, 2012 to September 28, 2012 |
|||||||||||||||
| ($ in thousands) | (Successor) | (Successor) | (Successor) | (Predecessor) | ||||||||||||||
| Other income, net |
$ | 500 | $ | — | $ | — | $ | — | ||||||||||
|
|
||||||||||||||||||
During the year ended December 31, 2014, we received a contractual reimbursement payment from a former partner related to the withdrawals of two ANDAs.
92
Table of Contents
Interest income (2014 compared to 2013 and 2013 compared to 2012)
| For the year ended |
For the year ended |
For the period | ||||||||||||||
| December 31, 2014 |
December 31, 2013 |
July 12, 2012 to December 31, 2012 |
January 1, 2012 to September 28, 2012 |
|||||||||||||
| ($ in thousands) | (Successor) | (Successor) | (Successor) | (Predecessor) | ||||||||||||
| Interest income |
$ | 18 | $ | 87 | $ | 50 | $ | 424 | ||||||||
|
|
||||||||||||||||
Interest income principally includes interest income derived primarily from money market and other short-term investments.
Interest expense (2014 compared to 2013 and 2013 compared to 2012)
| For the year ended |
For the year ended |
For the period | ||||||||||||||
| December 31, 2014 |
December 31, 2013 |
July 12, 2012 to December 31, 2012 |
January 1, 2012 to September 28, 2012 |
|||||||||||||
| ($ in thousands) | (Successor) | (Successor) | (Successor) | (Predecessor) | ||||||||||||
| Interest expense |
$ | (108,427 | ) | $ | (95,484 | ) | $ | (25,985 | ) | $ | (9,159 | ) | ||||
|
|
||||||||||||||||
To finance the Merger, the Sponsor arranged for an offering of $490.0 million in aggregate principal amount of the Notes by Sky Growth Acquisition Corporation and for financing under the Senior Credit Facilities. Upon the consummation of the Merger, Par Pharmaceutical Companies assumed the obligations of Sky Growth Acquisition Corporation under the Notes and the related purchase agreement and entered into the related indenture and the registration rights agreement relating to the Notes. The proceeds from the Notes offering, together with the proceeds of the Senior Credit Facilities among other sources were used to fund the consummation of the Merger and other uses of funds.
The Senior Credit Facilities were initially comprised of a $1,055.0 million senior secured term loan (“Term Loan Facility”) and a $150.0 million senior secured revolving credit facility (“Revolving Facility”). Borrowings under the Senior Credit Facilities bear interest at a rate per annum equal to an applicable margin plus, at the Company’s option, either LIBOR (which is subject to a 1.00% floor) or the base rate (which is subject to a 2.00% floor). On February 20, 2014 in conjunction with our acquisition of Par Sterile, we entered into an amendment to our Senior Credit Facility that refinanced all of the outstanding tranche B-1 term loans of the borrower with a new tranche of tranche B-2 term loans in an aggregate principal amount of $1,055.0 million. Additionally, we also entered into an incremental term B-2 joinder agreement and borrowed an additional $395.0 million of new tranche B term loans from the lenders participating therein for the purpose of consummating our acquisition of Par Sterile. As of December 31, 2014, the effective interest rate on the seven-year Tranche B Term Loans was 4.00%, representing the 1.00% LIBOR floor plus 300 basis points. As of December 31, 2013, the applicable rate was 4.25% representing the 1.00% LIBOR floor plus 325 basis points. As of December 31, 2012, the effective interest rate on the Tranche B Term Loans was 4.75%, representing the 1.00% LIBOR floor plus 375 basis points. In addition to paying interest on outstanding principal under the Senior Credit Facilities, we paid customary agency fees and a commitment fee in respect of the unutilized commitments under the revolving credit facility. Refer to Note 14 to our audited consolidated financial statements included elsewhere in this prospectus for a description of a refinancing and repricing of the Senior Credit Facilities completed in February 2014 and February 2013. As a result of the Merger, our interest expense significantly increased after September 28, 2012 due to increased borrowings.
93
Table of Contents
The outstanding balance of the Tranche B Term Loans that is part of the Senior Credit Facilities was $1,436.0 million at December 31, 2014. Interest expense for the twelve month period ended December 31, 2014 is principally comprised of interest related to the Notes and the Senior Credit Facilities.
In connection with the acquisition of Anchen in November 2011, we entered into a credit agreement (the “Predecessor Credit Agreement”) with a syndicate of banks to provide senior credit facilities comprised of a five-year term loan facility in an initial aggregate principal amount of $350.0 million and a five-year revolving credit facility in an initial amount of $100.0 million. Interest expense for the nine month period ended September 28, 2012 is principally comprised of interest on such term loan. The Predecessor Credit Agreement was extinguished on September 28, 2012 in connection with the Merger.
Income taxes (2014 compared to 2013 and 2013 compared to 2012)
| For the year ended |
For the year ended |
For the period | ||||||||||||||||
| December 31, 2014 |
December 31, 2013 |
July 12, 2012 to December 31, 2012 |
January 1, 2012 to September 28, 2012 |
|||||||||||||||
| ($ in thousands) | (Successor) | (Successor) | (Successor) | (Predecessor) | ||||||||||||||
| (Benefit) provision for income taxes |
$ | (72,993 | ) | $ | (61,182 | ) | $ | (23,727 | ) | $ | 29,530 | |||||||
|
|
|
|
|
|||||||||||||||
| Effective tax rate |
41% | 37% | 30% | 58% | ||||||||||||||
|
|
||||||||||||||||||
The provision/ (benefit) for income taxes was based on the applicable federal and state tax rates for those periods (see Note 19 to our audited consolidated financial statements which are included elsewhere in this prospectus). For periods with a loss before benefit for income taxes, favorable tax items result in an increase in the effective tax rate, while unfavorable tax items result in a decrease in the effective tax rate. For periods with income before provision for income taxes, favorable tax items result in a decrease in the effective tax rate, while, unfavorable tax items result in an increase in the effective tax rate. The higher effective tax rate for the year ended December 31, 2014 (Successor) is principally due to tax benefits we receive as a domestic manufacturer and tax credits related to our research and development activity partially offset by non-deductibility of the annual pharmaceutical manufacturers’ fee. The lower effective tax rate for the period July 12, 2012 (inception) to December 31, 2012 (Successor) is principally due to the non-deductibility of certain acquisition related transaction costs. The higher effective tax rate for the period January 1, 2012 to September 28, 2012 (Predecessor) is principally due to the non-deductibility of certain charges related to our settlement with the DOJ and non-deductibility of certain acquisition-related transaction costs, off-set by a reduction in tax contingencies.
Off-balance sheet arrangements
We have no off-balance sheet arrangements, other than disclosed operating leases.
Critical accounting policies and use of estimates
Critical accounting policies are those policies that are most important to the portrayal of our financial condition and results of operations, and require management’s most difficult, subjective and complex judgments, resulting from the need to make estimates about the effect of matters that are inherently uncertain. Our most critical accounting policies, as discussed below, pertain to revenue recognition and the determination of deductions from gross revenues, the determination of whether certain costs pertaining to our significant development and marketing agreements are to be capitalized or expensed as incurred, the valuation and assessment of impairment of goodwill and intangible assets and inventory valuation. In applying such policies,
94
Table of Contents
management often must use amounts that are based on its informed judgments and estimates. Because of the uncertainties inherent in these estimates, actual results could differ from the estimates used in applying the critical accounting policies. We are not aware of any likely events or circumstances that would result in different amounts being reported that would materially affect our financial condition or results of operations.
Revenue recognition and provisions for deductions from gross revenues
We recognize revenues for product sales when title and risk of loss have transferred to our customers, when reliable estimates of rebates, chargebacks, returns and other adjustments can be made, and when collectability is reasonably assured. This is generally at the time products are received by the customers. We also review available trade inventory levels at certain large wholesalers to evaluate any potential excess supply levels in relation to expected demand. Upon recognizing revenue from sales, we record estimates for the following items that reduce gross revenues:
| • | Chargebacks |
| • | Rebates and incentive programs |
| • | Product returns |
| • | Cash discounts and other |
| • | Medicaid rebates |
The following table summarizes the activity for the years ended December 31, 2014, 2013 and 2012 in the accounts affected by the estimated provisions described below, ($ in thousands):
| For the year ended December 31, 2014 | ||||||||||||||||||||||||
| (Successor) | ||||||||||||||||||||||||
| Accounts receivable reserves | Beginning balance |
Par Sterile beginning balance |
Provision period sales |
(Provision) reversal recorded for prior period sales |
Credits processed |
Ending balance |
||||||||||||||||||
| Chargebacks |
$ | (48,766 | ) | $ | (6,296 | ) | $ | (871,139 | ) | $ | 2,628 | (1) | $ | 827,081 | $ | (96,492 | ) | |||||||
| Rebates and incentive programs |
(75,321 | ) | (5,489 | ) | (480,949 | ) | — | 422,770 | (138,989 | ) | ||||||||||||||
| Returns |
(78,181 | ) | (4,820 | ) | (31,361 | ) | — | 30,032 | (84,330 | ) | ||||||||||||||
| Cash discounts and other |
(37,793 | ) | (1,792 | ) | (291,153 | ) | (1,449 | )(3) | 245,390 | (86,797 | ) | |||||||||||||
|
|
|
|||||||||||||||||||||||
| Total |
$ | (240,061 | ) | $ | (18,397 | ) | $ | (1,674,602 | ) | $ | 1,179 | $ | 1,525,273 | $ | (406,608 | ) | ||||||||
|
|
|
|||||||||||||||||||||||
| Accrued liabilities(2) |
$ | (35,829 | ) | $ | (382 | ) | $ | (84,840 | ) | $ | 2,805 | (4) | $ | 75,599 | $ | (42,647 | ) | |||||||
|
|
||||||||||||||||||||||||
| For the year ended December 31, 2013 | ||||||||||||||||||||
| (Successor) | ||||||||||||||||||||
| Accounts receivable reserves | Beginning balance |
Provision for current |
(Provision) for prior sales |
Credits processed |
Ending balance |
|||||||||||||||
| Chargebacks |
$ | (41,670 | ) | $ | (630,097 | ) | $ | — | (1) | $ | 623,001 | $ | (48,766 | ) | ||||||
| Rebates and incentive programs |
(59,426 | ) | (290,934 | ) | 659 | 274,380 | (75,321 | ) | ||||||||||||
| Returns |
(68,062 | ) | (37,956 | ) | — | 27,837 | (78,181 | ) | ||||||||||||
| Cash discounts and other |
(26,544 | ) | (195,632 | ) | 1,564 | 182,819 | (37,793 | ) | ||||||||||||
|
|
|
|
|
|
|
|
|
|
|
|||||||||||
| Total |
$ | (195,702 | ) | $ | (1,154,619 | ) | $ | 2,223 | $ | 1,108,037 | $ | (240,061 | ) | |||||||
|
|
|
|
|
|
|
|
|
|
|
|||||||||||
| Accrued liabilities(2) |
$ | (42,162 | ) | $ | (80,726 | ) | $ | 3,566 | (5) | $ | 83,493 | $ | (35,829 | ) | ||||||
|
|
||||||||||||||||||||
95
Table of Contents
| For the period July 12, 2012 to December 31, 2012 | ||||||||||||||||||||
| (Successor) | ||||||||||||||||||||
| Accounts receivable reserves | Beginning balance |
Provision recorded for current period sales |
(Provision) reversal recorded for prior period sales |
Credits processed |
Ending balance |
|||||||||||||||
| Chargebacks |
$ | (24,223 | ) | $ | (132,834 | ) | $ | — | (1) | $ | 115,387 | $ | (41,670 | ) | ||||||
| Rebates and incentive programs |
(43,866 | ) | (69,749 | ) | — | 54,189 | (59,426 | ) | ||||||||||||
| Returns |
(64,119 | ) | (8,522 | ) | — | 4,579 | (68,062 | ) | ||||||||||||
| Cash discounts and other |
(30,817 | ) | (46,053 | ) | — | 50,326 | (26,544 | ) | ||||||||||||
|
|
|
|
|
|
|
|
|
|
|
|||||||||||
| Total |
$ | (163,025 | ) | $ | (257,158 | ) | $ | — | $ | 224,481 | $ | (195,702 | ) | |||||||
|
|
|
|
|
|
|
|
|
|
|
|||||||||||
| Accrued liabilities(2) . |
$ | (42,455 | ) | $ | (24,437 | ) | $ | — | $ | 24,730 | $ | (42,162 | ) | |||||||
|
|
|
|
|
|
|
|
|
|
|
|||||||||||
| For the period January 1, 2012 to September 28, 2012 | ||||||||||||||||||||
| (Predecessor) | ||||||||||||||||||||
| Accounts receivable reserves | Beginning balance |
Provision recorded for current period sales |
(Provision) reversal recorded for prior period sales |
Credits processed |
Ending balance |
|||||||||||||||
| Chargebacks |
$ | (20,688 | ) | $ | (309,411 | ) | $ | — | (1) | $ | 305,876 | $ | (24,223 | ) | ||||||
| Rebates and incentive programs |
(35,132 | ) | (147,112 | ) | (59 | ) | 138,437 | (43,866 | ) | |||||||||||
| Returns |
(58,672 | ) | (24,793 | ) | 1,602 | (6) | 17,744 | (64,119 | ) | |||||||||||
| Cash discounts and other |
(28,672 | ) | (102,718 | ) | (809 | ) | 101,382 | (30,817 | ) | |||||||||||
|
|
|
|
|
|
|
|
|
|
|
|||||||||||
| Total |
$ | (143,164 | ) | $ | (584,034 | ) | $ | 734 | $ | 563,439 | $ | (163,025 | ) | |||||||
|
|
|
|
|
|
|
|
|
|
|
|||||||||||
| Accrued liabilities(2) . |
$ | (39,614 | ) | $ | (49,536 | ) | $ | — | $ | 46,695 | $ | (42,455 | ) | |||||||
|
|
|
|
|
|
|
|
|
|
|
|
||||||||||
| (1) | Unless specific in nature, the amount of provision or reversal of reserves related to prior periods for chargebacks is not determinable on a product or customer specific basis; however, based upon historical analysis and analysis of activity in subsequent periods, we believe that our chargeback estimates remain reasonable. During the year ended December 31, 2014 (Successor), the Company settled a dispute with a customer resulting in a recovery payment of $3.6 million of which $2.6 million pertained to prior year transactions. |
| (2) | Includes amounts due to indirect customers for which no underlying accounts receivable exists and is principally comprised of Medicaid rebates and rebates due under other U.S. Government pricing programs, such as TriCare and the Department of Veterans Affairs. |
| (3) | During the year ended December 31, 2014, the Company recorded expense of approximately $1.0 million related to a re-procurement claim from one customer for the period September 2012 through October 2012. In addition, we settled post audit claims from customers for the period January 2009 through December 2012 that resulted in net expense of approximately $0.5 million. |
| (4) | During 2014, we received further additional information related to Managed Medicaid utilization in California and performed a recalculation of average manufacturer’s price. As a result we reduced our 2014 Medicaid accruals by approximately $3.6 million related to the periods March 2010 through December 2013. This activity was partially offset by the expense of $0.8 million related to disputed TriCare claims for the period from January 2009 through December 2013. Our Medicaid and TriCare accruals represent our best estimate at this time. |
| (5) | During 2013, we received additional information related to Managed Medicaid utilization in California and performed a recalculation of average manufacturer’s price. As a result we reduced our 2013 Medicaid accruals by approximately $3.6 million related to the periods January 2010 through December 2012. Our Medicaid accrual represents our best estimate at this time. |
| (6) | The amount principally represents the resolution of a customer dispute in the first quarter of 2012 regarding invalid deductions taken in prior years of approximately $1.6 million. |
We sell our products directly to wholesalers, retail drug store chains, drug distributors, mail order pharmacies and other direct purchasers and customers that purchase products indirectly through the wholesalers, including independent pharmacies, non-warehousing retail drug store chains, managed health care providers and other indirect purchasers. We have entered into agreements at negotiated contract prices with those health
96
Table of Contents
care providers that purchase products through our wholesale customers at those contract prices. Chargeback credits are issued to wholesalers for the difference between our invoice price to the wholesaler and the contract price through which the product is resold to health care providers. The information that we consider when establishing our chargeback reserves includes contract and non-contract sales trends, average historical contract pricing, actual price changes, processing time lags and customer inventory information from our three largest wholesale customers. Our chargeback provision and related reserve vary with changes in product mix, changes in customer pricing and changes to estimated wholesaler inventory.
Customer rebates and incentive programs are generally provided to customers as an incentive for the customers to continue carrying our products or replace competing products in their distribution channels with products sold by us. Rebate programs are based on a customer’s dollar purchases made during an applicable monthly, quarterly or annual period. We also provide indirect rebates, which are rebates paid to indirect customers that have purchased our products from a wholesaler under a contract with us. The incentive programs include stocking or trade show promotions where additional discounts may be given on a new product or certain existing products as an added incentive to stock our products. We may, from time to time, also provide price and/or volume incentives on new products that have multiple competitors and/or on existing products that confront new competition in order to attempt to secure or maintain a certain market share. The information that we consider when establishing our rebate and incentive program reserves are rebate agreements with and purchases by each customer, tracking and analysis of promotional offers, projected annual sales for customers with annual incentive programs, actual rebates and incentive payments made, processing time lags, and for indirect rebates, the level of inventory in the distribution channel that will be subject to indirect rebates. We do not provide incentives designed to increase shipments to our customers that we believe would result in out-of-the-ordinary course of business inventory for them. We regularly review and monitor estimated or actual customer inventory information at our three largest wholesale customers for our key products to ascertain whether customer inventories are in excess of ordinary course of business levels.
Pursuant to a drug rebate agreement with the CMS, TriCare and similar supplemental agreements with various states, we provide a rebate on drugs dispensed under such government programs. We determine our estimate of the Medicaid rebate accrual primarily based on historical experience of claims submitted by the various states and any new information regarding changes in the Medicaid program that might impact our provision for Medicaid rebates. In determining the appropriate accrual amount, we consider historical payment rates, processing lag for outstanding claims and payments, and levels of inventory in the distribution channel. We review the accrual and assumptions on a quarterly basis against actual claims data to help ensure that the estimates made are reliable. On January 28, 2008, the Fiscal Year 2008 National Defense Authorization Act was enacted, which expands TriCare to include prescription drugs dispensed by TriCare retail network pharmacies. TriCare rebate accruals reflect this program expansion and are based on actual and estimated rebates on Department of Defense eligible sales.
We accept returns of product according to the following criteria: (i) the product returns must be approved by authorized personnel with the lot number and expiration date accompanying any request and (ii) we generally will accept returns of products from any customer and will provide the customer with a credit memo for such returns if such products are returned between six months prior to, and 12 months following, such products’ expiration date. We record a provision for product returns based on historical experience, including actual rate of expired and damaged in-transit returns, average remaining shelf-lives of products sold, which generally range from 12 to 48 months, and estimated return dates. Additionally, we consider other factors when estimating our current period return provision, including levels of inventory in the distribution channel, significant market changes that may impact future expected returns, and actual product returns, and may record additional provisions for specific returns that it believes are not covered by the historical rates.
97
Table of Contents
We offer cash discounts to our customers, generally 2% of the sales price, as an incentive for paying within invoice terms, which generally range from 30 to 90 days. We account for cash discounts by reducing accounts receivable by the full amount of the discounts that we expect our customers to take. In addition to the significant gross-to-net sales adjustments described above, we periodically make other sales adjustments. We generally account for these other gross-to-net adjustments by establishing an accrual in the amount equal to our estimate of the adjustments attributable to the sale.
We may at our discretion provide price adjustments due to various competitive factors, through shelf-stock adjustments on customers’ existing inventory levels. There are circumstances under which we may not provide price adjustments to certain customers as a matter of business strategy, and consequently may lose future sales volume to competitors and risk a greater level of sales returns on products that remain in the customer’s existing inventory.
As detailed above, we have the experience and access to relevant information that we believe are necessary to reasonably estimate the amounts of such deductions from gross revenues. Some of the assumptions we use for certain of these estimates are based on information received from third parties, such as wholesale customer inventories and market data, or other market factors beyond our control. The estimates that are most critical to the establishment of these reserves, and therefore, would have the largest impact if these estimates were not accurate, are estimates related to contract sales volumes, average contract pricing, customer inventories and return volumes. We regularly review the information related to these estimates and adjust our reserves accordingly, if and when actual experience differs from previous estimates. With the exception of the product returns allowance, the ending balances of accounts receivable reserves and allowances generally are processed during a two-month to four-month period.
Research and development agreements
We capitalize or expense amounts related to the development of new products and technologies through agreements with third parties based on our determination of our ability to recover in a reasonable period of time its cost from the estimated future cash flows anticipated to be generated pursuant to each agreement. Accordingly, amounts related to our funding of the research and development efforts of others or to the purchase of contractual rights to products that have not been approved by the FDA, and where we have no alternative future use for the product, are expensed and included in research and development costs. Amounts for contractual rights acquired by us to a process, product or other legal right having multiple or alternative future uses that support its realizability, as well as to an approved product, are capitalized and included in intangible assets on the consolidated balance sheets.
Inventories
Inventories are stated at the lower of cost (first-in, first-out basis) or market value. We establish reserves for our inventory to reflect situations in which the cost of the inventory is not expected to be recovered. In evaluating whether inventory is stated at the lower of cost or market, management considers such factors as the amount of inventory on hand, estimated time required to sell such inventory, remaining shelf life, remaining contractual terms of any supply and distribution agreements including authorized generic agreements, and current expected market conditions, including level of competition. We record provisions for inventory to cost of goods sold.
We capitalize costs associated with certain products prior to regulatory approval and product launch (“pre-launch inventories”) when it is reasonably certain that the pre-launch inventories will be saleable, based on management’s judgment of future commercial use and net realizable value. The determination to capitalize is
98
Table of Contents
made once we (or our third party development partners) have filed an ANDA that has been acknowledged by the FDA for containing sufficient information to allow the FDA to conduct their review in an efficient and timely manner and management is reasonably certain that all regulatory and legal hurdles will be cleared. This determination is based on the particular facts and circumstances relating to the expected FDA approval of the generic drug product being considered, and accordingly, the time frame within which the determination is made varies from product to product. We could be required to expense previously capitalized costs related to pre-launch inventories upon a change in such judgment, due to a denial or delay of approval by regulatory bodies, a delay in commercialization, or other potential risk factors. If these risks were to materialize and the launch of such product were significantly delayed, we may have to write-off all or a portion of such pre-launch inventories and such amounts could be material. As of December 31, 2014, we had pre-launch inventories of $5.0 million. Should any launch be delayed, inventory write-offs may occur to the extent we are unable to recover the full value of our inventory investment. The recoverability of the cost of pre-launch inventories with a limited shelf life is evaluated based on the specific facts and circumstances surrounding the timing of anticipated product launches, including our expected number of competitors during the six-month period subsequent to any anticipated product launch. Further, we believe that the inventory balance at December 31, 2014 is recoverable based on anticipated launches and the related expected demand for lower priced generic products that may be substituted for referenced branded products upon FDA approval.
Goodwill and intangible assets
We determine the estimated fair values of goodwill and intangible assets with definite and/or indefinite lives based on valuations performed at the time of their acquisition. In addition, the fair value of certain amounts paid to third parties related to the development of new products and technologies, as described above in “Research and Development Agreements”, are capitalized and included in intangible assets on the accompanying consolidated balance sheets.
Goodwill and indefinite-lived intangible assets are reviewed for impairment annually, or when events or other changes in circumstances indicate that the carrying amount of the asset may not be recoverable. Impairment of goodwill and indefinite-lived intangibles is determined to exist when the fair value is less than the carrying value of the net assets being tested. Impairment of definite-lived intangibles is determined to exist when undiscounted forecasted cash flows related to the assets are less than the carrying value of the assets being tested.
As discussed above with respect to determining an asset’s fair value, because this process involves management making certain estimates and because these estimates form the basis of the determination of whether or not an impairment charge should be recorded, these estimates are considered to be critical accounting estimates. The critical estimates include projected future cash flows related to subject product sales and related estimated costs, assumptions related to the time value of money and weighted average cost of capital, the market capitalization of our company, and the implied value of our business relative to similar companies and relative to acquisitions involving similar companies. For the intangible assets, the critical estimates include future projected prescriptions (demand), the operational execution of the related marketing and sales plans, the timing and operational execution of planned product launches, and the expected levels of competition in each product market.
As of October 1, 2014, we performed our annual goodwill impairment assessment and of our intangible assets with indefinite lives noting no impairment of goodwill and impairment of certain of our intangible assets, as described below. No changes in business or other factors are known as of the December 31, 2014 balance sheet date that would necessitate an evaluation for impairment. In the year ended December 31, 2014, we adjusted our forecast for certain products to reflect competition and pricing assumptions which caused us to assess the carrying value of certain intangible assets. During the twelve months ended December 31, 2014 we recorded intangible asset impairments totaling $146.9 million related to an adjustment to the forecasted operating results for two IPR&D intangible asset groups and eight Par Pharmaceutical segment products compared to their originally forecasted
99
Table of Contents
operating results at date of acquisition, inclusive of one discontinued product, one partially impaired product primarily due to the contract ending with the partner and a partially impaired IPR&D project from the Par Sterile acquisition due to an adverse court ruling pertaining to related patent litigation. The estimated fair values of the assets were determined by completing updated discounted cash flow models. During the twelve months ended December 31, 2013, we recorded intangible asset impairments totaling approximately $100.1 million for IPR&D classes of products and projects that were evaluated as part of the annual evaluation of indefinite lived intangible assets, as well as five products not expected to achieve their originally forecasted operating results we ceased selling a product that had been acquired with the divested products from the Watson and Actavis Group merger. During the period from January 1, 2012 to September 28, 2012, we abandoned an in-process research and development project that was acquired in the Anchen acquisition and recorded a corresponding intangible asset impairment of $2.0 million, and we exited the market of a commercial product that was acquired in the Anchen acquisition and recorded a corresponding intangible asset impairment of $3.7 million. During the period from July 12, 2012 (inception) to December 31, 2012, we had no impairment charges. We will continue to assess the carrying value of our goodwill and intangible assets in accordance with applicable accounting guidance and may in the future conclude that impairments exist. Events that may lead to future conclusions of impairment include product recalls, product supply issues, additional competition, pricing pressures from customers, competitors or governmental agencies, and/or failure to execute on marketing and sales plans.
As a result of the Par Sterile acquisition on February 20, 2014, we recorded $156.0 million of incremental goodwill. With finalization of purchase price allocation, we had goodwill of $1.0 billion at December 31, 2014. With the finalization of purchase accounting resulted from the Merger, at December 31, 2013 we had goodwill of $856.0 million. In addition, intangible assets, net of accumulated amortization, totaled $1.0 billion at December 31, 2014 and $1.1 billion at December 31, 2013.
Share-based compensation expense
Our stock-based compensation expense is estimated at the grant date, including our stock option grants that are valued using the Black-Scholes model (for options with service and performance conditions) and a Monte Carlo simulation model (for options with a market condition). These option-pricing models require the use of assumptions such as expected volatility. In addition, we estimate the expected forfeiture rate and only recognize expense for those shares expected to vest. We estimate the forfeiture rate based on historical experience. To the extent our actual forfeiture rate is different from our estimate; stock-based compensation expense is adjusted accordingly. Our estimated grant date values and related inputs utilized and other data points are detailed in Note 17, “Share-Based Compensation” to our consolidated financial statements contained elsewhere in this prospectus.
Common stock valuation—February 19, 2014—$1.40
Another major driver of grant date estimated fair value related to our share-based compensation is the estimate of the value of a share of our common stock. In the absence of a public market for our common shares, our board of directors took reasonable actions to make estimates of the fair value of a share of common stock at February 19, 2014 and December 23, 2014, as detailed below.
Our board of directors determined the fair value of our common stock using methodologies, approaches and assumptions consistent with the American Institute of Certified Public Accountants (the “AICPA”), Audit and Accounting Practice Aid Series: Valuation of Privately Held Company Equity Securities Issued as Compensation, or the AICPA Practice Guide using a combination of various methodologies, each of which can be categorized under either of the following two valuation approaches: the income approach and the market approach.
The Income Approach or Discounted Cash Flow Analysis is primarily focused on our expected future operating performance. This approach determines the net present value of future free cash flows using an appropriate discount rate that reflects the risk associated with our business.
100
Table of Contents
The Market Approach is primarily focused on the value of public companies we consider peers and the value of recent market transactions. We identified companies that we considered to be reasonably comparable to us in terms of investment risks and attributes, as well as products provided and markets served. In this analysis, we reviewed valuation multiples and financial performance ratios for selected public companies. We also identified transactions involving the sale of a controlling interest in companies we deemed similar to us, in whole or in part. In this analysis we analyzed the implied valuation multiples paid in such transactions.
As of February 19, 2014, our board of directors, with the assistance of an independent third party valuation specialist firm, determined and approved a fair value for each share of common stock of $1.40.
Factors considered by our board of directors in establishing the fair value of the common stock as of February 19, 2014 included the following: (i) the lack of a public market for our common stock and the uncertainty of such a market developing; (ii) available cash, financial condition and results of operations; (iii) the risks associated with successfully integrating the recently announced Par Sterile acquisition; (iv) the estimated valuation range of $1.30 to $1.79 per common share as provided by the independent third party valuation specialist firm; (v) our expected operating performance; and (vi) market conditions for pharmaceutical company stocks in general.
Our board of directors reconfirmed an estimated fair value for each share of common stock of $1.40 at their May 6, 2014 and August 5, 2014 scheduled quarterly meetings.
Equity contribution from related parties
On February 20, 2014, we received an equity contribution of $110 million from certain investment funds associated with TPG, in conjunction with the Par Sterile acquisition. The equity contribution of $110 million resulted in the issuance of 78,571,429 shares of common stock using the $1.40 as the fair value per share of common stock.
2014 stock option grants
The following table summarizes key data points related to our 2014 stock option grants. Each of the 2014 stock option grants were issued with an exercise price equal to the estimated fair value of a common share of $1.40. Other data points are detailed in Note 17, “Share-Based Compensation” to our consolidated financial statements contained elsewhere in this prospectus.
| Grant date | Number of stock options granted |
|||
| March 13, 2014 |
1,250,000 | |||
| April 1, 2014 |
2,857,143 | |||
| May 9, 2014 |
7,435,000 | |||
| June 13, 2014 |
500,000 | |||
| July 21, 2014 |
480,000 | |||
| August 5, 2014 |
185,714 | |||
|
|
|
|||
| Total—2014 |
12,707,857 | |||
|
|
||||
Our board of directors and management intended all options granted to be exercisable at a price per share equal to the per share fair value of our common stock underlying those options on the date of grant.
Common stock valuation—December 23, 2014—$2.56
As of December 23, 2014, our board of directors, with the assistance of the same independent third party valuation specialist firm, determined and approved a fair value for each share of common stock of $2.56 using similar methodologies described above for the common stock valuation at February 19, 2014.
101
Table of Contents
Factors considered by our board of directors in establishing the fair value of our common stock as of December 23, 2014 and its related increase from February 19, 2014 included the following: (i) the lack of a public market for our common stock; (ii) available cash, financial condition and results of operations since February 19, 2014, including a number of successful product launches in the third and fourth quarters of 2014 as detailed in “—Results of Operations — Year Ended December 31, 2014, Year Ended December 31, 2013, Period from January 1, 2012 to September 28, 2012, and Period from July 12, 2012 (inception) to December 31, 2012 —Revenues (2014 compared to 2013)”; (iii) the success of integrating the Par Sterile acquisition into our operations; (iv) the estimated valuation range of $2.25 to $2.87 per common share as provided by the independent third party valuation specialist firm; (v) our expected operating performance; and (vi) market conditions for pharmaceutical company stocks in general.
Sensitivity analysis
Although we believe that the estimated fair values as determined, approved or reconfirmed at each date noted above by our board of directors are reasonable, and accordingly the grant date fair values of our stock option issuances in 2014 were appropriate at the time of grant, we performed a sensitivity analysis assuming our common stock estimated fair value rose ratably from February 19, 2014 to December 23, 2014, which dates encompass all of the stock option grants during 2014, to quantify the sensitivity of our stock based compensation for the effect of assumed changes in stock price. The sensitivity analysis demonstrated that the potential impact on our 2014 stock based compensation or our total deferred compensation would not be material to our 2014 results of operations, financial position or cash flows.
Common stock valuation - February 3, 2015 - $3.40
In the absence of a public market for our common stock, our board of directors took reasonable actions to make estimates of the fair value of a share of our common stock at February 3, 2015. Our board of directors determined the fair value of our common stock using methodologies, approaches and assumptions consistent with the American Institute of Certified Public Accountants (the “AICPA”), Audit and Accounting Practice Aid Series: Valuation of Privately Held Company Equity Securities Issued as Compensation, or the AICPA Practice Guide. Our board of directors, with the assistance of an independent third party valuation specialist firm, determined and approved a fair value for each share of our common stock of $3.40.
Factors considered by our board of directors in establishing the fair value of our common stock as of February 3, 2015 included the following: (i) our planned initial public offering; (ii) available cash, financial condition and results of operations since December 23, 2014, the date of the most recent common stock valuation at the time, including the continuing success of a number of products that launched in 2014; (iii) the continued success of integrating the Par Sterile acquisition into our operations; (iv) the estimated valuation range of $3.13 to $3.68 per share of common stock as derived from a report by the independent third party valuation specialist firm; (v) our expected operating performance; and (vi) market conditions for pharmaceutical company stocks in general.
2015 stock option grants
Effective as of January 26, 2015, our board of directors authorized grants of options to purchase approximately 2.8 million shares of our common stock to certain employees pursuant to the 2012 EIP at an exercise price of $2.56, the most recent common stock valuation at the time. The estimated fair market value of our common stock used in the valuation of these stock option grants for financial reporting purposes was $3.40, since this estimated fair value of a share of our common stock was available in close proximity to the January 26, 2015 grant date and our planned initial public offering in the near future. Our estimated grant date values and
102
Table of Contents
related inputs utilized are detailed in Note 17, “Share-based Compensation” to our condensed consolidated financial statements contained elsewhere in this prospectus.
Contingencies and legal fees
We are subject to various patent litigations, product liability litigations, government investigations and other legal proceedings in the ordinary course of business. Legal fees and other expenses related to litigation are expensed as incurred and included in selling, general and administrative expenses. Contingent accruals are recorded when we determine that a loss is both probable and reasonably estimable. Due to the fact that legal proceedings and other contingencies are inherently unpredictable, our assessments involve significant judgment regarding future events. During the year ended December 31, 2014 we recorded an incremental provision of $91.0 million related to the settlement of omeprazole/sodium bicarbonate patent litigation for $100.0 million. In the year ended December 31, 2013, we provided for an additional $26.0 million as we continued to periodically assess and estimate our remaining potential liability for AWP actions. The amount provided for in 2013 represents the settlement of AWP actions in the States of Illinois, Kansas and Utah totaling $32.4 million less amounts accrued prior to 2013.
Income taxes
We prepare and file tax returns based on our interpretation of tax laws and regulations and record estimates based on these judgments and interpretations. In the normal course of business, our tax returns are subject to examination by various taxing authorities, which may result in future tax, interest, and penalty assessments by these authorities. Inherent uncertainties exist in estimates of many tax positions due to changes in tax law resulting from legislation, regulation, and/or as concluded through the various jurisdictions’ tax court systems. We recognize the tax benefit from an uncertain tax position only if it is more likely than not that the tax position will be sustained on examination by the taxing authorities, based on the technical merits of the position. The tax benefits recognized in our financial statements from such a position are measured based on the largest benefit that has a greater than 50 percent likelihood of being realized upon ultimate resolution. The amount of unrecognized tax benefits is adjusted for changes in facts and circumstances. For example, adjustments could result from significant amendments to existing tax law and the issuance of regulations or interpretations by the taxing authorities, new information obtained during a tax examination, or resolution of an examination. We believe that our estimates for uncertain tax positions are appropriate and sufficient to pay assessments that may result from examinations of our tax returns. We recognize both accrued interest and penalties related to unrecognized tax benefits in income tax expense.
We have recorded valuation allowances against certain of our deferred tax assets, primarily those that have been generated from certain state net operating losses in certain taxing jurisdictions. In evaluating whether we would more likely than not recover these deferred tax assets, we have not assumed any future taxable income or tax planning strategies in the jurisdictions associated with these carryforwards where history does not support such an assumption. Implementation of tax planning strategies to recover these deferred tax assets or future income generation in these jurisdictions could lead to the reversal of these valuation allowances and a reduction of income tax expense. When evaluating valuation allowances, management utilizes forecasted financial information.
We believe that our estimates for the uncertain tax positions and valuation allowances against the deferred tax assets are appropriate based on current facts and circumstances.
Use of estimates in reserves
We believe that our reserves, allowances and accruals for items that are deducted from gross revenues are reasonable and appropriate based on current facts and circumstances. It is possible however, that other parties
103
Table of Contents
applying reasonable judgment to the same facts and circumstances could develop different allowance and accrual amounts for items that are deducted from gross revenues. Additionally, changes in actual experience or changes in other qualitative factors could cause our allowances and accruals to fluctuate, particularly with newly launched or acquired products. We review the rates and amounts in our allowance and accrual estimates on a quarterly basis. If future estimated rates and amounts are significantly greater than those reflected in our recorded reserves, the resulting adjustments to those reserves would decrease our reported net revenues; conversely, if actual product returns, rebates and chargebacks are significantly less than those reflected in our recorded reserves, the resulting adjustments to those reserves would increase our reported net revenues. If we were to change our assumptions and estimates, our reserves would change, which would impact the net revenues that we report. We regularly review the information related to these estimates and adjust our reserves accordingly, if and when actual experience differs from previous estimates.
Use of forecasted financial information in accounting estimates
The use of forecasted financial information is inherent in many of our accounting estimates, including determining the estimated fair value of goodwill and intangible assets, matching intangible amortization to underlying benefits (e.g. sales and cash inflows), establishing and evaluating inventory reserves, and evaluating the need for valuation allowances for deferred tax assets. Such forecasted financial information is based on numerous assumptions, including:
| • | our ability to achieve, and the timing of, FDA approval for pipeline products; |
| • | our ability to successfully commercialize products in a highly competitive marketplace; |
| • | the competitive landscape—including the number of competitors for a product at its introduction to the market and throughout its product lifecycle and the impact of such competition on both sales volume and price; |
| • | our market share and our competitors’ market share; |
| • | our ability to execute and maintain agreements related to contract-manufactured products (which are manufactured for us by third-parties under contract) and licensed products (which are licensed to us from third-party development partners); |
| • | the ability of our third party partners and suppliers to adequately perform their contractual obligations; |
| • | our ability to maintain adequate product supply to meet market demand; |
| • | the reimbursement landscape and its impact on pricing power; and |
| • | the product lifecycle, which for generic products is generally relatively short (2-10 years), and which for branded products is generally longer (8-12 years). |
We believe that our financial forecasts are reasonable and appropriate based upon current facts and circumstances. It is possible however, that other parties applying reasonable judgment to the same facts and circumstances could develop different forecasts and that the application of those forecasts could result in different valuations of certain assets on our balance sheet. Additionally, differences in actual experience versus forecasted experience could cause our valuations of certain assets to fluctuate. These differences may be more prevalent in products that are newly launched, products that are newly acquired, and products that are at the end of their lifecycles or remaining contractual terms of any supply and distribution agreements including authorized generic agreements. We regularly review the information related to these forecasts and adjust the carrying amounts of the applicable assets accordingly, if and when actual results differ from previous estimates.
104
Table of Contents
Recent accounting pronouncements:
In April 2014, the FASB issued ASU 2014-08, “Reporting Discontinued Operations and Disclosures of Disposals of Components of an Entity” (“ASU 2014-08”). ASU 2014-08 amends guidance for reporting discontinued operations and disposals of components of an entity. Under the new guidance, only disposals representing a strategic shift in operations should be presented as discontinued operations. Those strategic shifts should have a major effect on the organization’s operations and financial results. Examples include a disposal of a major geographic area, a major line of business, or a major equity method investment. The new guidance requires expanded disclosures about discontinued operations that will provide financial statement users with more information about the assets, liabilities, income, and expenses of discontinued operations. The guidance also expands the disclosure of the pre-tax income attributable to a disposal of a significant part of an organization that does not qualify for discontinued operations reporting. This disclosure is intended to provide users with information about the ongoing trends in a reporting organization’s results from continuing operations. ASU 2014-08 is effective prospectively for fiscal years, and interim reporting periods within those years, beginning after December 15, 2014 with early adoption permitted only for disposals that have not been previously reported. We currently do not anticipate an impact of ASU 2014-08 on our consolidated financial statements and related disclosures.
In May 2014, the FASB issued ASU 2014-09, “Revenue from Contracts with Customers” (“ASU 2014-09”). ASU 2014-09 supersedes nearly all existing revenue recognition guidance under accounting principles generally accepted in the United States of America. ASU 2014-09 affects any entity that either enters into contracts with customers to transfer goods or services or enters into contracts for the transfer of nonfinancial assets unless those contracts are within the scope of other standards (e.g., insurance contracts or lease contracts). The core principle of ASU 2014-09 is to recognize revenues to depict the transfer of promised goods or services to customers in an amount that reflects the consideration that is expected to be received for those goods or services. ASU 2014-09 defines a five step process to achieve this core principle: 1) identify the contract with a customer, 2) identify the separate performance obligations in the contract, 3) determine the transaction price, 4) allocate the transaction price to the separate performance obligations in the contract, and 5) recognize revenue when (or as) the entity satisfies a performance obligation. ASU 2014-09 is effective for annual reporting periods beginning after December 15, 2016. Early adoption is not permitted. ASU 2014-09 can be applied retrospectively to each prior reporting period presented or retrospectively with the cumulative effect of the change recognized at the date of the initial application in retained earnings or accumulated deficit. We are currently evaluating the impact of ASU 2014-09 on our consolidated financial statements and related disclosures and we have not yet selected a transition method.
In August 2014, the FASB issued ASU 2014-15, “Presentation of Financial Statements-Going Concern (Subtopic 205-40): Disclosure of Uncertainties about an Entity’s Ability to Continue as a Going Concern” (“ASU 2014-15”), which defines management’s responsibility to assess an entity’s ability to continue as a going concern, and to provide related footnote disclosures if there is substantial doubt about its ability to continue as a going concern. The pronouncement is effective for annual reporting periods ending after December 15, 2016 with early adoption permitted. We currently do not anticipate an impact of ASU 2014-15 on our consolidated financial statements and related disclosures.
In November 2014, the FASB issued ASU 2014-17, “Business Combinations (Topic 805): Pushdown Accounting” (“ASU 2014-17”). The amendments in ASU 2014-17 provide an acquired entity with an option to apply pushdown accounting in its separate financial statements upon occurrence of an event in which an acquirer obtains control of the acquired entity. The pronouncement is effective for annual reporting periods ending after November 14, 2014 with early adoption permitted. There is no impact from ASU 2014-17 on our consolidated financial statements and related disclosures.
105
Table of Contents
Financial condition
Liquidity and capital resources
Three months ended March 31, 2015 and three months ended March 31, 2014
| Three months ended | ||||||||
| ($ in thousands) | March 31, 2015 |
March 31, 2014 |
||||||
| Cash and cash equivalents at beginning of period |
$ | 244,440 | $ | 130,080 | ||||
| Net cash provided by operating activities |
100,207 | 89,139 | ||||||
| Net cash used in investing activities |
(51,285 | ) | (490,859 | ) | ||||
| Net cash (used in) provided by financing activities |
(107,482 | ) | 492,200 | |||||
|
|
|
|||||||
| Net (decrease) increase in cash and cash equivalents |
$ | (58,560 | ) | $ | 90,480 | |||
|
|
|
|||||||
| Cash and cash equivalents at end of period |
$ | 185,880 | $ | 220,560 | ||||
|
|
||||||||
Cash provided in operations for the three months ended March 31, 2015 primarily reflected gross margin dollars (excluding amortization) generated from revenues. Refer below for further details of operating cash flows.
Cash flows used in investing activities for the three months ended March 31, 2015 were primarily driven by the Par Biosciences and Innoteq acquisitions and a purchase of an intangible asset, combined with capital expenditures.
Cash used in financing activities for the three months ended March 31, 2015 primarily represented a dividend-equivalent payment to stock option holders, fees for new debt borrowings and debt principal payments, tempered by the proceeds from new borrowings used to partially fund the Dividend Recapitalization.
Our working capital, current assets minus current liabilities, of $284.8 million at March 31, 2015 decreased approximately $90.0 million from $375.2 million at December 31, 2014, which primarily reflects the cash used to fund our first quarter 2015 acquisitions coupled with cash used to fund the Dividend Recapitalization. The working capital ratio, which is calculated by dividing current assets by current liabilities, was 2.21x at March 31, 2015 compared to 2.35x at December 31, 2014. We believe that our working capital ratio indicates the ability to meet our ongoing and foreseeable obligations for at least the next 12 fiscal months.
Detail of operating cash Flows
| Three months ended | ||||||||
| ($ in thousands) | March 31, 2015 |
March 31, 2014 |
||||||
| Cash received from customers, royalties and other |
$ | 466,705 | $ | 368,423 | ||||
| Cash paid to distribution partners |
(65,458 | ) | (77,692 | ) | ||||
| Cash paid for inventory |
(66,282 | ) | (47,019 | ) | ||||
| Cash paid to employees |
(91,729 | ) | (32,329 | ) | ||||
| Cash paid to all other suppliers and third parties |
(109,465 | ) | (100,892 | ) | ||||
| Interest paid, net |
(17,735 | ) | (13,631 | ) | ||||
| Income taxes paid, net |
(15,829 | ) | (7,721 | ) | ||||
|
|
|
|||||||
| Net cash provided by operating activities |
$ | 100,207 | $ | 89,139 | ||||
|
|
||||||||
Sources of liquidity
Our primary source of liquidity is cash received from customers. The increase in net cash related to operating activities for the three months ended March 31, 2015 as compared to 2014 resulted primarily from increased
106
Table of Contents
cash received from customers from increased gross margin dollars generated by increased revenues, tempered by cash paid to employees in the form of annual bonuses and special discretionary dividend-equivalent bonuses.
Our ability to continue to generate cash from operations is predicated not only on our ability to maintain a sustainable amount of sales of our current product portfolio, but also our ability to monetize our product pipeline and future products that we may acquire. Our future profitability depends, to a significant extent, upon our ability to introduce, on a timely basis, new generic products that are either the first to market (or among the first to market) or otherwise can gain significant market share. No assurances can be given that we or any of our strategic partners will successfully complete the development of any of these potential products either under development or proposed for development, that regulatory approvals will be granted for any such product, that any approved product will be produced in commercial quantities or that any approved product will be sold profitably. Commercializing brand pharmaceutical products is more costly than generic products. We cannot be certain that any of our branded product expenditures will result in the successful development or launch of branded product that will prove to be commercially successful or will improve the long-term profitability of our business.
Another source of available liquidity is our Senior Credit Facilities that include a five-year revolving credit facility in an initial amount of $150.0 million. The Senior Credit Facilities are more fully described in the “Description of indebtedness” section below. There were no outstanding borrowings from the revolving credit facility as of March 31, 2015.
Uses of liquidity
Our uses of liquidity and future and potential uses of liquidity include the following:
| • | Dividend paid of $494.3 million as part of the Dividend Recapitalization. |
| • | $36.5 million of dividend-equivalent payments to stock option holders as part of the Dividend Recapitalization. |
| • | $34.8 million in first quarter of 2015 for our acquisition of Innoteq and Par Biosciences, net of cash acquired. |
| • | Business development activities, including the acquisition of product rights, which are typically in a range near $40.0 million annually. As of March 31, 2015, the total potential future payments that ultimately could be due under existing agreements related to products in various stages of development were approximately $13.7 million. This amount is exclusive of contingent payments tied to the achievement of sales milestones, which cannot be determined at this time and would be funded through future revenue streams. |
| • | Capital expenditures of approximately $50.0 million are planned for 2015. |
| • | Potential liabilities related to the outcomes of litigation, or the outcomes of investigations by federal authorities. In the event that we experience a significant loss, such loss may result in a material impact on our liquidity or financial condition when such liability is paid. |
| • | Cash paid for inventory purchases as detailed in “—Details of operating cash flows” above. |
| • | Cash paid to all other suppliers and third parties as detailed in “—Details of operating cash flows” above. |
| • | Cash compensation paid to employees as detailed in “—Details of operating cash flows” above. |
| • | Potential liabilities related to the outcomes of audits by regulatory agencies like the IRS. In the event that our loss contingency is ultimately determined to be higher than originally accrued, the recording of the additional liability may result in a material impact on our liquidity or financial condition when such additional liability is paid. |
107
Table of Contents
| • | Normal course payables due to distribution agreement partners of approximately $44.8 million as of March 31, 2015 related primarily to amounts due under profit sharing agreements. We paid substantially all of the $44.8 million during the first two months of the second quarter of 2015. The risk of lower cash receipts from customers due to potential decreases in revenues associated with competition or supply issues related to partnered products would be generally mitigated by proportional decreases in amounts payable to distribution agreement partners. |
We believe that we will be able to monetize our current product portfolio, our product pipeline, and future product acquisitions and generate sufficient operating cash flows that, along with existing cash, cash equivalents and available for sale securities, will allow us to meet our financial obligations over the foreseeable future. We expect to continue to fund our operations, including our research and development activities, capital projects, in-licensing product activity and obligations under our existing distribution and development arrangements discussed herein, out of our working capital and funds available under our Senior Credit Facilities.
Contractual obligations as of March 31, 2015
The dollar values of our material contractual obligations and commercial commitments as of March 31, 2015 were as follows ($ in thousands):
| Amounts due by period | ||||||||||||||||||||||||
| Obligation | Total monetary obligations |
2015 | 2016 to 2017 |
2018 to 2019 |
2020 and |
Other |
||||||||||||||||||
| Operating leases |
$ | 34,920 | $ | 5,201 | $ | 9,891 | $ | 7,001 | $ | 12,827 | $ | — | ||||||||||||
| Senior credit facilities |
1,856,148 | 14,065 | 37,506 | 1,804,577 | — | — | ||||||||||||||||||
| 7.375% senior notes |
490,000 | — | — | — | 490,000 | — | ||||||||||||||||||
| Interest payments |
564,729 | 97,944 | 233,656 | 204,520 | 28,609 | — | ||||||||||||||||||
| Fees related to credit facilities |
2,597 | 656 | 1,722 | 219 | — | — | ||||||||||||||||||
| Purchase obligations(1) |
223,946 | 223,946 | — | — | — | — | ||||||||||||||||||
| Tax liabilities(2) |
18,573 | — | — | — | — | 18,573 | ||||||||||||||||||
| TPG Management fee(3) |
31,000 | 3,000 | 8,000 | 8,000 | 12,000 | — | ||||||||||||||||||
| Severance payments |
76 | 76 | — | — | — | — | ||||||||||||||||||
| Other |
556 | 556 | — | — | — | — | ||||||||||||||||||
|
|
|
|||||||||||||||||||||||
| Total obligations |
$ | 3,222,545 | $ | 345,444 | $ | 290,775 | $ | 2,024,317 | $ | 543,436 | $ | 18,573 | ||||||||||||
|
|
||||||||||||||||||||||||
| (1) | Purchase obligations consist of both cancelable and non-cancelable inventory and non-inventory items. |
| (2) | The difference between a tax position taken or expected to be taken in a tax return and the benefit recognized and measured pursuant to ASC 740-10, “Income Taxes” represents an unrecognized tax benefit. An unrecognized tax benefit is a liability that represents a potential future obligation to the taxing authorities. As of March 31, 2015, the amount represents unrecognized tax benefits, interest and penalties based on evaluation of tax positions and concession on tax issues challenged by the IRS. We do not expect to make a significant tax payment related to these long-term liabilities within the next year; however, we cannot estimate in which period thereafter such tax payments may occur. For presentation on the table above, we include the related long-term liability in the “Other” column. |
| (3) | In connection with the Merger, the Company entered into a management services agreement with the Manager. Pursuant to such agreement, and in exchange for on-going consulting and management advisory services, the Manager has a right to an annual monitoring fee paid quarterly equal to 1% of EBITDA as defined under the credit agreement for the Term Loan Facility that is part of our Senior Credit Facilities. There is an annual cap of $4.0 million for this fee. The Manager is also entitled to receive reimbursement for out-of-pocket expenses incurred in connection with services provided pursuant to the agreement. In connection with an initial public offering, the Manager will be entitled to receive, on its request and in lieu of any continuing payment of an annual monitoring fee, an aggregate termination fee of approximately $30 million. |
108
Table of Contents
Year ended December 31, 2014, year ended December 31, 2013
| For the years ended | For the period | |||||||||||||||||
| December 31, 2014 |
December 31, 2013 |
July 12, 2012 to December 31, 2012 |
January 1, 2012 to September 28, 2012 |
|||||||||||||||
| ($ in thousands) | (Successor) | (Successor) | (Successor) | (Predecessor) | ||||||||||||||
| Cash and cash equivalents at beginning of period |
$ | 130,080 | $ | 38,864 | $ | 278,879 | $ | 162,516 | ||||||||||
| Net cash provided by (used in) operating activities |
145,245 | 113,045 | (54,745 | ) | 153,760 | |||||||||||||
| Net cash used in investing activities |
(519,575 | ) | (12,198 | ) | (2,026,531 | ) | (46,602 | ) | ||||||||||
| Net cash provided by (used in) financing activities |
488,690 | (9,631 | ) | 1,841,261 | 9,205 | |||||||||||||
|
|
|
|
|
|||||||||||||||
| Net increase (decrease) in cash and cash equivalents |
$ | 114,360 | $ | 91,216 | $ | (240,015 | ) | $ | 116,363 | |||||||||
|
|
|
|
|
|||||||||||||||
| Cash and cash equivalents at end of period |
$ | 244,440 | $ | 130,080 | $ | 38,864 | $ | 278,879 | ||||||||||
|
|
||||||||||||||||||
Discussion of liquidity for the year ended and as of December 31, 2014
Cash provided by operations for the year ended December 31, 2014, reflects gross margin dollars (excluding amortization) generated from revenues coupled with collection of accounts receivables. Refer below for further details of operating cash flows.
Cash flows used in investing activities were primarily driven by the Par Sterile acquisition plus capital expenditures.
Cash provided by financing activities for the year ended December 31, 2014, primarily represented new debt borrowings under our Senior Credit Facilities plus a capital contribution from the Company less debt principal payments to reprice our Senior Credit Facilities coupled with other debt principal payments.
Our working capital (current assets minus current liabilities) of $375.0 million at December 31, 2014 increased approximately $168.0 million from $207.0 million at December 31, 2013, which primarily reflects the cash generated by operations coupled with increases in other working capital items. The working capital ratio, which is calculated by dividing current assets by current liabilities, was 2.35x at December 31, 2014 compared to 1.80x at December 31, 2013. We believe that our working capital ratio indicates the ability to meet our ongoing and foreseeable obligations for at least the next twelve fiscal months.
109
Table of Contents
Detail of operating cash flows
| For the years ended | For the Period | |||||||||||||||||
| December 31, 2014 |
December 31, 2013 |
July 12, 2012 to December 31, 2012 |
January 1, 2012 to September 28, 2012 |
|||||||||||||||
| ($ in thousands) | (Successor) | (Successor) | (Successor) | (Predecessor) | ||||||||||||||
| Cash received from customers, royalties and other |
$ | 1,493,521 | $ | 1,236,464 | $ | 275,079 | $ | 867,848 | ||||||||||
| Cash paid for inventory |
(272,731 | ) | (233,631 | ) | (50,356 | ) | (136,440 | ) | ||||||||||
| Cash paid to employees |
(127,987 | ) | (82,440 | ) | (48,034 | ) | (70,943 | ) | ||||||||||
| Payment to DOJ |
— | (46,071 | ) | — | — | |||||||||||||
| Payment related to AWP |
(32,350 | ) | (7,200 | ) | — | (23,883 | ) | |||||||||||
| Payment related to omeprazole litigation settlement |
(100,000 | ) | — | — | — | |||||||||||||
| Cash paid to distribution partners |
(288,149 | ) | (303,426 | ) | (58,747 | ) | (247,894 | ) | ||||||||||
| Cash paid to all other suppliers and third parties |
(390,539 | ) | (349,833 | ) | (163,978 | ) | (228,768 | ) | ||||||||||
| Interest paid, net |
(97,305 | ) | (85,916 | ) | (13,756 | ) | (6,615 | ) | ||||||||||
| Income taxes received, net |
(39,215 | ) | (14,902 | ) | 5,047 | 455 | ||||||||||||
|
|
|
|
|
|||||||||||||||
| Net cash provided by (used in) operating activities |
$ | 145,245 | $ | 113,045 | $ | (54,745 | ) | $ | 153,760 | |||||||||
|
|
||||||||||||||||||
Sources of liquidity
Our primary source of liquidity is cash received from customers. The increase in net cash provided by operating activities for the year ended December 31, 2014 as compared to 2013 resulted primarily from increased cash received from customers from increased gross margin dollars generated by increased revenues, tempered by the $100.0 million settlement of the omeprazole/sodium bicarbonate patent litigation coupled with other cash outflows detailed above. Our ability to continue to generate cash from operations is predicated not only on our ability to maintain a sustainable amount of sales of our current product portfolio, but also our ability to monetize our product pipeline and future products that we may acquire. Our future profitability depends, to a significant extent, upon our ability to introduce, on a timely basis, new generic products that are either the first to market (or among the first to market) or otherwise can gain significant market share. No assurances can be given that we or any of our strategic partners will successfully complete the development of any of these potential products either under development or proposed for development, that regulatory approvals will be granted for any such product, that any approved product will be produced in commercial quantities or that any approved product will be sold profitably. Commercializing brand pharmaceutical products is more costly than generic products. We cannot be certain that any of our branded product expenditures will result in the successful development or launch of branded product that will prove to be commercially successful or will improve the long-term profitability of our business.
Another source of available liquidity is our Senior Credit Facilities that include a five-year revolving credit facility in an initial amount of $150.0 million. The Senior Credit Facilities are more fully described in the “Description of indebtedness” section below. There were no outstanding borrowings from the revolving credit facility as of December 31, 2014.
110
Table of Contents
Uses of liquidity
Our uses of liquidity and future and potential uses of liquidity include the following:
| • | Approximately $490.0 million in first quarter of 2014 for the Par Sterile acquisition. |
| • | $100.0 million settlement of the omeprazole/sodium bicarbonate patent litigation in the third quarter of 2014. |
| • | Business development activities, including the acquisition of product rights, which are typically in a range near $40.0 million annually. As of December 31, 2014, the total potential future payments that ultimately could be due under existing agreements related to products in various stages of development were approximately $13.8 million. This amount is exclusive of contingent payments tied to the achievement of sales milestones, which cannot be determined at this time and would be funded through future revenue streams. |
| • | Capital expenditures of approximately $50.0 million are planned for 2015. |
| • | Potential liabilities related to the outcomes of litigation, such as the AWP matters, or the outcomes of investigations by federal authorities, such as the DOJ. In the event that we experience a significant loss, such loss may result in a material impact on our liquidity or financial condition when such liability is paid. |
| • | Cash paid for inventory purchases as detailed in “—Detail of operating cash flows” above. |
| • | Cash paid to all other suppliers and third parties as detailed in “—Detail of operating cash flows” above. |
| • | Cash compensation paid to employees as detailed in “—Detail of operating cash flows” above. |
| • | Potential liabilities related to the outcomes of audits by regulatory agencies like the United States Internal Revenue Service (“IRS”). In the event that our loss contingency is ultimately determined to be higher than originally accrued, the recording of the additional liability may result in a material impact on our liquidity or financial condition when such additional liability is paid. |
| • | Normal course payables due to distribution agreement partners of approximately $53.0 million as of December 31, 2014 related primarily to amounts due under profit sharing agreements. We paid substantially all of the $53.0 million during the first two months of the first quarter of 2015. The risk of lower cash receipts from customers due to potential decreases in revenues associated with competition or supply issues related to partnered products would be generally mitigated by proportional decreases in amounts payable to distribution agreement partners. |
We believe that we will be able to monetize our current product portfolio, our product pipeline, and future product acquisitions and generate sufficient operating cash flows that, along with existing cash, cash equivalents and available for sale securities, will allow us to meet our financial obligations over the foreseeable future. We expect to continue to fund our operations, including our research and development activities, capital projects, in-licensing product activity and obligations under our existing distribution and development arrangements discussed herein, out of our working capital and funds available under the Senior Credit Facilities.
111
Table of Contents
Contractual obligations as of December 31, 2014
The dollar values of our material contractual obligations and commercial commitments as of December 31, 2014 were as follows ($ in thousands):
| Amounts due by period | Other | |||||||||||||||||||||||
| Obligation | Total monetary obligations |
2015 | 2016 to 2017 | 2018 to 2019 | 2020 and thereafter |
|||||||||||||||||||
| Operating leases |
33,940 | 6,329 | 8,669 | 6,415 | 12,527 | — | ||||||||||||||||||
| Senior credit facilities(1) |
1,435,837 | 14,503 | 29,006 | 1,392,328 | — | — | ||||||||||||||||||
| 7.375% senior notes |
490,000 | — | — | — | 490,000 | — | ||||||||||||||||||
| Interest payments |
507,547 | 100,032 | 197,667 | 173,710 | 36,138 | — | ||||||||||||||||||
| Fees related to credit facilities |
2,971 | 875 | 1,721 | 250 | 125 | — | ||||||||||||||||||
| Purchase obligations(2) |
165,056 | 165,056 | — | — | — | — | ||||||||||||||||||
| Tax liabilities(3) |
16,627 | — | — | — | — | 16,627 | ||||||||||||||||||
| Management fee(4) |
28,000 | 4,000 | 8,000 | 8,000 | 8,000 | — | ||||||||||||||||||
| Severance payments |
502 | 502 | — | — | — | — | ||||||||||||||||||
| Other |
1,242 | 1,242 | — | — | — | — | ||||||||||||||||||
|
|
|
|
|
|
|
|
|
|
|
|
|
|||||||||||||
| Total obligations |
$ | 2,681,722 | $ | 292,539 | $ | 245,063 | $ | 1,580,703 | $ | 546,790 | $ | 16,627 | ||||||||||||
|
|
|
|
|
|
|
|
|
|
|
|
|
|||||||||||||
|
|
||||||||||||||||||||||||
| (1) | Excludes amendments to Senior Credit Facilities entered into in February 2015. See “—Recent Developments.” |
| (2) | Purchase obligations consist of both cancelable and non-cancelable inventory and non-inventory items. |
| (3) | The difference between a tax position taken or expected to be taken in a tax return and the benefit recognized and measured pursuant to ASC 740-10 Income Taxes represents an unrecognized tax benefit. An unrecognized tax benefit is a liability that represents a potential future obligation to the taxing authorities. As of December 31, 2014, the amount represents unrecognized tax benefits, interest and penalties based on evaluation of tax positions and concession on tax issues challenged by the IRS. We do not expect to make a significant tax payment related to these long-term liabilities within the next year; however, we cannot estimate in which period thereafter such tax payments may occur. For presentation on the table above, we include the related long-term liability in the “Other” column. |
| (4) | In connection with the Merger, we entered into a management services agreement with the Manager. Pursuant to such agreement, and in exchange for on-going consulting and management advisory services, the Manager has a right to an annual monitoring fee paid quarterly equal to 1% of EBITDA as defined under the credit agreement for the term loan facility that is part of our Senior Credit Facilities. There is an annual cap of $4.0 million for this fee. The Manager is also entitled to receive reimbursement for out-of-pocket expenses incurred in connection with services provided pursuant to the agreement |
Financing
In conjunction with the closing of the Merger, Par Pharmaceutical Companies entered into the Tranche B Term Loans and a revolving credit facility and, additionally, in conjunction with the Merger, Par Pharmaceutical Companies issued the Notes. See “Description of indebtedness” for further details on the Tranche B Term Loans, revolving credit facility and the Notes. For additional information, refer to the credit agreements, indentures and related agreements filed as exhibits to this prospectus.
Senior credit facilities
Our Senior Credit Facilities consist of a $127.5 million Tranche B Revolving Credit Facility, which will mature on December 28, 2017; a $22.5 million Tranche A Revolving Credit Facility, which will mature on September 28, 2017; a $1,450 million Tranche B-2 Term Loan, which will mature on September 28, 2019; and a $425.0 million Incremental B-3 Term Loan, which will mature on September 28, 2019. The Senior Credit Facilities were amended in February 2015. See “— Recent developments” for a discussion of the amendments to the Senior Credit Facilities.
112
Table of Contents
On February 20, 2014 we drew in full on our $1,066 million Original Tranche B-2 Term Loan and used the proceeds therefrom to repay in full our Tranche B-1 Term Loan in connection with a repricing thereof, which had been incurred itself to repay in full our Tranche B Term Loan in a repricing of its interest rate outstanding at the time. Further, on February 20, 2014 we performed an incremental borrowing of an additional $395.0 million of Tranche B-2 Term Loans for the purpose of consummating the acquisition of Par Sterile. Additionally, on February 25, 2015 we drew in full our $425.0 million Incremental B-3 Term Loan to pay the Dividend Recapitalization and related fees and expenses. As of December 31, 2014, we had no outstanding balance under the Revolving Credit Facility.
Per the maturity dates set forth above, we believe that we do not currently face a substantial refinancing risk. However, upon the occurrence of certain events, such as a change of control or a violation of certain covenants in the Senior Credit Facilities, we could be required to repay or refinance our indebtedness. See “Risk factors — Risks related to our indebtedness — The substantial indebtedness of our indirect subsidiary, Par Pharmaceutical Companies, could adversely affect our ability to raise additional capital to fund our operations, limit our ability to react to changes in the economy or our industry and prevent us from meeting obligations on our indebtedness.”
Borrowings under each portion of the Senior Credit Facilities bear an interest at a base rate or at LIBOR, as elected by us, plus an applicable margin. The base rate is determined by reference to the higher of (i) the prime rate of Bank of America, N.A., (ii) the federal funds effective rate plus 0.50% and (iii) the one-month London interbank market rate plus 1.00% (the “base rate”). The base rate with respect to the term loans under the Senior Credit Facilities is subject to a 2.00% floor. The LIBOR rate is determined by reference to the interest rate for dollar deposits in the London interbank market for the interest period relevant to such borrowings. The base rate with respect to the term loans under the Senior Credit Facilities is subject to a 1.00% floor. The below table outlines the applicable margin for each credit facility.
| Applicable rate (per annum) | ||||||||
| Facility | LIBOR rate borrowings | Base borrowings | ||||||
| Tranche B Revolving Credit Facility |
3.25% | 2.25% | ||||||
| Tranche A Revolving Credit Facility |
3.75% | 2.75% | ||||||
| Tranche B-2 Term Loan |
3.00% | 2.00% | ||||||
| Incremental B-3 Term Loan |
3.25% | 2.25% | ||||||
|
|
||||||||
At December 31, 2014, the interest rate on the Tranche B-2 Term Loan was 4.0%. We must repay each of the term loans under the Senior Credit Facilities in quarterly installments equal to 0.25% of the original principal amount of the respective loan. The remaining amount of each of the term loans under the Senior Credit Facilities is due in full at maturity. We are also required to pay a commitment fee to the lenders under our Revolving Credit Facility in respect of the unused commitments thereunder of 0.50%.
The Senior Credit Facilities contain certain customary representations and warranties, affirmative covenants, events of default and various restrictive covenants, which are subject to certain significant exceptions.
7.375% senior notes
On September 28, 2012, Par Pharmaceutical Companies issued $490.0 million aggregate principal amount of the senior notes (the “Notes”). At December 31, 2014, Par Pharmaceutical Companies had $490.0 million outstanding of the Notes. Interest on the Notes is payable on April 15 and October 15 of each year and is payable in cash.
The Notes are unconditionally guaranteed, jointly and severally, by each of Par Pharmaceutical Companies’ current and future wholly-owned domestic restricted subsidiaries that guarantee the Senior Credit Facilities.
113
Table of Contents
Each guarantee issued in respect of the Notes is automatically released upon, without limitation, the release of the corresponding guarantee of the Senior Credit Facilities. We anticipate that Par Pharmaceutical Holdings, Inc. will become a guarantor under the Notes after the completion of this offering.
The indenture for the Notes contains various restrictive covenants, which are subject to certain significant exceptions. As of March 31, 2015, we believe that Par Pharmaceutical Companies was in compliance with all covenants and the provisions contained in the indenture for the Notes.
Quantitative and qualitative disclosures about market risk
Senior credit facilities
In connection with the Merger and related transactions, on September 28, 2012 we entered into the Senior Credit Facilities comprised of the seven-year Term Loan Facility in an initial aggregate principal amount of $1,055 million and the five-year Revolving Facility in an initial amount of $150 million. The proceeds of the Revolving Facility are available for general corporate purposes. Refer to Note 14, “Debt” in our consolidated financial statements included elsewhere in this prospectus for further information.
Borrowings under the Senior Credit Facilities bear interest at a rate per annum equal to an applicable margin plus, at our option, either LIBOR (which is subject to a 1.00% floor) or the base rate (which is subject to a 2.00% floor). During the fourth quarter of 2014, the effective interest rate on the seven-year Term Loan Facility was 4.00%, representing the 1.00% LIBOR floor plus 300 basis points. We are also obligated to pay a commitment fee based on the unused portion of the Revolving Facility. Repayments of the proceeds of the Term Loan Facility are due in quarterly installments over the term of the credit agreement governing our Senior Credit Facilities. Amounts borrowed under the Revolving Facility would be payable in full upon expiration of the credit agreement governing our Senior Credit Facilities.
If the three month LIBOR spot rate was to increase or decrease by 0.125% from current rates, interest expense would not change due to application of the 1.00% floor previously mentioned.
The following table summarizes the carrying value of our Senior Credit Facilities that subject us to market risk (interest rate risk) at December 31, 2014 and December 31, 2013:
| December 31, 2014 | December 31, 2013 | |||||||
| ($ in thousands) | (Successor) | (Successor) | ||||||
| Senior secured term loan |
$ | 1,435,837 | $ | 1,055,340 | ||||
| Senior secured revolving credit facility |
— | — | ||||||
| 7.375% senior notes |
490,000 | 490,000 | ||||||
|
|
|
|||||||
| 1,925,837 | 1,545,340 | |||||||
| Less unamortized debt discount to senior secured term loan |
(7,265 | ) | (7,821 | ) | ||||
| Less current portion |
(14,503 | ) | (21,462 | ) | ||||
|
|
|
|||||||
| Long-term debt |
$ | 1,904,069 | $ | 1,516,057 | ||||
|
|
||||||||
| Debt Maturities as of December 31, 2014 | ($ amounts in thousands) | |||
| 2015 |
$ | 14,503 | ||
| 2016 |
14,503 | |||
| 2017 |
14,503 | |||
| 2018 |
14,503 | |||
| 2019 |
1,377,825 | |||
| 2020 |
490,000 | |||
|
|
|
|||
| Total debt at December 31, 2014 |
$ | 1,925,837 | ||
|
|
||||
114
Table of Contents
Our company
We are a leading U.S. pharmaceutical company specializing in developing, licensing, manufacturing, marketing and distributing generic drugs. We have a generics portfolio of approximately 95 products across an extensive range of dosage forms and delivery systems, including immediate and extended release oral solids (tablets, orally disintegrating tablets, capsules and powders), injectables, nasal sprays, ophthalmics (which are sterile pharmaceutical preparations administered for ocular conditions) and transdermal patches (which are medicated adhesive patches designed to deliver the drug through the skin). Our focus is on high-barrier-to-entry products that are difficult to formulate, difficult to manufacture or face complex legal and regulatory challenges. These products often see limited competition, tend to be more profitable than commoditized generic drugs and often have longer life cycles. We have an integrated team-based approach to product development that combines our formulation, regulatory, legal, manufacturing and commercial capabilities. As of December 31, 2014, we had over 200 products in our pipeline, which included 115 ANDAs pending with the FDA representing $36.7 billion of combined branded product sales in 2014, including 32 potential first-to-file and six potential first-to-market opportunities.
Our company operates in two business segments, Par Pharmaceutical, which includes generic products marketed under Par Pharmaceutical and sterile products marketed under Par Sterile Products, LLC (“Par Sterile,” and formerly known as JHP Pharmaceuticals, LLC), and Par Specialty Pharmaceuticals (“Par Specialty,” and formerly known as Strativa Pharmaceuticals), which markets two branded products. For the year ended December 31, 2014, we had revenue of $1,308.6 million and adjusted EBITDA of $433.8 million. Our product development strategy and ability to execute strategic transactions has resulted in a compound annual revenue growth rate of 12.2% and an adjusted EBITDA compound annual growth rate of 20.4% over the last three years. Our goal is to strengthen our position as a leading pharmaceutical company by developing and commercializing generic drugs with limited competition, significant barriers to entry and longer life cycles.
Our approach to product development is to target high-barrier-to-entry generic products, including first-to-file or first-to-market opportunities. A “first-to-file” product refers to an ANDA that is the first ANDA filed containing a Paragraph IV patent challenge to the corresponding branded product, which offers the opportunity for 180 days of generic marketing exclusivity if approved by the FDA and if we are successful in litigating the patent challenge. A “first-to-market” product refers to a product that is the first marketed generic equivalent of a branded product for reasons apart from statutory marketing exclusivity, such as the generic equivalent of a branded product that is difficult to formulate or manufacture. Our potential first-to-file and first-to-market opportunities account for 33% of our pipeline of 115 ANDAs, which we believe is one of the highest in the industry and demonstrates our differentiated development capabilities. As a result, more than half of our generic adjusted gross margin in 2014 was earned from products that are either exclusive or have two or fewer competitors, which we believe leads to more sustainable market share and profitability for our product portfolio.
We have invested significant resources and focus to expand our technology capabilities to develop a range of products in-house, including immediate release oral solids and alternate dosage forms such as extended-release oral solids, injectables, topicals, nasal sprays, ophthalmics, films and transdermal patches. Our development pipeline reflects these efforts. As of December 31, 2014, our pipeline included over 200 products, 115 of which are pending at the FDA and approximately 100 of which are in development. In addition to development capabilities, we have acquired bioequivalence and clinical end point study capabilities, and we have entered into an agreement to acquire a dedicated, lower-cost API development and manufacturing facility in India. As a result of these investments, we have the flexibility to more fully control the management and
115
Table of Contents
development of key products from formulation stage to commercialization. The following charts demonstrate our pipeline of new product opportunities and our portfolio of alternate dosage products:
We are committed to high product quality standards and allocate significant resources and focus to quality assurance, quality control and manufacturing excellence. We operate five FDA approved manufacturing facilities, four of which are located in the United States and one in India, with annual capacity in excess of four billion dosage units and with ample capacity and room for expansion. In addition, our facilities have passed all recent FDA inspections. As a result of our operational excellence and high quality and compliance standards, we have not received any warning letters from the FDA with respect to manufacturing plants we have operated since before 2000, which we believe differentiates us from other generic manufacturers. Our track record in high-quality manufacturing and supply reliability is most recently demonstrated by the 2014 CVS Health Supplier Partner Award based on providing innovative product offerings, commitment to customer service and consistency of supply.
116
Table of Contents
Our senior management team has a strong track record and established history of executing and integrating business development opportunities and strategic acquisitions. Since 2011, we have completed and integrated over 20 business development transactions and six company acquisitions. These transactions have enhanced and deepened our presence in the industry by expanding our portfolio of products in development and manufacturing capabilities. We believe we are a partner of choice to brand companies seeking an authorized generics partner. Authorized generics are generic versions of branded drugs licensed to generic drug companies by brand drug companies that may be sold during (and after) the statutory exclusivity period granted to the first-to-file generic equivalent to the branded product. We also believe we are a partner of choice to large generic companies for product divestitures that arise as a result of industry consolidation, and for smaller development organizations looking for a partner that has deep experience with product development, patent litigation strategy and a strong market presence. A summary overview of our selected transactions since 2011 is described below:
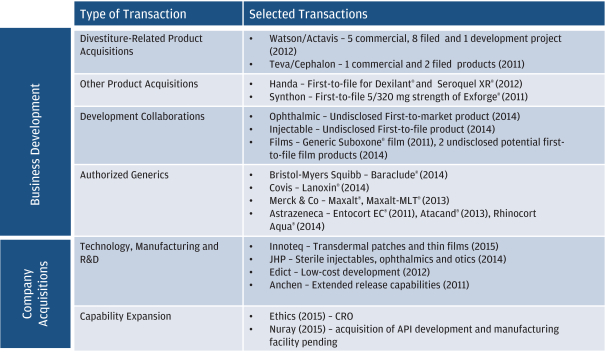
Par Pharmaceutical
Par Pharmaceutical includes generic products marketed under Par Pharmaceutical and sterile products marketed under Par Sterile. The focus of Par Pharmaceutical is to develop, license, manufacture, market and distribute generic prescription drugs in an extensive range of dosage forms and delivery systems, including immediate release oral solids and alternate dosage forms such as extended release oral solids, injectables, topicals, nasal sprays, ophthalmics, films and transdermal patches. We sell our products primarily in the United States. As the percentage of branded pharmaceuticals that are expected to lose patent protection increasingly shifts towards alternate dosage forms (dosage forms other than immediate release oral solid dose), we have made investments in our development capabilities and technologies which better position us to take advantage of this change. On February 20, 2014, we completed our acquisition of Par Sterile, which expanded our capability and presence into the rapidly growing sterile drug market, including injectable products and ophthalmics. Par Pharmaceutical’s products are primarily sold through wholesalers, retailers and mail order pharmacies. Par Sterile’s products are primarily sold through wholesalers, often via an arrangement with a
117
Table of Contents
group purchasing organization, prior to being dispensed at hospitals or directly administered by physicians. The segment contributed $1,214.1 million in net product revenue and $620.6 million of adjusted gross margin in 2014.
Par Specialty Pharmaceuticals
Par Specialty Pharmaceuticals is focused on the marketing and distribution of two branded prescription products, Nascobal® Nasal Spray, and Megace® ES. Nascobal® is a prescription vitamin B12 treatment indicated for maintenance of remission in certain pernicious anemia patients in a once-weekly intranasal administration, which may be preferable to periodic subcutaneous or intramuscular injections. Megace® ES is indicated for the treatment of anorexia, cachexia or any unexplained significant weight loss in patients with a diagnosis of AIDS. These products are marketed by our branded field sales force of approximately 60 people, which communicates the therapeutic and health benefits of our products to healthcare providers and managed care organizations. The segment contributed $64.0 million in net product revenue and $54.1 million of adjusted gross margin in 2014.
Recent performance
Paul Campanelli was appointed as our Chief Executive Officer in September 2012 following the Merger. Prior to the Merger, Mr. Campanelli served as Par’s Chief Operating Officer, having held positions of increasing responsibility since joining the Company in 2001. Over the past two years, under Mr. Campanelli’s leadership, we have made significant investments in expanding our research, development and manufacturing capabilities. These investments have resulted in:
| • | submitting 61 ANDAs since the Merger, resulting in a total of 115 ANDAs pending at the FDA as of December 31, 2014, compared to 89 ANDAs pending as of December 31, 2012; |
| • | diversifying our development portfolio from 83 development projects with 60 alternate dosage forms (including extended release solid oral dose) at December 31, 2012 to approximately 100 products in development with 70 alternate dosage forms (including extended release solid oral dose) at December 31, 2014; |
| • | diversifying our manufacturing capabilities from largely solid oral dose capabilities in 2012 to capabilities covering almost all generic presentations, such as gels, nasal sprays, ophthalmics, films, transdermal patches and injectable products, through our internal investment and acquisitions of Par Sterile and Innoteq; |
| • | expanding our core competencies to provide us the flexibility to more fully control key product development by acquiring Par Biosciences Private Limited (formerly known as Ethics Bio Lab Private Limited), a Chennai, India-based CRO that conducts bioequivalence and clinical end point studies, and by lowering development and manufacturing costs for a portion of our product portfolio through the utilization of Par Formulations Private Limited (formerly known as Edict Pharmaceuticals Private Limited), a Chennai, India-based developer and manufacturer of generic pharmaceuticals; |
| • | enhancing our portfolio through business development and product acquisitions, including our November 2012 acquisition of a mix of marketed products, ANDAs awaiting FDA approval and one late-stage development product in connection with Watson’s acquisition of Actavis Group; |
| • | diversifying our revenue base such that over half of our total adjusted gross margin is derived from products that are either exclusive or have two or fewer competitors for the year ended December 31, 2014; and |
| • | establishing Par Laboratories Europe, Ltd. in 2015, a U.K.-based business office which will serve as an entry point into the European generics market. |
118
Table of Contents
In addition, the following financial metrics highlight improvements since the fiscal year ended December 31, 2011:
| • | total revenue increased from $926.1 million for the year ended December 31, 2011 to $1,308.6 million for the year ended December 31, 2014, representing a CAGR of 12.2%; |
| • | adjusted gross margin increased from $406.0 million for the year ended December 31, 2011 to $674.7 million for the year ended December 31, 2014, representing a CAGR of 18.5%; |
| • | adjusted gross margin as a percentage of revenue increased from 43.8% for the year ended December 31, 2011 to 51.2% for the year ended December 31, 2014; |
| • | adjusted EBITDA increased from $248.5 million for the year ended December 31, 2011 to $433.8 million for the year ended December 31, 2014, representing a CAGR of 20.4%; and |
| • | adjusted EBITDA as a percentage of revenue increased from 26.8% for the year ended December 31, 2011 to 33.1% for the year ended December 31, 2014. |
Adjusted gross margin and adjusted EBITDA are non-GAAP financial measures and should not be considered substitutes for and are not comparable with net income or net operating income as determined in accordance with GAAP. We recorded a net loss of $105.5 million for the year ended December 31, 2014, a net loss of $105.9 million for the year ended December 31, 2013 and a net loss of $33.5 million for the combined 2012 year-end period. For additional information regarding these financial measures, including an explanation and reconciliation of our non-GAAP measures to the most directly comparable measure presented in accordance with GAAP, see “Prospectus summary—Summary historical and pro forma condensed consolidated financial data” included elsewhere in this prospectus. The Merger was accounted for as a business combination and therefore resulted in a new accounting basis. Our results of operations for the year ended 2012 presented elsewhere in this prospectus are presented for the predecessor and successor periods, which relate to the periods preceding the Merger (January 1, 2012 through September 28, 2012) and succeeding (July 12, 2012 (inception) through December 31, 2012) the inception date, respectively. The successor period reflects the new accounting basis established for us as of the incorporation date. In the discussion above, we present our net loss for the combined 2012 full year period for comparative purposes, using the mathematical sum of the net loss reported for the successor and predecessor periods. In addition, throughout the document we present certain other 2012 measures on a combined basis. Such information represents non-GAAP measures because Successor is on a new basis of accounting. These measures should not be considered substitutes for and are not compatible with GAAP measures. The information is presented in this manner as we believe it enables a reasonable comparison. This financial information may not reflect the actual financial results we would have achieved absent the Merger and may not be predictive of future financial results. For a presentation of our results of operations for the year ended 2012 on a GAAP basis, showing the separate predecessor and successor periods, see “Selected historical consolidated financial data.”
Our capabilities
Since 2011, we have strategically expanded our technology, manufacturing, handling and development capabilities, shifting from primarily solid oral immediate and extended release products to a diversified array of dosage forms. These expanded technologies represent a sizeable market opportunity, with 2014 branded product sales utilizing these technologies of approximately $110 billion, according to IMS Health. As of December 31, 2014, our development product portfolio included 26 immediate release oral solids, 24 injectables, 23 extended release oral solids, eight topicals, five ophthalmics, three nasal sprays and two films.
119
Table of Contents
The following graphic shows Par Pharmaceutical’s current capabilities and new in-process opportunities:
Technology, manufacturing & handling capabilities
We have broadened our product portfolio by investing in internal development capabilities as well as through acquisitions of companies that focus on difficult to formulate products and difficult to manufacture dosage forms. Our internal investments have included expansion of our technology capabilities in gels, nasal sprays and topicals. Additionally, we have added ophthalmic, sterile vial and hormonal handling capabilities through our acquisition of Par Sterile, and thin film, slow dissolve film and transdermal patch expertise through our acquisition of Innoteq.
Research and development capabilities
Our research and development capabilities have expanded in tandem with our broader product portfolio and access to new dosage forms. As of December 31, 2014, approximately 70% of our research and development portfolio targets alternate dosage forms such as extended release oral solids, injectables, topicals, nasal sprays, ophthalmics, films and transdermal patches. We believe these capabilities position us as one of a few companies globally that possesses this broad array of product technologies.
Since 2012, we have taken significant measures to optimize operational efficiencies throughout the product development process. We have acquired bioequivalence study capabilities through our acquisition of Par Biosciences, which decreases our dependence on third parties for such services. We expect to add API development and manufacturing capabilities through the pending acquisition of an API facility. In addition, since 2014, we completed our acquisition of (i) Par Sterile, which expanded our capabilities and presence into the rapidly growing sterile drug market, including injectable and ophthalmic products and (ii) Innoteq, which provided thin film and patch capability. These expanded capabilities provide the flexibility to more fully control the management and development of key products from formulation stage to commercialization.
Our comprehensive suite of technology, manufacturing and development capabilities increases the likelihood of success in commercializing high-barrier-to-entry products and obtaining first-to-file and first-to-market status on our products, yielding more sustainable market share and profitability for our product portfolio.
Our strengths
Our senior executive team has a strong track record of product selection and development, and has launched 47 new products since 2011, eight of which have been first-to-file and one of which has been first-to-market. We have an integrated team-based approach to product development, that combines our formulation, regulatory,
120
Table of Contents
legal, manufacturing and commercial capabilities. Our senior executive team is an integral part of this approach to product development and we believe this allows us to offer a high-value portfolio of products to our customers. We believe that the strengths of Par are as follows:
Focused approach to product selection targeting high-barrier-to-entry products with long-term value. We specialize in high-barrier-to-entry products that are difficult to formulate, difficult to manufacture or face complex legal and regulatory challenges. These products often see limited competition and tend to be more profitable than commoditized generic drugs. We believe our strong track record of developing products with limited competition, high barriers to entry and longer life cycles has enabled us to maintain more sustainable market share and profitability for our product portfolio. As a result, a large portion of our generics gross margin comes from products where we are either the exclusive generic or have two or fewer competitors. The following chart illustrates our percentage of adjusted gross margin by number of competitors for the year ended December 31, 2014:
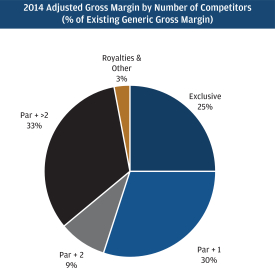
As of December 31, 2014, among our top ten generic drugs by revenue, more than half maintain market shares in excess of 50%. In recent years, we have introduced generic versions of several major pharmaceuticals with high barriers to entry such as Lovaza® (complex and difficult-to-source API), Precedex® (unique dosage form), Luvox CR® (controlled-release product) and Focalin XR® (controlled substance).
Full suite of technology capabilities. We have a full suite of dosage forms, including immediate release oral solids and alternate dosage forms such as extended release oral solids, injectables, topicals, nasal sprays, ophthalmics, films and transdermal patches. According to EvaluatePharma, approximately $45.0 billion of branded originator products focused in alternate dosage forms (excluding extended release oral solids) are expected to lose patent protection between 2014 and 2018, and they span the full range of injectables, ophthalmics, topicals, intranasals, transdermals and inhalers. During the same period, approximately $74.0 billion of branded originator products focused on oral solids (including immediate release and extended release) are expected to lose patent protection. Given the large value opportunity represented by alternate dosage forms, we have invested significant resources and focus to expand our technology capabilities. Our acquisition of Par Biosciences provides us with bioequivalence study capabilities, which allows us to control the speed, cost and execution of development. In addition, we are in the process of acquiring an API development and manufacturing facility. These expanded capabilities provide the flexibility to more fully control the management and development of key products from formulation stage to commercialization. Our investments in technology have allowed us to
121
Table of Contents
diversify our product offerings and expand our pipeline. These capabilities allow us to capitalize on opportunities as the market continues to migrate towards alternate dosage forms and technologies. The following chart illustrates how these expanded capabilities provide access to other U.S. market segments:
|
|
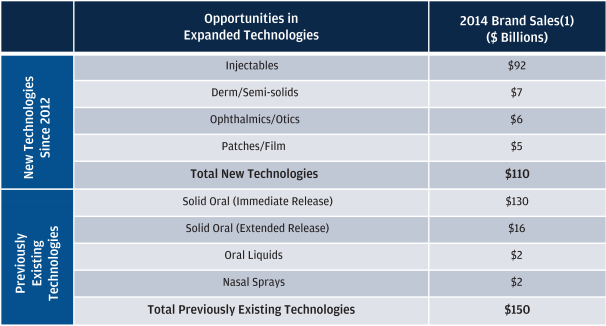
| (1) | IMS Full Year 2014 Data |
Diverse portfolio of products. We have a generics portfolio of approximately 95 products across an extensive range of dosage forms and delivery systems. In addition to our current products, our pipeline consists of new products that will further expand and diversify our portfolio. We believe our broad suite of products has allowed us to increase our market presence and develop long term relationships with customers. In recent years, we introduced products across dosage forms such as generic versions of Actiq® (transmucosal lozenge), Entocort® EC (capsule), Precedex® (injectable) and Maxalt-MLT® (ODT), as well as Adrenalin® (injectable), which is marketed as a branded product. In addition, our adjusted gross margin is diversified across our drug portfolio with our top ten revenue products accounting for over half of our total consolidated adjusted gross margin for the fiscal year ended December 31, 2014.
Deep, targeted pipeline with high visibility into future launches. We have a large number of products pending regulatory approval and a robust pipeline of products in development. As of December 31, 2014, we had 115 ANDAs pending with the FDA representing $36.7 billion of combined branded product sales in 2014, including 32 potential first-to-file and six potential first-to-market opportunities representing $14.8 billion of combined branded product sales in 2014 compared to 57 ANDAs as of December 31, 2011 pending with the FDA representing approximately $21.7 billion of combined branded product sales in 2011.
122
Table of Contents
The following chart illustrates the approximate brand product sales for selected products in our pipeline:
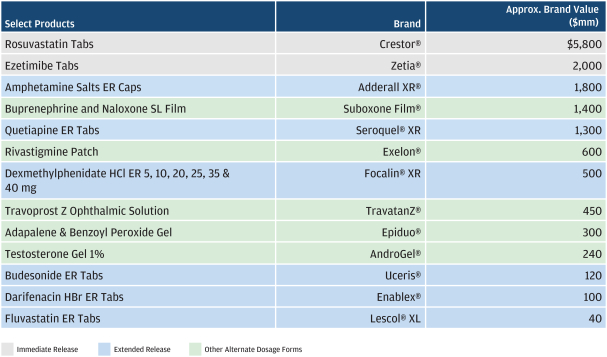
Our potential first-to-file and first-to-market opportunities account for 33% of our pending ANDA pipeline, which we believe is one of the highest in the industry and differentiates our development capabilities. Moreover, we have a number of products that are date-certain product launches which provides us with high visibility into future launches and cash flows. For example, we have date-certain launches on the generic versions of Zetia® and Seroquel XR® in 2016, or earlier under certain circumstances. As of December 31, 2014, our Paragraph IV opportunities accounted for approximately 55% of our current development portfolio and 70% of the development portfolio targets alternate dosage forms.
Commitment to manufacturing excellence with a culture of quality and compliance. We have invested significant resources and focus on quality assurance, quality control and manufacturing excellence. As of December 31, 2014, we operated five FDA approved manufacturing facilities, four of which are located in the United States and one in India, with ample capacity and room for expansion. As a result of our commitment to operational excellence and high quality and compliance standards, we have not received any warning letters from the FDA with respect to manufacturing plants we have operated since before 2000, which we believe differentiates us from other generic manufacturers. High-quality manufacturing and supply reliability has become increasingly valuable to customers as the FDA has increased scrutiny of generics manufacturers. Our track record in high-quality manufacturing and supply reliability is most recently demonstrated by our 2014 CVS Health Supplier Partner Award based on providing innovative product offerings, commitment to customer service and consistency of supply. We are well positioned to take advantage of industry shortages or competitor manufacturing disruptions and have done so numerous times in the past.
Proven success in identifying and executing on business development and strategic acquisitions. We have successfully completed and integrated over 20 business development transactions and six company acquisitions since 2011, which has expanded our product portfolio, development capabilities and manufacturing platforms. Our experience and extensive network of relationships in the industry allows us to identify a significant number of opportunities and execute on them quickly and efficiently. On February 20, 2014, we
123
Table of Contents
completed our acquisition of Par Sterile, which expanded our capabilities and presence into the rapidly growing sterile drug market, including injectable and ophthalmic products. In addition, we have a successful track record of partnering with large brand pharmaceutical companies looking for an authorized generics partner, which we believe is a result of our strong distribution network and industry positioning. We believe we are a partner of choice for product divestitures for large generic companies, which are often reluctant to partner with one another given the competitive dynamics of the industry. In addition, our deep experience with product development, patent litigation strategy and our strong market presence allows us to partner with smaller development organizations. Examples of our success include our partnership with Glenmark Pharmaceuticals Ltd. for generic Zetia® rights and the acquisition of rights to generics for Actiq® and Provigil® from Teva. We intend to continue to pursue and execute on commercially compelling business development and strategic acquisitions that could further diversify our portfolio, pipeline and capabilities. Given our strong track record of success in executing similar transactions in the past in an effective and efficient manner, we believe that we are well positioned to compete for these potential opportunities.
Track record of strong top-line revenue growth and significant cash flow generation. We submitted 11, 21, 21 and 30 new ANDA filings during 2011, 2012, 2013 and 2014, respectively, and introduced 38 new generic products during that period. Driven by our diversification into alternate dosage forms and targeted product selection, our net product revenue has grown from $887.5 million in 2011 to $1,278.1 million in 2014, which represents a CAGR of 12.9% over that period, and our adjusted EBITDA has grown from $248.5 million in 2011 to $433.8 million in 2014, which represents a CAGR of 20.4% over that period. Our adjusted gross margin as a percentage of revenue has expanded from 43.8% in 2011 to 51.2% in 2014. We expect to submit approximately 20 to 25 new ANDA filings during each of 2015, 2016 and 2017, and we expect a number of these potential products to be first-to-file or first-to-market opportunities that will drive top-line revenue growth.
Experienced management team with a strong track record of operational execution. We have a highly experienced leadership team that is committed to developing, manufacturing, marketing and distributing safe, innovative and quality pharmaceuticals. The four members of our executive management team average approximately 25 years of experience in the pharmaceutical industry, and each has been with us for at least nine years, with the exception of Terrance Coughlin, our Chief Operating Officer, who joined us in April 2014. Our senior management team has an average of 24 years of industry experience, which has led to our track record of high quality manufacturing and supply reliability. This leadership team has enabled us to successfully execute on our business strategy, growing revenue and enhancing profitability.
Our strategy
Our goal is to strengthen our position as a leading pharmaceutical company by developing and commercializing generic drugs with limited competition, high barriers to entry and longer life cycles. We successfully manage our business for the long term by continuing to commit to provide high-quality pharmaceuticals that are affordable and accessible to patients. In implementing our strategy, we are focused on the following:
Grow our core business in attractive high-value segments. Our strategy focuses on high-value generic products, including first-to-file and first-to-market opportunities. According to EvaluatePharma, between 2014 and 2018, approximately $74 billion of branded originator products focused on oral solids (including immediate release and extended release) are expected to lose patent protection. By specializing in high-barrier-to-entry products that are either difficult to manufacture and/or present complex legal and regulatory challenges, we are able to market products that are more profitable and longer-lived relative to our competitors. As a result, over half of our generic adjusted gross margin as of December 31, 2014 was earned from products that are either exclusive or have two or fewer competitors.
124
Table of Contents
Advance our pipeline to continue building our portfolio. We have expanded our development portfolio from approximately 60 products in development at December 31, 2011 to 100 as of December 31, 2014. We have also further diversified our product pipeline from approximately 30 to 70 products in alternate dosage forms as of the same periods. We have grown our ANDAs pending with the FDA from 57 products at December 31, 2011 to 115 products at December 31, 2014, including 32 potential first-to-file and six potential first-to-market opportunities. We expect to submit approximately 20 to 25 new ANDA filings during each of 2015, 2016 and 2017 and continue our research and development efforts to strengthen and grow our portfolio.
Strategically expand our technology capabilities across development and manufacturing. We have made significant investments to enhance our technology platforms and have expanded our capabilities to manufacture products in alternate dosage forms. We believe this will become an increasingly strategic asset over time. We are committed to high product quality standards and invest significant resources and focus to quality assurance, quality control and manufacturing excellence. In addition, we have expanded our manufacturing platforms by making strategic investments to acquire capabilities in orally dissolving thin films and transdermal patches, bioequivalence and clinical end point study services and API development and manufacturing (acquisition pending). As a result of these investments, we have the flexibility to more fully control the management and development of key products. We will continue to invest in expanding our technology capabilities across development and manufacturing to develop high-barrier-to-entry products.
Build upon our success in strategic acquisitions and business development. We have an established history of successfully executing and integrating strategic acquisitions that have enhanced and deepened our presence in our industry. Through these acquisitions, we have expanded our portfolio of products, pipeline, manufacturing and technological capabilities. We expect business development to remain a priority for us as we continue to identify and execute on transactions that fit our strategy and focus on high-barrier-to-entry products.
Leverage existing platform to drive operational efficiency. As a well-established industry player, we have built broad infrastructure in areas of technology, manufacturing, development, sales and distribution. This enables us to go from product selection to commercialization in an efficient manner, driving sales growth and enhancing profitability. As our portfolio expands, we can leverage these existing capabilities to accelerate bottom-line growth and margin expansion.
Our industry
Prescription pharmaceutical products are sold either as branded or generic products. Generic drugs are the pharmaceutical and therapeutic equivalents of branded products and are usually marketed under their generic (chemical) names rather than by brand names. Typically, a generic drug may not be marketed until the expiration of applicable patent(s) on the corresponding branded product, unless a resolution of patent litigation results in an earlier opportunity to enter the market. Generic drugs are the same as branded products in dosage form, safety, efficacy, route of administration, quality, performance characteristics and intended use, but they are sold generally at prices below those of the corresponding branded products. Generic drugs provide a cost-effective alternative for consumers, while maintaining the same high quality, efficacy, safety profile, purity and stability of the branded product. An ANDA is required to be filed and approved by the FDA in order to manufacture a generic drug for sale in the United States. The time required to obtain FDA approval of ANDAs is on average approximately 42 months after initial filing. The aggregate number of ANDAs submitted to the FDA in 2014 was 1,264. There have been recent changes in FDA submission requirements and those companies that are able to prepare high quality submissions are comparatively advantaged.
According to IMS Health, generic pharmaceuticals account for approximately 86% of all prescriptions dispensed in 2013. According to IMS Health, the worldwide generics market was estimated to be worth $195 billion in sales for the
125
Table of Contents
12 months ended September 2014 representing a 10% increase from the prior year. We expect key drivers of growth in the future to include:
| • | Demographic trends. In 2015 the U.S. population over 65 years of age is expected to be 47.7 million, growing over 17% to 55.9 million by 2020. This growth in this segment of the population, who are significant consumers of pharmaceutical products, will increase generic utilization. In addition, the generic market will be positively impacted by an increased acceptance of generic drugs as lower-cost equivalents of branded pharmaceutical product among consumers, physicians and pharmacists. |
| • | Number of products coming off patent. The continued volume of patent expiries in the branded pharmaceuticals market will fuel generic growth. According to EvaluatePharma, $117 billion of worldwide branded pharmaceutical sales in 2013 will expire between 2013 and 2015. This will grow to $264 billion for products set to expire between 2013 and 2020). |
| • | Cost containment measures. A key driver of generic market growth has been the efforts of governments and the private sector to mitigate the increasing burden of healthcare expenditures by encouraging the use of generic pharmaceutical products. According to IMS Health, in 2013 the use of generics saved consumers $239 billion, an average of almost $655 million daily, and significant cost-cutting measures still continue to be implemented by stakeholders in the healthcare system. |
Within the generic pharmaceuticals industry, complex and hard-to-formulate products have higher barriers to entry, limited competition and longer life cycles. Products and drug delivery systems with differentiated formulations, that require advanced manufacturing technology, and those in complex dosage forms fall into this category. Alternative dosage forms to solid oral dose generics, including injectables, nasal sprays, topicals, ophthamlics, patches and films are a high-growing sub-segment of the generics industry. Multiple factors such as (i) challenging regulatory requirements including high cGMP and FDA regulatory standards, (ii) expertise in complex manufacturing processes and (iii) difficulty in developing and sourcing the often complex API these dosage forms require, contribute to higher barriers to entry for these products. Additionally, trade customers highly value manufacturers that consistently offer high quality products, maintain high levels of customer service, and introduce new product offerings. As a result, the market for complex, hard-to-formulate, hard-to-manufacture generics is less commoditized, allowing companies who successfully produce high-quality products in this market to sustain competitive pricing, margins and longer life cycles for their products.
Financial information about segments
Summarized net revenue and segment contribution information for each of the last three fiscal years are presented in “Note 21—Segment Information” to our audited consolidated financial statements included elsewhere in this prospectus.
Marketing and customers
Marketing of our generic products is primarily targeted to wholesalers, retailers and mail order pharmacies. Par Sterile’s products are primarily sold through wholesalers, often via an arrangement with a group purchasing organization, prior to being dispensed at hospitals or directly administered by physicians. Par Specialty products are marketed by its sales force of approximately 60 people, which communicates the therapeutic and health benefits of our branded products to healthcare providers and managed care organizations. Some of our wholesalers purchase products and warehouse those products for certain retail drug store chains, independent pharmacies and managed health care organizations. Customers in the managed health care market include health maintenance organizations, nursing homes, hospitals, clinics, pharmacy benefit management companies and mail order customers.
126
Table of Contents
We have approximately 120 customers, some of which are part of large buying groups. In the year ended December 31, 2014, our four largest customers in terms of net sales accounted for approximately 70% of our total net revenue, as follows: McKesson Drug Co. (24.7%), Cardinal Health Inc. (18.3%), CVS Health Corporation (14.5%) and AmerisourceBergen Corporation (13.4%). We do not have written agreements that guarantee future business with any of these major customers, and the loss of any one or more of these customers or the substantial reduction in orders from any of such customers could have a material adverse effect on our operating results, prospects and financial condition.
Manufacturing
We have manufacturing sites in Chestnut Ridge, New York; Irvine, California; Rochester, Michigan; Stratford, Connecticut; and Chennai, India, which handle the production, assembly, quality assurance testing and packaging of our products. We estimate that for the products we manufacture internally, our U.S. facilities contributed 98% of our manufacturing production based on revenue compared to 2% in India as of December 31, 2014.
Competition
The pharmaceutical industry is highly competitive. At times, we may not be able to differentiate our products from our competitors’ products, successfully develop or introduce new products that are less expensive than our competitors’ products, or offer purchasers payment and other commercial terms as favorable as those offered by our competitors. We believe that our principal generic competitors are Teva, Sandoz, Mylan and Actavis, based upon the markets in which we compete. Our strategy focuses on high-value, first-to-file or first-to-market opportunities, regardless of therapeutic category. By specializing in high-barrier-to-entry products that are either difficult to manufacture or require complex legal challenges, we endeavor to market more profitable and longer-lived products relative to our competitors. There can be no assurance, however, that this strategy will enable us to compete successfully in the industry or that we will be able to develop and implement any new or additional viable strategies.
The Hatch-Waxman amendments to the FDCA provide for a period of 180 days of generic marketing exclusivity for each applicant that is first-to-file an ANDA containing a Paragraph IV certification. The holder of an approved first-to-file ANDA that is successful in challenging the applicable branded drug patent(s) generally enjoys higher market share and revenue during this period of marketing exclusivity. At the expiration of the exclusivity period, other generic distributors may enter the market, resulting in a significant price decline for the drug. In some instances, price declines have exceeded 90%. As a result of price declines, we may at our discretion provide price adjustments to our customers for the difference between our new (lower) price and the price at which we previously sold the product then held in inventory by our customers. These types of price adjustments are commonly known as shelf stock adjustments. There are circumstances under which, as a matter of business strategy, we may decide not to provide price adjustments to certain customers, and consequently, we may receive returns of our customers’ unsold products and lose future sales volume to competitors rather than reduce our pricing.
Competition in the generic drug industry has also increased due to the advent of authorized generics. Authorized generics are generic pharmaceutical products that are introduced by brand companies, either directly or through third parties, under the brand’s NDA approval. Authorized generics may be sold during (and after) the statutory exclusivity period granted to the first-to-file generic equivalent to the branded product. This is a significant source of competition for us, because brand companies do not face any regulatory barriers to introducing a generic version of their own branded drugs. Further, authorized generics may be sold during any period of generic marketing exclusivity granted to a generic company, which significantly undercuts the profits that a generic company could otherwise receive as an exclusive marketer of a generic product. Such actions have the effect of
127
Table of Contents
reducing the potential market share and profitability of our generic products and may inhibit us from introducing generic products corresponding to certain branded drugs. We have also marketed authorized generics in partnership with brand companies, including during the exclusivity periods of our generic competitors. Approximately 4% of our gross margin for the year ended December 31, 2014 was derived from sales of authorized generics as compared to approximately 9% for the year ended December 31, 2011.
Increased price competition has also resulted from consolidation among wholesalers and retailers and the formation of large buying groups, which has caused reductions in sales prices and gross margin. This competitive environment has led to an increase in customer demand for downward price adjustments from the distributors of generic pharmaceutical products. Such price reductions are likely to continue, or even increase, which could have a material adverse effect on our revenue and gross margin.
The principal competitive factors in the generic pharmaceutical market include:
| • | introduction of other generic drug manufacturers’ products in direct competition with our products, |
| • | introduction of authorized generic products in direct competition with our products, particularly during exclusivity periods, |
| • | consolidation among distribution outlets through mergers and acquisitions and the formation of buying groups, |
| • | ability of generic competitors to quickly enter the market after the expiration of patents or exclusivity periods, diminishing the amount and duration of significant profits, |
| • | the willingness of generic drug customers, including wholesale and retail customers, to switch among products of different pharmaceutical manufacturers; |
| • | pricing pressures by competitors and customers, |
| • | a company’s reputation as a manufacturer and distributor of quality products, |
| • | a company’s level of service (including maintaining sufficient inventory levels for timely deliveries), |
| • | product appearance and labeling, and |
| • | a company’s breadth of product offerings. |
Our branded products benefit from patent protection, making them subject to Paragraph IV patent challenges that could jeopardize our market exclusivity for these products. Consequently, competition from generic equivalents following a successful Paragraph IV patent challenge against one of our branded products could have an adverse effect on Par Specialty. In addition, after patent protections expire, generic products can be sold in the market at a significantly lower cost than the branded version, and, where available, may be required or encouraged in preference to the branded version under third party reimbursement programs. Generic products may also be substituted for branded products by pharmacies and state laws sometimes require pharmacies to effect such substitution. Par Specialty also faces competition from other brand drug companies. Many of our brand competitors have longer operating histories, broader product portfolios and greater financial, research and development, marketing and other resources than we do. Consequently, many of our brand competitors may be able to develop products superior to our own. Furthermore, we may not be able to differentiate our products from those of our brand competitors or offer customers payment and other commercial terms as favorable as those offered by our brand competitors. The markets in which we compete and intend to compete are undergoing, and are expected to continue to undergo, rapid and significant change. We expect brand competition to intensify as technological advances and consolidations continue.
128
Table of Contents
Raw materials
The raw materials essential to our manufacturing business are purchased primarily from U.S. distributors of bulk pharmaceutical chemicals manufactured by foreign companies. To date, we have experienced no significant difficulties in obtaining raw materials and expect that raw materials will generally continue to be available in the future. However, because the federal drug application process requires specification of raw material suppliers, if raw materials from a specified supplier were to become unavailable, FDA approval of a new supplier would be required. A delay of six months or more in the manufacture and marketing of the drug involved while a new supplier becomes qualified by the FDA and its manufacturing process is determined to meet FDA standards could, depending on the particular product, have a material adverse effect on our results of operations and financial condition. Generally, we attempt to mitigate the potential effects of any such situation by providing for, where economically and otherwise feasible, two or more suppliers of raw materials for the drugs that we manufacture. In addition, we may attempt to enter into a contract with a raw material supplier in an effort to ensure adequate supply for certain products.
Employees
At December 31, 2014, we had approximately 1,600 employees, of which approximately 200 employees are covered by a collective bargaining agreement. We consider our employee relations to be good.
Government regulation
The development, manufacturing, sales, marketing and distribution of our products are subject to extensive regulation by the U.S. federal government, principally the FDA, and, as applicable, the Drug Enforcement Administration, FTC and state and local governments. For both currently marketed and future products, failure to comply with applicable regulatory requirements can, among other things, result in suspension of regulatory approval and possible civil and criminal sanctions. Regulations, enforcement positions, statutes and legal interpretations applicable to the pharmaceutical industry are constantly evolving and are not always clear. Significant changes in regulations, enforcement positions, statutes and legal interpretations could have a material adverse effect on our financial condition and results of operations.
Additionally, future healthcare legislation or other legislative proposals at the federal and state levels could bring about major changes in the affected health care systems, including statutory restrictions on the means that can be employed by brand and generic pharmaceutical companies to settle Paragraph IV patent litigations. We cannot predict the outcome of such initiatives, but such initiatives, if passed, could result in significant costs to us in terms of costs of compliance and penalties associated with failure to comply.
The FDCA, the Controlled Substances Act and other federal statutes and regulations govern the development, testing, manufacture, safety, effectiveness, labeling, storage, record keeping, approval, import and export, and advertising and promotion of our products. Non-compliance with applicable regulations can result in judicially and/or administratively imposed sanctions, including the initiation of product seizures, injunctions, fines and criminal prosecutions. Administrative enforcement measures may involve the recall of products, as well as the refusal of an applicable government authority to enter into supply contracts or to approve NDAs and ANDAs. The FDA also has the authority to withdraw its approval of drugs in accordance with its regulatory due process procedures.
Review and approval of drugs in the United States
FDA approval is required before any new drug, including a generic equivalent of a previously approved branded name drug, may be marketed. To obtain FDA approval for a new drug, a prospective manufacturer must, among other things, demonstrate that its manufacturing facilities comply with the FDA’s current Good Manufacturing
129
Table of Contents
Practices (“cGMP”) regulations, which is discussed in further detail below. The FDA may inspect the manufacturer’s facilities to ensure such compliance prior to approval or at any other time. The manufacturer is required to comply with cGMP regulations at all times during the manufacture and processing of drugs. To comply with the standards set forth in these regulations, we must continue to expend significant time, money and effort in the areas of production, quality control and quality assurance.
In order to obtain FDA approval of a new drug, a manufacturer must demonstrate the drug’s safety and efficacy. There currently are two ways to satisfy the FDA’s safety and effectiveness requirements:
| • | New drug applications (NDAs). Unless the procedure discussed in the following paragraph is permitted under the FDCA, a prospective manufacturer generally must submit to the FDA an NDA containing complete pre-clinical and clinical safety and efficacy data or a right of reference to such data. The pre-clinical data must provide an adequate basis for evaluating the safety and scientific rationale for the initiation of clinical trials. Clinical trials are conducted in three sequential phases and may take up to several years to complete. At times, the phases may overlap. Data from pre-clinical testing and clinical trials is submitted to the FDA as an NDA for marketing approval. The FDA is, however, authorized to approve an alternative type of NDA under Section 505(b)(2) of the FDCA. Section 505(b)(2) permits the filing of an NDA where at least some of the information required for approval comes from studies not conducted by or for the applicant and for which the applicant has not obtained a right of reference from the data owner. The applicant may rely upon the FDA’s findings of safety and efficacy for an approved product that acts as the “listed drug.” The FDA may also require 505(b)(2) applicants to perform additional studies or measurements to support the change from the listed drug. |
| • | Abbreviated new drug applications (ANDAs). The Hatch-Waxman amendments to the FDCA established a statutory procedure for submission and FDA review and approval of ANDAs for generic versions of branded drugs previously approved by the FDA (such previously approved drugs are referred to as “listed drugs”). Because the safety and efficacy of listed drugs have already been established by the brand company, the FDA waives the requirement for complete clinical trials. However, a generic manufacturer is typically required to conduct bioequivalence studies of its test product against the listed drug. The bioequivalence studies for orally administered, systemically available drug products assess the rate and extent to which the API is absorbed into the bloodstream from the drug product and becomes available at the site of action. Bioequivalence is established when there is an absence of a significant difference in the rate and extent for absorption of the generic product and the listed drug. For some drugs (e.g., locally acting drugs like topical anti-fungals), other means of demonstrating bioequivalence may be required by the FDA, especially where rate and/or extent of absorption are difficult or impossible to measure. In addition to the bioequivalence data, an ANDA must contain patent certifications and chemistry, manufacturing, labeling and stability data. |
Supplemental NDAs or ANDAs are required for, among other things, approval to transfer certain products from one manufacturing site to another or to change an API supplier, and may be under review for a year or more. In addition, certain products may only be approved for transfer once new bioequivalence studies are conducted or other requirements are satisfied.
Hatch-Waxman exclusivity and patent provisions
The Hatch-Waxman amendments also established certain statutory protections for listed drugs. Under the Hatch-Waxman amendments, approval of an ANDA for a generic drug may not be made effective for interstate marketing until all relevant patents for the listed drug have expired, been withdrawn, delisted, or determined to be invalid, unenforceable, or not infringed by the generic drug applicant submitting a Paragraph IV certification. Prior to enactment of the Hatch-Waxman amendments, the FDA did not consider the patent status of a previously approved drug. In addition, under the Hatch-Waxman amendments, statutory non-patent exclusivity periods are established following approval of certain listed drugs, where specific criteria are met by
130
Table of Contents
the drug. For example, for new chemical entities, an ANDA or 505(b)(2) application referencing that drug may not be filed with the FDA until the expiration of five years after approval of that drug, unless the submission is accompanied by a Paragraph IV certification, in which case the applicant may submit its application four years following the original product approval. The FDCA also provides for a period of three years of exclusivity if the NDA, including a 505(b)(2) NDA, includes reports of one or more new clinical investigations, other than bioavailability or bioequivalence studies, that were conducted by or for the applicant and are essential to the approval of the application. Additionally, drugs approved for so-called “orphan indications” (those diseases for which the patient population is sufficiently small) are entitled to a seven year data exclusivity period. The Hatch-Waxman amendments also provide for extensions of up to five years for certain patents covering drugs to compensate the patent holder for the reduction in the effective market life of the patented drug resulting from the time spent in the federal regulatory review process.
Upon approval of an NDA or a supplement thereto, NDA sponsors are required to list with the FDA each patent with claims that, according to the NDA holder/patent holder, cover the applicant’s product or an approved method of using the product. Each of the patents listed by the NDA sponsor is published in the Orange Book. When an ANDA applicant files its application with the FDA, the applicant is required to certify to the FDA concerning any patents listed for the reference product in the Orange Book, except for patents covering methods of use for which the ANDA applicant is not seeking approval. To the extent that the Section 505(b)(2) applicant is relying on studies conducted for an already approved product, the applicant is required to certify to the FDA concerning any patents listed for the approved product in the Orange Book to the same extent that an ANDA applicant would.
Specifically, the applicant must certify with respect to each patent that:
| • | the required patent information has not been filed; |
| • | the listed patent has expired; |
| • | the listed patent has not expired, but will expire on a particular date and approval is sought after patent expiration; or |
| • | the listed patent is invalid, unenforceable or will not be infringed by the new product. |
A certification that the new product will not infringe the already approved product’s listed patents or that such patents are invalid or unenforceable is called a Paragraph IV certification.
If the ANDA or 505(b)(2) applicant has provided a Paragraph IV certification to the FDA, the applicant must also send notice of the Paragraph IV certification to the NDA and patent holders once the ANDA or 505(b)(2) application has been accepted for filing by the FDA. The NDA and patent holders may then initiate a patent infringement lawsuit in response to the notice of the Paragraph IV certification. The filing of a patent infringement lawsuit within 45 days after the receipt of a Paragraph IV certification automatically prevents the FDA from approving the ANDA or 505(b)(2) application until the earlier of 30 months after the receipt of the Paragraph IV notice, expiration of the patent, or a decision in the infringement case that is favorable to the ANDA applicant.
On February 6, 2015, the FDA issued proposed regulations concerning submission of patent information to FDA, patent certifications by ANDA and 505(b)(2) applicants, notices of Paragraph IV certifications, and the 30-month stay. We cannot predict when the regulations might be finalized or whether, if finalized, the regulations will be substantially similar to the proposal. When final regulations are promulgated, we will have a clearer view of their impact on this aspect of our business.
131
Table of Contents
Stages of testing development for FDA approval
With respect to Par Specialty, our current strategy is to bypass the substantial investments associated with the development of branded drugs and instead to focus on the profitability of our existing branded products and consider opportunities to add to our portfolio through in-licensing and acquisition of late-stage development products or currently marketed products. If we were to undertake the process of developing a branded product and bringing it to market, the first step in obtaining FDA approval for a drug that has not been previously approved is pre-clinical testing. Pre-clinical tests are intended to provide a laboratory evaluation of the product to determine its chemistry, formulation and stability. Toxicology studies are also performed to assess the potential safety and efficacy of the product. The results of these studies are submitted to the FDA as part of an investigational new drug (“IND”) application. The toxicology studies are analyzed to ensure that clinical trials can safely proceed. There is a 30-day period in which the FDA can raise concerns regarding the trials proposed in an IND. If the FDA raises any concerns, the developer must address those concerns before the clinical trials can begin. An IND becomes effective after such 30-day period if the FDA does not raise any concerns. Prior to the start of any clinical study, an independent institutional review board must review and approve such study.
There are three main stages of clinical trial development:
| • | In Phase I, the drug is tested for safety, absorption, tolerance and metabolism in a small number of subjects. |
| • | In Phase II, after successful Phase I evaluations, the drug is tested for efficacy in a limited number of patients. The drug is further tested for safety, absorption, tolerance and metabolism. |
| • | In Phase III, after successful Phase II evaluations, further tests are done to determine safety and efficacy in a larger number of patients who are to represent the population in which the drug will eventually be used. |
The developer then submits an NDA containing the results from the pre-clinical and clinical trials. The NDA drug development and approval process takes approximately three to ten years or more.
Pricing regulation
Successful commercialization of our products depends, in part, on the availability of governmental and third-party payor reimbursement for the cost of our products. Government authorities and third-party payors increasingly are challenging the price of medical products and services. On the government side, there is a heightened focus, at both the federal and state levels, on decreasing costs and reimbursement rates in Medicaid, Medicare and other government insurance programs. This has led to an increase in federal and state legislative initiatives related to drug prices, which could significantly influence the purchase of pharmaceutical products, resulting in lower prices and changes in product demand. If enacted, these changes could lead to reduced payments to pharmacies. Many states have also created preferred drug lists and include drugs on those lists only when the manufacturers agree to pay a supplemental rebate. If our current products or future drug candidates are not included on these preferred drug lists, physicians may not be inclined to prescribe them to their Medicaid patients, thereby diminishing the potential market for our products.
Moreover, government regulations regarding reporting and payment obligations are complex, and we are continually evaluating the methods we use to calculate and report the amounts owed with respect to Medicaid and other government pricing programs. Our calculations are subject to review and challenge by various government agencies and authorities, and it is possible that any such review could result either in material changes to the method used for calculating the amounts owed to such agency or the amounts themselves. Because the process for making these calculations, and our judgments supporting these calculations, involve subjective decisions, these calculations are subject to audit. In the event that a government authority challenges or finds ambiguity with regard to our report of payments, such authority may impose civil and/or criminal sanctions, which could have a material adverse effect on our business. From time to time we conduct
132
Table of Contents
routine reviews of our government pricing calculations. These reviews may have an impact on government price reporting and rebate calculations used to comply with various government regulations regarding reporting and payment obligations.
Healthcare reform
In the United States, there have been a number of federal and state proposals during the last several years regarding the pricing of pharmaceutical products and other changes to the healthcare system. It is uncertain what other legislative proposals may be adopted or what actions federal, state, or private payors may take in response to any healthcare reform proposals or legislation. We cannot predict the effect such reforms may have on our business, and no assurance can be given that any such reforms will not have a material adverse effect.
By way of example, in March 2010, the Patient Protection and Affordable Care Act of 2010, as amended by the Health Care and Education Reconciliation Act of 2010, or collectively, the Affordable Care Act, was signed into law, which, among other things, includes changes to the coverage and payment for drug products under government health care programs. The current legislation includes measures that (i) significantly increase Medicaid rebates through both the expansion of the program and significant increases in rebates; (ii) substantially expand the Public Health System (340B) program to allow other entities to purchase prescription drugs at substantial discounts; (iii) extend the Medicaid rebate rate to a significant portion of Managed Medicaid enrollees; (iv) assess a 50% rebate on Medicaid Part D spending in the coverage gap for branded and authorized generic prescription drugs; and (v) levy a significant excise tax on the industry to fund the healthcare reform. The impacts of these provisions are included in our current financial statements.
Fraud and abuse regulation
Pharmaceutical companies are subject to various federal and state laws that are intended to combat health care fraud and abuse, and that govern certain of our business practices, especially our interactions with customers and potential customers through sales and marketing, or research and development activities. These include anti-kickback laws, false claims laws, sunshine laws, privacy laws, and FDA regulation of advertising and promotion of pharmaceutical products.
| • | Anti-kickback laws, of which the Federal health care programs anti-kickback law is most commonly the subject of enforcement proceedings, prohibit, among other things, the knowing and willful offer or payment of remuneration intended to induce, or in exchange for, ordering (or arranging for or recommending ordering) covered products or services, including our products. |
| • | False claims laws prohibit knowingly presenting, or causing to be presented, claims for payment to third party payers (Medicare and Medicaid) that are false or fraudulent and, under the Federal False Claims Act, a claim is deemed false or fraudulent if it is made pursuant to an illegal kickback. |
| • | Sunshine laws, including the Federal Open Payments law enacted as part of the Affordable Care Act, require pharmaceutical manufacturers to disclose payments and other transfers of value to physicians and certain other health care providers or professionals, and in the case of some state sunshine laws, restrict or prohibit certain such payments. |
| • | Privacy laws, such as the privacy regulations implemented under the Health Insurance Portability and Accountability Act (HIPAA), restrict covered entities from using or disclosing protected health information. Covered entities commonly include physicians, hospitals, and health insurers from which we may seek to acquire data to aid in our research, development, sales and marketing activities. Although pharmaceutical manufacturers are not covered entities under HIPAA, our ability to acquire or use protected health information from covered entities may be affected by privacy laws. |
133
Table of Contents
| • | The FDA regulates the sale and marketing of prescription drug products and, among other things, prohibits pharmaceutical manufacturers from promoting products for unapproved uses. |
We have incurred and will continue to incur costs to comply with these laws.
While we intend to comply in all respects with fraud and abuse laws, there has been an increase in government enforcement efforts at both the federal and state level. Numerous cases have been brought against pharmaceutical manufacturers under the Federal False Claims Act, alleging, among other things, that certain sales or marketing-related practices violate the Anti-kickback statute or the FDA’s regulations, and many of these cases have resulted in settlement agreements under which the companies were required to change certain practices, pay substantial fines, and operate under the supervision of a federally-appointed monitor for a period of years. Due to the breadth of these laws and their implementing regulations and the absence of guidance in some cases, it is possible that our practices might be challenged by government authorities. Violations of fraud and abuse laws may be punishable by civil and/or criminal sanctions including fines, civil monetary penalties, as well as the possibility of exclusion of our products from payment by Federal health care programs. Any such violations or challenges could have a material adverse effect on our business.
AWP litigation
Many government and third-party payors reimburse the purchase of certain prescription drugs based on a drug’s Average Wholesale Price or “AWP.” In the past several years, state and federal government agencies have conducted ongoing investigations of manufacturers’ reporting practices with respect to AWP, which they have suggested have led to excessive payments by state and federal government agencies for prescription drugs. We and numerous other pharmaceutical companies have been named as defendants in various state and federal court actions alleging improper or fraudulent practices related to the reporting of AWP.
Drug pedigree laws
State and federal governments have proposed or passed various drug pedigree laws which can require the tracking of all transactions involving prescription drugs from the manufacturer to the pharmacy (or other dispensing) level. Companies are required to maintain records documenting the chain of custody of prescription drug products beginning with the purchase of such products from the manufacturer. Compliance with these pedigree laws requires implementation of extensive tracking systems as well as heightened documentation and coordination with customers and manufacturers. While we fully intend to comply with these laws, there is uncertainty about future changes in legislation and government enforcement of these laws. Failure to comply could result in fines or penalties, as well as loss of business that could have a material adverse effect on our financial results.
Federal regulation of patent litigation settlements and authorized generic arrangements
As part of the Medicare Prescription Drug Improvement and Modernization Act of 2003, companies are required to file with the FTC and the DOJ certain types of agreements entered into between brand and generic pharmaceutical companies related to the settlement of patent litigation and/or manufacture, marketing and sale of generic versions of branded drugs. This requirement could affect the manner in which generic drug manufacturers resolve intellectual property litigation and other disputes with brand pharmaceutical companies, and could result generally in an increase in private-party litigation against pharmaceutical companies or additional investigations or proceedings by the FTC or other governmental authorities.
134
Table of Contents
Other
The U.S. federal government, various states and localities have laws regulating the manufacture and distribution of pharmaceuticals, as well as regulations dealing with the substitution of generic drugs for branded drugs. Our operations are also subject to regulation, licensing requirements and inspection by the states and localities in which our operations are located and/or in which we conduct business.
Certain of our activities are also subject to FTC enforcement actions. The FTC enforces a variety of antitrust and consumer protection laws designed to ensure that the nation’s markets function competitively, are vigorous, efficient and free of undue restrictions.
Federal, state, local and foreign laws of general applicability, such as laws regulating working conditions, also govern us. In addition, like other manufacturers, we are subject to numerous and increasingly stringent federal, state and local environmental laws and regulations concerning, among other things, the generation, handling, storage, transportation, treatment and disposal of toxic and hazardous substances, the discharge of pollutants into the air and water and the cleanup of contamination. We are required to maintain and comply with environmental permits and controls for some of our operations, and these permits are subject to modification, renewal and revocation by the issuing authorities. Our environmental capital expenditures and costs for environmental compliance may increase in the future as a result of changes in environmental laws and regulations or increased manufacturing activities at any of our facilities. We could incur significant costs or liabilities as a result of any failure to comply with environmental laws, including fines, penalties, third-party claims and the costs of undertaking a clean-up at a current or former site or at a site to which our wastes were transported. In addition, we have grown in part by acquisition, and our diligence may not have identified environmental impacts from historical operations at sites we have acquired in the past or may acquire in the future.
Legal proceedings
Our legal proceedings are complex and subject to significant uncertainties. As such, we cannot predict the outcome or the effects of the legal proceedings described below. While we believe that we have valid claims and/or defenses in the litigations described below, litigation is inherently unpredictable, and the outcome of these proceedings could include substantial damages, the imposition of substantial fines, penalties, and injunctive or administrative remedies. For proceedings where losses are both probable and reasonably estimable, we have accrued for such potential loss as set forth below. Such accruals have been developed based upon estimates and assumptions that have been deemed reasonable by management, but the assessment process relies heavily on estimates and assumptions that may ultimately prove to be inaccurate or incomplete, and unknown circumstances may exist or unforeseen events occur that could lead us to change those estimates and assumptions. Unless otherwise indicated below, at this time we are not able to estimate the possible loss or range of loss, if any, associated with these legal proceedings. In general, we intend to continue to vigorously prosecute and/or defend these proceedings, as appropriate; however, from time to time, we may settle or otherwise resolve these matters on terms and conditions that we believe are in the best interests of the Company. Resolution of any or all claims, investigations, and legal proceedings, individually or in the aggregate, could have a material adverse effect on our results of operations and/or cash flows in any given accounting period or on our overall financial condition.
Patent related matters
On April 28, 2006, CIMA Labs, Inc. (“CIMA”) and Schwarz Pharma, Inc. (“Schwarz Pharma”) filed separate lawsuits against us in the U.S. District Court for the District of New Jersey. CIMA and Schwarz Pharma each have alleged that we infringed U.S. Patent Nos. 6,024,981 (the “’981 patent”) and 6,221,392 (the “’392 patent”) by
135
Table of Contents
submitting a Paragraph IV certification to the FDA for approval of alprazolam orally disintegrating tablets. The complaints generally seek (i) a finding of infringement, validity and/or enforceability; (ii) a permanent injunction be entered, terminating at the expiration of the patents-in-suit; and (iii) unspecified damages. On July 10, 2008, the U.S. Patent and Trademark Office (“USPTO”) rejected all claims pending in both the ‘392 and ‘981 patents. On September 28, 2009, the USPTO’s Patent Trial and Appeal Board (“PTAB”) affirmed the Examiner’s rejection of all claims in the ‘981 patent, and on March 24, 2011, the PTAB affirmed the rejections pending for both patents and added new grounds for rejection of the ‘981 patent. On June 24, 2011, the plaintiffs re-opened prosecution on both patents at the USPTO. On May 13, 2013, the PTAB reversed outstanding rejections to the currently pending claims of the ’392 patent reexamination application and affirmed a conclusion by the Examiner that testimony offered by the patentee had overcome other rejections. On September 20, 2013, a reexamination certificate was issued for the ’392 patent, and on January 9, 2014, a reexamination certificate was issued for the ’981 patent, each incorporating narrower claims than the respective originally-issued patent. We intend to vigorously defend this lawsuit and pursue our counterclaims.
Unimed and Laboratories Besins Iscovesco filed a lawsuit on August 22, 2003 against Paddock Laboratories, Inc. in the U.S. District Court for the Northern District of Georgia alleging patent infringement as a result of Paddock’s submitting an ANDA with a Paragraph IV certification seeking FDA approval of testosterone 1% gel, a generic version of Unimed Pharmaceuticals, Inc.’s Androgel®. On September 13, 2006, we acquired from Paddock all rights to the ANDA, and the litigation was resolved by a settlement and license agreement that permits us to launch the generic version of the product no earlier than August 31, 2015, and no later than February 28, 2016, assuring our ability to market a generic version of Androgel® well before the expiration of the patents at issue. On January 30, 2009, the Bureau of Competition for the FTC filed a lawsuit against us in the U.S. District Court for the Central District of California, subsequently transferred to the Northern District of Georgia, alleging violations of antitrust laws stemming from our court-approved settlement, and several distributors and retailers followed suit with a number of private plaintiffs’ complaints beginning in February 2009. The FTC complaint generally seeks (i) a finding that our agreements with co-defendants violate Section 5(a) of the Federal Trade Commission Act; and (ii) a permanent injunction against our ability to engage in such conduct in the future. The private plaintiffs’ complaints generally seek (i) equitable relief; and (ii) single, treble, and/or multiple unspecified damages and costs. On February 23, 2010, the District Court granted our motion to dismiss the FTC’s claims and granted in part and denied in part our motion to dismiss the claims of the private plaintiffs. On September 28, 2012, the District Court granted our motion for summary judgment against certain of the private plaintiffs’ claims. On June 10, 2010, the FTC appealed the District Court’s dismissal of the FTC’s claims to the U.S. Court of Appeals for the 11th Circuit. On April 25, 2012, the Court of Appeals affirmed the District Court’s decision. On June 17, 2013, the Supreme Court of the United States reversed the Court of Appeals’ decision and remanded the case to the U.S. District Court for the Northern District of Georgia for further proceedings. On October 23, 2013, the District Court issued an order on indicative ruling on a request for relief from judgment, effectively remanding to the District Court the appeal of the grant of our motion for summary judgment against certain of the private plaintiffs’ claims and holding those claims in abeyance while the remaining issues pending before the Court are resolved. We believe we have complied with all applicable laws in connection with the court-approved settlement and intend to continue to vigorously defend these actions.
On September 13, 2007, Santarus, Inc. and The Curators of the University of Missouri (“Missouri”) filed a lawsuit against us in the U.S. District Court for the District of Delaware alleging infringement of U.S. Patent Nos. 6,699,885; 6,489,346; and 6,645,988 because we submitted an ANDA with a Paragraph IV certification seeking FDA approval of 20 mg and 40 mg omeprazole/sodium bicarbonate capsules. On December 20, 2007, Santarus and Missouri filed a second lawsuit alleging infringement of the patents because we submitted an ANDA with a Paragraph IV certification seeking FDA approval of 20 mg and 40 mg omeprazole/sodium bicarbonate powders
136
Table of Contents
for oral suspension. The complaints generally sought (i) a finding of infringement, validity, and/or enforceability; and (ii) a permanent injunction be entered, terminating at the expiration of the patents-in-suit. On October 20, 2008, plaintiffs amended their complaint to add U.S. Patent Nos. 6,780,882 and 7,399,722. On April 14, 2010, the District Court ruled in our favor, finding that the plaintiffs’ patents were invalid as being obvious and without adequate written description. On July 1, 2010, we launched our 20 mg and 40 mg generic omeprazole/sodium bicarbonate capsules product. Santarus and Missouri appealed the District Court’s decision to the U.S. Court of Appeals for the Federal Circuit, and we cross-appealed the District Court’s decision of enforceability of plaintiffs’ patents. On September 4, 2012, the Court of Appeals reversed the District Court’s finding of invalidity and remanded to the District Court for further proceedings, and we ceased further distribution of our 20 mg and 40 mg generic omeprazole/sodium bicarbonate capsules product. Santarus was acquired by Salix Pharmaceuticals, Inc. on January 2, 2014. On September 22, 2014, we entered into a settlement agreement with Salix, Santarus and Missouri to resolve all claims relating to this matter, and the dismissal stipulation was entered on September 26, 2014. As part of the settlement, Salix, Santarus and Missouri released all claims against us in exchange for a payment of $100 million. We recorded a charge of $91.0 million in the third quarter of 2014 in addition to the $9.0 million previously accrued.
On April 29, 2009, Pronova BioPharma ASA (“Pronova”) filed a lawsuit against us in the U.S. District Court for the District of Delaware. The complaint alleges infringement of U.S. Patent Nos. 5,502,077 and 5,656,667 because we submitted an ANDA with a Paragraph IV certification seeking FDA approval of omega-3-acid ethyl esters oral capsules. On May 29, 2012, the District Court ruled in favor of Pronova in the initial case, and we appealed to the U.S. Court of Appeals for the Federal Circuit on June 25, 2012. On September 12, 2013, the Court of Appeals ruled in our favor, reversing the lower District Court decision. On March 5, 2014, judgment in our favor was formally entered in the District Court. On April 16, 2014, Pronova petitioned for writ of certiorari to the U.S. Supreme Court, which was denied on October 6, 2014.
On August 10, 2011, Avanir Pharmaceuticals, Inc. et al. (“Avanir”) filed a lawsuit against us in the U.S. District Court for the District of Delaware. The complaint alleges infringement of U.S. Patent Nos. 7,659,282 and RE38,115 because we submitted an ANDA with a Paragraph IV certification seeking FDA approval of oral capsules of 20 mg dextromethorphan hydrobromide and 10 mg quinidine sulfate. The complaint generally seeks (i) a finding of infringement, validity, and/or enforceability; and (ii) a permanent injunction be entered, terminating at the expiration of the patents-in-suit. Our case was consolidated with those of other defendants, Actavis, Impax, and Wockhardt. On September 12, 2012, Avanir filed an additional complaint against us, adding U.S. Patent No. 8,227,484 to the case and seeking the same relief as the first complaint. A bench trial was held from September 9-13 and October 15, 2013. On April 30, 2014, a decision was entered in favor of Avanir. On August 20, 2014, the Court issued an order requiring that Avanir delist the ‘115 patent, leaving only the ‘484 and ‘282 to be addressed on appeal. We filed our notice of appeal following resolution of the delisting claim on September 12, 2014. We intend to prosecute our appeal of this decision vigorously.
On September 1, 2011, we, along with EDT Pharma Holdings Ltd. (now known as Alkermes Pharma Ireland Limited) (Elan), filed a complaint against TWi Pharmaceuticals, Inc. (“TWi”) of Taiwan in the U.S. District Court for the District of Maryland alleging infringement of U.S. Patent No. 7,101,576 because TWi filed an ANDA with a Paragraph IV certification seeking FDA approval of a generic version of Megace® ES. Our complaint seeks (i) a finding of infringement, validity, and/or enforceability; and (ii) a permanent injunction be entered, terminating at the expiration of the patents-in-suit. A bench trial was held from October 7-15, 2013. On February 21, 2014, the District Court issued a decision in favor of TWi, finding all asserted claims of the ‘576 patent invalid for obviousness, and we appealed to the U.S. Court of Appeals for the Federal Circuit. On August 12, 2014, the District Court granted our motion for preliminary injunction enjoining TWi’s launch of its generic product pending disposition of the case on appeal, requiring us to post a $10.0 million bond. On December 3, 2014, the Federal Circuit reversed the District Court’s decision, remanding for further findings of fact. On March 9, 2015,
137
Table of Contents
the District Court granted our motion for preliminary injunction enjoining TWi’s launch of its generic product pending disposition of the case on remand, requiring us to post a $6.0 million bond. We intend to continue to vigorously pursue our case.
On April 4, 2012, AR Holding Company, Inc. filed a lawsuit against us in the U.S. District Court for the District of Delaware. The complaint alleges infringement of U.S. Patent Nos. 7,619,004; 7,601,758; 7,820,681; 7,915,269; 7,964,647; 7,964,648; 7,981,938; 8,093,296; 8,093,297; and 8,097,655 (subsequently adding U.S. Patent Nos. 8,415,395 and 8,415,396) because we submitted an ANDA with a Paragraph IV certification seeking FDA approval of oral tablets of 0.6 mg colchicine. On November 1, 2012, Takeda Pharmaceuticals was substituted as the plaintiff and real party-in-interest in the case. On August 30, 2013, Takeda filed a second complaint in view of the same filing adding to the dispute U.S. Patent Nos. 7,906,519; 7,935,731; 7,964,648; 8,093,297; and 8,093,298. The complaint generally seeks (i) a finding of infringement, validity, and/or enforceability; and (ii) a permanent injunction be entered, terminating at the expiration of the patents-in-suit. On August 30, 2013, Takeda filed a new complaint against us in view of our change of the ANDA’s labeled indication. We intend to defend these actions vigorously.
On October 25, 2012, Purdue Pharma L.P. (“Purdue”) and Transcept Pharmaceuticals (“Transcept”) filed a lawsuit against us in the U.S. District Court for the District of New Jersey. The complaint alleged infringement of U.S. Patent Nos. 8,242,131 and 8,252,809 because we submitted an ANDA with a Paragraph IV certification seeking FDA approval of zolpidem tartrate sublingual tablets 1.75 and 3.5 mg. The complaint generally seeks (i) a finding of infringement, validity, and/or enforceability; and (ii) a permanent injunction be entered, terminating at the expiration of the patents-in-suit. On November 24, 2014, we reached an agreement with Purdue and Transcept to stay our case contingent upon our agreement to be bound by the District Court’s decision in Transcept’s trial against Actavis and Novel Laboratories, which commenced December 1, 2014. On March 27, 2015, the District Court issued an opinion in favor of Actavis and Novel Laboratories, and on April 9, 2015, the District Court accordingly entered judgment in favor of Par, finding the patents-in-suit invalid. We will continue to monitor the progress of any appeal of the District Court’s decision, to which judgment we would be subject.
On December 19, 2012, Endo Pharmaceuticals and Grünenthal GmbH filed a lawsuit against us in the U.S. District Court for the Southern District of New York. The complaint alleges infringement of U.S. Patent Nos. 7,851,482; 8,114,383; 8,192,722; 8.309, 060; 8,309,122; and 8,329,216 because we submitted an ANDA with a Paragraph IV certification to the FDA for approval of oxymorphone hydrochloride extended release tablets 40 mg. The complaint generally seeks (i) a finding of infringement, validity, and/or enforceability; and (ii) a permanent injunction be entered, terminating at the expiration of the patents-in-suit. On November 7, 2014, Endo and Mallinckrodt sued us on the same filing in the U.S. District Court for the District of Delaware, adding U.S. Patent Nos. 8,808,737 and 8,871,779 to the case. On January 15, 2015, the case in the Southern District of New York was dismissed by stipulation. On March 31, 2015, the case in the District of Delaware was dismissed by stipulation.
On January 8, 2013, we were substituted for Actavis as defendant in litigation then pending in the U.S. District Court for the District of Delaware. The action was brought by Novartis against Actavis for filing an ANDA with a Paragraph IV certification seeking FDA approval of rivastigmine transdermal extended release film 4.6 and 9.5 mg/24 hr. We assumed the rights to this ANDA. The complaint alleges infringement of U.S. Patents 5,602,176; 6,316,023; and 6,335,031 and generally seeks (i) a finding of infringement, validity, and/or enforceability; and (ii) a permanent injunction be entered, terminating at the expiration of the patents-in-suit. On August 22, 2013, Novartis filed an additional complaint in view of our submission of an ANDA supplement containing a Paragraph IV certification adding the 13.3 mg/24 hr. strength. A trial was held August 26-29, 2013, and a second bench trial directed to our non-infringement positions was held on May 1-2, 2014. On June 27, 2014, we filed a declaratory judgment action against Novartis in the same Court regarding all strengths, seeking judgment of
138
Table of Contents
non-infringement and invalidity on all asserted patents in view of all strengths embraced by our ANDA. On August 29, 2014, the Court in the first action entered judgment in our favor, finding that we do not infringe the asserted patents. On October 7, 2014, the Court entered judgment in our favor on the declaratory judgment complaint. On October 20, 2014 and October 30, 2014, Novartis filed notices of appeal to the U.S. Court of Appeals for the Federal Circuit from both the original case as well as the complaint initiated on the ANDA supplement. On November 7, 2014, Novartis filed an appeal from the declaratory judgment decision. We intend to defend these actions vigorously.
On February 7, 2013, Sucampo Pharmaceuticals, Takeda Pharmaceuticals, and R-Tech Ueno filed a lawsuit against us in the U.S. District Court for the District of Delaware. The complaint alleges infringement of U.S. Patent Nos. 6,414,016; 7,795,312; 8,026,393; 8,071,613; 8,097,653; and 8,338,639 because we submitted an ANDA with a Paragraph IV certification to the FDA for approval of lubiprostone oral capsules 8 mcg and 24 mcg. The complaint generally seeks (i) a finding of infringement; and (ii) a permanent injunction be entered, terminating at the expiration of the patents-in-suit. On July 3, 2013, an amended complaint was filed, adding U.S. Patent No. 8,389,542 to the case. On October 9, 2014, the parties entered into a settlement agreement resolving the dispute and allowing us to launch our generic lubiprostone product on January 1, 2021, or earlier in certain circumstances. The consent judgment terminating the case was entered December 2, 2014.
On May 15, 2013, Endo Pharmaceuticals filed a lawsuit against us in the U.S. District Court for the Southern District of New York. The complaint alleges infringement of U.S. Patent Nos. 7,851,482; 8,309,122; and 8,329,216 as a result of our November 2012 acquisition from Watson of an ANDA with a Paragraph IV certification seeking FDA approval of non-tamper resistant oxymorphone hydrochloride extended release tablets. The complaint generally seeks (i) a finding of infringement, validity, and/or enforceability; and (ii) a permanent injunction be entered, terminating at the expiration of the patents-in-suit. On March 20, 2015, the lawsuit was dismissed by stipulation.
On June 21, 2013, we, along with Alkermes Pharma Ireland Limited (Elan), filed a complaint against Breckenridge Pharmaceutical, Inc. in the U.S. District Court for the District of Delaware. In the complaint, we allege infringement of U.S. Patent Nos. 6,592,903 and 7,101,576 because Breckenridge filed an ANDA with a Paragraph IV certification seeking FDA approval of a generic version of Megace® ES. Our complaint seeks (i) a finding of infringement, validity, and/or enforceability; and (ii) a permanent injunction be entered, terminating at the expiration of the patents-in-suit. A stipulation to stay the proceedings was entered on July 22, 2014. We intend to prosecute this infringement case vigorously.
On September 23, 2013, Forest Labs and Royalty Pharma filed a lawsuit against us in the U.S. District Court for the District of Delaware. The complaint alleges infringement of U.S. Patent Nos., 6,602,911; 7,888,342; and 7,994,220 because we submitted an ANDA with a Paragraph IV certification to the FDA for approval of 12.5, 25, 50, and 100 mg milnacipran HCl oral tablets. The complaint generally seeks (i) a finding of infringement; and (ii) a permanent injunction be entered, terminating at the expiration of the patents-in-suit. On May 4, 2015, the case was dismissed by stipulation pursuant to a confidential settlement agreement.
On August 20, 2013 and April 4, 2014, MonoSol RX and Reckitt Benckiser filed lawsuits against us in the U.S. District Court for the District of Delaware. The complaints allege infringement of U.S. Patent Nos. 8,017,150, 8,475,832 and 8,603,514, because we submitted an ANDA with a Paragraph IV certification to the FDA for approval of EQ 2/0.5, 8/2, 4/1, 12/3 mg base buprenorphine HCl/naloxone HCl sublingual films. The complaints generally seek (i) a finding of infringement; and (ii) a permanent injunction be entered, terminating at the expiration of the patents-in-suit. On December 31, 2014, the plaintiffs filed a complaint on the same ANDA filing, adding U.S. Patent Nos. 8,900,497 and 8,906,277. We intend to defend these actions vigorously.
On December 27, 2013, Jazz Pharmaceuticals filed a lawsuit against us in the U.S. District Court for the District of New Jersey. The complaint alleges infringement of U.S. Patent Nos. 6,472,431; 6,780,889; 7,262,219; 7,851,506;
139
Table of Contents
8,263,650; 8,324,275; 8,461,203; 7,668,730; 7,765,106; 7,765,107; 7,895,059; 8,457,988; and 8,589,182 because we submitted an ANDA with a Paragraph IV certification to the FDA for approval of 500mg/ml sodium oxybate oral solution. On August 15, 2014, October 10, 2014, and January 8, 2015, Jazz filed additional complaints against us in view of the same ANDA filing, adding U.S. Patent Nos. 8,731,963; 8,772,306; and 8,859,619, respectively, to the case. The complaints generally seek (i) a finding of infringement; and (ii) a permanent injunction be entered, terminating at the expiration of the patents-in-suit. We intend to defend these actions vigorously.
On January 21, 2014, Lyne Laboratories, Fresenius USA Manufacturing and Fresenius Medical Care Holdings filed a lawsuit against us in the U.S. District Court for the District of Massachusetts. The complaint alleges infringement of U.S. Patent Nos. 8,591,938 and 8,592,480 because we submitted an ANDA with a Paragraph IV certification to the FDA for approval of 169mg/5ml calcium acetate oral solution. The complaint generally seeks (i) a finding of infringement; and (ii) a permanent injunction be entered, terminating at the expiration of the patents-in-suit. The case has been settled on confidential terms with a stipulation of dismissal, which was entered by the Court on April 29, 2015.
On February 14, 2014 and August 15, 2014, Forest Laboratories, Inc., Forest Laboratories Holdings, Ltd., and Adamas Pharmaceuticals, Inc., filed lawsuits against us and our Anchen subsidiary in the U.S. District Court for the District of Delaware. The complaints allege infringement of U.S. Patent Nos. 8,039,009; 8,168,209; 8,173,708; 8,283,379; 8,329,752; 8,362,085; and 8,598,233 because we submitted ANDAs with Paragraph IV certifications to the FDA for approval of 7, 14, 21, and 28 mg memantine hydrochloride extended release capsules. The complaints generally seek (i) a finding of infringement and (ii) a permanent injunction be entered, terminating at the expiration of the patents-in-suit. On January 14, 2015, a joint stipulation of dismissal was entered in the case pursuant to a confidential settlement agreement between the parties.
On April 23, 2014, Hyperion Therapeutics filed a lawsuit against us in the U.S. District Court for the Eastern District of Texas. The complaint alleges infringement of U.S. Patent Nos. 8,404,215 and 8,642,012 because we submitted an ANDA with Paragraph IV certifications to the FDA for approval of 1.1 g/ml glyceryl phenylbutyrate oral liquid. The complaint generally seeks (i) a finding of infringement and (ii) a permanent injunction be entered, terminating at the expiration of the patents-in-suit. We intend to defend this action vigorously. On April 29, 2015, we filed Inter Partes Review petitions seeking institution of a trial on invalidity at the U.S. Patent and Trademark Office for both of the patents asserted in the Texas litigation. We intend to defend and prosecute, as applicable, these actions vigorously.
On June 20, 2014, Otsuka Pharmaceutical Co. filed a lawsuit against us in the U.S. District Court for the District of Delaware. The complaint alleges infringement of U.S. Patent Nos. 5,753,677 and 8,501,730 relating to our Paragraph IV certification accompanying our ANDA for approval of 15 and 30 mg tolvaptan oral tablets. The complaint generally seeks (i) a finding of infringement; and (ii) a permanent injunction be entered, terminating at the expiration of the patents-in-suit. We intend to defend this action vigorously.
On June 30, 2014, AstraZeneca filed a lawsuit against us in the U.S. District Court for the District of Delaware. The complaint alleges infringement of U.S. Patent No. 7,951,400 because we submitted an ANDA with a Paragraph IV certification to the FDA for approval of eq 2.5 mg and eq 5 mg saxagliptin hydrochloride oral tablets. The complaint generally seeks (i) a finding of infringement and (ii) a permanent injunction be entered, terminating at the expiration of the patents-in-suit. The case has been settled on confidential terms with a stipulation of dismissal, which was entered by the Court on April 14, 2015.
On July 17, 2014, Glycyx Pharmaceuticals and Salix filed a lawsuit against us in the U.S. District Court for the District of Delaware. The complaint alleges infringement of U.S. Patent Nos. 6,197,341 and 8,497,256 because we submitted an ANDA with a Paragraph IV certification to the FDA for approval of 1.1 g balsalazide disodium oral tablets. The complaint generally seeks (i) a finding of infringement and (ii) a permanent injunction be
140
Table of Contents
entered, terminating at the expiration of the patents-in-suit. The case has been settled on confidential terms with a stipulation of dismissal, which was entered by the Court on March 30, 2015.
On August 6, 2014, Prometheus Labs filed a lawsuit against us in the U.S. District Court for the District of Delaware. The complaint alleges infringement of U.S. Patent No. 6,284,770 because we submitted an ANDA with a Paragraph IV certification to the FDA for approval of 0.5 and 1.0 mg alosetron hydrochloride tablets. The complaint generally seeks (i) a finding of infringement and (ii) a permanent injunction be entered, terminating at the expiration of the patents-in-suit. On November 17, 2014, the court stayed our case pending the outcome of the appeal of the first Paragraph IV filer’s victory in the District Court.
On August 19, 2014, Hospira, Inc. filed a declaratory judgment complaint against the FDA in the U.S. District Court for the District of Maryland in view of the FDA’s approval of our ANDA for dexmedetomidine hydrochloride injection, concentrate (100 mcg/ml) vials pursuant to our submission and statement under section viii. On August 20, 2014, we moved to intervene in the case on the side of the FDA. On August 25, 2014, we filed a declaratory judgment complaint against Hospira, Inc. in view of U.S. Patent No. 6,716,867 in the U.S. District Court for the District of New Jersey. On September 5, 2014, the Maryland Court ruled in favor of the FDA, Par and joint intervenor Mylan, Inc. on summary judgment, and Hospira, Inc. and its intervenor/co-complainant Sandoz appealed that judgment to the U.S. Court of Appeals for the Fourth Circuit. On October 29, 2014, all parties stipulated jointly to a dismissal of all of the cases (Maryland, New Jersey, and the Fourth Circuit) pursuant to a confidential settlement agreement.
On October 10, 2014, Novartis Pharmaceuticals Corporation and Novartis AG filed a lawsuit against us in the U.S. District Court for the District of Delaware. The complaint alleges infringement of U.S. Patent Nos. 5,665,772; 6,004,973; and 6,455,518 because we submitted an ANDA with a Paragraph IV certification to the FDA for approval of 0.25, 0.5, and 0.75 mg everolimus tablets. The complaint generally seeks (i) a finding of infringement and (ii) a permanent injunction be entered, terminating at the expiration of the patents-in-suit. We intend to defend this action vigorously.
On November 19, 2014, we filed a declaratory judgment action against GlaxoSmithKline and Aptalis in the U.S. District Court for the Eastern District of Pennsylvania, seeking declaratory judgment of non-infringement and invalidity of U.S. Patent No. 7,919,115 in view of our April 11, 2012 submission of an ANDA with a Paragraph IV certification to the FDA seeking approval for lamotrigine orally disintegrating tablets 25, 50, 100, and 200 mg. On January 30, 2015, the consent judgment was entered.
Under a Development and Supply Agreement between Pharmaceutics International, Inc. (“PII”) and Par Sterile, PII agreed to develop and manufacture, and Par Sterile agreed to market and sell, certain pharmaceutical products, including zoledronic acid, the generic version of Zometa® and Reclast®. Under the Agreement, the parties agreed to share equally all mutually agreed expenses and costs of Paragraph IV proceedings related to the product, including any costs and expenses related to any mutually agreed upon settlement. On February 20, 2013, Novartis Pharmaceuticals Corporation filed a lawsuit against PII, along with several other defendants, in the U.S. District Court for the District of New Jersey, for filing ANDAs with Paragraph IV certifications seeking FDA approval of both zoledronic acid eq 4 mg base/5 ml vials and zoledronic acid eq 5 mg base/100 ml bottles. The complaint alleges, among other things, that the sale of generic versions of Reclast® and Zometa® would infringe one or more of U.S. Patent Nos. 8,324,189; 7,932,241; and 8,052,987 and seeks (i) a finding of infringement, validity, and/or enforceability; (ii) a permanent injunction be entered, terminating at the expiration of the patents-in-suit; and (iii) damages or other monetary relief in light of commercial manufacture, use, offers to sell, or sale of the ANDA products. On March 1, 2013, the District Court denied Novartis’s request for a temporary restraining order against PII and the other defendants. On March 4, 2013, Par Sterile began distribution of PII’s generic Zometa® product and began distribution of the generic Reclast® product in December 2013. On December 3, 2014, in view of the foregoing, Novartis sued Par Sterile in the same court, seeking (i) a finding of infringement, validity, and/or
141
Table of Contents
enforceability; (ii) a permanent injunction be entered, terminating at the expiration of the patents-in-suit; and (iii) damages or other monetary relief in light of commercial manufacture, use, offers to sell, or sale of the ANDA products. We intend to defend this action vigorously.
On December 18, 2014, and January 23, 2015, Novartis Pharmaceuticals Corporation and Novartis AG filed lawsuits against us in the U.S. District Court for the District of Delaware. The complaints allege infringement of U.S. Patent Nos. 5,665,772; 7,297,703; and 7,741,338 518 because we submitted an ANDA with a Paragraph IV certification to the FDA for approval of 2.5, 5, 7.5, and 10 mg everolimus tablets. The complaints generally seek (i) a finding of infringement and (ii) a permanent injunction be entered, terminating at the expiration of the patents-in-suit. We intend to defend these actions vigorously.
On January 16, 2015, Supernus Pharmaceuticals filed a lawsuit against us in the U.S. District Court for the District of New Jersey. The complaint alleges infringement of U.S. Patent Nos. 8,298,576; 8,298,580; 8,663,683; and 8,877,248 because we submitted an ANDA with a Paragraph IV certification to the FDA for approval of 25, 50, 100, and 200 mg topiramate extended release capsules. The complaint generally seeks (i) a finding of infringement and (ii) a permanent injunction be entered, terminating at the expiration of the patents-in-suit. We intend to defend this action vigorously.
On January 21, 2015, Tris Pharma, Inc., filed a lawsuit against us in the U.S. District Court for the District of Delaware. The complaint alleges infringement of U.S. Patent Nos. 8,062,667; 8,287,903; 8,465,765; 8,563,033; and 8,778,390 because we submitted an ANDA with a Paragraph IV certification to the FDA for approval of 5 mg/ml methylphenidate hydrochloride extended release oral suspension. The complaint generally seeks (i) a finding of infringement and (ii) a permanent injunction be entered, terminating at the expiration of the patents-in-suit. We intend to defend this action vigorously.
On February 2, 2015, Cosmo Technologies, Ltd and Santarus, Inc. filed a lawsuit against us in the U.S. District Court for the District of Delaware. The complaint alleges infringement of U.S. Patent Nos. 7,410,651; 7,431,943; 8,293,273; 8,784,888; 8,895,064; and RE43,799 because we submitted an ANDA with a Paragraph IV certification to the FDA for approval of 9 mg budesonide tablets. The complaint generally seeks (i) a finding of infringement and (ii) a permanent injunction be entered, terminating at the expiration of the patents-in-suit. We intend to defend this action vigorously.
On February 20, 2015, Ferring Pharmaceuticals, Inc. and Ferring International Center S.A. filed a lawsuit against us in the U.S. District Court for the District of Delaware. The complaint alleges infringement of U.S. Patent Nos. 8,450,338 and 8,481,083 because we submitted an ANDA with a Paragraph IV certification to the FDA for approval of 10/3.5/12 g sodium picosulfate/magnesium oxide/citric acid packets for oral solution. The complaint generally seeks (i) a finding of infringement and (ii) a permanent injunction be entered, terminating at the expiration of the patents-in-suit. We intend to defend this action vigorously.
On February 26, 2015, Shire, LLC filed a lawsuit against us in the U.S. District Court for the District of New Jersey. The complaint alleges infringement of U.S. Patent Nos. RE41,148 and RE42,096 because we submitted an ANDA with a Paragraph IV certification to the FDA for approval of 5, 10, 15, 20, and 25 mg mixed amphetamine salts extended release capsules. The complaint generally seeks (i) a finding of infringement and (ii) a permanent injunction be entered, terminating at the expiration of the patents-in-suit. We intend to defend this action vigorously.
On March 6, 2015, BioMarin Pharmaceutical Inc. and Merck & Cie filed a lawsuit against us in the U.S. District Court for the District of New Jersey. The complaint alleges infringement of U.S. Patent Nos. 7,566,462; 7,566,714; 7,612,073; 7,727,987; 8,003,126; 8,067,416; RE43,797; and 8,318,745 because we submitted an ANDA with a Paragraph IV certification to the FDA for approval of 100 mg sapropterin dihydrochloride oral tablets. The complaint generally seeks (i) a finding of infringement and (ii) a permanent injunction be entered, terminating at the expiration of the patents-in-suit. We intend to defend this action vigorously.
142
Table of Contents
On March 23, 2015, Helsinn Healthcare, Eisai, and Roche Palo Alto LLC filed a lawsuit against us in the U.S. District Court for the District of New Jersey. The complaint alleges infringement of U.S. Patent Nos. 7,947,724; 7,947,725; 7,960,424; 8,598,219; and 8,729,094, because we submitted an ANDA with a Paragraph IV certification to the FDA for approval of 0.25 mg/5 ml (0.05 mg/ml) palonosetron hydrochloride solution (sterile) for injection. The complaint generally seeks (i) a finding of infringement and (ii) a permanent injunction be entered, terminating at the expiration of the patents-in-suit. We intend to defend this action vigorously.
Industry related matters
Beginning in September 2003, we, along with numerous other pharmaceutical companies, have been named as a defendant in actions brought by the Attorneys General of Illinois, Kansas, and Utah, as well as a state law qui tam action brought on behalf of the state of Wisconsin by Peggy Lautenschlager and Bauer & Bach, LLC, alleging generally that the defendants defrauded the state Medicaid systems by purportedly reporting or causing the reporting of AWP and/or “Wholesale Acquisition Costs” that exceeded the actual selling price of the defendants’ prescription drugs. During the year ended December 31, 2013, we recorded $25.7 million as “Settlements and loss contingencies, net” on the consolidated statements of operations as we continued to periodically assess and estimate our remaining potential liability. On January 28, 2014, we settled the claims brought by the State of Kansas for $1.8 million. On February 5, 2014, we settled the claims brought by the State of Utah for $2.1 million. On June 2, 2014, we settled the claims brought by the State of Illinois for $28.5 million, including attorneys’ fees and costs. The amounts provided for 2013 represents the amounts settled, less amounts previously accrued. Other than as described below, all of the above AWP cases against the Company have been concluded.
On February 17, 2014, the Dane County Circuit Court for the State of Wisconsin dismissed the state law qui tam action brought on behalf of the state of Wisconsin by Peggy Lautenschlager and Bauer & Bach, LLC. On June 12, 2014, the Dane County Circuit Court denied the plaintiffs’ renewed motion to amend the complaint and issued a final order of dismissal on the merits, without prejudice. The plaintiffs subsequently appealed the ruling, and on September 22, 2014, the Wisconsin Court of Appeals dismissed the plaintiffs’ appeal. On August 11, 2014, plaintiffs filed a similar AWP qui tam action under seal in the Dane County Circuit Court, and the State of Wisconsin declined to intervene on December 19, 2014. On January 13, 2015, the Dane County Circuit Court unsealed the complaint. The complaint generally seeks (i) a judgment for qui tam plaintiffs; (ii) a declaration that defendants’ actions violated Wis. Stat. § 20.931; (iii) an award of treble damages to the State; (iv) an order that defendants pay civil penalties for statutory violations of not less than $5,000 for each violation; and (v) an award of an appropriate share of the proceeds to qui tam plaintiffs. We intend to vigorously defend this lawsuit.
The Attorneys General of Florida, Indiana and Virginia and the U.S. Office of Personnel Management (the “USOPM”) have issued subpoenas, and the Attorneys General of Michigan, Tennessee, Texas, and Utah have issued civil investigative demands, to us. The demands generally request documents and information pertaining to allegations that certain of our sales and marketing practices caused pharmacies to substitute ranitidine capsules for ranitidine tablets, fluoxetine tablets for fluoxetine capsules, and two 7.5 mg buspirone tablets for one 15 mg buspirone tablet, under circumstances in which some state Medicaid programs at various times reimbursed the new dosage form at a higher rate than the dosage form being substituted. We have provided documents in response to these subpoenas to the respective Attorneys General and the USOPM. The aforementioned subpoenas and civil investigative demands culminated in the federal and state law qui tam action brought on behalf of the United States and several states by Bernard Lisitza. The complaint was unsealed on August 30, 2011. Lisitza’s corrected second amended complaint generally seeks (i) a finding that defendants violated and be enjoined from future violations of the federal False Claims Act and state false claims acts; (ii) treble damages and maximum civil penalties for each violation of the federal False Claims Act and state false claims acts; (iii) an applicable percentage share of the proceeds; and (iv) expenses, fees, and costs. The United
143
Table of Contents
States intervened in this action on July 8, 2011 and filed a separate complaint on September 9, 2011, alleging claims for violations of the Federal False Claims Act and common law fraud. The United States’ second corrected complaint generally seeks (i) treble damages and civil penalties for violations under the federal False Claims Act and (ii) compensatory and punitive damages for common law fraud. The states of Michigan and Indiana have also intervened as to claims arising under their respective state false claims acts, common law fraud, and unjust enrichment. Michigan’s complaint generally seeks (i) treble damages and civil penalties and (ii) common law compensatory and punitive damages. Indiana’s amended complaint generally seeks treble damages, costs, and attorney’s fees. We intend to vigorously defend these lawsuits.
Other
On March 19, 2009, we were served with a subpoena by the DOJ requesting documents related to Par Specialty’s marketing of Megace® ES. The subpoena indicated that the DOJ was investigating promotional practices in the sales and marketing of Megace® ES. We cooperated with the DOJ in this inquiry. On March 5, 2013, we entered into a settlement agreement with the DOJ that terminated the DOJ’s investigation. The settlement agreement provided for our payment of $45.0 million (plus interest and fees) and included a plea agreement with the New Jersey Criminal Division of the DOJ in which the Company admitted to a single count of misdemeanor misbranding, a civil settlement with the DOJ, a state settlement encompassing forty-nine states (one state declined to participate due to the small amount of its potential recovery), and a release from each of these entities in favor of the Company related to the practices at issue in the terminated investigation. We accrued for the settlement in the period from January 1, 2012 through September 28, 2012 (Predecessor). The settlement was paid in 2013.
On August 6, 2014, we received a subpoena from the Office of the Attorney General of the State of Connecticut requesting documents related to our agreement with Covis Pharma S.a.r.l. to distribute an authorized generic version of Covis’s Lanoxin® (digoxin) oral tablets. We completed our response on October 28, 2014.
On December 5, 2014, we received a subpoena from the Antitrust Division of the DOJ requesting documents related to communications with competitors regarding our authorized generic version of Covis’s Lanoxin® (digoxin) oral tablets and our generic doxycycline products. We intend to cooperate fully with the Department of Justice’s inquiry.
On February 3, 2015, we received a Civil Investigative Demand from Office of the Attorney General of the State of Alaska instructing production of, among other documents, all production in the on-going lawsuit filed against us in 2009 by the Bureau of Competition for the FTC and currently on remand to the U.S. District Court for the Northern District of Georgia, described above under “Business—Legal proceedings—Patent related matters.” We intend to comply fully with the Civil Investigative Demand.
On February 9, 2015, we received a Civil Investigative Demand from the FTC instructing production of, among other documents, all documents related to our license agreement and manufacturing and supply agreement with Concordia Pharmaceuticals, Inc. (the “Concordia Agreements”) relating to our sale of clonidine hydrochloride extended release tablets, the generic version of Concordia’s Kapvay® (the “FTC Investigation”). The Company has negotiated a settlement of the FTC Investigation under which it will agree to entry of an FTC order prohibiting the Company from enforcing any provision of the Concordia Agreements that would prevent Concordia from marketing an authorized generic version of Kapvay® and prohibiting any future agreement between a brand-name company and us that would prevent the brand-name company from marketing an authorized generic version of a branded drug during any period of time when there is no patent in effect and listed in FDA’s publication Approved Drug Products with Therapeutic Equivalence Evaluations, also known as the “Orange Book,” covering the branded drug. Under the order, we will be subject to certain antitrust
144
Table of Contents
compliance and reporting requirements typical of FTC orders. The settlement and entry of the agreed-upon order are subject to initial acceptance by the FTC, publication of the settlement’s terms and a period of public comment, and the FTC’s final acceptance of the settlement.
We are, from time to time, a party to certain other litigations, including product liability litigations. We believe that these litigations are part of the ordinary course of our business and that their ultimate resolution will not have a material effect on our financial condition, results of operations or liquidity. We intend to defend or, in cases where we are the plaintiff, to prosecute these litigations vigorously.
Information technology
Our Information Technology (“IT”) contributes state-of-the-industry infrastructure for reliable and compliant operations, business-driven solutions that align with our objectives for profitable growth and innovative ideas bound to business performance and efficiency goals. Our IT department is organized into three departments: Business Applications, Technology Operations, and Scientific Systems. Each department maintains its own development, implementation and support teams.
| • | The Business Applications department purchases, develops, and maintains business applications systems jointly with internal departments. This department follows industry best practices in project management, systems development life cycle, change management, account management, computer systems validation, and data archiving. |
| • | The Technology Operations department purchases, deploys and maintains computing and communication infrastructure systems that enable reliable and efficient business operations. This department follows industry best practices in capacity planning, configuration management, incident/problem prevention and management, disaster recovery, data backup and restoration, data center operations, and security management. |
| • | The Scientific Systems department purchases, develops, and maintains systems that support Quality Control, Regulatory, and Manufacturing operations. This department follows industry best practices in GxP compliance, project management, systems development life cycle, change management, computer systems validation, and data archiving. |
145
Table of Contents
Properties
| Location | Use | Square feet | Owned/Leased | Expiration of lease | ||||||
| Chestnut Ridge, NY |
Manufacturing | 120,000 | Owned | |||||||
| Chestnut Ridge, NY |
Quality, Administrative | 40,000 | Owned | |||||||
| Chestnut Ridge, NY |
Future Administrative and Manufacturing | 135,000 | Owned | |||||||
| Chestnut Ridge, NY |
Research | 61,430 | Leased | December 2024 | ||||||
| Montebello, NY |
Distribution | 190,000 | Leased | January 2024 | ||||||
| Woodcliff Lake, NJ |
Administrative | 61,000 | Leased | March 2016 | ||||||
| Parsippany, NJ |
Administrative | 19,000 | Leased | July 2021 | ||||||
| Irvine, CA |
Administrative, Quality | 40,500 | Leased | March 2016 | ||||||
| Irvine, CA |
Manufacturing, Warehouse | 40,700 | Leased | December 2017 | ||||||
| Irvine, CA |
Research | 26,800 | Leased | August 2018 | ||||||
| Rochester, MI (1) |
Manufacturing | 140,000 | Owned | |||||||
| Rochester, MI (1) |
Warehouse | 44,000 | Owned | |||||||
| Rochester, MI (1) |
Quality, Research | 65,000 | Owned | |||||||
| Rochester, MI (1) |
Utilities | 11,650 | Owned | |||||||
| Rochester, MI (1) |
Administrative | 59,500 | Owned | |||||||
| Stratford, CT |
Manufacturing, Research | 16,500 | Leased | September 2021(2) | ||||||
| Stratford, CT |
Distribution | 8,000 | Leased | December 2021 | ||||||
| Chennai, India |
Administrative, Manufacturing, Research | 95,000 | Owned | |||||||
| Chennai, India |
CRO | 22,900 | Leased | January 2018 | ||||||
| Watford, UK |
Administrative | 1,000 | Leased | November 2015 | ||||||
|
| ||||||||||
| (1) | In February 2014, in conjunction with our acquisition of Par Sterile, we acquired an 80-acre site in Rochester, MI. |
| (2) | Approximately 13,300 square feet of leased space is set to expire in November 2018. |
We believe that our owned and leased properties are sufficient in size, scope and nature to meet our anticipated needs for the reasonably foreseeable future. See “Management’s discussion and analysis of financial condition and results of operations—Financial condition” and Note 20 to our audited consolidated financial statements which are included elsewhere in this prospectus.
Par Pharmaceutical is managed and/or served out of all the properties noted above. Par Specialty is managed and/or served out of certain of the New York and New Jersey properties noted above.
146
Table of Contents
Directors and Executive Officers
Below is a list of names, ages and positions, and a brief account of the business experience, of the individuals who are serving as our executive officers and our directors as of March 31, 2015.
| Name | Age | Position | ||||
| Paul V. Campanelli | 53 | Chief Executive Officer and Director | ||||
| Thomas J. Haughey |
51 | General Counsel and Chief Administrative Officer | ||||
| Michael A. Tropiano |
57 | Executive Vice President and Chief Financial Officer | ||||
| Terrance J. Coughlin |
49 | Chief Operating Officer | ||||
| Patrick G. LePore |
59 | Director (Chairman) | ||||
| Todd B. Sisitsky |
43 | Director | ||||
| Jeffrey K. Rhodes |
40 | Director | ||||
| Sharad Mansukani |
45 | Director | ||||
|
| ||||||
Paul V. Campanelli has served as Chief Executive Officer and as a member of the board of directors since September 2012 following the closing of the Merger. Previously, he held certain roles at Par Pharmaceutical Companies, including Chief Operating Officer from November 2011 to September 2012 and Executive Vice President from February 2007 to November 2011. He also served as President of Par Pharmaceutical, our generic products division, from February 2007 to November 2011. As of November 2011, he assumed responsibility for Par Specialty, our branded products division. He was Executive Vice President, Business Development and Licensing of Par Pharmaceutical from September 2006 to March 2007. Mr. Campanelli also served as Par Pharmaceutical’s Senior Vice President, Business Development and Licensing, from March 2004 to September 2006, and as Vice President, Business Development, from April 2002 to March 2004. Mr. Campanelli’s past and ongoing management experience in the pharmaceutical industry as well as his intimate understanding of our day-to-day operations as Chief Executive Officer led to the conclusion that he should serve as a director of our company.
Thomas J. Haughey has served as General Counsel and Chief Administrative Officer since September 2012 following the closing of the Merger. Previously, he held certain roles at Par Pharmaceutical Companies, including as General Counsel and Chief Administrative Officer since November 2003 and October 2008, respectively, except during the period from November 2011 to November 2013 during which time he served as President. From March 2006 until October 2008, he served as Executive Vice President of Par Pharmaceutical Companies, and from November 2003 until November 2011, he served as Secretary. Prior to joining us, Mr. Haughey had served for more than five years as Legal Director of Licensing in the Law Department of Schering-Plough Corporation.
Michael A. Tropiano has served as Executive Vice President and Chief Financial Officer since September 2012 following the closing of the Merger. Previously he held certain roles at Par Pharmaceutical Companies, including as Executive Vice President and Chief Financial Officer since July 2010 and as Vice President and Treasurer from August 2005 to July 2010. Before joining us, Mr. Tropiano served from 2001 to July 2005 as Vice President and Corporate Treasurer of Medpointe Pharmaceuticals and Assistant Treasurer from 1984 to 2001 of Carter-Wallace, Inc. Mr. Tropiano is a Chartered Financial Consultant.
147
Table of Contents
Terrance J. Coughlin has served as Chief Operating Officer since April 2014. From April 2007 to October 2013, Mr. Coughlin served as President and Chief Executive Officer of Glenmark Generics, Inc. USA/Glenmark Generics Limited, a generic drug company focused on developing, manufacturing, selling and distributing generic drugs. From September 2004 to April 2007 he served as President. During his tenure at Glenmark, he had overall responsibility for the North American, Western European and Eastern European generics businesses, as well as the global API business and Glenmark’s generics operations in India. Prior to Glenmark, he served as Senior Vice President of Dr. Reddy’s Laboratories, Inc., which he joined in 1995.
Patrick G. LePore served as Executive Chairman of the board of directors following the closing of the Merger in September 2012 until January 31, 2013, and as Chairman since that time. From August 2007 to the closing of the Merger in September 2012, Mr. LePore served as Chairman of the board of directors of Par Pharmaceutical Companies and Chief Executive Officer (and President until November 2011). He was a director of Par Pharmaceutical Companies from May 2006 until January 31, 2013. From 2002 to 2005, Mr. LePore was President of the healthcare marketing group at Cardinal Health, Inc. From 1984 until 2002, he was with BLP Group Companies, a full service medical communication/education company, as Chairman, President and Chief Executive Officer. BLP Group Companies was sold to Cardinal Health in 2002. Mr. LePore currently serves on the board of PharMerica Corporation (NYSE:PMC), a pharmacy management service provider in long-term care settings and in the home, and serves as chairman of the board of AgeneBio, Inc., a private biotech company based in Baltimore. He is also a trustee of Villanova University. Mr. LePore’s knowledge of our company and our industry based on his experience as our former Chief Executive Officer and his experience as a pharmaceutical executive and board member of pharmaceutical companies led to the conclusion that he should serve as a director of our company.
Todd B. Sisitsky has been a director since the closing of the Merger in September 2012. Mr. Sisitsky is a partner of TPG, where he leads the firm’s investment activities in the healthcare services, pharmaceutical and medical device sectors. He has played leadership roles in connection with TPG’s investments in Aptalis (GI-focused specialty pharmaceutical company, which is now owned by Actavis), Biomet (leading orthopedic implant manufacturer), Fenwal Transfusion Therapies (blood product technologies business), IASIS Healthcare (Tennessee-based acute care hospital company), Surgical Care Affiliates (ambulatory surgery center business carved out from HealthSouth Corporation), HealthScope (hospital and pathology company based in Australia), IMS Health (leading global data services and consulting business to several segments of the healthcare industry) and Immucor (leading automated blood screening and testing business). Mr. Sisitsky serves on the board of directors of IASIS Healthcare Corporation, Immucor, Inc., Surgical Care Affiliates, Inc., IMS Health Holdings, Inc. and Biomet, Inc. He also serves on the board of the global not-for-profit organization, the Campaign for Tobacco Free Kids, as well as on the Dartmouth Medical School Board of Overseers. Prior to joining TPG in 2003, Mr. Sisitsky was with Forstmann Little & Company and Oak Hill Capital Partners. He received an M.B.A. from the Stanford Graduate School of Business, where he was an Arjay Miller Scholar, and earned his undergraduate degree from Dartmouth College, where he graduated summa cum laude. Mr. Sisitsky’s financial expertise as well as his experience as a director of other companies in the healthcare industry led to the conclusion that he should serve as a director of our company.
Jeffrey K. Rhodes has been a director since the closing of the Merger in September 2012. Mr. Rhodes is a partner of TPG where he helps lead the firm’s investment activities in the healthcare services, pharmaceutical and medical device sectors. He is involved with TPG’s investments and serves on the board of directors of Biomet, Inc., IMS Health Holdings, Inc., Immucor Inc., Surgical Care Affiliates, Inc. and Envision Pharmaceutical Holdings, Inc. (an Ohio-based full service pharmacy benefit management company). Prior to joining TPG in 2005, Mr. Rhodes was with McKinsey & Company and Article27 LTD, a start-up software company. He was a founding board member of the Healthcare Private Equity Association, a non-profit trade association that represents the U.S. healthcare private equity industry. Mr. Rhodes earned his M.B.A. from the Harvard Business
148
Table of Contents
School, where he was a Baker Scholar, and earned his B.A. in Economics from Williams College, where he graduated summa cum laude. Mr. Rhodes’s financial expertise as well as his experience as a director of other companies in the healthcare industry led to the conclusion that he should serve as a director of our company.
Sharad Mansukani has been a director since the closing of the Merger in September 2012. He serves as a senior advisor to TPG and as a strategic advisor to the board of directors of Cigna Corporation. Dr. Mansukani has served as Chairman of the board of directors of Envision Pharmaceutical Holdings, Inc. since November 2013. He serves on the board of directors of IASIS Healthcare Corporation, Surgical Care Affiliates, Inc., IMS Health Holdings, Inc. and Immucor, Inc. He also serves on the board of directors of Children’s Hospital of Philadelphia and on the editorial boards of the American Journal of Medical Quality, Managed Care, Biotechnology Healthcare, and American Health & Drug Benefits. Dr. Mansukani previously served as Vice Chairman-Strategic Planning and a member of the board of directors of HealthSpring, Inc. from June 2010 to January 2012; from November 2008 to June 2010 he was Executive Vice President and Chief Strategy Officer. He also previously served as a senior advisor to the Administrator of Centers for Medicare and Medicaid Services (“CMS”) from 2003 to 2005, and as Senior Vice President and Chief Medical Officer of Health Partners, a non-profit Medicaid and Medicare health plan owned at the time by Philadelphia-area hospitals. Dr. Mansukani was appointed to Medicare’s Program Advisory and Oversight Committee by the Secretary of the Dept. of Health and Human Services, which was established by the U.S. Congress and is tasked to advise Medicare upon CMS payment policies. Dr. Mansukani completed a residency and fellowship in ophthalmology at the Perelman School of Medicine at the University of Pennsylvania, a fellowship in quality management and managed care at the Wharton School of Business and is board certified in medical management by the American College of Physician Executives. Dr. Mansukani’s expertise in the fields of medicine, managed care and medical management as well as his experience as a director and/or advisor to CMS and other companies in the healthcare industry led to the conclusion that he should serve as a director of our company.
Board composition and director independence
Our business and affairs are managed under the direction of the board of directors. Our board currently consists of five directors and the TPG Funds have the right to nominate, and have nominated, all of the directors that serve on the board. Currently, our directors serve for terms of one year, or until their successors are duly elected and qualified. Our certificate of incorporation that will be in effect upon closing of this offering provides that our board of directors shall consist of at least three directors but not more than 15 directors and that the number of directors may be fixed from time to time by resolution of our board of directors. Under the proposed stockholders agreement described below, we have agreed to take necessary action to maintain the size of the board of directors at no greater than five directors, subject to applicable laws and regulations. Our board of directors will be divided into three classes, as follows:
| • | Class I, which will initially consist of Messrs. Campanelli and Sisitsky, whose terms will expire at our annual meeting of stockholders to be held in 2016; |
| • | Class II, which will initially consist of Messrs. Rhodes and Mansukani, whose terms will expire at our annual meeting of stockholders to be held in 2017; and |
| • | Class III, which will initially consist of Mr. LePore, whose term will expire at our annual meeting of stockholders to be held in 2018. |
Upon the expiration of the initial term of office for each class of directors, each director in such class shall be elected for a term of three years and serve until a successor is duly elected and qualified or until his or her earlier death, resignation or removal. Any additional directorships resulting from an increase in the number of directors or a vacancy may be filled by the directors then in office.
149
Table of Contents
In connection with this offering, we will enter into a stockholders agreement with the TPG Funds governing their nomination rights with respect to our board of directors following this offering. Under the agreement, we are required to take all necessary action to cause the board of directors to include individuals designated by the TPG Funds in the slate of nominees recommended by the board of directors for election by our stockholders, as follows:
| • | for so long as the TPG Funds own at least 50% of the shares of our common stock held by them following the closing of this offering, they will be entitled to designate four individuals for nomination to serve on our board of directors; |
| • | when the TPG Funds own less than 50% but at least 10% of the shares of our common stock held by them following the closing of this offering, they will be entitled to designate three individuals for nomination; |
| • | when the TPG Funds own less than 10% but at least 5% of the shares of our common stock held by them following the closing of this offering, they will be entitled to designate two individuals for nomination; and |
| • | when the TPG Funds own less than 5% but at least 3% of the shares of our common stock held by them following the closing of this offering, they will be entitled to designate one individual for nomination. |
The TPG Funds will have also have the exclusive right to remove their designees and to fill vacancies created by the removal or resignation of their designees, and we are required to take all necessary action to cause such removals and fill such vacancies at the request of the TPG Funds.
Controlled company exception
Following the completion of this offering, we expect to be a “controlled company” under the rules of because more than 50% of our outstanding voting power will be held by TPG. See “Principal and selling stockholders.” We intend to rely upon the “controlled company” exception relating to the board of directors and committee independence requirements under the rules of the NYSE. Pursuant to this exception, we will be exempt from the rules that would otherwise require that our board of directors consist of a majority of independent directors and that our compensation and management development committee and nominating and governance committee be composed entirely of independent directors. The “controlled company” exception does not modify the independence requirements for the audit committee, and we intend to comply with the requirements of the Exchange Act and the rules of the NYSE, which require that our audit committee have at least one independent director upon consummation of this offering, consist of a majority of independent directors within 90 days following the effective date of the registration statement of which this prospectus forms a part and exclusively of independent directors within one year following the effective date of the registration statement of which this prospectus forms a part.
Our board of directors has determined that is an independent director under the rules of the NYSE. In making this determination, the board of directors considered the relationships that each such non-employee director has with our company and all other facts and circumstances that the board of directors deemed relevant in determining their independence, including beneficial ownership of our common stock.
Board committees
Upon the completion of this offering, our board of directors will have three standing committees: the audit committee; the compensation and management development committee; and the nominating and corporate governance committee. Each of the committees operates under its own written charter adopted by the board of
150
Table of Contents
directors, each of which will be available on our website upon closing of this offering. Under the terms of the proposed stockholders agreement, the TPG Funds have the right to appoint a director to serve on each of our committees, subject to NYSE and SEC rules.
Audit committee
Following this offering, our audit committee will be composed of , with serving as chairman of the committee. We anticipate that, prior to the completion of this offering, our audit committee will determine that meets the definition of “independent director” under the rules of the NYSE and under Rule 10A-3 under the Exchange Act. Within 90 days following the effective date of the registration statement of which this prospectus forms a part, we anticipate that the audit committee will consist of a majority of independent directors, and within one year following the effective date of the registration statement of which this prospectus forms a part, the audit committee will consist exclusively of independent directors. None of our audit committee members simultaneously serves on the audit committees of more than three public companies, including ours. Our board of directors has determined that is an “audit committee financial expert” within the meaning of the SEC’s regulations and applicable listing standards of the NYSE. The audit committee’s responsibilities upon completion of this offering will include:
| • | appointing, approving the compensation of, and assessing the qualifications, performance and independence of our independent registered public accounting firm; |
| • | pre-approving audit and permissible non-audit services, and the terms of such services, to be provided by our independent registered public accounting firm; |
| • | reviewing the internal audit plan with the independent registered public accounting firm and members of management responsible for preparing our financial statements; |
| • | reviewing and discussing with management and the independent registered public accounting firm our annual and quarterly financial statements and related disclosures as well as critical accounting policies and practices used by us; |
| • | reviewing the adequacy of our internal control over financial reporting; |
| • | reviewing all related party transactions for potential conflict of interest situations and approving all such transactions; |
| • | establishing policies and procedures for the receipt and retention of accounting-related complaints and concerns; |
| • | recommending, based upon the audit committee’s review and discussions with management and the independent registered public accounting firm, the inclusion of our audited financial statements in our Annual Report on Form 10-K; |
| • | reviewing and assessing the adequacy of the committee charter and submitting any changes to the board of directors for approval; |
| • | monitoring our compliance with legal and regulatory requirements as they relate to our financial statements and accounting matters; |
| • | preparing the audit committee report required by the rules of the SEC to be included in our annual proxy statement; and |
| • | reviewing and discussing with management and our independent registered public accounting firm our earnings releases. |
151
Table of Contents
Compensation and management development committee
Following this offering, our compensation and management development committee will be composed of , with serving as chairman of the committee. The compensation and management development committee’s responsibilities upon completion of this offering will include:
| • | annually reviewing and approving corporate goals and objectives relevant to the compensation of our chief executive officer and our other executive officers; |
| • | evaluating the performance of our chief executive officer in light of such corporate goals and objectives and determining and approving the compensation of our chief executive officer; |
| • | reviewing and approving the compensation of our other executive officers; |
| • | appointing, compensating and overseeing the work of any compensation consultant, legal counsel or other advisor retained by the compensation and management development committee; |
| • | conducting the independence assessment outlined in the rules of the NYSE with respect to any compensation consultant, legal counsel or other advisor retained by the compensation and management development committee; |
| • | reviewing and assessing the adequacy of the committee charter and submitting any changes to the board of directors for approval; |
| • | reviewing and establishing our overall management compensation philosophy and policy; |
| • | overseeing and administering our equity compensation and similar plans; |
| • | reviewing and approving our policies and procedures for the grant of equity-based awards; |
| • | reviewing and making recommendations to the board of directors with respect to director compensation; and |
| • | reviewing and discussing with management the compensation discussion and analysis to be included in our annual proxy statement or Annual Report on Form 10-K. |
Nominating and corporate governance committee
Following this offering, our nominating and corporate governance committee will be composed of , with serving as chairman of the committee. The nominating and corporate governance committee’s responsibilities upon completion of this offering will include:
| • | developing and recommending to the board of directors criteria for board and committee membership; |
| • | establishing procedures for identifying and evaluating board of director candidates, including nominees recommended by stockholders; |
| • | identifying individuals qualified to become members of the board of directors; |
| • | recommending to the board of directors the persons to be nominated for election as directors and to each of the board’s committees; |
| • | developing and recommending to the board of directors a set of corporate governance principles; |
| • | articulating to each director what is expected, including reference to the corporate governance principles and directors’ duties and responsibilities; |
| • | reviewing and recommending to the board of directors practices and policies with respect to directors; |
152
Table of Contents
| • | reviewing and recommending to the board of directors the functions, duties and compositions of the committees of the board of directors; |
| • | reviewing and assessing the adequacy of the committee charter and submitting any changes to the board of directors for approval; |
| • | providing for new director orientation and continuing education for existing directors on a periodic basis; |
| • | performing an evaluation of the performance of the committee; and |
| • | overseeing the evaluation of the board of directors and management. |
Director experience and qualifications
The board of directors believes that each director should possess a combination of skills, professional experience, and diversity of viewpoints necessary to oversee our business. In addition, it believes that there are certain attributes that every director should possess, as reflected in its membership criteria. Accordingly, the board of directors considers the qualifications of directors and director candidates individually and in the broader context of its overall composition and our current and future needs.
Among other things, the board of directors has determined that it is important to have individuals with the following skills and experiences:
| • | leadership experience, as directors with experience in significant leadership positions possess strong abilities to motivate and manage others and to identify and develop leadership qualities in others; |
| • | knowledge of our industry, particularly distribution strategy and vendor and customer relations, which is relevant to understanding our business and strategy; |
| • | operations experience, as it gives directors a practical understanding of developing, implementing and assessing our business strategy and operating plan; |
| • | risk management experience, which is relevant to oversight of the risks facing our business; |
| • | financial/accounting experience, particularly knowledge of finance and financial reporting processes, which is relevant to understanding and evaluating our capital structure, financial statements and reporting requirements; and |
| • | strategic planning experience, which is relevant to the board of director’s review of our strategies and monitoring their implementation and results. |
Board oversight of risk management
While the full board of directors has the ultimate oversight responsibility for the risk management process, its committees oversee risk in certain specified areas. In particular, our audit committee oversees management of enterprise risks as well as financial risks. Our compensation and management development committee is responsible for overseeing the management of risks relating to our executive compensation plans and arrangements and the incentives created by the compensation awards it administers. Our nominating and corporate governance committee oversees risks associated with corporate governance, business conduct and ethics, and is responsible for overseeing the review and approval of related party transactions. Pursuant to the board of directors’ instruction, management regularly reports on applicable risks to the relevant committee or the full board of directors, as appropriate, with additional review or reporting on risks conducted as needed or as requested by the board of directors and its committees.
153
Table of Contents
Code of conduct
We will adopt a code of conduct that applies to all of our employees, including our principal executive officer and principal financial officer. In connection with this offering, we will make our code of conduct available on our website. We intend to disclose any amendments to our codes, or any waivers of their requirements, on our website.
154
Table of Contents
Compensation discussion and analysis
This compensation discussion and analysis describes our executive compensation philosophy and objectives and the key elements of, and the decisions made and actions taken with respect to, our compensation program for 2014 as they applied to the individuals identified in the “Summary compensation table for fiscal years 2014, 2013 and 2012” below.
The compensation and management development committee of our board of directors (the “Committee”), which is comprised of Mr. Campanelli, who is the chair of the Committee, as well as Messrs. LePore and Sisitsky and Dr. Mansukani, generally oversees our executive compensation program. However, since the Merger, certain aspects of our executive compensation program, including Mr. Coughlin’s compensation arrangements, which were entered into in 2014, and grants of certain equity awards, have been approved by our board of directors.
The capitalized term “Named Executives” refers to the following executive officers whose compensation is required to be reported in the “Summary compensation table for fiscal years 2014, 2013 and 2012” with respect to 2014.
| Name | Position | |
| Paul V. Campanelli |
Chief Executive Officer | |
| Michael A. Tropiano |
Executive Vice President and Chief Financial Officer | |
| Thomas J. Haughey |
General Counsel and Chief Administrative Officer | |
| Terrance J. Coughlin |
Chief Operating Officer | |
Because we only have four executive officers, we are only required to report the compensation of four individuals in the “Summary compensation table for fiscal years 2014, 2013 and 2012” with respect to 2014.
Executive summary
The overall objective of our executive compensation program is to effectively reward, motivate and retain individuals who are critical to the long-term success of our business. Our compensation decisions are guided by a “pay for performance” philosophy intended to align our compensation policies with the interests of our stockholders by tying a substantial portion of an executive’s overall compensation opportunity to the achievement of key strategic business and financial objectives.
Highlights of our compensation practices
The Committee evaluates our compensation practices and programs with the goal of establishing fairness in compensation for our employees and our stockholders alike. The following are highlights of our current compensation practices:
| • | Performance-based compensation. Our cash-based annual incentive program and equity-based long-term incentive program, which comprise a substantial portion of the total compensation opportunities for our Named Executives, are performance-oriented. The cash bonus payouts under the annual incentive program are contingent upon the achievement of our financial and strategic goals. Under our long-term incentive |
155
Table of Contents
| program, half of the stock options granted to our Named Executives are subject to performance-based vesting based on our achievement of specified adjusted EBITDA goals or generating certain returns on the Sponsor’s investment in us. See “Annual cash incentive” and “Long-term incentive” below. |
| • | No tax gross ups and limited benefits. We do not provide our executive officers with special benefits, supplemental executive retirement plans, or tax gross-ups. We provide our executive officers with modest perquisites and other personal benefits which we believe are reasonable and serve as useful retention tools. See “Traditional employee benefits and executive perquisites” below. |
| • | Compensation risk assessment. We believe that our compensation programs are not designed to encourage our Named Executives or other employees to take unnecessary risks that would be reasonably likely to have a material adverse effect on us. See “Compensation risk assessment” below. |
| • | Clawback policy. Each of our Named Executives is subject to our Executive Financial Recoupment Program under which we can recoup incentive compensation in the event the executive engages in certain types of misconduct or fails to properly supervise employees who engage in misconduct. |
| • | No single trigger vesting. We do not provide for automatic single trigger vesting of our long-term incentive awards. |
Highlights of our 2014 performance and related compensation decisions
The following are highlights of our 2014 performance and related compensation decisions:
| • | We achieved adjusted EBITDA (as described below) of $433.8 million for the year, exceeding our adjusted EBITDA target by 18.5%. |
| • | We generated $414.8 million in operating cash flow (as described below) in 2014, which exceeded our operating cash flow target by 29.8%. |
| • | Consistent with the Company’s strategic goal of obtaining exclusive marketing rights for generic pharmaceutical products, we submitted 30 ANDAs to the FDA in 2014, exceeding our target by 15.4%. |
| • | We significantly bolstered our product offerings through the acquisition and integration of Par Sterile. |
| • | In accordance with our “pay for performance” philosophy, because we significantly exceeded most of our financial targets and strategic objectives for 2014, we funded our annual incentive bonus plan at 193% of the aggregate target for the Named Executives (154% of the aggregate target for all other eligible employees). See “Annual cash incentive” below. |
Compensation philosophy and policies regarding executive compensation
In addition to maintaining an executive compensation program that will provide competitive levels of total compensation necessary to attract and retain talented executives who will contribute to our financial success, our executive compensation program is guided by a “pay for performance” philosophy. This philosophy is intended to align executives’ interests with those of our stockholders and to reward executives when Company and individual performance are strong. Therefore, we provide a substantial portion of Named Executives’ overall compensation opportunity in the form of an annual incentive bonus, the payment of which is subject to the achievement of key financial and strategic business objectives. We also provide a substantial portion of Named Executives’ overall compensation opportunity in the form of stock options, the value of which is directly tied to the performance of our stock. In addition, half of the stock options granted to our Named Executives are subject to time-based vesting and the other half are subject to performance-based vesting based on our achievement of specified adjusted EBITDA goals or generating certain returns on the Sponsor’s investment in us.
156
Table of Contents
The following principles influence and guide our compensation decisions:
| • | compensation should attract, motivate and retain qualified executives; |
| • | compensation should reflect a “pay for performance” philosophy by focusing on financial targets and strategic objectives; |
| • | compensation should reflect accountability and achievement; and |
| • | compensation decisions should reflect alignment with stockholder interests. |
The Committee follows these principles when making compensation decisions with respect to our Named Executives.
The compensation setting process and benchmarking
A year-round process
Our compensation planning process, including evaluation of management performance and consideration of the business environment, is a year-round process. Compensation decisions are designed to promote our fundamental business objectives and strategies which, in turn, drive long-term stockholder value.
The Committee’s role in the process
The compensation of our Named Executives is determined by the Committee, except where our board of directors has approved certain arrangements, such as Mr. Coughlin’s compensation arrangements and grants of certain equity awards. The Committee’s responsibilities generally include:
| • | reviewing and evaluating our equity incentive arrangements and granting equity incentive awards to our Named Executives; |
| • | determining bonus payouts under the prior year’s annual incentive program; |
| • | reviewing performance milestones and strategic objectives for the annual incentive program for the upcoming year; |
| • | reviewing management recommendations regarding our compensation program; |
| • | reviewing our Chief Executive Officer’s achievement of the prior year’s goals and setting of objectives for the upcoming year; and |
| • | addressing any other compensation related matters that require the attention of the Committee. |
Mr. Campanelli recuses himself from all Committee determinations of his own compensation.
Management’s role in the process
Management plays a role in the compensation-setting process, other than with respect to compensation for our Chief Executive Officer. The most significant aspects of management’s role are:
| • | our Chief Executive Officer, Chief Financial Officer and Senior Vice President of Human Resources review and recommend compensation plans; |
| • | our Named Executives recommend business targets and goals; |
157
Table of Contents
| • | our Chief Executive Officer evaluates the performance of the other Named Executives based on agreed-upon objectives; and |
| • | our Chief Executive Officer recommends salary, bonus levels and awards and long-term incentive awards for the other Named Executives. |
Our Chief Executive Officer and Senior Vice President of Human Resources establish the agenda for Committee meetings. Our Chief Executive Officer provides compensation recommendations as to our Named Executives and other key employees (other than himself) and participates in Committee meetings as the chair of the Committee.
Competitive compensation practices
Our compensation arrangements must be competitive in the marketplace in order to attract and retain highly-qualified executives to lead the Company. We have not, however, engaged in formal benchmarking practices with a third-party consultant since prior to the Merger in 2012. The components and levels of compensation for our Named Executives (other than Mr. Coughlin) were established by our board of directors in 2012 after the completion of the Merger, and have been adjusted since the Merger, after considering the factors described below. The components and levels of Mr. Coughlin’s compensation arrangement were negotiated between Mr. Coughlin, on the one hand, and the Company and Par Pharmaceutical, Inc., on the other hand in connection with his commencement of employment with us, based on industry compensation practices for the position of chief operating officer and Mr. Coughlin’s prior experience.
The Committee has also relied on the experience of its Sponsor-affiliated members and on analysis performed by the Sponsor that considers the compensation of our Named Executives in light of the compensation structure of other portfolio companies or private equity-backed companies in general.
Employment agreements
We have entered into employment agreements with our Named Executives in order to attract a high level of talent to the Company and, equally important to our success, to retain key executives to execute our business strategies. Our executive employment agreements also protect us by setting forth the applicable terms for terminations of employment and provide valuable protection against improper use of our confidential business information, competition with our business and solicitation of employees and customers during and following the employment term.
A more detailed description of our employment agreements appears under the heading “Narrative disclosure to summary compensation table and grants of plan based-awards table” below.
Components of executive compensation and decisions related to 2014 compensation for Named Executives
Described below are the key components and objectives of our executive compensation program for 2014 as it relates to our Named Executives.
Base salary
Base cash compensation is a critical element of executive compensation because it enables us to recruit and retain key executives. Base salaries for our Named Executives are set forth in employment agreements that were negotiated between each individual, on the one hand, and the Company and Par Pharmaceutical, Inc., on the other hand.
158
Table of Contents
The following table sets forth, as of December 31, 2014, each Named Executive’s base salary and percentage increase over the prior year.
| Name / position | Base salary |
Increase over prior year |
||||||
| Paul V. Campanelli, Chief Executive Officer |
$ | 871,250 | 2.5% | |||||
| Michael A. Tropiano, Executive Vice President and Chief Financial Officer |
$ | 486,875 | 2.5% | |||||
| Thomas J. Haughey, General Counsel and Chief Administrative Officer |
$ | 666,250 | 2.5% | |||||
| Terrance J. Coughlin, Chief Operating Officer |
$ | 550,000 | N/A | |||||
|
|
||||||||
The increases shown above reflect cost-of-living increases in base salaries that were approved for our employees generally and became effective in 2014.
In December 2014, each of our Named Executives (other than Mr. Campanelli) received an additional 2.5% cost of living increase in his base salary and, in recognition of his success in driving the Company’s exceptional performance, Mr. Campanelli’s base salary was increased to $950,000. The base salary increases approved in December 2014 became effective on January 1, 2015, and are not reflected in the table above.
Annual cash incentive
We provide an annual cash bonus opportunity to our Named Executives under our annual incentive program in order to drive Company and individual performance. Cash bonus payouts under the program are contingent on the achievement of key financial and strategic goals that are established at the beginning of the year by our Named Executives under the guidance and ultimate approval of the Committee. However, we do not follow a strict mathematical formula-based approach for determining the actual bonus awards, except that, as described below, threshold and maximum bonuses are determined based on the achievement of specified performance targets. Instead, we weigh each individual’s contribution to our performance in determining individual awards, as described below.
The “target” amount of each Named Executive’s cash bonus award is set as a percentage of his base salary. As position and responsibility increase, a greater portion of the Named Executive’s overall cash compensation opportunity is attributable to the annual incentive program, subjecting it to the achievement of our performance targets and thus placing it “at risk.” Accordingly, for 2014, the target bonus amount was set at 100% of base salary for Mr. Campanelli, 65% of base salary for Mr. Tropiano (increased from 60% for 2013 based on his outstanding performance and in recognition of the importance of his responsibilities for the business as a whole), 75% of base salary for Mr. Haughey, and 70% of base salary for Mr. Coughlin, which was pro-rated based upon the commencement date of his employment.
159
Table of Contents
The chief component of the bonus funding target for 2014 consisted of key financial metric targets approved by our board of directors at the beginning of the year and formally incorporated in our 2014 operating plan. We chose these metrics based upon our detailed analysis of projected sales, on a product-by-product basis, and expenses, based on annual spending required to achieve our short- and long-term goals. Taken as a group, these selected financial parameters provided an objective basis for determining whether our executives had successfully executed on our 2014 operating plan. The second component of the bonus funding target consisted of key strategic objectives that our board of directors determined would contribute to our longer-term growth and increased stockholder value. The following table sets forth the key financial targets set by our board of directors for 2014 and our actual performance for 2014:
2014 Financial performance objectives and actual performance
| 2014 Financial metrics: | 2014 Performance target |
2014 Performance results |
% of performance target achieved | |||
| Adjusted EBITDA(1) |
$366.1 million | $433.8 million | 118.5% | |||
| Adjusted Gross Margin(2) |
$613.3 million | $674.7 million | 110% | |||
| Operating Cash Flow(3) |
$319.5 million | $414.8 million | 129.8% | |||
| Capital Expenditures |
$52.1 million | $45.5 million | 87.3% | |||
| Research & Development Expenditures |
$124.2 million | $119.1 million | 95.9% | |||
| ANDAs Submitted |
21 - 26 | 30 | 115.4% | |||
| Product Launches(4) |
18 - 24 | 13 | 54.2% | |||
|
| ||||||
| (1) | “Adjusted EBITDA” is a non-GAAP financial measure that generally represents earnings (e.g., revenues less expenses) excluding interest, taxes, depreciation and amortization. In calculating adjusted EBITDA for cash incentive purposes in 2014, we added back to loss from continuing operations before benefit for income taxes: (a) amortization of inventory step up established with the purchase accounting related to the acquisition of Par Sterile, (b) certain legal and restructuring costs, (c) amortization expense related to intangible assets as well as intangible asset impairment recorded, (d) certain transaction costs, (e) litigation settlements and loss contingencies, (f) depreciation expense related to property, plant and equipment, (g) interest expense, including costs associated with debt repricing and extinguishment, (h) share-based compensation and (i) management fees. See the reconciliation of net income (loss) to adjusted EBITDA contained under “Selected historical consolidated financial data” above. |
| (2) | “Adjusted Gross Margin” is a non-GAAP measure that represents GAAP gross margin excluding amortization expense. |
| (3) | “Operating Cash Flow” is a non-GAAP measure that represents adjusted EBITDA, as defined above, adjusted for the net change in working capital (current assets less current liabilities) and other cash settled items related to restructuring charges, an annual monitoring fee paid to the Sponsor, and certain legal and accounting fees. |
| (4) | Our achievement level relative to our target number of products launched in 2014 was largely due to delays in the regulatory approval process that were outside of our control. We anticipate introducing many of the products we expected to launch in 2014 after receiving further regulatory approvals. |
Evaluation of achievement
We set a minimum threshold and a maximum payout for cash bonus payments: In the event that less than 85% of our targeted 2014 adjusted EBITDA goal was achieved, there would be no bonus payable (irrespective of the executive’s individual performance and the achievement of our other targets) unless the Committee exercised its discretion to fund the bonus pool for achievement against the other financial and performance metrics; and in the event that 133% or greater of targeted 2014 adjusted EBITDA goal was achieved, the bonus pool would be funded at 200% of target, subject to the Committee’s ability to make downward adjustments in amounts earned. The “Grants of plan-based awards for fiscal year 2014” table sets forth the hypothetical bonus awards available to our Named Executives in 2014 for achieving the minimum (or “threshold”) performance target, the “target” bonus award, and the maximum bonus award.
The Committee viewed 2014 as a very successful year as measured by our financial and operational performance and determined that it was appropriate to fund our annual incentive bonus plan at 193% of the
160
Table of Contents
aggregate target for our Named Executives. The primary reason for this funding level was the fact that the Company substantially exceeded its 2014 adjusted EBITDA goal and exceeded, or performed well against, a number of its other key financial metrics. In determining the funding level, the Committee also reviewed and took into account our strong 2014 operational performance, focusing specifically on the number of ANDAs submitted, the successful acquisition and integration of Par Sterile, which substantially enhanced our competitive standing, and the approval and launch of our generic version of Lovaza®, which represented the successful achievement of a long-term goal of the Company. For actual amounts awarded to each Named Executive, see the “Non-equity incentive plan compensation” column of the “Summary compensation table for fiscal years 2014, 2013 and 2012” below.
Long-term incentive
Equity-based compensation is an important element of our compensation program for our Named Executives. We believe that equity-based compensation is an effective long-term incentive and retention tool, and serves to align the interests of our Named Executives with our stockholders.
Our board of directors has granted options to purchase common stock of the Company (“options” or “stock options”) to senior management, including our Named Executives, under the Sky Growth Holdings Corporation 2012 Equity Incentive Plan, as amended (the “2012 EIP”).
All of our Named Executives, other than Mr. Coughlin, were employed at the time the Merger occurred and were granted option awards at that time that were intended to serve as long-term incentives covering a five-year time frame. In determining the size of each executive’s equity award, our board of directors considered factors such as the estimated long-term values of these awards, the size of prior awards granted to the executive, and the executive’s position and responsibilities. In 2014, we made additional option grants to each of our Named Executives (other than Mr. Coughlin) following the Sponsor’s purchase of additional shares of our common stock in connection with the acquisition of Par Sterile (described above under the heading “Recent acquisitions”), which had resulted in the equity ownership of our Named Executives (other than Mr. Coughlin) and other holders of our common stock being diluted. Our board of directors decided to make these grants in order to generally maintain the equity ownership levels of our Named Executives (on a fully diluted basis) before and after the additional equity purchase by the Sponsor. Because the long-term equity incentive grants made to our Named Executives (other than Mr. Coughlin) in 2012 were intended to provide incentives over a multi-year period, except for the anti-dilution grants described above, no equity grants were made to our Named Executives in 2014, other than Mr. Coughlin’s grants, as described below.
Mr. Coughlin’s option award, granted at his time of hire, was intended to be comparable in size to the awards made to our Named Executives who were employed at the time of the Merger, while still providing an appropriately-sized incentive based on factors such as internal equity and market conditions. Mr. Coughlin’s option award was also intended to cover a four-year time frame that generally aligns with the last four years of vesting opportunities for option awards granted to our other Named Executives in connection with the Merger. The Committee, upon the recommendation of Mr. Campanelli, also approved a supplemental stock option award to Mr. Coughlin in December 2014, which was granted to him on January 26, 2015, and therefore does not appear in the tables below. This supplemental grant of 588,235 stock options was made in recognition of Mr. Coughlin’s successful assumption of a key leadership role within the Company and contributions to our financial and operational results in 2014 and has vesting terms that align with the grants made to other Named Executives in connection with the Merger, except that it is intended to cover a three-year time frame that generally aligns with the last three years of vesting opportunities for those option awards.
Half of the stock options granted to our Named Executives in connection with the Merger are subject to time-based vesting; the other half of the stock options are subject to performance-based vesting. The time-based stock
161
Table of Contents
options vest over a five-year period and the performance-based stock options are eligible to vest over a five-year period based on our achievement of specified adjusted EBITDA goals for each of the five fiscal years beginning with our 2013 fiscal year, subject to the executive’s remaining in continuous employment with (or provides other service to) us through an applicable anniversary of the vesting commencement date (which is September 28, 2012 for option awards granted in connection with the Merger). To the extent the performance-based stock options do not vest because the adjusted EBITDA goal is not met (and is not met based on the combined adjusted EBITDA for a given fiscal year and the next succeeding fiscal year), the stock options will remain outstanding and vest (together with any other unvested performance-based stock options) if the Sponsor realizes certain returns on its investment in us. Each stock option award granted to our Named Executives in 2014 was also evenly split between time- and performance-based stock options and was subject to the same vesting conditions as are described above, except that, other than the supplemental grant approved for Mr. Coughlin at the end of 2014, the stock options are generally subject to vesting over a four-year period beginning in our 2014 fiscal year.
The vesting of stock options is described in greater detail in footnote 2 to the “Outstanding equity awards at 2014 fiscal year-end” table below. In addition, as discussed below in “Potential payments upon termination or change in control for fiscal year 2014—2012 EIP,” time-based stock options are subject to accelerated vesting in limited circumstances relating to change in control events and certain terminations of employment.
For our 2014 fiscal year, performance-based stock options were eligible to vest if we achieved an adjusted EBITDA of $374 million (determined in the same manner as is described above). Because we achieved adjusted EBITDA of $433.8 million for our 2014 fiscal year, performance-based stock options that were first eligible to vest with respect to our 2014 fiscal year have vested or, in certain cases, will vest if the holder remains employed with (or otherwise provides service to) us through an applicable anniversary of the vesting commencement date as set forth in his or her option agreement.
In connection with the Merger, we also provided our Named Executives (and other executives) with the opportunity to roll over outstanding equity of Par Pharmaceutical Companies, Inc. held by them immediately prior to the consummation of the Merger into our equity, and each of our Named Executives (other than Mr. Coughlin, who was not employed by us at the time) elected to do so.
Traditional employee benefits and executive perquisites
In 2014, we maintained broad-based benefits programs for all eligible employees, including our Named Executives, which included health insurance, life and disability insurance and dental insurance, to remain competitive in the marketplace and enable us to attract and retain quality employees. We maintained a 401(k) plan, in which eligible employees, including our Named Executives, were permitted to contribute from 1% to 25% of their compensation to the plan. We also matched employee contributions, including those made by our Named Executives, to our 401(k) plan in an amount equal to 50% of up to 6% of the employee’s compensation.
In addition, we provided our Named Executives with perquisites and other personal benefits that we believed were reasonable and consistent with our overall compensation program and were intended to enable us to attract and retain highly-qualified employees for key positions. In 2014, perquisites granted to our Named Executives included an automobile allowance, supplemental life insurance, supplemental disability benefits, gym memberships and executive physicals. Please see “Summary compensation table for fiscal years 2014, 2013 and 2012” for a further description of the value of perquisites provided to each of our Named Executives.
Compensation mix
The mix of fixed versus variable compensation is an important factor in motivating our Named Executives and other key employees to contribute to our financial performance over the short- and long-term and in aligning
162
Table of Contents
management interests with stockholder interests. Our view is that, the more senior the executive, (i) the greater the percentage of the executive’s cash compensation that should be in the form of an annual bonus opportunity, which is contingent on achieving the Company’s short-term performance objectives, and (ii) the greater the percentage of the executive’s overall target total direct compensation that should be comprised of equity compensation, the value of which is dependent on the Company’s stock performance. We believe this compensation framework focuses executives on improving financial results and creating value for our stockholders.
Our philosophy on the appropriate compensation mix for our Named Executives is evident in the long-term incentive awards we have granted to them since the Merger in 2012. As shown in the “Summary compensation table for fiscal years 2014, 2013 and 2012” below, a very significant portion of the compensation paid to our Named Executives since the Merger has been in the form of stock options (including, in 2012, grants to Messrs. Campanelli, Tropiano and Haughey that were intended to serve as an incentive to them over a five-year vesting period). The Committee views long-term incentive compensation as a critical tool for linking executive pay with the interests of our stockholders and therefore has weighted it heavily in our overall compensation program. For more information on these awards, see the “Outstanding equity awards at 2014 fiscal year-end” table below.
Severance and change of control
We provide our Named Executives with certain benefits upon termination of their employment in various circumstances, including in connection with a change of control, pursuant to employment agreements and our Change in Control Severance Policy (the “Change in Control Policy”). However, the benefits payable to a Named Executive under the Change in Control Policy would be reduced by the severance benefits provided under an applicable employment or severance agreement. We believe providing severance benefits to our Named Executives helps retain their continued services and keep them focused on our long-term interests. Please see “Potential payments upon termination or change of control for fiscal year 2014” for a description of the benefits provided to our Named Executives upon termination of their employment in various circumstances.
Executive financial recoupment program
We established the Executive Financial Recoupment Program (the “Recoupment Program”), which generally permits us to recover incentive compensation (which includes equity awards and cash bonuses) from a “covered person” upon a determination that (a) such covered person engaged in significant misconduct (e.g., a violation of a significant law or regulation or our policy) and/or (b) a company representative for whom such covered person had supervisory responsibility engaged in significant misconduct that does not constitute an isolated occurrence and that such covered person knew or should have known was occurring, with respect to the circumstances described in each of subsections (a) and (b), which makes (or with respect to cash bonuses or equity awards already made, would have made) such covered person and/or company representative ineligible for an annual bonus, bonus deferral or other deferred or unvested equity award in the applicable plan year or subsequent plan year. Subject to applicable law, the Recoupment Program permits us to recover incentive compensation from an executive (i) in the case of a cash bonus, for a period of three years from the date that such bonus was paid (or if the payment of the bonus is deferred, the date that such bonus would have been paid but for the deferral), (ii) in the case of deferred or unvested equity awards, until three years after such executive’s employment termination date and (iii) in the case of vested equity awards, for the three-year period prior to the date that the applicable recoupment determination is made. Under the Recoupment Program, a “covered person” is any company executive at the level of Vice President or above, including each of our Named Executives.
163
Table of Contents
Tax consequences and deductibility of executive compensation
Because our common stock is not currently publicly traded, executive compensation paid in our 2014 fiscal year was not subject to the provisions of Section 162(m) of the Internal Revenue Code, which limits the deductibility of compensation paid to certain individuals to $1 million, excluding qualifying performance-based compensation and certain other compensation. Following this offering, at such time as we are subject to the deduction limitation under Section 162(m) of the United States Internal Revenue Code of 1986, as amended (the “Internal Revenue Code”), we expect that the Committee will consider the impact of Section 162(m) of the Internal Revenue Code when structuring our executive compensation arrangements with our Named Executives. However, the Committee will retain flexibility to approve compensation arrangements that promote the objectives of our compensation program but that may not qualify for full or partial tax deductibility.
Accounting considerations with regard to compensation practices
We review on an on-going basis our compensation programs and the impact of such compensation programs on our financial statements, including the accounting treatment of equity-based compensation, and our compensation decisions may be influenced by such factors.
Compensation risk assessment
We last completed a comprehensive compensation risk assessment in 2012, when the common stock of the Company’s indirect wholly owned subsidiary, Par Pharmaceutical Companies, Inc., publicly-traded on the New York Stock Exchange. Since that time, management has continued to monitor the Company’s compensation programs to ensure that our compensation policies and practices do not create risks that are reasonably likely to have a material adverse effect on the Company.
Summary compensation table for fiscal years 2014, 2013 and 2012
The following table sets forth information regarding compensation earned or paid, as applicable, for the fiscal years ended December 31, 2014, December 31, 2013, and December 31, 2012, by or to our Named Executives.
| Name and principal position |
Year | Salary($) | Stock awards(1)($) |
Option awards(2)($) |
Non-equity incentive plan compensation |
All other compensation (4)($) |
Total ($) |
|||||||||||||||||||||
| Paul V. Campanelli, |
2014 | 870,933 | 0 | 3,360,000 | 2,200,000 | 25,343 | 6,456,276 | |||||||||||||||||||||
| Chief Executive Officer |
|
2013 2012 |
|
|
850,000 615,385 |
|
|
0 1,666,698 |
|
|
0 9,067,841 |
|
|
1,250,000 550,000 |
|
|
25,192 26,043 |
|
|
2,125,192 11,925,967 |
| |||||||
| Michael A. Tropiano, |
2014 | 486,418 | 0 | 201,600 | 448,000 | 26,674 | 1,162,692 | |||||||||||||||||||||
| Executive Vice President and |
|
2013 2012 |
|
|
475,000 434,615 |
|
|
0 375,004 |
|
|
0 2,646,157 |
|
|
358,750 425,000 |
|
|
27,474 26,374 |
|
|
861,224 3,907,150 |
| |||||||
| Thomas J. Haughey, |
2014 | 665,625 | 0 | 373,800 | 734,000 | 23,477 | 1,796,902 | |||||||||||||||||||||
| Chief Administrative Officer and General Counsel |
|
2013 2012 |
|
|
650,000 569,231 |
|
|
0 1,666,698 |
|
|
0 5,017,841 |
|
|
587,500 550,000 |
|
|
23,827 23,177 |
|
|
1,261,327 7,826,947 |
| |||||||
| Terrance J. Coughlin, |
2014 | 399,808 | 0 | 2,400,000 | 433,125 | 7,800 | 3,240,733 | |||||||||||||||||||||
| Chief Operating Officer(5) |
||||||||||||||||||||||||||||
|
|
||||||||||||||||||||||||||||
| (1) | The amounts listed reflect the grant date values of stock awards determined in accordance with FASB ASC 718-10 Compensation—Stock Compensation. For assumptions used in determining these values, see Note 17 to our audited consolidated financial statements which are included elsewhere in this prospectus. No stock awards were granted to our Named Executives from the effective date of the Merger through the end of our 2014 fiscal year. |
164
Table of Contents
| (2) | The amounts listed reflect the grant date fair values of option awards determined in accordance with FASB ASC 718-10 Compensation—Stock compensation. For assumptions used in determining these values, see Note 17 to our audited consolidated financial statements which are included elsewhere in this prospectus. Please see “Outstanding equity awards at 2014 fiscal year-end” below for a description of the vesting terms that apply to outstanding stock options held by our Named Executives. |
| (3) | The amounts listed represent amounts paid pursuant to our annual incentive program. See the discussion under “Components of executive compensation and decisions related to 2014 compensation for Named Executives- Annual cash incentive” for a description of how the amounts paid for 2014 were determined. For the performance-based option awards, the maximum payout level of such awards is equal to the target payout level, which is reflected in the amounts listed. |
| (4) | The total amounts shown in the “All other compensation” column are comprised of the following items, as applicable to each Named Executive for our 2014 fiscal year: |
| Name | Year | 401(k) plan matching contributions ($) |
Premiums for executive life and disability insurance ($) |
Car allowance ($) |
Gym membership ($) |
|||||||||||||||
| Paul V. Campanelli |
2014 | 7,800 | 4,443 | 12,600 | 500 | |||||||||||||||
| Michael A. Tropiano |
2014 | 7,800 | 6,274 | 12,600 | 0 | |||||||||||||||
| Thomas J. Haughey |
2014 | 7,800 | 3,077 | 12,600 | 0 | |||||||||||||||
| Terrance J. Coughlin |
2014 | 7,800 | 0 | 0 | 0 | |||||||||||||||
|
|
||||||||||||||||||||
| (5) | Mr. Coughlin commenced employment with us on April 1, 2014. |
Grants of plan-based awards for fiscal year 2014
The following table sets forth the grants of plan-based awards made to our Named Executives during 2014.
| Grant date |
Estimated possible payouts
under non-equity incentive plan awards(1)($) |
All other option awards: number of securities underlying options(#) |
Exercise price of option awards ($/Sh)(2) |
Grant date awards(3)($) |
||||||||||||||||||||||||
| Name | Threshold | Target | Maximum | |||||||||||||||||||||||||
| Paul V. Campanelli |
— | 566,312 | 871,250 | 1,742,500 | 4,000,000 | $ | 1.40 | $ | 3,360,000 | |||||||||||||||||||
| 5/9/14 | ||||||||||||||||||||||||||||
| Michael A. Tropiano |
— | 205,705 | 316,469 | 632,938 | 240,000 | $ | 1.40 | $ | 201,600 | |||||||||||||||||||
| 5/9/14 | ||||||||||||||||||||||||||||
| Thomas J. Haughey |
— | 324,797 | 499,688 | 999,376 | 445,000 | $ | 1.40 | $ | 373,800 | |||||||||||||||||||
| 5/9/14 | ||||||||||||||||||||||||||||
| Terrance J. Coughlin |
— | 187,688 | 288,750 | — | 2,857,143 | $ | 1.40 | $ | 2,400,000 | |||||||||||||||||||
| 4/1/14 | ||||||||||||||||||||||||||||
|
|
||||||||||||||||||||||||||||
| (1) | We provide performance-based annual incentive awards to our Named Executives under our annual incentive program administered by the Committee. These columns indicate the ranges of possible payouts for 2014 performance for each of our Named Executives. “Threshold” refers to the minimum amount payable for a certain level of performance under the annual incentive program, whereas “Target” refers to the amount payable if the specified performance target is reached, and “Maximum” refers to the maximum payout possible under the program. Actual bonus awards paid in 2014 are set forth in the “Non-equity incentive plan compensation” column of the “Summary compensation table for fiscal years 2014, 2013 and 2012” above. For additional discussion of our annual incentive program, see “Components of executive compensation and decisions related to 2014 compensation for Named Executives-Annual cash incentive.” |
| (2) | The exercise price of the stock options represents the fair market value of a share of our common stock on the applicable grant date as determined by our board of directors. |
| (3) | The amounts listed reflect the grant date fair values of option awards determined in accordance with FASB ASC 718-10 Compensation—Stock Compensation. For assumptions used in determining these fair values, see Note 17 to our audited consolidated financial statements which are included elsewhere in this prospectus. Please see “Outstanding equity awards at 2014 fiscal year-end” below for a description of the vesting terms that apply to outstanding stock options held by our Named Executives. |
Narrative disclosure to summary compensation table and grants of plan based-awards table
Employment agreements. On September 28, 2012, Par Pharmaceutical, Inc. and the Company entered into employment agreements with each of Messrs. Campanelli, Tropiano and Haughey. The agreements with Messrs. Campanelli, Tropiano and Haughey amended and restated the employment agreement to which each executive was party immediately prior to September 28, 2012. Each amended and restated employment agreement
165
Table of Contents
provides for an initial term that runs from September 28, 2012 to September 28, 2017 and automatically renews for an additional year on September 29, 2017 and on each September 29 thereafter, unless terminated by the parties pursuant to the agreement’s terms. Under his employment agreement, Mr. Campanelli’s annual base salary was initially set at $850,000 and he is eligible to receive an annual cash bonus with a target of 100% of his annual base salary and a maximum of 200% of his annual base salary. Under his employment agreement, Mr. Tropiano’s annual base salary was initially set at $475,000 and he is eligible to receive an annual cash bonus with a target of 60% of his annual base salary (his target annual cash bonus has since been increased to 65% of his annual base salary, as discussed above) and a maximum of 120% of his annual base salary (increased to 130% of his annual base salary). Under his employment agreement, Mr. Haughey’s annual base salary was initially set at $650,000 and he is eligible to receive an annual cash bonus with a target of 75% of his annual base salary and a maximum of 150% of his annual base salary. Each of Messrs. Campanelli, Tropiano and Haughey is entitled to an automobile allowance equal to $1,050 per month under his employment agreement.
On February 12, 2014, Par Pharmaceutical, Inc. and the Company entered into an employment agreement with Mr. Coughlin. The agreement provides for an initial term that runs from April 1, 2014 through March 31, 2017 and automatically renews for an additional year on April 1, 2017 and on each April 1 thereafter, unless terminated by the parties pursuant to the agreement’s terms. Under his employment agreement, Mr. Coughlin’s annual salary was initially set at $550,000 and he is eligible to receive an annual cash bonus with a target of 70% of his base salary.
Pursuant to his employment agreement, each Named Executive is also entitled to participate in our employee benefit and welfare plans and programs, subject to their terms, and to Company-paid premiums for a $1 million life insurance policy.
Severance. The severance and restrictive covenants provisions of each Named Executive’s employment agreement are described below under “Potential payments upon termination or change of control for fiscal year 2014.”
166
Table of Contents
Outstanding equity awards at 2014 fiscal year-end
The following table sets forth certain information with respect to the number of shares of common stock covered by exercisable and unexercisable stock options held by our Named Executives at December 31, 2014. None of our Named Executives held any stock awards at December 31, 2014.
| Option awards | ||||||||||||||||
| Name | Number
of (#) |
Number of securities underlying unexercised options unexercisable (2)(#) |
Option exercise price (3)($) |
Option expiration date |
||||||||||||
| (a) | (b) | (c) | (d) | (e) | ||||||||||||
| Paul V. Campanelli |
1,329,840 | (1) | 0.25 | 1/07/2019 | ||||||||||||
| 522,864 | (1) | 0.25 | 1/03/2020 | |||||||||||||
| 319,253 | (1) | 0.25 | 1/05/2021 | |||||||||||||
| 1,169,446 | (1) | 0.25 | 1/04/2022 | |||||||||||||
| 5,000,000 | (2) | 7,500,000 | 1.00 | 10/31/2022 | ||||||||||||
| 4,000,000 | (4)(5) | 1.40 | 5/9/2024 | |||||||||||||
| Michael A. Tropiano |
179,063 | (1) | 0.25 | 1/03/2020 | ||||||||||||
| 294,684 | (1) | 0.25 | 1/05/2021 | |||||||||||||
| 526,257 | (1) | 0.25 | 1/04/2022 | |||||||||||||
| 1,400,000 | (2) | 2,100,000 | 1.00 | 10/31/2022 | ||||||||||||
| 240,000 | (4) | 1.40 | 5/9/2024 | |||||||||||||
| Thomas J. Haughey |
427,174 | (1) | 0.25 | 1/07/2019 | ||||||||||||
| 750,787 | (1) | 0.25 | 1/03/2020 | |||||||||||||
| 319,253 | (1) | 0.25 | 1/05/2021 | |||||||||||||
| 1,169,446 | (1) | 0.25 | 1/04/2022 | |||||||||||||
| 2,600,000 | (2) | 3,900,000 | 1.00 | 10/31/2022 | ||||||||||||
| 445,000 | (4) | 1.40 | 5/9/2024 | |||||||||||||
| Terrance J. Coughlin |
2,857,143 | (5) | 1.40 | 4/1/2024 | ||||||||||||
|
|
||||||||||||||||
| (1) | In conjunction with the Merger, our Named Executives were given the opportunity to exchange their stock options in Par Pharmaceutical Companies, Inc. (“Par Options”) for stock options to acquire common stock of the Company (“Rollover Stock Options”). All Rollover Stock Options maintained the same 10-year term as the corresponding Par Option. All of the Rollover Stock Options were either vested prior to September 28, 2012 or their vesting was accelerated as of September 28, 2012 in accordance with the terms of the Par Option agreements and the equity plan under which the Par Options were granted. |
| (2) | In conjunction with the Merger, our Named Executives (other than Mr. Coughlin, who was not employed by us at the time) were granted stock options on October 31, 2012. Each option award granted in connection with or since the Merger is divided into two equal tranches of stock options, called “Tranche 1 Options” and “Tranche 2 Options.” Tranche 1 Options are time-based options and Tranche 2 Options are performance-based options. |
| Tranche 1 Options granted in connection with the Merger vest in five equal annual installments beginning on the first anniversary of the vesting commencement date (September 28, 2012), provided that the executive remains in continuous employment with (or provides other service to) us from the date of grant. Tranche 2 Options granted in connection with the Merger vest based upon the executive’s remaining in continuous employment with (or providing other service to) us and the achievement of specified annual adjusted EBITDA targets. If any installment of these Tranche 2 Options does not vest based on the achievement of the specified annual adjusted EBITDA targets for a particular year, such installment is eligible to vest in respect of the next succeeding fiscal year if a two-year cumulative adjusted EBITDA target is met, except with respect to the 2017 performance tranche, for which there is no cumulative adjusted EBITDA target. In circumstances where the specified annual or cumulative adjusted EBITDA targets are not met, Tranche 2 Options will also vest in amounts of either 50% or 100% of the number of Tranche 2 Options subject to the award in the event that the Sponsor receives a specified level of return on investment calculated as a multiple of the total equity invested in the Company in respect of the shares of our common stock owned by it. In December 2013, the Committee, in its discretion as allowed by the terms of the 2012 EIP and based on the level of 2013 adjusted EBITDA achievement relative to target (approximately 99.6%), authorized the vesting of the 2013 portion of Tranche 2 Options, including the first 20% installment of all Tranche 2 Options granted in connection with the Merger that are held by our Named Executives. All Tranche 2 Options eligible to vest based on our 2014 performance vested based on our level of 2014 adjusted EBITDA achievement relative to target (as determined by the Committee in February 2015). |
167
Table of Contents
| (3) | The exercise price of the Rollover Stock Options, as described in note (1) above, was set at $0.25 per option in connection with the exchange of the Par Options for Rollover Stock Options at the Merger. The exercise price of stock options granted on October 31, 2012, April 1, 2014 and May 9, 2014 represents the fair market value of a share of our common stock on the applicable date of grant as determined by our board of directors. |
| (4) | Each option award granted to our Named Executives in 2014 was evenly split between time- and performance-based stock options and was subject to the same vesting conditions as are described in footnote (2) above, except that the option awards are subject to time- and performance-based vesting over a four-year period beginning in our 2014 fiscal year. Tranche 2 Options granted to our Named Executives in 2014 will also vest where the specified annual or cumulative adjusted EBITDA targets are not met, in amounts of either 50% or 100% of the number of Tranche 2 Options subject to the award, in the event that the Sponsor receives a specified level of return on investment calculated as a multiple of the total amount invested in the Company in respect of the shares of our common stock owned by it. |
| (5) | Mr. Coughlin’s grant of stock options was made to him in connection with the commencement of his employment with us. |
Adjustments in connection with dividend recapitalization. On February 25, 2015, in connection with the payment of an extraordinary cash dividend to holders of the Company’s common stock, our board of directors approved cash payments to holders of certain stock options and a reduction in the exercise price of certain stock options, pursuant to the terms of the 2012 EIP. In connection with this dividend, all option award holders, including our Named Executives, received payments equal to $0.6303 per share underlying 100% of their Rollover Stock Options, 80% of the shares underlying their options with a vesting commencement date of September 28, 2012 and 50% of the shares underlying their options with vesting commencement dates between February 20, 2014 and August 5, 2014. In addition, with respect to outstanding and unexercised options with a vesting commencement date of September 28, 2012, the exercise prices were reduced (i) from $1.00 to $0.69 for option awards eligible to vest based either on the optionee’s continued service through September 28, 2016 or the Company’s annual adjusted EBITDA for 2016, and (ii) from $1.00 to $0.68 for options eligible to vest based either on the optionee’s continued service through September 28, 2017 or the Company’s annual adjusted EBITDA for 2017. With respect to outstanding and unexercised options with vesting commencement dates between February 20, 2014 and August 5, 2014, the exercise prices were reduced from $1.40 to $0.77 for options eligible to vest based either on the optionee’s continued service through a date later than August 5, 2016 or the Company’s annual adjusted EBITDA for 2016 or 2017.
Option exercises and stock vested for fiscal year 2014
During 2014, none of our Named Executives acquired shares of common stock either by exercise of stock options or the vesting of other stock awards.
Potential payments upon termination or change of control for fiscal year 2014
This section describes the compensation to which a Named Executive may be entitled upon his separation or termination of employment, assuming such events were to occur on December 31, 2014. The amount of such compensation is illustrated in the “Potential payments upon termination for fiscal year 2014” table below.
Change in control policy
We provide our Named Executives (and other eligible employees) up to 18 months’ salary continuation, paid COBRA coverage and outplacement services pursuant to our Change in Control Policy upon termination of their employment in connection with a “change in control.” However, the benefits payable to a Named Executive under the Change in Control Policy will be reduced by any severance benefits provided to him under any employment or severance agreement with us. A Named Executive would be entitled to payments under the Change in Control Policy if, within the 24 month period following a change in control, his employment is either terminated by us without “cause” or he terminates employment with “good reason.”
168
Table of Contents
The Change in Control Policy defines the terms “cause”, “good reason” and “change in control” as follows:
The term “cause” has the meaning defined in the eligible employee’s employment or severance agreement, and if there is no employment or severance agreement, means (i) any act or omission that would reasonably be likely to have a material adverse effect on our business; (ii) conviction of (including any no contest plea) a felony or any other crime (other than ordinary traffic violations); (iii) material misconduct or willful and deliberate non-performance of his duties (other than as a result of disability); (iv) theft, embezzlement, dishonesty or fraud with respect to the Company; (v) commission of any act of fraud, dishonesty or moral turpitude which is actually or potentially injurious to the our business interests or reputation; (vi) material breach of any written policy applicable to employees of the Company and its affiliates, where such breach is actually or potentially injurious to our business interests or reputation; or (vii) unauthorized disclosure of any confidential or proprietary information of our company or its affiliates.
The term “good reason” has the meaning defined in the eligible employee’s employment agreement, and if there is no employment agreement, (i) a material reduction in the eligible employee’s base salary; (ii) the eligible employee’s job responsibilities are substantially reduced in scope; or (iii) a material change in the eligible employee’s principal place of employment to a location more than 35 miles from his or her place of employment as of the date immediately prior to a change in control.
A “change in control” of the Company generally means (i) any individual, firm, corporation or other entity, or any group (as defined in the Exchange Act) becomes, directly or indirectly, the beneficial owner (as defined in the Exchange Act) of more than twenty percent (20%) of the then outstanding shares entitled to vote generally in the election of our directors; (ii) the consummation of (a) a merger or other business combination of the Company with or into another corporation pursuant to which our stockholders do not own, immediately after the transaction, more than 50% of the voting power of the corporation that survives and is a publicly owned corporation and not a subsidiary of another corporation, or (b) a sale, exchange or other disposition of all or substantially all of our assets; or (iii) our stockholders approve any plan or proposal for our liquidation or dissolution.
Since the employment agreements with the Named Executives and the Company’s practice with respect to outplacement services (as described below in footnote 3 to the “Potential payments upon termination for fiscal year 2014” table), taken together, provide for greater payments than those payable under the Change in Control Policy, the Named Executives would not receive any payments under the Change in Control Policy.
Employment agreements with named executives
In connection with the consummation of the Merger, the Company and Par Pharmaceutical, Inc. entered into amended and restated employment agreements with Messrs. Campanelli, Tropiano and Haughey. In connection with his commencement of employment with us, we entered into an employment agreement with Mr. Coughlin. These employment agreements entitle the executives to receive compensation and benefits in the event of termination of employment under certain circumstances, whether before or after a change of control of our company. The various events of termination of employment and the payments and benefits (if any) to which a Named Executive may be entitled under such situations pursuant to his amended and restated employment agreement are described below and illustrated in the “Potential payments upon termination for fiscal year 2014” table below.
Upon death or disability
Upon termination of employment for death or disability, each of our Named Executives would be entitled to a payment calculated as two times the sum of (i) his annual base salary in effect as of the termination date plus
169
Table of Contents
(ii) an amount equal to his annual target cash bonus, in effect as of the termination date, less any life insurance or disability insurance received by the executive or his estate. Such amounts will be payable in a lump sum upon termination of employment for death, and in installments for two years in accordance with the Company’s regular payroll practices in the event of termination of employment for disability. Upon termination of employment for disability, each of our Named Executives would also be entitled to participate, at our expense, in our group health plans in accordance with COBRA for a period of up to 18 months.
Upon termination by us without “cause”; upon termination by the Named Executive for “good reason”; or our non-renewal of the employment agreement
Upon termination of employment of any of our Named Executives (i) by us without “cause”; (ii) by the executive for “good reason”; or (iii) by our non-renewal of the employment agreement, the affected executive would be entitled to a payment calculated as two times the sum of (a) his annual base salary in effect as of the termination date plus (b) an amount equal to his annual target cash bonus in effect as of the termination date. Each of our Named Executives would also be entitled to participate, at our expense, in our group health plans in accordance with COBRA for a period of up to 18 months.
Upon non-renewal of the employment agreement by the Named Executive; upon termination by the Named Executive without “good reason”; or upon termination by us for “cause”
If the employment of any of our Named Executives is terminated (i) by his non-renewal of the employment agreement, (ii) by his resignation without “good reason” or (iii) by us for “cause,” the executive would not be entitled to any severance payments.
The employment agreements with each of our Named Executives define the terms “cause” and “good reason” as follows:
The term “cause” generally means (i) conviction of, guilty or no contest plea to, or confession of guilt of, a felony, or other crime involving moral turpitude; (ii) an act or omission in connection with employment that constitutes fraud, criminal misconduct, breach of fiduciary duty, dishonesty, gross negligence, malfeasance, willful misconduct or other conduct that is materially harmful or detrimental to us; (iii) a material breach by the executive of his employment agreement; (iv) continuing failure to perform such duties as are assigned to the executive, other than a failure resulting from disability; (v) knowingly taking any action on our behalf without appropriate authority to take such action; (vi) knowingly taking any action in conflict of interest with us given the executive’s position with us; or (vii) the commission of an act of personal dishonesty by the executive that involves personal profit in connection with the Company.
The term “good reason” generally means (i) our failure to make any payment that we are required to make to the executive when due or within two business days; (ii) the assignment to the executive, without his written consent, of duties inconsistent with positions, responsibilities and status with us, a change in the executive’s reporting responsibilities, titles or offices or any act constituting a constructive termination or removal of the executive; (iii) a reduction in the executive’s base salary; or (iv) a permanent reassignment (without the executive’s consent) to a primary work location more than 35 miles from our present executive offices.
2012 EIP
If the employment of a Named Executive (or other executive) is terminated without “cause” by us or for “good reason” by the executive, in each case, within two years after a “change of control”, all unvested time-based stock options (Tranche 1 Options) held by the executive would become vested and exercisable. However, all unvested performance-based stock options (Tranche 2 Options) held by the executive would be forfeited upon a termination for any reason.
170
Table of Contents
For this purpose, the terms “cause” and “good reason” have the meanings ascribed to them, in the case of termination of any of our Named Executives, in the affected executive’s employment agreement. The term “change of control” means (i) any change in the ownership of the capital stock of the Company if, immediately after giving effect thereto, any person (or group of persons acting in concert) other than the Sponsor and its affiliates will have the direct or indirect power to elect a majority of the members of our board of directors; (ii) any change in the ownership of the capital stock of the Company if, immediately after giving effect thereto, the Sponsor and its affiliates own less than 25% of the common shares of the Company; or (iii) the sale of all or substantially all of the assets of the Company and its subsidiaries.
Non-compete, non-solicitation and release of claims
Each of our Named Executives has agreed for 18 months following termination of his employment with us not to solicit business or employees away from us and not to provide any services that may compete with our business, regardless of the reason for such termination. Each Named Executive is required to sign a separation agreement that includes a release of claims against us as a condition to receiving the severance amounts described above.
Estimated value of benefits to be received upon involuntary separation not related to a change of control or upon qualifying termination following a change of control
The following table shows the estimated value of payments and other benefits to be received by our Named Executives under the terms of their respective employment agreements or other arrangements in effect on December 31, 2014, assuming the employment of such individual terminates under one of the following circumstances as of December 31, 2014. There are no income tax or excise tax gross-ups of any kind provided to our Named Executives.
Potential payments upon termination for fiscal year 2014
| Compensation program |
For “cause” | By us without cause; by executive for good reason; non-renewal of agreement by company |
Death or disability |
By the executive without good reason; or non-renewal of agreement by executive |
By us without cause or for good reason by executive if within the two-year period after change in control |
|||||||||||||||
| Cash Severance(1) |
||||||||||||||||||||
| Mr. Campanelli |
— | $ | 3,485,000 | $ | 3,485,000 | — | $ | 3,485,000 | ||||||||||||
| Mr. Tropiano |
— | $ | 1,606,688 | $ | 1,606,688 | — | $ | 1,606,688 | ||||||||||||
| Mr. Haughey |
— | $ | 2,331,876 | $ | 2,331,876 | — | $ | 2,331,876 | ||||||||||||
| Mr. Coughlin |
$ | 1,870,000 | $ | 1,870,000 | $ | 1,870,000 | ||||||||||||||
|
|
|
|||||||||||||||||||
| Equity Value(2) |
||||||||||||||||||||
| Mr. Campanelli |
— | — | — | — | $ | 14,720,000 | ||||||||||||||
| Mr. Tropiano |
— | — | — | — | $ | 2,995,200 | ||||||||||||||
| Mr. Haughey |
— | — | — | — | $ | 5,561,600 | ||||||||||||||
| Mr. Coughlin |
— | — | — | — | $ | 3,657,144 | ||||||||||||||
|
|
|
|||||||||||||||||||
| Perquisites/Benefits(3) |
||||||||||||||||||||
| Mr. Campanelli |
— | $ | 49,050 | $ | 32,550 | — | $ | 49,050 | ||||||||||||
| Mr. Tropiano |
— | $ | 49,205 | $ | 32,705 | — | $ | 49,205 | ||||||||||||
| Mr. Haughey |
— | $ | 49,205 | $ | 32,705 | — | $ | 49,205 | ||||||||||||
| Mr. Coughlin |
— | $ | 49,205 | $ | 32,705 | — | $ | 49,205 | ||||||||||||
|
|
||||||||||||||||||||
| (1) | Upon termination, the Named Executive would be entitled to two times the sum of annual base salary plus an amount equal to his target bonus in effect as of the termination date, which would be paid over the two-year period following the Named Executive’s termination. Any life insurance and disability insurance payments received by the Named Executive would be deducted from the amount payable upon termination. |
171
Table of Contents
| (2) | Assumes the triggering event took place on the last day of the fiscal year, December 31, 2014, and the price per share is the fair market value as of that date as determined by our board of directors ($2.56). Time-based stock options (Tranche 1 Options) would vest upon a termination of employment by us without cause or for good reason by executive if it occurred within the two-year period after a change of control. The amounts shown in the last column represent the number of Tranche 1 Options held by the Named Executive that would vest in connection with a qualifying termination of employment following a change in control, multiplied by the positive difference between the exercise price for those stock options and $2.56. |
| (3) | Represents the value of each Named Executive’s entitlement to participate, at our expense, in all of our medical and health plans and programs in accordance with COBRA for a period of 18 months (not applicable upon termination in the event of death), as well as, in the case of a qualifying termination following a change in control, the value of outplacement services ($16,500 as of December 31, 2014) for a period of 12 months provided pursuant to our Change in Control Policy. Pursuant to Company practice, outplacement services would also be provided in the event of a Named Executive’s termination of employment by us without cause, termination of employment by the Named Executive for good reason or non-renewal of the Named Executive’s employment agreement by us. |
Director compensation for fiscal year 2014
Dr. Mansukani, who was appointed to our board of directors by the Sponsor effective as of the closing of the Merger, and Mr. LePore, since the expiration of his employment term on January 31, 2013, are the only members of our board of directors who receive compensation for their service to our board of directors. The other members of our board of directors were employees of either (i) us or (ii) the Sponsor and received no compensation for services rendered to our board of directors during 2014.
The following table sets forth the 2014 compensation of the directors serving on our board of directors (other than directors who are Named Executives):
| Director | Fees earned or paid in cash |
Stock awards |
Option awards |
All other compensation |
Total | |||||||||||||||
| Patrick G. LePore(1) |
$ | 300,000 | (2) | — | — | $ | 2,252,547 | (3) | $ | 2,552,547 | ||||||||||
| Sharad Mansukani(4) |
$ | 60,000 | (5) | — | $ | 415,000 | (6) | $ | 475,000 | |||||||||||
| Todd B. Sisitsky(7) |
— | — | — | — | ||||||||||||||||
| Jeffrey K. Rhodes(7) |
— | — | — | — | ||||||||||||||||
|
|
||||||||||||||||||||
| (1) | At the end of 2014, Mr. LePore held 1,780,000 stock options, 712,000 of which were vested and 1,068,000 of which were unvested. Mr. LePore’s stock options vest in the same manner as the stock options granted to our Named Executives in connection with the Merger. See note 2 under the “Outstanding equity awards at 2014 fiscal year-end” table above for a description of those vesting terms. Mr. LePore did not hold any other stock options or any stock awards at the end of 2014. |
| (2) | Pursuant to the terms of his employment agreement, which governed the terms of his employment with us and includes certain terms relating to his service as the non-employee chairman of our board of directors, Mr. LePore is entitled to cash compensation at an annual rate of $300,000, which is paid to him on a quarterly basis. |
| (3) | Pursuant to the terms his separation agreement with us, which governed the terms of his termination of employment with us, Mr. LePore received $2,245,000 in cash severance payments from us in 2014. Under his separation agreement, we are obligated to pay Mr. LePore severance payments totaling $4,490,000 in equal semi-monthly installments, commencing March 2013 through March 2015. In addition, for up to 18 months following January 31, 2013, we were obligated to make monthly payments to Mr. LePore, at his election, to cover the cost of premiums for COBRA continuation coverage. During 2014, we paid Mr. LePore $7,547 to cover the cost of his COBRA premiums. Our obligation to reimburse Mr. LePore for COBRA premiums ended in July 2014. |
| (4) | At the end of 2014, Dr. Mansukani held (i) 25,000 restricted stock units, all of which were granted to him in 2013 and are scheduled to vest on September 28, 2015, subject to his continued service to us through that date, and (ii) 1,000,000 stock options, 450,000 of which were vested and 550,000 of which were unvested. The vesting of the 500,000 stock options granted to Dr. Mansukani in 2014 is described in note 6 below. Dr. Mansukani’s 500,000 other stock options were granted to him on March 12, 2013. 20% of this stock option vests on each of the first, second, third, fourth and fifth anniversaries of September 28, 2012, subject to Dr. Mansukani’s continued service to us through the applicable vesting date. Dr. Mansukani did not hold any other stock options or stock awards at the end of 2014. |
| (5) | Represents the 2014 annual cash retainer payable to Dr. Mansukani. |
| (6) | Dr. Mansukani was granted 500,000 stock options on June 13, 2014 with an exercise price of $1.40. 25% of these stock options were vested on the grant date, an additional 25% of these stock options vested on September 28, 2014, and 25% of these stock options are scheduled to vest on each of the third and fourth anniversaries of September 28, 2012, subject to Dr. Mansukani’s continued service to us through the applicable vesting date. The amount listed reflects the grant date fair value of the stock options in accordance with FASB ASC 718-10 Compensation—Stock Compensation. For assumptions used in determining these values, see Note 17 to our audited consolidated financial statements which are included elsewhere in this prospectus. |
| (7) | Messrs. Sisitsky and Rhodes are affiliated with the Sponsor and neither of them received any compensation from us for their service on our board of directors in 2014. Neither of Messrs. Sisitsky or Rhodes held any stock options or stock awards as of the end of 2014. |
172
Table of Contents
On February 25, 2015, the payments and reductions in exercise prices described above under “Adjustments in connection with dividend recapitalization” were also made with respect to stock options held by Dr. Mansukani and Mr. LePore. The restricted stock units held by Dr. Mansukani were not adjusted in connection with the payment of the cash dividend and no payments were made in respect of them.
Sky Growth Holdings Corporation 2012 Equity Incentive Plan
The following is a description of the material terms of the 2012 EIP. This summary is not a complete description of all provisions of the plan and is qualified in its entirety by reference to the 2012 EIP, which is filed as an exhibit to the registration statement of which this prospectus is a part. We intend to adopt a new equity incentive plan in connection with this offering, described below under “Par Pharmaceutical Holdings, Inc. 2015 Omnibus Plan,” and upon the completion of this offering, we will no longer make awards under the 2012 EIP.
Plan administration. The 2012 EIP is administered by the Committee, which has the authority to, among other things, interpret the 2012 EIP, select eligible persons to receive grants of awards and determine the terms of awards under the 2012 EIP.
Authorized shares. Subject to adjustment, the maximum number of shares of our common stock that may be delivered in satisfaction of awards under the 2012 EIP is 68,750,000. However, each performance award granted under the 2012 EIP pursuant to a long-term cash incentive award agreement (the “Incentive Agreement”) will decrease the pool of shares available under the 2012 EIP by a number of shares equal to the award amount (as described in the Incentive Agreement) determined at target based on a 3.4 “Multiple of Money” (as defined in the Incentive Agreement) divided by 2.4 (we refer to share equivalents related to these long-term cash awards as “share equivalents”). As of , 2015, shares have been granted with respect to equity awards and long-term cash incentive awards with respect to share equivalents have been granted under the 2012 EIP.
Eligibility. The Committee selects participants from among those key employees and directors of, and consultants and advisors to, the Company who, in the opinion of the Committee, are in a position to make a significant contribution to the success of the Company.
Types of awards; vesting. The 2012 EIP provides for the grant of stock options (including incentive stock options), stock appreciation rights, restricted and unrestricted stock and stock units, performance awards and other awards that are convertible into or otherwise based on our common stock. The Committee has the authority to determine the vesting schedule applicable to each award, and to accelerate the vesting or exercisability of any award.
Termination of employment or service. The Committee will determine the effect of termination of employment or service on an award. Unless the Committee expressly provides otherwise in an award agreement, immediately upon a termination of employment or service all unvested options and other awards requiring exercise will terminate and all other unvested awards will be forfeited. Vested options and stock appreciation rights will remain exercisable for one year following a termination due to death or disability, 90 days following a termination without cause or resignation for good reason or 30 days following any other termination except a termination for cause (or, if shorter, for the remaining term of the option). If a participant’s service is terminated for cause, all options and other awards requiring exercise (whether or not vested) will immediately terminate.
Transferability. Awards under the 2012 EIP may not be transferred except by will or the laws of descent and distribution, unless (for awards other than incentive stock options) otherwise provided by the Committee or our management stockholders’ agreement.
Corporate transactions. In the event of certain corporate transactions (including a consolidation, merger or similar transaction or series of related transactions, a sale of all or substantially all of the Company’s assets, a change in control or a dissolution or liquidation of the Company), the Committee may provide for the
173
Table of Contents
continuation or assumption of outstanding awards, for new grants in substitution of outstanding awards, for a cash-out of outstanding awards or for the accelerated vesting or delivery of shares under awards, in each case, on such terms and with such restrictions as it determines in its sole discretion. Except as otherwise provided by the Committee, awards not assumed or accelerated will terminate upon the consummation of such corporate transaction.
Adjustment. In the event of certain changes in the Company’s outstanding stock or capital structure (including a stock dividend, stock split or combination of shares, recapitalization or other change in our capital structure that constitutes an “equity restructuring” under applicable accounting rules), the Committee will make appropriate adjustments to the maximum type and number of shares that may be delivered under the 2012 EIP, and will also make appropriate adjustments to the number and kind of shares of stock or securities subject to awards, the exercise prices of such awards or any other terms of awards affected by such change. The Committee may also make the types of adjustments described above to take into account distributions and other events other than those set forth above if it determines that such adjustments are appropriate to avoid distortion in the operation of the 2012 EIP and preserve the value of awards.
Amendment and termination. The Committee may amend the 2012 EIP or outstanding awards, except that the Committee may not alter the terms of an award if it would affect adversely a participant’s rights under the award without the participant’s written consent (unless expressly provided in the 2012 EIP or reserved in the applicable award agreement).
Par Pharmaceutical Holdings, Inc. 2015 Omnibus Plan
In connection with this offering, our board of directors intends to adopt the Par Pharmaceutical Holdings, Inc. 2015 Omnibus Plan, or the 2015 Omnibus Plan, and, following this offering, all equity-based awards will be granted under the 2015 Omnibus Plan. The following summary describes what we anticipate to be the material terms of the 2015 Omnibus Plan. This summary of the 2015 Omnibus Plan is not a complete description of all provisions of the 2015 Omnibus Plan and is qualified in its entirety by reference to the 2015 Omnibus Plan, a form of which will be filed as an exhibit to the registration statement of which this prospectus is a part.
Administration. The 2015 Omnibus Plan is administered by the Committee. The Committee has the authority to, among other things, interpret the 2015 Omnibus Plan, determine eligibility for, grant and determine the terms of awards under the 2015 Omnibus Plan, determine the form of settlement of awards (whether in cash, shares of our common stock or other property), and do all things necessary or appropriate to carry out the purposes of the 2015 Omnibus Plan. The Committee’s determinations under the 2015 Omnibus Plan are conclusive and binding.
Eligibility. Our key employees, directors, consultants and advisors are eligible to participate in the 2015 Omnibus Plan.
Authorized shares. Subject to adjustment, as described below, the maximum number of shares of our common stock that may be delivered in satisfaction of awards under the 2015 Omnibus Plan is shares. Any shares of common stock underlying awards that are settled in cash, expire or become unexercisable without having been exercised or that are forfeited or repurchased by us will again be available for issuance under the 2015 Omnibus Plan. The number of shares of our common stock delivered in satisfaction of awards will be determined net of shares of our common stock withheld by us in payment of the exercise price or purchase price of an award or in satisfaction of tax withholding requirements with respect to an award.
Individual limits. The maximum number of shares of our common stock subject to stock options and the maximum number of shares of our common stock subject to stock appreciation rights, or SARs, that may be granted to any participant in the 2015 Omnibus Plan in any calendar year is, in each case, shares. The
174
Table of Contents
maximum number of shares of our common stock subject to other awards that may be granted to any participant in the 2015 Omnibus Plan in any calendar year is shares. The maximum value of cash awards that may be granted to any participant in the 2015 Omnibus Plan in any calendar year is $ .
Non-employee director limits. In the case of a non-employee director, an additional limit applies such that the maximum grant-date fair value of stock-denominated awards as determined by the Committee assuming maximum performance (if applicable), and the maximum amount of cash payable under any cash awards, granted under the 2015 Omnibus Plan in any calendar year during any part of which the director is then eligible under such plan is, in each case, $ , except that such limit for a non-employee chairman of our board of directors or lead director is, in each case, $ .
Types of awards. The 2015 Omnibus Plan provides for awards of stock options, SARs, restricted stock, unrestricted stock, stock units, performance awards, cash awards and other awards convertible into or otherwise based on shares of our common stock. Eligibility for stock options intended to be incentive stock options, or ISOs, is limited to our employees. Dividend equivalents may also be provided in connection with an award under the 2015 Omnibus Plan on terms and subject to conditions established by the Committee.
| • | Stock options and SARs. The exercise price of a stock option, and the base price against which a SAR is to be measured, may not be less than the fair market value (or, in the case of an ISO granted to a ten percent shareholder, 110% of the fair market value) of a share of our common stock on the date of grant. The Committee may impose conditions on the time or times at which stock options or SARs become exercisable and the terms on which such awards remain exercisable. |
| • | Restricted and unrestricted stock. A restricted stock award is an award of shares of our common stock subject to forfeiture restrictions, while an unrestricted stock award is not subject to such restrictions. |
| • | Stock units. A stock unit award is an award denominated in shares of our common stock that entitles the participant to receive shares of our common stock or cash measured by the value of shares of our common stock in the future. |
| • | Performance awards. A performance award is an award the vesting, settlement or exercisability of which is subject to specified performance criteria. |
| • | Cash awards. A cash award is an award denominated in cash. |
| • | Other awards. Other awards are awards that are convertible into or otherwise based on shares of our common stock. |
Performance awards. The 2015 Omnibus Plan provides for the grant of performance awards that are made based upon, and subject to achieving, performance objectives. Performance objectives with respect to those awards that are intended to qualify as “performance-based compensation” for purposes of Section 162(m) of the Code, to the extent applicable, are limited to an objectively determinable measure or measures of performance relating to any or any combination of the following (measured either absolutely or comparatively (including by reference to an index or indices or a specified peer group) and determined either on a consolidated basis or, as the context permits, on a divisional, subsidiary, line of business, project or geographical basis or in combinations thereof and subject to such adjustments, if any, as the Committee specifies, consistent with the requirements of Section 162(m) of the Code): sales; revenues; assets; expenses; earnings before or after deduction for all or any portion of interest, taxes, depreciation, or amortization, whether or not on a continuing operations or an aggregate or per share basis; return on equity, investment, capital or assets; one or more operating ratios; operating income or profit, including on an after tax basis; borrowing levels, leverage ratios or credit rating; market share; capital expenditures; research and development expenditures; cash flow; margins; stock price; stockholder return; sales of particular products or
175
Table of Contents
services; product launches; submission of new drug applications, abbreviated new drug applications, drug master files and/or the foreign counterparts of any of them; inspection results; technology transfers; customer acquisition or retention; acquisitions and divestitures (in whole or in part); joint ventures and strategic alliances; spin-offs, split-ups and the like; reorganizations; or recapitalizations, restructurings, financings (issuance of debt or equity) or refinancings. Each performance criterion also includes all derivations of the criterion (e.g., income includes pre-tax income, net income, operating income, etc.).
To the extent consistent with the requirements for satisfying the performance-based compensation exception under Section 162(m) of the Code, to the extent applicable, the Committee may provide, by the deadline that otherwise applies to the establishment of the terms of any award intended to qualify for such exception, that one or more of the performance objectives applicable to an award will be adjusted in an objectively determinable manner to reflect events (for example, the impact of charges for restructurings, discontinued operations, mergers, acquisitions, and other unusual or infrequently occurring items, and the cumulative effects of tax or accounting changes, each as defined by U.S. generally accepted accounting principles) occurring during the performance period that affect the applicable performance objectives.
We intend awards under the 2015 Omnibus Plan to be exempt from the deduction limitations of Section 162(m) of the Code by reason of the post-initial public offering transition rule under Section 162(m) to the maximum extent possible.
Vesting; termination of employment or service. The Committee has the authority to determine the vesting schedule applicable to each award, and to accelerate the vesting or exercisability of any award. The Committee will determine the effect of a termination of employment or service on an award. Unless otherwise provided by the Committee, upon a termination of a participant’s employment or service, all unvested stock options and SARs then held by the participant will terminate and all other unvested awards will be forfeited. All vested stock options and SARs then held by the participant will remain outstanding for 90 days following such termination or 12 months in the case of a termination due to death or disability, or, in each case, until the applicable expiration date, if earlier. All stock options and SARs held by a participant immediately prior to the participant’s termination of employment or service will immediately terminate if such termination is for cause, as defined in the 2015 Omnibus Plan, or occurs in circumstances that would have constituted grounds for the participant’s employment or service to be terminated for cause, in the determination of the compensation committee.
Non-transferability of awards. Awards under the 2015 Omnibus Plan may not be transferred other than by the laws of descent and distribution, unless, for awards other than ISOs, otherwise provided by the Committee.
Recovery of compensation. The Committee may cancel, rescind, withhold or otherwise limit or restrict any award at any time under the 2015 Omnibus Plan if the participant is not in compliance with the provisions of the 2015 Omnibus Plan or any award thereunder or if the participant breaches any agreement with us with respect to non-competition, non-solicitation or confidentiality. The Committee also may recover any award or payments or gain in respect of any award under the 2015 Omnibus Plan in accordance with any applicable Company clawback or recoupment policy, or as otherwise required by applicable law or applicable stock exchange listing standards.
Certain transactions; certain adjustments. In the event of a consolidation, merger or similar transaction or series of related transactions, including a sale or other disposition of shares of our common stock, in which our Company is not the surviving corporation or that results in the acquisition of all or substantially all of our then outstanding shares of common stock by a single person or entity or by a group of persons and/or entities acting in concert, a sale of all or substantially all of our assets or our dissolution or liquidation, the Committee may, among other things, provide for the continuation or assumption of outstanding awards, for new grants in substitution of outstanding awards, for the accelerated vesting or delivery of shares under awards or for a cash-
176
Table of Contents
out of outstanding awards, in each case on such terms and with such restrictions as it deems appropriate. Except as the Committee may otherwise determine, awards not assumed in connection with such a transaction will terminate automatically and, in the case of outstanding restricted stock, will be forfeited automatically upon the consummation of such covered transaction.
In the event of a stock dividend, stock split or combination of shares, including a reverse stock split, recapitalization or other change in our capital structure that constitutes an equity restructuring within the meaning of FASB ASC Topic 718, the Committee will make appropriate adjustments to the maximum number of shares of our common stock that may be delivered under, and the individual share limits included in, the 2015 Omnibus Plan, and will also make appropriate adjustments to the number and kind of shares or securities subject to awards, the exercise prices of such awards or any other terms of awards affected by such change. The Committee will also make the types of adjustments described above to take into account distributions and other events other than those listed above if it determines that such adjustments are appropriate to avoid distortion in the operation of the 2015 Omnibus Plan.
No Repricing. The repricing of stock options and SARs (other than in connection with certain corporate transactions) is prohibited without prior approval of the Company’s stockholders.
Amendment; termination. The Committee will be able to amend the 2015 Omnibus Plan or outstanding awards, or terminate the 2015 Omnibus Plan as to future grants of awards, except that the Committee will not be able to alter the terms of an award if it would affect materially and adversely a participant’s rights under the award without the participant’s consent (unless expressly provided in the 2015 Omnibus Plan or the right to alter the terms of an award was expressly reserved by the Committee at the time the award was granted). Shareholder approval will be required for any amendment to the 2015 Omnibus Plan to the extent such approval is required by law, including applicable stock exchange requirements.
Par Pharmaceutical Holdings, Inc. 2015 Employee Stock Purchase Plan
In connection with this offering, our board of directors intends to adopt the Par Pharmaceutical Holdings, Inc. 2015 Employee Stock Purchase Plan (the “ESPP”) as a means of permitting our eligible employees, including our Named Executive, to acquire shares of our common stock. shares of our common stock will be available for issuance under the ESPP. Under the ESPP, eligible employees of the Company will be eligible to purchase shares of our common stock during specified purchase periods. The purchase price of shares acquired under the ESPP will be determined by the Committee, but may not be less than the lesser of 85% of the fair market value of a share of our common stock at the beginning of the purchase period or 85% of the fair market value of a share of our common stock at the end of the purchase period. As of the date of this prospectus, the initial purchase period under the ESPP has not yet commenced and our board of directors has not determined the date on which such initial purchase period will commence. This summary is not a complete description of all provisions of the ESPP and is qualified in its entirety by reference to the ESPP, a form of which will be filed as an exhibit to the registration statement of which this prospectus is a part.
Par Pharmaceutical Holdings, Inc. Cash Incentive Plan
In connection with this offering, our board of directors intends to adopt the Par Pharmaceutical Holdings, Inc. Cash Incentive Plan, which we refer to as the Cash Incentive Plan. Starting in 2016, annual cash bonus opportunities for our Named Executives and other key employees will be granted under the Cash Incentive Plan. The following summary describes what we anticipate to be the material terms of the Cash Incentive Plan. This summary is not a complete description of all provisions of the Cash Incentive Plan and is qualified in its entirety by reference to the Cash Incentive Plan, a form of which will be filed as an exhibit to the registration statement of which this prospectus is a part.
177
Table of Contents
Administration. The Cash Incentive Plan will be administered by the Committee or its delegates, except that actions with respect to an award intended to qualify for the Section 162(m) “performance-based compensation” exception that are required by Section 162(m) of the Code to be taken by a compensation committee consisting solely of “outside directors” as defined in such section, the administrator will be the Committee, our board of directors or a properly authorized subcommittee consisting solely of two or more outside directors. The administrator has the authority to do all things necessary to administer the Cash Incentive Plan and its interpretation or decision in any plan matter will be final and conclusive as to all parties.
Participants; individual limit. Our executive officers and other key employees will be selected from time to time by the administrator to participate in the Cash Incentive Plan. The maximum payment to any participant pursuant to an award intended to qualify as performance-based compensation under Section 162(m) of the Code under the Cash Incentive Plan in any fiscal year will in no event exceed $ , disregarding any deferrals with respect to such an award.
Awards. With respect to each award granted under the Cash Incentive Plan, the administrator will determine the applicable service or other performance conditions to payment, the amounts that may become payable if those conditions are satisfied, and such other terms and conditions as it deems appropriate in its sole discretion. Subject to certain limitations in the case of awards intended to qualify for the “performance-based compensation” exception under Section 162(m) of the Code (as described below), the administrator may base award performance conditions on such objective or subjective factors as it may determine.
Performance-based awards under Section 162(m). Where an award is intended to qualify for the performance-based compensation exception under Section 162(m) of the Code, all award determinations will be made in a manner consistent the following additional rules: (i) payment under the award must be contingent on satisfaction of objectively determined performance goals determined by the administrator based on one or more performance criterion (as described below); (ii) the administrator must establish all terms of the award not later than by the end of the first quarter of the applicable performance period (or, if earlier, by the 90th day of the performance period); and (iii) no payment may be made under the award unless and until the administrator has certified that the applicable performance conditions have been satisfied in accordance with the terms of the Cash Incentive Plan (as described below).
Performance criteria. Awards under the Cash Incentive Plan will be made based on, and subject to achieving, performance criteria established by the administrator, which may be applied to a participant or participants on an individual basis, to a business unit or division, or to the Company as a whole. Performance criteria for awards intended to qualify as performance-based compensation for purposes of Section 162(m), to the extent applicable, are limited to the objectively determinable measure or objectively determinable measures of performance relating to any or any combination of the following (measured either absolutely or comparatively (including by reference to an index or indices or a specified peer group) and determined either on a consolidated basis or, as the context permits, on a divisional, subsidiary, line of business, project or geographical basis or in combinations thereof and subject to such adjustments, if any, as the Committee specifies, consistent with the requirements of Section 162(m) of the Code): sales; revenues; assets; expenses; earnings before or after deduction for all or any portion of interest, taxes, depreciation, or amortization, whether or not on a continuing operations or an aggregate or per share basis; return on equity, investment, capital or assets; one or more operating ratios; operating income or profit, including on an after tax basis; borrowing levels, leverage ratios or credit rating; market share; capital expenditures; research and development expenditures; cash flow; margins; stock price; stockholder return; sales of particular products or services; product launches; submission of new drug applications, abbreviated new drug applications, drug master files and/or the foreign counterparts of any of them; inspection results; technology transfers; customer acquisition or retention; acquisitions and divestitures (in whole or in part); joint ventures and strategic
178
Table of Contents
alliances; spin-offs, split-ups and the like; reorganizations; or recapitalizations, restructurings, financings (issuance of debt or equity) or refinancings. Each performance criterion also includes all derivations of the criterion (e.g., income includes pre-tax income, net income, operating income, etc.).
To the extent consistent with the requirements of Section 162(m) of the Code, the administrator may establish, by the deadline that otherwise applies to the establishment of the terms of an award intended to qualify for the performance-based compensation exception under Section 162(m) of the Code, that, in the case of any given award, one or more of the performance criteria applicable to the award will be adjusted in an objectively determinable manner to reflect events (for example, the impact of charges for restructurings, discontinued operations, mergers, acquisitions, other unusual or infrequently occurring items, and the cumulative effects of tax or accounting changes, each as defined by U.S. generally accepted accounting principles) occurring during the applicable performance period that affect the applicable performance criterion or criteria.
We intend awards under the Cash Incentive Plan to be exempt from the deduction limitations of Section 162(m) of the Code by reason of the post-initial public offering transition rule under Section 162(m) to the maximum extent possible.
Payment under an award. As soon as practicable after the close of a performance period, the administrator will determine whether and to what extent, if at all, the performance criterion or criteria applicable to each award granted for the performance period have been satisfied and, in the case of awards intended to qualify for the performance-based compensation exception to Section 162(m) of the Code, will take such steps as it determines to be sufficient to satisfy the certification requirement under Section 162(m) of the Code as to the performance results. The administrator will then determine the actual payment, if any, under each award. No amount may be paid under any award intended to qualify for the performance-based compensation exception to Section 162(m) of the Code unless the certification requirement described above has been satisfied as set forth above, except as provided by the administrator consistent with the requirements of Section 162(m) of the Code. The administrator may, in its sole and absolute discretion and with or without specifying its reasons for doing so, after determining the amount that would otherwise be payable under any award for a performance period, reduce (including to zero) the actual payment, if any, to be made under a given award or, in the case of awards other than awards intended to qualify for the performance-based compensation exception to Section 162(m) of the Code, otherwise adjust the amount payable under the award. Unless otherwise determined by the administrator, payments under the Cash Incentive Plan will be made in cash not later than March 15th of the calendar year following the year in which the participant vests in his or her award under this plan. Unless otherwise provided by the administrator, a payment under the Cash Incentive Plan will not be made unless the participant has remained employed with the Company or one of its affiliates through the end of the applicable performance year.
Recovery of compensation. The administrator may provide that awards will be subject to forfeiture, termination or rescission, and that a participant will be obligated to return to the Company payments received with respect to an award, in connection with (i) a breach by the participant of award terms or the Cash Incentive Plan, or any non-competition, non-solicitation, confidentiality or similar covenant or agreement with the Company or any of its affiliates or (ii) an overpayment to the participant of incentive compensation due to inaccurate financial data. The administrator may recover awards and payments under any award in accordance with any applicable Company clawback or recoupment policy, as amended and in effect from time to time, or as otherwise required by applicable law or applicable stock exchange listing standards.
Amendment; termination. The administrator or our board of directors may amend the Cash Incentive Plan at any time and from time to time, and may terminate the Cash Incentive Plan at any time.
179
Table of Contents
Certain relationships and related party transactions
Agreements with TPG and management
In connection with the Merger, we entered into various agreements with TPG and members of our management. These include a management stockholders’ agreement, a management services agreement and a management rights agreement. Further, in connection with this offering, we plan to enter into a stockholders agreement with TPG and a registration rights agreement with TPG and certain members of management. These and related arrangements are described below.
Management stockholders’ agreement
We are party to a management stockholders’ agreement with TPG and certain members of management who were employed by us at the time of the Merger and other members of management that have joined the agreement since the Merger (collectively, “Management”). This agreement requires Management to vote on certain matters as directed by the Sponsor, restricts Management’s ability to transfer shares, provides for certain Company and Sponsor call rights with respect to shares held by Management, and provides for drag along rights, tag along rights and lock-up restrictions. In connection with this offering, other than with respect to the restrictions on share transfer and lock-up restrictions, which will be amended so that they cease 180 days following this offering, the material provisions of this agreement will terminate in accordance with their terms.
Management services agreement
Pursuant to our management services agreement with a management company affiliated with TPG, which we refer to as the Manager, we retained the Manager to provide us with certain management, consulting and financial services to us when and as requested by us. Under that agreement, we agreed to pay the Manager an aggregate annual monitoring fee equal to 1% of adjusted EBITDA (as defined in the indenture that governs our Notes), up to a maximum of $4.0 million per calendar year. The monitoring fee is payable in quarterly installments in arrears at the end of each fiscal quarter. The management services agreement further provides that the Manager will be entitled to receive fees in connection with certain subsequent financing, acquisition, disposition and change of control transactions equal to customary fees charged by internationally recognized investment banks for serving as financial advisor in similar transactions. The management services agreement also provides for reimbursement of out-of-pocket expenses incurred by the Manager. The management services agreement includes customary exculpation and indemnification provisions in favor of the Manager and its affiliates. In connection with this offering, the Manager will be entitled to receive an aggregate termination fee of $ million.
We paid $4.0 million and $3.6 million in aggregate fees and out-of-pocket expenses to the Manager for fiscal 2014 and 2013, respectively. In the period July 12, 2012 (inception) to December 31, 2012 (Successor), we paid a total of $20.7 million to the Manager (which included a transaction fee of $20.0 million related to the closing of the Merger) in aggregate fees and out-of-pocket expenses.
Management rights agreement
We are party to a management rights agreement with TPG pursuant to which we granted to TPG Partners VI, L.P. the majority owner of TPG Sky, L.P. the right to appoint at least one member of our board of directors, together with certain consultation, advisement, information and inspection rights with respect to the Company. We and TPG plan to terminate this agreement in connection with this offering.
180
Table of Contents
Stockholders agreement
In connection with this offering, we plan to enter into a stockholders agreement with the TPG Funds pursuant to which we will be required to take all necessary action to cause the board of directors and its committees to include individuals designated by the TPG Funds in the slate of nominees recommended by the board of directors for election by our stockholders. These nomination rights are described in this prospectus in the sections titled “Management—Board Composition and Director Independence” and “Management—Board Committees.” Our stockholders agreement also provides that we will obtain customary director indemnity insurance and enter into indemnification agreements with the TPG Funds’ director designees, and we expect to enter into indemnification agreements with each of our directors generally providing for indemnification in connection with their service to us or on our behalf.
Registration rights agreement
In connection with this offering, we plan to enter into a registration rights agreement with the TPG Funds that provides the TPG Funds with demand registration rights in respect of any shares of common stock they hold, subject to certain conditions. In addition, in the event that we register additional shares of common stock for sale to the public following the completion of this offering, we will be required to give notice of such registration to the parties thereto, and, subject to certain limitations, include shares of common stock held by them in such registration. Our executive officers, Mr. LePore and Mr. Mansukani have similar piggyback rights in the event we register shares of common stock held by the TPG Funds for sale to the public following the completion of this offering. The agreement includes customary indemnification provisions in favor of the TPG Funds and the other parties thereto, and any person who is or might be deemed a control person (within the meaning of the Securities Act and the Exchange Act) and related parties of such entities against certain losses and liabilities (including reasonable costs of investigation and legal expenses) arising out of or based upon any filing or other disclosure made by us under the securities laws relating to any such registration.
Transactions with other sponsor portfolio companies
TPG is a private equity firm that has investments in companies that do business with us in the ordinary course of business. We believe these transactions are conducted on an arms-length basis. For fiscal 2014, 2013 and 2012, we purchased services of approximately $4.0 million, $6.6 million and $6.2 million, respectively, from companies in which TPG has investments.
Related party transactions policy
In connection with this offering, we will adopt a policy with respect to the review, approval and ratification of related party transactions. Under the policy, our audit committee is responsible for reviewing and approving related party transactions. In the course of its review and approval of related party transactions, our audit committee will consider the relevant facts and circumstances to decide whether to approve such transactions. Related party transactions must be approved or ratified by the audit committee based on full information about the proposed transaction and the related party’s interest.
We did not have a written policy regarding the review and approval of related party transactions immediately prior to this offering. Nevertheless, with respect to such transactions, it was our policy for our board of directors to consider the nature of and business reason for such transactions, how the terms of such transactions compared to those which might be obtained from unaffiliated third parties and whether such transactions were otherwise fair to and in the best interests of, or not contrary to, our best interests.
181
Table of Contents
Principal and selling stockholders
The following table sets forth information with respect to the beneficial ownership of our common stock as of March 31, 2015 for (a) each person, or group of affiliated persons, known by us to own beneficially more than 5% of our outstanding shares of common stock, (b) each member of our board of directors, (c) each of our named executive officers, (d) all of our directors and executive officers as a group and (e) each other selling stockholder.
Beneficial ownership is determined in accordance with SEC rules. The information is not necessarily indicative of beneficial ownership for any other purpose. In general, under these rules a beneficial owner of a security includes any person who, directly or indirectly, through any contract, arrangement, understanding, relationship or otherwise has or shares voting power or investment power with respect to such security. A person is also deemed to be a beneficial owner of a security if that person has the right to acquire beneficial ownership of such security within 60 days. To our knowledge, except as otherwise indicated, and subject to applicable community property laws, the persons named in the table have sole voting and investment power with respect to all shares of common stock held by that person.
The percentage of shares beneficially owned is computed on the basis of 784,251,980 shares of our common stock outstanding held by 39 shareholders of record as of March 31, 2015. Shares of our common stock that a person has the right to acquire within 60 days of March 31, 2015 are deemed outstanding for purposes of computing the percentage ownership of such person’s holdings, but are not deemed outstanding for purposes of computing the percentage ownership of any other person, except with respect to the percentage ownership of all directors and executive officers as a group. Unless otherwise indicated in a footnote, the address for each individual listed below is c/o Par Pharmaceutical Holdings, Inc., One Ram Ridge Road, Chestnut Ridge, New York 10977.
| Name and address of beneficial owners |
Shares beneficially owned prior to this offering |
Number of |
Number of |
Shares beneficially owned after this offering (without option) |
Shares beneficially owned after this offering (with option) | |||||||||||||||
| Number | Percent | Number | Percent | Number | Percent | |||||||||||||||
| 5% stockholders: |
||||||||||||||||||||
| TPG Funds(1) |
776,071,428 | 99.0% | ||||||||||||||||||
| Directors and named executive officers: |
||||||||||||||||||||
| Paul V. Campanelli(2) |
9,341,403 | 1.2% | ||||||||||||||||||
| Michael A. Tropiano(3) |
2,460,004 | * | ||||||||||||||||||
| Thomas J. Haughey(4) |
5,377,910 | * | ||||||||||||||||||
| Terrance J. Coughlin(5) |
1,714,286 | * | ||||||||||||||||||
| Patrick G. LePore(6) |
4,712,000 | * | ||||||||||||||||||
| Todd B. Sisitsky(7) |
— | — | ||||||||||||||||||
| Jeffrey K. Rhodes(8) |
— | — | ||||||||||||||||||
| Sharad Mansukani(9) |
640,000 | * | ||||||||||||||||||
| All executive officers and directors as a group (8 persons)(10) |
24,245,603 | 3.0% | ||||||||||||||||||
|
| ||||||||||||||||||||
| * | Less than 1%. |
| (1) | Includes 609,737,616 shares of common stock held by TPG Sky, L.P., a Delaware limited partnership (“TPG Sky”), 158,833,812 shares held by TPG Sky Co-Invest, L.P., a Delaware limited partnership (“TPG Sky Co-Invest”), and 7,500,000 shares held by TPG Biotechnology Partners IV, L.P., a Delaware limited partnership (“Biotech IV” and together with TPG Sky and TPG Sky Co-Invest, the “TPG Funds”). The general partner of each of TPG Sky and TPG Sky Co-Invest is TPG Advisors VI, Inc., a Delaware corporation (“TPG Advisors VI”). The general partner of Biotech IV is TPG Biotechnology GenPar IV, L.P., a Delaware limited partnership, whose general partner is TPG Biotech GenPar IV Advisors, LLC, a Delaware |
182
Table of Contents
| limited liability company, whose sole member is TPG Holdings I, L.P., a Delaware limited partnership, whose general partner is TPG Holdings I-A, LLC, a Delaware limited liability company, whose sole member is TPG Group Holdings (SBS), L.P., a Delaware limited partnership, whose general partner is TPG Group Holdings (SBS) Advisors, Inc., a Delaware corporation (“Group Advisors”). David Bonderman and James G. Coulter are officers and sole stockholders of each of TPG Advisors VI and Group Advisors and may therefore be deemed to be the beneficial owners of the shares held by the TPG Funds. The business address of each of the entities listed in this note is c/o TPG Global, LLC, 301 Commerce Street, Suite 3300, Fort Worth, TX 76102. |
| (2) | Shares shown as beneficially owned by Mr. Campanelli includes 9,341,403 shares underlying stock options that are currently exercisable or vest within 60 days. |
| (3) | Shares shown as beneficially owned by Mr. Tropiano includes 2,460,004 shares underlying stock options that are currently exercisable or vest within 60 days. |
| (4) | Shares shown as beneficially owned by Mr. Haughey includes 5,377,910 shares underlying stock options that are currently exercisable or vest within 60 days. |
| (5) | Shares shown as beneficially owned by Mr. Coughlin includes 714,286 shares underlying stock options that are currently exercisable or vest within 60 days. |
| (6) | Shares shown as beneficially owned by Mr. LePore includes 2,000,000 shares of common stock, 712,000 shares underlying stock options that are currently exercisable or vest within 60 days and 2,000,000 shares held by Park Street Investors, L.P., a Delaware limited partnership. The General Partnership of Park Street Investors, L.P. is Park Street Investment Corporation (“PSIC”), a Delaware corporation, of which Mr. LePore and his spouse are officers and directors, and together they own a majority of the outstanding stock of PSIC. |
| (7) | Todd B. Sisitsky, who is one of our directors, is a TPG Partner. Mr. Sisitsky has no voting or investment power over the shares held by the TPG Funds. The address of Mr. Sisitsky is c/o TPG Global, LLC, 301 Commerce Street, Suite 3300, Fort Worth, TX 76102. |
| (8) | Jeffrey K. Rhodes, who is one of our directors, is a TPG Principal. Mr. Rhodes has no voting or investment power over the shares held by the TPG Funds. The address of Mr. Rhodes is c/o TPG Global, LLC, 301 Commerce Street, Suite 3300, Fort Worth, TX 76102. |
| (9) | Includes 450,000 shares underlying stock options that are currently exercisable or vest within 60 days. |
| (10) | Shares shown as beneficially owned includes 19,055,603 shares underlying stock options that are currently exercisable or vest within 60 days. |
183
Table of Contents
We summarize below the principal terms of the agreements that govern our existing indebtedness. We refer you to the exhibits to the registration statement of which this prospectus forms a part for copies of agreements governing the indebtedness described below.
Senior credit facilities
Overview
In connection with the Merger, on September 28, 2012, our indirect subsidiaries, Par Pharmaceutical Companies and Par Pharmaceutical, Inc. entered as co-borrowers into a credit agreement (the “Original Credit Agreement”) with a syndicate of banks, led by Bank of America, N.A., as Administrative Agent, Bank of America, N.A., Deutsche Bank Securities Inc., Goldman Sachs Bank USA, Citigroup Global Markets, Inc., RBC Capital Markets LLC and BMO Capital Markets Corp. as Joint Lead Arrangers and Joint Lead Bookrunners, Deutsche Bank Securities Inc. and Goldman Sachs Bank USA as Co-Syndication Agents, and Citigroup Global Markets Inc. and RBC Capital Markets LLC as Co-Documentation Agents, to provide Senior Credit Facilities comprised of a seven-year senior secured term loan in an initial aggregate principal amount of $1,055.0 million, the Tranche B Term Loans, and a five-year senior secured revolving credit facility in an initial amount of $150.0 million.
On February 6, 2013, Par Pharmaceutical Companies entered into an amendment (“Amendment No. 1”) to replace the Tranche B Term Loans with a new class of term loans in an aggregate principal amount of $1,066.0 million (the “Tranche B-1 Term Loans”). Among other things, the Tranche B-1 Term Loans reduced the interest rate applicable to the term loans.
Par Pharmaceutical Companies entered into an amendment on February 22, 2013 (“Amendment No. 2”) and another amendment on February 28, 2013 (“Amendment No. 3”) which, collectively, extended the maturity date of revolving credit commitments of certain existing lenders who elected to do so, resulting in a $127.5 million senior secured revolving credit facility (the “Tranche B Revolving Credit Facility”) comprised of those existing lenders who elected to extend the maturity date of their revolving commitments, and created a $22.5 million senior secured revolving credit facility (the “Tranche A Revolving Credit Facility” and, together with the Tranche B Revolving Credit Facility, the “Revolving Credit Facility”) comprised of those existing lenders who elected not to extend the maturity date of their revolving credit commitments.
On February 20, 2014, in conjunction with the Par Sterile acquisition, Par Pharmaceutical Companies entered into an amendment to the Original Credit Agreement (“Amendment No. 4”) to replace the Tranche B-1 Term Loans with a new class of term loans in an aggregate principal amount of $1,066.0 million (the “Original Tranche B-2 Term Loans”). Among other things, the Original Tranche B-2 Term Loans reduced the interest rate applicable to the term loans and increased the maximum senior secured net leverage ratio in compliance with which Par Pharmaceutical Companies can incur new incremental debt. Additionally, in connection therewith Par Pharmaceutical Companies also borrowed an additional $395.0 million of Tranche B-2 Term Loans (the “Incremental B-2 Term Loans” and, together with the Original Tranche B-2 Term Loans, the “Tranche B-2 Term Loans”) from the lenders participating therein for the purpose of consummating the Par Sterile acquisition.
On February 20, 2015, Par Pharmaceutical Companies entered into Amendment No. 5 which was effective as of February 25, 2015 and increased the maximum first lien senior secured net leverage ratio levels included in the financial maintenance covenant, which covenant only applies to the extent there are borrowings under the Revolving Credit Facility (excluding undrawn letters of credit to the extent cash collateralized) outstanding.
On February 25, 2015, Par Pharmaceutical Companies entered into Amendment No. 6 which authorized the funding of a new tranche of Incremental B-3 Term Loans in an aggregate principal amount of $425.0 million,
184
Table of Contents
the proceeds of which were used to pay the Dividend Recapitalization and related fees and expenses. The terms of the Incremental B-3 Term Loans are substantially the same as the terms of the Tranche B-2 Term Loans, except that (1) the interest rate margins applicable to the Incremental B-3 Term Loans are 3.25% for LIBOR and 2.25% for base rate, a 25 basis point increase compared to the Tranche B-2 Term Loans and (2) the Incremental B-3 Term Loans are subject to a soft call provision applicable to the optional prepayment of the loans which requires a premium equal to 1.00% of the aggregate principal amount of the loans being prepaid if, on or prior to August 25, 2015, the Par Pharmaceutical Companies enters into certain repricing transactions. Additionally, all voluntary and mandatory prepayments of outstanding term loans must be made pro rata among the Incremental B-3 Term Loans and the Tranche B-2 Term Loans.
As of March 31, 2015, the Senior Credit Facilities consisted of the following:
| • | a $127.5 million Tranche B Revolving Credit Facility, all of which remained undrawn as of March 31, 2015; |
| • | a $22.5 million Tranche A Revolving Credit Facility, all of which remained undrawn as of March 31, 2015; |
| • | a $1,450.0 million Tranche B-2 Term Loan; and |
| • | a $425.0 million Incremental B-3 Term Loan. |
The following is a summary of the material terms of the Original Credit Agreement, as amended by the above-described Amendment No. 1, Amendment No. 2, Amendment No. 3, Amendment No. 4, Amendment No. 5 and Amendment No. 6 (the “Credit Agreement”). The description does not purport to be complete and is qualified in its entirety by reference to the provisions of the Credit Agreement.
Maturity
The Tranche B-2 Term Loan and Incremental B-3 Term Loans (collectively, the “Term Loans”) each mature on September 28, 2019. The commitments under the Tranche B Revolving Credit Facility terminate on December 28, 2017 and the commitments under the Tranche A Revolving Credit Facility terminate on September 28, 2017.
Interest rates, fees and amortization
Repayments of the proceeds of the Term Loans are due in quarterly installments in an amount equal to 0.25% of the original aggregate principal amount of the Term Loans over the term of the Credit Agreement, with such payments scheduled for the last business day of each March, June, September and December. Amounts borrowed under the Revolving Credit Facility are payable in full upon expiration of the Credit Agreement. Par Pharmaceutical Companies is also obligated to pay a 0.50% commitment fee based on the unused portion of the Revolving Credit Facility.
Borrowings of the Term Loans bear interest at a rate per annum equal to an applicable margin plus, at Par Pharmaceutical Companies’ option, either LIBOR (which is subject to a 1.00% floor) or the base rate (which is subject to a 2.00% floor). The applicable margin for borrowings under the Tranche B-2 Term Loans is 3.00% for LIBOR borrowings and 2.00% for base rate borrowings. The applicable margin for borrowings under the Incremental B-3 Term Loans is 3.25% for LIBOR borrowings and 2.25% for base rate borrowings.
Borrowings under the Revolving Credit Facility bear interest at a rate per annum equal to an applicable margin plus, at Par Pharmaceutical Companies’ option, either LIBOR or the base rate. The applicable margin and commitment fee rates for borrowings under the Revolving Credit Facility vary depending on the senior secured net leverage ratio. If the senior secured net leverage ratio is greater than 3.0 to 1.0, the applicable margin
185
Table of Contents
under the Tranche B Revolving Credit Facility is 3.25% for LIBOR borrowings and 2.25% for base rate borrowings, with a commitment fee rate of 0.50% and the applicable margin under the Tranche A Revolving Credit Facility is 3.75% for LIBOR borrowings and 2.75% for base rate borrowings, with a commitment fee rate of 0.50%. If the senior secured net leverage ratio is between 2.5 to 1.0 and 3.0 to 1.0, the applicable margin under the Tranche B Revolving Credit Facility is 3.25% for LIBOR borrowings and 2.25% for base rate borrowings, with a commitment fee rate of 0.375% and the applicable margin under the Tranche A Revolving Credit Facility is 3.50% for LIBOR borrowings and 2.50% for base rate borrowings, with a commitment fee rate of 0.375%. If the senior secured net leverage ratio is less than or equal to 2.5 to 1.0, the applicable margin under the Tranche B Revolving Credit Facility is 3.00% for LIBOR borrowings and 2.00% for base rate borrowings, with a commitment fee rate of 0.375% and the applicable margin under the Tranche A Revolving Credit Facility is 3.25% for LIBOR borrowings and 2.25% for base rate borrowings, with a commitment fee rate of 0.375%. Borrowings and repayments of loans under the Tranche B Revolving Credit Facility and the Tranche A Revolving Credit Facility may be made on a non-pro rata basis with one another, and the commitments under the Tranche A Revolving Credit Facility may be terminated prior to the commitments under the Tranche B Revolving Credit Facility.
Accordion
The Credit Agreement includes an accordion feature pursuant to which Par Pharmaceutical Companies may increase the amount available to be borrowed by up to an additional $250.0 million (or a greater amount if certain specified financial ratios are met) under certain circumstances. The maximum senior secured net leverage ratio in compliance with which Par Pharmaceutical Companies can incur new incremental debt is 3.75 to 1.00.
Prepayments
Par Pharmaceutical Companies may, at its option, voluntarily prepay any amounts outstanding under the Term Loans and the Revolving Credit Facility in whole or in part without premium or penalty, other than customary “breakage” costs with respect to LIBOR loans. However, the Incremental B-3 Term Loans are subject to a soft call provision applicable to the voluntary prepayment of the loans which requires a premium equal to 1.00% of the aggregate principal amount of the loans being prepaid if, on a date prior to August 25, 2015, Par Pharmaceutical Companies enters into certain repricing transactions. All voluntary and mandatory prepayments of outstanding term loans must be made pro rata among the Tranche B-2 Term Loan and the Incremental B-3 Term Loans.
Par Pharmaceutical Companies is obligated to make mandatory principal prepayments for any fiscal year if the ratio of total amount of outstanding senior secured debt less cash and cash equivalents divided by our consolidated EBITDA is greater than 2.50 to 1.00 as of December 31 of any fiscal year, subject to acceptance of the Credit Agreement lenders. When the ratio is greater than 2.50 to 1.00 but less than or equal to 3.00 to 1.00, Par Pharmaceutical Companies is required to pay 25% of excess cash flows, as defined in the Credit Agreement. When the ratio is greater than 3.00 to 1.00, Par Pharmaceutical Companies is required to pay 50% of excess cash flows in the form of principal prepayments, subject to acceptance of the Credit Agreement lenders.
For the year ended December 31, 2013, we were obligated to pay $10.8 million of principal prepayments during the first quarter of 2014. However, certain Term Loan lenders exercised their right under the Credit Agreement to decline their pro rata share of the mandatory principal prepayment. Therefore our actual mandatory principal prepayment in the first quarter of 2014 was $5.0 million. As permitted under the Credit Agreement, we applied this mandatory principal prepayment amount against scheduled principal payments for the second, third and fourth quarters of 2014.
186
Table of Contents
For the year ended December 31, 2014, we were not be obligated to make any mandatory principal payments during the first quarter of 2015.
Covenants; Representations & Warranties
The Credit Agreement contains customary representations and warranties, as well as customary events of default, in certain cases subject to reasonable and customary periods to cure, including but not limited to: failure to make payments when due, breach of covenants, breach of representations and warranties, insolvency proceedings, certain judgments and any change of control.
The Credit Agreement also contains various customary covenants that, in certain instances, restrict our ability to: (i) create liens on assets; (ii) incur additional indebtedness; (iii) engage in mergers or consolidations with or into other companies; (iv) engage in dispositions of assets, including entering into a sale and leaseback transaction; (v) pay dividends and distributions or repurchase capital stock; (vi) make investments, loans, guarantees or advances in or to other companies; (vii) change the nature of our business; (viii) repay or redeem certain junior indebtedness; (ix) engage in transactions with affiliates; and (x) enter into restrictive agreements. In addition, the Credit Agreement requires Par Pharmaceutical Companies to demonstrate compliance with a maximum senior secured first lien net leverage ratio whenever amounts are outstanding under the Revolving Credit Facility (excluding undrawn letters of credit to the extent cash collateralized) as of the last day of any quarterly testing period. All obligations under the Credit Agreement are guaranteed by Par Pharmaceutical Companies’ material domestic subsidiaries. All obligations under the Credit Agreement are secured by a pledge of (i) all of Par Pharmaceutical Companies’ equity interests, (ii) all equity interests of each material domestic subsidiary of Par Pharmaceutical Companies and (iii) approximately 65% of the equity interests of each material foreign subsidiary that is a wholly owned direct subsidiary of any loan party.
7.375% senior notes
Overview
In connection with the Merger, on September 28, 2012, Par Pharmaceutical Companies issued $490.0 million aggregate principal amount of the Notes. The Notes were issued pursuant to an indenture dated as of the same date between Par Pharmaceutical Companies and Wells Fargo Bank, National Association, as trustee. Interest on the Notes is payable semi-annually on April 15 and October 15, commencing on April 15, 2013. The Notes mature on October 15, 2020.
Redemption
Par Pharmaceutical Companies may redeem the Notes at its option, in whole or in part on one or more occasions, at any time on or after October 15, 2015, at specified redemption prices that vary by year, together with accrued and unpaid interest, if any, to the date of redemption. At any time prior to October 15, 2015, Par Pharmaceutical Companies may redeem up to 40% of the aggregate principal amount of the Notes with the net proceeds of certain equity offerings at a redemption price equal to the sum of (i) 107.375% of the aggregate principal amount thereof, plus (ii) accrued and unpaid interest, if any, to the redemption date. At any time prior to October 15, 2015, Par Pharmaceutical Companies may also redeem the Notes, in whole or in part on one or more occasions, at a price equal to 100% of the principal amount of the notes, plus accrued and unpaid interest and a specified “make-whole premium.”
Guarantee
The Notes are guaranteed on a senior unsecured basis by Par Pharmaceutical Companies’ material existing direct and indirect wholly-owned domestic subsidiaries and, subject to certain exceptions, each of Par
187
Table of Contents
Pharmaceutical Companies’ future direct and indirect domestic subsidiaries that guarantee the Senior Credit Facilities or Par Pharmaceutical Companies’ other indebtedness or indebtedness of the guarantors will guarantee the Notes. Under certain circumstances, the subsidiary guarantors may be released from their guarantees without consent of the holders of Notes. We anticipate that Par Pharmaceutical Holdings, Inc. will become a guarantor under the Notes after completion of this offering.
Security and ranking
The Notes and the subsidiary guarantees are Par Pharmaceutical Companies’ and the guarantors’ senior unsecured obligations and (i) rank senior in right of payment to all of Par Pharmaceutical Companies’ and the subsidiary guarantors’ existing and future subordinated indebtedness; (ii) rank equally in right of payment with all of Par Pharmaceutical Companies’ and the subsidiary guarantors’ existing and future senior indebtedness; (iii) are effectively subordinated to any of Par Pharmaceutical Companies’ and the subsidiary guarantors’ existing and future secured debt, to the extent of the value of the assets securing such debt; and (iv) are structurally subordinated to all of the existing and future liabilities (including trade payables) of each of Par Pharmaceutical Companies’ subsidiaries that do not guarantee the Notes.
Covenants
The indenture governing the Notes contains customary events of default, in certain cases subject to reasonable and customary periods to cure, including but not limited to: failure to make payments when due, breach of covenants, a payment default or acceleration equaling $40 million or more according to the terms of certain other indebtedness, failure to pay final judgments aggregating in excess of $40 million when due, insolvency proceedings, a required guarantee shall cease to remain in full force.
The indenture also contains various customary covenants that, in certain instances, restrict our ability to: (i) pay dividends and distributions or repurchase capital stock; (ii) incur additional indebtedness; (iii) make investments, loans, guarantees or advances in or to other companies; (iv) engage in dispositions of assets, including entering into a sale and leaseback transaction; (v) engage in transactions with affiliates; (vi) create liens on assets; (vii) repurchase or redeem certain subordinated indebtedness, (viii) engage in mergers or consolidations with or into other companies; and (ix) change the nature of our business.
The covenants are subject to a number of exceptions and qualifications. Certain of these covenants will be suspended during any period of time that (1) the Notes have Investment Grade Ratings (as defined in the indenture) from both Moody’s Investors Service, Inc. and Standard & Poor’s, and (2) no default has occurred and is continuing under the indenture. In the event that the Notes are downgraded to below an Investment Grade Rating, Par Pharmaceutical Companies and certain subsidiaries will again be subject to the suspended covenants with respect to future events.
188
Table of Contents
General
Upon completion of this offering, our authorized capital stock will consist of shares of common stock, par value $0.001 per share, and shares of preferred stock, par value $0.001 per share. The following description of our capital stock is intended as a summary only and is qualified in its entirety by reference to our certificate of incorporation and bylaws to be in effect at the closing of this offering, which are filed as exhibits to the registration statement of which this prospectus forms a part, and to the applicable provisions of the DGCL.
Common stock
Dividend rights. Subject to preferences that may apply to shares of preferred stock outstanding at the time, holders of outstanding shares of common stock will be entitled to receive dividends out of assets legally available at the times and in the amounts as the board of directors may determine from time to time. See “Dividend policy.”
Voting rights. Each outstanding share of common stock will be entitled to one vote on all matters submitted to a vote of stockholders. Holders of shares of our common stock will have no cumulative voting rights.
Preemptive rights. Our common stock will not be entitled to preemptive or other similar subscription rights to purchase any of our securities.
Conversion or redemption rights. Our common stock will be neither convertible nor redeemable.
Liquidation rights. Upon our liquidation, the holders of our common stock will be entitled to receive pro rata our assets that are legally available for distribution, after payment of all debts and other liabilities and subject to the prior rights of any holders of preferred stock then outstanding.
Preferred stock
Our board of directors may, without further action by our stockholders, from time to time, direct the issuance of shares of preferred stock in series and may, at the time of issuance, determine the designations, powers, preferences, privileges and relative participating, optional or special rights, as well as the qualifications, limitations or restrictions thereof, including dividend rights, conversion rights, voting rights, terms of redemption and liquidation preferences, any or all of which may be greater than the rights of the common stock. Satisfaction of any dividend preferences of outstanding shares of preferred stock would reduce the amount of funds available for the payment of dividends on shares of our common stock. Holders of shares of preferred stock may be entitled to receive a preference payment in the event of our liquidation before any payment is made to the holders of shares of our common stock. Under certain circumstances, the issuance of shares of preferred stock may render more difficult or tend to discourage a merger, tender offer or proxy contest, the assumption of control by a holder of a large block of our securities or the removal of incumbent management. Upon the affirmative vote of a majority of the total number of directors then in office, our board of directors, without stockholder approval, may issue shares of preferred stock with voting and conversion rights which could adversely affect the holders of shares of our common stock and the market value of our common stock. Upon consummation of this offering, there will be no shares of preferred stock outstanding, and we have no present intention to issue any shares of preferred stock.
189
Table of Contents
Anti-takeover effects of our certificate of incorporation and our bylaws
Our certificate of incorporation and our bylaws contain provisions that may delay, defer or discourage another party from acquiring control of us. We expect that these provisions will discourage coercive takeover practices or inadequate takeover bids. These provisions are also designed to encourage persons seeking to acquire control of us to first negotiate with the board of directors, which we believe may result in an improvement of the terms of any such acquisition in favor of our stockholders. However, they may also discourage acquisitions that some stockholders may favor.
These provisions include:
| • | Classified board. Our certificate of incorporation provides that our board of directors will be divided into three classes of directors. As a result, approximately one-third of our board of directors will be elected each year. The classification of directors will have the effect of making it more difficult for stockholders to change the composition of our board. Following the closing of this offering, our board of directors will initially be composed of five members. |
| • | Requirements for removal of directors. Following the date on which the TPG Funds no longer beneficially own a majority of our common stock, directors may only be removed for cause by the affirmative vote of the holders of at least 75% of the voting power of our outstanding shares of capital stock. |
| • | Advance notice procedures. Our bylaws establish an advance notice procedure for stockholder proposals to be brought before an annual meeting of our stockholders, including proposed nominations of persons for election to the board of directors. Stockholders at an annual meeting will only be able to consider proposals or nominations specified in the notice of meeting or brought before the meeting by or at the direction of the board of directors or by a stockholder who was a stockholder of record on the record date for the meeting, who is entitled to vote at the meeting and who has given our secretary timely written notice, in proper form, of the stockholder’s intention to bring that business before the meeting. Although the bylaws do not give the board of directors the power to approve or disapprove stockholder nominations of candidates or proposals regarding other business to be conducted at a special or annual meeting, the bylaws may have the effect of precluding the conduct of certain business at a meeting if the proper procedures are not followed or may discourage or deter a potential acquiror from conducting a solicitation of proxies to elect its own slate of directors or otherwise attempting to obtain control of our company. |
| • | Actions by written consent; special meetings of stockholders. Our certificate of incorporation provides that, following the date on which the TPG Funds no longer beneficially own a majority of our common stock, stockholder action can be taken only at an annual or special meeting of stockholders and cannot be taken by written consent in lieu of a meeting. Our certificate of incorporation also provides that, except as otherwise required by law, special meetings of the stockholders can only be called by or at the direction of the chairman of the board, our chief executive officer, a majority of the board of directors, or, until the date on which the TPG Funds no longer beneficially own a majority of our common stock, by the secretary at the request of the holders of 50% or more of our outstanding shares of common stock. |
| • | Supermajority approval requirements. Following the date on which the TPG Funds no longer beneficially own a majority of our common stock, certain amendments to our certificate of incorporation and shareholder amendments to our bylaws will require the affirmative vote of at least 75% of the voting power of the outstanding shares of our capital stock. |
| • | Authorized but unissued shares. Our authorized but unissued shares of preferred stock will be available for future issuance without stockholder approval. The existence of authorized but unissued shares of preferred stock could render more difficult or discourage an attempt to obtain control of a majority of our common stock by means of a proxy contest, tender offer, merger or otherwise. |
190
Table of Contents
| • | Business combinations with interested stockholders. We have elected in our certificate of incorporation not to be subject to Section 203 of the DGCL, an antitakeover law. In general, Section 203 prohibits a publicly held Delaware corporation from engaging in a business combination, such as a merger, with a person or group owning 15% or more of the corporation’s voting stock for a period of three years following the date the person became an interested stockholder, unless (with certain exceptions) the business combination or the transaction in which the person became an interested stockholder is approved in a prescribed manner. While we will not be subject to any anti-takeover effects of Section 203, our certificate of incorporation contains provisions that have the same effect as Section 203, except that they provide that investment funds affiliated with TPG will not be deemed to be an “interested stockholder,” regardless of the percentage of our voting stock owned by investment funds affiliated with TPG, and accordingly will not be subject to such restrictions. |
Exclusive jurisdiction for certain actions
Our certificate of incorporation requires, to the fullest extent permitted by law, that derivative actions brought in the name of the Company, actions against directors, officers and employees for breach of a fiduciary duty and other similar actions, may be brought only in specified courts in the State of Delaware. Although we believe this provision benefits us by providing increased consistency in the application of Delaware law in the types of lawsuits to which it applies, the provision may have the effect of discouraging lawsuits against our directors and officers. See “Risk Factors—Our certificate of incorporation designates courts in the State of Delaware as the sole and exclusive forum for certain types of actions and proceedings that may be initiated by our stockholders, which could limit our stockholders’ ability to obtain a favorable judicial forum for disputes with us or our directors, officers or employees.”
Litigation costs
Our bylaws require, except to the extent prohibited by the DGCL, that in all derivative actions brought in the name of the Company, actions against directors, officers and employees for breach of a fiduciary duty and other similar actions, the initiating party shall reimburse the Company and any officer, director or other employee for all fees, costs and expenses incurred in connection with such action if such initiating party does not substantially achieve the full remedy sought. While application of this standard will necessarily take into account the particular facts, circumstances and equities of any particular claim, we would expect a claiming party to be required to prevail on the merits on substantially all of the claims asserted in the complaint and, as a result, receive substantially the full remedy that it was seeking (including, if applicable, any equitable remedy) in order to avoid responsibility for reimbursing such fees, costs and expenses, and we expect that we would seek to apply this standard in a manner most favorable to us. However, it is uncertain how a court will ultimately interpret this provision. Although we believe this provision benefits us by discouraging meritless lawsuits against the Company and our directors, officers and employees, the provision may have the effect of discouraging lawsuits that could benefit the Company. See “Risk Factors—Our bylaws provide that if a claiming party brings certain actions against us and is not successful on the merits then they will be obligated to pay our litigation costs, which could have the effect of discouraging litigation, including claims brought by our stockholders.”
Corporate opportunities
Our certificate of incorporation provides that we renounce any interest or expectancy in the business opportunities of TPG and of its officers, directors, agents, stockholders, members, partners, affiliates and subsidiaries and each such party shall not have any obligation to offer us those opportunities unless presented to one of our directors or officers in his or her capacity as a director or officer.
191
Table of Contents
Limitations on liability and indemnification of directors and officers
Our certificate of incorporation limits the liability of our directors to the fullest extent permitted by the DGCL and our bylaws require that we will provide them with customary indemnification. We expect to enter into customary indemnification agreements with each of our executive officers and directors that provide them, in general, with customary indemnification in connection with their service to us or on our behalf. We also maintain officers’ and directors’ liability insurance that insures against liabilities that our officers and directors may incur in such capacities.
Transfer agent and registrar
The transfer agent and registrar for our common stock is American Stock Transfer & Trust Company, LLC.
Listing
We intend to apply to list our common stock on the NYSE under the symbol “PRX.”
192
Table of Contents
Shares eligible for future sale
Before this offering, there has been no public market for our common stock. As described below, only a limited number of shares currently outstanding will be available for sale immediately after this offering due to contractual and legal restrictions on resale. Nevertheless, future sales of substantial amounts of our common stock, including shares issued upon the exercise of outstanding options or warrants, in the public market after this offering, or the perception that those sales may occur, could cause the prevailing market price for our common stock to fall or impair our ability to raise capital through sales of our equity securities.
Upon the closing of this offering, we will have outstanding shares of our common stock, after giving effect to the issuance of shares of our common stock in this offering, assuming no exercise by the underwriters of their option to purchase additional shares and no exercise of options outstanding as of March 31, 2015.
Of the shares that will be outstanding immediately after the closing of this offering, we expect that the shares to be sold in this offering will be freely tradable without restriction under the Securities Act unless purchased by our “affiliates,” as that term is defined in Rule 144 under the Securities Act. Shares purchased by our affiliates may not be resold except pursuant to an effective registration statement or an exemption from registration, including the safe harbor under Rule 144 of the Securities Act described below. In addition, following this offering, shares of common stock issuable pursuant to awards granted under certain of our equity plans that are covered by a registration statement on Form S-8 will be freely tradable in the public market, subject to certain contractual and legal restrictions described below.
The remaining shares of our common stock outstanding after this offering will be “restricted securities,” as that term is defined in Rule 144 of the Securities Act, and we expect that substantially all of these restricted securities will be subject to the lock-up agreements described below. These restricted securities may be sold in the public market only if the sale is registered or pursuant to an exemption from registration, such as the safe harbor provided by Rule 144.
Lock-up agreements
We and each of our directors, executive officers and certain other stockholders, who collectively own shares of our common stock following this offering, have agreed that, without the prior written consent of certain of the underwriters, we and they will not, subject to limited exceptions, directly or indirectly sell or dispose of any shares of common stock or any securities convertible into or exchangeable or exercisable for shares of common stock for a period of 180 days after the date of this prospectus, unless extended pursuant to its terms. The lock-up restrictions and specified exceptions are described in more detail under “Underwriting (conflicts of interest).”
Rule 144
In general, under Rule 144, beginning 90 days after the date of this prospectus, any person who is not our affiliate and has held their shares for at least six months, including the holding period of any prior owner other than one of our affiliates, may sell shares without restriction, subject to the availability of current public information about us. In addition, under Rule 144, any person who is not our affiliate and has not been our affiliate at any time during the preceding three months and has held their shares for at least one year, including the holding period of any prior owner other than one of our affiliates, would be entitled to sell an unlimited number of shares immediately upon the closing of this offering without regard to whether current public information about us is available.
193
Table of Contents
Beginning 90 days after the date of this prospectus, a person who is our affiliate or who was our affiliate at any time during the preceding three months and who has beneficially owned restricted securities for at least six months, including the holding period of any prior owner other than one of our affiliates, is entitled to sell a number of shares within any three-month period that does not exceed the greater of: (i) 1% of the number of shares of our common stock outstanding, which will equal approximately shares immediately after this offering; and (ii) the average weekly trading volume of our common stock on the NYSE during the four calendar weeks preceding the filing of a notice on Form 144 with respect to the sale.
Sales under Rule 144 by our affiliates are also subject to certain manner of sale provisions, notice requirements and the availability of current public information about us.
Rule 701
In general, under Rule 701 under the Securities Act, beginning 90 days after we become subject to the public company reporting requirements of the Exchange Act, any of our employees, directors, officers, consultants or advisors who acquired shares of common stock from us in connection with a written compensatory stock or option plan or other written agreement in compliance with Rule 701 is entitled to sell such shares in reliance on Rule 144 but without compliance with certain of the requirements contained in Rule 144. Accordingly, subject to any applicable lock-up agreements, beginning 90 days after we become subject to the public company reporting requirements of the Exchange Act, under Rule 701 persons who are not our affiliates may resell those shares without complying with the minimum holding period or public information requirements of Rule 144, and persons who are our affiliates may resell those shares without compliance with Rule 144’s minimum holding period requirements.
Equity incentive plans
Following this offering, we intend to file with the SEC a registration statement on Form S-8 under the Securities Act covering the shares of common stock that are subject to outstanding options and other awards issuable pursuant to our equity incentive plans. Shares covered by such registration statement will be available for sale in the open market following its effective date, subject to certain Rule 144 limitations applicable to affiliates and the terms of lock-up agreements applicable to those shares.
Registration Rights
Subject to the lock-up restrictions described above, certain holders of our common stock may demand that we register the sale of their shares under the Securities Act or, if we file another registration statement under the Securities Act other than a Form S-8 covering securities issuable under our equity plans or on Form S-4, may elect to include their shares of common stock in such registration. Following such registered sales, the shares will be freely tradable without restriction under the Securities Act, unless held by our affiliates. See “Certain Relationships and Related Party Transactions—Stockholders Agreement.”
194
Table of Contents
Material United States federal income tax considerations for non-U.S. holders
The following is a summary of material U.S. federal income and estate tax considerations relating to the purchase, ownership and disposition of shares of our common stock issued pursuant to this offering by Non-U.S. Holders (as defined below). This summary does not purport to be a complete analysis of all the potential tax considerations relevant to Non-U.S. Holders of shares of our common stock. This summary is based upon the Internal Revenue Code, the United States Treasury regulations promulgated or proposed thereunder and administrative and judicial interpretations thereof, all as of the date hereof and all of which are subject to change or differing interpretations at any time, possibly with retroactive effect.
This summary assumes that shares of our common stock are held by a Non-U.S. Holder as “capital assets” within the meaning of Section 1221 of the Internal Revenue Code (generally, property held for investment). This summary does not purport to deal with all aspects of U.S. federal income and estate taxation that might be relevant to particular Non-U.S. Holders in light of their particular investment circumstances or status, nor does it address specific tax considerations that may be relevant to particular persons who are subject to special treatment under U.S. federal income tax laws (including, for example, financial institutions, broker-dealers, insurance companies, partnerships or other pass-through entities, certain U.S. expatriates or former long-term residents of the United States, tax-exempt organizations, pension plans, “controlled foreign corporations,” “passive foreign investment companies,” corporations that accumulate earnings to avoid U.S. federal income tax, persons in special situations, such as those who have elected to mark securities to market or those who hold shares of our common stock as part of a straddle, hedge, conversion transaction, synthetic security or other integrated investment, persons that have a “functional currency” other than the U.S. dollar, or holders subject to the alternative minimum tax or the 3.8% tax on net investment income). In addition, except as explicitly addressed herein with respect to estate tax, this summary does not address certain estate and any gift tax considerations or considerations arising under the tax laws of any state, local or non-U.S. jurisdiction.
For purposes of this summary, a “Non-U.S. Holder” means a beneficial owner of shares of our common stock that for U.S. federal income tax purposes, is an individual, corporation, estate or trust other than:
| • | an individual who is a citizen or resident of the United States; |
| • | a corporation, or any other organization taxable as a corporation for U.S. federal income tax purposes, that is created or organized in or under the laws of the United States, any state thereof or the District of Columbia; |
| • | an estate, the income of which is included in gross income for U.S. federal income tax purposes regardless of its source; or |
| • | a trust if (1) a U.S. court is able to exercise primary supervision over the trust’s administration and one or more United States persons (as defined in the Internal Revenue Code) have the authority to control all of the trust’s substantial decisions or (2) the trust has a valid election in effect under applicable United States Treasury regulations to be treated as a United States person. |
A modified definition of Non-U.S. Holder applies for U.S. federal estate tax purposes (as discussed below).
If an entity that is classified as a partnership for U.S. federal income tax purposes holds shares of our common stock, the tax treatment of persons treated as its partners for U.S. federal income tax purposes will generally depend upon the status of the partner and the activities of the partnership. Partnerships and other entities that are classified as partnerships for U.S. federal income tax purposes and persons holding our common stock through a partnership or other entity classified as a partnership for U.S. federal income tax purposes are urged to consult their own tax advisors.
195
Table of Contents
There can be no assurance that the IRS will not challenge one or more of the tax consequences described herein, and we have not obtained, nor do we intend to obtain, a ruling from the IRS or an opinion of counsel with respect to the U.S. federal income or estate tax consequences to a Non-U.S. Holder of the purchase, ownership or disposition of shares of our common stock.
THIS SUMMARY IS FOR GENERAL INFORMATION ONLY AND IS NOT INTENDED TO BE TAX ADVICE. PROSPECTIVE INVESTORS ARE URGED TO CONSULT THEIR OWN TAX ADVISORS CONCERNING THE U.S. FEDERAL INCOME AND ESTATE TAXATION AND OTHER TAX CONSEQUENCES TO THEM OF THE PURCHASE, OWNERSHIP AND DISPOSITION OF SHARES OF OUR COMMON STOCK, AS WELL AS THE APPLICATION OF STATE, LOCAL AND NON-U.S. INCOME AND OTHER TAX LAWS.
Distributions on shares of our common stock
As discussed under “Dividend policy” above, following the completion of the offering, our board of directors does not intend to pay dividends on our common stock. However, we expect to reevaluate our dividend policy on a regular basis following the offering and may, subject to compliance with the covenants contained in our credit facilities and other instruments governing our indebtedness which limit our ability to pay dividends and other considerations, determine to pay dividends in the future. The declaration, amount and payment of any future dividends on shares of our common stock will be at the sole discretion of our board of directors, which may take into account general and economic conditions, our financial condition and results of operations, our available cash and current and anticipated cash needs, capital requirements, contractual, legal, tax and regulatory restrictions, the implications of the payment of dividends by us to our stockholders or by our subsidiaries to us, and any other factors that our board of directors may deem relevant. See “Description of indebtedness” for restrictions on payment of dividends. In February 2015, our board of directors declared a cash dividend of $0.6303 per share (or approximately $494.3 million in the aggregate) to stockholders of record as of February 25, 2015.
In the event that we do make a distribution of cash or property with respect to shares of our common stock (or make a redemption that is treated as a distribution for U.S. federal income tax purposes), any such distributions generally will constitute dividends for U.S. federal income tax purposes to the extent of our current or accumulated earnings and profits as determined under U.S. federal income tax principles, and will be subject to withholding as described in the next paragraph below. If a distribution exceeds both our current and accumulated earnings and profits, the excess will be treated as a tax-free return of the Non-U.S. Holder’s investment, up to such holder’s adjusted tax basis in its shares of our common stock. Any remaining excess will be treated as capital gain, subject to the tax treatment described below in “—Gain on sale, exchange or other taxable disposition of shares of our common stock.” Any distribution described in this paragraph would also be subject to the discussion below under “—Additional withholding and information reporting requirements for shares of our common stock held by or through non-U.S. entities.”
Any dividends paid to a Non-U.S. Holder with respect to shares of our common stock generally will be subject to a 30% U.S. federal withholding tax unless such Non-U.S. Holder provides us or our agent, as the case may be, with an appropriate IRS Form W-8, such as:
| • | IRS Form W-8BEN (or successor form) or IRS Form W-8BEN-E (or successor form) certifying, under penalties of perjury, that such Non-U.S. Holder is entitled to a reduction in withholding under an applicable income tax treaty; or |
| • | IRS Form W-8ECI (or successor form) certifying, under penalties of perjury, that a dividend paid on shares of our common stock is not subject to withholding tax because it is effectively connected with the conduct by such Non-U.S. Holder of a trade or business in the United States (in which case such dividend generally will be subject to U.S. federal income tax rates on a net income basis as described below). |
196
Table of Contents
The certifications described above must be provided to us or our agent prior to the payment of dividends and must be updated periodically. The certification also may require a Non-U.S. Holder that provides an IRS form or that claims treaty benefits to provide its U.S. taxpayer identification number. Special certification and other requirements apply in the case of certain Non-U.S. Holders that are intermediaries or pass-through entities for U.S. federal income tax purposes.
Each Non-U.S. Holder is urged to consult its own tax advisor about the specific methods for satisfying these requirements. A claim for exemption will not be valid if the person receiving the applicable form has actual knowledge or reason to know that the statements on the form are false.
If dividends are effectively connected with the conduct by the Non-U.S. Holder of a trade or business in the United States (and, if required by an applicable income tax treaty, are attributable to a permanent establishment or fixed base maintained by such Non-U.S. Holder in the United States), the Non-U.S. Holder, although exempt from the withholding tax described above (provided that the certifications described above are satisfied), will generally be subject to U.S. federal income tax on such dividends on a net income basis in the same manner as if it were a resident of the United States, unless otherwise provided in an applicable income tax treaty. In addition, if such Non-U.S. Holder is treated as a corporation for U.S. federal income tax purposes, such Non-U.S. Holder may be subject to a “branch profits tax” on its effectively connected earnings and profits at a rate of 30%, unless an applicable income tax treaty provides otherwise.
Non-U.S. Holders that do not timely provide us or our agent with the required certifications, but which are eligible for a reduced rate of U.S. federal withholding tax pursuant to an applicable income tax treaty may obtain a refund or credit of any excess amount withheld by timely filing an appropriate claim for refund with the IRS.
Gain on sale, exchange or other taxable disposition of shares of our common stock
Subject to the discussion below under “—Additional withholding and information reporting requirements for shares of our common stock held by or through non-U.S. entities” and “—Backup withholding and information reporting,” in general, a Non-U.S. Holder will not be subject to U.S. federal income tax or withholding tax on any gain realized upon such holder’s sale, exchange or other disposition of shares of our common stock (including a redemption, but only if the redemption would be treated as a sale or exchange rather than a distribution for U.S. federal income tax purposes) unless (i) such Non-U.S. Holder is an individual who is present in the United States for 183 days or more in the taxable year of disposition, and certain other conditions are met, (ii) we are, or have been, at any time during the five-year period preceding such disposition (or the Non-U.S. Holder’s holding period, if shorter) a “U.S. real property holding corporation,” unless our common stock is regularly traded on an established securities market and the Non-U.S. Holder holds no more than 5% of our outstanding common stock, directly or indirectly, during the shorter of the 5-year period ending on the date of the disposition or the period that the Non-U.S. Holder held our common stock, or (iii) such gain is effectively connected with the conduct by such Non-U.S. Holder of a trade or business in the United States (and, if required by an applicable income tax treaty, is attributable to a permanent establishment or fixed base maintained by such Non-U.S. Holder in the United States).
If the first exception applies, the Non-U.S. Holder generally will be subject to U.S. federal income tax at a rate of 30% (unless an applicable income tax treaty provides otherwise) on the amount by which such Non-U.S. Holder’s capital gains allocable to U.S. sources exceed capital losses allocable to U.S. sources during the taxable year of the disposition.
With respect to the second exception above, if we are determined to be a U.S. real property holding corporation and the foregoing exception does not apply, then a purchaser may withhold 10% of the proceeds payable to a
197
Table of Contents
Non-U.S. Holder from a sale of our common stock and the Non-U.S. Holder generally will be subject to U.S. federal income tax on a net income basis with respect to such gain in the same manner as if such holder were a resident of the United States, unless otherwise provided in an applicable income tax treaty. Generally, a corporation is a U.S. real property holding corporation if the fair market value of its U.S. real property interests equals or exceeds 50% of the sum of the fair market values of its worldwide real property interests plus its other assets used or held for use in a trade or business. Although there can be no assurance, we do not believe that we are, or have been, a U.S. real property holding corporation, or that we are likely to become one in the future. No assurance can be provided that our common stock will be regularly traded on an established securities market for purposes of the rules described above.
If the third exception applies, the Non-U.S. Holder generally will be subject to U.S. federal income tax on a net income basis with respect to such gain in the same manner as if such holder were a resident of the United States, unless otherwise provided in an applicable income tax treaty, and a Non-U.S. Holder that is treated as a corporation for U.S. federal income tax purposes may also be subject to a “branch profits tax” on its effectively connected earnings and profits at a rate of 30%, unless an applicable income tax treaty provides otherwise.
Additional withholding and information reporting requirements for shares of our common stock held by or through non-U.S. entities
Sections 1471 to 1474 of the Internal Revenue Code (referred to as the “Foreign Account Tax Compliance Act” or “FATCA”) impose a U.S. federal withholding tax at a rate of 30% on payments of dividends on, and gross proceeds from the sale or other disposition of, our common stock paid to certain foreign entities, unless (i) if the foreign entity is a “foreign financial institution,” such foreign entity undertakes certain due diligence, reporting, withholding, and certification obligations, (ii) if the foreign entity is not a “foreign financial institution,” such foreign entity identifies certain of its U.S. investors or provides certification that it does not have any such investors, or (iii) the foreign entity is otherwise exempt under FATCA. Under applicable United States Treasury regulations, withholding under FATCA will generally apply to payments of (1) dividends on our common stock and (2) gross proceeds from a sale or other disposition of our common stock made after December 31, 2016. Non-U.S. rules that implement intergovernmental agreements between the United States and other countries in which a Non-U.S. Holder or intermediary is located may modify the FATCA rules described above. Non-U.S. holders should consult their own tax advisors regarding the possible implications of FATCA (or non-U.S. rules that implement intergovernmental agreements) on Non-U.S. Holders’ investment in our common stock and the entities (including financial intermediaries) through which they hold our common stock, including, without limitation, the process and deadlines for meeting the applicable requirements to prevent the imposition of the 30% withholding tax under FATCA.
Backup withholding and information reporting
We must report annually to the IRS and to each Non-U.S. Holder the gross amount of the distributions on shares of our common stock paid to such holder and the tax withheld, if any, with respect to such distributions. These information reporting requirements apply even if withholding was not required. In addition to the requirements described above under “—Additional withholding and information reporting requirements for shares of our common stock held by or through non-U.S. entities,” a Non-U.S. Holder may have to comply with specific certification procedures to establish that the holder is not a United States person (as defined in the Internal Revenue Code) or otherwise establish an exemption in order to avoid backup withholding at the applicable rate with respect to dividends on our common stock. Dividends paid to Non-U.S. Holders subject to the U.S. federal withholding tax, as described above in “—Distributions on Shares of our Common Stock,” generally will be exempt from U.S. backup withholding.
198
Table of Contents
Information reporting and backup withholding will generally apply to the payment of the proceeds of a disposition of shares of our common stock by a Non-U.S. Holder effected by or through the U.S. office of any broker, U.S. or non-U.S., unless the holder certifies that it is not a United States person (as defined in the Internal Revenue Code) and satisfies certain other requirements, or otherwise establishes an exemption. For information reporting purposes, dispositions effected through a non-U.S. office of a broker with certain specified connections to the United States generally will be treated in a manner similar to dispositions effected through a U.S. office of a broker, and dispositions otherwise effected through a non-U.S. office generally will not be subject to information reporting. Generally, backup withholding will not apply to a payment of disposition proceeds to a Non-U.S. Holder where the transaction is effected through a non-U.S. office of a U.S. broker or non-U.S. office of a non-U.S broker. Prospective investors are urged to consult their own tax advisors regarding the application of the information reporting and backup withholding rules to them.
Copies of information returns may be made available to the tax authorities of the country in which the Non-U.S. Holder resides or is incorporated, under the provisions of a specific treaty or agreement.
Backup withholding is not an additional tax. Any amounts withheld under the backup withholding rules from a payment made to a Non-U.S. Holder can be refunded or credited against such Non-U.S. Holder’s U.S. federal income tax liability, if any, provided that an appropriate claim is timely filed with the IRS.
Federal estate tax
Shares of our common stock held (or treated as held) by an individual who is not a U.S. citizen or resident (as defined for U.S. federal estate tax purposes) at the time of such individual’s death will be included in such individual’s gross estate for U.S. federal estate tax purposes, unless an applicable estate tax treaty provides otherwise.
199
Table of Contents
Underwriting (conflicts of interest)
We and the selling stockholders are offering the shares of common stock described in this prospectus through a number of underwriters. J.P. Morgan Securities LLC and Goldman, Sachs & Co. are acting as joint book-running managers of the offering and as representatives of the underwriters. We and the selling stockholders have entered into an underwriting agreement with the underwriters dated the date of this prospectus. Subject to the terms and conditions of the underwriting agreement, we and the selling stockholders have agreed to sell to the underwriters, and each underwriter has severally agreed to purchase, at the public offering price less the underwriting discounts and commissions set forth on the cover page of this prospectus, the number of shares of common stock listed next to its name in the following table:
| Underwriter | Number of shares | |
| J.P. Morgan Securities LLC |
||
| Goldman, Sachs & Co. |
||
| Citigroup Global Markets Inc. |
||
| Morgan Stanley & Co. |
||
| Deutsche Bank Securities Inc. |
||
| Evercore Group L.L.C. |
||
| Merrill Lynch, Pierce, Fenner & Smith Incorporated |
||
| RBC Capital Markets, LLC |
||
| TPG Capital BD, LLC |
||
| BMO Capital Markets Corp. |
||
| Mizuho Securities USA Inc. |
||
|
| ||
| Total |
||
|
| ||
The underwriters are committed to purchase all the shares of common stock offered by us and the selling stockholders if they purchase any shares. The underwriting agreement also provides that if an underwriter defaults, the purchase commitments of non-defaulting underwriters may also be increased or the offering may be terminated.
The underwriters propose to offer the shares of common stock directly to the public at the initial public offering price set forth on the cover page of this prospectus and to certain dealers at that price less a concession not in excess of $ per share. Any such dealers may resell shares to certain other brokers or dealers at a discount of up to $ per share from the initial public offering price. After the initial public offering of the shares, the offering price and other selling terms may be changed by the underwriters. Sales of shares made outside of the U.S. may be made by affiliates of the underwriters. The offering of the shares by the underwriters is subject to receipt and acceptance and subject to the underwriters’ right to reject any order in whole or in part.
The underwriters have an option to buy up to additional shares of common stock from us and the selling stockholders. The underwriters have 30 days from the date of this prospectus to exercise this option to purchase additional shares of common stock. If any shares are purchased with this option to purchase additional shares of common stock, the underwriters will purchase such shares in approximately the same proportion as shown in the table above. If any additional shares of common stock are purchased, the underwriters will offer the additional shares on the same terms as those on which the shares are being offered.
200
Table of Contents
The underwriting fee is equal to the public offering price per share of common stock less the amount paid by the underwriters to us per share of common stock. The underwriting fee is $ per share. The following table shows the per share and total underwriting discounts and commissions to be paid to the underwriters by us assuming both no exercise and full exercise of the underwriters’ option to purchase additional shares.
| Paid by us | ||||||||
| Without exercise of option to purchase additional shares |
With full exercise of option to purchase additional shares |
|||||||
| Per Share |
$ | $ | ||||||
| Total |
$ | $ | ||||||
|
|
||||||||
We estimate that the total expenses of this offering, including registration, filing and listing fees, printing fees, legal and accounting expenses and transfer agent and registrar expenses, but excluding the underwriting discounts and commissions, will be approximately $ .
A prospectus in electronic format may be made available on the web sites maintained by one or more underwriters, or selling group members, if any, participating in the offering. The underwriters may agree to allocate a number of shares to underwriters and selling group members for sale to their online brokerage account holders. Internet distributions will be allocated by the representatives of the underwriters and selling group members that may make Internet distributions on the same basis as other allocations.
We have agreed that we will not (1) offer, pledge, sell, contract to sell, sell any option or contract to purchase, purchase any option or contract to sell, grant any option, right or warrant to purchase, or otherwise transfer or dispose of, directly or indirectly or file with the SEC a registration Statement under the Securities Act relating to any shares of our common stock or any securities convertible into or exercisable or exchangeable for our common stock, or publicly disclose the intention to make any offer, sale, pledge, disposition or filing, or (2) enter into any swap or other agreement that transfers, in whole or in part, any of the economic consequences of ownership of our common stock or any such other securities, whether any such transaction described in clause (1) or (2) above is to be settled by delivery of common stock or such other securities, in cash or otherwise, without the prior written consent of the representatives of the underwriters for a period of 180 days after the date of this prospectus, other than the shares of our common stock to be sold hereunder and any shares of our common stock issued upon the exercise of options granted under our existing management incentive plans. Notwithstanding the foregoing, if (1) during the last 17 days of the 180-day restricted period, we issue an earnings release or material news or a material event relating to us occurs; or (2) prior to the expiration of the 180-day restricted period, we announce that we will release earnings results during the 16-day period beginning on the last day of the 180-day period, the restrictions described above shall continue to apply until the expiration of the 18-day period beginning on the issuance of the earnings release or the occurrence of the material news or material event.
Our directors and executive officers and the selling stockholders have entered into lock-up agreements with the underwriters prior to the commencement of this offering pursuant to which each of these persons or entities, with limited exceptions, for a period of 180 days after the date of this prospectus, may not, without the prior written consent of certain of the underwriters, (1) offer, pledge, sell, contract to sell, sell any option or contract to purchase, purchase any option or contract to sell, grant any option, right or warrant to purchase, or otherwise transfer or dispose of, directly or indirectly, or file with the SEC a registration statement under the Securities Act relating to, any shares of our common stock or any securities convertible into or exercisable or exchangeable for our common stock (including without limitation, common stock or such other securities which may be deemed to be beneficially owned by such directors, officers and selling stockholders in accordance with
201
Table of Contents
the rules and regulations of the SEC and securities which may be issued upon exercise of a stock option or warrant), or publicly disclose the intention to make any offer, sale, pledge, disposition or filing, (2) enter into any swap or other agreement that transfers, in whole or in part, any of the economic consequences of ownership of our common stock or such other securities, whether any such transaction described in clause (1) or (2) above is to be settled by delivery of common stock or such other securities, in cash or otherwise, or (3) make any demand for or exercise any right with respect to the registration of any shares of our common stock or any security convertible into or exercisable or exchangeable for our common stock. Notwithstanding the foregoing, if (1) during the last 17 days of the 180-day restricted period, we issue an earnings release or material news or a material event relating to us occurs; or (2) prior to the expiration of the 180-day restricted period, we announce that we will release earnings results during the 16-day period beginning on the last day of the 180-day period, the restrictions described above shall continue to apply until the expiration of the 18-day period beginning on the issuance of the earnings release or the occurrence of the material news or material event.
We and the selling stockholders have agreed to indemnify the several underwriters against certain liabilities, including liabilities under the Securities Act.
We intend to apply to have our common stock listed on the NYSE under the symbol “PRX”.
In connection with this offering, the underwriters may engage in stabilizing transactions, which involves making bids for, purchasing and selling shares of common stock in the open market for the purpose of preventing or retarding a decline in the market price of the common stock while this offering is in progress. These stabilizing transactions may include making short sales of the common stock, which involves the sale by the underwriters of a greater number of shares of common stock than they are required to purchase in this offering, and purchasing shares of common stock on the open market to cover positions created by short sales. Short sales may be “covered” shorts, which are short positions in an amount not greater than the underwriters’ option to purchase additional shares of our common stock referred to above, or may be “naked” shorts, which are short positions in excess of that amount. The underwriters may close out any covered short position either by exercising their option to purchase additional shares of our common stock, in whole or in part, or by purchasing shares in the open market. In making this determination, the underwriters will consider, among other things, the price of shares available for purchase in the open market compared to the price at which the underwriters may purchase shares through their option to purchase additional shares of our common stock. A naked short position is more likely to be created if the underwriters are concerned that there may be downward pressure on the price of the common stock in the open market that could adversely affect investors who purchase in this offering. To the extent that the underwriters create a naked short position, they will purchase shares in the open market to cover the position.
The underwriters have advised us that, pursuant to Regulation M of the Securities Act, they may also engage in other activities that stabilize, maintain or otherwise affect the price of the common stock, including the imposition of penalty bids. This means that if the representatives of the underwriters purchase common stock in the open market in stabilizing transactions or to cover short sales, the representatives of the underwriters can require the underwriters that sold those shares as part of this offering to repay the underwriting discount received by them.
These activities may have the effect of raising or maintaining the market price of the common stock or preventing or retarding a decline in the market price of the common stock, and, as a result, the price of the common stock may be higher than the price that otherwise might exist in the open market. If the underwriters commence these activities, they may discontinue them at any time. The underwriters may carry out these transactions on the NYSE, in the over-the-counter market or otherwise.
202
Table of Contents
Prior to this offering, there has been no public market for our common stock. The initial public offering price will be determined by negotiations between us and the representatives of the underwriters. In determining the initial public offering price, we and the representatives of the underwriters expect to consider a number of factors including:
| • | the information set forth in this prospectus and otherwise available to the representatives of the underwriters; |
| • | our prospects and the history and prospects for the industry in which we compete; |
| • | an assessment of our management; |
| • | our prospects for future earnings; |
| • | the general condition of the securities markets at the time of this offering; |
| • | the recent market prices of, and demand for, publicly traded common stock of generally comparable companies; and |
| • | other factors deemed relevant by the underwriters and us. |
Neither we nor the underwriters can assure investors that an active trading market will develop for our common shares, or that the shares will trade in the public market at or above the initial public offering price.
Selling restrictions
General
Other than in the United States, no action has been taken by us or the underwriters that would permit a public offering of the securities offered by this prospectus in any jurisdiction where action for that purpose is required. The securities offered by this prospectus may not be offered or sold, directly or indirectly, nor may this prospectus or any other offering material or advertisements in connection with the offer and sale of any such securities be distributed or published in any jurisdiction, except under circumstances that will result in compliance with the applicable rules and regulations of that jurisdiction. Persons into whose possession this prospectus comes are advised to inform themselves about and to observe any restrictions relating to the offering and the distribution of this prospectus. This prospectus does not constitute an offer to sell or a solicitation of an offer to buy any securities offered by this prospectus in any jurisdiction in which such an offer or a solicitation is unlawful.
Notice to prospective investors in the European Economic Area
In relation to each Member State of the European Economic Area (each, a “Relevant Member State”), no offer of shares of common stock may be made to the public in that Relevant Member State other than:
| A. | to any legal entity which is a qualified investor as defined in the Prospectus Directive; |
| B. | to fewer than 100 or, if the Relevant Member State has implemented the relevant provision of the 2010 PD Amending Directive, 150, natural or legal persons (other than qualified investors as defined in the Prospectus Directive), as permitted under the Prospectus Directive, subject to obtaining the prior consent of the representatives; or |
| C. | in any other circumstances falling within Article 3(2) of the Prospectus Directive, |
provided that no such offer of shares of common stock shall require the Company or the representatives to publish a prospectus pursuant to Article 3 of the Prospectus Directive or supplement a prospectus pursuant to Article 16 of the Prospectus Directive.
203
Table of Contents
Each person in a Relevant Member State who initially acquires any shares of common stock or to whom any offer is made will be deemed to have represented, acknowledged and agreed that it is a “qualified investor” within the meaning of the law in that Relevant Member State implementing Article 2(1)(e) of the Prospectus Directive. In the case of any shares of common stock being offered to a financial intermediary as that term is used in Article 3(2) of the Prospectus Directive, each such financial intermediary will be deemed to have represented, acknowledged and agreed that the shares of common stock acquired by it in the offer have not been acquired on a non-discretionary basis on behalf of, nor have they been acquired with a view to their offer or resale to, persons in circumstances which may give rise to an offer of any shares of common stock to the public other than their offer or resale in a Relevant Member State to qualified investors as so defined or in circumstances in which the prior consent of the representatives has been obtained to each such proposed offer or resale.
The Company, the representatives and their affiliates will rely upon the truth and accuracy of the foregoing representations, acknowledgements and agreements.
This prospectus has been prepared on the basis that any offer of shares of common stock in any Relevant Member State will be made pursuant to an exemption under the Prospectus Directive from the requirement to publish a prospectus for offers of shares of common stock. Accordingly any person making or intending to make an offer in that Relevant Member State of shares of common stock which are the subject of the offering contemplated in this prospectus may only do so in circumstances in which no obligation arises for the Company or any of the underwriters to publish a prospectus pursuant to Article 3 of the Prospectus Directive in relation to such offer. Neither the Company nor the underwriters have authorized, nor do they authorize, the making of any offer of shares of common stock in circumstances in which an obligation arises for the Company or the underwriters to publish a prospectus for such offer.
For the purpose of the above provisions, the expression “an offer to the public” in relation to any shares of common stock in any Relevant Member State means the communication in any form and by any means of sufficient information on the terms of the offer and the shares of common stock to be offered so as to enable an investor to decide to purchase or subscribe the shares of common stock, as the same may be varied in the Relevant Member State by any measure implementing the Prospectus Directive in the Relevant Member State and the expression “Prospectus Directive” means Directive 2003/71/EC (including the 2010 PD Amending Directive, to the extent implemented in the Relevant Member States) and includes any relevant implementing measure in the Relevant Member State and the expression “2010 PD Amending Directive” means Directive 2010/73/EU.
Notice to prospective investors in the United Kingdom
In addition, in the United Kingdom, this document is being distributed only to, and is directed only at, and any offer subsequently made may only be directed at persons who are “qualified investors” (as defined in the Prospectus Directive) (i) who have professional experience in matters relating to investments falling within Article 19 (5) of the Financial Services and Markets Act 2000 (Financial Promotion) Order 2005, as amended (the “Order”) and/or (ii) who are high net worth companies (or persons to whom it may otherwise be lawfully communicated) falling within Article 49(2)(a) to (d) of the Order (all such persons together being referred to as “relevant persons”).
Any person in the United Kingdom that is not a relevant person should not act or rely on the information included in this document or use it as basis for taking any action. In the United Kingdom, any investment or investment activity that this document relates to may be made or taken exclusively by relevant persons. Any person in the United Kingdom that is not a relevant person should not act or rely on this document or any of its contents.
204
Table of Contents
Notice to prospective investors in Switzerland
The shares of common stock may not be publicly offered in Switzerland and will not be listed on the SIX Swiss Exchange (“SIX”) or on any other stock exchange or regulated trading facility in Switzerland. This document does not constitute a prospectus within the meaning of, and has been prepared without regard to the disclosure standards for issuance prospectuses under art. 652a or art. 1156 of the Swiss Code of Obligations or the disclosure standards for listing prospectuses under art. 27 ff. of the SIX Listing Rules or the listing rules of any other stock exchange or regulated trading facility in Switzerland. Neither this document nor any other offering or marketing material relating to the shares of common stock or the offering may be publicly distributed or otherwise made publicly available in Switzerland.
Neither this document nor any other offering or marketing material relating to the offering, the Company, the shares of common stock have been or will be filed with or approved by any Swiss regulatory authority. In particular, this document will not be filed with, and the offer of shares of common stock will not be supervised by, the Swiss Financial Market Supervisory Authority FINMA (FINMA), and the offer of shares of common stock has not been and will not be authorized under the Swiss Federal Act on Collective Investment Schemes (“CISA”). The investor protection afforded to acquirers of interests in collective investment schemes under the CISA does not extend to acquirers of shares of common stock.
Notice to prospective investors in the Dubai International Financial Centre (“DIFC”)
This document relates to an Exempt Offer in accordance with the Markets Rules 2012 of the Dubai Financial Services Authority (“DFSA”). This document is intended for distribution only to persons of a type specified in the Markets Rules 2012 of the DFSA. It must not be delivered to, or relied on by, any other person. The DFSA has no responsibility for reviewing or verifying any documents in connection with Exempt Offers. The DFSA has not approved this prospectus supplement nor taken steps to verify the information set forth herein and has no responsibility for this document. The securities to which this document relates may be illiquid and/or subject to restrictions on their resale. Prospective purchasers of the securities offered should conduct their own due diligence on the securities. If you do not understand the contents of this document you should consult an authorized financial advisor.
In relation to its use in the DIFC, this document is strictly private and confidential and is being distributed to a limited number of investors and must not be provided to any person other than the original recipient, and may not be reproduced or used for any other purpose. The interests in the securities may not be offered or sold directly or indirectly to the public in the DIFC.
Notice to prospective investors in the United Arab Emirates
Shares of our common stock have not been, and are not being, publicly offered, sold, promoted or advertised in the United Arab Emirates (including the Dubai International Financial Centre) other than in compliance with the laws of the United Arab Emirates (and the Dubai International Financial Centre) governing the issue, offering and sale of securities. Further, this prospectus does not constitute a public offer of securities in the United Arab Emirates (including the Dubai International Financial Centre) and is not intended to be a public offer. This prospectus has not been approved by or filed with the Central Bank of the United Arab Emirates, the Securities and Commodities Authority or the Dubai Financial Services Authority.
205
Table of Contents
Notice to prospective investors in Australia
This prospectus:
| • | does not constitute a disclosure document under Chapter 6D.2 of the Corporations Act 2001 (Cth) (the “Corporations Act”); |
| • | has not been, and will not be, lodged with the Australian Securities and Investments Commission (“ASIC”), as a disclosure document for the purposes of the Corporations Act and does not purport to include the information required of a disclosure document under Chapter 6D.2 of the Corporations Act; and |
| • | may only be provided in Australia to select investors who are able to demonstrate that they fall within one or more of the categories of investors, or Exempt Investors, available under section 708 of the Corporations Act. |
The shares of common stock may not be directly or indirectly offered for subscription or purchased or sold, and no invitations to subscribe for or buy the shares of common stock may be issued, and no draft or definitive offering memorandum, advertisement or other offering material relating to any shares of common stock may be distributed in Australia, except where disclosure to investors is not required under Chapter 6D of the Corporations Act or is otherwise in compliance with all applicable Australian laws and regulations. By submitting an application for the shares of common stock, you represent and warrant to us that you are an Exempt Investor.
As any offer of shares of common stock under this document will be made without disclosure in Australia under Chapter 6D.2 of the Corporations Act, the offer of those securities for resale in Australia within 12 months may, under section 707 of the Corporations Act, require disclosure to investors under Chapter 6D.2 if none of the exemptions in section 708 applies to that resale. By applying for the shares of common stock you undertake to us that you will not, for a period of 12 months from the date of issue of the shares of common stock, offer, transfer, assign or otherwise alienate those securities to investors in Australia except in circumstances where disclosure to investors is not required under Chapter 6D.2 of the Corporations Act or where a compliant disclosure document is prepared and lodged with ASIC.
Notice to prospective investors in Japan
The shares of common stock have not been and will not be registered under the Financial Instruments and Exchange Act. Accordingly, the shares of common stock may not be offered or sold, directly or indirectly, in Japan or to, or for the benefit of, any resident of Japan (which term as used herein means any person resident in Japan, including any corporation or other entity organized under the laws of Japan), or to others for re-offering or resale, directly or indirectly, in Japan or to or for the benefit of a resident of Japan, except pursuant to an exemption from the registration requirements of, and otherwise in compliance with, the Financial Instruments and Exchange Act and any other applicable laws, regulations and ministerial guidelines of Japan.
Notice to prospective investors in Hong Kong
The shares of common stock have not been offered or sold and will not be offered or sold in Hong Kong, by means of any document, other than (a) to “professional investors” as defined in the Securities and Futures Ordinance (Cap. 571) of Hong Kong and any rules made under that Ordinance; or (b) in other circumstances which do not result in the document being a “prospectus” as defined in the Companies Ordinance (Cap. 32) of Hong Kong or which do not constitute an offer to the public within the meaning of that Ordinance. No advertisement, invitation or document relating to the shares of common stock has been or may be issued or has been or may be in the possession of any person for the purposes of issue, whether in Hong Kong or elsewhere, which is directed at, or the contents of which are likely to be accessed or read by, the public of Hong Kong
206
Table of Contents
(except if permitted to do so under the securities laws of Hong Kong) other than with respect to shares of common stock which are or are intended to be disposed of only to persons outside Hong Kong or only to “professional investors” as defined in the Securities and Futures Ordinance and any rules made under that Ordinance.
Notice to prospective investors in Singapore
This prospectus has not been registered as a prospectus with the Monetary Authority of Singapore. Accordingly, this prospectus and any other document or material in connection with the offer or sale, or invitation for subscription or purchase, of shares of common stock may not be circulated or distributed, nor may the shares of common stock be offered or sold, or be made the subject of an invitation for subscription or purchase, whether directly or indirectly, to persons in Singapore other than (i) to an institutional investor under Section 274 of the Securities and Futures Act, Chapter 289 of Singapore (the “SFA”), (ii) to a relevant person pursuant to Section 275(1), or any person pursuant to Section 275(1A), and in accordance with the conditions specified in Section 275, of the SFA, or (iii) otherwise pursuant to, and in accordance with the conditions of, any other applicable provision of the SFA.
Where the shares of common stock are subscribed or purchased under Section 275 of the SFA by a relevant person which is:
| (a) | a corporation (which is not an accredited investor (as defined in Section 4A of the SFA)) the sole business of which is to hold investments and the entire share capital of which is owned by one or more individuals, each of whom is an accredited investor; or |
| (b) | a trust (where the trustee is not an accredited investor) whose sole purpose is to hold investments and each beneficiary of the trust is an individual who is an accredited investor, |
securities (as defined in Section 239(1) of the SFA) of that corporation or the beneficiaries’ rights and interest (howsoever described) in that trust shall not be transferred within six months after that corporation or that trust has acquired the shares of common stock pursuant to an offer made under Section 275 of the SFA except:
| (a) | to an institutional investor or to a relevant person defined in Section 275(2) of the SFA, or to any person arising from an offer referred to in Section 275(1A) or Section 276(4)(i)(B) of the SFA; |
| (b) | where no consideration is or will be given for the transfer; |
| (c) | where the transfer is by operation of law; |
| (d) | as specified in Section 276(7) of the SFA; or |
| (e) | as specified in Regulation 32 of the Securities and Futures (Offers of Investments) (Shares and Debentures) Regulations 2005 of Singapore |
Notice to prospective investors in Bermuda
Shares of common stock may be offered or sold in Bermuda only in compliance with the provisions of the Investment Business Act of 2003 of Bermuda which regulates the sale of securities in Bermuda. Additionally, non-Bermudian persons (including companies) may not carry on or engage in any trade or business in Bermuda unless such persons are permitted to do so under applicable Bermuda legislation.
207
Table of Contents
Notice to prospective investors in Saudi Arabia
This document may not be distributed in the Kingdom of Saudi Arabia except to such persons as are permitted under the Offers of Securities Regulations as issued by the board of the Saudi Arabian Capital Market Authority (“CMA”) pursuant to resolution number 2-11-2004 dated 4 October 2004 as amended by resolution number 1-28-2008, as amended (the “CMA Regulations”). The CMA does not make any representation as to the accuracy or completeness of this document and expressly disclaims any liability whatsoever for any loss arising from, or incurred in reliance upon, any part of this document. Prospective purchasers of the securities offered hereby should conduct their own due diligence on the accuracy of the information relating to the securities. If you do not understand the contents of this document, you should consult an authorised financial adviser.
Notice to prospective investors in the British Virgin Islands
1. The following is a suggested selling restriction where the offer will not be made to anyone in the British Virgin Islands.
The shares of common stock are not being, and may not be offered to the public or to any person in the British Virgin Islands for purchase or subscription by or on behalf of the Issuer. The shares of common stock may be offered to companies incorporated under the BVI Business Companies Act, 2004 (British Virgin Islands),“BVI Companies”), but only where the offer will be made to, and received by, the relevant BVI Company entirely outside of the British Virgin Islands.
The additional rider set out below can be inserted, if desired.
This prospectus has not been, and will not be, registered with the Financial Services Commission of the British Virgin Islands. No registered prospectus has been or will be prepared in respect of the shares of common stock for the purposes of the Securities and Investment Business Act, 2010 (“SIBA”) or the Public Issuers Code of the British Virgin Islands.
2. The following paragraph can be added where the offer will be made in the British Virgin Islands to qualified investors so as to fall within the “qualified investor” exemption.
The shares of common stock may be offered to persons located in the British Virgin Islands who are “qualified investors” for the purposes of SIBA. Qualified investors include (i) certain entities which are regulated by the Financial Services Commission in the British Virgin Islands, including banks, insurance companies, licensees under SIBA and public, professional and private mutual funds; (ii) a company, any securities of which are listed on a recognised exchange; and (iii) persons defined as “professional investors” under SIBA, which is any person (a) whose ordinary business involves, whether for that person’s own account or the account of others, the acquisition or disposal of property of the same kind as the property, or a substantial part of the property of the Issuer; or (b) who has signed a declaration that he, whether individually or jointly with his spouse, has net worth in excess of US$1,000,000 and that he consents to being treated as a professional investor.
Notice to prospective investors in China
This prospectus does not constitute a public offer the shares of common stock, whether by sale or subscription, in the People’s Republic of China (the “PRC”). The shares of common stock are not being offered or sold directly or indirectly in the PRC to or for the benefit of, legal or natural persons of the PRC.
Further, no legal or natural persons of the PRC may directly or indirectly purchase any of the shares of common stock or any beneficial interest therein without obtaining all prior PRC’s governmental approvals that are required, whether statutorily or otherwise. Persons who come into possession of this document are required by the issuer and its representatives to observe these restrictions.
208
Table of Contents
Notice to prospective investors in Korea
The shares of common stock have not been and will not be registered under the Financial Investments Services and Capital Markets Act of Korea and the decrees and regulations thereunder (the “FSCMA”), and the shares of common stock have been and will be offered in Korea as a private placement under the FSCMA. None of the shares of common stock may be offered, sold or delivered directly or indirectly, or offered or sold to any person for re-offering or resale, directly or indirectly, in Korea or to any resident of Korea except pursuant to the applicable laws and regulations of Korea, including the FSCMA and the Foreign Exchange Transaction Law of Korea and the decrees and regulations thereunder (the “FETL”). The shares of common stock have not been listed on any of securities exchanges in the world including, without limitation, the Korea Exchange in Korea. Furthermore, the purchaser of the shares of common stock shall comply with all applicable regulatory requirements (including but not limited to requirements under the FETL) in connection with the purchase of the shares of common stock. By the purchase of the shares of common stock, the relevant holder thereof will be deemed to represent and warrant that if it is in Korea or is a resident of Korea, it purchased the shares of common stock pursuant to the applicable laws and regulations of Korea.
Notice to prospective investors in Malaysia
No prospectus or other offering material or document in connection with the offer and sale of the shares of common stock has been or will be registered with the Securities Commission of Malaysia (“Commission”) for the Commission’s approval pursuant to the Capital Markets and Services Act 2007. Accordingly, this prospectus and any other document or material in connection with the offer or sale, or invitation for subscription or purchase, of the shares of common stock may not be circulated or distributed, nor may the shares of common stock be offered or sold, or be made the subject of an invitation for subscription or purchase, whether directly or indirectly, to persons in Malaysia other than (i) a closed end fund approved by the Commission; (ii) a holder of a Capital Markets Services Licence; (iii) a person who acquires the shares of common stock, as principal, if the offer is on terms that the shares of common stock may only be acquired at a consideration of not less than RM250,000 (or its equivalent in foreign currencies) for each transaction; (iv) an individual whose total net personal assets or total net joint assets with his or her spouse exceeds RM3 million (or its equivalent in foreign currencies), excluding the value of the primary residence of the individual; (v) an individual who has a gross annual income exceeding RM300,000 (or its equivalent in foreign currencies) per annum in the preceding twelve months; (vi) an individual who, jointly with his or her spouse, has a gross annual income of RM400,000 (or its equivalent in foreign currencies), per annum in the preceding twelve months; (vii) a corporation with total net assets exceeding RM10 million (or its equivalent in a foreign currencies) based on the last audited accounts; (viii) a partnership with total net assets exceeding RM10 million (or its equivalent in foreign currencies); (ix) a bank licensee or insurance licensee as defined in the Labuan Financial Services and Securities Act 2010; (x) an Islamic bank licensee or takaful licensee as defined in the Labuan Financial Services and Securities Act 2010; and (xi) any other person as may be specified by the Commission; provided that, in the each of the preceding categories (i) to (xi), the distribution of the shares of common stock is made by a holder of a Capital Markets Services Licence who carries on the business of dealing in securities. The distribution in Malaysia of this prospectus is subject to Malaysian laws. This prospectus does not constitute and may not be used for the purpose of public offering or an issue, offer for subscription or purchase, invitation to subscribe for or purchase any securities requiring the registration of a prospectus with the Commission under the Capital Markets and Services Act 2007.
Notice to prospective investors in Taiwan
The shares of common stock have not been and will not be registered with the Financial Supervisory Commission of Taiwan pursuant to relevant securities laws and regulations and may not be sold, issued or
209
Table of Contents
offered within Taiwan through a public offering or in circumstances which constitutes an offer within the meaning of the Securities and Exchange Act of Taiwan that requires a registration or approval of the Financial Supervisory Commission of Taiwan. No person or entity in Taiwan has been authorised to offer, sell, give advice regarding or otherwise intermediate the offering and sale of the shares of common stock in Taiwan.
Notice to prospective investors in South Africa
Due to restrictions under the securities laws of South Africa, the shares of common stock are not offered, and the Offer shall not be transferred, sold, renounced or delivered, in South Africa or to a person with an address in South Africa, unless one or other of the following exemptions applies:
| (i) | the offer, transfer, sale, renunciation or delivery is to duly registered banks, mutual banks, financial services provider, financial institution, the Public Investment Corporation (in each case registered as such in South Africa), a person who deals with securities in their ordinary course of business, or a wholly owned subsidiary of a bank, mutual bank, authorised services provider or financial institution, acting as agent in the capacity of an authorised portfolio manager for a pension fund (duly registered in South Africa), or as manager for a collective investment scheme (registered in South Africa); or |
| (ii) | the contemplated acquisition cost of the securities, for any single addressee acting as principal is equal to or greater than R1,000,000. |
This document does not, nor is it intended to, constitute an “offer to the public” (as that term is defined in the South African Companies Act, 2008 (the “SA Companies Act”) and does not, nor is it intended to, constitute a prospectus prepared and registered under the SA Companies Act. This document is not an “offer to the public” and must not be acted on or relied on by persons who do not fall within Section 96(1)(a) of the SA Companies Act (such persons being referred to as “relevant persons”). Any investment or investment activity to which this document relates is available only to relevant persons and will be engaged in only with relevant persons.
Other relationships
The underwriters and their respective affiliates are full-service financial institutions engaged in various activities, which may include securities trading, commercial and investment banking, financial advisory, investment management, investment research, principal investment, hedging, financing and brokerage activities.
Certain of the underwriters and their affiliates have provided in the past to us and our affiliates and may provide from time to time in the future certain commercial banking, financial advisory, investment banking and other services for us and such affiliates in the ordinary course of their business, for which they have received and may continue to receive customary fees and commissions. Certain underwriters and/or their affiliates, including J.P. Morgan Securities LLC, Goldman, Sachs & Co., Citigroup Global Markets Inc., Merrill Lynch, Pierce, Fenner & Smith Incorporated, Deutsche Bank Securities Inc., BMO Capital Markets Corp. and RBC Capital Markets, LLC are lenders and/or agents under our Senior Credit Facilities or acted as bookrunners in connection with the offering of our Notes. In addition, from time to time, certain of the underwriters and their affiliates may effect transactions for their own account or the account of customers, and hold on behalf of themselves or their customers, long or short positions in our debt or equity securities or loans, and may do so in the future. In the ordinary course of their various business activities, the underwriters and their respective affiliates may make or hold a broad array of investments and actively trade debt and equity securities (or related derivative securities) and financial instruments (including bank loans) for their own account and for the accounts of their customers, and such investment and securities activities may involve securities and/or instruments of the issuer. The underwriters and their respective affiliates may also make investment recommendations and/or
210
Table of Contents
publish or express independent research views in respect of such securities or instruments and may at any time hold, or recommend to clients that they acquire, long and/or short positions in such securities and instruments
Conflicts of interest
Affiliates of TPG Capital BD, LLC, an underwriter of this offering, will beneficially own in excess of 10% of our issued and outstanding common stock following this offering. Therefore, TPG Capital BD, LLC is deemed to have a “conflict of interest” under FINRA Rule 5121(f)(5)(B). In addition, because the TPG Funds are affiliates of TPG Capital BD, LLC and, as selling stockholders, will receive more than 5% of the net proceeds of this offering, TPG Capital BD, LLC is deemed to have a “conflict of interest” under FINRA Rule 5121(f)(5)(C)(ii). Accordingly, this offering will be made in compliance with the applicable provisions of FINRA Rule 5121. Pursuant to that rule, the appointment of a qualified independent underwriter is not necessary in connection with this offering because the underwriters primarily responsible for managing this public offering do not have a “conflict of interest” under Rule 5121, are not an affiliate of any underwriter that does have a “conflict of interest” under Rule 5121 and meet the requirements of paragraph (f)(12)(E) of Rule 5121. In accordance with FINRA Rule 5121(c), no sales of the shares will be made by TPG Capital BD, LLC to any discretionary account over which TPG Capital BD, LLC exercises discretion without the prior specific written approval of the account holder. See “Use of proceeds.”
211
Table of Contents
The validity of the issuance of our common stock offered in this prospectus will be passed upon for us by Ropes & Gray LLP, Boston, Massachusetts. Ropes & Gray LLP and some of its attorneys are limited partners of RGIP, LP, which is an investor in certain investment funds affiliated with TPG and sometimes a co-investor with such funds. RGIP, LP directly or indirectly owns less than 1% of our outstanding shares of common stock. The underwriters have been represented by Cravath, Swaine & Moore LLP.
The consolidated financial statements of Par Pharmaceutical Holdings, Inc. as of December 31, 2014 and 2013 and for each of the two years in the period ended December 31, 2014 appearing in this Prospectus and Registration Statement have been audited by Ernst & Young LLP, independent registered public accounting firm, as set forth in their report thereon appearing elsewhere herein, and are included in reliance upon such report given on the authority of such firm as experts in accounting and auditing.
The consolidated financial statements of Par Pharmaceutical Holdings, Inc. and subsidiaries comprised of the consolidated statements of operations, comprehensive (loss) income, stockholders’ equity, and cash flows for the period July 12, 2012 (Date of Inception) through December 31, 2012 (Successor) included in this Prospectus, have been audited by Deloitte & Touche LLP, an independent registered public accounting firm, as stated in their report appearing herein (which report expresses an unqualified opinion on the consolidated financial statements and includes an explanatory paragraph referring to the merger transaction with Par Pharmaceutical Companies, Inc. and Sky Growth Acquisition Corporation). Such consolidated financial statements have been so included in reliance upon the report of such firm given upon their authority as experts in accounting and auditing.
The consolidated financial statements of Par Pharmaceutical Companies, Inc. and subsidiaries comprised of the consolidated statements of operations, comprehensive (loss) income, stockholders’ equity, and cash flows for the period January 1, 2012 through September 28, 2012 (Predecessor) included in this Prospectus, have been audited by Deloitte & Touche LLP, an independent registered public accounting firm, as stated in their report appearing herein (which report expresses an unqualified opinion on the consolidated financial statements and includes an explanatory paragraph referring to the merger transaction with Par Pharmaceutical Companies, Inc. and Sky Growth Acquisition Corporation). Such consolidated financial statements have been so included in reliance upon the report of such firm given upon their authority as experts in accounting and auditing.
Where you can find more information
We have filed with the SEC a registration statement on Form S-1 under the Securities Act with respect to the shares of common stock offered hereby. This prospectus, which constitutes a part of the registration statement, does not contain all of the information set forth in the registration statement or the exhibits and schedules filed therewith. For further information with respect to us and the common stock offered hereby, please refer to the registration statement and the exhibits and schedules filed therewith. Statements contained in this prospectus regarding the contents of any contract or any other document that is filed as an exhibit to the registration statement are not necessarily complete, and each such statement is qualified in all respects by reference to the full text of such contract or other document filed as an exhibit to the registration statement. A copy of the registration statement and the exhibits and schedules filed therewith may be inspected without charge at the public reference room maintained by the SEC, located at 100 F Street N.E., Washington, D.C. 20549, and copies of all or any part of the registration statement may be obtained from such offices upon the payment of the fees
212
Table of Contents
prescribed by the SEC. Please call the SEC at 1-800-SEC-0330 for further information about the public reference room. The SEC also maintains a website that contains reports, proxy and information statements and other information regarding registrants that file electronically with the SEC. The SEC’s website address is www.sec.gov.
Upon completion of this offering, we will become subject to the information and periodic reporting requirements of the Exchange Act and, in accordance therewith, we will file periodic reports, proxy statements and other information with the SEC. Such periodic reports, proxy statements and other information will be available for inspection and copying at the public reference room and website of the SEC referred to above.
213
Table of Contents
Index to consolidated financial statements
| Consolidated financial statements as of December 31, 2014 and December 31, 2013 and for the years ended December 31, 2014 and December 31, 2013, for the period July 12, 2012 (inception) to December 31, 2012 and the period January 1, 2012 to September 28, 2012 |
||||
| F-2 | ||||
| Consolidated balance sheets at December 31, 2014 and December 31, 2013 |
F-5 | |||
| F-6 | ||||
| F-7 | ||||
| F-8 | ||||
| F-9 | ||||
| F-10 | ||||
| Condensed consolidated financial statements as of March 31, 2015 and March 31, 2014 |
||||
| Condensed consolidated balance sheets at March 31, 2015 (unaudited) and December 31, 2014 |
F-72 | |||
| F-73 | ||||
| F-74 | ||||
| F-75 | ||||
| F-76 | ||||
F-1
Table of Contents
Report of independent registered public accounting firm
The Board of Directors and Stockholders of
Par Pharmaceutical Holdings, Inc.
We have audited the accompanying consolidated balance sheets of Par Pharmaceutical Holdings, Inc. as of December 31, 2014 and 2013, and the related consolidated statements of operations, comprehensive loss, stockholders’ equity and cash flows for each of the two years in the period ended December 31, 2014. These financial statements are the responsibility of the Company’s management. Our responsibility is to express an opinion on these financial statements based on our audits.
We conducted our audits in accordance with the standards of the Public Company Accounting Oversight Board (United States). Those standards require that we plan and perform the audit to obtain reasonable assurance about whether the financial statements are free of material misstatement. We were not engaged to perform an audit of the Company’s internal control over financial reporting. Our audits included consideration of internal control over financial reporting as a basis for designing audit procedures that are appropriate in the circumstances, but not for the purpose of expressing an opinion on the effectiveness of the Company’s internal control over financial reporting. Accordingly, we express no such opinion. An audit also includes examining, on a test basis, evidence supporting the amounts and disclosures in the financial statements, assessing the accounting principles used and significant estimates made by management, and evaluating the overall financial statement presentation. We believe that our audits provide a reasonable basis for our opinion.
In our opinion, the financial statements referred to above present fairly, in all material respects, the consolidated financial position of Par Pharmaceutical Holdings, Inc. at December 31, 2014 and 2013, and the consolidated results of its operations and its cash flows for each of the two years in the period ended December 31, 2014, in conformity with U.S. generally accepted accounting principles.
/s/ Ernst & Young LLP
MetroPark, New Jersey
March 12, 2015
F-2
Table of Contents
Report of independent registered public accounting firm
To the Board of Directors and Stockholders of
Par Pharmaceutical Holdings, Inc.
We have audited the accompanying consolidated statements of operations, comprehensive (loss) income, stockholders’ equity, and cash flows of Par Pharmaceutical Holdings, Inc. and subsidiaries (the “Company”) for the period July 12, 2012 (Date of Inception) through December 31, 2012 (Successor). These consolidated financial statements are the responsibility of the Company’s management. Our responsibility is to express an opinion on these consolidated financial statements based on our audit.
We conducted our audit in accordance with the standards of the Public Company Accounting Oversight Board (United States). Those standards require that we plan and perform the audit to obtain reasonable assurance about whether the financial statements are free of material misstatement. The Company is not required to have, nor were we engaged to perform, an audit of its internal control over financial reporting. Our audit included consideration of internal control over financial reporting as a basis for designing audit procedures that are appropriate in the circumstances, but not for the purpose of expressing an opinion on the effectiveness of the Company’s internal control over financial reporting. Accordingly, we express no such opinion. An audit also includes examining, on a test basis, evidence supporting the amounts and disclosures in the financial statements, assessing the accounting principles used and significant estimates made by management, as well as evaluating the overall financial statement presentation. We believe that our audit provides a reasonable basis for our opinion.
In our opinion, such consolidated financial statements present fairly, in all material respects, the results of operations and cash flows of the Company for the period July 12, 2012 (Date of Inception) through December 31, 2012 (Successor), in conformity with accounting principles generally accepted in the United States of America.
As discussed in the notes to the consolidated financial statements, Par Pharmaceutical Companies, Inc. was acquired at the close of business on September 28, 2012 through a merger transaction with Sky Growth Acquisition Corporation, a wholly-owned subsidiary of Par Pharmaceutical Holdings, Inc. The acquisition was accomplished through a reverse subsidiary merger of Sky Growth Acquisition Corporation with and into the Company, with the Company being the surviving entity. The transaction was accounted for as a business combination and the basis of assets and liabilities were adjusted to their estimated fair values.
/s/ DELOITTE & TOUCHE LLP
Philadelphia, Pennsylvania
March 12, 2015
F-3
Table of Contents
Report of independent registered public accounting firm
To the Board of Directors and Stockholders of
Par Pharmaceutical Holdings, Inc.
We have audited the accompanying consolidated statements of operations, comprehensive (loss) income, stockholders’ equity, and cash flows of Par Pharmaceutical Companies, Inc. and subsidiaries (the “Company”) for the period January 1, 2012 through September 28, 2012 (Predecessor). These consolidated financial statements are the responsibility of the Company’s management. Our responsibility is to express an opinion on these consolidated financial statements based on our audit.
We conducted our audit in accordance with the standards of the Public Company Accounting Oversight Board (United States). Those standards require that we plan and perform the audit to obtain reasonable assurance about whether the financial statements are free of material misstatement. The Company is not required to have, nor were we engaged to perform, an audit of its internal control over financial reporting. Our audit included consideration of internal control over financial reporting as a basis for designing audit procedures that are appropriate in the circumstances, but not for the purpose of expressing an opinion on the effectiveness of the Company’s internal control over financial reporting. Accordingly, we express no such opinion. An audit also includes examining, on a test basis, evidence supporting the amounts and disclosures in the financial statements, assessing the accounting principles used and significant estimates made by management, as well as evaluating the overall financial statement presentation. We believe that our audit provides a reasonable basis for our opinion.
In our opinion, such consolidated financial statements present fairly, in all material respects, the results of operations and cash flows of the Company for the period January 1, 2012 through September 28, 2012 (Predecessor), in conformity with accounting principles generally accepted in the United States of America.
As discussed in the notes to the consolidated financial statements, Par Pharmaceutical Companies, Inc. was acquired at the close of business on September 28, 2012 through a merger transaction with Sky Growth Acquisition Corporation, a wholly-owned subsidiary of Par Pharmaceutical Holdings, Inc. The acquisition was accomplished through a reverse subsidiary merger of Sky Growth Acquisition Corporation with and into the Company, with the Company being the surviving entity. The transaction was accounted for as a business combination and the basis of assets and liabilities were adjusted to their estimated fair values.
/s/ DELOITTE & TOUCHE LLP
Philadelphia, Pennsylvania
March 20, 2013
(March 12, 2015 as to Note 18)
F-4
Table of Contents
Par Pharmaceutical Holdings, Inc.
Consolidated balance sheets
(In thousands, except share and per share data)
| December 31, 2014 |
December 31, 2013 |
|||||||
| ASSETS |
||||||||
| Current assets: |
||||||||
| Cash and cash equivalents |
$ | 244,440 | $ | 130,080 | ||||
| Available for sale marketable debt securities |
— | 3,541 | ||||||
| Accounts receivable, net |
158,732 | 143,279 | ||||||
| Inventories |
154,687 | 117,307 | ||||||
| Prepaid expenses and other current assets |
28,255 | 15,438 | ||||||
| Deferred income tax assets |
66,936 | 55,932 | ||||||
|
|
|
|||||||
| Total current assets |
653,050 | 465,577 | ||||||
| Property, plant and equipment, net |
217,314 | 127,276 | ||||||
| Intangible assets, net |
1,040,753 | 1,092,648 | ||||||
| Goodwill |
1,012,108 | 855,726 | ||||||
| Other assets |
83,909 | 96,342 | ||||||
|
|
|
|||||||
| Total assets |
$ | 3,007,134 | $ | 2,637,569 | ||||
|
|
|
|||||||
| LIABILITIES AND STOCKHOLDERS’ EQUITY |
||||||||
| Current liabilities: |
||||||||
| Current portion of long-term debt |
$ | 14,503 | $ | 21,462 | ||||
| Accounts payable |
79,987 | 31,181 | ||||||
| Payables due to distribution agreement partners |
53,213 | 79,117 | ||||||
| Accrued salaries and employee benefits |
32,246 | 20,700 | ||||||
| Accrued government pricing liabilities |
42,647 | 35,829 | ||||||
| Accrued legal settlements |
— | 41,367 | ||||||
| Accrued interest payable |
7,529 | 7,629 | ||||||
| Accrued expenses and other current liabilities |
47,679 | 21,686 | ||||||
|
|
|
|||||||
| Total current liabilities |
277,804 | 258,971 | ||||||
| Long-term liabilities |
17,004 | 20,322 | ||||||
| Non-current deferred tax liabilities |
242,177 | 288,783 | ||||||
| Long-term debt, less current portion |
1,904,069 | 1,516,057 | ||||||
| Commitments and contingencies |
— | — | ||||||
| Stockholders’ equity: |
||||||||
| Common stock, $0.001 par value per share, 900,000,000 shares authorized in 2014 and 2013; 784,335,270 and 703,791,017 issued and outstanding in 2014 and 2013, respectively |
784 | 704 | ||||||
| Additional paid-in capital |
835,880 | 714,509 | ||||||
| Accumulated deficit |
(266,094 | ) | (160,577 | ) | ||||
| Accumulated other comprehensive loss |
(3,648 | ) | (799 | ) | ||||
| Treasury stock |
(842 | ) | (401 | ) | ||||
|
|
|
|||||||
| Total stockholders’ equity |
566,080 | 553,436 | ||||||
|
|
|
|||||||
| Total liabilities and stockholders’ equity |
$ | 3,007,134 | $ | 2,637,569 | ||||
|
|
||||||||
The accompanying notes are an integral part of these consolidated financial statements.
F-5
Table of Contents
Par Pharmaceutical Holdings, Inc.
Consolidated statements of operations
(In thousands, except per share data)
| For the year ended |
For the year ended |
For the period | ||||||||||||||||
| December 31, 2014 |
December 31, 2013 |
July 12, 2012 to December 31, 2012 |
January 1, 2012 to September 28, 2012 |
|||||||||||||||
| (Successor) | (Successor) | (Successor) | (Predecessor) | |||||||||||||||
| Revenues: |
||||||||||||||||||
| Net product sales |
$ | 1,278,106 | $ | 1,062,453 | $ | 237,338 | $ | 780,797 | ||||||||||
| Other product related revenues |
30,515 | 35,014 | 8,801 | 23,071 | ||||||||||||||
|
|
|
|
|
|||||||||||||||
| Total revenues |
1,308,621 | 1,097,467 | 246,139 | 803,868 | ||||||||||||||
| Cost of goods sold, excluding amortization expense |
643,851 | 595,166 | 157,893 | 431,174 | ||||||||||||||
| Amortization expense |
185,655 | 184,258 | 42,801 | 30,344 | ||||||||||||||
|
|
|
|
|
|||||||||||||||
| Total cost of goods sold |
829,506 | 779,424 | 200,694 | 461,518 | ||||||||||||||
|
|
|
|
|
|||||||||||||||
| Gross margin |
479,115 | 318,043 | 45,445 | 342,350 | ||||||||||||||
| Operating expenses: |
||||||||||||||||||
| Research and development |
119,095 | 100,763 | 19,383 | 66,606 | ||||||||||||||
| Selling, general and administrative |
181,136 | 155,164 | 73,760 | 165,604 | ||||||||||||||
| Intangible asset impairment |
146,934 | 100,093 | — | 5,700 | ||||||||||||||
| Settlements and loss contingencies, net |
90,107 | 25,650 | 10,059 | 45,000 | ||||||||||||||
| Restructuring costs |
5,413 | 1,816 | 241 | — | ||||||||||||||
|
|
|
|
|
|||||||||||||||
| Total operating expenses |
542,685 | 383,486 | 103,443 | 282,910 | ||||||||||||||
|
|
|
|
|
|||||||||||||||
| Loss on sale of product rights |
(3,042 | ) | — | — | — | |||||||||||||
|
|
|
|
|
|||||||||||||||
| Operating (loss) income |
(66,612 | ) | (65,443 | ) | (57,998 | ) | 59,440 | |||||||||||
| Gain on marketable securities and other investments, net |
— | 1,122 | — | — | ||||||||||||||
| Gain on bargain purchase |
— | — | 5,500 | — | ||||||||||||||
| Interest income |
18 | 87 | 50 | 424 | ||||||||||||||
| Interest expense |
(108,427 | ) | (95,484 | ) | (25,985 | ) | (9,159 | ) | ||||||||||
| Loss on debt extinguishment |
(3,989 | ) | (7,335 | ) | — | — | ||||||||||||
| Other income |
500 | — | — | — | ||||||||||||||
|
|
|
|
|
|||||||||||||||
| (Loss) income before (benefit) provision for income taxes |
(178,510 | ) | (167,053 | ) | (78,433 | ) | 50,705 | |||||||||||
| (Benefit) provision for income taxes |
(72,993 | ) | (61,182 | ) | (23,727 | ) | 29,530 | |||||||||||
|
|
|
|
|
|||||||||||||||
| Net (loss) income |
$ | (105,517 | ) | $ | (105,871 | ) | $ | (54,706 | ) | $ | 21,175 | |||||||
|
|
|
|
|
|||||||||||||||
| Net (loss) income per common share: |
||||||||||||||||||
| Basic |
$ | (0.14 | ) | $ | (0.15 | ) | $ | (0.08 | ) | $ | 0.58 | |||||||
|
|
|
|
|
|||||||||||||||
| Diluted |
$ | (0.14 | ) | $ | (0.15 | ) | $ | (0.08 | ) | $ | 0.57 | |||||||
|
|
|
|
|
|||||||||||||||
| Weighted average number of common shares outstanding: |
||||||||||||||||||
| Basic |
772,728 | 704,009 | 698,047 | 36,449 | ||||||||||||||
|
|
|
|
|
|||||||||||||||
| Diluted |
772,728 | 704,009 | 698,047 | 37,231 | ||||||||||||||
|
|
|
|
|
|||||||||||||||
| Proforma net loss (unaudited) |
$ | |||||||||||||||||
|
|
|
|||||||||||||||||
| Proforma net loss per common share (unaudited): |
||||||||||||||||||
| Basic and diluted |
$ | |||||||||||||||||
|
|
|
|||||||||||||||||
| Pro forma weighted average number of common shares outstanding (unaudited): |
||||||||||||||||||
| Basic and diluted |
||||||||||||||||||
|
|
||||||||||||||||||
The accompanying notes are an integral part of these consolidated financial statements.
F-6
Table of Contents
Par Pharmaceutical Holdings, Inc.
Consolidated statements of comprehensive (loss) income
(In thousands)
| For the year ended |
For the year ended |
For the period | ||||||||||||||||
| December 31, 2014 |
December 31, 2013 |
July 12, 2012 to December 31, 2012 |
January 1, 2012 to September 28, 2012 |
|||||||||||||||
| (Successor) | (Successor) | (Successor) | (Predecessor) | |||||||||||||||
| Net (loss) income |
$ | (105,517 | ) | $ | (105,871 | ) | $ | (54,706 | ) | $ | 21,175 | |||||||
| Other comprehensive (loss) income: |
||||||||||||||||||
| Unrealized (loss) gain on marketable securities, net of tax |
(3 | ) | (27 | ) | (10 | ) | 36 | |||||||||||
| Unrealized loss on cash flow hedges, net of tax |
(5,765 | ) | (1,411 | ) | — | — | ||||||||||||
| Less: reclassification adjustment for net losses included in net income (loss), net of tax |
2,880 | 649 | — | — | ||||||||||||||
| Other |
39 | — | — | — | ||||||||||||||
|
|
|
|
|
|||||||||||||||
| Other comprehensive (loss) income |
(2,849 | ) | (789 | ) | (10 | ) | 36 | |||||||||||
|
|
|
|
|
|||||||||||||||
| Comprehensive (loss) income |
$ | (108,366 | ) | $ | (106,660 | ) | $ | (54,716 | ) | $ | 21,211 | |||||||
|
|
||||||||||||||||||
The accompanying notes are an integral part of these consolidated financial statements.
F-7
Table of Contents
Par Pharmaceutical Holdings, Inc.
Consolidated statements of stockholders’ equity
(In thousands)
|
Common stock |
Additional paid-in capital |
Retained earnings / (accumulated deficit) |
Accumulated other comprehensive income/(loss) |
Treasury |
Total |
|||||||||||||||||||||||
| Shares | Amount | |||||||||||||||||||||||||||
| Balance, December 31, 2011 (Predecessor) |
39,678 | $ | 397 | $ | 389,166 | $ | 302,984 | $ | 13 | $ | (82,979 | ) | $ | 609,581 | ||||||||||||||
| Net income |
— | — | — | 21,175 | — | — | 21,175 | |||||||||||||||||||||
| Unrealized loss on available for sale securities, $48 net of tax of $12 |
— | — | — | — | 36 | — | 36 | |||||||||||||||||||||
| Exercise of stock options |
394 | 4 | 11,312 | — | — | — | 11,316 | |||||||||||||||||||||
| Tax benefit related to share-based compensation |
— | — | 7,946 | — | — | — | 7,946 | |||||||||||||||||||||
| Employee stock purchase program |
— | — | 266 | — | — | — | 266 | |||||||||||||||||||||
| Purchase of treasury stock |
— | — | — | — | — | (2,163 | ) | (2,163 | ) | |||||||||||||||||||
| Compensatory arrangements |
— | — | 7,282 | — | — | — | 7,282 | |||||||||||||||||||||
| Restricted stock grants |
99 | 1 | (1 | ) | — | — | — | — | ||||||||||||||||||||
| Forfeitures of restricted stock |
(10 | ) | — | — | — | — | — | — | ||||||||||||||||||||
|
|
|
|||||||||||||||||||||||||||
| Balance, September 28, 2012 (Predecessor) |
40,161 | 402 | 415,971 | 324,159 | 49 | (85,142 | ) | 655,439 | ||||||||||||||||||||
|
|
|
|||||||||||||||||||||||||||
| Balance, July 12, 2012 (Successor) |
— | — | — | — | — | — | — | |||||||||||||||||||||
| Net loss |
— | — | — | (54,706 | ) | — | — | (54,706 | ) | |||||||||||||||||||
| Unrealized loss on available for sale securities, $17 net of tax of $7 |
— | — | — | — | (10 | ) | (10 | ) | ||||||||||||||||||||
| Issuance of common stock |
703,701 | 704 | 702,997 | — | — | — | 703,701 | |||||||||||||||||||||
| Compensatory arrangements |
— | — | 2,240 | — | — | — | 2,240 | |||||||||||||||||||||
| Other |
— | — | (56 | ) | — | — | — | (56 | ) | |||||||||||||||||||
|
|
|
|||||||||||||||||||||||||||
| Balance, December 31, 2012 (Successor) |
703,701 | 704 | 705,181 | (54,706 | ) | (10 | ) | — | 651,169 | |||||||||||||||||||
|
|
|
|||||||||||||||||||||||||||
| Net loss |
— | — | — | (105,871 | ) | — | — | (105,871 | ) | |||||||||||||||||||
| Unrealized loss on available for sale securities, $43 net of tax of $16 |
— | — | — | — | (27 | ) | — | (27 | ) | |||||||||||||||||||
| Unrealized loss on cash flow hedges, $2,203 net of tax of $792 |
— | — | — | — | (1,411 | ) | — | (1,411 | ) | |||||||||||||||||||
| Reclassification adjustment for realized losses included in net loss, $1,014 net of tax of $365 |
— | — | — | — | 649 | — | 649 | |||||||||||||||||||||
| Compensatory arrangements |
— | — | 9,154 | — | — | — | 9,154 | |||||||||||||||||||||
| Issuance of common stock |
100 | — | 100 | — | — | — | 100 | |||||||||||||||||||||
| Stock-based compensation plan settlements |
(50 | ) | — | (154 | ) | (154 | ) | |||||||||||||||||||||
| Vesting of restricted stock |
40 | — | — | — | — | — | — | |||||||||||||||||||||
| Excess tax benefit on exercise of stock options |
— | 228 | — | — | — | 228 | ||||||||||||||||||||||
| Purchase of treasury stock |
— | — | — | — | — | (401 | ) | (401 | ) | |||||||||||||||||||
|
|
|
|||||||||||||||||||||||||||
| Balance, December 31, 2013 (Successor) |
703,791 | 704 | 714,509 | (160,577 | ) | (799 | ) | (401 | ) | 553,436 | ||||||||||||||||||
|
|
|
|||||||||||||||||||||||||||
| Net loss |
— | — | — | (105,517 | ) | — | — | (105,517 | ) | |||||||||||||||||||
| Unrealized loss on available for sale securities, $5 net of tax of $2 |
— | — | — | — | (3 | ) | — | (3 | ) | |||||||||||||||||||
| Unrealized loss on cash flow hedges, $9,011 net of tax of $3,246 |
— | — | — | — | (5,765 | ) | — | (5,765 | ) | |||||||||||||||||||
| Reclassification adjustment for realized losses included in net loss, $4,500 net of tax of $1,620 |
— | — | — | — | 2,880 | — | 2,880 | |||||||||||||||||||||
| Compensatory arrangements |
— | — | 8,678 | — | — | — | 8,678 | |||||||||||||||||||||
| Issuance of common stock |
80,540 | 80 | 112,676 | — | — | — | 112,756 | |||||||||||||||||||||
| Stock-based compensation plan settlements |
(46 | ) | — | (126 | ) | — | — | — | (126 | ) | ||||||||||||||||||
| Vesting of restricted stock |
50 | — | — | — | — | — | — | |||||||||||||||||||||
| Excess tax benefit on exercise of stock options |
— | — | 143 | — | — | — | 143 | |||||||||||||||||||||
| Purchase of treasury stock |
— | — | — | — | — | (441 | ) | (441 | ) | |||||||||||||||||||
| Other |
— | — | — | — | 39 | — | 39 | |||||||||||||||||||||
|
|
|
|||||||||||||||||||||||||||
| Balance, December 31, 2014 (Successor) |
784,335 | $ | 784 | $ | 835,880 | $ | (266,094 | ) | $ | (3,648 | ) | $(842 | ) | $ | 566,080 | |||||||||||||
|
|
||||||||||||||||||||||||||||
The accompanying notes are an integral part of these consolidated financial statements.
F-8
Table of Contents
Par Pharmaceutical Holdings, Inc.
Consolidated statements of cash flows
(In thousands)
| For the year ended |
For the year ended |
For the period | ||||||||||||||||
| December 31, 2014 |
December 31, 2013 |
July 12, 2012 to December 31, 2012 |
January 1, 2012 to September 28, 2012 |
|||||||||||||||
| (Successor) | (Successor) | (Successor) | (Predecessor) | |||||||||||||||
| Cash flows from operating activities: |
||||||||||||||||||
| Net (loss) income |
$ | (105,517 | ) | $ | (105,871 | ) | $ | (54,706 | ) | $ | 21,175 | |||||||
| Adjustments to reconcile net (loss) income to net cash provided by (used in) operating activities: |
||||||||||||||||||
| Deferred income taxes |
(128,377 | ) | (81,847 | ) | (27,060 | ) | 12,103 | |||||||||||
| Resolution of tax contingencies |
— | — | — | (5,256 | ) | |||||||||||||
| Non-cash interest expense |
10,363 | 10,734 | 2,633 | 1,876 | ||||||||||||||
| Depreciation and amortization |
213,564 | 207,646 | 50,348 | 44,426 | ||||||||||||||
| Cost of goods on acquired inventory step up |
9,031 | 6,557 | 21,543 | 4,048 | ||||||||||||||
| Intangible asset impairment |
146,934 | 100,093 | — | 5,700 | ||||||||||||||
| Allowances against accounts receivable |
148,221 | 44,367 | 33,232 | 19,206 | ||||||||||||||
| Share-based compensation expense |
8,678 | 9,154 | 2,240 | 7,282 | ||||||||||||||
| Gain on bargain purchase |
— | — | (5,500 | ) | — | |||||||||||||
| Loss on debt extinguishment |
3,989 | 7,335 | — | — | ||||||||||||||
| Loss sale of product rights |
3,042 | — | — | — | ||||||||||||||
| Other, net |
612 | 439 | 367 | 242 | ||||||||||||||
| Changes in assets and liabilities: |
||||||||||||||||||
| Increase in accounts receivable |
(158,262 | ) | (64,554 | ) | (42,421 | ) | (7,168 | ) | ||||||||||
| (Increase) decrease in inventories |
(12,712 | ) | (11,690 | ) | (15,013 | ) | 11,790 | |||||||||||
| (Increase) decrease in prepaid expenses and other assets |
(11,345 | ) | 16,846 | (20,700 | ) | (21,315 | ) | |||||||||||
| Increase (decrease) in accounts payable, accrued expenses and other liabilities |
36,503 | (44,891 | ) | (23,351 | ) | 58,050 | ||||||||||||
| (Decrease) increase in payables due to distribution agreement partners |
(25,910 | ) | 12,597 | 10,537 | (13,376 | ) | ||||||||||||
| Decrease in income taxes receivable/payable |
6,431 | 6,130 | 13,106 | 14,977 | ||||||||||||||
|
|
|
|
|
|||||||||||||||
| Net cash provided by (used in) operating activities |
145,245 | 113,045 | (54,745 | ) | 153,760 | |||||||||||||
| Cash flows from investing activities: |
||||||||||||||||||
| Capital expenditures |
(45,460 | ) | (17,465 | ) | (10,306 | ) | (11,454 | ) | ||||||||||
| Sky Growth Merger |
— | — | (1,908,725 | ) | — | |||||||||||||
| Business acquisitions, net of any cash acquired |
(478,226 | ) | (1,733 | ) | (110,000 | ) | (34,868 | ) | ||||||||||
| Purchases of intangibles |
(153 | ) | (1,000 | ) | — | (15,000 | ) | |||||||||||
| Purchases of available for sale marketable debt securities |
— | — | — | (6,566 | ) | |||||||||||||
| Proceeds from available for sale of marketable debt securities |
3,514 | 8,000 | 2,500 | 17,500 | ||||||||||||||
| Other, net |
750 | — | — | 3,786 | ||||||||||||||
|
|
|
|
|
|||||||||||||||
| Net cash used in investing activities |
(519,575 | ) | (12,198 | ) | (2,026,531 | ) | (46,602 | ) | ||||||||||
| Cash flows from financing activities: |
||||||||||||||||||
| Proceeds from debt |
525,541 | 198,889 | 1,545,000 | — | ||||||||||||||
| Proceeds from equity contributions, net |
112,756 | 100 | 703,701 | — | ||||||||||||||
| Stock-based compensation plan settlements |
(126 | ) | (154 | ) | — | — | ||||||||||||
| Payments of debt |
(146,032 | ) | (206,881 | ) | (339,512 | ) | (8,750 | ) | ||||||||||
| Payments to extinguish debt |
— | (1,412 | ) | — | — | |||||||||||||
| Debt issuance costs |
(3,150 | ) | — | (67,928 | ) | — | ||||||||||||
| Proceeds from share-based compensation plans |
— | — | — | 11,582 | ||||||||||||||
| Excess tax benefits on share-based compensation |
142 | 228 | — | 8,536 | ||||||||||||||
| Purchase of treasury stock |
(441 | ) | (401 | ) | — | (2,163 | ) | |||||||||||
|
|
|
|
|
|||||||||||||||
| Net cash provided by (used in) financing activities |
488,690 | (9,631 | ) | 1,841,261 | 9,205 | |||||||||||||
|
|
|
|
|
|||||||||||||||
| Net increase (decrease) in cash and cash equivalents |
114,360 | 91,216 | (240,015 | ) | 116,363 | |||||||||||||
| Cash and cash equivalents at beginning of period |
130,080 | 38,864 | 278,879 | 162,516 | ||||||||||||||
|
|
|
|
|
|||||||||||||||
| Cash and cash equivalents at end of period |
$ | 244,440 | $ | 130,080 | $ | 38,864 | $ | 278,879 | ||||||||||
|
|
|
|
|
|||||||||||||||
| Supplemental disclosure of cash flow information: |
||||||||||||||||||
| Cash paid (received) during the period for: |
||||||||||||||||||
| Income taxes, net |
$ | 39,215 | $ | 14,902 | $ | (11,667 | ) | $ | 6,165 | |||||||||
| Interest paid |
$ | 97,305 | $ | 86,187 | $ | 13,969 | $ | 6,615 | ||||||||||
| Non-cash transactions: |
||||||||||||||||||
| Capital expenditures incurred but not yet paid |
$ | 1,242 | $ | 2,254 | $ | 460 | $ | 708 | ||||||||||
| Equity contribution from management shareholders |
$ | — | $ | — | $ | 4,131 | $ | — | ||||||||||
|
|
||||||||||||||||||
The accompanying notes are an integral part of these consolidated financial statements.
F-9
Table of Contents
Par Pharmaceutical Holdings, Inc.
Notes to consolidated financial statements
Par Pharmaceutical Holdings, Inc., (“Holdings”), formerly known as Sky Growth Holdings Corporation, formed July 12, 2012, operates primarily through its indirect, wholly owned domestic subsidiaries Par Pharmaceutical Companies, Inc. (“PPCI”), issuer of the outstanding public debt and Par Pharmaceutical Inc. (collectively with Holdings and PPCI, referred to herein as “the Company,” “we,” “our,” or “us”). PPCI was the holding company prior to the Merger. Prior to the Merger, we conducted our operations through the subsidiaries of PPCI and we continue to do so subsequent to the Merger. On March 4, 2015, Sky Growth Holdings Corporation changed its name to Par Pharmaceutical Holdings, Inc. The Company operates in two business segments or divisions. The generic products division, Par Pharmaceutical (“Par”), develops (including through third party development arrangements and product acquisitions), manufactures and distributes generic and sterile pharmaceuticals in the United States. The branded products division, Par Specialty Pharmaceuticals (“Par Specialty”), formerly known as Strativa Pharmaceuticals, acquires, manufactures and distributes branded pharmaceuticals in the United States. The products we market are principally in the solid oral dosage form (tablet, caplet and two-piece hard-shell capsule), although we also distribute several oral suspension products, and nasal spray products.
PPCI entered into an Agreement and Plan of Merger on July 14, 2012 (the “Merger Agreement) and was acquired at the close of business on September 28, 2012, through a merger transaction with Sky Growth Acquisition Corporation, a wholly owned subsidiary of the Company. Holdings was formed on July 12, 2012 by investment funds affiliated with TPG Capital, L.P. (“TPG” and, together with certain affiliated entities, collectively, the “Sponsor”). PPCI is owned by affiliates of the Sponsor and members of management. The acquisition was accomplished through a reverse subsidiary merger of Sky Growth Acquisition Corporation with and into PPCI, with PPCI being the surviving entity (the “Merger”). Subsequent to the Merger, PPCI became an indirect, wholly owned subsidiary of Holdings (see Note 2—“Sky Growth Merger”). Prior to September 29, 2012, PPCI operated as a public company with its common stock traded on the New York Stock Exchange.
Although PPCI continued as the same legal entity after the Merger, the accompanying consolidated statements of operations, comprehensive income (loss), stockholders’ equity and cash flows are presented for two periods in 2012: Predecessor and Successor, which relate to the period preceding the September 28, 2012 consummation of the Merger (January 1, 2012 to September 28, 2012) and the period succeeding the execution of the Merger Agreement with Holdings (July 14, 2012 to December 31, 2012). After the Merger, consolidated PPCI and consolidated Holdings have the same financial statements, excluding merger-related costs that were recorded on the books and records of Holdings (see Note 2—“Sky Growth Merger”). The Merger and the allocation of the purchase price were recorded as of September 29, 2012. Although the accounting policies followed by Holdings are consistent for the Predecessor and Successor periods, with the exception of the change in the annual evaluation date for goodwill from December 31st to October 1st, financial information for such periods have been prepared under two different historical cost bases of accounting and are therefore not comparable. The results of the periods presented are not necessarily indicative of the results that may be achieved in future periods.
Note 1—Summary of significant accounting policies:
Principles of consolidation:
The consolidated financial statements include the accounts of the Company and its wholly owned subsidiaries, where the operations are conducted and who are the obligators under the Senior Credit Facilities and the 7.375% Senior Notes (refer to Note 14—“Debt”). All intercompany transactions are eliminated in consolidation.
F-10
Table of Contents
Basis of financial statement presentation:
Our accounting and reporting policies conform to the accounting principles generally accepted in the United States of America (U.S. GAAP). The Financial Accounting Standards Board (“FASB”) codified all the accounting standards and principles in the Accounting Standards Codification (“ASC”) as the single source of U.S. GAAP recognized by the FASB to be applied by nongovernmental entities in preparation of financial statements in conformity with U.S. GAAP. Rules and interpretive releases of the Securities and Exchange Commission (the “SEC”) under federal securities laws are also sources of authoritative U.S. GAAP for SEC registrants. All content within the ASC carries the same level of authority.
As a result of the Merger, a new basis of accounting was established as of September 29, 2012. The consolidated financial statements and notes differentiate the results of operations and cash flows for the period from July 12, 2012 (inception) to December 31, 2012 denoting the new basis of accounting as “Successor” in such statements, with a black line separating that information from the results of operations and cash flows for the period from January 1, 2012 to September 28, 2012, which is identified as “Predecessor” in such statements and which reflects the basis of accounting prior to the Merger. For additional information on the effects of the Merger, including a discussion of the Company’s accounting for the Merger, refer to Note 2, “Sky Growth Merger”.
Pro forma financial information
As more fully described in Note 23—Subsequent Events, in February 2015, we amended our existing Credit Agreement, which included new borrowings that were used to pay a cash dividend to the stockholders of Holdings, dividend-equivalent payments, and a special discretionary dividend-equivalent bonus to certain Company employees (the “Dividend Recapitalization”).
Pro forma earnings per share (unaudited)
For the purposes of the pro forma earnings per share of common stock calculations, Holdings has assumed that the Dividend Recapitalization had occurred as of January 1, 2014. The basic and diluted pro forma per share of common stock calculations presented below give effect to the Dividend Recapitalization and the number of shares whose proceeds would be necessary to fund the Dividend Recapitalization in addition to historical EPS. The basic pro forma earnings per share of common stock is computed by dividing net (loss) income available to common shareholders by the pro forma weighted average number of shares of common stock outstanding during the period. The diluted pro forma earnings per share of common stock calculation also assumes the conversion, exercise or issuance of all potential shares of common stock, unless the effect of inclusion would be anti-dilutive.
F-11
Table of Contents
The below table sets forth the computation of unaudited pro forma basic and diluted loss per share for the year ended December 31, 2014:
| (In thousands, except per share data) | December 31, 2014 |
|||
| Numerator: |
||||
| Net loss as reported |
$ | |||
| Net loss pro forma adjustments: |
||||
| Interest expense, net of tax |
||||
| Amortization of debt issuance costs and discount, net of tax |
||||
|
|
|
|||
| Pro forma net loss |
$ | |||
|
|
|
|||
| Denominator: |
||||
| Weighted average common shares used in computing basic and diluted loss per common share outstanding |
||||
| Adjustment for common stock issued whose proceeds will be used to fund the Dividend Recapitalization |
||||
|
|
|
|||
| Pro forma weighted average common shares used in computing basic and diluted loss per common share outstanding |
||||
|
|
|
|||
| Pro forma basic and diluted loss per share |
$ | |||
|
|
|
|||
|
|
||||
Use of estimates:
The consolidated financial statements include certain amounts that are based on management’s best estimates and judgments. Estimates are used in determining such items as provisions for sales returns, rebates and incentives, chargebacks, and other sales allowances, depreciable/amortizable lives, asset impairments, excess inventory, valuation allowance on deferred taxes, purchase price allocations and amounts recorded for contingencies and accruals. Because of the uncertainties inherent in such estimates, actual results may differ from these estimates. Management periodically evaluates estimates used in the preparation of the consolidated financial statements for continued reasonableness.
Use of forecasted financial information in accounting estimates:
The use of forecasted financial information is inherent in many of our accounting estimates, including but not limited to, determining the estimated fair value of goodwill and intangible assets, matching intangible amortization to underlying benefits (e.g. sales and cash inflows), establishing and evaluating inventory reserves, and evaluating the need for valuation allowances for deferred tax assets. Such forecasted financial information is comprised of numerous assumptions regarding our future revenues, cash flows, and operational results. Management believes that its financial forecasts are reasonable and appropriate based upon current facts and circumstances. Because of the inherent nature of forecasts, however, actual results may differ from these forecasts. Management regularly reviews the information related to these forecasts and adjusts the carrying amounts of the applicable assets prospectively, if and when actual results differ from previous estimates.
Cash and cash equivalents:
We consider all highly liquid money market instruments with an original maturity of three months or less when purchased to be cash equivalents. These amounts are stated at cost, which approximates fair value. At
F-12
Table of Contents
December 31, 2014, cash equivalents were held in a number of money market funds and consisted of immediately available fund balances. We maintain our cash deposits and cash equivalents with well-known and stable financial institutions. At December 31, 2014, our cash and cash equivalents were invested primarily in AAA-rated money market funds, which hold high-grade corporate securities or invest in government and/or government agency securities. We have not experienced any losses on our deposits of cash and cash equivalents to date.
Our primary source of liquidity is cash received from customers. In the years ended December 31, 2014 and December 31, 2013 (Successor), we collected $1,462.0 million and $1,150.0 million with respect to net product sales. In the period from July 12, 2012 (inception) to December 31, 2012 (Successor), we collected $258.0 million with respect to net product sales. In the period from January 1, 2012 to September 28, 2012 (Predecessor), we collected $854.0 million with respect to net product sales. Our primary use of liquidity includes funding of general operating expenses, normal course payables due to distribution agreement partners, capital expenditures, business development and product acquisition activities, and corporate acquisitions.
The ability to monetize our current product portfolio, our product pipeline, and future product acquisitions and generate sufficient operating cash flows that along with existing cash, cash equivalents and available for sale securities will allow us to meet our financial obligations over the foreseeable future. The timing of our future financial obligations and the introduction of products in the pipeline as well as future product acquisitions may require additional debt and/or equity financing; there can be no assurances that we will be able to obtain any such additional financing when needed or on acceptable or favorable terms.
Concentration of credit risk:
Financial instruments that potentially subject us to credit risk consist of trade receivables. We market our products primarily to wholesalers, drug store chains, supermarket chains, mass merchandisers, distributors, mail order accounts and drug distributors. We believe the risk associated with this concentration is somewhat limited due to the number of customers and their geographic dispersion and our performance of certain credit evaluation procedures (see Note 9—“Accounts Receivable—Major Customers—Gross Accounts Receivable”).
Investments in debt securities:
We determine the appropriate classification of all debt securities as held-to-maturity, available-for-sale or trading at the time of purchase, and re-evaluate such classification as of each balance sheet date in accordance with FASB ASC 320. We assess whether temporary or other-than-temporary unrealized losses on our marketable securities have occurred due to declines in fair value or other market conditions based on the extent and duration of the decline, as well as other factors. Because we have determined that all of our debt securities are available for sale, unrealized gains and losses are reported as a component of accumulated other comprehensive income (loss) in stockholders’ equity. Any other-than-temporary unrealized losses would be recorded in the consolidated statement of operations.
Inventories:
Inventories are typically stated at the lower of cost (first-in, first-out basis) or market value. The nature of the costs capitalized for inventories are generally related to amounts required to acquire materials and amounts incurred to produce salable goods. We establish reserves for our inventory to reflect situations in which the cost of the inventory is not expected to be recovered. In evaluating whether inventory is stated at the lower of cost or market, management considers such factors as the amount of inventory on hand, estimated time required to sell such inventory, remaining shelf life, remaining contractual terms of any supply and distribution agreements
F-13
Table of Contents
including authorized generic agreements, and current expected market conditions, including level of competition. Such evaluations utilize forecasted financial information. We record provisions for inventory to cost of goods sold.
Property, plant and equipment:
As detailed in Note 2—“Sky Growth Merger” and Note 3—“Par Sterile Acquisition”, property, plant and equipment was increased to its fair value in the allocation of purchase price as of September 28, 2012 and February 20, 2014, respectively. The revised carrying values of the property, plant and equipment are depreciated over their remaining useful lives. The costs of repairs and maintenance are expensed when incurred, while expenditures for refurbishments and improvements that significantly add to the productive capacity or extend the useful life of an asset are capitalized.
Depreciation and amortization:
Property, plant and equipment are reported at acquisition cost, less accumulated depreciation and amortization, and are generally depreciated or amortized over their estimated useful lives. Leasehold improvements are amortized over the shorter of their estimated useful life or the term of the lease. The following is the estimated useful life for each applicable asset group:
| Buildings |
10 to 40 years | |
| Machinery and equipment |
3 to 15 years | |
| Office equipment, furniture and fixtures |
3 to 7 years | |
| Computer software and hardware |
3 to 7 years | |
|
| ||
Impairment of long-lived assets:
We evaluate long-lived assets, including intangible assets with definite lives, for impairment periodically or whenever events or other changes in circumstances indicate that the carrying value of an asset may no longer be recoverable. If such circumstances are determined to exist, the estimated fair value is compared to the carrying value to determine whether impairment exists at its lowest level of identifiable cash flows. If impairment is identified, the assets are adjusted to fair value and a loss is recorded. Our judgments related to the expected useful lives of long-lived assets and our ability to realize undiscounted cash flows in excess of the carrying amounts of such assets are affected by factors such as ongoing maintenance and improvements of the assets, changes in economic and market conditions, our ability to successfully launch products, and changes in operating performance. In addition, we regularly evaluate our other assets and may accelerate depreciation over the revised useful life if the asset has limited future value.
Costs of computer software:
We capitalize certain costs associated with computer software developed or obtained for internal use in accordance with the provisions of FASB ASC 350-40. We capitalize those costs from the acquisition of external materials and services associated with developing or obtaining internal use computer software. We capitalize certain payroll costs for employees that are directly associated with internal use computer software projects once specific criteria of ASC 350-40 are met. Those costs that are associated with preliminary stage activities, training, maintenance, and all other post-implementation stage activities are expensed as they are incurred. All costs capitalized in connection with internal use computer software projects are amortized on a straight-line basis over a useful life of three to seven years, beginning when the software is ready for its intended use.
F-14
Table of Contents
Research and development agreements:
Research and development costs are expensed as incurred. These expenses include the costs of our internal product development efforts, acquired in-process research and development purchased in an asset acquisition outside of a business combination, as well as costs incurred in connection with our third party collaboration efforts. Milestone payments made under contract research and development arrangements or product licensing arrangements prior to regulatory approval of the associated product are expensed when the milestone is achieved. Once the product receives regulatory approval we record any subsequent milestone payments as intangible assets. We make the determination to capitalize or expense amounts related to the development of new products and technologies through agreements with third parties based on our ability to recover our cost in a reasonable period of time from the estimated future cash flows anticipated to be generated pursuant to each agreement. Market (including competition), regulatory and legal factors, among other things, may affect the realizability of the projected cash flows that an agreement was initially expected to generate. We regularly monitor these factors and subject all capitalized costs to periodic impairment testing.
Costs for patent litigation and legal proceedings:
Costs for patent litigation or other legal proceedings are expensed as incurred and included in selling, general and administrative expenses.
Goodwill and intangible assets:
We determine the estimated fair values of goodwill and intangible assets with definite and/or indefinite lives based on valuations performed at the time of their acquisition in accordance with FASB ASC 350 and in accordance with FASB ASC 805, “Business Combinations,” (“ASC 805”), including acquired in-process research and development, which is capitalized as part of business combinations. Such valuations utilize forecasted financial information. In addition, certain amounts paid to third parties related to the development of new products and technologies, as described above, are capitalized and included in intangible assets on the accompanying consolidated balance sheets.
Goodwill and indefinite lived intangible assets are evaluated for impairment at least annually. We may first consider qualitative factors as set forth in the guidance, when appropriate to determine if it is more likely than not (defined as 50% or more) that the fair value of the reporting unit is less than its carrying amount. If it is determined that it is not more likely than not that the fair value of the reporting unit is less than its carrying amount, no additional steps are taken. If we chose not to consider qualitative factors or it is determined that it is more likely than not that the fair value of the reporting unit is less than its carrying amount, the Company then uses a two-step process that compares the fair value of the reporting unit to which the goodwill is assigned to the reporting unit’s carrying amount, including goodwill. The first step is to identify a potential impairment, and the second step measures the amount of the impairment loss, if any. Goodwill is impaired if the carrying amount of a reporting unit’s goodwill exceeds its estimated fair value. As of October 1, 2014, the Company performed its annual goodwill and indefinite lived intangible asset impairment assessments noting no impairment of goodwill and impairment of certain of our intangible assets. Refer to Note 12—“Intangible Assets, net”. No changes in business or other factors are known as of the December 31, 2014 balance sheet date that would necessitate an evaluation for impairment.
Definite-lived intangibles are amortized over the period in which the related cash flows are expected to be generated or on a straight-line basis over the products’ estimated useful life if the estimated cash flows method approximates straight-line basis.
We review the carrying value of our long-term assets for impairment whenever events and circumstances indicate that the carrying value of an asset may not be recoverable from the estimated future cash flows
F-15
Table of Contents
expected to result from its use and eventual disposition. In cases where undiscounted expected future cash flows are less than the carrying value, an impairment loss is recognized equal to an amount by which the carrying value exceeds the fair value of assets.
As discussed above with respect to determining an asset’s fair value and useful life, because this process involves management making certain estimates and because these estimates form the basis of the determination of whether or not an impairment charge should be recorded, these estimates are considered to be critical accounting estimates. We will continue to assess the carrying value of our goodwill and intangible assets in accordance with applicable accounting guidance.
Income taxes:
We account for income taxes in accordance with FASB ASC 740. Deferred taxes are provided using the asset and liability method, whereby deferred income taxes result from temporary differences between the reported amounts in the financial statements and the tax basis of assets and liabilities, as measured by presently enacted tax rates. We establish valuation allowances against deferred tax assets when it is more likely than not that the realization of those deferred tax assets will not occur. In establishing valuation allowances, management makes estimates such as projecting future taxable income. Such estimates utilize forecasted financial information.
ASC 740-10 clarifies the accounting for uncertainty in income taxes recognized in an enterprise’s financial statements and prescribes a recognition threshold and measurement attribute for financial statement recognition, measurement and disclosure of tax positions that a company has taken or expects to be taken in a tax return. Additionally, ASC 740-10 provides guidance on de-recognition, classification, interest and penalties, accounting in interim periods and transition. See Note 19—“Income Taxes”.
Revenue recognition and accounts receivable reserves and allowances:
We recognize revenues for product sales when title and risk of loss transfer to our customers, when reliable estimates of rebates, chargebacks, returns and other adjustments can be made, and collectability is reasonably assured. Included in our recognition of revenues are estimated provisions for sales allowances, the most significant of which include rebates, chargebacks, product returns, and other sales allowances, recorded as reductions to gross revenues, with corresponding adjustments to the accounts receivable reserves and allowances (see Note 9—“Accounts Receivable”). In addition, we record estimates for rebates paid under federal and state government Medicaid drug reimbursement programs as reductions to gross revenues, with corresponding adjustments to accrued liabilities. We have the experience and access to relevant information that we believe are necessary to reasonably estimate the amounts of such deductions from gross revenues. Some of the assumptions we use for certain of our estimates are based on information received from third parties, such as customers’ inventories at a particular point in time and market data, or other market factors beyond our control. The estimates that are most critical to our establishment of these reserves, and therefore would have the largest impact if these estimates were not accurate, are our estimates of non-contract sales volumes, average contract pricing, customer inventories, processing time lags, and return volumes. We regularly review the information related to these estimates and adjust our reserves accordingly, if and when actual experience differs from previous estimates.
Distribution costs:
We record distribution costs related to shipping product to our customers, primarily through the use of common carriers or external distribution services, in selling, general and administrative expenses. Distribution costs for the years ended December 31, 2014 and December 31, 2013 (Successor) were approximately $3.4 million and
F-16
Table of Contents
$3.3 million, respectively. Distribution costs for the period from July 12, 2012 (inception) to December 31, 2012 (Successor) were approximately $1.0 million. Distribution costs for the period from January 1, 2012 to September 28, 2012 (Predecessor) were approximately $2.3 million.
Fair value of financial instruments:
The carrying amounts of our cash equivalents, accounts receivable, accounts payable and accrued liabilities approximate fair values based upon the relatively short-term nature of these financial instruments.
Concentration of suppliers of distributed products and internally manufactured products:
We have entered into a number of license and distribution agreements pursuant to which we distribute generic pharmaceutical products and brand products developed and/or supplied to us by certain third parties. We have also entered into contract manufacturing agreements for third-parties to manufacture some of our own generic products for us. For the year ended December 31, 2014 (Successor), a significant percentage of our total net product sales were generated from such contract-manufactured and/or licensed products. We cannot provide assurance that the efforts of our contractual partners will continue to be successful, that we will be able to renew such agreements or that we will be able to enter into new agreements in the future. Any alteration to or termination of our current material license and distribution agreements, our failure to enter into new and similar agreements, or the interruption of the supply of our products under such agreements or under our contract manufacturing agreements, could have a material adverse effect on our business, condition (financial and other), prospects or results of operations.
We produce substantially all of our internally manufactured products at our manufacturing facilities in New York, Michigan, and California as of December 31, 2014. A significant disruption at those facilities, even on a short-term basis, could impair our ability to produce and ship products to the market on a timely basis, which could have a material adverse effect on our business, financial position and results of operations.
Segments:
FASB ASC 280-10 codifies the standards for reporting of financial information about operating segments in annual financial statements. Management considers our business to be in two reportable business segments, generic and brand pharmaceuticals. Refer to Note 21—“Segment Information”. Our four largest customers in terms of our consolidated total revenues accounted for approximately 70% of our total revenues as of December 31, 2014, as follows: McKesson Drug Co. (24.7%), Cardinal Health Inc. (18.3%), CVS Health Corporation (14.5%) and AmerisourceBergen Corporation (13.4%) for the year ended December 31, 2014.
Contingencies and legal fees:
We are subject to various patent litigations, product liability litigations, government investigations and other legal proceedings in the ordinary course of business. Legal fees and other expenses related to litigation are expensed as incurred and included in selling, general and administrative expenses. Contingent accruals are recorded when we determine that a loss is both probable and reasonably estimable. Due to the fact that legal proceedings and other contingencies are inherently unpredictable, our assessments involve significant judgment regarding future events.
Debt issuance costs:
We capitalize direct costs incurred with obtaining debt financing, which are included in other assets on the consolidated balance sheet. Debt issuance costs are amortized to interest expense over the term of the underlying
F-17
Table of Contents
debt using the effective interest method. We recognized amortized debt issuance costs of $10.7 million for the year ended December 31, 2014 (Successor), $10.7 million for the year ended December 31, 2013 (Successor), $2.8 million for the period July 12, 2012 (inception) to December 31, 2012 (Successor), and $1.9 million for the period January 1, 2012 to September 28, 2012 (Predecessor).
Derivative instruments and hedging activities:
As required by FASB ASC 815, Derivatives and Hedging (“ASC 815”), we record all derivatives on our consolidated balance sheet at fair value. The accounting for changes in the fair value of derivatives depends on the intended use of the derivative, whether we have elected to designate a derivative in a hedging relationship and apply hedge accounting and whether the hedging relationship has satisfied the criteria necessary to apply hedge accounting. Derivatives designated and qualifying as a hedge of the exposure to changes in the fair value of an asset, liability, or firm commitment attributable to a particular risk, such as interest rate risk, are considered fair value hedges. Derivatives designated and qualifying as a hedge of the exposure to variability in expected future cash flows, or other types of forecasted transactions, are considered cash flow hedges. Derivatives may also be designated as hedges of the foreign currency exposure of a net investment in a foreign operation. Hedge accounting generally provides for the matching of the timing of gain or loss recognition on the hedging instrument with the recognition of the changes in the fair value of the hedged asset or liability that are attributable to the hedged risk in a fair value hedge or the earnings effect of the hedged forecasted transactions in a cash flow hedge. We may enter into derivative contracts that are intended to economically hedge certain of our risks, even though hedge accounting does not apply or we elect not to apply hedge accounting under ASC 815.
Earnings / (loss) per common share data:
Basic loss per common share is calculated based upon net income/loss available to holders of common shares divided by the weighted average number of shares outstanding. Diluted loss per common share is based upon the weighted-average number of common shares outstanding during the period plus additional weighted-average common equivalent shares outstanding during the period when the effect is dilutive. Common equivalent shares result from the assumed exercise of outstanding stock options, the proceeds of which are then assumed to have been used to repurchase outstanding stock and the vesting of unvested restricted stock units. Common equivalent shares are not included in the net income/loss per common share calculations because the effect would have been anti-dilutive.
Recent accounting pronouncements:
In April 2014, the FASB issued ASU 2014-08, “Reporting Discontinued Operations and Disclosures of Disposals of Components of an Entity” (“ASU 2014-08”). ASU 2014-08 amends guidance for reporting discontinued operations and disposals of components of an entity. Under the new guidance, only disposals representing a strategic shift in operations should be presented as discontinued operations. Those strategic shifts should have a major effect on the organization’s operations and financial results. Examples include a disposal of a major geographic area, a major line of business, or a major equity method investment. The new guidance requires expanded disclosures about discontinued operations that will provide financial statement users with more information about the assets, liabilities, income, and expenses of discontinued operations. The guidance also expands the disclosure of the pre-tax income attributable to a disposal of a significant part of an organization that does not qualify for discontinued operations reporting. This disclosure is intended to provide users with information about the ongoing trends in a reporting organization’s results from continuing operations. ASU 2014-08 is effective prospectively for fiscal years, and interim reporting periods within those years, beginning
F-18
Table of Contents
after December 15, 2014 with early adoption permitted only for disposals that have not been previously reported. We currently do not anticipate an impact of ASU 2014-08 on our consolidated financial statements and related disclosures.
In May 2014, the FASB issued ASU 2014-09, “Revenue from Contracts with Customers” (“ASU 2014-09”). ASU 2014-09 supersedes nearly all existing revenue recognition guidance under accounting principles generally accepted in the United States of America. ASU 2014-09 affects any entity that either enters into contracts with customers to transfer goods or services or enters into contracts for the transfer of nonfinancial assets unless those contracts are within the scope of other standards (e.g., insurance contracts or lease contracts). The core principle of ASU 2014-09 is to recognize revenues to depict the transfer of promised goods or services to customers in an amount that reflects the consideration that is expected to be received for those goods or services. ASU 2014-09 defines a five step process to achieve this core principle: 1) identify the contract with a customer, 2) identify the separate performance obligations in the contract, 3) determine the transaction price, 4) allocate the transaction price to the separate performance obligations in the contract, and 5) recognize revenue when (or as) the entity satisfies a performance obligation. ASU 2014-09 is effective for annual reporting periods beginning after December 15, 2016. Early adoption is not permitted. ASU 2014-09 can be applied retrospectively to each prior reporting period presented or retrospectively with the cumulative effect of the change recognized at the date of the initial application in retained earnings or accumulated deficit. We are currently evaluating the impact of ASU 2014-09 on our consolidated financial statements and related disclosures and we have not yet selected a transition method.
In August 2014, the FASB issued ASU 2014-15, “Presentation of Financial Statements-Going Concern (Subtopic 205-40): Disclosure of Uncertainties about an Entity’s Ability to Continue as a Going Concern” (“ASU 2014-15”), which defines management’s responsibility to assess an entity’s ability to continue as a going concern, and to provide related footnote disclosures if there is substantial doubt about its ability to continue as a going concern. The pronouncement is effective for annual reporting periods ending after December 15, 2016 with early adoption permitted. We currently do not anticipate an impact of ASU 2014-15 on our consolidated financial statements and related disclosures.
In November 2014, the FASB issued ASU 2014-17, “Business Combinations (Topic 805): Pushdown Accounting” (“ASU 2014-17”). The amendments in ASU 2014-17 provide an acquired entity with an option to apply pushdown accounting in its separate financial statements upon occurrence of an event in which an acquirer obtains control of the acquired entity. The pronouncement is effective for annual reporting periods ending after November 14, 2014 with early adoption permitted. There is no impact from ASU 2014-17 on our consolidated financial statements and related disclosures.
Note 2—Sky Growth merger:
The transactions
PPCI was acquired at the close of business on September 28, 2012 through the Merger. Holdings and its wholly-owned subsidiaries were formed by affiliates of TPG solely for the purposes of completing the Merger and the related transactions. At the time of the Merger, each share of our common stock issued and outstanding immediately prior to the close of the Merger was converted into the right to receive cash. Aggregate consideration tendered at September 28, 2012 was for 100% of the equity of PPCI. Subsequent to the Merger, PPCI became an indirect, wholly owned subsidiary of Holdings.
The Merger was accounted for as a purchase business combination in accordance with FASB ASC 805, “Business Combinations,” (“ASC 805”) whereby the purchase price paid to effect the Merger was allocated to recognize the acquired assets and liabilities assumed at fair value. The acquisition method of accounting uses the fair value concept defined in ASC 820, “Fair Value Measurements and Disclosures” (“ASC 820”).
F-19
Table of Contents
The sources and uses of funds in connection with the Transactions are summarized below ($ in thousands):
| Sources: | Uses: | |||||||||
| Senior secured term loan |
$ | 1,055,000 | Cash purchase of equity | $ | 1,908,725 | |||||
| 7.375% Senior notes |
490,000 | Prior debt and accrued interest | 337,704 | |||||||
|
|
|
|||||||||
| Sponsor equity contribution |
690,000 | Total purchase price | 2,246,429 | |||||||
| Company cash on hand |
144,791 | Transaction costs | 133,362 | |||||||
|
|
|
|
|
|||||||
| Total source of funds |
$ | 2,379,791 | Total use of funds | $ | 2,379,791 | |||||
|
|
||||||||||
The final allocation of the purchase price at September 29, 2012 was as follows ($ in thousands):
| As of September 29, 2012 |
||||
| Cash on hand |
$ | 278,879 | ||
| Accounts receivable, net |
113,902 | |||
| Inventories |
118,704 | |||
| Property, plant and equipment, net |
129,416 | |||
| Intangible assets |
1,303,300 | |||
| Other current and non-current assets |
83,493 | |||
|
|
|
|||
| Total identifiable assets |
2,027,694 | |||
|
|
|
|||
| Accounts payable |
36,304 | |||
| Payables due to distribution agreement partners |
55,983 | |||
| Accrued government pricing liabilities |
43,010 | |||
| Accrued legal settlements |
58,917 | |||
| Other current liabilities |
89,231 | |||
| Other long-term liabilities |
12,568 | |||
| Deferred income taxes |
340,978 | |||
|
|
|
|||
| Total liabilities assumed |
636,991 | |||
|
|
|
|||
| Net identifiable assets acquired |
1,390,703 | |||
| Goodwill |
855,726 | |||
| Total purchase price allocation |
$ | 2,246,429 | ||
|
|
||||
The excess of the purchase price (consideration transferred) over the estimated amounts of identifiable assets acquired and liabilities assumed as of the effective date of the Merger was allocated to goodwill in accordance with ASC 805, which mainly represents intangible assets related to our know-how, including our workforce’s expertise in R&D and manufacturing that do not qualify for separate recognition. The purchase price allocation was subject to completion of our analysis of the fair value of the assets and liabilities as of the effective date of the Merger. The final valuation was completed as of September 30, 2013. Refer to Note 13—“Goodwill”, for changes during the year ended December 31, 2013. None of the goodwill identified above will be deductible for income tax purposes.
Transactions with manager
In connection with the Merger and the related transactions, PPCI entered into a management services agreement with an affiliate of TPG (the “Manager”). Pursuant to the agreement, in exchange for on-going consulting and management advisory services, the Manager receives an annual monitoring fee paid quarterly
F-20
Table of Contents
equal to 1% of EBITDA as defined under the credit agreement for the Senior Credit Facilities (as defined in Note 14—“Debt”). There is an annual cap of $4.0 million for this fee. The Manager also receives reimbursement for out-of-pocket expenses incurred in connection with services provided pursuant to the agreement. Holdings recorded an expense of $4.0 million and $3.6 million for consulting and management advisory service fees which are included in selling, general and administrative expenses in the consolidated statement of operations in the years ended December 31, 2014 (Successor), December 31, 2013 (Successor), and $0.7 million in the period from July 12, 2012 (inception) to December 31, 2012 (Successor). Also, in the period from July 12, 2012 (inception) to December 31, 2012 (Successor), Holdings incurred merger-related costs of $28.2 million. There costs were primarily investment bank fees, accounting fees, legal fees, and other fees.
Note 3—Par Sterile acquisition:
On February 20, 2014, the Company completed its acquisition of JHP Group Holdings, Inc. and its subsidiaries (collectively, “JHP”), a privately-held, specialty sterile products pharmaceutical company. The acquisition was accomplished through a reverse subsidiary merger of an indirect subsidiary of the Company with and into JHP Group Holdings, Inc., in which JHP Group Holdings, Inc. was the surviving entity and became an indirect, wholly owned subsidiary of the Company (the “Par Sterile Acquisition”). The consideration for the Par Sterile Acquisition consisted of $487.0 million in cash, after finalization of certain customary working capital adjustments. The Company financed the Par Sterile Acquisition with proceeds received in connection with the debt financing provided by third party lenders of $395.0 million and an equity contribution of $110.0 million from certain investment funds associated with TPG. Among the primary reasons the Company acquired JHP and the factors that contributed to the preliminary recognition of goodwill was that the Par Sterile Acquisition expanded its capability and presence into the rapidly growing sterile drug market for injectable products including ophthalmics and otics. The result is a broader and more diversified product portfolio, and an expanded development pipeline.
JHP operated principally through its operating subsidiary, JHP Pharmaceuticals, LLC, which was renamed Par Sterile Products, LLC (“Par Sterile”) subsequent to the Par Sterile Acquisition. We continue to operate Par Sterile as a specialty pharmaceutical company developing and manufacturing sterile injectable products. Par Sterile’s products are primarily sold through wholesalers, often via an arrangement with a group purchasing organization, prior to being dispensed at hospitals or directly administered by physicians. Par Sterile targets products with limited competition due to difficulty in manufacturing and/or the product’s market size. Our Par Sterile manufacturing facility in Rochester, Michigan has the capability to manufacture small-scale clinical through large-scale commercial products.
The operating results of Par Sterile from February 20, 2014 to December 31, 2014 are included in the accompanying consolidated statement of operations as part of the Par Pharmaceutical segment, reflecting total revenues of approximately $140.3 million. Par Sterile’s contribution to the overall Par Pharmaceutical segment’s operating (loss) or income is not tracked separately. The consolidated balance sheet as of December 31, 2014 reflects the acquisition, including goodwill, which represents Par Sterile’s workforce expertise in research & development, marketing and manufacturing.
The acquisition has been accounted for as a business combination using the acquisition method of accounting under the provisions of ASC 805. The acquisition method of accounting uses the fair value concept defined in ASC 820. ASC 805 requires, among other things, that most assets acquired and liabilities assumed in a business purchase combination be recognized at their fair values as of the acquisition date and that the fair value of acquired in-process research and development (“IPR&D”) be recorded on the balance sheet regardless of the likelihood of success of the related product or technology as of the completion of the acquisition. The process for estimating the fair values of IPR&D, identifiable intangible assets and certain tangible assets requires the
F-21
Table of Contents
use of significant estimates and assumptions, including estimating future cash flows, developing appropriate discount rates, estimating the costs, timing and probability of success to complete in-process projects and projecting regulatory approvals. Under ASC 805, transaction costs are not included as a component of consideration transferred and were expensed as incurred. The acquisition and financing transaction costs totaled $12.4 million of which $8.2 million were included in operating expenses as selling, general and administrative expenses on the consolidated statements of operations and $4.1 million were capitalized as deferred financing costs or debt discount on the consolidated balance sheet. The acquisition-related transaction costs were comprised of bank fees ($10.4 million), legal fees ($1.5 million), and other fees ($0.5 million). The excess of the purchase price (consideration transferred) over the estimated amounts of identifiable assets and liabilities of Par Sterile as of the effective date of the acquisition was allocated to goodwill, as part of the Par Pharmaceutical segment, in accordance with ASC 805. The purchase price allocation was finalized with the completion of our analysis of the fair value of the assets and liabilities of Par Sterile as of the effective date of the acquisition. The establishment of the fair value of the consideration for an acquisition, and the allocation to identifiable tangible and intangible assets and liabilities, requires the extensive use of accounting estimates and management judgment. We believe the fair values assigned to the assets acquired and liabilities assumed are based on reasonable estimates and assumptions.
The sources and uses of funds in connection with the Par Sterile Acquisition are summarized below ($ in thousands):
| Sources: | Uses: | |||||||||
| Senior secured term loan |
$ | 395,000 | Cash purchase of equity | $ | 487,429 | (a) | ||||
| Sponsor equity contribution |
110,000 | Transaction costs | 12,350 | |||||||
| Company cash on hand |
1,133 | (a) | Accrued interest on Company debt | 6,354 | ||||||
|
|
|
|
|
|||||||
| Total source of funds |
$ | 506,133 | Total use of funds | $ | 506,133 | |||||
|
|
||||||||||
| (a) | Adjusted to reflect the finalization of working capital adjustments noted above. |
Fair value estimate of assets acquired and liabilities assumed
The purchase price of Par Sterile has been allocated to the following assets and liabilities ($ in thousands):
| As of February 20, 2014 | ||||
| Cash and cash equivalents |
$ | 9,204 | ||
| Accounts receivable, net |
5,413 | |||
| Inventories |
35,959 | |||
| Prepaid expenses and other current assets |
10,583 | |||
| Property, plant and equipment |
73,579 | |||
| Intangible assets |
283,500 | |||
|
|
|
|||
| Total identifiable assets |
418,238 | |||
|
|
|
|||
| Accounts payable |
13,796 | |||
| Accrued expenses and other liabilities |
1,902 | |||
| Deferred tax liabilities |
71,493 | |||
|
|
|
|||
| Total liabilities assumed |
87,191 | |||
|
|
|
|||
| Net identifiable assets acquired |
331,047 | |||
| Goodwill |
156,382 | |||
|
|
|
|||
| Net assets acquired |
$ | 487,429 | ||
|
|
||||
Approximately $20.0 million of the goodwill identified above and recorded on the consolidated balance sheet as of December 31, 2014 will be deductible for income tax purposes.
F-22
Table of Contents
Supplemental pro forma information (unaudited)
The following unaudited pro forma information for the years ended December 31, 2014 , and December 31, 2013 assumes the Par Sterile Acquisition occurred as of January 1, 2013. The pro forma information is not necessarily indicative either of the combined results of operations that actually would have been realized had the acquisition been consummated during the periods for which pro forma information is presented, nor is it intended to be a projection of future results or trends.
| For the Year Ended | ||||||||
| (In thousands, except per share data) | December 31, 2014 |
December 31, 2013 |
||||||
| Total revenues |
$ | 1,327,683 | $ | 1,249,682 | ||||
| Net loss |
$ | (97,444 | ) | $ | (136,599 | ) | ||
| Net loss per basic and diluted share |
$ | (0.13 | ) | $ | (0.19 | ) | ||
|
|
||||||||
These amounts have been calculated after adjusting for the additional expense that would have been recorded assuming the fair value adjustments to long-lived assets ($205.1 million) and inventory ($9.0 million) had been applied on January 1, 2013, and the debt incurred as a result of the Par Sterile Acquisition ($395.0 million) had been outstanding since January 1, 2013, along with the related repricing of the Term Loan Facility (as defined in Note 14—“Debt”), together with the consequential tax effects.
Pro forma loss from continuing operations for the year ended December 31, 2014 was adjusted to exclude $8.2 million of Par Sterile Acquisition-related costs incurred in 2014 with the consequential tax effects. These costs were primarily bank fees, accounting fees, and legal fees. Pro forma loss from continuing operations for the year ended December 31, 2014 was adjusted to include the Par Sterile Acquisition-related costs with the consequential tax effects. Pro forma loss from continuing operations for the years ended December 31, 2014 and 2013 have been adjusted to exclude certain historical amounts such as intangible asset amortization.
Note 4—Acquisition of divested products from the Watson/Actavis Merger:
In connection with the merger of Watson Pharmaceuticals, Inc. and Actavis Group on November 6, 2012 (the “Watson/Actavis Merger”), we acquired the U.S. marketing rights to five generic products that were marketed by Watson or Actavis, as well as eight Abbreviated New Drug Applications (“ANDA”) awaiting regulatory approval, and a generic product in late-stage development, for $110.0 million. We also acquired a number of related supply agreements, each with a term of three years. The purchase price was paid in cash and funded from our cash on hand.
The acquisition was accounted for as a business combination resulting in a bargain purchase under ASC 805. The purchase price of the acquisition was allocated to the assets acquired, with the excess of the fair value of assets acquired over the purchase price recorded as a gain. The bargain purchase was mainly attributed to the FTC-mandated divestiture of products by Watson and Actavis in conjunction with the approval of the related Watson/Actavis Merger.
Note 5—Edict acquisition:
On February 17, 2012, through Par Pharmaceutical, Inc., our wholly-owned subsidiary, we completed our acquisition of privately-held Edict Pharmaceuticals Private Limited, which has been renamed Par Formulations Private Limited (referred to as “Par Formulations”), for cash and our repayment of certain additional pre-close indebtedness (the “Edict Acquisition”). The operating results of Par Formulations were included in our consolidated financial results from the date of acquisition. The operating results were reflected as part of the Par Pharmaceutical segment. We funded the purchase from cash on hand.
F-23
Table of Contents
The addition of Par Formulations broadened our industry expertise and expanded our research & development and manufacturing capabilities. The Edict Acquisition was revalued as part of the business combination accounting for the Merger. Refer to Note 2—“Sky Growth Merger.”
Note 6—Pending acquisitions as of December 31, 2014:
In December 2014, our wholly-owned subsidiary, Par Formulations Private Limited, entered into an agreement to purchase certain assets of privately-held Nuray Chemicals Private Limited (“Nuray”), a Chennai, India based developer and manufacturer of active pharmaceutical ingredients (“API”) for approximately $20.0 million in cash, contingent payments and other consideration. A vice president of the Company is a minority shareholder of Nuray. The assets to be acquired via a definitive agreement consist of a FDA approved facility that manufactures API, including real property, improvements and related assets. The closing of the acquisition is subject to the receipt of applicable regulatory approvals and other customary closing terms and conditions. The acquisition will be accounted for as a business combination under the guidance of ASC 805. The operating results of the acquired business will be included in our consolidated financial results from the date of the closing of the acquisition as part of the Par Pharmaceutical segment. We intend to fund the purchase from cash on hand.
In January 2015, we completed our acquisition of Innoteq, Inc., a privately-held domestic corporation that is engaged in the business of researching, developing and manufacturing transdermal patches and thin film, slow dissolve film, coated/non-woven film and other coated pharmaceutical and consumer products, for approximately $27.0 million.
In January 2015, we acquired Par Biosciences Private Limited (formerly Ethics Bio Lab Private Limited), a clinical research organization located in India for $10.0 million.
The Company will account for these transactions as business combinations using the acquisition method of accounting in accordance with ASC 805, Business Combinations. The Company will provide this information in its Quarterly Report on Form 10-Q for the quarter ended March 31, 2015 for the acquisitions completed in January 2015.
Note 7—Available for sale marketable debt securities:
At December 31, 2014, we had no marketable debt securities. As of December 31, 2013, all of our investments in marketable debt securities were classified as available for sale and, as a result, were reported at their estimated fair values on the condensed consolidated balance sheets. Refer to Note 8—“Fair Value Measurements.”
Available for sale marketable debt securities are generally classified as current on our consolidated balance sheet.
The following is a summary of amortized cost and estimated fair value of our investments in marketable debt securities available for sale at December 31, 2013 ($ in thousands):
| Unrealized | Estimated Fair Value |
|||||||||||||||
| Cost | Gain | (Loss) | ||||||||||||||
| Corporate bonds |
$ | 3,522 | $ | 19 | $ | — | $ | 3,541 | ||||||||
|
|
||||||||||||||||
F-24
Table of Contents
Note 8—Fair value measurements:
ASC 820-10 Fair Value Measurements and Disclosures defines fair value as the price that would be received for an asset or paid to transfer a liability (an exit price) in the principal or most advantageous market for the asset or liability in an orderly transaction between market participants on the measurement date. ASC 820 requires that assets and liabilities carried at fair value be classified and disclosed in one of the following three categories:
| Level 1: | Quoted market prices in active markets for identical assets and liabilities. Active market means a market in which transactions for assets or liabilities occur with “sufficient frequency” and volume to provide pricing information on an ongoing unadjusted basis. Cash equivalents include highly liquid investments with an original maturity of three months or less at acquisition. We have determined that our cash equivalents in their entirety are classified as Level 1 within the fair value hierarchy. | |
| Level 2: | Observable inputs other than Level 1 prices, such as quoted prices for similar assets or liabilities; or other inputs that are observable or can be corroborated by observable market data for substantially the full term of the assets or liabilities. Our Level 2 assets primarily include debt securities, including corporate bonds with quoted prices that are traded less frequently than exchange-traded instruments. All of our Level 2 asset values are determined using a pricing model with inputs that are observable in the market or can be derived principally from or corroborated by observable market data. The pricing model information is provided by third party entities (e.g., banks or brokers). In some instances, these third party entities engage external pricing services to estimate the fair value of these securities. We have a general understanding of the methodologies employed by the pricing services in their pricing models. We corroborate the estimates of non-binding quotes from the third party entities’ pricing services to an independent source that provides quoted market prices from broker or dealer quotations. We investigate large differences, if any. Based on historical differences, we have not been required to adjust quotes provided by the third party entities’ pricing services used in estimating the fair value of these securities. | |
| Level 3: | Unobservable inputs that are not corroborated by market data. | |
Financial assets and liabilities
The fair value of our financial assets and liabilities measured at fair value on a recurring basis as of December 31, 2014 were as follows ($ in thousands):
| Estimated fair value at December 31, 2014 |
Level 1 | Level 2 | Level 3 | |||||||||||||
| (Successor) | ||||||||||||||||
| Cash equivalents |
$ | 100,002 | $ | 100,002 | $ | — | $ | — | ||||||||
| Senior secured term loan (Note 14) |
$ | 1,399,941 | $ | — | $ | 1,399,941 | $ | — | ||||||||
| 7.375% senior notes (Note 14) |
$ | 507,763 | $ | — | $ | 507,763 | $ | — | ||||||||
| Derivative instruments—Interest rate caps (Note 15) |
$ | 5,700 | $ | — | $ | 5,700 | $ | — | ||||||||
|
|
||||||||||||||||
F-25
Table of Contents
The fair value of our financial assets and liabilities measured at fair value on a recurring basis as of December 31, 2013 were as follows ($ in thousands):
| Estimated fair value at December 31, 2013 |
Level 1 | Level 2 | Level 3 | |||||||||||||
| (Successor) | ||||||||||||||||
| Corporate bonds (Note 7) |
$ | 3,541 | $ | — | $ | 3,541 | $ | — | ||||||||
| Cash equivalents |
$ | 66,782 | $ | 66,782 | $ | — | $ | — | ||||||||
| Senior secured term loan (Note 14) |
$ | 1,063,255 | $ | — | $ | 1,063,255 | $ | — | ||||||||
| 7.375% senior notes (Note 14) |
$ | 507,150 | $ | — | $ | 507,150 | $ | — | ||||||||
| Derivative instruments—Interest rate caps (Note 15) |
$ | 1,189 | $ | — | $ | 1,189 | $ | — | ||||||||
|
|
||||||||||||||||
The carrying amount reported in the consolidated balance sheets for accounts receivables, net, inventories, prepaid expenses and other current assets, accounts payable, payables due to distribution agreement partners, accrued salaries and employee benefits, accrued government pricing liabilities, accrued legal settlements, and accrued expenses and other current liabilities approximate fair value because of their short-term nature.
Non-financial assets and liabilities
The Company’s non-financial assets, such as intangible assets and property, plant and equipment are only recorded at fair value if an impairment charge is recognized.
Intangible assets
During the years ended December 31, 2014 and December 31, 2013, we recorded intangible asset impairments totaling $146.9 million and $100.1 million, respectively, as detailed in Note 12—“Intangible Assets, net”. During the period from January 1, 2012 to September 28, 2012 (Predecessor), we abandoned an in-process research and development project that was acquired in the Anchen Acquisition and recorded a corresponding intangible asset impairment of $2.0 million, and we exited the market of a commercial product that was acquired in the Anchen Acquisition and recorded a corresponding intangible asset impairment of $3.7 million.
Derivative instruments—interest rate caps
We use interest rate cap agreements to manage our interest rate risk on our variable rate long-term debt. Refer to Note 15—“Derivative Instruments and Hedging Activities,” for further information.
Note 9—Accounts receivable:
We account for revenue in accordance with ASC 605 “Revenue Recognition”. In accordance with that standard, we recognize revenue for product sales when title and risk of loss have transferred to our customers, when reliable estimates of rebates, chargebacks, returns and other adjustments can be made, and when collectability is reasonably assured. This is generally at the time that products are received by our direct customers. We also review available trade inventory levels at certain large wholesalers to evaluate any potential excess supply levels in relation to expected demand. We determine whether we will recognize revenue at the time that our products are received by our direct customers or defer revenue recognition until a later date on a product by product basis at the time of launch. Upon recognizing revenue from a sale, we record estimates for chargebacks, rebates and incentive programs, product returns, cash discounts and other sales reserves that reduce accounts receivable.
F-26
Table of Contents
The following tables summarize the impact of accounts receivable reserves and allowance for doubtful accounts on the gross trade accounts receivable balances at each balance sheet date ($ in thousands):
| December 31, 2014 |
December 31, 2013 |
|||||||
| (Successor) | (Successor) | |||||||
| Gross trade accounts receivable |
$ | 565,694 | $ | 383,347 | ||||
| Chargebacks |
(96,492 | ) | (48,766 | ) | ||||
| Rebates and incentive programs |
(138,989 | ) | (75,321 | ) | ||||
| Returns |
(84,330 | ) | (78,181 | ) | ||||
| Cash discounts and other |
(86,797 | ) | (37,793 | ) | ||||
| Allowance for doubtful accounts |
(354 | ) | (7 | ) | ||||
|
|
|
|||||||
| Accounts receivable, net |
$ | 158,732 | $ | 143,279 | ||||
|
|
||||||||
Allowance for doubtful accounts
| For the year ended |
For the year ended |
For the period | ||||||||||||||
| December 31, 2014 |
December 31, 2013 |
July 12, 2012 to December 31, 2012 |
January 1, 2012 to September 28, 2012 |
|||||||||||||
| (Successor) | (Successor) | (Successor) | (Predecessor) | |||||||||||||
| Balance at beginning of period |
$ | (7 | ) | $ | — | $ | (100 | ) | $ | (1 | ) | |||||
| Par Sterile opening balance |
(278 | ) | — | — | — | |||||||||||
| Anchen opening balance |
— | — | — | (100 | ) | |||||||||||
| Additions—charge to expense |
(597 | ) | (2 | ) | — | — | ||||||||||
| Adjustments and/or deductions |
528 | (5 | ) | 100 | 1 | |||||||||||
|
|
|
|||||||||||||||
| Balance at end of period |
$ | (354 | ) | $ | (7 | ) | $ | — | $ | (100 | ) | |||||
|
|
||||||||||||||||
The following tables summarize the activity for the years ended December 31, 2014, 2013 and 2012 in the accounts affected by the estimated provisions described below ($ in thousands):
| For the year ended December 31, 2014 | ||||||||||||||||||||||||
| (Successor) | ||||||||||||||||||||||||
| Accounts receivable reserves | Beginning balance |
Par Sterile beginning balance |
Provision recorded for current period sales |
(Provision) reversal recorded for prior period sales |
Credits processed |
Ending balance |
||||||||||||||||||
| Chargebacks |
$ | (48,766 | ) | $ | (6,296 | ) | $ | (871,139 | ) | $ | 2,628 | (1) | $ | 827,081 | $ | (96,492 | ) | |||||||
| Rebates and incentive programs |
(75,321 | ) | (5,489 | ) | (480,949 | ) | — | 422,770 | (138,989 | ) | ||||||||||||||
| Returns |
(78,181 | ) | (4,820 | ) | (31,361 | ) | — | 30,032 | (84,330 | ) | ||||||||||||||
| Cash discounts and other |
(37,793 | ) | (1,792 | ) | (291,153 | ) | (1,449 | )(3) | 245,390 | (86,797 | ) | |||||||||||||
|
|
|
|||||||||||||||||||||||
| Total |
$ | (240,061 | ) | $ | (18,397 | ) | $ | (1,674,602 | ) | $ | 1,179 | $ | 1,525,273 | $ | (406,608 | ) | ||||||||
|
|
|
|||||||||||||||||||||||
| Accrued liabilities(2) |
$ | (35,829 | ) | $ | (382 | ) | $ | (84,840 | ) | $ | 2,805 | (4) | $ | 75,599 | $ | (42,647 | ) | |||||||
|
|
||||||||||||||||||||||||
F-27
Table of Contents
| For the year ended December 31, 2013 | ||||||||||||||||||||||
| (Successor) | ||||||||||||||||||||||
| Accounts receivable reserves | Beginning balance |
Provision recorded for current period sales |
(Provision) reversal recorded for prior period sales |
Credits processed |
Ending balance |
|||||||||||||||||
| Chargebacks |
$ | (41,670 | ) | $ | (630,097 | ) | $ | — | (1) | $ | 623,001 | $ | (48,766 | ) | ||||||||
| Rebates and incentive programs |
(59,426 | ) | (290,934 | ) | 659 | 274,380 | (75,321 | ) | ||||||||||||||
| Returns |
(68,062 | ) | (37,956 | ) | — | 27,837 | (78,181 | ) | ||||||||||||||
| Cash discounts and other |
(26,544 | ) | (195,632 | ) | 1,564 | 182,819 | (37,793 | ) | ||||||||||||||
|
|
|
|||||||||||||||||||||
| Total |
$ | (195,702 | ) | $ | (1,154,619 | ) | $ | 2,223 | $ | 1,108,037 | $ | (240,061 | ) | |||||||||
|
|
|
|||||||||||||||||||||
| Accrued liabilities(2) |
$ | (42,162 | ) | $ | (80,726 | ) | $ | 3,566 | (5) | $ | 83,493 | $ | (35,829 | ) | ||||||||
|
|
||||||||||||||||||||||
| For the period July 12, 2012 to December 31, 2012 | ||||||||||||||||||||||
| (Successor) | ||||||||||||||||||||||
| Accounts receivable reserves | Beginning balance |
Provision recorded for current period sales |
(Provision) reversal recorded for prior period sales |
Credits processed |
Ending balance |
|||||||||||||||||
| Chargebacks |
$ | (24,223 | ) | $ | (132,834 | ) | $ | — | (1) | $ | 115,387 | $ | (41,670 | ) | ||||||||
| Rebates and incentive programs |
(43,866 | ) | (69,749 | ) | — | 54,189 | (59,426 | ) | ||||||||||||||
| Returns |
(64,119 | ) | (8,522 | ) | — | 4,579 | (68,062 | ) | ||||||||||||||
| Cash discounts and other |
(30,817 | ) | (46,053 | ) | — | 50,326 | (26,544 | ) | ||||||||||||||
|
|
|
|
|
|
|
|
|
|
|
|
||||||||||||
| Total |
$ | (163,025 | ) | $ | (257,158 | ) | $ | — | $ | 224,481 | $ | (195,702 | ) | |||||||||
|
|
|
|
|
|
|
|
|
|
|
|
||||||||||||
| Accrued liabilities(2) . |
$ | (42,455 | ) | $ | (24,437 | ) | $ | — | $ | 24,730 | $ | (42,162 | ) | |||||||||
|
|
|
|
|
|
|
|
|
|
|
|
||||||||||||
| For the period January 1, 2012 to September 28, 2012 | ||||||||||||||||||||||
| (Predecessor) | ||||||||||||||||||||||
| Accounts receivable reserves | Beginning balance |
Provision recorded for current period sales |
(Provision) reversal recorded for prior period sales |
Credits processed |
Ending balance |
|||||||||||||||||
| Chargebacks |
$ | (20,688 | ) | $ | (309,411 | ) | $ | — | (1) | $ | 305,876 | $ | (24,223 | ) | ||||||||
| Rebates and incentive programs |
(35,132 | ) | (147,112 | ) | (59 | ) | 138,437 | (43,866 | ) | |||||||||||||
| Returns |
(58,672 | ) | (24,793 | ) | 1,602 | (6) | 17,744 | (64,119 | ) | |||||||||||||
| Cash discounts and other |
(28,672 | ) | (102,718 | ) | (809 | ) | 101,382 | (30,817 | ) | |||||||||||||
|
|
|
|
|
|
|
|
|
|
|
|
||||||||||||
| Total |
$ | (143,164 | ) | $ | (584,034 | ) | $ | 734 | $ | 563,439 | $ | (163,025 | ) | |||||||||
|
|
|
|
|
|
|
|
|
|
|
|
||||||||||||
| Accrued liabilities(2) . |
$ | (39,614 | ) | $ | (49,536 | ) | $ | — | $ | 46,695 | $ | (42,455 | ) | |||||||||
|
|
|
|
|
|
|
|
|
|
|
|
|
|||||||||||
| (1) | Unless specific in nature, the amount of provision or reversal of reserves related to prior periods for chargebacks is not determinable on a product or customer specific basis; however, based upon historical analysis and analysis of activity in subsequent periods, we believe that our chargeback estimates remain reasonable. During the year ended December 31, 2014 (Successor), the Company settled a dispute with a customer resulting in a recovery payment of $3.6 million of which $2.6 million pertained to prior year transactions. |
| (2) | Includes amounts due to indirect customers for which no underlying accounts receivable exists and is principally comprised of Medicaid rebates and rebates due under other U.S. Government pricing programs, such as TriCare and the Department of Veterans Affairs. |
| (3) | During the year ended December 31, 2014, the Company recorded expense of approximately $1.0 million related to a re-procurement claim from one customer for the period September 2012 through October 2012. In addition, we settled post audit claims from customers for the period January 2009 through December 2012 that resulted in net expense of approximately $0.5 million. |
F-28
Table of Contents
| (4) | During 2014, we received further additional information related to Managed Medicaid utilization in California and performed a recalculation of average manufacturer’s price. As a result we reduced our 2014 Medicaid accruals by approximately $3.6 million related to the periods March 2010 through December 2013. This activity was partially offset by the expense of $0.8 million related to disputed TriCare claims for the period from January 2009 through December 2013. Our Medicaid and TriCare accruals represent our best estimate at this time. |
| (5) | During 2013, we received additional information related to Managed Medicaid utilization in California and performed a recalculation of average manufacturer’s price. As a result we reduced our 2013 Medicaid accruals by approximately $3.6 million related to the periods January 2010 through December 2012. Our Medicaid accrual represents our best estimate at this time. |
| (6) | The amount principally represents the resolution of a customer dispute in the first quarter of 2012 regarding invalid deductions taken in prior years of approximately $1.6 million. |
The Company sells its products directly to wholesalers, retail drug store chains, drug distributors, mail order pharmacies and other direct purchasers as well as customers that purchase its products indirectly through the wholesalers, including independent pharmacies, non-warehousing retail drug store chains, managed health care providers and other indirect purchasers. The Company often negotiates product pricing directly with health care providers that purchase products through the Company’s wholesale customers. In those instances, chargeback credits are issued to the wholesaler for the difference between the invoice price paid to the Company by our wholesale customer for a particular product and the negotiated contract price that the wholesaler’s customer pays for that product. The information that the Company considers when establishing its chargeback reserves includes contract and non-contract sales trends, average historical contract pricing, actual price changes, processing time lags and customer inventory information from its three largest wholesale customers. The Company’s chargeback provision and related reserve vary with changes in product mix, changes in customer pricing and changes to estimated wholesaler inventory.
Customer rebates and incentive programs are generally provided to customers as an incentive for the customers to continue carrying the Company’s products or replace competing products in their distribution channels with our products. Rebate programs may be based on either a wholesale or non-wholesale customer’s direct purchases. Rebates may also be based on a non-wholesale customer’s indirect purchases of the Company’s products from a wholesaler under a contract with us. The incentive programs include stocking or trade show promotions where additional discounts may be given on a new product or certain existing products as an added incentive to stock the Company’s products. We may, from time to time, also provide price and/or volume incentives on new products that have multiple competitors and/or on existing products that confront new competition in order to attempt to secure or maintain a certain market share. The information that the Company considers when establishing its rebate and incentive program reserves are rebate agreements with, and purchases by, each customer, tracking and analysis of promotional offers, projected annual sales for customers with annual incentive programs, actual rebates and incentive payments made, processing time lags, and for indirect rebates, the level of inventory in the distribution channel that will be subject to indirect rebates. We do not provide incentives designed to increase shipments to our customers that we believe would result in out-of-the-ordinary course of business inventory for them. The Company regularly reviews and monitors estimated or actual customer inventory information at its three largest wholesale customers for its key products to ascertain whether customer inventories are in excess of ordinary course of business levels.
Pursuant to a drug rebate agreement with the Centers for Medicare and Medicaid Services, TriCare and similar supplemental agreements with various states, the Company provides a rebate on drugs dispensed under such government programs. The Company determines its estimate of the Medicaid rebate accrual primarily based on historical experience of claims submitted by the various states and any new information regarding changes in the Medicaid program that might impact the Company’s provision for Medicaid rebates. In determining the appropriate accrual amount we consider historical payment rates; processing lag for outstanding claims and payments; levels of inventory in the distribution channel; and the impact of the healthcare reform acts. The Company reviews the accrual and assumptions on a quarterly basis against actual claims data to help ensure that the estimates made are reliable. On January 28, 2008, the Fiscal Year 2008 National Defense Authorization Act was enacted, which expands TriCare to include prescription drugs dispensed by TriCare retail network
F-29
Table of Contents
pharmacies. TriCare rebate accruals reflect this program and are based on actual and estimated rebates on Department of Defense eligible sales.
The Company accepts returns of product according to the following criteria: (i) the product returns must be approved by authorized personnel with the lot number and expiration date accompanying any request and (ii) we generally will accept returns of products from any customer and will provide the customer with a credit memo for such returns if such products are returned between 6 months prior to, and 12 months following, such products’ expiration date. The Company records a provision for product returns based on historical experience, including actual rate of expired and damaged in-transit returns, average remaining shelf-lives of products sold, which generally range from 12 to 48 months, and estimated return dates. Additionally, we consider other factors when estimating the current period return provision, including levels of inventory in the distribution channel, significant market changes that may impact future expected returns, and actual product returns, and may record additional provisions for specific returns that we believe are not covered by the historical rates. The Company generally will accept returns of injectable products from any customer and provide the customer with a credit memo for returns if such products are returned between six months prior to and six months following, such products’ expiration date. The Company’s returns policy also states that refrigerated and temperature controlled injectable products are non-returnable.
The Company offers cash discounts to its customers, generally 2% of the sales price, as an incentive for paying within invoice terms, which generally range from 30 to 90 days. The Company accounts for cash discounts by reducing accounts receivable by the full amount of the discounts that we expect our customers to take.
In addition to the significant gross-to-net sales adjustments described above, we periodically make other sales adjustments. The Company generally accounts for these other gross-to-net adjustments by establishing an accrual in the amount equal to its estimate of the adjustments attributable to the sale.
The Company may at its discretion provide price adjustments due to various competitive factors, through shelf-stock adjustments on customers’ existing inventory levels. There are circumstances under which we may not provide price adjustments to certain customers as a matter of business strategy, and consequently may lose future sales volume to competitors and risk a greater level of sales returns on products that remain in the customer’s existing inventory.
As detailed above, we have the experience and access to relevant information that we believe are necessary to reasonably estimate the amounts of such deductions from gross revenues, except as described below. Some of the assumptions we use for certain of our estimates are based on information received from third parties, such as wholesale customer inventories and market data, or other market factors beyond our control. The estimates that are most critical to the establishment of these reserves, and therefore, would have the largest impact if these estimates were not accurate, are estimates related to contract sales volumes, average contract pricing, customer inventories and return volumes. The Company regularly reviews the information related to these estimates and adjusts its reserves accordingly, if and when actual experience differs from previous estimates. With the exception of the product returns allowance, the ending balances of accounts receivable reserves and allowances generally are processed during a two-month to four-month period.
Use of estimates in reserves
We believe that our reserves, allowances and accruals for items that are deducted from gross revenues are reasonable and appropriate based on current facts and circumstances. It is possible however, that other parties applying reasonable judgment to the same facts and circumstances could develop different allowance and accrual amounts for items that are deducted from gross revenues. Additionally, changes in actual experience or changes in other qualitative factors could cause our allowances and accruals to fluctuate, particularly with
F-30
Table of Contents
newly launched or acquired products. We review the rates and amounts in our allowance and accrual estimates on a quarterly basis. If future estimated rates and amounts are significantly greater than those reflected in our recorded reserves, the resulting adjustments to those reserves would decrease our reported net revenues; conversely, if actual product returns, rebates and chargebacks are significantly less than those reflected in our recorded reserves, the resulting adjustments to those reserves would increase our reported net revenues. We regularly review the information related to these estimates and adjust our reserves accordingly, if and when actual experience differs from previous estimates.
As is customary and in the ordinary course of business, our revenue that has been recognized for product launches included initial trade inventory stocking that we believed was commensurate with new product introductions. At the time of each product launch, we were able to make reasonable estimates of product returns, rebates, chargebacks and other sales reserves by using historical experience of similar product launches and significant existing demand for the products.
Note 10—Inventories:
| ($ in thousands) | December 31, 2014 |
December 31, 2013 |
||||||
| (Successor) | (Successor) | |||||||
| Raw materials and supplies |
$ | 60,020 | $ | 44,403 | ||||
| Work-in-process |
26,343 | 9,834 | ||||||
| Finished goods |
68,324 | 63,070 | ||||||
|
|
|
|||||||
| $ | 154,687 | $ | 117,307 | |||||
|
|
||||||||
Inventory write-offs (inclusive of pre-launch inventories detailed below)
| For the year ended | For the year ended | For the period | ||||||||||||||
| ($ in thousands) | December 31, 2014 | December 31, 2013 | July 12, 2012 to December 31, 2012 |
January 1, 2012 to September 28, 2012 |
||||||||||||
| (Successor) | (Successor) | (Successor) | (Predecessor) | |||||||||||||
| Inventory write-offs |
$ | 12,941 | $ | 18,299 | $ | 2,567 | $ | 17,209 | ||||||||
|
|
||||||||||||||||
Par capitalizes inventory costs associated with certain products prior to regulatory approval and product launch, based on management’s judgment of reasonably certain future commercial use and net realizable value, when it is reasonably certain that the pre-launch inventories will be saleable. The determination to capitalize is made once Par (or its third party development partners) has filed an ANDA that has been acknowledged by the FDA as containing sufficient information to allow the FDA to conduct its review in an efficient and timely manner and management is reasonably certain that all regulatory and legal hurdles will be cleared. This determination is based on the particular facts and circumstances relating to the expected FDA approval of the generic drug product being considered, and accordingly, the time frame within which the determination is made varies from product to product. Par could be required to write down previously capitalized costs related to pre-launch inventories upon a change in such judgment, or due to a denial or delay of approval by regulatory bodies, or a delay in commercialization, or other potential factors. As of December 31, 2014, Par had approximately $4.4 million in inventories related to generic products that were not yet available to be sold.
Par Specialty also capitalizes inventory costs associated with in-licensed branded products subsequent to FDA approval but prior to product launch based on management’s judgment of probable future commercial use and net realizable value. We believe that numerous factors must be considered in determining probable future
F-31
Table of Contents
commercial use and net realizable value including, but not limited to, Par Specialty’s limited number of historical product launches, as well as the ability of third party partners to successfully manufacture commercial quantities of product. Par Specialty could be required to expense previously capitalized costs related to pre-launch inventory upon a change in such judgment, due to a delay in commercialization, product expiration dates, projected sales volume, estimated selling price or other potential factors. As of December 31, 2014, Par Specialty had approximately $0.6 million in inventories related to a brand product that was not yet available to be sold.
The amounts in the table below represent inventories related to products that were not yet available to be sold and are also included in the total inventory balances presented above.
Pre-launch inventories
| ($ in thousands) | December 31, 2014 | December 31, 2013 | ||||||
| (Successor) | (Successor) | |||||||
| Raw materials and supplies |
$ | 4,515 | $ | 6,308 | ||||
| Work-in-process |
386 | 93 | ||||||
| Finished goods |
134 | 118 | ||||||
|
|
|
|||||||
| $ | 5,035 | $ | 6,519 | |||||
|
|
||||||||
| For the year ended | For the year ended | For the period | ||||||||||||||
| December 31, 2014 | December 31, 2013 | July 12, 2012 to December 31, 2012 |
January 1, 2012 to September 28, 2012 |
|||||||||||||
| (Successor) | (Successor) | (Successor) | (Predecessor) | |||||||||||||
| Pre-launch inventory write-offs, net of partner allocation |
$ | 4,733 | $ | 2,310 | $ | 1,730 | $ | 10,208 | ||||||||
|
|
||||||||||||||||
Note 11 – Property, plant and equipment, net:
| ($ in thousands) | December 31, 2014 | December 31, 2013 | ||||||
| (Successor) | (Successor) | |||||||
| Land |
$ | 11,063 | $ | 4,553 | ||||
| Buildings |
63,589 | 29,491 | ||||||
| Machinery and equipment |
97,129 | 58,556 | ||||||
| Office equipment, furniture and fixtures |
12,849 | 5,433 | ||||||
| Computer software and hardware |
26,369 | 21,582 | ||||||
| Leasehold improvements |
26,774 | 25,828 | ||||||
| Construction in progress |
37,981 | 12,286 | ||||||
|
|
|
|||||||
| 275,754 | 157,729 | |||||||
| Accumulated depreciation and amortization |
(58,440 | ) | (30,453 | ) | ||||
|
|
|
|||||||
| $ | 217,314 | $ | 127,276 | |||||
|
|
||||||||
Depreciation and amortization expense related to property, plant and equipment
| For the year ended | For the year ended | For the period | ||||||||||||||
| ($ in thousands) | December 31, 2014 |
December 31, 2013 | July 12, 2012 to December 31, 2012 |
January 1, 2012 to September 28, 2012 |
||||||||||||
| (Successor) | (Successor) | (Successor) | (Predecessor) | |||||||||||||
| Depreciation and amortization expense |
$ | 27,837 | $ | 23,323 | $ | 7,547 | $ | 13,230 | ||||||||
|
|
||||||||||||||||
F-32
Table of Contents
Note 12 – Intangible assets, net:
| December 31, 2014 (Successor) | December 31, 2013 (Successor) | |||||||||||||||||||||||
| ($ in thousands) | Cost | Accumulated amortization |
Net | Cost | Accumulated amortization |
Net | ||||||||||||||||||
| Developed products (1) |
$ | 957,166 | $ | (373,602 | ) | $ | 583,564 | $ | 878,607 | $ | (204,218 | ) | $ | 674,389 | ||||||||||
| Other product related royalty streams |
115,600 | (37,334 | ) | 78,266 | 115,600 | (22,709 | ) | 92,891 | ||||||||||||||||
| IPR&D (2) |
351,614 | — | 351,614 | 298,100 | — | 298,100 | ||||||||||||||||||
| Trade names (3) |
27,100 | (118 | ) | 26,982 | 26,400 | — | 26,400 | |||||||||||||||||
| Other |
1,153 | (826 | ) | 327 | 1,000 | (132 | ) | 868 | ||||||||||||||||
|
|
|
|||||||||||||||||||||||
| $ | 1,452,633 | $ | (411,880 | ) | $ | 1,040,753 | $ | 1,319,707 | $ | (227,059 | ) | $ | 1,092,648 | |||||||||||
|
|
||||||||||||||||||||||||
| (1) | Developed products include intangible assets related to commercial products as part of the Merger, subsequently developed IPR&D, products acquired from the Watson/Actavis Merger, and intangible assets related to commercial products as part of the Par Sterile Acquisition. These products are amortized based on its remaining useful life. |
| (2) | IPR&D indefinite-lived assets include IPR&D as part of the Merger, IPR&D acquired from the Watson/Actavis Merger, and IPR&D acquired as part of the Par Sterile Acquisition. |
| (3) | Trade names include Par and Par Sterile Acquisition related trade name. The Par Sterile Acquisition related trade name is being amortized over its useful life, while the Par trade name is treated as an indefinite-lived asset and is not amortized. |
We recorded amortization expense related to intangible assets of approximately $184.8 million for the year ended December 31, 2014 (Successor), $184.3 million for the year ended December 31, 2013 (Successor), $42.8 million for the period July 12, 2012 (inception) to December 31, 2012 (Successor), and $31.2 million for the period January 1, 2012 to September 28, 2012 (Predecessor). After the Merger, amortization expense was included in cost of goods sold.
Intangible asset impairment
During the year ended December 31, 2014, we recorded intangible asset impairments totaling $146.9 million related to an adjustment to the forecasted operating results for two IPR&D intangible asset groups and eight Par Pharmaceutical segment products compared to their originally forecasted operating results at date of acquisition, inclusive of one discontinued product, one partially impaired product primarily due to the contract ending with the partner and a partially impaired IPR&D project from the Par Sterile Acquisition due to an adverse court ruling pertaining to related patent litigation. The estimated fair values of the assets were determined by completing updated discounted cash flow models. During the year ended December 31, 2013, we recorded intangible asset impairments totaling approximately $100.1 million for IPR&D classes of products and projects that were evaluated as part of the annual evaluation of indefinite lived intangible assets, as well as five products not expected to achieve their originally forecasted operating results and we ceased selling a product that had been acquired with the divested products from the Watson/Actavis Merger. During the period from January 1, 2012 to September 28, 2012 (Predecessor), we abandoned an in-process research and development project that was acquired in the Anchen Acquisition and recorded a corresponding intangible asset impairment of $2.0 million, and we exited the market of a commercial product that was acquired in the Anchen Acquisition and recorded a corresponding intangible asset impairment of $3.7 million.
Intangible assets presented in the Successor period are principally comprised of product related assets recognized at fair value in accordance with ASC 805 and are inclusive of assets that had previously been recognized in the Predecessor period and revalued as part of the Merger as well as assets initially recognized in connection with the Merger. Intangible assets presented in the Predecessor period are principally comprised of assets previously recognized at estimated fair value under ASC 805 as well as numerous asset acquisitions and acquisition of product and intellectual property rights recorded at cost. Intangible assets are amortized over
F-33
Table of Contents
the period in which the related cash flows are expected to be generated or on a straight-line basis over the products’ estimated useful life if the estimated cash flows method approximates straight-line basis. We evaluate all intangible assets for impairment whenever events or other changes in circumstances indicate that the carrying value of an asset may no longer be recoverable. Such evaluations utilize forecasted financial information. As of December 31, 2014, we believe our net intangible assets are recoverable. The intangible assets included on our consolidated balance sheet at December 31, 2014 and December 31, 2013 includes the following:
Intangible assets acquired in the Merger
PPCI was acquired on September 28, 2012 through a merger transaction. Refer to Note 2—“Sky Growth Merger” for details of the transaction. As part of the Merger, we revalued intangible assets related to commercial products (developed technology), royalty streams, IPR&D, and our trade name.
The remaining net book value of the related intangible asset related to developed products will be amortized over a weighted average amortization period of approximately five years.
IPR&D is related to R&D projects that were incomplete at the Merger. There are 58 projects associated with IPR&D. Due to the nature of our generic product portfolio pipeline, individual products in the annual IPR&D groups are expected to launch within an annual time period or reasonably close thereto. When the first product of each annual IPR&D group launches, it is our policy to commence amortization of the entire annual group utilizing the related cash flows expected to be generated for the annual group. The remaining net book value of the related intangible asset associated with subsequently developed annual IPR&D groups will be amortized over a weighted average amortization period of approximately seven years.
Trade names constitute intellectual property rights and are marketing-related intangible assets. Our corporate trade name was valued using a relief from royalty method of the income approach and accounted for as an indefinite-lived intangible asset that will be subject to annual impairment testing or whenever events or changes in business circumstances necessitate an evaluation for impairment using a fair value approach.
Intangible assets acquired with the divested products from the Watson/Actavis Merger
On November 6, 2012, we acquired the U.S. marketing rights to five generic products that were currently marketed by Watson or Actavis, as well as eight ANDAs currently awaiting regulatory approval and a generic product in late-stage development, in connection with the merger of Watson and Actavis. Refer to Note 4—“Acquisition of Divested Products from the Watson/Actavis Merger” for details of the transaction.
The remaining net book value of the related intangible asset related to developed products will be amortized over a weighted average amortization period of approximately five years.
IPR&D consists of technology-related intangible assets used in research & development activities, which were incomplete at the time of the acquisition. Upon the successful completion and launch of a product in the group, we will make a separate determination of useful life of the related IPR&D intangible asset and commence amortization.
Intangible assets acquired with the Par Sterile acquisition
On February 20, 2014, we acquired intangible assets as part of the Par Sterile Acquisition. Refer to Note 3—“Par Sterile Acquisition,” for further details. The intangible assets related to commercial products (developed technology), IPR&D, and the JHP trade name.
F-34
Table of Contents
The fair value of the developed technology and in-process research and development intangible assets were estimated using the discounted cash flow method of the income approach. We believe that the level and timing of cash flows appropriately reflect market participant assumptions. Some of the significant assumptions inherent in the development of the identifiable intangible asset valuations, from the perspective of a market participant, include the estimated net cash flows by year by project or product (including net revenues, costs of sales, research and development costs, selling and marketing costs and other charges), the appropriate discount rate to select in order to measure the risk inherent in each future cash flow stream, the assessment of each asset’s life cycle, competitive trends impacting the asset and each cash flow stream, and other factors.
Developed products are defined as products that are commercialized, all research and development efforts have been completed by the seller, and final regulatory approvals have been received. The developed product intangible assets are composite assets, comprising the market position of the product, the developed technology utilized, and the customer base to which the products are sold. Developed technology and the customer base were considered but have not been identified separately as any related cash flows would be very much intertwined with the product related intangibles. Developed products held by the Company are considered separable from the business as they could be sold to a third party. Developed products were valued using a multi-period excess earnings method under the income approach. The principle behind this method is that the value of the intangible asset is equal to the present value of the after-tax cash flows attributable to the intangible asset only. The remaining net book value of the related intangible asset related to developed products will be amortized over a weighted average amortization period of approximately nine years.
IPR&D is related to research & development projects that were incomplete at the time of the Par Sterile Acquisition. We grouped and valued IPR&D based on the projected year of launch for each group, with the exception of one project that was expected to produce large cash flows in the future and we valued this project by itself. IPR&D is considered separable from the business as it could be sold to a third party. The value of IPR&D was accounted for as an indefinite-lived intangible asset and will be subject to impairment testing until the completion or abandonment of each group. Upon the successful completion and launch of a product in a group, we will make a separate determination of useful life of the IPR&D intangible asset and commence amortization. This methodology resulted in six groups of IPR&D (2014 through 2018 plus a group with a single IPR&D project). When the first product of each IPR&D group launches, it is our policy to commence amortization of the entire group utilizing the related cash flows expected to be generated for the group. Due to the nature of our generic injectable product portfolio pipeline, individual products in the IPR&D groups are expected to launch within an annual time period or reasonably close thereto.
Trade names constitute intellectual property rights and are marketing-related intangible assets. The related trade name was valued using a relief from royalty method of the income approach and accounted for with a five year useful life based on expected utility. This asset will be subject to impairment testing whenever events or changes in business circumstances necessitate an evaluation for impairment using a fair value approach.
F-35
Table of Contents
Estimated amortization expense for existing intangible assets at December 31, 2014
The following table does not include estimated amortization expense for future milestone payments that may be paid and result in the creation of intangible assets after December 31, 2014 and assumes the intangible asset related to the Par trade name as an indefinite lived asset will not be amortized in the future.
| ($ in thousands) | Estimated amortization expense |
|||
| 2015 |
$ | 155,188 | ||
| 2016 |
150,649 | |||
| 2017 |
170,569 | |||
| 2018 |
135,113 | |||
| 2019 |
112,770 | |||
| 2020 and thereafter |
290,064 | |||
|
|
|
|||
| $ | 1,014,353 | |||
|
|
||||
Note 13—Goodwill:
| ($ in thousands) | December 31, 2014 | December 31, 2013 | ||||||
| (Successor) | (Successor) | |||||||
| Balance at beginning of period |
$ | 855,726 | $ | 856,726 | ||||
| Additions: |
||||||||
| Par Sterile Acquisition (1) |
156,382 | — | ||||||
| Deductions: |
||||||||
| Finalization of purchase accounting (2) |
— | (1,000 | ) | |||||
|
|
|
|||||||
| Balance at end of period |
$ | 1,012,108 | $ | 855,726 | ||||
|
|
||||||||
| (1) | As noted in Note 3 -“Par Sterile Acquisition,” we acquired Par Sterile as of February 20, 2014. Based upon our purchase price allocation, we recorded $156.4 million of incremental goodwill. This goodwill was allocated to Par. |
| (2) | As noted in Note 2—“Sky Growth Merger,” PPCI was acquired through the Merger. Based upon purchase price allocation in accordance with ASC 350-20-35-30, we recorded goodwill, which was allocated to Par. |
Goodwill is not being amortized, but is tested at least annually, on or about October 1st or whenever events or changes in business circumstances necessitate an evaluation for impairment using a fair value approach. The goodwill impairment test consists of a two-step process. The first step is to identify a potential impairment and the second step measures the amount of impairment, if any. We performed a qualitative assessment (“Step Zero analysis”) to determine whether it is necessary to perform the two-step goodwill impairment test as of October 1, 2014. The Step Zero analysis entailed an assessment of the totality of events and circumstances that could affect the comparison of our reporting unit’s fair value with its carrying amount. Goodwill is deemed to be impaired if the carrying amount of a reporting unit exceeds its estimated fair value. As of October 1, 2014, the Company performed its annual goodwill impairment assessment via the Step Zero analysis and concluded that it was not necessary to perform the two-step goodwill impairment test and that there was no impairment. No impairment of goodwill had been recognized through December 31, 2014.
F-36
Table of Contents
Note 14—Debt:
| ($ in thousands) | December 31, 2014 | December 31, 2013 | ||||||
| (Successor) | (Successor) | |||||||
| Senior secured term loan |
$ | 1,435,837 | $ | 1,055,340 | ||||
| Senior secured revolving credit facility |
— | — | ||||||
| 7.375% senior notes |
490,000 | 490,000 | ||||||
|
|
|
|||||||
| 1,925,837 | 1,545,340 | |||||||
| Less unamortized debt discount to senior secured term loan |
(7,265 | ) | (7,821 | ) | ||||
| Less current portion |
(14,503 | ) | (21,462 | ) | ||||
|
|
|
|||||||
| Long-term debt |
$ | 1,904,069 | $ | 1,516,057 | ||||
|
|
||||||||
Senior credit facilities
In connection with the Merger, on September 28, 2012, we entered into a credit agreement (the “Credit Agreement”) with a syndicate of banks, led by Bank of America, N.A., as Administrative Agent, Bank of America, N.A., Deutsche Bank Securities Inc., Goldman Sachs Bank USA, Citigroup Global Markets, Inc., RBC Capital Markets LLC and BMO Capital Markets Corp. as Joint Lead Arrangers and Joint Lead Bookrunners, Deutsche Bank Securities Inc. and Goldman Sachs Bank USA as Co-Syndication Agents, and Citigroup Global Markets Inc. and RBC Capital Markets LLC as Co-Documentation Agents, to provide senior credit facilities comprised of a seven-year senior secured term loan in an initial aggregate principal amount of $1,055.0 million (the “Term Loan Facility”) and a five-year senior secured revolving credit facility in an initial amount of $150.0 million (the “Revolving Facility” and together with the Term Loan Facility, the “Senior Credit Facilities”). The proceeds of the Revolving Facility are available for general corporate purposes.
The Credit Agreement contains customary representations and warranties, as well as customary events of default, in certain cases subject to reasonable and customary periods to cure, including but not limited to: failure to make payments when due, breach of covenants, breach of representations and warranties, insolvency proceedings, certain judgments and any change of control. The Credit Agreement also contains various customary covenants that, in certain instances, restrict our ability to: (i) create liens on assets; (ii) incur additional indebtedness; (iii) engage in mergers or consolidations with or into other companies; (iv) engage in dispositions of assets, including entering into a sale and leaseback transaction; (v) pay dividends and distributions or repurchase capital stock; (vi) make investments, loans, guarantees or advances in or to other companies; (vii) change the nature of our business; (viii) repay or redeem certain junior indebtedness, (ix) engage in transactions with affiliates; and (x) enter into restrictive agreements. In addition, the Credit Agreement requires us to demonstrate compliance with a maximum senior secured first lien leverage ratio whenever amounts are outstanding under the revolving credit facility as of the last day of any quarterly testing period. All obligations under the Credit Agreement are guaranteed by our material domestic subsidiaries. We were in compliance with all applicable covenants as of December 31, 2014.
The Credit Agreement includes an accordion feature pursuant to which we may increase the amount available to be borrowed by up to an additional $250.0 million (or a greater amount if we meet certain specified financial ratios) under certain circumstances. Repayments of the proceeds of the term loan are due in quarterly installments over the term of the Credit Agreement. Amounts borrowed under the Revolving Facility are payable in full upon expiration of the Credit Agreement. We are also obligated to pay a commitment fee based on the unused portion of the Revolving Facility.
We are obligated to make mandatory principal prepayments for any fiscal year if the ratio of total amount of outstanding senior secured term loan less cash and cash equivalents divided by our consolidated EBITDA is
F-37
Table of Contents
greater than 2.50 to 1.00 as of December 31 of any fiscal year. When the ratio is greater than 2.50 to 1.00 but less than or equal to 3.00 to 1.00, we are required to pay 25% of excess cash flows, as defined in the Credit Agreement. When the ratio is greater than 3.00 to 1.00, we are required to pay 50% of excess cash flows in the form of principal prepayments. For the year ended December 31, 2013, we were obligated to pay $10.8 million of principal prepayments during the first quarter of 2014. However, certain Term Lenders exercised their right under the Credit Agreement to decline their pro rata share of the mandatory principal prepayment. Therefore our actual mandatory principal prepayment in the first quarter of 2014 was $5.0 million. As permitted under the Credit Agreement, we applied this mandatory principal prepayment amount against scheduled principal payments for the second and third quarters of 2014. As of December 31, 2014 we were not obligated to make any mandatory principal prepayments.
Repricing of the term loan facility and additional borrowings—2014
On February 20, 2014, in conjunction with our acquisition of Par Sterile, we entered into an amendment to our Senior Credit Facility that refinanced all of the outstanding tranche B-1 term loans of the Borrower (the “Existing Tranche B Term Loans”) with a new tranche of tranche B-2 term loans (the “New Tranche B Term Loans”) in an aggregate principal amount of $1,055.0 million. The terms of the New Tranche B Term Loans are substantially the same as the terms of the then Existing Tranche B Term Loans, except that (1) the interest rate margins applicable to the New Tranche B Term Loans are 3.00% for LIBOR and 2.00% for base rate, a 25 basis point reduction compared to the Existing Tranche B Term Loans, and (2) the New Tranche B Loans were subject to a soft call provision applicable to the optional prepayment of the loans which would have required a premium equal to 1.00% of the aggregate principal amount of the loans being prepaid if, on or prior to August 20, 2014, the Company entered into certain repricing transactions. Additionally, the maximum senior secured net leverage ratio in compliance with which the Company can incur new incremental debt was increased by 25 basis points to 3.75:1.00.
Additionally, on February 20, 2014, in conjunction with our acquisition of Par Sterile, we also entered into the Incremental Term B-2 Joinder Agreement (the “Joinder”) among us, Holdings, and certain of our subsidiaries, and our lenders. Under the terms of the Joinder, PPCI borrowed an additional $395.0 million of New Tranche B Term Loans from the lenders participating therein for the purpose of consummating our acquisition of Par Sterile.
In connection with the transactions described herein, we incurred related transaction costs for the quarter ended March 31, 2014 that totaled $12.4 million of which $8.2 million representing acquisition and financing transaction costs were included in operating expenses as selling, general and administrative on the consolidated statements of operations and $4.1 million were capitalized as deferred financing costs or debt discount on the consolidated balance sheet. In accordance with the applicable accounting guidance for debt modifications and extinguishments, approximately $4.0 million of the existing unamortized deferred financing costs were written off in connection with this repricing and included in the consolidated statements of operations as a loss on debt extinguishment.
Refinancing of the term loan facility—2013
On February 6, 2013, the Company, Par Pharmaceutical, Inc., as co-borrower, Sky Growth Intermediate Holdings II Corporation (“Intermediate Holdings”), the subsidiary guarantor party thereto, Bank of America, as administrative agent, and the lenders and other parties thereto modified the Term Loan Facility (as amended, the “New Term Loan Facility”) by entering into Amendment No. 1 (“Amendment No. 1”) to the Credit Agreement.
Amendment No. 1 replaced the existing term loans with a new class of term loans in an aggregate principal amount of $1,066.0 million (the “New Term Loans”). Borrowings under the New Term Loan Facility bore
F-38
Table of Contents
interest at a rate per annum equal to an applicable margin plus, at the Company’s option, either LIBOR (which is subject to a 1.00% floor) or the base rate (which is subject to a 2.00% floor). The applicable margin for borrowings under the New Term Loans was 3.25% for LIBOR borrowings and 2.25% for base rate borrowings. Amendment No. 1 provided for a soft call option applicable to the New Term Loans. The soft call option provided for a premium equal to 1.00% of the amount of the outstanding principal if, on or prior to August 6, 2013, PPCI entered into certain repricing transactions. The other terms applicable to the New Term Loans were substantially the same terms as the original term loans.
In connection with the transactions described herein, PPCI paid a 1.00% soft call premium in an aggregate amount of approximately $10.5 million on the existing term loan in February 2013, a portion of which was capitalized as a discount to the New Term Loan Facility. In accordance with the applicable accounting guidance for debt modifications and extinguishments, approximately $5.9 million of the existing unamortized deferred financing costs and $1.4 million of the related $10.5 million soft call premium were written off in connection with this refinancing and included in the consolidated statements of operations as a loss on debt extinguishment.
Repricing of the revolving facility—2013
The Company and Par Pharmaceutical, Inc., as co-borrower, Intermediate Holdings, the subsidiary guarantor party thereto, Bank of America, as administrative agent, and the lenders and other parties thereto modified the Revolving Credit Facility by entering into Amendment No. 2 (“Amendment No. 2”), dated February 22, 2013, and Amendment No. 3 (“Amendment No. 3” and, together with Amendment No. 2, the “Revolver Amendments”), dated February 28, 2013, to the Credit Agreement.
The Revolver Amendments extend the scheduled maturity of the revolving credit commitments of certain existing lenders (the “Extending Lenders”) who have elected to do so, such extension to be effected by converting such amount of the existing revolving credit commitments of the Extending Lenders into a new tranche of revolving credit commitments (the “Extended Revolving Facility”) that will mature on December 28, 2017. The Revolver Amendments also set forth the interest rate payable on borrowings outstanding under the Extended Revolving Facility, as described below. The aggregate commitments under the Extended Revolving Facility are $127.5 million and the aggregate commitments under the non-extended portion of the Revolving Facility are $22.5 million. There were no outstanding borrowings from the Revolving Facility or the Extended Revolving Facility as of December 31, 2014.
Borrowings under both the non-extended portion of the Revolving Facility and the Extended Revolving Facility bear interest at a rate per annum equal to an applicable margin plus, at the Company’s option, either LIBOR or the base rate. The initial applicable margin for borrowings under the Extended Revolving Facility is 3.25% for LIBOR borrowings and 2.25% for base rate borrowings. The initial applicable margin for LIBOR and base rate borrowings under the non-extended portion of the Revolving Facility remain at 3.75% and 2.75%, respectively. Borrowings and repayments of loans under the Extended Revolving Facility and the non-extended portion of the Revolving Facility may be made on a non-pro rata basis with one another, and the commitments under the non-extended portion of the Revolving Facility may be terminated prior to the commitments under the Extended Revolving Credit Facility. The other terms applicable to the Extended Revolving Credit Facility are substantially identical to those of the Revolving Credit Facility.
7.375% senior notes
In connection with the Merger, on September 28, 2012, we issued $490.0 million aggregate principal amount of 7.375% senior notes due 2020 (the “Notes”). The Notes were issued pursuant to an indenture entered into as of
F-39
Table of Contents
the same date between the Company and Wells Fargo Bank, National Association, as trustee. Interest on the Notes is payable semi-annually on April 15 and October 15, commencing on April 15, 2013. The Notes mature on October 15, 2020.
We may redeem the Notes at our option, in whole or in part on one or more occasions, at any time on or after October 15, 2015, at specified redemption prices that vary by year, together with accrued and unpaid interest, if any, to the date of redemption. At any time prior to October 15, 2015, we may redeem up to 40% of the aggregate principal amount of the Notes with the net proceeds of certain equity offerings at a redemption price equal to the sum of (i) 107.375% of the aggregate principal amount thereof, plus (ii) accrued and unpaid interest, if any, to the redemption date. At any time prior to October 15, 2015, we may also redeem the Notes, in whole or in part on one or more occasions, at a price equal to 100% of the principal amount of the Notes, plus accrued and unpaid interest and a specified “make-whole premium.”
The Notes are guaranteed on a senior unsecured basis by our material existing direct and indirect wholly-owned domestic subsidiaries and, subject to certain exceptions, each of our future direct and indirect domestic subsidiaries that guarantees the Senior Credit Facilities or our other indebtedness or indebtedness of the guarantors will guarantee the Notes. Under certain circumstances, the subsidiary guarantors may be released from their guarantees without consent of the holders of Notes.
The Notes and the subsidiary guarantees will be our and the guarantors’ senior unsecured obligations and will (i) rank senior in right of payment to all of our and the subsidiary guarantors’ existing and future subordinated indebtedness; (ii) rank equally in right of payment with all of our and the subsidiary guarantors’ existing and future senior indebtedness; (iii) be effectively subordinated to any of our and the subsidiary guarantors’ existing and future secured debt, to the extent of the value of the assets securing such debt; and (iv) be structurally subordinated to all of the existing and future liabilities (including trade payables) of each of our subsidiaries that do not guarantee the Notes.
The indenture governing the Notes contains customary representations and warranties, as well as customary events of default, in certain cases subject to reasonable and customary periods to cure, including but not limited to: failure to make payments when due, breach of covenants, a payment default or acceleration equaling $40.0 million or more according to the terms of certain other indebtedness, failure to pay final judgments aggregating in excess of $40.0 million when due, insolvency proceedings, a required guarantee shall cease to remain in full force. The indenture also contains various customary covenants that, in certain instances, restrict our ability to: (i) pay dividends and distributions or repurchase capital stock; (ii) incur additional indebtedness; (iii) make investments, loans, guarantees or advances in or to other companies; (iv) engage in dispositions of assets, including entering into a sale and leaseback transaction; (v) engage in transactions with affiliates; (vi) create liens on assets; (vii) redeem or repay certain subordinated indebtedness, (viii) engage in mergers or consolidations with or into other companies; and (ix) change the nature of our business. The covenants are subject to a number of exceptions and qualifications. Certain of these covenants will be suspended during any period of time that (1) the Notes have Investment Grade Ratings (as defined in the indenture) from both Moody’s Investors Service, Inc. and Standard & Poor’s, and (2) no default has occurred and is continuing under the indenture. In the event that the Notes are downgraded to below an Investment Grade Rating, the Company and certain subsidiaries will again be subject to the suspended covenants with respect to future events. We were in compliance with all covenants as of December 31, 2014.
F-40
Table of Contents
We incurred interest expense of $108.4 million in 2014 (Successor) and $95.5 million in 2013 (Successor). During the period from July 12, 2012 (inception) to December 31, 2012 (Successor), we incurred interest expense of $26.0 million, and during the period from January 1, 2012 to September 28, 2012 (Predecessor), we incurred interest expense of $9.2 million.
| Debt Maturities as of December 31, 2014 | ($ in thousands) | |||
| 2015 |
$ | 14,503 | ||
| 2016 |
14,503 | |||
| 2017 |
14,503 | |||
| 2018 |
14,503 | |||
| 2019 |
1,377,825 | |||
| 2020 |
490,000 | |||
|
|
||||
| Total debt at December 31, 2014 |
$ | 1,925,837 | ||
|
|
||||
The fair value of the senior secured credit term loan was estimated to be approximately $1,399.9 million at December 31, 2014 (level 2 inputs) as compared to the face value of $1,435.8 million. The fair value of the Notes was estimated to be approximately $507.8 million at December 31, 2014 (level 2 inputs) as compared to their face value of $490.0 million.
Note 15—Derivative instruments and hedging activities
Risk management objective of using derivatives
We are exposed to certain risks arising from global economic conditions. We manage economic risks, including interest rate risk primarily through the use of derivative financial instruments. All derivatives are carried at fair value on our consolidated balance sheets. We do not enter into speculative derivatives. Specifically, we enter into derivative financial instruments to manage exposures that arise from payment of future known and uncertain cash amounts related to our borrowings, the value of which are determined by LIBOR interest rates. We may net settle any of our derivative positions under agreements with our counterparty, when applicable.
Cash flow hedges of interest rate risk via interest rate caps
Our objective in using interest rate derivatives is to add certainty to interest expense amounts and to manage our exposure to interest rate movements, specifically to protect us from variability in cash flows attributable to changes in LIBOR interest rates. To accomplish this objective, we primarily use interest rate caps as part of our interest rate risk management strategy. Interest rate caps designated as cash flow hedges involve the receipt of variable-rate amounts from a counterparty if LIBOR exceeds the strike rate in exchange for the Company making fixed-rate payments over the life of the agreements without exchange of the underlying notional amount. We entered into such derivatives to hedge the variable cash flows associated with existing variable-rate debt under our Credit Agreement. We assess effectiveness and the effective portion of changes in the fair value of derivatives designated and qualified as cash flow hedges for financial reporting purposes is recorded in “Accumulated other comprehensive loss” on our consolidated balance sheet and will be subsequently reclassified into earnings in the period that the hedged forecasted transaction affects earnings. Any ineffective portion of the change in fair value of the derivatives would be recognized directly in earnings.
Interest rate caps
As of December 31, 2014, we had eight outstanding interest rate caps with two counterparties with various termination dates and notional amounts, which we deemed to be effective for accounting purposes. The
F-41
Table of Contents
derivatives had a combined notional value of $750.0 million, all with effective dates as of either September 30, 2013 or 2014 and with termination dates each September 30th beginning in 2015 and ending in 2018. Consistent with the terms of the Credit Agreement, the interest rate caps have a strike of 1% which matches the LIBOR floor of 1.0% on the debt. The premium is deferred and paid over the life of the instrument. The effective annual interest rate related to these interest rate caps was a fixed weighted average rate of approximately 4.8% at December 31, 2014. These instruments are designated for accounting purposes as cash flow hedges of interest rate risk related to our Credit Agreement. In addition, amounts reported in “Accumulated other comprehensive loss” on our consolidated balance sheet related to derivatives will be reclassified to interest expense as interest payments are made on our variable-rate debt under the Credit Agreement. Approximately 35% of our total outstanding debt at December 31, 2014 remains subject to variability in cash flows attributable to changes in LIBOR interest rates. During the next twelve months, we estimate that $5.8 million will be reclassified from “Accumulated other comprehensive loss” on our consolidated balance sheet at December 31, 2014 to interest expense.
Fair value
As of the effective date, we designated the interest rate swap agreements as cash flow hedges. As cash flow hedges, unrealized gains are recognized as assets while unrealized losses are recognized as liabilities. The interest rate swap agreements are highly correlated to the changes in LIBOR interest rates. The effective portion of such gains or losses is recorded as a component of accumulated other comprehensive income or loss, while the ineffective portion of such gains or losses will be recorded as a component of interest expense. As of December 31, 2014, we recorded $5.7 million (or $3.6 million, net of tax) as part of “Accumulated other comprehensive loss” on our consolidated balance sheet. Future realized gains and losses in connection with each required interest payment will be reclassified from Accumulated other comprehensive loss to interest expense.
We elected to use the income approach to value the derivatives, using observable Level 2 market expectations at each measurement date and standard valuation techniques to convert future amounts to a single present amount (discounted) assuming that participants are motivated, but not compelled to transact. Level 2 inputs for the cap valuations are limited to quoted prices for similar assets or liabilities in active markets (specifically futures contracts) and inputs other than quoted prices that are observable for the asset or liability (specifically LIBOR cash and swap rates, volatility and credit risk at commonly quoted intervals). Mid-market pricing is used as a practical expedient for fair value measurements. Key inputs for valuation models include the cash rates, futures rates, swap rates, credit rates and interest rate volatilities. Reset rates, discount rates and volatilities are interpolated from these market inputs to calculate cash flows as well as to discount those future cash flows to present value at each measurement date. Refer to Note 8 for additional information regarding fair value measurements.
F-42
Table of Contents
The fair value of our derivative instruments measured as outlined above as of December 31, 2014 was as follows:
| ($ in thousands) Description |
December 31, 2014 |
Quoted prices level 1 |
Significant other observable inputs level 2 |
Significant other unobservable inputs level 3 |
||||||||||||
| ASSETS |
||||||||||||||||
| Current Assets |
||||||||||||||||
| Derivatives |
$ | — | $ | — | $ | — | $ | — | ||||||||
|
|
|
|||||||||||||||
| $ | — | $ | — | $ | — | $ | — | |||||||||
|
|
|
|||||||||||||||
| LIABILITIES |
||||||||||||||||
| Current Liabilities |
||||||||||||||||
| Derivatives |
$ | (5,700 | ) | $ | — | $ | (5,700 | ) | $ | — | ||||||
|
|
|
|||||||||||||||
| $ | (5,700 | ) | $ | — | $ | (5,700 | ) | $ | — | |||||||
|
|
||||||||||||||||
The following table summarizes the fair value and presentation in our consolidated balance sheets for derivative instruments as of December 31, 2014 and 2013:
| Asset derivatives | Liability derivatives |
|||||||||||||||||||
| Balance sheet location |
December 31, 2014 |
December 31, 2013 |
Balance
sheet |
December 31, 2014 |
December 31, 2013 |
|||||||||||||||
| ($ in thousands) | Fair value | Fair value | Fair value | Fair value | ||||||||||||||||
| Derivatives designated as hedging instruments under ASC 815 |
||||||||||||||||||||
| Interest rate cap contracts |
— | — | Other Current Liabilities | $ | (5,763 | ) | (4,002 | ) | ||||||||||||
| Interest rate cap contracts |
— | — | Other Non-Current Liabilities | $ | (138 | ) | — | |||||||||||||
| Interest rate cap contracts |
— | — | Other Assets | 201 | 2,813 | |||||||||||||||
|
|
|
|
|
|||||||||||||||||
| Total derivatives designated as hedging instruments under ASC 815 |
— | — | $ | (5,700 | ) | $ | (1,189 | ) | ||||||||||||
|
|
|
|
|
|||||||||||||||||
| Total derivatives |
— | — | $ | (5,700 | ) | $ | (1,189 | ) | ||||||||||||
|
|
||||||||||||||||||||
F-43
Table of Contents
The following tables summarize our eight interest cap agreements with a two counterparties. We separately record the short-term and long-term portion of our derivatives. As of December 31, 2014 each agreement represented a net liability for us and none of our interest cap agreements represented a net asset:
| ($ in thousands) | Offsetting of derivative liabilities as of December 31, 2014 | |||||||||||||||||||||||
| Gross amounts not offset in the statement of financial position |
||||||||||||||||||||||||
| Description | Gross amounts of recognized liabilities |
Gross amounts offset in the statement of financial position |
Net amounts of liabilities presented in the statement of financial position |
Financial instruments |
Cash collateral pledged |
Net amount |
||||||||||||||||||
| Derivatives by counterparty |
||||||||||||||||||||||||
| Counterparty 1 |
$ | (3,820 | ) | $ | (143 | ) | $ | (3,963 | ) | $ | 143 | $ | — | $ | (3,820 | ) | ||||||||
| Counterparty 2 |
(1,880 | ) | (58 | ) | (1,938 | ) | 58 | — | (1,880 | ) | ||||||||||||||
|
|
|
|||||||||||||||||||||||
| Total |
$ | (5,700 | ) | $ | (201 | ) | $ | (5,901 | ) | $ | 201 | $ | — | $ | (5,700 | ) | ||||||||
|
|
||||||||||||||||||||||||
| ($ in thousands) | Offsetting of derivative assets as of December 31, 2014 | |||||||||||||||||||||||
| Gross amounts not offset in the statement of financial position |
||||||||||||||||||||||||
| Description | Gross amounts of recognized assets |
Gross amounts offset in the statement of financial position |
Net amounts of assets presented in the statement of financial position |
Financial instruments |
Cash collateral pledged |
Net amount |
||||||||||||||||||
| Derivatives by counterparty |
||||||||||||||||||||||||
| Counterparty 1 |
$ | — | $ | 143 | $ | 143 | $ | (143 | ) | $ | — | $ | — | |||||||||||
| Counterparty 2 |
— | 58 | 58 | (58 | ) | — | — | |||||||||||||||||
|
|
|
|||||||||||||||||||||||
| Total |
$ | — | $ | 201 | $ | 201 | $ | (201 | ) | $ | — | $ | — | |||||||||||
|
|
||||||||||||||||||||||||
The following table summarizes information about the fair values of our derivative instruments on the condensed consolidated statements of other comprehensive loss for the years ended December 31, 2014 and December 31, 2013 (Pre-tax):
| For the year ended | ||||||||
| December 31, 2014 | December 31, 2013 | |||||||
| Other Comprehensive Loss Rollforward: |
||||||||
| Beginning Balance Loss (Pre-tax) |
$ | (1,189 | ) | $ | — | |||
| Amount Recognized in Other Comprehensive Loss on Derivative |
(9,007 | ) | (2,203 | ) | ||||
| Amount Reclassified from Other Comprehensive Loss into Interest Expense (Pre-tax) |
4,496 | 1,014 | ||||||
|
|
|
|||||||
| Ending Balance Loss (Pre-tax) |
$ | (5,700 | ) | $ | (1,189 | ) | ||
|
|
||||||||
F-44
Table of Contents
The following table summarizes the effect and presentation of derivative instruments, including the effective portion or ineffective portion of our cash flow hedges, on the consolidated statements of operations for the periods ending December 31, 2014 and 2013:
| The effect of derivative instruments on the statement of financial performance | ||||||||||||||||||||||||||||||
| ($ in thousands) | For the year ended December 31, 2014 and December 31, 2013 | |||||||||||||||||||||||||||||
| Derivatives in ASC 815 cash flow hedging relationships |
Amount of gain or (loss) recognized in other comprehensive income (loss) on derivative (effective portion) |
Location of gain or (loss) reclassified from accumulated other comprehensive income (loss) into income (loss) (effective portion) |
Amount of gain or (loss) reclassified from accumulated other comprehensive income into income (loss) (effective portion) |
Location of gain or (loss) recognized in income (loss) on derivative (ineffective portion) |
Amount of gain or (loss) recognized in income on derivative (ineffective portion) |
|||||||||||||||||||||||||
| 2014 | 2013 | 2014 | 2013 | 2014 | 2013 | |||||||||||||||||||||||||
| Interest rate cap contracts |
$ | (9,007 | ) | (2,203 | ) | Interest Expense | $ | (4,496 | ) | (1,014 | ) | Interest Expense | $ | — | — | |||||||||||||||
|
|
|
|
|
|
|
|||||||||||||||||||||||||
| Total |
$ | (9,007 | ) | (2,203 | ) | $ | (4,496 | ) | (1,014 | ) | $ | — | $ | — | ||||||||||||||||
|
|
||||||||||||||||||||||||||||||
Note 16—Guarantor and non-guarantor narrative disclosure:
PPCI is the sole issuer of the Notes. The Notes are guaranteed on a senior unsecured basis by PPCI’s material direct and indirect wholly-owned domestic subsidiaries. The guarantees are full and unconditional and joint and several. PPCI has no independent assets or operations. Each of the subsidiary guarantors is 100% owned by PPCI and all its non-guarantor subsidiaries are minor subsidiaries.
Note 17—Share-based compensation:
We account for share-based compensation as required by FASB ASC 718-10 Compensation—Stock Compensation (“ASC 718”), which requires companies to recognize compensation expense in the amount equal to the fair value of all share-based payments granted to employees. Under ASC 718-10, we recognize share-based compensation ratably over the service period applicable to the award. ASC 718-10 also requires that excess tax benefits be reflected as financing cash flows.
On May 9, 2014 and June 13, 2014, in view of the limited number of shares remaining in the Sky Growth Holdings Corporation 2012 Equity Incentive Plan (the “Plan”) and in order to enhance the Company’s ability to retain employees and to increase the mutuality of interests between employees and stockholders, the Board of Directors of Holdings amended the Plan to increase the maximum number of shares of Holdings common stock, $0.001 par value per share (the “Stock”) that may be delivered in satisfaction of, or may underlie, awards under the Plan, including stock options (the “Pool”), by 8,750,000 shares of Stock. At December 31, 2014, approximately 4,082,000 total shares of Stock were available for future issuances from the Pool.
Successor share-based compensation
Stock options
In conjunction with the Merger, certain senior level employees of PPCI were granted stock options in Holdings, effectively granted as of September 28, 2012, under the terms of the Sky Growth Holdings Corporation 2012 Equity Incentive Plan. The share-based compensation expense relating to awards to those persons has been pushed down from Holdings to PPCI.
F-45
Table of Contents
Each optionee received 2 equal tranches of stock options. Tranche 1 options vest based upon continued employment over a five year period, ratably 20% each annual period. Our policy is to recognize expense for this type of award on a straight-line basis over the requisite service period for the entire award (5 years). Tranche 2 options vest based upon continued employment and the company achieving specified annual or bi-annual EBITDA targets. Compensation expense will be recognized on a graded vesting schedule. In circumstances where the specified annual or bi-annual EBITDA targets are not met, Tranche 2 options may also vest in amounts of either 50% or 100% of the original award in the event of a initial public offering or other sale of the company to a third party buyer (a market condition) that returns a specified level of proceeds calculated as a multiple of the original equity invested in the Company as of September 28, 2012.
We granted a member of the Board of Directors of Holdings stock options in Holdings during the year ended December 31, 2013 under similar terms as the Tranche 1 options granted as of September 28, 2012 under the Sky Growth Holdings Corporation 2012 Equity Incentive Plan. These stock options vest based upon continued service over an approximate five year period, ratably 20% each period ending September 28th. We will recognize expense on a straight-line basis over the requisite service period for the entire award. The share-based compensation expense relating to the award has been pushed down from Holdings to the Company. We used the Black-Scholes stock option pricing model to estimate the fair value of the stock option awards.
In addition, during the year ended December 31, 2014, the Holdings Board of Directors authorized the additional grants of options to purchase shares of Holdings’ Stock pursuant to the Sky Growth Holdings Corporation 2012 Equity Incentive Plan at an exercise price of $1.40 (equal to the estimated fair market value of Holdings’ Stock at that time) to certain employees and a member of Holdings Board of Directors. The stock option grants are roughly divided into two tranches of stock options. Tranche 1 of the options will vest in equal increments of 25% on each of the first, second, third, and fourth anniversaries of the “Vesting Commencement Date” as defined in each stock option agreement, provided that each employee remains in continuous employment with the Company through such dates. Tranche 2 of the options (the “Performance Options”) will vest in equal increments of 25%, subject to the employee remaining in continuous employment with the Company through the applicable anniversary of the Vesting Commencement Date and to the Company’s achievement of specified annual EBITDA targets for 2014 through 2017. If an applicable portion of the Performance Options do not vest based on the achievement of the specified annual EBITDA target for a particular year, such portion will be eligible to vest in the next succeeding fiscal year if a two-year cumulative EBITDA target is met (other than with respect to 2017, for which there is no two-year cumulative EBITDA target). In circumstances where the specified annual or bi-annual EBITDA targets are not met, Tranche 2 options may also vest in amounts of either 50% or 100% of the original award in the event of an initial public offering or other sale of Holdings to a third party buyer (a market condition) that returns a specified level of proceeds calculated as a multiple of its investment in Holdings by the Sponsor.
We used the Black-Scholes stock option pricing model to estimate the fair value of Tranche 1 and Tranche 2 without a market condition (service and performance conditions only) stock option awards with the following weighted average assumptions:
| For the year ended | For the period | |||||||||||
| December 31, 2014 |
December 31, 2013 |
July 12, 2012 to December 31, 2012 |
||||||||||
| (Successor) | (Successor) | (Successor) | ||||||||||
| TRANCHE 1 |
||||||||||||
| Risk-free interest rate |
2.1% | N/A | 0.9% | |||||||||
| Expected life (in years) |
6.3 | N/A | 5.0 | |||||||||
| Expected volatility |
63.0% | N/A | 75.0% | |||||||||
| Dividend |
0.0% | N/A | 0.0% | |||||||||
|
|
||||||||||||
F-46
Table of Contents
| For the year ended | For the period | |||||||||||
| December 31, 2014 |
December 31, 2013 |
July 12, 2012 to December 31, 2012 |
||||||||||
| (Successor) | (Successor) | (Successor) | ||||||||||
| TRANCHE 2 |
||||||||||||
| Risk-free interest rate |
2.1% | N/A | 1.0% | |||||||||
| Expected life (in years) |
6.5 | N/A | 5.0 | |||||||||
| Expected volatility |
63.0% | N/A | 75.0% | |||||||||
| Dividend |
0.0% | N/A | 0.0% | |||||||||
|
|
||||||||||||
The Tranche 2 stock option grants with a market condition were valued using a Monte Carlo simulation. In addition to the above assumptions utilized in the Black-Scholes model, the Monte Carlo simulation developed a range of projected outcomes of the market condition by projecting potential share prices over a 4 or 5 year simulation and determining if the share price had reached the specified level of proceeds stipulated in the equity plan. We ran millions simulations and concluded the fair value of the Tranche 2 Option with market condition as the average of present value of the payoffs across all simulations.
A summary of the calculated estimated grant date fair value per option is as follows:
| For the year ended | For the period | |||||||||||
| December 31, 2014 |
December 31, 2013 |
July 12, 2012 to December 31, 2012 |
||||||||||
| Fair value of stock options | (Successor) | (Successor) | (Successor) | |||||||||
| TRANCHE 1 |
$ | 0.83 | N/A | $ | 0.67 | |||||||
| TRANCHE 2 without market condition |
$ | 0.85 | N/A | $ | 0.68 | |||||||
| TRANCHE 2 with market condition |
$ | 0.72 | N/A | $ | 0.66 | |||||||
|
|
||||||||||||
For Tranche 2 options, each quarter we will evaluate the probability of the Company achieving the annual or the bi-annual EBITDA targets (“Vesting Event A”) and the probability of an initial public offering or other sale of the Company to a third party buyer (“Vesting Event B”). If it is probable that the Company will achieve Vesting Event A, then the Company will recognize expense for Tranche 2 options at the per option value noted above with any necessary adjustments to expense to be equal to the ratable expense as of the end of that particular quarter end. If it is probable that the Company will achieve Vesting Event B, but not Vesting Event A, then the Company will recognize expense for Tranche 2 options at the per option value (which is the fair value taking into account the market condition) noted above with any necessary adjustment to expense to be equal to the ratable expense as of the end of that particular quarter end.
F-47
Table of Contents
Set forth below is the impact on our results of operations of recording share-based compensation from stock options for the years ended December 31, 2014, December 31, 2013 and for the period from July 12, 2012 (inception) to December 31, 2012 ($ in thousands):
| For the year ended December 31, 2014 |
For the year ended December 31, 2013 |
For the period July 12, 2012 to December 31, 2012 |
||||||||||
| (Successor) | (Successor) | (Successor) | ||||||||||
| Cost of goods sold |
$ | 858 | $ | 901 | $ | 223 | ||||||
| Selling, general and administrative |
7,721 | 8,147 | 2,003 | |||||||||
|
|
|
|||||||||||
| Total, pre-tax |
8,579 | 9,048 | 2,226 | |||||||||
| Tax effect of share-based compensation |
(3,088 | ) | (3,348 | ) | (824 | ) | ||||||
|
|
|
|||||||||||
| Total, net of tax |
$ | 5,491 | $ | 5,700 | $ | 1,402 | ||||||
|
|
||||||||||||
The following is a summary of our stock option activity (shares in thousands):
| Shares | Weighted average exercise price |
Weighted average remaining life |
Aggregate intrinsic value |
|||||||||||||
| TRANCHE 1 |
||||||||||||||||
| Balance at December 31, 2013 |
21,830 | $ | 1.00 | |||||||||||||
| Granted |
6,604 | 1.40 | ||||||||||||||
| Exercised |
(170 | ) | 1.00 | |||||||||||||
| Forfeited |
(400 | ) | 1.02 | |||||||||||||
|
|
|
|||||||||||||||
| Balance at December 31, 2014 |
27,864 | 1.09 | 8.2 | 40,834 | ||||||||||||
|
|
|
|||||||||||||||
| Exercisable at December 31, 2014 |
8,762 | 1.01 | 7.9 | 13,569 | ||||||||||||
|
|
|
|||||||||||||||
| Vested and expected to vest at December 31, 2014 |
$ | 27,488 | $ | 1.10 | 8.2 | $ | 40,248 | |||||||||
|
|
||||||||||||||||
| Shares | Weighted average exercise price |
Weighted average remaining life |
Aggregate intrinsic value |
|||||||||||||
| TRANCHE 2 |
||||||||||||||||
| Balance at December 31, 2013 |
21,330 | $ | 1.00 | |||||||||||||
| Granted |
6,104 | 1.40 | ||||||||||||||
| Exercised |
(110 | ) | 1.00 | |||||||||||||
| Forfeited |
(400 | ) | 1.02 | |||||||||||||
|
|
|
|||||||||||||||
| Balance at December 31, 2014 |
26,924 | 1.09 | 8.2 | 39,568 | ||||||||||||
|
|
|
|||||||||||||||
| Exercisable at December 31, 2014 |
8,372 | 1.00 | 7.8 | 13,060 | ||||||||||||
|
|
|
|||||||||||||||
| Vested and expected to vest at December 31, 2014 |
$ | 26,384 | $ | 1.09 | 8.2 | $ | 38,795 | |||||||||
|
|
||||||||||||||||
Rollover options
As part of the Merger, certain employees of PPCI were given the opportunity to exchange their stock options in PPCI for stock options in Holdings (“Rollover Stock Options”). TPG was not legally or contractually required to replace PPCI stock options with Holdings stock options, therefore the Rollover Stock Options were not part of the purchase price. The ratio of exchange was based on the intrinsic value of the PPCI stock options at September 28, 2012.
F-48
Table of Contents
The term of the PPCI stock options exchanged for Holdings stock options were not extended. All Rollover Stock Options maintained their 10 year term from original grant date.
All of the Rollover Stock Options were either vested prior to September 27, 2012 or were accelerated vested on September 27, 2012 (date of the PPCI shareholders’ meeting that approved Par’s acquisition by TPG) in accordance with the terms of the PPCI stock option agreements. No additional vesting conditions were imposed on the holders of the Rollover Stock Options. All remaining unrecognized share-based compensation expense associated with the Rollover Stock Options was recognized as of September 27, 2012 on PPCI’s (the predecessor’s) books and records.
The following is a summary of our Rollover Stock Options activity (shares and aggregate intrinsic value in thousands):
| Shares | Weighted average exercise price |
Weighted average remaining life |
Aggregate intrinsic value |
|||||||||||||
| Balance at December 31, 2013 |
17,351 | $ | 0.25 | |||||||||||||
| Granted |
— | 0.25 | ||||||||||||||
| Exercised |
(268 | ) | 0.25 | |||||||||||||
| Forfeited |
— | 0.25 | ||||||||||||||
|
|
|
|||||||||||||||
| Balance at December 31, 2014 |
17,083 | 0.25 | 5.4 | $ | 39,461 | |||||||||||
|
|
|
|||||||||||||||
| Exercisable at December 31, 2014 |
$ | 17,083 | $ | 0.25 | 5.4 | $ | 39,461 | |||||||||
|
|
||||||||||||||||
Restricted stock
In addition, in conjunction with the Merger, certain senior level employees were granted restricted stock units (RSUs) in Holdings.
Each RSU has only a time-based service condition and will vest no later than the fifth anniversary of the grant date (September 28, 2017) upon fulfillment of the service condition.
The fair value of each RSU is based on fair value of each share of Holdings common stock on the grant date. The RSUs are classified as equity awards. The total calculated value, net of estimated forfeitures, will be recognized ratably over the 5 year vesting period.
Set forth below is the impact on our results of operations of recording share-based compensation from RSUs for the years ended December 31, 2014, and 2013, and for the period July 12, 2012 (inception) to December 31, 2012 ($ amounts in thousands):
| For the year ended December 31, 2014 |
For the year ended December 31, 2013 |
For the period July 12, 2012 to December 31, 2012 |
||||||||||
| (Successor) | (Successor) | (Successor) | ||||||||||
| Cost of goods sold |
$ | — | $ | — | $ | 1 | ||||||
| Selling, general and administrative |
99 | 106 | 13 | |||||||||
|
|
|
|||||||||||
| Total, pre-tax |
99 | 106 | 14 | |||||||||
| Tax effect of share-based compensation |
(36 | ) | (39 | ) | (5 | ) | ||||||
|
|
|
|||||||||||
| Total, net of tax |
$ | 63 | $ | 67 | $ | 9 | ||||||
|
|
||||||||||||
F-49
Table of Contents
The following is a summary of our RSU activity (shares and aggregate intrinsic value in thousands):
| Shares | Weighted average grant price |
Aggregate intrinsic value |
||||||||||
| Balance at December 31, 2013 |
375 | $ | 1.00 | |||||||||
| Granted |
— | 1.00 | ||||||||||
| Vested |
(50 | ) | 1.00 | |||||||||
| Forfeited |
— | 1.00 | ||||||||||
|
|
|
|||||||||||
| Non-vested restricted stock unit balance at December 31, 2014 |
325 | $ | 1.00 | $ | 832 | |||||||
|
|
||||||||||||
Long-term cash incentive awards
In conjunction with the Merger, certain employees were granted awards under the Long-term Cash Incentive Award Agreement incentive plan from Holdings. Each participant has the potential to receive a cash award based on specific achievements in the event of a transaction (e.g., initial public offering or sale of the company to a third party buyer) that returns a specified level of proceeds calculated as a multiple of the equity invested in the Company by the Sponsor. There is no vesting period under the long-term cash incentive plan. The grantees must be employed by Holdings at the time of a transaction event in order to be eligible for a cash payment.
This plan is accounted for in accordance with ASC 450 and will be evaluated quarterly. If information available before the financial statements are issued indicates that it is probable that a liability had been incurred at the date of the financial statements then an accrual shall be made for the estimated cash payout. No amount was accrued for the Long-term Cash Incentive Awards through December 31, 2014.
Predecessor share-based compensation
As a result of the Merger, as of September 27, 2012, the Predecessor’s unvested share-based compensation instruments were accelerated to vest in accordance with the underlying Predecessor equity plans. These instruments, together with previously vested awards, and with the exception of Rollover Options discussed above, were settled in cash at the $50.00 purchase price per share paid by TPG in the Merger. All previous share-based compensation plans were canceled in conjunction with the Merger.
Stock options
We used the Black-Scholes stock option pricing model to estimate the fair value of stock option awards with the following weighted average assumptions:
| For the period ended | ||||
| September 28, 2012 | ||||
| Risk-free interest rate |
0.8% | |||
| Expected life (in years) |
4.7 | |||
| Expected volatility |
43.9% | |||
| Dividend |
0% | |||
|
|
||||
F-50
Table of Contents
The following is a summary of the weighted average per share fair value of options granted for the period ended September 28, 2012.
| For the period ended | ||||
| September 28, 2012 | ||||
| Weighted average per share fair value of options granted |
$ | 12.46 | ||
|
|
||||
Set forth below is the impact on our results of operations of recording share-based compensation from stock options for the period ended September 28, 2012 ($ in thousands):
| For the period ended | ||||
| September 28, 2012 | ||||
| Cost of goods sold |
$ | 300 | ||
| Selling, general and administrative |
2,700 | |||
|
|
|
|||
| Total, pre-tax |
$ | 3,000 | ||
| Tax effect of share-based compensation |
(1,110 | ) | ||
|
|
|
|||
| Total, net of tax |
$ | 1,890 | ||
|
|
||||
The following is a summary of our stock option activity (shares and aggregate intrinsic value in thousands):
| Shares | Weighted average grant price |
Weighted average remaining life |
Aggregate intrinsic value |
|||||||||||||
| Balance at December 31, 2011 |
2,286 | $ | 30.11 | — | — | |||||||||||
| Granted |
310 | 32.97 | — | — | ||||||||||||
| Exercised |
(1,659 | ) | 25.61 | — | — | |||||||||||
| Forfeited |
(937 | ) | 39.12 | — | — | |||||||||||
|
|
|
|||||||||||||||
| Balance at September 28, 2012 |
— | $ | — | — | $ | — | ||||||||||
|
|
||||||||||||||||
Total fair value of shares vested ($ in thousands):
| For the period ended | ||||
| September 28, 2012 | ||||
| Total fair value of shares vested |
$ | 3,125 | ||
|
|
||||
Restricted stock/restricted stock units
Outstanding restricted stock and restricted stock units generally vested ratably over four years. The related share-based compensation expense was recorded over the requisite service period, which was the vesting period. The fair value of restricted stock was based on the market value of our common stock on the date of grant.
F-51
Table of Contents
The impact on our results of operations of recording share-based compensation from restricted stock for the period ended September 28, 2012 was as follows ($ in thousands):
| For the period ended | ||||
| September 28, 2012 | ||||
| Cost of goods sold |
$ | 377 | ||
| Selling, general and administrative |
3,390 | |||
|
|
|
|||
| Total, pre-tax |
$ | 3,767 | ||
| Tax effect of stock-based compensation |
(1,394 | ) | ||
|
|
|
|||
| Total, net of tax |
$ | 2,373 | ||
|
|
||||
The following is a summary of our restricted stock activity (shares and aggregate intrinsic value in thousands):
| Shares | Weighted average grant price |
Aggregate intrinsic value |
||||||||||
| Non-vested balance at December 31, 2011 |
281 | $ | 24.28 | — | ||||||||
| Granted |
99 | 32.89 | — | |||||||||
| Exercised |
(370 | ) | 26.37 | — | ||||||||
| Forfeited |
(10 | ) | 32.00 | — | ||||||||
|
|
|
|||||||||||
| Non-vested balance at September 28, 2012 |
— | $ | — | $ | — | |||||||
|
|
||||||||||||
The following is a summary of our restricted stock unit activity (shares and aggregate intrinsic value in thousands):
| Shares | Weighted average grant price |
Aggregate intrinsic value |
||||||||||
| Non-vested restricted stock unit balance at December 31, 2011 |
69 | $ | 36.47 | — | ||||||||
| Granted |
82 | 33.09 | — | |||||||||
| Exercised |
(128 | ) | 34.97 | — | ||||||||
| Forfeited |
(23 | ) | 32.76 | — | ||||||||
|
|
|
|||||||||||
| Non-vested restricted stock unit balance at September 28, 2012 |
— | $ | — | $ | — | |||||||
|
|
||||||||||||
Restricted stock unit grants with internal performance conditions
In January 2012, we issued restricted stock units with performance conditions (“performance units”) to our Chief Operating Officer and our President. The vesting of these performance units was contingent upon the achievement of certain financial and operational goals related to the Anchen Acquisition and corporate entity performance with cliff vesting after three years if the performance conditions and continued employment condition were met.
Our Chief Operating Officer and our President each received approximately 25 thousand performance units in January 2012. The value of the performance units awarded was approximately $1.7 million thousand at the grant date. These awards were accelerated and vested as of September 28, 2012 and all related compensation was recognized as of that date.
Cash-settled restricted stock unit awards
We granted cash-settled restricted stock unit awards that vested ratably over four years to certain employees. The cash-settled restricted stock unit awards were classified as liability awards and were reported within
F-52
Table of Contents
accrued expenses and other current liabilities and other long-term liabilities on the consolidated balance sheet through September 28, 2012. Cash settled restricted stock units entitled such employees to receive a cash amount determined by the fair value of our common stock on the vesting date. The fair values of these awards were remeasured at each reporting period (marked to market) until the awards vested and were paid as of September 28, 2012. Fair value fluctuations were recognized as cumulative adjustments to share-based compensation expense and the related liabilities. Cash-settled restricted stock unit awards were subject to forfeiture if employment terminated prior to vesting. Share-based compensation expense for cash-settled restricted stock unit awards were recognized ratably over the service period.
The impact on our results of operations of recording share-based compensation from cash-settled restricted stock units for the period ended September 28, 2012 was as follows ($ in thousands):
| For the period ended | ||||
| September 28, 2012 | ||||
| Cost of goods sold |
$ | 232 | ||
| Selling, general and administrative |
2,089 | |||
|
|
|
|||
| Total, pre-tax |
$ | 2,321 | ||
| Tax effect of stock-based compensation |
(859 | ) | ||
|
|
|
|||
| Total, net of tax |
$ | 1,462 | ||
|
|
||||
Information regarding activity for cash-settled restricted stock units outstanding is as follows (number of awards in thousands):
| Shares | Weighted average grant price |
Aggregate intrinsic value |
||||||||||
| Awards outstanding at December 31, 2011 |
149 | $ | 32.97 | — | ||||||||
| Granted |
137 | 33.38 | — | |||||||||
| Exercised |
(40 | ) | 32.55 | — | ||||||||
| Forfeited |
(246 | ) | 62.84 | — | ||||||||
|
|
|
|||||||||||
| Awards outstanding at September 28, 2012 |
— | $ | — | $ | — | |||||||
|
|
||||||||||||
Employee stock purchase program:
We maintained an Employee Stock Purchase Program (the “Program”). The Program was designed to qualify as an employee stock purchase plan under Section 423 of the Internal Revenue Code of 1986, as amended. It enabled eligible employees to purchase shares of our common stock at a 5% discount to the fair market value. All shares were monetized and the Program was canceled as of September 28, 2012 in conjunction with the Merger.
| (amounts in thousands) | For the period ended | |||
| September 28, 2012 | ||||
| Shares purchased by employees |
5 | |||
|
|
||||
Chief executive officer specific share-based compensation
On November 2, 2010, PPCI entered into an employment agreement with its former President and Chief Executive Officer (the “former CEO”), effective as of January 1, 2011. His employment agreement was for a three-year term, ending December 31, 2013. Pursuant to the employment agreement, the former CEO was
F-53
Table of Contents
eligible to receive an incentive compensation award based on the compound annual growth rate (“CAGR”) of PPCI common stock over the course of the three-year employment term (January 1, 2011 to December 31, 2013). The former CEO was eligible to receive an incentive compensation award ranging from $2.0 million (for a three-year CAGR of 4%) to $9.0 million (for a three-year CAGR of 20% or more). He was not eligible to receive an incentive compensation award if PPCI’s three-year CAGR was below 4%, and no incentive compensation award would be payable if the employment agreement was terminated prior to its expiration unless a change of control (as defined in the agreement) had occurred. This CAGR based award was classified as liability awards and are reported within accrued expenses and other current liabilities and other long-term liabilities on the consolidated balance sheet through September 28, 2012. The fair values of this award was remeasured at each reporting period (mark-to-market) using a Monte Carlo valuation model until the award vested and was paid. Fair value fluctuations were recognized as cumulative adjustments to share-based compensation expense and the related liabilities. Share-based compensation expense for this CAGR award was recognized ratably over the three-year service period. Through September 28, 2012, PPCI $4.6 million of expense was recognized associated with this plan.
In January 2011, the former CEO was granted an equity award consisting of restricted stock units with a total grant date economic value of approximately $1.9 million. The units vested on the date that a change of control (as defined in the agreement) occurred. The related share-based compensation expense was recorded through September 28, 2012. The fair value of restricted stock units was based on the market value of our common stock on the date of grant.
Note 18—Earnings/(loss) per share:
The following is a reconciliation of the amounts used to calculate basic and diluted earnings per share (share amounts and $ in thousands, except per share amounts):
| For the year ended |
For the year ended |
For the period | ||||||||||||||||
| December 31, 2014 |
December 31, 2013 |
July 12, 2012 to December 31, 2012 |
January 1, 2012 to September 28, 2012 |
|||||||||||||||
| (Successor) | (Successor) | (Successor) | (Predecessor) | |||||||||||||||
| Net (loss) income |
(105,517 | ) | (105,871 | ) | (54,706 | ) | 21,175 | |||||||||||
| Basic earnings (loss) per common share: |
||||||||||||||||||
| Weighted average common shares outstanding |
772,728 | 704,009 | 698,047 | 36,449 | ||||||||||||||
|
|
|
|
|
|||||||||||||||
| Net (loss) income per common stock |
(0.14 | ) | (0.15 | ) | (0.08 | ) | 0.58 | |||||||||||
| Earnings per common share assuming dilution: |
||||||||||||||||||
| Weighted average common shares outstanding |
772,728 | 704,009 | 698,047 | 36,449 | ||||||||||||||
| Effect of diluted shares |
— | — | — | 782 | ||||||||||||||
| Diluted weighted average common shares outstanding |
772,728 | 704,009 | 698,047 | 37,231 | ||||||||||||||
| Net (loss) income per common share assuming dilution |
(0.14 | ) | (0.15 | ) | (0.08 | ) | 0.57 | |||||||||||
|
|
||||||||||||||||||
Since we had a net loss for the years ended December 31, 2014 and 2013 and period of July 12, 2012 (inception) to December 31, 2012 (Successor), basic and diluted net loss per share of common stock is the same, because the effect of including potential common stock equivalents (such as stock options and restricted stock units)
F-54
Table of Contents
would be anti-dilutive. The potential effect of diluted shares, totaled 11.1 million, 8.3 million, and 8.6 million, respectively. Options outstanding of 0.6 million for the period January 1, 2012 to September 28, 2012 were not included in the computation of diluted earnings/(loss) per share because their exercise price were greater than the average market price of our common stock and their inclusion would therefore, have been anti-dilutive.
Note 19—Income taxes:
The components of our provision (benefit) for income taxes on income from continuing operations for the years ended December 31, 2014 (Successor) and December 31, 2013 (Successor), the successor period from July 12, 2012 (inception) through December 31, 2012 (Successor), the predecessor period from January 1, 2012 through September 28, 2012 (Predecessor) are as follows ($ in thousands):
| For the year ended |
For the year ended |
For the period | ||||||||||||||||
| December 31, 2014 |
December 31, 2013 |
July 12, 2012 to December 31, 2012 |
January 1, 2012 to September 28, 2012 |
|||||||||||||||
| (Successor) | (Successor) | (Successor) | (Predecessor) | |||||||||||||||
| Current income tax provision (benefit): |
||||||||||||||||||
| Federal |
$ | 53,167 | $ | 19,505 | $ | 2,944 | $ | 21,878 | ||||||||||
| State |
917 | 187 | 159 | (5,284 | ) | |||||||||||||
| Foreign |
1,300 | 973 | 230 | 833 | ||||||||||||||
|
|
|
|
|
|||||||||||||||
| 55,384 | 20,665 | 3,333 | 17,427 | |||||||||||||||
| Deferred income tax (benefit) provision: |
||||||||||||||||||
| Federal |
(126,795 | ) | (79,996 | ) | (25,978 | ) | 12,982 | |||||||||||
| State |
(1,582 | ) | (1,851 | ) | (1,082 | ) | (829 | ) | ||||||||||
| Foreign |
— | — | — | (50 | ) | |||||||||||||
|
|
|
|
|
|||||||||||||||
| (128,377 | ) | (81,847 | ) | (27,060 | ) | 12,103 | ||||||||||||
|
|
|
|
|
|||||||||||||||
| $ | (72,993 | ) | $ | (61,182 | ) | $ | (23,727 | ) | $ | 29,530 | ||||||||
|
|
||||||||||||||||||
F-55
Table of Contents
Deferred tax assets and (liabilities) as of December 31, 2014, and 2013 are as follows ($ in thousands):
| December 31, 2014 |
December 31, 2013 |
|||||||
| (Successor) | (Successor) | |||||||
| Deferred tax assets: |
||||||||
| Accounts receivable |
$ | 61,580 | $ | 35,298 | ||||
| Inventories |
15,945 | 12,670 | ||||||
| Litigation settlements and contingencies |
— | 12,241 | ||||||
| Accrued and prepaid expenses |
8,506 | 8,219 | ||||||
| Net operating losses and other carryforwards |
19,475 | 15,015 | ||||||
| Stock options and restricted shares |
7,221 | 4,097 | ||||||
| Other |
3,782 | 4,790 | ||||||
|
|
|
|||||||
| 116,509 | 92,330 | |||||||
| Less valuation allowance |
(19,381 | ) | (12,322 | ) | ||||
|
|
|
|||||||
| Total deferred tax assets |
97,128 | 80,008 | ||||||
|
|
|
|||||||
| Deferred tax liabilities: |
||||||||
| Fixed assets |
(21,358 | ) | (20,621 | ) | ||||
| Deferred financing cost |
(8,809 | ) | (15,463 | ) | ||||
| Intangible assets |
(240,675 | ) | (275,399 | ) | ||||
| Other |
(1,527 | ) | (1,376 | ) | ||||
|
|
|
|||||||
| Total deferred tax liabilities |
(272,369 | ) | (312,859 | ) | ||||
| Net deferred tax liability |
($ | 175,241 | ) | ($ | 232,851 | ) | ||
|
|
||||||||
Management believes it is more likely than not that $97.1 million of the deferred tax asset balance of $116.5 million as of December 31, 2014 will be realized.
We have gross net operating loss (“NOL”) carryforwards at December 31, 2014 of approximately $242.7 million for state income tax purposes. State NOL carryforwards will begin expiring in 2015. A gross valuation allowance on the deferred tax assets at December 31, 2014, primarily relates to certain state NOL’s and credit and capital loss carryforwards of approximately $252.0 million which represents $19.4 million of net valuation allowance. This valuation allowance increased in 2014 by $7.1 million, primarily due to an increase of certain state NOL’s principally driven by our debt service and acquisition costs.
F-56
Table of Contents
The table below provides reconciliation between the statutory federal income tax rate and the effective rate of income tax expense for each of the periods shown as follows. For periods with a loss before benefit for income taxes, favorable tax items result in an increase in the effective tax rate, while unfavorable tax items result in a decrease in the effective tax rate. For periods with income before provision for income taxes, favorable tax items result in a decrease in the effective tax rate, while, unfavorable tax items result in an increase in the effective tax rate.
| For the year ended |
For the year ended |
For the period | ||||||||||||||||
| December 31, 2014 |
December 31, 2013 |
July 12, 2012 to December 31, 2012 |
January 1, 2012 to September 28, 2012 |
|||||||||||||||
| (Successor) | (Successor) | (Successor) | (Predecessor) | |||||||||||||||
| Federal statutory tax rate |
35% | 35% | 35% | 35% | ||||||||||||||
| State tax—net of federal benefit |
1 | 1 | 1 | 2 | ||||||||||||||
| Domestic manufacturing deduction |
3 | — | — | — | ||||||||||||||
| Tax contingencies |
— | — | (1 | ) | (6 | ) | ||||||||||||
| Non-deductible legal settlements |
1 | — | — | 17 | ||||||||||||||
| Non-deductible annual pharmaceutical manufacturers’ fee |
(1 | ) | (2 | ) | — | — | ||||||||||||
| Non-deductible transaction costs |
— | — | (5 | ) | 8 | |||||||||||||
| R&D Credit |
2 | 2 | — | — | ||||||||||||||
| Other |
— | 1 | — | 2 | ||||||||||||||
|
|
|
|
|
|||||||||||||||
| Effective tax rate |
41% | 37% | 30% | 58% | ||||||||||||||
|
|
||||||||||||||||||
Tax contingencies
Significant judgment is required in evaluating our tax positions and determining its provision for income taxes. During the ordinary course of business, there are transactions and calculations for which the ultimate tax determination is uncertain. We establish reserves for tax related uncertainties based on estimates of whether, and the extent to which, additional taxes will be due. These reserves are established when we believe that certain positions might be challenged despite our belief that our tax return positions are fully supportable. We adjust these reserves in light of changing facts and circumstances, such as the outcome of tax audits. The provision for income taxes includes the impact of reserve provisions and changes to reserves that are considered appropriate. Accruals for tax contingencies are provided for in accordance with the requirements of ASC 740-10. We reflect interest and penalties attributable to income taxes, to the extent they arise, as a component of its income tax provision or benefit.
At December 31, 2014, the amount of gross unrecognized tax benefits (excluding the federal benefit received from state positions) was $14.5 million. The total amount of accrued interest and penalties resulting from such unrecognized tax benefits was $2.1 million at December 31, 2014 (Successor) and $2.5 million at December 31, 2013 (Successor). During the year ended December 31, 2014 (Successor), the year ended December 31, 2013, the period from July 12, 2012 (inception) to December 31, 2012 (Successor), and the period from January 1, 2012 to September 28, 2012 (Predecessor), we recognized approximately $0.6 million, $0.5 million, $0.04 million, and $0.4 million, respectively, in interest and penalties.
The total amount of unrecognized tax benefits that, if recognized, would affect our effective tax rate was $13.6 million and $13.3 million at December 31, 2014 and 2013, respectively.
F-57
Table of Contents
A reconciliation of the beginning and ending amount of gross unrecognized tax benefits for the years ended December 31, 2014 (Successor) and December 31, 2013 (Successor), the successor period from July 12, 2012 (inception) through December 31, 2012, the predecessor period from January 1, 2012 through September 28, 2012 are as follows ($ in thousands):
| For the year ended |
For the year ended |
For the period | ||||||||||||||||
| December 31, 2014 |
December 31, 2013 |
July 12, 2012 to December 31, 2012 |
January 1, 2012 to September 28, 2012 |
|||||||||||||||
| (Successor) | (Successor) | (Successor) | (Predecessor) | |||||||||||||||
| Balance at the beginning of period |
$ | 17,981 | $ | 12,538 | $ | 12,119 | $ | 14,409 | ||||||||||
| Additions based on tax positions related to the current year |
2,786 | 2,577 | 419 | 2,337 | ||||||||||||||
| Additions for tax positions of prior years |
1,070 | 3,708 | — | 634 | ||||||||||||||
| Reductions for tax positions of prior years |
(6,484 | ) | (842 | ) | — | (5,261 | ) | |||||||||||
| Reductions due to lapse of applicable statute of limitations |
— | — | — | — | ||||||||||||||
| Settlements paid |
(858 | ) | — | — | — | |||||||||||||
|
|
|
|
|
|||||||||||||||
| Balance at the end of the period |
$ | 14,495 | $ | 17,981 | $ | 12,538 | $ | 12,119 | ||||||||||
|
|
||||||||||||||||||
We believe it is reasonably possible that approximately $2.2 million of our current unrecognized tax positions may be recognized within the next twelve months as a result of settlements or a lapse of the statute of limitations.
For periods prior to 2012, the Company is no longer subject to IRS audit. We are currently under audit in several state jurisdictions for the years 2005 through 2013. In most other state jurisdictions, we are no longer subject to examination by tax authorities for years prior to 2009.
Note 20—Commitments, contingencies and other matters:
Leases
At December 31, 2014, we had minimum rental commitments aggregating $33.9 million under non-cancelable operating leases expiring through 2018. Amounts payable thereunder are $6.3 million in 2015, $4.7 million in 2016, $4.0 million in 2017, $3.3 million in 2018 and $15.6 million thereafter. Rent expense charged to operations was $6.4 million in 2014 (Successor), $6.3 million in 2013 (Successor), $1.6 million in the period from July 12, 2012 (inception) to December 31, 2012 (Successor), and $4.8 million for the period from January 1, 2012 to September 28, 2012 (Predecessor).
Retirement savings plan
We have a Retirement Savings Plan (the “Retirement Savings Plan”) whereby eligible employees are permitted to contribute annually from 1% to 25% of their compensation to the Retirement Savings Plan. We contribute an amount equal to 50% of up to the first 6% of compensation contributed by the employee (“401(k) matching feature”). All participants enrolled in the Retirement Savings Plan as of January 1, 2013 became vested immediately with respect to the 401(k) matching feature contributions each pay period. Participants who enrolled in the Retirement Savings Plan after January 1, 2013 become vested with respect to 20% of our contributions for each full year of employment with the Company and thus become fully vested after five full years. We also may contribute additional funds each year to the Retirement Savings Plan, the amount of which,
F-58
Table of Contents
if any, is determined by the Board in its sole discretion. We incurred expenses related to the 401(k) matching feature of the Retirement Savings Plan of $2.0 million in 2014 (Successor), $1.7 million in 2013 (Successor), $0.2 million in the period from July 12, 2012 (inception) to December 31, 2012 (Successor), and $0.9 million for the period from January 1, 2012 to September 28, 2012 (Predecessor). We did not make a discretionary contribution to the Retirement Savings Plan for 2014, 2013 and 2012.
Our Anchen subsidiary has a legacy 401(k) plan whereby its eligible employees are permitted to contribute annually from their compensation to this 401(k) plan up to the annual IRS limit. Under this plan, Anchen eligible employees can receive employer matching contributions of 100% of the first 3% of compensation contributed and 50% of the next 2% of compensation contributed (“Anchen 401(k) matching feature”). Participants in the legacy 401(k) plan become vested immediately with respect to the Anchen 401(k) matching feature contributions each pay period. Anchen eligible employees may also receive additional funds each year under the legacy 401(k) plan, the amount of which, if any, is determined by the Board in its sole discretion. As of December 31, 2012, this plan was merged into the Retirement Savings Plan. We incurred expenses related to the Anchen 401(k) matching feature of $0.1 million in the period from July 12, 2012 (inception) to December 31, 2012 (Successor), and $0.4 million for the period from January 1, 2012 to September 28, 2012 (Predecessor). We did not make a discretionary contribution to the legacy 401(k) plan for 2012.
We incurred expenses related to the 401(k) matching feature of the Par Sterile Retirement Savings Plan, assumed as part of the Par Sterile Acquisition, of $1.4 million in 2014.
Legal proceedings
Our legal proceedings are complex and subject to significant uncertainties. As such, we cannot predict the outcome or the effects of the legal proceedings described below. While we believe that we have valid claims and/or defenses in the litigations described below, litigation is inherently unpredictable, and the outcome of these proceedings could include substantial damages, the imposition of substantial fines, penalties, and injunctive or administrative remedies. For proceedings where losses are both probable and reasonably estimable, we have accrued for such potential loss as set forth below. Such accruals have been developed based upon estimates and assumptions that have been deemed reasonable by management, but the assessment process relies heavily on estimates and assumptions that may ultimately prove to be inaccurate or incomplete, and unknown circumstances may exist or unforeseen events occur that could lead us to change those estimates and assumptions. Unless otherwise indicated below, at this time we are not able to estimate the possible loss or range of loss, if any, associated with these legal proceedings. In general, we intend to continue to vigorously prosecute and/or defend these proceedings, as appropriate; however, from time to time, we may settle or otherwise resolve these matters on terms and conditions that we believe are in the best interests of the Company. Resolution of any or all claims, investigations, and legal proceedings, individually or in the aggregate, could have a material adverse effect on our results of operations and/or cash flows in any given accounting period or on our overall financial condition.
Patent related matters
On April 28, 2006, CIMA Labs, Inc. (“CIMA”) and Schwarz Pharma, Inc. (“Schwarz Pharma”) filed separate lawsuits against us in the U.S. District Court for the District of New Jersey. CIMA and Schwarz Pharma each have alleged that we infringed U.S. Patent Nos. 6,024,981 (the “’981 patent”) and 6,221,392 (the “’392 patent”) by submitting a Paragraph IV certification to the FDA for approval of alprazolam orally disintegrating tablets. The complaints generally seek (i) a finding of infringement, validity and/or enforceability; (ii) a permanent injunction be entered, terminating at the expiration of the patents-in-suit; and (iii) unspecified damages. On July 10, 2008, the U.S. Patent and Trademark Office (“USPTO”) rejected all claims pending in both the ‘392 and
F-59
Table of Contents
‘981 patents. On September 28, 2009, the USPTO’s Patent Trial and Appeal Board (“PTAB”) affirmed the Examiner’s rejection of all claims in the ‘981 patent, and on March 24, 2011, the PTAB affirmed the rejections pending for both patents and added new grounds for rejection of the ‘981 patent. On June 24, 2011, the plaintiffs re-opened prosecution on both patents at the USPTO. On May 13, 2013, the PTAB reversed outstanding rejections to the currently pending claims of the ’392 patent reexamination application and affirmed a conclusion by the Examiner that testimony offered by the patentee had overcome other rejections. On September 20, 2013, a reexamination certificate was issued for the ’392 patent, and on January 9, 2014, a reexamination certificate was issued for the ’981 patent, each incorporating narrower claims than the respective originally-issued patent. We intend to vigorously defend this lawsuit and pursue our counterclaims.
Unimed and Laboratories Besins Iscovesco filed a lawsuit on August 22, 2003 against Paddock Laboratories, Inc. in the U.S. District Court for the Northern District of Georgia alleging patent infringement as a result of Paddock’s submitting an ANDA with a Paragraph IV certification seeking FDA approval of testosterone 1% gel, a generic version of Unimed Pharmaceuticals, Inc.’s Androgel®. On September 13, 2006, we acquired from Paddock all rights to the ANDA, and the litigation was resolved by a settlement and license agreement that permits us to launch the generic version of the product no earlier than August 31, 2015, and no later than February 28, 2016, assuring our ability to market a generic version of Androgel® well before the expiration of the patents at issue. On January 30, 2009, the Bureau of Competition for the FTC filed a lawsuit against us in the U.S. District Court for the Central District of California, subsequently transferred to the Northern District of Georgia, alleging violations of antitrust laws stemming from our court-approved settlement, and several distributors and retailers followed suit with a number of private plaintiffs’ complaints beginning in February 2009. The FTC complaint generally seeks (i) a finding that our agreements with co-defendants violate Section 5(a) of the Federal Trade Commission Act; and (ii) a permanent injunction against our ability to engage in such conduct in the future. The private plaintiffs’ complaints generally seek (i) equitable relief; and (ii) single, treble, and/or multiple unspecified damages and costs. On February 23, 2010, the District Court granted our motion to dismiss the FTC’s claims and granted in part and denied in part our motion to dismiss the claims of the private plaintiffs. On September 28, 2012, the District Court granted our motion for summary judgment against the private plaintiffs’ claims of sham litigation. On June 10, 2010, the FTC appealed the District Court’s dismissal of the FTC’s claims to the U.S. Court of Appeals for the 11th Circuit. On April 25, 2012, the Court of Appeals affirmed the District Court’s decision. On June 17, 2013, the Supreme Court of the United States reversed the Court of Appeals’ decision and remanded the case to the U.S. District Court for the Northern District of Georgia for further proceedings. On October 23, 2013, the District Court issued an order on indicative ruling on a request for relief from judgment, effectively remanding to the District Court the appeal of the grant of our motion for summary judgment against the private plaintiffs’ claims and holding those claims in abeyance while the remaining issues pending before the Court are resolved. We believe we have complied with all applicable laws in connection with the court-approved settlement and intend to continue to vigorously defend these actions.
On September 13, 2007, Santarus, Inc. and The Curators of the University of Missouri (“Missouri”) filed a lawsuit against us in the U.S. District Court for the District of Delaware alleging infringement of U.S. Patent Nos. 6,699,885; 6,489,346; and 6,645,988 because we submitted an ANDA with a Paragraph IV certification seeking FDA approval of 20 mg and 40 mg omeprazole/sodium bicarbonate capsules. On December 20, 2007, Santarus and Missouri filed a second lawsuit alleging infringement of the patents because we submitted an ANDA with a Paragraph IV certification seeking FDA approval of 20 mg and 40 mg omeprazole/sodium bicarbonate powders for oral suspension. The complaints generally sought (i) a finding of infringement, validity, and/or enforceability; and (ii) a permanent injunction be entered, terminating at the expiration of the patents-in-suit. On October 20, 2008, plaintiffs amended their complaint to add U.S. Patent Nos. 6,780,882 and 7,399,722. On April 14, 2010, the District Court ruled in our favor, finding that the plaintiffs’ patents were invalid as being obvious and without adequate written description. On July 1, 2010, we launched our 20 mg and
F-60
Table of Contents
40 mg generic omeprazole/sodium bicarbonate capsules product. Santarus and Missouri appealed the District Court’s decision to the U.S. Court of Appeals for the Federal Circuit, and we cross-appealed the District Court’s decision of enforceability of plaintiffs’ patents. On September 4, 2012, the Court of Appeals reversed the District Court’s finding of invalidity and remanded to the District Court for further proceedings, and we ceased further distribution of our 20 mg and 40 mg generic omeprazole/sodium bicarbonate capsules product. Santarus was acquired by Salix Pharmaceuticals, Inc. on January 2, 2014. On September 22, 2014, we entered into a settlement agreement with Salix, Santarus and Missouri to resolve all claims relating to this matter, and the dismissal stipulation was entered on September 26, 2014. As part of the settlement, Salix, Santarus and Missouri released all claims against us in exchange for a payment of $100.0 million. We recorded a charge of $91.0 million in the third quarter of 2014 in addition to the $9.0 million previously accrued.
On April 29, 2009, Pronova BioPharma ASA (“Pronova”) filed a lawsuit against us in the U.S. District Court for the District of Delaware. The complaint alleges infringement of U.S. Patent Nos. 5,502,077 and 5,656,667 because we submitted an ANDA with a Paragraph IV certification seeking FDA approval of omega-3-acid ethyl esters oral capsules. On May 29, 2012, the District Court ruled in favor of Pronova in the initial case, and we appealed to the U.S. Court of Appeals for the Federal Circuit on June 25, 2012. On September 12, 2013, the Court of Appeals ruled in our favor, reversing the lower District Court decision. On March 5, 2014, judgment in our favor was formally entered in the District Court. On April 16, 2014, Pronova petitioned for writ of certiorari to the U.S. Supreme Court, which was denied on October 6, 2014.
On August 10, 2011, Avanir Pharmaceuticals, Inc. et al. (“Avanir”) filed a lawsuit against us in the U.S. District Court for the District of Delaware. The complaint alleges infringement of U.S. Patent Nos. 7,659,282 and RE38,115 because we submitted an ANDA with a Paragraph IV certification seeking FDA approval of oral capsules of 20 mg dextromethorphan hydrobromide and 10 mg quinidine sulfate. The complaint generally seeks (i) a finding of infringement, validity, and/or enforceability; and (ii) a permanent injunction be entered, terminating at the expiration of the patents-in-suit. Our case was consolidated with those of other defendants, Actavis, Impax, and Wockhardt. On September 12, 2012, Avanir filed an additional complaint against us, adding U.S. Patent No. 8,227,484 to the case and seeking the same relief as the first complaint. A bench trial was held from September 9-13 and October 15, 2013. On April 30, 2014, a decision was entered in favor of Avanir. On August 20, 2014, the Court issued an order requiring that Avanir delist the ‘115 patent, leaving only the ‘484 and ‘282 to be addressed on appeal. We filed our notice of appeal following resolution of the delisting claim on September 12, 2014. We intend to prosecute our appeal of this decision vigorously.
On September 1, 2011, we, along with EDT Pharma Holdings Ltd. (now known as Alkermes Pharma Ireland Limited) (Elan), filed a complaint against TWi Pharmaceuticals, Inc. of Taiwan (“TWi”) in the U.S. District Court for the District of Maryland alleging infringement of U.S. Patent No. 7,101,576 because TWi filed an ANDA with a Paragraph IV certification seeking FDA approval of a generic version of Megace® ES. Our complaint seeks (i) a finding of infringement, validity, and/or enforceability; and (ii) a permanent injunction be entered, terminating at the expiration of the patents-in-suit. A bench trial was held from October 7-15, 2013. On February 21, 2014, the District Court issued a decision in favor of TWi, finding all asserted claims of the ‘576 patent invalid for obviousness, and we appealed to the U.S. Court of Appeals for the Federal Circuit. On August 12, 2014, the District Court granted our motion for preliminary injunction enjoining TWi’s launch of its generic product pending disposition of the case on appeal, requiring us to post a $10.0 million bond. On December 3, 2014, the Federal Circuit reversed the District Court’s decision, remanding for further findings of fact. On March 9, 2015, the District Court granted our motion for preliminary injunction enjoining TWi’s launch of its generic product pending disposition of the case on remand, requiring us to post a $6.0 million bond. We intend to continue to vigorously pursue our case.
On April 4, 2012, AR Holding Company, Inc. filed a lawsuit against us in the U.S. District Court for the District of Delaware. The complaint alleges infringement of U.S. Patent Nos. 7,619,004; 7,601,758; 7,820,681; 7,915,269;
F-61
Table of Contents
7,964,647; 7,964,648; 7,981,938; 8,093,296; 8,093,297; and 8,097,655 (subsequently adding U.S. Patent Nos. 8,415,395 and 8,415,396) because we submitted an ANDA with a Paragraph IV certification seeking FDA approval of oral tablets of 0.6 mg colchicine. On November 1, 2012, Takeda Pharmaceuticals was substituted as the plaintiff and real party-in-interest in the case. On August 30, 2013, Takeda filed a second complaint in view of the same filing adding to the dispute U.S. Patent Nos. 7,906,519; 7,935,731; 7,964,648; 8,093,297; and 8,093,298. The complaint generally seeks (i) a finding of infringement, validity, and/or enforceability; and (ii) a permanent injunction be entered, terminating at the expiration of the patents-in-suit. On August 30, 2013, Takeda filed a new complaint against us in view of our change of the ANDA’s labeled indication. We intend to defend these actions vigorously.
On October 25, 2012, Purdue Pharma L.P. (“Purdue”) and Transcept Pharmaceuticals (“Transcept”) filed a lawsuit against us in the U.S. District Court for the District of New Jersey. The complaint alleged infringement of U.S. Patent Nos. 8,242,131 and 8,252,809 because we submitted an ANDA with a Paragraph IV certification seeking FDA approval of zolpidem tartrate sublingual tablets 1.75 and 3.5 mg. The complaint generally seeks (i) a finding of infringement, validity, and/or enforceability; and (ii) a permanent injunction be entered, terminating at the expiration of the patents-in-suit. On November 24, 2014, we reached an agreement with Purdue and Transcept to stay our case contingent upon our agreement to be bound by the District Court’s decision in Transcept’s trial against Actavis and Novel Laboratories, which commenced December 1, 2014.
On December 19, 2012, Endo Pharmaceuticals and Grünenthal GmbH filed a lawsuit against us in the U.S. District Court for the Southern District of New York. The complaint alleges infringement of U.S. Patent Nos. 7,851,482; 8,114,383; 8,192,722; 8.309, 060; 8,309,122; and 8,329,216 because we submitted an ANDA with a Paragraph IV certification to the FDA for approval of oxymorphone hydrochloride extended release tablets 40 mg. The complaint generally seeks (i) a finding of infringement, validity, and/or enforceability; and (ii) a permanent injunction be entered, terminating at the expiration of the patents-in-suit. On November 7, 2014, Endo and Mallinckrodt sued us on the same filing in the U.S. District Court for the District of Delaware, adding U.S. Patent Nos. 8,808,737 and 8,871,779 to the case. On January 15, 2015, the case in the Southern District of New York was dismissed by stipulation. We intend to defend the action in the District of Delaware vigorously.
On January 8, 2013, we were substituted for Actavis as defendant in litigation then pending in the U.S. District Court for the District of Delaware. The action was brought by Novartis against Actavis for filing an ANDA with a Paragraph IV certification seeking FDA approval of rivastigmine transdermal extended release film 4.6 and 9.5 mg/24 hr. We assumed the rights to this ANDA. The complaint alleges infringement of U.S. Patents 5,602,176; 6,316,023; and 6,335,031 and generally seeks (i) a finding of infringement, validity, and/or enforceability; and (ii) a permanent injunction be entered, terminating at the expiration of the patents-in-suit. On August 22, 2013, Novartis filed an additional complaint in view of our submission of an ANDA supplement containing a Paragraph IV certification adding the 13.3 mg/24 hr. strength. A trial was held August 26-29, 2013, and a second bench trial directed to our non-infringement positions was held on May 1-2, 2014. On June 27, 2014, we filed a declaratory judgment action against Novartis in the same Court regarding all strengths, seeking judgment of non-infringement and invalidity on all asserted patents in view of all strengths embraced by our ANDA. On August 29, 2014, the Court in the first action entered judgment in our favor, finding that we do not infringe the asserted patents. On October 7, 2014, the Court entered judgment in our favor on the declaratory judgment complaint. On October 20, 2014 and October 30, 2014, Novartis filed notices of appeal to the U.S. Court of Appeals for the Federal Circuit from both the original case as well as the complaint initiated on the ANDA supplement. On November 7, 2014, Novartis filed an appeal from the declaratory judgment decision. We intend to defend these actions vigorously.
On February 7, 2013, Sucampo Pharmaceuticals, Takeda Pharmaceuticals, and R-Tech Ueno filed a lawsuit against us in the U.S. District Court for the District of Delaware. The complaint alleges infringement of U.S. Patent Nos. 6,414,016; 7,795,312; 8,026,393; 8,071,613; 8,097,653; and 8,338,639 because we submitted an
F-62
Table of Contents
ANDA with a Paragraph IV certification to the FDA for approval of lubiprostone oral capsules 8 mcg and 24 mcg. The complaint seeks (i) a finding of infringement; and (ii) a permanent injunction be entered, terminating at the expiration of the patents-in-suit. On July 3, 2013, an amended complaint was filed, adding U.S. Patent No. 8,389,542 to the case. On October 9, 2014, the parties entered into a settlement agreement resolving the dispute and allowing us to launch our generic lubiprostone product on January 1, 2021, or earlier in certain circumstances. The consent judgment terminating the case was entered December 2, 2014.
On May 15, 2013, Endo Pharmaceuticals filed a lawsuit against us in the U.S. District Court for the Southern District of New York. The complaint alleges infringement of U.S. Patent Nos. 7,851,482; 8,309,122; and 8,329,216 as a result of our November 2012 acquisition from Watson of an ANDA with a Paragraph IV certification seeking FDA approval of non-tamper resistant oxymorphone hydrochloride extended release tablets. The complaint generally seeks (i) a finding of infringement, validity, and/or enforceability; and (ii) a permanent injunction be entered, terminating at the expiration of the patents-in-suit. We intend to defend this action vigorously.
On June 21, 2013, we, along with Alkermes Pharma Ireland Limited (Elan), filed a complaint against Breckenridge Pharmaceutical, Inc. in the U.S. District Court for the District of Delaware. In the complaint, we allege infringement of U.S. Patent Nos. 6,592,903 and 7,101,576 because Breckenridge filed an ANDA with a Paragraph IV certification seeking FDA approval of a generic version of Megace® ES. Our complaint seeks (i) a finding of infringement, validity, and/or enforceability; and (ii) a permanent injunction be entered, terminating at the expiration of the patents-in-suit. A stipulation to stay the proceedings was entered on July 22, 2014. We intend to prosecute this infringement case vigorously.
On September 23, 2013, Forest Labs and Royalty Pharma filed a lawsuit against us in the U.S. District Court for the District of Delaware. The complaint alleges infringement of U.S. Patent Nos., 6,602,911; 7,888,342; and 7,994,220 because we submitted an ANDA with a Paragraph IV certification to the FDA for approval of 12.5, 25, 50, and 100 mg milnacipran HCl oral tablets. The complaint seeks (i) a finding of infringement; and (ii) a permanent injunction be entered, terminating at the expiration of the patents-in-suit. We intend to defend this action vigorously.
On August 20, 2013 and April 4, 2014, MonoSol RX and Reckitt Benckiser filed lawsuits against us in the U.S. District Court for the District of Delaware. The complaints allege infringement of U.S. Patent Nos. 8,017,150, 8,475,832 and 8,603,514, because we submitted an ANDA with a Paragraph IV certification to the FDA for approval of EQ 2/0.5, 8/2, 4/1, 12/3 mg base buprenorphine HCl/naloxone HCl sublingual films. The complaints seek (i) a finding of infringement; and (ii) a permanent injunction be entered, terminating at the expiration of the patents-in-suit. On December 31, 2014, the plaintiffs filed a complaint on the same ANDA filing, adding U.S. Patent Nos. 8,900,497 and 8,906,277. We intend to defend these actions vigorously.
On December 27, 2013, Jazz Pharmaceuticals filed a lawsuit against us in the U.S. District Court for the District of New Jersey. The complaint alleges infringement of U.S. Patent Nos. 6,472,431; 6,780,889; 7,262,219; 7,851,506; 8,263,650; 8,324,275; 8,461,203; 7,668,730; 7,765,106; 7,765,107; 7,895,059; 8,457,988; and 8,589,182 because we submitted an ANDA with a Paragraph IV certification to the FDA for approval of 500mg/ml sodium oxybate oral solution. On August 15, 2014, October 10, 2014, and January 8, 2015, Jazz filed additional complaints against us in view of the same ANDA filing, adding U.S. Patent Nos. 8,731,963; 8,772,306; and 8,859,619, respectively, to the case. The complaints seek (i) a finding of infringement; and (ii) a permanent injunction be entered, terminating at the expiration of the patents-in-suit. We intend to defend these actions vigorously.
On January 21, 2014, Lyne Laboratories, Fresenius USA Manufacturing and Fresenius Medical Care Holdings filed a lawsuit against us in the U.S. District Court for the District of Massachusetts. The complaint alleges infringement of U.S. Patent Nos. 8,591,938 and 8,592,480 because we submitted an ANDA with a Paragraph IV
F-63
Table of Contents
certification to the FDA for approval of 169mg/5ml calcium acetate oral solution. The complaint seeks (i) a finding of infringement; and (ii) a permanent injunction be entered, terminating at the expiration of the patents-in-suit. The case has been settled on confidential terms with a stipulation of dismissal, which we expect will be entered by the Court presently.
On February 14, 2014 and August 15, 2014, Forest Laboratories, Inc., Forest Laboratories Holdings, Ltd., and Adamas Pharmaceuticals, Inc., filed lawsuits against us and our Anchen subsidiary in the U.S. District Court for the District of Delaware. The complaints allege infringement of U.S. Patent Nos. 8,039,009; 8,168,209; 8,173,708; 8,283,379; 8,329,752; 8,362,085; and 8,598,233 because we submitted ANDAs with Paragraph IV certifications to the FDA for approval of 7, 14, 21, and 28 mg memantine hydrochloride extended release capsules. The complaints seek (i) a finding of infringement and (ii) a permanent injunction be entered, terminating at the expiration of the patents-in-suit. On January 14, 2015, a joint stipulation of dismissal was entered in the case pursuant to a confidential settlement agreement between the parties.
On April 23, 2014, Hyperion Therapeutics filed a lawsuit against us in the U.S. District Court for the Eastern District of Texas. The complaint alleges infringement of U.S. Patent Nos. 8,404,215 and 8,642,012 because we submitted an ANDA with Paragraph IV certifications to the FDA for approval of 1.1 g/ml glyceryl phenylbutyrate oral liquid. The complaint seeks (i) a finding of infringement and (ii) a permanent injunction be entered, terminating at the expiration of the patents-in-suit. We intend to defend this action vigorously.
On June 20, 2014, Otsuka Pharmaceutical Co. filed a lawsuit against us in the U.S. District Court for the District of Delaware. The complaint alleges infringement of U.S. Patent Nos. 5,753,677 and 8,501,730 relating to our Paragraph IV certification accompanying our ANDA for approval of 15 and 30 mg tolvaptan oral tablets. The complaint seeks (i) a finding of infringement; and (ii) a permanent injunction be entered, terminating at the expiration of the patents-in-suit. We intend to defend this action vigorously.
On June 30, 2014, AstraZeneca filed a lawsuit against us in the U.S. District Court for the District of Delaware. The complaint alleges infringement of U.S. Patent No. 7,951,400 because we submitted an ANDA with a Paragraph IV certification to the FDA for approval of eq 2.5 mg and eq 5 mg saxagliptin hydrochloride oral tablets. The complaint seeks (i) a finding of infringement and (ii) a permanent injunction be entered, terminating at the expiration of the patents-in-suit. We intend to defend this suit vigorously.
On July 17, 2014, Glycyx Pharmaceuticals and Salix filed a lawsuit against us in the U.S. District Court for the District of Delaware. The complaint alleges infringement of U.S. Patent Nos. 6,197,341 and 8,497,256 because we submitted an ANDA with a Paragraph IV certification to the FDA for approval of 1.1 g balsalazide disodium oral tablets. The complaint seeks (i) a finding of infringement and (ii) a permanent injunction be entered, terminating at the expiration of the patents-in-suit. We intend to defend this suit vigorously.
On August 6, 2014, Prometheus Labs filed a lawsuit against us in the U.S. District Court for the District of Delaware. The complaint alleges infringement of U.S. Patent No. 6,284,770 because we submitted an ANDA with a Paragraph IV certification to the FDA for approval of 0.5 and 1.0 mg alosetron hydrochloride tablets. The complaint seeks (i) a finding of infringement and (ii) a permanent injunction be entered, terminating at the expiration of the patents-in-suit. On November 17, 2014, the court stayed our case pending the outcome of the appeal of the first Paragraph IV filer’s victory in the District Court.
On August 19, 2014, Hospira, Inc. filed a declaratory judgment complaint against the FDA in the U.S. District Court for the District of Maryland in view of the FDA’s approval of our ANDA for dexmedetomidine hydrochloride injection, concentrate (100 mcg/ml) vials pursuant to our submission and statement under section viii. On August 20, 2014, we moved to intervene in the case on the side of the FDA. On August 25, 2014, we filed a declaratory judgment complaint against Hospira, Inc. in view of U.S. Patent No. 6,716,867 in the U.S.
F-64
Table of Contents
District Court for the District of New Jersey. On September 5, 2014, the Maryland Court ruled in favor of the FDA, Par and joint intervenor Mylan, Inc. on summary judgment, and Hospira, Inc. and its intervenor/co-complainant Sandoz appealed that judgment to the U.S. Court of Appeals for the Fourth Circuit. On October 29, 2014, all parties stipulated jointly to a dismissal of all of the cases (Maryland, New Jersey, and the Fourth Circuit) pursuant to a confidential settlement agreement.
On October 10, 2014, Novartis Pharmaceuticals Corporation and Novartis AG filed a lawsuit against us in the U.S. District Court for the District of Delaware. The complaint alleges infringement of U.S. Patent Nos. 5,665,772; 6,004,973; and 6,455,518 because we submitted an ANDA with a Paragraph IV certification to the FDA for approval of 0.25, 0.5, and 0.75 mg everolimus tablets. The complaint seeks (i) a finding of infringement and (ii) a permanent injunction be entered, terminating at the expiration of the patents-in-suit. We intend to defend this action vigorously.
On November 19, 2014, we filed a declaratory judgment action against GlaxoSmithKline and Aptalis in the U.S. District Court for the Eastern District of Pennsylvania, seeking declaratory judgment of non-infringement and invalidity of U.S. Patent No. 7,919,115 in view of our April 11, 2012 submission of an ANDA with a Paragraph IV certification to the FDA seeking approval for lamotrigine orally disintegrating tablets 25, 50, 100, and 200 mg. On January 30, 2015, the consent judgment was entered.
Under a Development and Supply Agreement between Pharmaceutics International, Inc. (“PII”) and Par Sterile, PII agreed to develop and manufacture, and Par Sterile agreed to market and sell, certain pharmaceutical products, including zoledronic acid, the generic version of Zometa® and Reclast®. Under the Agreement, the parties agreed to share equally all mutually agreed expenses and costs of Paragraph IV proceedings related to the product, including any costs and expenses related to any mutually agreed upon settlement. On February 20, 2013, Novartis Pharmaceuticals Corporation filed a lawsuit against PII, along with several other defendants, in the U.S. District Court for the District of New Jersey, for filing ANDAs with Paragraph IV certifications seeking FDA approval of both zoledronic acid eq 4 mg base/5 ml vials and zoledronic acid eq 5 mg base/100 ml bottles. The complaint alleges, among other things, that the sale of generic versions of Reclast® and Zometa® would infringe one or more of U.S. Patent Nos. 8,324,189; 7,932,241; and 8,052,987 and seeks (i) a finding of infringement, validity, and/or enforceability; (ii) a permanent injunction be entered, terminating at the expiration of the patents-in-suit; and (iii) damages or other monetary relief in light of commercial manufacture, use, offers to sell, or sale of the ANDA products. On March 1, 2013, the District Court denied Novartis’s request for a temporary restraining order against PII and the other defendants. On March 4, 2013, Par Sterile began distribution of PII’s generic Zometa® product and began distribution of the generic Reclast® product in December 2013. On December 3, 2014, in view of the foregoing, Novartis sued Par Sterile in the same court, seeking (i) a finding of infringement, validity, and/or enforceability; (ii) a permanent injunction be entered, terminating at the expiration of the patents-in-suit; and (iii) damages or other monetary relief in light of commercial manufacture, use, offers to sell, or sale of the ANDA products. We intend to defend this action vigorously.
On December 18, 2014, and January 23, 2015, Novartis Pharmaceuticals Corporation and Novartis AG filed lawsuits against us in the U.S. District Court for the District of Delaware. The complaints allege infringement of U.S. Patent Nos. 5,665,772; 7,297,703; and 7,741,338 518 because we submitted an ANDA with a Paragraph IV certification to the FDA for approval of 2.5, 5, 7.5, and 10 mg everolimus tablets. The complaints seek (i) a finding of infringement and (ii) a permanent injunction be entered, terminating at the expiration of the patents-in-suit. We intend to defend these actions vigorously.
On January 16, 2015, Supernus Pharmaceuticals filed a lawsuit against us in the U.S. District Court for the District of New Jersey. The complaint alleges infringement of U.S. Patent Nos. 8,298,576; 8,298,580; 8,663,683; and 8,877,248 because we submitted an ANDA with a Paragraph IV certification to the FDA for approval of 25, 50, 100, and 200 mg topiramate extended release capsules. The complaint seeks (i) a finding of infringement
F-65
Table of Contents
and (ii) a permanent injunction be entered, terminating at the expiration of the patents-in-suit. We intend to defend this action vigorously.
On January 21, 2015, Tris Pharma, Inc., filed a lawsuit against us in the U.S. District Court for the District of Delaware. The complaint alleges infringement of U.S. Patent Nos. 8,062,667; 8,287,903; 8,465,765; 8,563,033; and 8,778,390 because we submitted an ANDA with a Paragraph IV certification to the FDA for approval of 5 mg/ml methylphenidate hydrochloride extended release oral suspension. The complaint seeks (i) a finding of infringement and (ii) a permanent injunction be entered, terminating at the expiration of the patents-in-suit. We intend to defend this action vigorously.
On February 2, 2015, Cosmo Technologies, Ltd and Santarus, Inc. filed a lawsuit against us in the U.S. District Court for the District of Delaware. The complaint alleges infringement of U.S. Patent Nos. 7,410,651; 7,431,943; 8,293,273; 8,784,888; 8,895,064; and RE43,799 because we submitted an ANDA with a Paragraph IV certification to the FDA for approval of 9 mg budesonide tablets. The complaint seeks (i) a finding of infringement and (ii) a permanent injunction be entered, terminating at the expiration of the patents-in-suit. We intend to defend this action vigorously.
On February 20, 2015, Ferring Pharmaceuticals, Inc. and Ferring International Center S.A. filed a lawsuit against us in the U.S. District Court for the District of Delaware. The complaint alleges infringement of U.S. Patent Nos. 8,450,338 and 8,481,083 because we submitted an ANDA with a Paragraph IV certification to the FDA for approval of 10/3.5/12 g sodium picosulfate/magnesium oxide/citric acid packets for oral solution. The complaint generally seeks (i) a finding of infringement and (ii) a permanent injunction be entered, terminating at the expiration of the patents-in-suit. We intend to defend this action vigorously.
On February 26, 2015, Shire, LLC filed a lawsuit against us in the U.S. District Court for the District of New Jersey. The complaint alleges infringement of U.S. Patent Nos. RE41,148 and RE42,096 because we submitted an ANDA with a Paragraph IV certification to the FDA for approval of 5, 10, 15, 20, and 25 mg mixed amphetamine salts extended release capsules. The complaint seeks (i) a finding of infringement and (ii) a permanent injunction be entered, terminating at the expiration of the patents-in-suit. We intend to defend this action vigorously.
On March 6, 2015, BioMarin Pharmaceutical Inc. and Merck & Cie filed a lawsuit against us in the U.S. District Court for the District of New Jersey. The complaint alleges infringement of U.S. Patent Nos. 7,566,462; 7,566,714; 7,612,073; 7,727,987; 8,003,126; 8,067,416; RE43,797; and 8,318,745 because we submitted an ANDA with a Paragraph IV certification to the FDA for approval of 100 mg sapropterin dihydrochloride oral tablets. The complaint seeks (i) a finding of infringement and (ii) a permanent injunction be entered, terminating at the expiration of the patents-in-suit. We intend to defend this action vigorously.
Industry related matters
Beginning in September 2003, we, along with numerous other pharmaceutical companies, have been named as a defendant in actions brought by the Attorneys General of Illinois, Kansas, and Utah, as well as a state law qui tam action brought on behalf of the state of Wisconsin by Peggy Lautenschlager and Bauer & Bach, LLC, alleging generally that the defendants defrauded the state Medicaid systems by purportedly reporting or causing the reporting of AWP and/or “Wholesale Acquisition Costs” that exceeded the actual selling price of the defendants’ prescription drugs. During the year ended December 31, 2013, we recorded $25.7 million as “Settlements and loss contingencies, net” on the consolidated statements of operations as we continued to periodically assess and estimate our remaining potential liability. On January 28, 2014, we settled the claims brought by the State of Kansas for $1.8 million. On February 5, 2014, we settled the claims brought by the State of Utah for $2.1 million. On June 2, 2014, we settled the claims brought by the State of Illinois for $28.5 million, including attorneys’ fees and costs. The amounts provided for 2013 represents the amounts settled, less amounts previously accrued. Other than as described below, all of the above AWP cases against the Company have been concluded.
F-66
Table of Contents
On February 17, 2014, the Dane County Circuit Court for the State of Wisconsin dismissed the state law qui tam action brought on behalf of the state of Wisconsin by Peggy Lautenschlager and Bauer & Bach, LLC. On June 12, 2014, the Dane County Circuit Court denied the plaintiffs’ renewed motion to amend the complaint and issued a final order of dismissal on the merits, without prejudice. The plaintiffs subsequently appealed the ruling, and on September 22, 2014, the Wisconsin Court of Appeals dismissed the plaintiffs’ appeal. On August 11, 2014, plaintiffs filed a similar AWP qui tam action under seal in the Dane County Circuit Court, and the State of Wisconsin declined to intervene on December 19, 2014. On January 13, 2015, the Dane County Circuit Court unsealed the complaint. The complaint seeks (i) a judgment for qui tam plaintiffs; (ii) a declaration that defendants’ actions violated Wis. Stat. § 20.931; (iii) an award of treble damages to the State; (iv) an order that defendants pay civil penalties for statutory violations of not less than $5,000 for each violation; and (v) an award of an appropriate share of the proceeds to qui tam plaintiffs. We intend to vigorously defend this lawsuit.
The Attorneys General of Florida, Indiana and Virginia and the U.S. Office of Personnel Management (the “USOPM”) have issued subpoenas, and the Attorneys General of Michigan, Tennessee, Texas, and Utah have issued civil investigative demands, to us. The demands generally request documents and information pertaining to allegations that certain of our sales and marketing practices caused pharmacies to substitute ranitidine capsules for ranitidine tablets, fluoxetine tablets for fluoxetine capsules, and two 7.5 mg buspirone tablets for one 15 mg buspirone tablet, under circumstances in which some state Medicaid programs at various times reimbursed the new dosage form at a higher rate than the dosage form being substituted. We have provided documents in response to these subpoenas to the respective Attorneys General and the USOPM. The aforementioned subpoenas and civil investigative demands culminated in the federal and state law qui tam action brought on behalf of the United States and several states by Bernard Lisitza. The complaint was unsealed on August 30, 2011. Lisitza’s corrected second amended complaint seeks (i) a finding that defendants violated and be enjoined from future violations of the federal False Claims Act and state false claims acts; (ii) treble damages and maximum civil penalties for each violation of the federal False Claims Act and state false claims acts; (iii) an applicable percentage share of the proceeds; and (iv) expenses, fees, and costs. The United States intervened in this action on July 8, 2011 and filed a separate complaint on September 9, 2011, alleging claims for violations of the Federal False Claims Act and common law fraud. The United States’ second corrected Complaint seeks (i) treble damages and civil penalties for violations under the federal False Claims Act and (ii) compensatory and punitive damages for common law fraud. The states of Michigan and Indiana have also intervened as to claims arising under their respective state false claims acts, common law fraud, and unjust enrichment. Michigan’s complaint seeks (i) treble damages and civil penalties and (ii) common law compensatory and punitive damages. Indiana’s amended complaint seeks treble damages, costs, and attorney’s fees. We intend to vigorously defend these lawsuits.
Other
On March 19, 2009, we were served with a subpoena by the DOJ requesting documents related to Par Specialty’s marketing of Megace® ES. The subpoena indicated that the DOJ was investigating promotional practices in the sales and marketing of Megace® ES. We cooperated with the DOJ in this inquiry. On March 5, 2013, we entered into a settlement agreement with the DOJ that terminated the DOJ’s investigation. The settlement agreement provided for our payment of $45.0 million (plus interest and fees) and included a plea agreement with the New Jersey Criminal Division of the DOJ in which the Company admitted to a single count of misdemeanor misbranding, a civil settlement with the DOJ, a state settlement encompassing fortynine states (one state declined to participate due to the small amount of its potential recovery), and a release from each of these entities in favor of the Company related to the practices at issue in the terminated investigation. We accrued for the settlement in the period from January 1, 2012 through September 28, 2012 (Predecessor). The settlement was paid in 2013.
F-67
Table of Contents
On August 6, 2014, we received a subpoena from the Office of the Attorney General of the State of Connecticut requesting documents related to our agreement with Covis Pharma S.a.r.l. to distribute an authorized generic version of Covis’s Lanoxin® (digoxin) oral tablets. We completed our response on October 28, 2014.
On December 5, 2014, we received a subpoena from the Antitrust Division of the U.S. Department of Justice requesting documents related to communications with competitors regarding our authorized generic version of Covis’s Lanoxin® (digoxin) oral tablets and our generic doxycycline products. We intend to cooperate fully with the Department of Justice’s inquiry.
On February 3, 2015, we received a Civil Investigative Demand from Office of the Attorney General of the State of Alaska instructing production of, among other documents, all production in the on-going lawsuit filed against us in 2009 by the Bureau of Competition for the FTC and currently on remand to the U.S. District Court for the Northern District of Georgia, described above under “Patent Related Matters.” We intend to comply fully with the Civil Investigative Demand.
On February 9, 2015, we received a Civil Investigative Demand from the FTC instructing production of, among other documents, all documents related to our license agreement and manufacturing and supply agreement with Concordia Pharmaceuticals, Inc. relating to our sale of clonidine hydrochloride extended release tablets, the generic version of Concordia’s Kapvay®. We intend to comply fully with the Civil Investigative Demand.
We are, from time to time, a party to certain other litigations, including product liability litigations. We believe that these litigations are part of the ordinary course of our business and that their ultimate resolution will not have a material effect on our financial condition, results of operations or liquidity. We intend to defend or, in cases where we are the plaintiff, to prosecute these litigations vigorously.
Note 21—Segment information:
We operate in two reportable business segments: generic pharmaceuticals (referred to as “Par Pharmaceutical” or “Par”) and branded pharmaceuticals (referred to as “Par Specialty Pharmaceuticals” or “Par Specialty”). Branded products are marketed under brand names through marketing programs that are designed to generate physician and consumer loyalty. Branded products generally are patent protected, which provides a period of market exclusivity during which they are sold with little or no direct competition. Generic pharmaceutical products are the chemical and therapeutic equivalents of corresponding brand drugs. The Drug Price Competition and Patent Term Restoration Act of 1984 provides that generic drugs may enter the market upon the approval of an ANDA and the expiration, invalidation or circumvention of any patents on corresponding brand drugs, or the expiration of any other market exclusivity periods related to the brand drugs. Our chief operating decision maker is our Chief Executive Officer.
Our business segments were determined based on management’s reporting and decision-making requirements in accordance with FASB ASC 280-10 Segment Reporting. We believe that our generic products represent a single operating segment because the demand for these products is mainly driven by consumers seeking a lower cost alternative to brand name drugs. Par’s generic drugs are developed using similar methodologies, for the same purpose (e.g., seeking bioequivalence with a brand name drug nearing the end of its market exclusivity period for any reason discussed above). Par’s generic products are produced using similar processes and standards mandated by the FDA, and Par’s generic products are sold to similar customers. Based on the similar economic characteristics, production processes and customers of Par’s generic products, management has determined that Par’s generic pharmaceuticals are a single reportable business segment. Our chief operating decision maker does not review the Par (generic) or Par Specialty (brand) segments in any more granularity, such as at the therapeutic or other classes or categories. Certain of our expenses, such as the direct sales force and other sales and marketing expenses and specific research and development expenses, are
F-68
Table of Contents
charged directly to either of the two segments. Other expenses, such as general and administrative expenses and non-specific research and development expenses are allocated between the two segments based on assumptions determined by management.
Our chief operating decision maker does not review our assets, depreciation or amortization by business segment at this time as they are not material to Par Specialty. Therefore, such allocations by segment are not provided.
The financial data for the two business segments are as follows ($ in thousands):
| For the year ended |
For the year ended |
For the period | ||||||||||||||||
| December 31, 2014 |
December 31, 2013 |
July 12, 2012 to December 31, 2012 |
January 1, 2012 to September 28, 2012 |
|||||||||||||||
| (Successor) | (Successor) | (Successor) | (Predecessor) | |||||||||||||||
| Revenues: |
||||||||||||||||||
| Par Pharmaceutical |
$ | 1,241,131 | $ | 1,028,418 | $ | 227,312 | $ | 743,360 | ||||||||||
| Par Specialty |
67,490 | 69,049 | 18,827 | 60,508 | ||||||||||||||
|
|
|
|
|
|||||||||||||||
| Total revenues |
$ | 1,308,621 | $ | 1,097,467 | $ | 246,139 | $ | 803,868 | ||||||||||
| Gross margin: |
||||||||||||||||||
| Par Pharmaceutical |
436,078 | 271,396 | 33,776 | 296,338 | ||||||||||||||
| Par Specialty |
43,037 | 46,647 | 11,669 | 46,012 | ||||||||||||||
|
|
|
|
|
|||||||||||||||
| Total gross margin |
$ | 479,115 | $ | 318,043 | $ | 45,445 | $ | 342,350 | ||||||||||
| Operating (loss) income: |
||||||||||||||||||
| Par Pharmaceutical |
(30,938 | ) | (48,082 | ) | (48,526 | ) | 116,591 | |||||||||||
| Par Specialty |
(35,674 | ) | (17,361 | ) | (9,472 | ) | (57,151 | ) | ||||||||||
|
|
|
|
|
|||||||||||||||
| Total operating (loss) income |
$ | (66,612 | ) | $ | (65,443 | ) | $ | (57,998 | ) | $ | 59,440 | |||||||
| Gain on marketable securities and other investments, net |
— | 1,122 | — | — | ||||||||||||||
| Gain on bargain purchase |
— | — | 5,500 | — | ||||||||||||||
| Interest income |
18 | 87 | 50 | 424 | ||||||||||||||
| Interest expense |
(108,427 | ) | (95,484 | ) | (25,985 | ) | (9,159 | ) | ||||||||||
| Loss on debt extinguishment |
(3,989 | ) | (7,335 | ) | — | — | ||||||||||||
| Other income |
500 | — | — | — | ||||||||||||||
| (Benefit) provision for income taxes |
(72,993 | ) | (61,182 | ) | (23,727 | ) | 29,530 | |||||||||||
|
|
|
|
|
|||||||||||||||
| Net (loss) income |
$ | (105,517 | ) | $ | (105,871 | ) | $ | (54,706 | ) | $ | 21,175 | |||||||
|
|
||||||||||||||||||
F-69
Table of Contents
Total revenues of our top selling products were as follows ($ in thousands):
| For the year ended |
For the year ended |
For the period | ||||||||||||||||
| Product | December 31, 2014 |
December 31, 2013 |
July 12, 2012 to December 31, 2012 |
January 1, 2012 to September 28, 2012 |
||||||||||||||
| (Successor) | (Successor) | (Successor) | (Predecessor) | |||||||||||||||
| Par Pharmaceutical |
||||||||||||||||||
| Budesonide (Entocort® EC) |
$ | 142,853 | $ | 198,834 | $ | 36,710 | $ | 103,762 | ||||||||||
| Bupropion ER (Wellbutrin®) |
84,467 | 45,403 | 11,255 | 34,952 | ||||||||||||||
| Propafenone (Rythmol SR®) |
75,966 | 70,508 | 19,623 | 53,825 | ||||||||||||||
| Amlodipine/Valsartan (Exforge®) |
60,784 | — | — | — | ||||||||||||||
| Divalproex (Depakote®) |
59,052 | 46,635 | 2,436 | 9,099 | ||||||||||||||
| Metoprolol succinate ER (Toprol-XL®) |
46,251 | 56,670 | 31,287 | 154,216 | ||||||||||||||
| Clonidine ER (Kapvay®) |
45,134 | 13,008 | — | — | ||||||||||||||
| Lamotrigine (Lamictal XR®) |
40,673 | 54,577 | — | — | ||||||||||||||
|
Aplisol® |
35,228 | — | — | — | ||||||||||||||
| Modafinil (Provigil®) |
2,123 | 27,688 | 16,956 | 88,831 | ||||||||||||||
| Chlorpheniramine/Hydrocodone (Tussionex®) |
26,899 | 33,518 | 17,403 | 30,706 | ||||||||||||||
| Other(1) |
594,751 | 450,148 | 83,491 | 249,383 | ||||||||||||||
| Other product related revenues(2) |
26,950 | 31,429 | 8,151 | 18,586 | ||||||||||||||
|
|
|
|
|
|
|
|
|
|||||||||||
| Total Par Pharmaceutical Revenues |
$ | 1,241,131 | $ | 1,028,418 | $ | 227,312 | $ | 743,360 | ||||||||||
|
|
|
|
|
|
|
|
|
|||||||||||
| Par Specialty |
||||||||||||||||||
| Nascobal® Nasal Spray |
$ | 32,332 | $ | 26,864 | $ | 7,138 | $ | 17,571 | ||||||||||
| Megace® ES |
31,653 | 39,510 | 10,910 | 38,322 | ||||||||||||||
| Other product related revenues(2) |
3,505 | 2,675 | 779 | 4,615 | ||||||||||||||
|
|
|
|
|
|
|
|
|
|||||||||||
| Total Par Specialty Revenues |
$ | 67,490 | $ | 69,049 | $ | 18,827 | $ | 60,508 | ||||||||||
|
|
||||||||||||||||||
| (1) | The further detailing of revenues of the other approximately 85 generic drugs was not considered significant to the overall disclosure due to the lower volume of revenues associated with each of these generic products. No single product in the other category was significant to total generic revenues for the years ended December 31, 2014 (Successor) and December 31, 2013 (Successor), the period from July 12, 2012 (inception) to December 31, 2012 (Successor) or for the period from January 1, 2012 to September 28, 2012 (Predecessor). |
| (2) | Other product related revenues represents licensing and royalty related revenues from profit sharing agreements. |
Note 22—Restructuring costs:
2014
Subsequent to the Par Sterile Acquisition, we eliminated approximately 25 redundant positions within Par Pharmaceutical and accrued severance and other employee-related costs for those employees affected by the workforce reduction in the first quarter of 2014.
| ($ in thousands) | Non-cash | |||||||||||||||||||||||
| Restructuring activities (Par Sterile) | Initial charge |
Additional charge |
Cash payments |
charge related to inventory and/or intangible assets |
Reversals, reclass or transfers |
Liabilities at December 31, 2014 |
||||||||||||||||||
| Severance and employee benefits to be paid in cash |
$ | 1,146 | $ | 3,527 | $ | (2,686 | ) | $ | — | $ | — | $ | 1,987 | |||||||||||
|
|
|
|||||||||||||||||||||||
| Total restructuring costs line item |
$ | 1,146 | $ | 3,527 | $ | (2,686 | ) | $ | — | $ | — | $ | 1,987 | |||||||||||
|
|
||||||||||||||||||||||||
F-70
Table of Contents
Due to the change in our product development strategy, we eliminated approximately 44 redundant positions within our Irvine location and accrued severance and other employee-related costs for these employees affected by the workforce reduction.
| ($ in thousands) | Non-cash | |||||||||||||||||||||||
| Restructuring activities (Irvine) | Initial charge |
Additional charge |
Cash payments |
charge related to inventory and/or intangible assets |
Reversals, reclass or transfers |
Liabilities at December 31, 2014 |
||||||||||||||||||
| Severance and employee benefits to be paid in cash |
$ | 740 | $ | — | $ | (127 | ) | $ | — | $ | — | $ | 613 | |||||||||||
|
|
|
|||||||||||||||||||||||
| Total restructuring costs line item |
$ | 740 | $ | — | $ | (127 | ) | $ | — | $ | — | $ | 613 | |||||||||||
|
|
||||||||||||||||||||||||
2013
In January 2013, we initiated a restructuring of Par Specialty, our branded pharmaceuticals division, in anticipation of entering into a settlement agreement and corporate integrity agreement that terminated the U.S. Department of Justice’s ongoing investigation of Par Specialty’s marketing of Megace® ES. We reduced our Par Specialty workforce by approximately 70 people, with the majority of the reductions in the sales force. The remaining Par Specialty sales force has been reorganized into a single sales team of approximately 60 professionals that focus their marketing efforts principally on Nascobal® Nasal Spray. In connection with these actions, we incurred expenses for severance and other employee-related costs as well as the termination of certain contracts. There were no remaining liabilities at December 31, 2014 on the consolidated balance sheet.
| ($ in thousands) | Non-cash | |||||||||||||||||||
| Restructuring activities | Initial charge |
Cash payments |
charge related to inventory and/or intangible assets |
Reversals, reclass or transfers |
Liabilities at December 31, 2014 |
|||||||||||||||
| Severance and employee benefits to be paid in cash |
$ | 1,413 | $ | (1,409 | ) | $ | — | $ | (4 | ) | $ | — | ||||||||
| Asset impairments and other |
403 | — | (403 | ) | — | — | ||||||||||||||
|
|
|
|||||||||||||||||||
| Total restructuring costs line item |
$ | 1,816 | $ | (1,409 | ) | $ | (403 | ) | $ | (4 | ) | $ | — | |||||||
|
|
||||||||||||||||||||
Note 23—Subsequent events:
Refer to Note 6 — ”Pending acquisitions as of December 31, 2014” for acquisitions completed in January 2015.
In February 2015, the Company amended its existing Credit Agreement, which included new borrowings in an aggregate principal amount of $425.0 million. These new borrowings, along with cash on hand, were used to pay a $494.3 million cash dividend to the stockholders of Holdings. Pursuant to the terms of the Sky Growth Holdings Corporation 2012 Equity Incentive Plan, stock option holders are entitled to antidilution protection upon equity restructurings as defined ASC 718, including a recapitalization through a large nonrecurring dividend as noted above. The form of such antidilution protection is at the discretion of the Holdings Board of Directors acting as the Plan Administrator. Accordingly, the Plan Administrator provided each stock option holder the required antidilution protection either through a dividend-equivalent payment, a reduction of the exercise price of the applicable stock option awards or a combination thereof. The dividend-equivalent payments were approximately $36.5 million. In connection with dividend-equivalent payments related to unvested stock option awards, the Company expects to record a charge to accelerate a portion of unrecognized compensation expense in the first quarter of 2015. In addition, a special discretionary dividend-equivalent bonus was paid to certain employees granted awards under the Long-term Cash Incentive Award Agreement with Holdings of approximately $4.2 million, which the Company expects to record as compensation expense in the first quarter of 2015. The Company also incurred related financing fees and expenses totaling $7.7 million in connection with the new borrowings.
F-71
Table of Contents
Par Pharmaceutical Holdings, Inc.
Condensed consolidated balance sheets
(In thousands, except share and par value per share data)
(Unaudited)
| March 31, 2015 |
December 31, 2014 |
|||||||
| ASSETS |
||||||||
| Current assets: |
||||||||
| Cash and cash equivalents |
$ | 185,880 | $ | 244,440 | ||||
| Accounts receivable, net |
73,833 | 158,732 | ||||||
| Inventories |
166,761 | 154,687 | ||||||
| Prepaid expenses and other current assets |
26,076 | 28,255 | ||||||
| Deferred income tax assets |
68,057 | 66,936 | ||||||
|
|
|
|||||||
| Total current assets |
520,607 | 653,050 | ||||||
| Property, plant and equipment, net |
223,748 | 217,314 | ||||||
| Intangible assets, net |
1,006,177 | 1,040,753 | ||||||
| Goodwill |
1,036,958 | 1,012,108 | ||||||
| Other assets |
88,445 | 83,909 | ||||||
|
|
|
|||||||
| Total assets |
$ | 2,875,935 | $ | 3,007,134 | ||||
|
|
|
|||||||
| LIABILITIES AND STOCKHOLDERS’ EQUITY |
||||||||
| Current liabilities: |
||||||||
| Current portion of long-term debt |
$ | 18,753 | $ | 14,503 | ||||
| Accounts payable |
81,793 | 79,987 | ||||||
| Payables due to distribution agreement partners |
44,818 | 53,213 | ||||||
| Accrued salaries and employee benefits |
17,517 | 32,246 | ||||||
| Accrued government pricing liabilities |
23,942 | 42,647 | ||||||
| Accrued legal fees |
12,839 | 4,864 | ||||||
| Accrued interest payable |
16,563 | 7,529 | ||||||
| Accrued expenses and other current liabilities |
19,556 | 42,815 | ||||||
|
|
|
|||||||
| Total current liabilities |
235,781 | 277,804 | ||||||
| Long-term liabilities |
21,910 | 17,004 | ||||||
| Non-current deferred tax liabilities |
228,272 | 242,177 | ||||||
| Long-term debt, less current portion |
2,318,510 | 1,904,069 | ||||||
| Commitments and contingencies |
— | — | ||||||
| Stockholders’ equity: |
||||||||
| Common stock, $0.001 par value per share, 900,000,000 shares authorized 2015 and 2014; 784,251,980 and 784,335,270 issued and outstanding in 2015 and 2014, respectively |
784 | 784 | ||||||
| Additional paid-in capital |
323,828 | 835,880 | ||||||
| Accumulated deficit |
(245,809 | ) | (266,094 | ) | ||||
| Accumulated other comprehensive loss |
(5,380 | ) | (3,648 | ) | ||||
| Treasury stock |
(1,961 | ) | (842 | ) | ||||
|
|
|
|||||||
| Total stockholders’ equity |
71,462 | 566,080 | ||||||
|
|
|
|||||||
| Total liabilities and stockholders’ equity |
$ | 2,875,935 | $ | 3,007,134 | ||||
|
|
||||||||
The accompanying notes are an integral part of these condensed consolidated financial statements.
F-72
Table of Contents
Par Pharmaceutical Holdings, Inc.
Condensed consolidated statements of operations
(In thousands, except per share data)
(Unaudited)
| Three months ended | ||||||||
| March 31, 2015 |
March 31, 2014 |
|||||||
| Revenues: |
||||||||
| Net product sales |
$ | 353,119 | $ | 282,833 | ||||
| Other product related revenues |
6,125 | 6,251 | ||||||
|
|
|
|||||||
| Total revenues |
359,244 | 289,084 | ||||||
| Cost of goods sold, excluding amortization expense |
165,379 | 150,668 | ||||||
| Amortization expense |
48,792 | 44,102 | ||||||
|
|
|
|||||||
| Total cost of goods sold |
214,171 | 194,770 | ||||||
|
|
|
|||||||
| Gross margin |
145,073 | 94,314 | ||||||
| Operating expenses: |
||||||||
| Research and development |
26,850 | 34,624 | ||||||
| Selling, general and administrative |
56,386 | 50,941 | ||||||
| Intangible asset impairment |
— | 41,758 | ||||||
| Settlements and loss contingencies, net |
(25 | ) | — | |||||
| Restructuring costs |
363 | 1,146 | ||||||
|
|
|
|||||||
| Total operating expenses |
83,574 | 128,469 | ||||||
|
|
|
|||||||
| Operating income (loss) |
61,499 | (34,155 | ) | |||||
|
|
|
|||||||
| Interest income |
17 | 14 | ||||||
| Interest expense |
(29,511 | ) | (25,467 | ) | ||||
| Loss on debt extinguishment |
— | (3,989 | ) | |||||
|
|
|
|||||||
| Income (loss) before provision (benefit) for income taxes |
32,005 | (63,597 | ) | |||||
|
|
|
|||||||
| Provision (benefit) for income taxes |
11,720 | (24,232 | ) | |||||
|
|
|
|||||||
| Net income (loss) |
$ | 20,285 | $ | (39,365 | ) | |||
|
|
|
|||||||
| Net income (loss) per common share: |
||||||||
| Basic |
$ | 0.03 | $ | (0.05 | ) | |||
|
|
|
|||||||
| Diluted |
$ | 0.02 | $ | (0.05 | ) | |||
|
|
|
|||||||
| Weighted average number of common shares outstanding: |
||||||||
| Basic |
784,048 | 737,839 | ||||||
|
|
|
|||||||
| Diluted |
814,578 | 737,839 | ||||||
| Pro forma net income (unaudited) |
$ | — | ||||||
|
|
|
|||||||
| Pro forma net income per common share (unaudited): |
||||||||
| Basic |
$ | — | ||||||
|
|
|
|||||||
| Diluted |
$ | — | ||||||
|
|
|
|||||||
| Pro forma weighted average number of common shares outstanding (unaudited): |
||||||||
| Basic |
||||||||
|
|
|
|||||||
| Diluted |
||||||||
|
|
|
|||||||
|
|
||||||||
The accompanying notes are an integral part of these condensed consolidated financial statements.
F-73
Table of Contents
Par Pharmaceutical Holdings, Inc.
Condensed consolidated statements of comprehensive income (loss)
(In thousands)
(Unaudited)
| Three months ended | ||||||||
| March 31, 2015 |
March 31, 2014 |
|||||||
| Net income (loss) |
$ | 20,285 | $ | (39,365 | ) | |||
| Other comprehensive loss, net of tax: |
||||||||
| Unrealized loss on marketable securities, net of tax |
— | (6 | ) | |||||
| Unrealized loss on cash flow hedges, net of tax |
(2,666 | ) | (1,212 | ) | ||||
| Less: reclassification adjustment for realized losses included in net income (loss), |
934 | 635 | ||||||
|
|
|
|||||||
| Other comprehensive loss |
(1,732 | ) | (583 | ) | ||||
|
|
|
|||||||
| Comprehensive income (loss) |
$ | 18,553 | $ | (39,948 | ) | |||
|
|
||||||||
The accompanying notes are an integral part of these condensed consolidated financial statements.
F-74
Table of Contents
Par Pharmaceutical Holdings, Inc.
Condensed consolidated statements of cash flows
(In thousands)
(Unaudited)
| Three months ended | ||||||||
| March 31, 2015 |
March 31, 2014 |
|||||||
| Cash flows from operating activities: |
||||||||
| Net income (loss) |
$ | 20,285 | $ | (39,365 | ) | |||
| Adjustments to reconcile net income (loss) to net cash provided by operating activities: |
||||||||
| Deferred income taxes |
(14,539 | ) | (28,036 | ) | ||||
| Depreciation and amortization |
57,082 | 50,663 | ||||||
| Non-cash interest expense |
2,742 | 2,686 | ||||||
| Cost of goods on acquired inventory step up |
— | 2,986 | ||||||
| Intangible asset impairment |
— | 41,758 | ||||||
| Allowances against accounts receivable |
(14,175 | ) | 13,520 | |||||
| Share-based compensation expense |
5,213 | 942 | ||||||
| Loss on debt extinguishment |
— | 3,989 | ||||||
| Other, net |
109 | (53 | ) | |||||
| Changes in assets and liabilities: |
||||||||
| Decrease in accounts receivable |
99,373 | 41,997 | ||||||
| Increase in inventories |
(11,443 | ) | (20,984 | ) | ||||
| Decrease (increase) in prepaid expenses and other assets |
3,455 | (1,343 | ) | |||||
| (Decrease) increase in accounts payable, accrued expenses and other liabilities |
(36,733 | ) | 36,386 | |||||
| Decrease in payables due to distribution agreement partners |
(8,395 | ) | (12,102 | ) | ||||
| Decrease in income taxes receivable/payable |
(2,767 | ) | (3,905 | ) | ||||
|
|
|
|||||||
| Net cash provided by operating activities |
100,207 | 89,139 | ||||||
| Cash flows from investing activities: |
||||||||
| Capital expenditures |
(8,492 | ) | (13,212 | ) | ||||
| Business acquisitions, net of cash acquired |
(34,793 | ) | (478,647 | ) | ||||
| Purchases of intangibles |
(8,000 | ) | — | |||||
| Proceeds from available for sale marketable debt securities |
— | 1,000 | ||||||
|
|
|
|||||||
| Net cash used in investing activities |
(51,285 | ) | (490,859 | ) | ||||
| Cash flows from financing activities: |
||||||||
| Proceeds from debt |
422,875 | 525,541 | ||||||
| Payments of debt |
(4,688 | ) | (140,191 | ) | ||||
| Proceeds from equity contributions |
416 | 110,000 | ||||||
| Debt issuance costs |
(6,069 | ) | (3,150 | ) | ||||
| Cash dividend paid |
(494,300 | ) | — | |||||
| Dividend-equivalent payments to Holdings stock option holders, net of tax |
(23,367 | ) | — | |||||
| Costs for issuance of capital |
(1,217 | ) | — | |||||
| Stock-based compensation plan settlements |
(13 | ) | — | |||||
| Purchase of treasury stock |
(1,119 | ) | — | |||||
|
|
|
|||||||
| Net cash (used in) provided by financing activities |
(107,482 | ) | 492,200 | |||||
| Net (decrease) increase in cash and cash equivalents |
(58,560 | ) | 90,480 | |||||
| Cash and cash equivalents at beginning of period |
244,440 | 130,080 | ||||||
|
|
|
|||||||
| Cash and cash equivalents at end of period |
$ | 185,880 | $ | 220,560 | ||||
|
|
|
|||||||
| Supplemental disclosure of cash flow information: |
||||||||
| Cash paid during the period for: |
||||||||
| Income taxes, net |
$ | 15,829 | $ | 7,721 | ||||
|
|
|
|||||||
| Interest paid |
$ | 17,735 | $ | 13,631 | ||||
|
|
|
|||||||
| Non-cash transactions: |
||||||||
| Capital expenditures incurred but not yet paid |
$ | 556 | $ | 731 | ||||
|
|
||||||||
The accompanying notes are an integral part of these condensed consolidated financial statements.
F-75
Table of Contents
Par Pharmaceutical Holdings, Inc.
Notes to condensed consolidated financial statements
March 31, 2015
(Unaudited)
Par Pharmaceutical Holdings, Inc., (“Holdings”), formerly known as Sky Growth Holdings Corporation, formed July 12, 2012, operates primarily through its indirect, wholly owned domestic subsidiaries Par Pharmaceutical Companies, Inc. (“PPCI”), issuer of the outstanding public debt and Par Pharmaceutical Inc. (collectively with Holdings and PPCI, referred to herein as “the Company,” “we,” “our,” or “us”). PPCI was the holding company prior to the Merger. Prior to the Merger, we conducted our operations through the subsidiaries of PPCI and we continue to do so subsequent to the Merger. After the Merger, consolidated PPCI and consolidated Holdings have the same financial statements, excluding merger-related costs that were recorded on the books and records of Holdings. On March 4, 2015, Sky Growth Holdings Corporation changed its name to Par Pharmaceutical Holdings, Inc. The Company operates in two business segments or divisions. The generic products division, Par Pharmaceutical (“Par”), develops (including through third party development arrangements and product acquisitions), manufactures and distributes generic and sterile pharmaceuticals in the United States. The branded products division, Par Specialty Pharmaceuticals (“Par Specialty”), formerly known as Strativa Pharmaceuticals, acquires, manufactures and distributes branded pharmaceuticals in the United States. The products we market are principally in the solid oral dosage form (tablet, caplet and two-piece hard-shell capsule), although we also distribute several oral suspension products, and nasal spray products.
PPCI entered into an Agreement and Plan of Merger on July 14, 2012 (the “Merger Agreement) and was acquired at the close of business on September 28, 2012, through a merger transaction with Sky Growth Acquisition Corporation, a wholly owned subsidiary of the Company. Holdings was formed on July 12, 2012 by investment funds affiliated with TPG Capital, L.P. (“TPG” and, together with certain affiliated entities, collectively, the “Sponsor”). PPCI is owned by affiliates of the Sponsor and members of management. The acquisition was accomplished through a reverse subsidiary merger of Sky Growth Acquisition Corporation with and into PPCI, with PPCI being the surviving entity (the “Merger”). Subsequent to the Merger, PPCI became an indirect, wholly owned subsidiary of Holdings (see Note 2—“Sky Growth Merger”). Prior to September 29, 2012, PPCI operated as a public company with its common stock traded on the New York Stock Exchange.
Note 1—Basis of presentation and recently issued accounting standards:
The accompanying condensed consolidated financial statements at March 31, 2015 and for the three-month periods ended March 31, 2015 and March 31, 2014 are unaudited. In the opinion of management, however, such statements include all normal recurring adjustments necessary to present fairly the information presented therein. The condensed consolidated balance sheet at December 31, 2014 was derived from the Company’s audited consolidated financial statements included elsewhere in this prospectus.
The accompanying condensed consolidated financial statements and these notes to condensed consolidated financial statements do not include all disclosures required by the accounting principles generally accepted in the United States of America for audited financial statements. Accordingly, these statements should be read in conjunction with our audited consolidated financial statements for the year ended December 31, 2014 included elsewhere in this prospectus. Results of operations for interim periods are not necessarily indicative of those that may be achieved for full fiscal years.
F-76
Table of Contents
Pro forma financial information
Pro forma earnings per common share (unaudited)
In February 2015, we amended our credit agreement governing the Senior Credit Facilities, which included new borrowings in an aggregate principal amount of $425.0 million that were used to pay a cash dividend to our stockholders of $494.3 million and, pursuant to the terms of the Sky Growth Holdings Corporation 2012 Equity Incentive Plan, dividend-equivalent payments to certain employees of $36.5 million and a special discretionary dividend-equivalent bonus totaling $4.2 million to certain employees (the “Dividend Recapitalization”).
For the purposes of the pro forma earnings per share of common share calculations, Holdings has assumed that the Dividend Recapitalization had occurred as of January 1, 2014. The basic and diluted pro forma per share of common stock calculations presented below give effect to the Dividend Recapitalization and the number of common shares whose net proceeds from the sale of such common shares would be necessary to fund the Dividend Recapitalization in addition to historical EPS.
The basic pro forma earnings per common share is computed by dividing net income available to common shareholders by the pro forma weighted average number of common shares outstanding during the period. The diluted pro forma earnings per common share calculation also assume the conversion, exercise or issuance of all potential common shares.
The below table sets forth the computation of unaudited pro forma basic and diluted income per common share for the three months ended March 31, 2015:
| (In thousands, except per share data) | March 31, 2015 | |
| Numerator: |
||
| Net income as reported |
||
| Net income pro forma adjustments: | ||
| Interest expense, net of tax |
||
| Amortization of debt issuance costs and discounts, net of tax |
||
|
| ||
| Pro forma net income |
||
|
| ||
| Denominator: |
||
| Weighted average common shares used in computing basic and diluted loss per common share outstanding |
||
| Adjustment for common stock issued whose proceeds would be necessary to fund the Dividend Recapitalization |
||
| Pro forma weighted average common shares used in computing basic income per common share outstanding |
||
|
| ||
| Pro forma basic income per common share |
||
|
| ||
| Pro forma weighted average common shares used in computing diluted income per common share outstanding |
||
|
| ||
| Pro forma diluted income per common share |
||
|
|
|
Recently issued accounting standards
In May 2014, the Financial Accounting Standards Board (“FASB”) issued Accounting Standards Update 2014-09, Revenue from Contracts with Customers (Topic 606) (ASU No. 2014-09). This new standard will replace all current U.S. GAAP guidance on this topic and eliminate all industry-specific guidance. In April 2015, the FASB issued an exposure draft proposing to defer the effective date of the new revenue standard for interim and annual periods beginning after December 15, 2017 (previously December 15, 2016). The proposal will allow
F-77
Table of Contents
public entities to adopt the new standard as early as the original public entity effective date (i.e. annual reporting periods beginning after December 15, 2016 and interim periods therein). Early adoption prior to that date will not be permitted. ASU 2014-09 allows for either full retrospective or modified retrospective adoption. The Company is evaluating the transition method that will be elected and the potential effects of adopting the provisions of ASU No. 2014-09.
In March 2015, the FASB issued ASU 2015-03, “Interest—Imputation of Interest (Subtopic 835-30): Simplifying the Presentation of Debt Issuance Costs” (“ASU 2015-03”) intended to simplify the presentation of debt issuance costs. These amendments require that debt issuance costs related to a recognized debt liability be presented in the balance sheet as a direct deduction from the carrying amount of that debt liability, consistent with debt discounts. The recognition and measurement guidance for debt issuance costs are not affected by the amendments in ASU 2015-03. The pronouncement is effective for public business entities for financial statements issued for fiscal years beginning after December 15, 2015, and interim periods within those fiscal years. For all other entities, the amendments are effective for financial statements issued for fiscal years beginning after December 15, 2015, and interim periods within fiscal years beginning after December 15, 2016. Early adoption is permitted for financial statements that have not been previously issued. We currently do not anticipate a material impact of ASU 2015-03 on our condensed consolidated financial statements and related disclosures.
Note 2—Sky Growth merger:
The transactions
PPCI was acquired at the close of business on September 28, 2012 through the Merger. Holdings and its wholly-owned subsidiaries were formed by affiliates of TPG solely for the purposes of completing the Merger and the related transactions. At the time of the Merger, each share of our common stock issued and outstanding immediately prior to the close of the Merger was converted into the right to receive cash. Aggregate consideration tendered at September 28, 2012 was for 100% of the equity of PPCI. Subsequent to the Merger, PPCI became an indirect, wholly owned subsidiary of Holdings.
The Merger was accounted for as a purchase business combination in accordance with ASC 805, “Business Combinations,” (“ASC 805”) whereby the purchase price paid to effect the Merger was allocated to recognize the acquired assets and liabilities assumed at fair value. The acquisition method of accounting uses the fair value concept defined in ASC 820, Fair Value Measurements and Disclosures (“ASC 820”).
Transactions with manager
In connection with the Merger and the related transactions, PPCI entered into a management services agreement with an affiliate of TPG (the “Manager”). Pursuant to the agreement, in exchange for on-going consulting and management advisory services, the Manager receives an annual monitoring fee paid quarterly equal to 1% of EBITDA as defined under the credit agreement for the Senior Credit Facilities (as defined in Note 14—“Debt”). There is an annual cap of $4.0 million for this fee. The Manager also receives reimbursement for out-of-pocket expenses incurred in connection with services provided pursuant to the agreement. We recorded an expense of $1.0 million and $0.9 million for consulting and management advisory service fees which are included in selling, general and administrative expenses in the condensed consolidated statement of operations for the three months ended March 31, 2015 and 2014.
Note 3—Par Sterile acquisition:
On February 20, 2014, the Company completed its acquisition of JHP Group Holdings, Inc. and its subsidiaries (collectively, “JHP”), a privately-held, specialty sterile products pharmaceutical company. The acquisition was
F-78
Table of Contents
accomplished through a reverse subsidiary merger of an indirect subsidiary of the Company with and into JHP Group Holdings, Inc., in which JHP Group Holdings, Inc. was the surviving entity and became an indirect, wholly owned subsidiary of the Company (the “Par Sterile Acquisition”). The consideration for the Par Sterile Acquisition consisted of $487.0 million in cash, after finalization of certain customary working capital adjustments. The Company financed the Par Sterile Acquisition with proceeds received in connection with the debt financing provided by third party lenders of $395.0 million and an equity contribution of $110.0 million from certain investment funds associated with TPG. Among the primary reasons the Company acquired JHP and the factors that contributed to the preliminary recognition of goodwill was that the Par Sterile Acquisition expanded its capability and presence into the rapidly growing sterile drug market for injectable products including ophthalmics and otics. The result is a broader and more diversified product portfolio, and an expanded development pipeline.
JHP operated principally through its operating subsidiary, JHP Pharmaceuticals, LLC, which was renamed Par Sterile Products, LLC (“Par Sterile”) subsequent to the Par Sterile Acquisition. We continue to operate Par Sterile as a specialty pharmaceutical company developing and manufacturing sterile injectable products. Par Sterile’s products are primarily sold through wholesalers, often via an arrangement with a group purchasing organization, prior to being dispensed at hospitals or directly administered by physicians. Par Sterile targets products with limited competition due to difficulty in manufacturing and/or the product’s market size. Our Par Sterile manufacturing facility in Rochester, Michigan has the capability to manufacture small-scale clinical through large-scale commercial products.
The operating results of Par Sterile for the three months ended March 31, 2015 are included in the accompanying condensed consolidated statement of operations as part of the Par Pharmaceutical segment, reflecting total revenues of $66.6 million. Par Sterile’s contribution to the overall Par Pharmaceutical segment’s operating income is not tracked separately. The condensed consolidated balance sheet as of March 31, 2015 reflects the acquisition, including goodwill, which represents Par Sterile’s workforce expertise in research and development, marketing and manufacturing.
The acquisition has been accounted for as a business purchase combination using the acquisition method of accounting under the provisions of ASC 805. The acquisition method of accounting uses the fair value concept defined in ASC 820. ASC 805 requires, among other things, that most assets acquired and liabilities assumed in a business purchase combination be recognized at their fair values as of the acquisition date and that the fair value of acquired in-process research and development (“IPR&D”) be recorded on the balance sheet regardless of the likelihood of success of the related product or technology as of the completion of the acquisition. The process for estimating the fair values of IPR&D, identifiable intangible assets and certain tangible assets requires the use of significant estimates and assumptions, including estimating future cash flows, developing appropriate discount rates, estimating the costs, timing and probability of success to complete in-process projects and projecting regulatory approvals. Under ASC 805, transaction costs are not included as a component of consideration transferred and were expensed as incurred. The acquisition and financing transaction costs totaled $12.4 million of which $8.2 million were included in operating expenses as selling, general and administrative expenses on the condensed consolidated statements of operations and $4.1 million were capitalized as deferred financing costs or debt discount on the consolidated balance sheet. The acquisition-related transaction costs were comprised of bank fees ($10.4 million), legal fees ($1.5 million), and other fees ($0.5 million). The excess of the purchase price (consideration transferred) over the estimated amounts of identifiable assets and liabilities of Par Sterile as of the effective date of the acquisition was allocated to goodwill, as part of the Par Pharmaceutical segment, in accordance with ASC 805. The purchase price allocation was finalized with the completion of our analysis of the fair value of the assets and liabilities of Par Sterile as of the effective date of the acquisition. The establishment of the fair value of the consideration for an acquisition, and the allocation to identifiable tangible and intangible assets and liabilities, requires the
F-79
Table of Contents
extensive use of accounting estimates and management judgment. We believe the fair values assigned to the assets acquired and liabilities assumed are based on reasonable estimates and assumptions.
The sources and uses of funds in connection with the Par Sterile Acquisition are summarized below ($ in thousands):
| Sources: | Uses: | |||||||||
| Senior secured term loan |
$ | 395,000 | Cash purchase of equity | $ | 487,429 | (a) | ||||
| Sponsor equity contribution |
110,000 | Transaction costs | 12,350 | |||||||
| Company cash on hand |
1,133 | (a) | Accrued interest on Company debt | 6,354 | ||||||
|
|
|
|
|
|||||||
| Total source of funds |
$ | 506,133 | Total use of funds | $ | 506,133 | |||||
|
|
||||||||||
| (a) | Adjusted to reflect the finalization of working capital adjustments noted above. |
Fair value estimate of assets acquired and liabilities assumed
The purchase price of Par Sterile has been allocated to the following assets and liabilities ($ in thousands):
| As of February 20, 2014 | ||||
| Cash and cash equivalents |
$ | 9,204 | ||
| Accounts receivable, net |
5,413 | |||
| Inventories |
35,959 | |||
| Prepaid expenses and other current assets |
10,583 | |||
| Property, plant and equipment |
73,579 | |||
| Intangible assets |
283,500 | |||
|
|
|
|||
| Total identifiable assets |
418,238 | |||
|
|
|
|||
| Accounts payable |
13,796 | |||
| Accrued expenses and other liabilities |
1,902 | |||
| Deferred tax liabilities |
71,493 | |||
|
|
|
|||
| Total liabilities assumed |
87,191 | |||
|
|
|
|||
| Net identifiable assets acquired |
331,047 | |||
| Goodwill |
156,382 | |||
|
|
|
|||
| Net assets acquired |
$ | 487,429 | ||
|
|
||||
Approximately $20.0 million of the goodwill identified above and recorded on the condensed consolidated balance sheet as of March 31, 2015 has been and will be deductible for income tax purposes.
Supplemental pro forma information (unaudited)
The following unaudited pro forma information for the quarter ended March 31, 2014 assumes the Par Sterile Acquisition occurred as of January 1, 2013. The unaudited pro forma results reflect certain adjustments related to past operating performance, the impact of the debt assumed, acquisition costs and acquisition accounting adjustments, such as increased depreciation and amortization expense based on the fair valuation of assets acquired and the related tax effects. The pro forma information is not necessarily indicative either of the combined results of operations that actually would have been realized had the Par Sterile Acquisition been consummated during the period for which pro forma information is presented, or is it intended to be a projection of future results or trends.
F-80
Table of Contents
| Three months ended | ||||
| (In thousands) | March 31, 2014 | |||
| Total revenues |
$ | 308,146 | ||
| Loss from continuing operations |
$ | (29,476 | ) | |
| Net loss per common share: Basic and Diluted |
$ | (0.04 | ) | |
|
|
||||
Note 4—Par Biosciences acquisition:
On January 14, 2015, we completed the acquisition of a privately-held Chennai, India-based clinical research organization (“CRO”), which we renamed Par Biosciences Private Limited (“Par Biosciences”), for $10.0 million. The operating results of Par Biosciences were included in our condensed consolidated financial results from the date of acquisition. The purchase price was paid in cash and funded from our cash on hand.
The operating results of Par Biosciences from January 14, 2015 through March 31, 2015 are included in the accompanying condensed consolidated statement of operations as part of the Par Pharmaceutical segment, reflecting an immaterial impact on income before taxes. The condensed consolidated balance sheet as of March 31, 2015 reflects the acquisition, including goodwill, which represents Par Biosciences’ workforce expertise in research and development.
The acquisition has been accounted for as a business purchase combination using the acquisition method of accounting under the provisions of ASC 805. The acquisition method of accounting uses the fair value concept defined in ASC 820. ASC 805 requires, among other things, that most assets acquired and liabilities assumed in a business purchase combination be recognized at their fair values as of the acquisition date. The process for estimating the fair values of certain identifiable assets requires the use of significant estimates and assumptions, including estimating future cash flows, developing appropriate discount rates, and estimating the costs. Under ASC 805, transaction costs are not included as a component of consideration transferred and were expensed as incurred. The acquisition-related transaction costs incurred for the quarter ended March 31, 2015 totaled $0.5 million which were included in operating expenses as selling, general and administrative on the condensed consolidated statements of operations. The excess of the purchase price (consideration transferred) over the estimated amounts of identifiable assets and liabilities of Par Biosciences as of the effective date of the acquisition was allocated to goodwill, as part of the Par Pharmaceutical segment, in accordance with ASC 805. The purchase price allocation is subject to completion of our analysis of the fair value of the assets and liabilities as of the effective date of the acquisition. Accordingly, the purchase price allocation below is preliminary and will be adjusted upon completion of the final valuation. These adjustments are not expected to be material. The final valuation is expected to be completed as soon as practicable but no later than one year from the consummation of the acquisition. The establishment of the fair value of the consideration for an acquisition, and the allocation to identifiable tangible and intangible assets and liabilities, requires the extensive use of accounting estimates and management judgment. We believe the fair values assigned to the assets acquired and liabilities assumed are based on reasonable estimates and assumptions based on data currently available.
Consideration transferred
The acquisition-date fair value of the consideration transferred consisted of the following items ($ amounts in thousands):
| Cash paid for equity |
$ | 8,761 | ||
| Deferred purchase price liabilities |
1,231 | (1) | ||
|
|
|
|||
| Total consideration |
$ | 9,992 | ||
|
|
||||
| (1) | Deferred purchase price liabilities represent two subsequent deferred payments due on the first and third anniversary of the closing date. |
F-81
Table of Contents
Fair value estimate of assets acquired and liabilities assumed
The purchase price of Par Biosciences has been allocated on a preliminary basis to the following assets and liabilities ($ in thousands):
| As of January 14, 2015 | ||||
| Cash and cash equivalents |
$ | 72 | ||
| Prepaid expenses and other assets |
213 | |||
| Property, plant and equipment |
3,370 | |||
|
|
|
|||
| Total identifiable assets |
3,655 | |||
|
|
|
|||
| Accounts payable / accrued expenses and other liabilities |
605 | |||
|
|
|
|||
| Total liabilities assumed |
605 | |||
|
|
|
|||
| Net identifiable assets acquired |
3,050 | |||
| Goodwill |
6,942 | |||
|
|
|
|||
| Net assets acquired |
$ | 9,992 | ||
|
|
||||
Approximately $0.3 million of the goodwill identified above and recorded on the condensed consolidated balance sheet as of March 31, 2015 will be deductible for income tax purposes.
Pro forma results of operations for the acquisition of Par Biosciences have not been presented because the acquisition is not material to our consolidated results of operations.
Note 5—Innoteq acquisition:
On January 9, 2015, we completed our acquisition of Innoteq, Inc. (“Innoteq”), a privately-held domestic corporation that is engaged in the business of researching, developing and manufacturing transdermal patches and thin film, slow dissolve film, coated/non-woven film and other coated pharmaceutical and consumer products, for $26.4 million. The operating results of Innoteq were included in our condensed consolidated financial results from the date of acquisition. The purchase price was paid in cash and funded from our cash on hand.
The operating results of Innoteq from January 9, 2015 through March 31, 2015 are included in the accompanying condensed consolidated statement of operations as part of the Par Pharmaceutical segment, reflecting an immaterial impact on income before taxes. The condensed consolidated balance sheet as of March 31, 2015 reflects the acquisition, including goodwill, which represents Innoteq’s workforce expertise in research and development.
The acquisition has been accounted for as a business purchase combination using the acquisition method of accounting under the provisions of ASC 805. The acquisition method of accounting uses the fair value concept defined in ASC 820. ASC 805 requires, among other things, that most assets acquired and liabilities assumed in a business purchase combination be recognized at their fair values as of the acquisition date. The process for estimating the fair values of identifiable intangible assets and certain tangible assets requires the use of significant estimates and assumptions, including estimating future cash flows, developing appropriate discount rates, estimating the costs, timing and probability of success to complete in-process projects and projecting regulatory approvals. Under ASC 805, transaction costs are not included as a component of consideration transferred and were expensed as incurred. The acquisition-related transaction costs incurred for the quarter ended March 31, 2015 totaled $0.8 million which were included in operating expenses as selling, general and administrative on the condensed consolidated statements of operations. The excess of the purchase price
F-82
Table of Contents
(consideration transferred) over the estimated amounts of identifiable assets and liabilities of Innoteq as of the effective date of the acquisition was allocated to goodwill, as part of the Par Pharmaceutical segment, in accordance with ASC 805. The purchase price allocation is subject to completion of our analysis of the fair value of the assets and liabilities as of the effective date of the acquisition. Accordingly, the purchase price allocation below is preliminary and will be adjusted upon completion of the final valuation. These adjustments are not expected to be material. The final valuation is expected to be completed as soon as practicable but no later than one year from the consummation of the acquisition. The establishment of the fair value of the consideration for an acquisition, and the allocation to identifiable tangible and intangible assets and liabilities, requires the extensive use of accounting estimates and management judgment. We believe the fair values assigned to the assets acquired and liabilities assumed are based on reasonable estimates and assumptions based on data currently available.
Fair value estimate of assets acquired and liabilities assumed
The purchase price of Innoteq has been allocated on a preliminary basis to the following assets and liabilities ($ in thousands):
| As of January 9, 2015 | ||||
| Cash and cash equivalents |
$ | 268 | ||
| Prepaid expenses and other assets |
1,189 | |||
| Property, plant and equipment |
3,557 | |||
| Intangible assets |
5,800 | |||
| Contract assets |
1,008 | |||
| Deferred tax asset non-current |
2,014 | |||
|
|
|
|||
| Total identifiable assets |
13,836 | |||
|
|
|
|||
| Accounts payable / accrued expenses and other liabilities |
2,870 | |||
| Deferred tax liabilities |
2,503 | |||
|
|
|
|||
| Total liabilities assumed |
5,373 | |||
|
|
|
|||
| Net identifiable assets acquired |
8,463 | |||
| Goodwill |
17,908 | |||
|
|
|
|||
| Net assets acquired |
$ | 26,371 | ||
|
|
||||
None of the goodwill identified above and recorded on the condensed consolidated balance sheet as of March 31, 2015 will be deductible for income tax purposes.
Pro forma results of operations for the acquisition of Innoteq have not been presented because the acquisition is not material to our consolidated results of operations.
Note 6—Pending acquisition of Nuray assets:
In December 2014, our wholly-owned subsidiary, Par Formulations Private Limited, entered into an agreement to purchase certain assets of privately-held Nuray Chemicals Private Limited (“Nuray”), a Chennai, India based developer and manufacturer of active pharmaceutical ingredients (“API”) for approximately $20.0 million in cash, contingent payments and other consideration. A vice president of the Company is a minority shareholder of Nuray. The assets to be acquired via a definitive agreement consist of a FDA approved facility that manufactures API, including real property, improvements and related assets. The closing of the acquisition is subject to the receipt of applicable regulatory approvals and other customary closing terms and conditions. The
F-83
Table of Contents
acquisition will be accounted for as a business combination under the guidance of ASC 805. The operating results of the acquired business will be included in our consolidated financial results from the date of the closing of the acquisition as part of the Par Pharmaceutical segment. We intend to fund the purchase from cash on hand.
Note 7—Fair value measurements:
ASC 820-10 Fair Value Measurements and Disclosures defines fair value as the price that would be received for an asset or paid to transfer a liability (an exit price) in the principal or most advantageous market for the asset or liability in an orderly transaction between market participants on the measurement date. ASC 820 requires that assets and liabilities carried at fair value be classified and disclosed in one of the following three categories:
| Level 1: | Quoted market prices in active markets for identical assets and liabilities. Active market means a market in which transactions for assets or liabilities occur with “sufficient frequency” and volume to provide pricing information on an ongoing unadjusted basis. Cash equivalents include highly liquid investments with an original maturity of three months or less at acquisition. We have determined that our cash equivalents in their entirety are classified as Level 1 within the fair value hierarchy. | |
| Level 2: | Observable inputs other than Level 1 prices, such as quoted prices for similar assets or liabilities; or other inputs that are observable or can be corroborated by observable market data for substantially the full term of the assets or liabilities. Our Level 2 assets primarily include debt securities, including corporate bonds with quoted prices that are traded less frequently than exchange-traded instruments. All of our Level 2 asset values are determined using a pricing model with inputs that are observable in the market or can be derived principally from or corroborated by observable market data. The pricing model information is provided by third party entities (e.g., banks or brokers). In some instances, these third party entities engage external pricing services to estimate the fair value of these securities. We have a general understanding of the methodologies employed by the pricing services in their pricing models. We corroborate the estimates of non-binding quotes from the third party entities’ pricing services to an independent source that provides quoted market prices from broker or dealer quotations. We investigate large differences, if any. Based on historical differences, we have not been required to adjust quotes provided by the third party entities’ pricing services used in estimating the fair value of these securities. | |
| Level 3: | Unobservable inputs that are not corroborated by market data. | |
Financial assets and liabilities
The fair value of our financial assets and liabilities measured at fair value as of March 31, 2015 were as follows ($ in thousands):
| Estimated fair value at |
Level 1 | Level 2 | Level 3 | |||||||||||||
| Cash equivalents |
$ | 100,010 | $ | 100,010 | $ | — | $ | — | ||||||||
| Senior secured term loan (Note 14) |
$ | 1,860,789 | $ | — | $ | 1,860,789 | $ | — | ||||||||
| 7.375% senior notes (Note 14) |
$ | 520,625 | $ | — | $ | 520,625 | $ | — | ||||||||
| Derivative instruments—Interest rate caps (Note 15) |
$ | 8,407 | $ | — | $ | 8,407 | $ | — | ||||||||
|
|
||||||||||||||||
F-84
Table of Contents
The fair value of our financial assets and liabilities measured at fair value as of December 31, 2014 were as follows ($ in thousands):
| Estimated fair value at December 31, 2014 |
Level 1 | Level 2 | Level 3 | |||||||||||||
| Cash equivalents |
$ | 100,002 | $ | 100,002 | $ | — | $ | — | ||||||||
| Senior secured term loan (Note 14) |
$ | 1,399,941 | $ | — | $ | 1,399,941 | $ | — | ||||||||
| 7.375% senior notes (Note 14) |
$ | 507,763 | $ | — | $ | 507,763 | $ | — | ||||||||
| Derivative instruments—Interest rate caps (Note 15) |
$ | 5,700 | $ | — | $ | 5,700 | $ | — | ||||||||
|
|
||||||||||||||||
The carrying amount reported in the condensed consolidated balance sheets for accounts receivables, net, inventories, prepaid expenses and other current assets, accounts payable, payables due to distribution agreement partners, accrued salaries and employee benefits, accrued government pricing liabilities, accrued legal settlements, and accrued expenses and other current liabilities approximate fair value because of their short-term nature.
There have been no transfers between Level 1 and Level 2 of the fair value hierarchy as of March 31, 2015 or December 31, 2014.
Non-financial assets and liabilities
The Company does not have any non-financial assets or liabilities as of March 31, 2015 or December 31, 2014 that are measured in the condensed consolidated financial statements at fair value.
Intangible assets
During the three months ended March 31, 2014, we recorded intangible asset impairments totaling $41.8 million for two products not expected to achieve their originally forecasted operating results.
Derivative instruments—interest rate caps
We use interest rate cap agreements to manage our interest rate risk on our variable rate long-term debt. Refer to Note 15—“Derivatives Instruments and Hedging Activities,” for further information.
Note 8—Accounts receivable:
We account for revenue in accordance with ASC 605 “Revenue Recognition”. In accordance with that standard, we recognize revenue for product sales when title and risk of loss have transferred to our customers, when reliable estimates of rebates, chargebacks, returns and other adjustments can be made, and when collectability is reasonably assured. This is generally at the time that products are received by our direct customers. We also review available trade inventory levels at certain large wholesalers to evaluate any potential excess supply levels in relation to expected demand. We determine whether we will recognize revenue at the time that our products are received by our direct customers or defer revenue recognition until a later date on a product by product basis at the time of launch. Upon recognizing revenue from a sale, we record estimates for chargebacks, rebates and incentive programs, product returns, cash discounts and other sales reserves that reduce accounts receivable.
F-85
Table of Contents
The following tables summarize the impact of accounts receivable reserves and allowance for doubtful accounts on the gross trade accounts receivable balances at each balance sheet date ($ in thousands):
|
March 31, 2015 |
December 31, 2014 |
|||||||
| Gross trade accounts receivable |
$ | 466,620 | $ | 565,694 | ||||
| Chargebacks |
(93,531 | ) | (96,492 | ) | ||||
| Rebates and incentive programs |
(129,544 | ) | (138,989 | ) | ||||
| Returns |
(98,198 | ) | (84,330 | ) | ||||
| Cash discounts and other |
(71,335 | ) | (86,797 | ) | ||||
| Allowance for doubtful accounts |
(179 | ) | (354 | ) | ||||
|
|
|
|||||||
| Accounts receivable, net |
$ | 73,833 | $ | 158,732 | ||||
|
|
||||||||
Allowance for doubtful accounts
| Three months ended | ||||||||
| ($ in thousands) | March 31, 2015 |
March 31, 2014 |
||||||
| Par balance at beginning of period |
$ | (354 | ) | $ | (7 | ) | ||
| Par Sterile beginning balance |
— | (278 | ) | |||||
| Additions—charge to expense |
(3 | ) | (99 | ) | ||||
| Adjustments and/or deductions |
178 | 93 | ||||||
|
|
|
|||||||
| Balance at end of period |
$ | (179 | ) | $ | (291 | ) | ||
|
|
||||||||
The following tables summarize the activity for the three months ended March 31, 2015 and for the three months ended March 31, 2014, in the accounts affected by the estimated provisions described below ($ in thousands):
| Three months ended March 31, 2015 | ||||||||||||||||||||
| Accounts receivable reserves | Beginning balance |
Provision current |
(Provision) for prior period sales |
Credits processed |
Ending balance |
|||||||||||||||
| Chargebacks |
$ | (96,492 | ) | $ | (205,642 | ) | $ | — | (1) | $ | 208,603 | $ | (93,531 | ) | ||||||
| Rebates and incentive programs |
(138,989 | ) | (143,651 | ) | — | 153,096 | (129,544 | ) | ||||||||||||
| Returns |
(84,330 | ) | (21,949 | ) | — | 8,081 | (98,198 | ) | ||||||||||||
| Cash discounts and other |
(86,797 | ) | (70,389 | ) | 3,812 | (3) | 82,039 | (71,335 | ) | |||||||||||
|
|
|
|||||||||||||||||||
| Total |
$ | (406,608 | ) | $ | (441,631 | ) | $ | 3,812 | $ | 451,819 | $ | (392,608 | ) | |||||||
|
|
|
|||||||||||||||||||
| Accrued liabilities(2) |
$ | (42,647 | ) | $ | (12,527 | ) | $ | — | $ | 31,232 | $ | (23,942 | ) | |||||||
|
|
||||||||||||||||||||
F-86
Table of Contents
| Three months ended March 31, 2014 | ||||||||||||||||||||||||
| Accounts receivable reserves | Beginning balance |
Par Sterile beginning balance |
Provision recorded for current period sales |
(Provision) for prior |
Credits processed |
Ending balance |
||||||||||||||||||
| Chargebacks |
$ | (48,766 | ) | $ | (5,886 | ) | $ | (189,919 | ) | $ | — | (1) | $ | 186,461 | $ | (58,110 | ) | |||||||
| Rebates and incentive programs |
(75,321 | ) | (5,489 | ) | (92,684 | ) | — | 89,541 | (83,953 | ) | ||||||||||||||
| Returns |
(78,181 | ) | (4,398 | ) | (7,112 | ) | — | 5,101 | (84,590 | ) | ||||||||||||||
| Cash discounts and other |
(37,793 | ) | (1,792 | ) | (55,741 | ) | (1,399 | )(4) | 52,239 | (44,486 | ) | |||||||||||||
|
|
|
|||||||||||||||||||||||
| Total |
$ | (240,061 | ) | $ | (17,565 | ) | $ | (345,456 | ) | $ | (1,399 | ) | $ | 333,342 | $ | (271,139 | ) | |||||||
|
|
|
|||||||||||||||||||||||
| Accrued liabilities(2) |
$ | (35,829 | ) | $ | (382 | ) | $ | (16,076 | ) | $ | 1,755 | (5) | $ | 20,020 | $ | (30,512 | ) | |||||||
|
|
||||||||||||||||||||||||
| (1) | Unless specific in nature, the amount of provision or reversal of reserves related to prior periods for chargebacks is not determinable on a product or customer specific basis. Based upon historical analysis and analysis of activity in subsequent periods, we believe that our chargeback estimates remain reasonable. |
| (2) | Includes amounts due to indirect customers for which no underlying accounts receivable exists and is principally comprised of Medicaid rebates and rebates due under other U.S. Government pricing programs, such as TriCare and the Department of Veterans Affairs. |
| (3) | The Company received lower than expected claims related to price adjustments accrued during the period September 2014 through December 2014. As a result, during the first quarter of 2015, the Company recorded a benefit of approximately $3.8 million. |
| (4) | During the three months ended March 31, 2014, the Company recorded additional reserves totaling approximately $1.4 million related to prior year claims from customers for various price decreases for the years 2009 through 2012. |
| (5) | During three months ended March 31, 2014, we received further additional information related to Managed Medicaid utilization in California and performed a recalculation of average manufacturer’s price. As a result we reduced our Medicaid accruals by approximately $2.4 million related to the periods March 2010 through December 2013. This activity was partially offset by the expense of $0.7 million related to disputed TriCare claims for the period from January 2009 through December 2013. |
The Company sells its products directly to wholesalers, retail drug store chains, drug distributors, mail order pharmacies and other direct purchasers as well as customers that purchase its products indirectly through the wholesalers, including independent pharmacies, non-warehousing retail drug store chains, managed health care providers and other indirect purchasers. The Company often negotiates product pricing directly with health care providers that purchase products through the Company’s wholesale customers. In those instances, chargeback credits are issued to the wholesaler for the difference between the invoice price paid to the Company by our wholesale customer for a particular product and the negotiated contract price that the wholesaler’s customer pays for that product. The information that the Company considers when establishing its chargeback reserves includes contract and non-contract sales trends, average historical contract pricing, actual price changes, processing time lags and customer inventory information from its three largest wholesale customers. The Company’s chargeback provision and related reserve vary with changes in product mix, changes in customer pricing and changes to estimated wholesaler inventory.
Customer rebates and incentive programs are generally provided to customers as an incentive for the customers to continue carrying the Company’s products or replace competing products in their distribution channels with our products. Rebate programs may be based on either a wholesale or non-wholesale customer’s direct purchases. Rebates may also be based on a non-wholesale customer’s indirect purchases of the Company’s products from a wholesaler under a contract with us. The incentive programs include stocking or trade show promotions where additional discounts may be given on a new product or certain existing products as an added incentive to stock the Company’s products. We may, from time to time, also provide price and/or volume incentives on new products that have multiple competitors and/or on existing products that confront new competition in order to attempt to secure or maintain a certain market share. The information that the Company considers when establishing its rebate and incentive program reserves are rebate agreements with, and purchases by, each customer, tracking and analysis of promotional offers, projected annual sales for customers with annual incentive programs, actual rebates and incentive payments made, processing time lags,
F-87
Table of Contents
and for indirect rebates, the level of inventory in the distribution channel that will be subject to indirect rebates. We do not provide incentives designed to increase shipments to our customers that we believe would result in out-of-the-ordinary course of business inventory for them. The Company regularly reviews and monitors estimated or actual customer inventory information at its three largest wholesale customers for its key products to ascertain whether customer inventories are in excess of ordinary course of business levels.
Pursuant to a drug rebate agreement with the Centers for Medicare and Medicaid Services, TriCare and similar supplemental agreements with various states, the Company provides a rebate on drugs dispensed under such government programs. The Company determines its estimate of the Medicaid rebate accrual primarily based on historical experience of claims submitted by the various states and any new information regarding changes in the Medicaid program that might impact the Company’s provision for Medicaid rebates. In determining the appropriate accrual amount we consider historical payment rates; processing lag for outstanding claims and payments; levels of inventory in the distribution channel; and the impact of the healthcare reform acts. The Company reviews the accrual and assumptions on a quarterly basis against actual claims data to help ensure that the estimates made are reliable. On January 28, 2008, the Fiscal Year 2008 National Defense Authorization Act was enacted, which expands TriCare to include prescription drugs dispensed by TriCare retail network pharmacies. TriCare rebate accruals reflect this program and are based on actual and estimated rebates on Department of Defense eligible sales.
The Company accepts returns of product according to the following criteria: (i) the product returns must be approved by authorized personnel with the lot number and expiration date accompanying any request and (ii) we generally will accept returns of products from any customer and will provide the customer with a credit memo for such returns if such products are returned between six months prior to, and 12 months following, such products’ expiration date. The Company records a provision for product returns based on historical experience, including actual rate of expired and damaged in-transit returns, average remaining shelf-lives of products sold, which generally range from 12 to 48 months, and estimated return dates. Additionally, we consider other factors when estimating the current period return provision, including levels of inventory in the distribution channel, significant market changes that may impact future expected returns, and actual product returns, and may record additional provisions for specific returns that we believe are not covered by the historical rates. The Company generally will accept returns of injectable products from any customer and provide the customer with a credit memo for returns if such products are returned between six months prior to and six months following, such products’ expiration date. The Company’s returns policy also states that refrigerated and temperature controlled injectable products are non-returnable.
The Company offers cash discounts to its customers, generally 2% of the sales price, as an incentive for paying within invoice terms, which generally range from 30 to 90 days. The Company accounts for cash discounts by reducing accounts receivable by the full amount of the discounts that we expect our customers to take.
In addition to the significant gross-to-net sales adjustments described above, we periodically make other sales adjustments. The Company generally accounts for these other gross-to-net adjustments by establishing an accrual in the amount equal to its estimate of the adjustments attributable to the sale.
The Company may at its discretion provide price adjustments due to various competitive factors, through shelf-stock adjustments on customers’ existing inventory levels. There are circumstances under which we may not provide price adjustments to certain customers as a matter of business strategy, and consequently may lose future sales volume to competitors and risk a greater level of sales returns on products that remain in the customer’s existing inventory.
As detailed above, we have the experience and access to relevant information that we believe are necessary to reasonably estimate the amounts of such deductions from gross revenues, except as described below. Some of
F-88
Table of Contents
the assumptions we use for certain of our estimates are based on information received from third parties, such as wholesale customer inventories and market data, or other market factors beyond our control. The estimates that are most critical to the establishment of these reserves, and therefore, would have the largest impact if these estimates were not accurate, are estimates related to contract sales volumes, average contract pricing, customer inventories and return volumes. The Company regularly reviews the information related to these estimates and adjusts its reserves accordingly, if and when actual experience differs from previous estimates. With the exception of the product returns allowance, the ending balances of accounts receivable reserves and allowances generally are processed during a two-month to four-month period.
Use of estimates in reserves
We believe that our reserves, allowances and accruals for items that are deducted from gross revenues are reasonable and appropriate based on current facts and circumstances. It is possible however, that other parties applying reasonable judgment to the same facts and circumstances could develop different allowance and accrual amounts for items that are deducted from gross revenues. Additionally, changes in actual experience or changes in other qualitative factors could cause our allowances and accruals to fluctuate, particularly with newly launched or acquired products. We review the rates and amounts in our allowance and accrual estimates on a quarterly basis. If future estimated rates and amounts are significantly greater than those reflected in our recorded reserves, the resulting adjustments to those reserves would decrease our reported net revenues; conversely, if actual product returns, rebates and chargebacks are significantly less than those reflected in our recorded reserves, the resulting adjustments to those reserves would increase our reported net revenues. We regularly review the information related to these estimates and adjust our reserves accordingly, if and when actual experience differs from previous estimates.
As is customary and in the ordinary course of business, our revenue that has been recognized for product launches included initial trade inventory stocking that we believed was commensurate with new product introductions. At the time of each product launch, we were able to make reasonable estimates of product returns, rebates, chargebacks and other sales reserves by using historical experience of similar product launches and significant existing demand for the products.
Note 9—Inventories:
| ($ in thousands) | March 31, 2015 |
December 31, 2014 |
||||||
| Raw materials and supplies |
$ | 66,642 | $ | 60,020 | ||||
| Work-in-process |
24,948 | 26,343 | ||||||
| Finished goods |
75,171 | 68,324 | ||||||
|
|
|
|||||||
| $ | 166,761 | $ | 154,687 | |||||
|
|
||||||||
Inventory write-offs (inclusive of pre-launch inventories detailed below)
| Three months ended | ||||||||
| ($ in thousands) | March 31, 2015 |
March 31, 2014 |
||||||
| Inventory write-offs |
$ | 3,718 | $ | 2,235 | ||||
|
|
||||||||
Par capitalizes inventory costs associated with certain products prior to regulatory approval and product launch, based on management’s judgment of reasonably certain future commercial use and net realizable
F-89
Table of Contents
value, when it is reasonably certain that the pre-launch inventories will be saleable. The determination to capitalize is made once Par (or its third party development partners) has filed an abbreviated new drug application (“ANDA”) that has been acknowledged by the FDA as containing sufficient information to allow the FDA to conduct its review in an efficient and timely manner and management is reasonably certain that all regulatory and legal hurdles will be cleared. This determination is based on the particular facts and circumstances relating to the expected FDA approval of the generic drug product being considered, and accordingly, the time frame within which the determination is made varies from product to product. Par could be required to write down previously capitalized costs related to pre-launch inventories upon a change in such judgment, or due to a denial or delay of approval by regulatory bodies, or a delay in commercialization, or other potential factors. As of March 31, 2015, Par had approximately $5.4 million in inventories related to generic products that were not yet available to be sold.
Par Specialty also capitalizes inventory costs associated with in-licensed branded products subsequent to FDA approval but prior to product launch based on management’s judgment of probable future commercial use and net realizable value. We believe that numerous factors must be considered in determining probable future commercial use and net realizable value including, but not limited to, Par Specialty’s limited number of historical product launches, as well as the ability of third party partners to successfully manufacture commercial quantities of product. Par Specialty could be required to expense previously capitalized costs related to pre-launch inventory upon a change in such judgment, due to a delay in commercialization, product expiration dates, projected sales volume, estimated selling price or other potential factors. As of March 31, 2015, Par Specialty had approximately $0.1 million in inventories related to products that were not yet available to be sold.
The amounts in the table below represent inventories related to products that were not yet available to be sold and are also included in the total inventory balances presented above.
Pre-launch inventories
| ($ in thousands) | March 31, 2015 |
December 31, 2014 |
||||||
| Raw materials and supplies |
$ | 4,209 | $ | 4,515 | ||||
| Work-in-process |
479 | 386 | ||||||
| Finished goods |
792 | 134 | ||||||
|
|
|
|||||||
| $ | 5,480 | $ | 5,035 | |||||
|
|
||||||||
Write-offs of pre-launch inventories
| Three months ended | ||||||||
| ($ in thousands) | March 31, 2015 |
March 31, 2014 |
||||||
| Pre-launch inventory write-offs, net of partner allocation |
$ | 493 | $ | 493 | ||||
|
|
||||||||
F-90
Table of Contents
Note 10—Property, plant and equipment, net:
| ($ in thousands) | March 31, 2015 |
December 31, 2014 |
||||||
| Land |
$ | 11,063 | $ | 11,063 | ||||
| Buildings |
63,822 | 63,589 | ||||||
| Machinery and equipment |
107,034 | 97,129 | ||||||
| Office equipment, furniture and fixtures |
17,976 | 12,849 | ||||||
| Computer software and hardware |
28,075 | 26,369 | ||||||
| Leasehold improvements |
26,942 | 26,774 | ||||||
| Construction in progress |
35,470 | 37,981 | ||||||
|
|
|
|||||||
| 290,382 | 275,754 | |||||||
| Accumulated depreciation and amortization |
(66,634 | ) | (58,440 | ) | ||||
|
|
|
|||||||
| $ | 223,748 | $ | 217,314 | |||||
|
|
||||||||
Depreciation and amortization expense related to property, plant and equipment
| Three months ended | ||||||||
| ($ in thousands) | March 31, 2015 |
March 31, 2014 |
||||||
| Depreciation and amortization expense |
$ | 8,274 | $ | 6,543 | ||||
|
|
||||||||
Note 11—Intangible assets, net:
| March 31, 2015 | December 31, 2014 | |||||||||||||||||||||||
| ($ in thousands) | Cost | Accumulated Amortization |
Net | Cost | Accumulated amortization |
Net | ||||||||||||||||||
| Developed products(1) |
$ | 965,166 | $ | (417,933 | ) | $ | 547,233 | $ | 957,166 | $ | (373,602 | ) | $ | 583,564 | ||||||||||
| Other product related royalty streams |
115,600 | (41,254 | ) | 74,346 | 115,600 | (37,334 | ) | 78,266 | ||||||||||||||||
| IPR&D(2) |
351,614 | — | 351,614 | 351,614 | — | 351,614 | ||||||||||||||||||
| Trade names(3) |
27,100 | (153 | ) | 26,947 | 27,100 | (118 | ) | 26,982 | ||||||||||||||||
| Other(4) |
6,952 | (915 | ) | 6,037 | 1,153 | (826 | ) | 327 | ||||||||||||||||
|
|
|
|||||||||||||||||||||||
| $ | 1,466,432 | $ | (460,255 | ) | $ | 1,006,177 | $ | 1,452,633 | $ | (411,880 | ) | $ | 1,040,753 | |||||||||||
|
|
||||||||||||||||||||||||
| (1) | Developed products include intangible assets related to commercial products as part of the Merger, subsequently developed IPR&D, products acquired from the Watson/Actavis Merger (as defined below), intangible assets related to commercial products as part of the Par Sterile Acquisition, and other intangible assets related to commercial products. These products are amortized based on their remaining useful lives. |
| (2) | IPR&D indefinite-lived assets include IPR&D as part of the Merger, IPR&D acquired from the Watson/Actavis Merger, and IPR&D acquired as part of the Par Sterile Acquisition. |
| (3) | Trade names include Par and Par Sterile trade names. Par Sterile trade name is amortized over its useful life, while the Par trade name is treated as an indefinite-lived asset and is not amortized. |
| (4) | Included in other are certain product rights associated with our 2015 acquisition of Innoteq. |
We recorded amortization expense related to intangible assets of $48.4 million for the three months ended March 31, 2015 and $44.1 million for the three months ended March 31, 2014. Amortization expense was included in cost of goods sold.
F-91
Table of Contents
Intangible assets acquired in the merger
PPCI was acquired on September 28, 2012 through a merger transaction. Refer to Note 2—“Sky Growth Merger” for details of the transaction. As part of the Merger, we revalued intangible assets related to commercial products (developed technology), royalty streams, IPR&D, and our trade name.
The remaining net book value of the related intangible asset related to developed products will be amortized over a weighted average amortization period of approximately five years.
IPR&D assets are related to R&D projects that were incomplete at the Merger. There are 58 projects associated with IPR&D. Due to the nature of our generic product portfolio pipeline, individual products in the annual IPR&D groups are expected to launch within an annual time period or reasonably close thereto. When the first product of each annual IPR&D group launches, it is our policy to commence amortization of the entire annual group utilizing the related cash flows expected to be generated for the annual group. The remaining net book value of the related intangible asset associated with subsequently developed annual IPR&D groups will be amortized over a weighted average amortization period of approximately seven years.
Trade names constitute intellectual property rights and are marketing-related intangible assets. Our corporate trade name was valued using a relief from royalty method of the income approach and accounted for as an indefinite-lived intangible asset that will be subject to annual impairment testing or whenever events or changes in business circumstances necessitate an evaluation for impairment using a fair value approach.
Intangible assets acquired with the divested products from the Watson/Actavis Merger
On November 6, 2012, we acquired the U.S. marketing rights to five generic products that were currently marketed by Watson or Actavis, as well as eight ANDAs awaiting regulatory approval and a generic product in late-stage development, in connection with the merger of Watson Pharmaceuticals, Inc. and Actavis Group on November 6, 2012 (the “Watson/Actavis Merger”).
The remaining net book value of the related intangible asset related to developed products will be amortized over a weighted average amortization period of approximately five years.
IPR&D consists of technology-related intangible assets used in research & development activities, which were incomplete at the time of the acquisition. Upon the successful completion and launch of a product in the group, we will make a separate determination of useful life of the related IPR&D intangible asset and commence amortization.
Intangible assets acquired with the Par Sterile acquisition
On February 20, 2014, we acquired intangible assets as part of the Par Sterile Acquisition. Refer to Note 3—“Par Sterile Acquisition,” for further details. The intangible assets related to commercial products (developed technology), IPR&D, and the JHP trade name.
The fair value of the developed technology and in-process research and development intangible assets were estimated using the discounted cash flow method of the income approach. We believe that the level and timing of cash flows appropriately reflect market participant assumptions. Some of the significant assumptions inherent in the development of the identifiable intangible asset valuations, from the perspective of a market participant, include the estimated net cash flows by year by project or product (including net revenues, costs of sales, research and development costs, selling and marketing costs and other charges), the appropriate discount rate to select in order to measure the risk inherent in each future cash flow stream, the assessment of each asset’s life cycle, competitive trends impacting the asset and each cash flow stream, and other factors.
F-92
Table of Contents
Developed products are defined as products that are commercialized, all research and development efforts have been completed by the seller, and final regulatory approvals have been received. The developed product intangible assets are composite assets, comprising the market position of the product, the developed technology utilized, and the customer base to which the products are sold. Developed technology and the customer base were considered but have not been identified separately as any related cash flows would be very much intertwined with the product related intangibles. Developed products held by the Company are considered separable from the business as they could be sold to a third party. Developed products were valued using a multi-period excess earnings method under the income approach. The principle behind this method is that the value of the intangible asset is equal to the present value of the after-tax cash flows attributable to the intangible asset only. The remaining net book value of the related intangible asset related to developed products will be amortized over a weighted average amortization period of approximately nine years.
IPR&D is related to research and development projects that were incomplete at the time of the Par Sterile Acquisition. We grouped and valued IPR&D based on the projected year of launch for each group, with the exception of one project that was expected to produce large cash flows in the future and we valued this project by itself. IPR&D is considered separable from the business as it could be sold to a third party. The value of IPR&D was accounted for as an indefinite-lived intangible asset and will be subject to impairment testing until the completion or abandonment of each group. Upon the successful completion and launch of a product in a group, we will make a separate determination of useful life of the IPR&D intangible asset and commence amortization. This methodology resulted in six groups of IPR&D (2014 through 2018 plus a group with a single IPR&D project). When the first product of each IPR&D group launches, it is our policy to commence amortization of the entire group utilizing the related cash flows expected to be generated for the group. Due to the nature of our generic injectable product portfolio pipeline, individual products in the IPR&D groups are expected to launch within an annual time period or reasonably close thereto.
Trade names constitute intellectual property rights and are marketing-related intangible assets. The related trade name was valued using a relief from royalty method of the income approach and accounted for with a five year useful life based on expected utility. This asset will be subject to impairment testing whenever events or changes in business circumstances necessitate an evaluation for impairment using a fair value approach.
During the three months ended March 31, 2015, we acquired a NDA from AstraZeneca for Zafirlukast for $8.0 million along with a short term supply agreement. We recorded an intangible asset in the same amount which will be amortized over the expected life of the product of three years.
Intangible asset impairments
During the three months ended March 31, 2014, we recorded intangible asset impairments totaling $41.8 million for two products not expected to achieve their originally forecasted operating results.
F-93
Table of Contents
Estimated amortization expense for existing intangible assets at March 31, 2015
The following table does not include estimated amortization expense for future milestone payments that may be paid and result in the creation of intangible assets after March 31, 2015 and assumes the intangible asset related to the Par trade name as an indefinite-lived asset will not be amortized in the future.
| ($ in thousands) | Estimated amortization expense |
|||
| Remainder of 2015 |
$ | 107,854 | ||
| 2016 |
154,664 | |||
| 2017 |
173,434 | |||
| 2018 |
135,456 | |||
| 2019 |
114,679 | |||
| 2020 and thereafter |
293,690 | |||
|
|
|
|||
| $ | 979,777 | |||
|
|
||||
Note 12—Goodwill:
| ($ in thousands) | March 31, 2015 |
December 31, 2014 |
||||||
| Balance at beginning of period |
$ | 1,012,108 | $ | 855,726 | ||||
| Additions: |
||||||||
| Par Sterile Acquisition(1) |
— | 156,382 | ||||||
| Par Biosciences Acquisition(2) |
6,942 | — | ||||||
| Innoteq Acquisition(3) |
17,908 | — | ||||||
|
|
|
|||||||
| Balance at end of period |
$ | 1,036,958 | $ | 1,012,108 | ||||
|
|
||||||||
| (1) | As noted in Note 3—“Par Sterile Acquisition,” we acquired Par Sterile as of February 20, 2014. Based upon our purchase price allocation, we recorded $156.4 million of incremental goodwill. This goodwill was allocated to Par. |
| (2) | As noted in Note 4—“Par Biosciences Acquisition,” we acquired Par Biosciences as of January 14, 2015. Based upon our purchase price allocation, we recorded $6.9 million of incremental goodwill. This goodwill was allocated to Par. |
| (3) | As noted in Note 5—“Innoteq Acquisition,” we acquired Innoteq as of January 9, 2015. Based upon our purchase price allocation, we recorded $17.9 million of incremental goodwill. This goodwill was allocated to Par. |
Goodwill is not being amortized, but is tested at least annually, on or about October 1st or whenever events or changes in business circumstances necessitate an evaluation for impairment using a fair value approach. The goodwill impairment test consists of a two-step process. The first step is to identify a potential impairment and the second step measures the amount of impairment, if any. We will perform a qualitative assessment (“Step Zero analysis”) to determine whether it is necessary to perform the two-step goodwill impairment test. The Step Zero analysis entails an assessment of the totality of events and circumstances that could affect the comparison of a reporting unit’s fair value with its carrying amount. Goodwill is deemed to be impaired if the carrying amount of a reporting unit exceeds its estimated fair value. As of October 1, 2014, Par performed its annual goodwill impairment assessment and concluded there was no impairment. No impairments of goodwill had been recognized through March 31, 2015.
Note 13—Income Taxes:
| Three months ended | ||||||||
| ($ in thousands) | March 31, 2015 |
March 31, 2014 |
||||||
| Provision (benefit) for income taxes |
$ | 11,720 | $ | (24,232 | ) | |||
| Effective tax rate |
37% | 38% | ||||||
|
|
||||||||
F-94
Table of Contents
The effective tax rate for the three months ended March 31, 2015 and 2014 reflects benefits for deductions specific to U.S. domestic manufacturing companies, offset by our nondeductible portion of the annual pharmaceutical manufacturers’ fee under the Patient Protection and Affordable Care Act.
Current deferred income tax assets at March 31, 2015 consist of temporary differences primarily related to accounts receivable reserves and inventory reserves. Non-current deferred income tax liabilities at March 31, 2015 consist of timing differences primarily related to intangible assets, debt, depreciation and stock compensation.
The Company is no longer subject to IRS audit for periods prior to 2012. We are currently under audit in two state jurisdictions for the years 2005 to 2009. In most other state jurisdictions, we are no longer subject to examination by state tax authorities for years prior to 2008.
We reflect interest and penalties attributable to income taxes, to the extent they arise, as a component of income tax provision or benefit.
The difference between a tax position taken or expected to be taken in a tax return and the benefit recognized and measured pursuant to ASC 740-10 represents an unrecognized tax benefit. An unrecognized tax benefit is a liability that represents a potential future obligation to the taxing authorities. An unrecognized tax benefit is a liability that represents a potential future obligation to the taxing authorities. As of March 31, 2015, we had $18.6 million included in “Long-term liabilities” on the condensed consolidated balance sheet that represented unrecognized tax benefits, interest and penalties based on evaluation of tax positions. During the three months ended March 31, 2015, we recorded an increase in unrecognized tax benefits of $1.8 million as a result of tax positions taken during the period. We expect that a portion of this total liability could potentially settle in the next 12 months. However, the dollar range for a potential settlement cannot be estimated at this time.
Note 14—Debt:
| ($ in thousands) | March 31, 2015 |
December 31, 2014 |
||||||
| Senior credit facilities: |
||||||||
| Senior secured term loan |
$ | 1,856,148 | $ | 1,435,837 | ||||
| Senior secured revolving credit facility |
— | — | ||||||
| 7.375% senior notes |
490,000 | 490,000 | ||||||
|
|
|
|||||||
| 2,346,148 | 1,925,837 | |||||||
| Less unamortized debt discount to senior secured term loan |
(8,885 | ) | (7,265 | ) | ||||
| Less current portion |
(18,753 | ) | (14,503 | ) | ||||
|
|
|
|||||||
| Long-term debt |
$ | 2,318,510 | $ | 1,904,069 | ||||
|
|
||||||||
Senior Credit Facilities
In connection with the Merger, on September 28, 2012, we entered into a credit agreement (the “Credit Agreement”) with a syndicate of banks, led by Bank of America, N.A., as Administrative Agent, Bank of America, N.A., Deutsche Bank Securities, Inc., Goldman Sachs Bank USA, Citigroup Global Markets, Inc., RBC Capital Markets LLC and BMO Capital Markets Corp. as Joint Lead Arrangers and Joint Lead Bookrunners, Deutsche Bank Securities, Inc. and Goldman Sachs Bank USA as Co-Syndication Agents, and Citigroup Global Markets Inc. and RBC Capital Markets LLC as Co-Documentation Agents, to provide senior credit facilities comprised of a seven-year senior secured term loan in an initial aggregate principal amount of $1,055.0 million (the “Term Loan Facility”) and a five-year senior secured revolving credit facility in an initial amount of $150.0 million (the “Revolving Facility” and together with the Term Loan Facility, the “Senior Credit Facilities”). The proceeds of the Revolving Facility are available for general corporate purposes.
F-95
Table of Contents
The Credit Agreement contains customary representations and warranties, as well as customary events of default, in certain cases subject to reasonable and customary periods to cure, including but not limited to: failure to make payments when due, breach of covenants, breach of representations and warranties, insolvency proceedings, certain judgments and any change of control. The Credit Agreement also contains various customary covenants that, in certain instances, restrict our ability to: (i) create liens on assets; (ii) incur additional indebtedness; (iii) engage in mergers or consolidations with or into other companies; (iv) engage in dispositions of assets, including entering into a sale and leaseback transaction; (v) pay dividends and distributions or repurchase capital stock; (vi) make investments, loans, guarantees or advances in or to other companies; (vii) change the nature of our business; (viii) repay or redeem certain junior indebtedness, (ix) engage in transactions with affiliates; and (x) enter into restrictive agreements. In addition, the Credit Agreement requires us to demonstrate compliance with a maximum senior secured first lien leverage ratio whenever amounts are outstanding under the revolving credit facility as of the last day of any quarterly testing period. All obligations under the Credit Agreement are guaranteed by our material domestic subsidiaries. We were in compliance with all applicable covenants as of March 31, 2015.
The Credit Agreement includes an accordion feature pursuant to which we may increase the amount available to be borrowed by up to an additional $250.0 million (or a greater amount if we meet certain specified financial ratios) under certain circumstances. Repayments of the proceeds of the term loan were due in quarterly installments over the term of the Credit Agreement. Amounts borrowed under the revolving credit facility would be payable in full upon expiration of the Credit Agreement. We are also obligated to pay a commitment fee based on the unused portion of the Revolving Facility.
We are obligated to make mandatory principal prepayments for any fiscal year if the ratio of total amount of outstanding senior secured debt less cash and cash equivalents divided by our consolidated EBITDA is greater than 2.50 to 1.00 as of December 31 of any fiscal year. When the ratio is greater than 2.50 to 1.00 but less than or equal to 3.00 to 1.00, we are required to pay 25% of excess cash flows, as defined in the Credit Agreement. When the ratio is greater than 3.00 to 1.00, we are required to pay 50% of excess cash flows in the form of principal prepayments. For the year ended December 31, 2014 we were not obligated to make any mandatory principal prepayments during the first quarter of 2015.
Amendments and additional borrowing—2015
On February 20, 2015, we entered into an amendment to our Senior Credit Facility which was effective as of February 25, 2015. The amendment increased the first lien net leverage levels included in the financial maintenance covenant, which covenant only applies to the extent there are revolving loans, swingline loans or letters of credit (excluding undrawn letters of credit to the extent cash collateralized) outstanding.
On February 25, 2015, we entered into another amendment to our Senior Credit Facility which authorized the funding of a new tranche of term loans (the “Term B-3 Loans”) in an aggregate principal amount of $425.0 million. The terms of the Term B-3 Loans are substantially the same as the terms of the existing Term B-2 Loans, except that (1) the interest rate margins applicable to Term B-3 Loans are 3.25% for LIBOR and 2.25% for base rate, a 25 basis point increase compared to the Term B-2 Loans, and (2) the Term B-3 Loans are subject to a soft call provision applicable to the optional prepayment of the loans which requires a premium equal to 1.00% of the aggregate principal amount of the loans being prepaid if, on or prior to August 25, 2015, the Company enters into certain repricing transactions. Additionally, all voluntary and mandatory prepayments of outstanding term loans must be made pro rata among the Term B-3 Loans and the Term B-2 Loans. Borrowings under the Term B-3 Loans, along with cash on hand, were used to fund the Dividend Recapitalization, as explained in Note 17—“Share-Based Compensation”.
F-96
Table of Contents
In connection with the transactions described herein, we incurred related transaction costs for the quarter ended March 31, 2015 that totaled $8.2 million which were capitalized as deferred financing costs or debt discount on the condensed consolidated balance sheet.
Repricing of the term loan facility and additional borrowings—2014
On February 20, 2014, in conjunction with our acquisition of Par Sterile, we entered into an amendment to our Senior Credit Facility that refinanced all of the outstanding tranche B-1 term loans of the Borrower (the “Existing Tranche B Term Loans”) with new tranche B-2 term loans (the “New Tranche B Term Loans”) in an aggregate principal amount of $1,055.0 million. The terms of the New Tranche B Term Loans are substantially the same as the terms of the then Existing Tranche B Term Loans, except that (1) the interest rate margins applicable to the New Tranche B Term Loans are 3.00% for LIBOR and 2.00% for base rate, a 25 basis point reduction compared to the Existing Tranche B Term Loans, and (2) the New Tranche B Loans were subject to a soft call provision applicable to the optional prepayment of the loans which would have required a premium equal to 1.00% of the aggregate principal amount of the loans being prepaid if, on or prior to August 20, 2014, the Company entered into certain repricing transactions. Additionally, the maximum senior secured net leverage ratio in compliance with which the Company can incur new incremental debt was increased by 25 basis points to 3.75:1.00.
Additionally, on February 20, 2014, in conjunction with our acquisition of Par Sterile, we also entered into the Incremental Term B-2 Joinder Agreement (the “Joinder”) among us, Holdings, and certain of our subsidiaries, and our lenders. Under the terms of the Joinder, we borrowed an additional $395.0 million of New Tranche B Term Loans from the lenders participating therein for the purpose of consummating our acquisition of Par Sterile.
In connection with the transactions described herein, we incurred related transaction costs for the quarter ended March 31, 2014 that totaled $12.4 million of which $8.2 million were included in operating expenses as selling, general and administrative on the condensed consolidated statements of operations and $4.1 million were capitalized as deferred financing costs or debt discount on the condensed consolidated balance sheet. In accordance with the applicable accounting guidance for debt modifications and extinguishments, approximately $4.0 million of the existing unamortized deferred financing costs were written off in connection with this repricing and included in the condensed consolidated statements of operations as a loss on debt extinguishment.
Refinancing of the term loan facility—2013
On February 6, 2013, the Company, Par Pharmaceutical, Inc., as co-borrower, Sky Growth Intermediate Holdings II Corporation (“Intermediate Holdings”), the subsidiary guarantor party thereto, Bank of America, as administrative agent, and the lenders and other parties thereto modified the Term Loan Facility (as amended, the “New Term Loan Facility”) by entering into Amendment No. 1 (“Amendment No. 1”) to the Credit Agreement.
Amendment No. 1 replaced the existing term loans with a new class of term loans in an aggregate principal amount of $1,066.0 million (the “New Term Loans”). Borrowings under the New Term Loan Facility bore interest at a rate per annum equal to an applicable margin plus, at the Company’s option, either LIBOR (which is subject to a 1.00% floor) or the base rate rate (which is subject to a 2.00% floor). The applicable margin for borrowings under the New Term Loans was 3.25% for LIBOR borrowings and 2.25% for base rate borrowings. Amendment No. 1 provided for a soft call option applicable to the New Term Loans. The soft call option provided for a premium equal to 1.00% of the amount of the outstanding principal if, on or prior to August 6, 2013, the Company entered into certain repricing transactions. The other terms applicable to the New Term Loans were substantially the same terms as the original term loans.
F-97
Table of Contents
In connection with the transactions described herein, the Company paid a 1.00% soft call premium in an aggregate amount of approximately $10.5 million on the existing term loan in February 2013, a portion of which was capitalized as a discount to the New Term Loan Facility. In accordance with the applicable accounting guidance for debt modifications and extinguishments, approximately $5.9 million of the existing unamortized deferred financing costs and $1.4 million of the related $10.5 million soft call premium were written off in connection with this refinancing and included in the condensed consolidated statements of operations as a loss on debt extinguishment.
Repricing of the revolving facility—2013
The Company and Par Pharmaceutical, Inc., as co-borrower, Intermediate Holdings, the subsidiary guarantor party thereto, Bank of America, as administrative agent, and the lenders and other parties thereto modified the Revolving Credit Facility by entering into Amendment No. 2 (“Amendment No. 2”), dated February 22, 2013, and Amendment No. 3 (“Amendment No. 3” and, together with Amendment No. 2, the “Revolver Amendments”), dated February 28, 2013, to the Credit Agreement.
The Revolver Amendments extend the scheduled maturity of the revolving credit commitments of certain existing lenders (the “Extending Lenders”) who have elected to do so, such extension was effected by converting such amount of the existing revolving credit commitments of the Extending Lenders into a new tranche of revolving credit commitments (the “Extended Revolving Facility”). The Revolver Amendments also set forth the interest rate payable on borrowings outstanding under the Extended Revolving Facility, as described below. The aggregate commitments under the Extended Revolving Facility are $127.5 million and the aggregate commitments under the non-extended portion of the Revolving Facility are $22.5 million. There were no outstanding borrowings from the Revolving Facility or the Extended Revolving Facility as of March 31, 2015.
Borrowings under both the non-extended portion of the Revolving Facility and the Extended Revolving Facility bear interest at a rate per annum equal to an applicable margin plus, at the Company’s option, either LIBOR or the base rate. The initial applicable margin for borrowings under the Extended Revolving Facility is 3.25% for LIBOR borrowings and 2.25% for base rate borrowings. The initial applicable margin for LIBOR and base rate borrowings under the non-extended portion of the Revolving Facility remain at 3.75% and 2.75%, respectively. Borrowings and repayments of loans under the Extended Revolving Facility and the non-extended portion of the Revolving Facility may be made on a non-pro rata basis with one another, and the commitments under the non-extended portion of the Revolving Facility may be terminated prior to the commitments under the Extended Revolving Credit Facility. The Extended Revolving Facility will mature on December 28, 2017. The other terms applicable to the Extended Revolving Credit Facility are substantially identical to those of the Revolving Credit Facility.
7.375% senior notes
In connection with the Merger, on September 28, 2012, we issued $490.0 million aggregate principal amount of 7.375% senior notes due 2020 (the “Notes”). The Notes were issued pursuant to an indenture entered into as of the same date between the Company and Wells Fargo Bank, National Association, as trustee. Interest on the Notes is payable semi-annually on April 15 and October 15, commencing on April 15, 2013. The Notes mature on October 15, 2020.
We may redeem the Notes at our option, in whole or in part on one or more occasions, at any time on or after October 15, 2015, at specified redemption prices that vary by year, together with accrued and unpaid interest, if any, to the date of redemption. At any time prior to October 15, 2015, we may redeem up to 40% of the aggregate principal amount of the Notes with the net proceeds of certain equity offerings at a redemption price
F-98
Table of Contents
equal to the sum of (i) 107.375% of the aggregate principal amount thereof, plus (ii) accrued and unpaid interest, if any, to the redemption date. At any time prior to October 15, 2015, we may also redeem the Notes, in whole or in part on one or more occasions, at a price equal to 100% of the principal amount of the Notes, plus accrued and unpaid interest and a specified “make-whole premium.”
The Notes are guaranteed on a senior unsecured basis by our material existing direct and indirect wholly-owned domestic subsidiaries and, subject to certain exceptions, each of our future direct and indirect domestic subsidiaries that guarantees the Senior Credit Facilities or our other indebtedness or indebtedness of the guarantors will guarantee the Notes. Under certain circumstances, the subsidiary guarantors may be released from their guarantees without consent of the holders of Notes.
The Notes and the subsidiary guarantees will be our and the guarantors’ senior unsecured obligations and will (i) rank senior in right of payment to all of our and the subsidiary guarantors’ existing and future subordinated indebtedness; (ii) rank equally in right of payment with all of our and the subsidiary guarantors’ existing and future senior indebtedness; (iii) be effectively subordinated to any of our and the subsidiary guarantors’ existing and future secured debt, to the extent of the value of the assets securing such debt; and, (iv) be structurally subordinated to all of the existing and future liabilities (including trade payables) of each of our subsidiaries that do not guarantee the Notes.
The indenture governing the Notes contains customary representations and warranties, as well as customary events of default, in certain cases subject to reasonable and customary periods to cure, including but not limited to: failure to make payments when due, breach of covenants, a payment default or acceleration equaling $40.0 million or more according to the terms of certain other indebtedness, failure to pay final judgments aggregating in excess of $40.0 million when due, insolvency proceedings, a required guarantee shall cease to remain in full force. The indenture also contains various customary covenants that, in certain instances, restrict our ability to: (i) pay dividends and distributions or repurchase capital stock; (ii) incur additional indebtedness; (iii) make investments, loans, guarantees or advances in or to other companies; (iv) engage in dispositions of assets, including entering into a sale and leaseback transaction; (v) engage in transactions with affiliates; (vi) create liens on assets; (vii) redeem or repay certain subordinated indebtedness; (viii) engage in mergers or consolidations with or into other companies; and, (ix) change the nature of our business. The covenants are subject to a number of exceptions and qualifications. Certain of these covenants will be suspended during any period of time that (1) the Notes have Investment Grade Ratings (as defined in the indenture) from both Moody’s Investors Service, Inc. and Standard & Poor’s, and (2) no default has occurred and is continuing under the indenture. In the event that the Notes are downgraded to below an Investment Grade Rating, the Company and certain subsidiaries will again be subject to the suspended covenants with respect to future events. We were in compliance with all covenants as of March 31, 2015.
PPCI is the sole issuer of the Notes. The Notes are guaranteed on a senior unsecured basis by PPCI’s material direct and indirect wholly-owned domestic subsidiaries. The guarantees are full and unconditional and joint and several. PPCI has no independent assets or operations. Each of the subsidiary guarantors is 100% owned by PPCI and all non-guarantor subsidiaries of PPCI are minor subsidiaries.
F-99
Table of Contents
Debt maturities as of March 31, 2015
| Debt maturities as of March 31, 2015 | ($ in thousands) | |||
| Remainder of 2015 |
14,065 | |||
| 2016 |
18,753 | |||
| 2017 |
18,753 | |||
| 2018 |
18,753 | |||
| 2019 |
1,785,824 | |||
| 2020 |
490,000 | |||
|
|
|
|||
| Total debt at March 31, 2015 |
$ | 2,346,148 | ||
|
|
||||
Note 15—Derivative instruments and hedging activities:
Risk management objective of using derivatives
We are exposed to certain risks arising from global economic conditions. We manage economic risks, including interest rate risk, primarily through the use of derivative financial instruments. All derivatives are carried at fair value on our consolidated balance sheets. We do not enter into speculative derivatives. Specifically, we enter into derivative financial instruments to manage exposures that arise from payment of future known and uncertain cash amounts related to our borrowings, the value of which are determined by LIBOR interest rates. We may net settle any of our derivative positions under agreements with our counterparty, when applicable.
Cash flow hedges of interest rate risk via interest rate caps
Our objective in using interest rate derivatives is to add certainty to interest expense amounts and to manage our exposure to interest rate movements, specifically to protect us from variability in cash flows attributable to changes in LIBOR interest rates. To accomplish this objective, we primarily use interest rate caps as part of our interest rate risk management strategy. Interest rate caps designated as cash flow hedges involve the receipt of variable-rate amounts from a counterparty if LIBOR exceeds the strike rate in exchange for the Company making fixed-rate payments over the life of the agreements without exchange of the underlying notional amount. We entered into such derivatives to hedge the variable cash flows associated with existing variable-rate debt under our Credit Agreement. We assess effectiveness and the effective portion of changes in the fair value of derivatives designated and qualified as cash flow hedges for financial reporting purposes is recorded in “Accumulated other comprehensive loss” on our consolidated balance sheet and will be subsequently reclassified into earnings in the period that the hedged forecasted transaction affects earnings. Any ineffective portion of the change in fair value of the derivatives would be recognized directly in earnings.
Interest rate caps
As of March 31, 2015, we had eight outstanding interest rate caps with two counterparties with various termination dates and notional amounts, which we deemed to be effective for accounting purposes. These derivatives had a combined notional value of $750.0 million, with effective dates as of either September 30, 2013 or 2014, and with termination dates each September 30th beginning in 2015 and ending in 2018. Consistent with the terms of the Credit Agreement, the interest rate caps have a strike of 1% which matches the LIBOR floor of 1.0% on the debt. The premium is deferred and paid over the life of the instrument. The effective annual interest rate related to these interest rate caps was a fixed weighted average rate of approximately 4.8% at March 31, 2015. These instruments are designated for accounting purposes as cash flow hedges of interest rate risk related to our Credit Agreement. Future payments under these interest rate caps will be reflected as interest expense on our condensed consolidated statements of operations. In addition, amounts reported in “Accumulated other comprehensive loss” on our condensed consolidated balance sheet related to
F-100
Table of Contents
derivatives will be reclassified to interest expense as interest payments are made on our variable-rate debt under the Credit Agreement. Approximately 47% of our total outstanding debt at March 31, 2015 remains subject to variability in cash flows attributable to changes in LIBOR interest rates.
During the next twelve months, we estimate that $5.6 million will be reclassified from “Accumulated other comprehensive loss” on our condensed consolidated balance sheet at March 31, 2015 to interest expense.
Fair value
As of the effective date, we designated the interest rate swap agreements as cash flow hedges. As cash flow hedges, unrealized gains are recognized as assets while unrealized losses are recognized as liabilities. The interest rate swap agreements are highly correlated to the changes in LIBOR interest rates. The effective portion of such gains or losses is recorded as a component of accumulated other comprehensive income or loss, while the ineffective portion of such gains or losses will be recorded as a component of interest expense. As of March 31, 2015, we recorded $8.4 million (or $5.4 million, net of tax) as part of “Accumulated other comprehensive loss” on our condensed consolidated balance sheet. Future realized gains and losses in connection with each required interest payment will be reclassified from Accumulated other comprehensive loss to interest expense.
We elected to use the income approach to value the derivatives, using observable Level 2 market expectations at each measurement date and standard valuation techniques to convert future amounts to a single present amount (discounted) assuming that participants are motivated, but not compelled to transact. Level 2 inputs for the cap valuations are limited to quoted prices for similar assets or liabilities in active markets (specifically futures contracts) and inputs other than quoted prices that are observable for the asset or liability (specifically LIBOR cash and swap rates, volatility and credit risk at commonly quoted intervals). Mid-market pricing is used as a practical expedient for fair value measurements. Key inputs for valuation models include the cash rates, futures rates, swap rates, credit rates and interest rate volatilities. Reset rates, discount rates and volatilities are interpolated from these market inputs to calculate cash flows as well as to discount those future cash flows to present value at each measurement date. Refer to Note 7 for additional information regarding fair value measurements.
The fair value of our derivative instruments measured as outlined above as of March 31, 2015 was as follows:
| ($ in thousands) Description |
March 31, 2015 |
Quoted prices level 1 |
Significant other observable inputs level 2 |
Significant other unobservable inputs level 3 |
||||||||||||
| ASSETS |
||||||||||||||||
| Current Assets |
||||||||||||||||
| Derivatives |
$ | — | $ | — | $ | — | $ | — | ||||||||
|
|
|
|||||||||||||||
| $ | — | $ | — | $ | — | $ | — | |||||||||
|
|
|
|||||||||||||||
| LIABILITIES |
||||||||||||||||
| Current Liabilities |
||||||||||||||||
| Derivatives |
$ | (8,407 | ) | $ | — | $ | (8,407 | ) | $ | — | ||||||
|
|
|
|||||||||||||||
| $ | (8,407 | ) | $ | — | $ | (8,407 | ) | $ | — | |||||||
|
|
||||||||||||||||
F-101
Table of Contents
The following table summarizes the fair value and presentation in our condensed consolidated balance sheets for derivative instruments as of March 31, 2015 and December 31, 2014:
| Asset derivatives | Liability derivatives | |||||||||||||||||||
| Balance sheet |
March 31, 2015 |
December 31, 2014 |
Balance sheet |
March 31, 2015 |
December 31, 2014 |
|||||||||||||||
| ($ in thousands) | Fair value | Fair value | Fair value | Fair value | ||||||||||||||||
| Derivatives designated as hedging instruments under ASC 815 |
||||||||||||||||||||
| Interest rate cap contracts |
$ | — | $ | — | Other Current Liabilities |
$ | (5,568 | ) | (5,763 | ) | ||||||||||
| Interest rate cap contracts |
— | — | Other Non-Current (Liabilities) |
(2,839 | ) | (138 | ) | |||||||||||||
| Interest rate cap contracts |
Other Assets | — | 201 | |||||||||||||||||
|
|
|
|
|
|||||||||||||||||
| Total derivatives designated as hedging instruments under ASC 815 |
$ | — | $ | — | $ | (8,407 | ) | $ | (5,700 | ) | ||||||||||
|
|
|
|
|
|||||||||||||||||
| Total derivatives |
$ | — | $ | — | $ | (8,407 | ) | $ | (5,700 | ) | ||||||||||
|
|
||||||||||||||||||||
The following tables summarize our eight interest cap agreements with two counterparties. We separately record the short-term and long-term portion of our derivatives. As of March 31, 2015, each agreement represented a net liability and none of our interest cap agreements represented a net asset:
| ($ in thousands) | Offsetting of derivative liabilities as of March 31, 2015 | |||||||||||||||||||||||
| Gross amounts
not offset in the statement of financial position |
||||||||||||||||||||||||
| Description | Gross amounts of recognized liabilities |
Gross amounts offset in the statement of financial position |
Net amounts of liabilities presented in the statement of financial position |
Financial instruments |
Cash collateral pledged |
Net amount |
||||||||||||||||||
| Derivatives by counterparty |
||||||||||||||||||||||||
| Counterparty 1 |
$ | (5,635 | ) | $ | — | $ | (5,635 | ) | $ | — | $ | — | $ | (5,635 | ) | |||||||||
| Counterparty 2 |
(2,772 | ) | — | (2,772 | ) | — | — | (2,772 | ) | |||||||||||||||
|
|
|
|||||||||||||||||||||||
| Total |
$ | (8,407 | ) | $ | — | $ | (8,407 | ) | $ | — | $ | — | $ | (8,407 | ) | |||||||||
|
|
||||||||||||||||||||||||
F-102
Table of Contents
The following table summarizes information about the fair values of our derivative instruments on the condensed consolidated statements of other comprehensive loss for the three months ended March 31, 2015 and March 31, 2014 (Pre-tax):
| ($ in thousands) | Three months ended | |||||||
| March 31, 2015 |
March 31, 2014 |
|||||||
| Other Comprehensive Loss Rollforward: |
||||||||
| Beginning Balance Gain/(Loss) (Pre-tax) |
$ | (5,700 | ) | $ | (1,189 | ) | ||
| Amount Recognized in Other Comprehensive Loss on Derivative (Pre-tax) |
(4,165 | ) | (1,893 | ) | ||||
| Amount Reclassified from Other Comprehensive Loss into Interest Expense (Pre-tax) |
1,458 | 992 | ||||||
|
|
|
|||||||
| Ending Balance Gain/(Loss) (Pre-tax) |
$ | (8,407 | ) | $ | (2,090 | ) | ||
|
|
||||||||
The following table summarizes the effect and presentation of derivative instruments, including the effective portion or ineffective portion of our cash flow hedges, on the condensed consolidated statements of operations for the periods ending March 31, 2015 and 2014:
| The effect of derivative instruments on the statement of financial performance | ||||||||||||||||||||||||||||||
| ($ in thousands) | For the three months ended March 31, 2015 and March 31, 2014 | |||||||||||||||||||||||||||||
| Derivatives in ASC 815 cash flow hedging relationships |
Amount of gain or (loss) recognized in other comprehensive income (loss) on derivative (effective portion) |
Location of gain or (loss) reclassified from accumulated other comprehensive income (loss) into income (loss) (effective portion) |
Amount of gain or (loss) reclassified from accumulated other comprehensive income into income (loss) (effective portion) |
Location of gain or (loss) recognized in income (loss) on derivative (ineffective portion) |
Amount of gain or (loss) recognized in income on derivative (ineffective portion ) |
|||||||||||||||||||||||||
| 2015 | 2014 | 2015 | 2014 | 2015 | 2014 | |||||||||||||||||||||||||
| Interest rate cap contracts |
$ | (4,165 | ) | $ | (1,893 | ) | Interest Expense | $ | (1,458 | ) | $ | (992 | ) | Interest Expense | $ | — | $ | — | ||||||||||||
|
|
|
|
|
|
|
|||||||||||||||||||||||||
| Total |
$ | (4,165 | ) | $ | (1,893 | ) | $ | (1,458 | ) | $ | (992 | ) | $ | — | $ | — | ||||||||||||||
|
|
||||||||||||||||||||||||||||||
Note 16—Changes in stockholders’ equity:
Changes in our Common Stock, Additional Paid-In Capital and Accumulated Other Comprehensive Loss accounts during the three-month period ended March 31, 2015 were as follows:
| (share amounts and $ in thousands) | Common stock | Additional paid-in capital |
Accumulated other comprehensive loss |
|||||||||||||
| Shares | Amount | |||||||||||||||
| Balance, December 31, 2014 |
784,335 | $ | 784 | $ | 835,880 | $ | (3,648 | ) | ||||||||
| Unrealized loss on cash flow hedges, net of tax |
— | — | — | (2,666 | ) | |||||||||||
| Less: reclassification adjustment for net losses included in net income, net of tax |
— | — | — | 934 | ||||||||||||
| Compensatory arrangements |
— | — | 5,213 | — | ||||||||||||
| Proceeds from issuance of stock |
151 | — | 415 | — | ||||||||||||
| Stock-based compensation plan settlements |
(234 | ) | — | (13 | ) | — | ||||||||||
| Dividends paid and dividend-equivalent payments, net of tax |
— | — | (517,667 | ) | — | |||||||||||
|
|
|
|||||||||||||||
| Balance, March 31, 2015 |
784,252 | $ | 784 | $ | 323,828 | $ | (5,380 | ) | ||||||||
|
|
||||||||||||||||
F-103
Table of Contents
Note 17—Share-based compensation:
We account for share-based compensation as required by ASC 718-10, Compensation—Stock Compensation, (“ASC 718-10”) which requires companies to recognize compensation expense in the amount equal to the fair value of all share-based payments granted to employees. Under ASC 718-10, we recognize share-based compensation ratably over the service period applicable to the award. ASC 718-10 also requires that excess tax benefits be reflected as financing cash flows. The share-based compensation expense relating to all awards noted below has been pushed down from Holdings to PPCI.
Accounting for option modifications, dividend-equivalent payments and other discretionary bonuses
In February 2015, we amended our Credit Agreement, which included borrowings in an aggregate principal amount of $425 million that along with cash on hand, were used to fund a special nonrecurring cash dividend of approximately $494.3 million to the stockholders of Holdings, non-forfeitable dividend-equivalent payments to stock option holders totaling approximately $36.5 million, and special discretionary dividend-equivalent bonuses totaling approximately $4.2 million to employees granted awards under Long-term Cash Incentive Award Agreements, and related financing fees and expenses of approximately $7.7 million (these actions are defined as the “Dividend Recapitalization”).
Pursuant to the terms of the Sky Growth Holdings Corporation 2012 Equity Incentive Plan (the “Plan”), stock option holders are entitled to antidilution protection upon equity restructurings as defined ASC 718, including a recapitalization through a large nonrecurring dividend as noted above. The form of such antidilution protection is at the discretion of the Holdings Board of Directors acting as the Plan Administrator. Accordingly, the Plan Administrator provided each stock option holder the required antidilution protection either through a dividend-equivalent payment, a reduction of the exercise price of the applicable stock option awards or a combination thereof. We did not record a charge for the modification of the exercise price for unvested awards and/or the dividend-equivalent payments as these modifications were provided for by the terms of the Plan.
In connection with dividend-equivalent payments related to unvested stock option awards, we recorded a charge to accelerate a portion of unrecognized compensation expense in the first quarter of 2015 totaling approximately $2.7 million.
The special discretionary dividend-equivalent bonuses totaling approximately $4.2 million paid to certain employees granted awards under Long-term Cash Incentive Award Agreements were recorded as compensation expense in the first quarter of 2015 as these payments were not required under any related plan or agreement.
Common stock valuation—February 3, 2015—$3.40
In the absence of a public market for Holdings common shares, the board of directors took reasonable actions to make estimates of the fair value of a share of Holdings common stock at February 3, 2015. The board of directors determined the fair value of Holdings common stock using methodologies, approaches and assumptions consistent with the American Institute of Certified Public Accountants (the “AICPA”), Audit and Accounting Practice Aid Series: Valuation of Privately Held Company Equity Securities Issued as Compensation, or the AICPA Practice Guide. The board of directors, with the assistance of an independent third party valuation specialist firm, determined and approved a fair value for each share of Holdings common stock of $3.40.
Factors considered by the board of directors in establishing the fair value of our Holdings common stock as of February 3, 2015 included the following: (i) the planned Initial Public Offering for Holdings; (ii) available cash, financial condition and results of operations since December 23, 2014, including the continuing success of a number of products that launched in 2014; (iii) the continued success of integrating the Par Sterile acquisition
F-104
Table of Contents
into our operations; (iv) the estimated valuation range of $3.13 to $3.68 per Holdings common share as derived from a report by the independent third party valuation specialist firm; (v) our expected operating performance; and (vi) market conditions for pharmaceutical company stocks in general.
Stock options
In January 2015, the Holdings Board of Directors authorized the grants of approximately 2.8 million stock options to purchase shares of Holdings’ Stock pursuant to the Plan at an exercise price of $2.56 to certain employees. The estimated fair market value of Holdings’ Stock used in the valuation of these stock option grants was $3.40. The stock option grants were divided into two tranches of stock options. Tranche 1 of the options will vest in increments of 33.33% on each of the first, second, and third anniversaries of the “Vesting Commencement Date” as defined in each stock option agreement, provided that each employee remains in continuous employment with the Company through such dates. Tranche 2 of the options (the “Performance Options”) will vest in increments of 33.33%, subject to the employee remaining in continuous employment with the Company through the applicable anniversary of the Vesting Commencement Date and to the Company’s achievement of specified annual EBITDA targets for 2015 through 2017. If an applicable portion of the Performance Options do not vest based on the achievement of the specified annual EBITDA target for a particular year, such portion will be eligible to vest in the next succeeding fiscal year if a two-year cumulative EBITDA target is met (other than with respect to 2017, for which there is no two-year cumulative EBITDA target). In circumstances where the specified annual or bi-annual EBITDA targets are not met, Tranche 2 options may also vest in amounts of either 50% or 100% of the original award in the event of an initial public offering or other sale of Holdings to a third party buyer (a market condition) that returns a specified level of proceeds calculated as a multiple of its investment in Holdings by the Sponsor.
In 2014, in view of the limited number of shares remaining in the Plan and in order to enhance the Company’s ability to retain employees and to increase the mutuality of interests between employees and stockholders, the Board of Directors of Holdings amended the Plan to increase the maximum number of shares of Holdings Common Stock, $0.001 par value per share (the “Stock”) that may be delivered in satisfaction of, or may underlie, awards under the Plan, including stock options (the “Pool”), by 8,750,000 shares of Stock. At March 31, 2015, approximately 0.2 million total shares of Stock were available for future issuances from the Pool.
In addition, during 2014, the Holdings Board of Directors authorized the additional grants of options to purchase shares of Holdings’ Stock pursuant to the Plan at an exercise price of $1.40 (equal to the estimated fair market value of Holdings’ Stock) to certain employees and a member of Holdings Board. The stock option grants are roughly divided into two tranches of stock options. Tranche 1 of the options will vest in equal increments of 25% on each of the first, second, third, and fourth anniversaries of the “Vesting Commencement Date” as defined in each stock option agreement, provided that each employee remains in continuous employment with the Company through such dates. Tranche 2 of the options (the “Performance Options”) will vest in equal increments of 25%, subject to the employee remaining in continuous employment with the Company through the applicable anniversary of the Vesting Commencement Date and to the Company’s achievement of specified annual EBITDA targets for 2014 through 2017. If an applicable portion of the Performance Options do not vest based on the achievement of the specified annual EBITDA target for a particular year, such portion will be eligible to vest in the next succeeding fiscal year if a two-year cumulative EBITDA target is met (other than with respect to 2017, for which there is no two-year cumulative EBITDA target). In circumstances where the specified annual or bi-annual EBITDA targets are not met, Tranche 2 options may also vest in amounts of either 50% or 100% of the original award in the event of an initial public offering or other sale of Holdings to a third party buyer (a market condition) that returns a specified level of proceeds calculated as a multiple of its investment in Holdings by the Sponsor.
F-105
Table of Contents
In conjunction with the Merger, certain senior level employees of the Company were granted stock options in Holdings, effectively granted as of September 28, 2012, under the terms of the Plan.
Each employee received two equal tranches of stock options. Tranche 1 options vest based upon continued employment over a five year period, ratably 20% each annual period. Our policy is to recognize expense for this type of award on a straight-line basis over the requisite service period for the entire award (5 years). Tranche 2 options vest based upon continued employment and the Company achieving specified annual or bi-annual EBITDA targets. Compensation expense will be recognized on a graded vesting schedule. In circumstances where the specified annual or bi-annual EBITDA targets are not met, Tranche 2 options may also vest in amounts of either 50% or 100% of the original award in the event of an initial public offering or other sale of Holdings to a third party buyer (a market condition) that returns a specified level of proceeds calculated as a multiple of its investment in Holdings by the Sponsor.
We used the Black-Scholes stock option pricing model to estimate the fair value of all Tranche 1 options and Tranche 2 options without a market condition (i.e., Tranche 2 options with service and performance conditions only) on each grant date.
The Tranche 2 options with a market condition were valued using a Monte Carlo simulation. The Monte Carlo simulation developed a range of projected outcomes of the market condition by projecting potential share prices over a 5 year simulation and determining if the share price had reached the specified level of proceeds stipulated in the equity plan. Millions of simulations were run as the basis to conclude on the fair value of the Tranche 2 options with market condition as the average of present value of the payoffs across all simulations.
We used the Black-Scholes stock option pricing model to estimate the fair value of Tranche 1 and Tranche 2 without a market condition (service and performance conditions only) stock option awards issued during the three-month period ended March 31, 2015 with the following weighted average assumptions:
| Three months ended | ||||
| March 31, 2015 | ||||
| TRANCHE 1 |
||||
| Risk-free interest rate |
1.5% | |||
| Expected life (in years) |
6.0 | |||
| Expected volatility |
46.0% | |||
| Dividend per share, as applicable |
$ | 0.63 | ||
| Adjusted exercise price, as applicable |
$ | 1.93 | ||
| Adjusted estimate of price per Holdings common share |
$ | 2.77 | ||
|
|
||||
| Three months ended | ||||
| March 31, 2015 | ||||
| TRANCHE 2 |
||||
| Risk-free interest rate |
1.5% | |||
| Expected life (in years) |
6.2 | |||
| Expected volatility |
46.0% | |||
| Dividend per share, as applicable |
$ | 0.63 | ||
| Adjusted exercise price, as applicable |
$ | 1.93 | ||
| Adjusted estimate of price per Holdings common share |
$ | 2.77 | ||
|
|
||||
F-106
Table of Contents
A summary of the calculated estimated grant date fair value per option is as follows:
| Three months ended | ||||||||
| Fair value of stock options | March 31, 2015 |
March 31, 2014 |
||||||
| TRANCHE 1 |
$ | 1.66 | $ | 0.67 | ||||
| TRANCHE 2 without market condition |
$ | 1.68 | $ | 0.68 | ||||
| TRANCHE 2 with market condition |
$ | 1.39 | $ | 0.76 | ||||
|
|
||||||||
For Tranche 2 options, each quarter we will evaluate the probability of the Company achieving the annual or the bi-annual EBITDA targets (“Vesting Event A”) and the probability of an initial public offering or other sale of the Company to a third party buyer (“Vesting Event B”). If it is probable that the Company will achieve Vesting Event A, then the Company will recognize expense for Tranche 2 options at the per option value noted above with any necessary adjustments to expense to be equal to the ratable expense as of the end of that particular quarter end. If it is probable that the Company will achieve Vesting Event B, but not Vesting Event A, then the Company will recognize expense for Tranche 2 options at the per option value (which is the fair value taking into account the market condition) noted above with any necessary adjustment to expense to be equal to the ratable expense as of the end of that particular quarter end.
We granted a member of the Board of Directors of Holdings stock options in Holdings during 2013 under similar terms as the Tranche 1 options granted as of September 28, 2012 under the Plan. These stock options vest based upon continued service over an approximate five year period, ratably 20% each period ending September 28th. We will recognize expense on a straight-line basis over the requisite service period for the entire award. The share-based compensation expense relating to the award has been pushed down from Holdings to the Company. We used the Black-Scholes stock option pricing model to estimate the fair value of the stock option awards.
Set forth below is the impact on our results of operations of recording share-based compensation from stock options ($ amounts in thousands):
| Three months ended | ||||||||
| March 31, 2015 |
March 31, 2014 |
|||||||
| Cost of goods sold |
$ | 253 | $ | 89 | ||||
| Selling, general and administrative |
4,928 | 830 | ||||||
|
|
|
|||||||
| Total, pre-tax |
$ | 5,181 | $ | 919 | ||||
| Tax effect of share-based compensation |
(1,865 | ) | (340 | ) | ||||
|
|
|
|||||||
| Total, net of tax |
$ | 3,316 | $ | 579 | ||||
|
|
||||||||
F-107
Table of Contents
The following is a summary of our stock option activity (shares and aggregate intrinsic value in thousands):
| Shares | Weighted average exercise price |
Weighted average remaining life |
Aggregate Intrinsic Value |
|||||||||||||
| TRANCHE 1 |
||||||||||||||||
| Balance at December 31, 2014 |
27,864 | $ | 1.09 | |||||||||||||
| Granted |
1,399 | 2.14 | (1) | |||||||||||||
| Exercised |
— | — | ||||||||||||||
| Forfeited |
— | — | ||||||||||||||
|
|
|
|||||||||||||||
| Balance at March 31, 2015 |
29,263 | $ | 0.99 | (1) | 8.0 | $ | 52,088 | |||||||||
|
|
|
|||||||||||||||
| Exercisable at March 31, 2015 |
9,843 | $ | 1.05 | 7.8 | $ | 16,889 | ||||||||||
|
|
|
|||||||||||||||
| Vested and expected to vest at March 31, 2015 |
28,940 | $ | 1.01 | (1) | 8.1 | $ | 50,934 | |||||||||
|
|
||||||||||||||||
| Shares | Weighted average exercise price |
Weighted average remaining life |
Aggregate intrinsic value |
|||||||||||||
| TRANCHE 2 |
||||||||||||||||
| Balance at December 31, 2014 |
26,924 | $ | 1.09 | |||||||||||||
| Granted |
1,399 | 2.14 | (1) | |||||||||||||
| Exercised |
(60 | ) | 1.00 | |||||||||||||
| Forfeited |
— | — | ||||||||||||||
|
|
|
|||||||||||||||
| Balance at March 31, 2015 |
28,263 | $ | 0.99 | (1) | 8.0 | $ | 50,308 | |||||||||
|
|
|
|||||||||||||||
| Exercisable at March 31, 2015 |
9,393 | $ | 1.05 | 7.8 | $ | 16,193 | ||||||||||
|
|
|
|||||||||||||||
| Vested and expected to vest at March 31, 2015 |
27,755 | $ | 1.01 | (1) | 8.0 | $ | 48,849 | |||||||||
|
|
||||||||||||||||
| (1) | The Weighted Average Exercise Price associated with Granted, Balance at March 31, 2015 and Vested and expected to vest at March 31, 2015 reflect the reduction of the exercise price of the applicable stock option awards as a form of antidilution protection required as part of the Dividend Recapitalization. |
Rollover options
As part of the Merger, certain employees of the Company were given the opportunity to exchange their stock options in PPCI for stock options in Holdings (“Rollover Stock Options”). TPG was not legally or contractually required to replace Predecessor stock options with Holdings stock options, therefore the Rollover Stock Options were not part of the purchase price. The ratio of exchange was based on the intrinsic value of PPCI options at September 28, 2012.
The term of the Predecessor stock options exchanged for Holdings stock options were not extended. All Rollover Stock Options maintained their 10 year term from original grant date.
All of the Rollover Stock Options were either vested prior to September 27, 2012 or were accelerated vested on September 27, 2012 (date of PPCI shareholders’ meeting that approved PPCI’s acquisition by TPG) in accordance with the terms of PPCI stock option agreements. No additional vesting conditions were imposed on the holders of the Rollover Stock Options. All remaining unrecognized share-based compensation expense associated with the Rollover Stock Options was recognized in the period ended September 28, 2012.
F-108
Table of Contents
The following is a summary of our Rollover Stock Options activity (shares and aggregate intrinsic value in thousands):
| Shares | Weighted average exercise price |
Weighted average remaining life |
Aggregate intrinsic value |
|||||||||||||
| Balance at December 31, 2014 |
17,083 | $ | 0.25 | |||||||||||||
| Granted |
— | — | ||||||||||||||
| Exercised |
(205 | ) | 0.25 | |||||||||||||
| Forfeited |
(34 | ) | 0.25 | |||||||||||||
|
|
|
|||||||||||||||
| Balance at March 31, 2015 |
16,844 | $ | 0.25 | 5.2 | $ | 42,447 | ||||||||||
|
|
|
|||||||||||||||
| Exercisable at March 31, 2015 |
16,844 | $ | 0.25 | 5.2 | $ | 42,447 | ||||||||||
|
|
||||||||||||||||
Restricted stock
In January 2015, we granted a member of the Board of Directors of Holdings approximately 20 thousand restricted stock units (“RSUs”) with a time-based service condition.
In conjunction with the Merger, certain senior level employees were granted RSUs in Holdings.
Each RSU has only a time-based service condition and will vest no later than the fifth anniversary of the grant date (September 28, 2017) upon fulfillment of the service condition.
The fair value of each RSU is based on fair value of each share of Holdings common stock on the grant date. The RSUs are classified as equity awards. The total calculated value, net of estimated forfeitures, will be recognized ratably over each vesting period.
Set forth below is the impact on our results of operations of recording share-based compensation from RSUs for the three-month periods ended March 31, 2015 and 2014 ($ in thousands):
| Three months ended | ||||||||
| March 31, 2015 | March 31, 2014 | |||||||
| Cost of goods sold |
$ | — | $ | — | ||||
| Selling, general and administrative |
32 | 23 | ||||||
|
|
|
|||||||
| Total, pre-tax |
$ | 32 | $ | 23 | ||||
| Tax effect of stock-based compensation |
(12 | ) | (9 | ) | ||||
|
|
|
|||||||
| Total, net of tax |
$ | 20 | $ | 14 | ||||
|
|
||||||||
The following is a summary of our RSU activity for the three-month period ended March 31, 2015 (shares and aggregate intrinsic value in thousands):
| Shares | Weighted average grant price |
Aggregate intrinsic value |
||||||||||
| Balance at December 31, 2014 |
325 | $ | 1.00 | |||||||||
| Granted |
20 | 2.56 | ||||||||||
| Vested |
— | — | ||||||||||
| Forfeited |
— | — | ||||||||||
|
|
|
|||||||||||
| Non-vested restricted stock unit balance at March 31, 2015 |
345 | $ | 1.09 | $ | 956 | |||||||
|
|
||||||||||||
F-109
Table of Contents
Long-term cash incentive awards
In conjunction with the Merger, certain employees were granted awards under Long-term Cash Incentive Award Agreements from Holdings. Each participant has the potential to receive a cash award based on specific achievements in the event of a transaction (e.g., initial public offering or sale of the company to a third party buyer) that returns a specified level of proceeds calculated as a multiple of the equity invested in the Company by the Sponsor. There is no vesting period under the related Long-term Cash Incentive Award Agreements. The grantees must be employed by Holdings and its subsidiaries at the time of a transaction event in order to be eligible for a cash payment.
These awards are accounted for in accordance with ASC 450 and will be evaluated quarterly. If information available before the financial statements are issued indicates that it is probable that a liability had been incurred at the date of the financial statements then an accrual shall be made for the estimated cash payout. No amount was accrued for the Long-term Cash Incentive Award Agreements at March 31, 2015. As noted above, in February 2015, special discretionary dividend-equivalent bonuses totaling approximately $4.2 million were paid to employees granted awards under the related Long-term Cash Incentive Award Agreements and such amount was recorded as compensation expense in the first quarter of 2015.
Note 18—Earnings/(loss) per share:
The following is a reconciliation of the amounts used to calculate basic and diluted earnings per share (share amounts and $ in thousands, except per share amounts):
| Three months ended | ||||||||
| March 31, | March 31, | |||||||
| Net income (loss) |
$ | 20,285 | $ | (39,365 | ) | |||
| Basic Earnings (Loss) per Common Share: |
||||||||
| Weighted average common shares outstanding |
784,048 | 737,839 | ||||||
|
|
|
|||||||
| Net income (loss) per common stock |
$ | 0.03 | $ | (0.05 | ) | |||
| Earnings per Common Share Assuming Dilution: |
||||||||
| Weighted average common shares outstanding |
784,048 | 737,839 | ||||||
| Effect of diluted shares |
30,530 | — | ||||||
| Diluted weighted average common shares outstanding |
814,578 | 737,839 | ||||||
|
|
|
|||||||
| Net income (loss) per common share assuming dilution |
$ | 0.02 | $ | (0.05 | ) | |||
|
|
||||||||
Since we had a net loss for the period ended March 31, 2014, basic and diluted net loss per share of common stock is the same, because the effect of including potential common stock equivalents (such as stock options and restricted stock units) would be anti-dilutive. The potential effect of diluted shares, totaled $10.7 million.
Note 19—Commitments, contingencies and other matters:
Legal proceedings
Our legal proceedings are complex and subject to significant uncertainties. As such, we cannot predict the outcome or the effects of the legal proceedings described below. While we believe that we have valid claims and/or defenses in the litigations described below, litigation is inherently unpredictable, and the outcome of these proceedings could include substantial damages, the imposition of substantial fines, penalties, and injunctive or administrative remedies. For proceedings where losses are both probable and reasonably estimable, we have accrued for such potential loss as set forth below. Such accruals have been developed based
F-110
Table of Contents
upon estimates and assumptions that have been deemed reasonable by management, but the assessment process relies heavily on estimates and assumptions that may ultimately prove to be inaccurate or incomplete, and unknown circumstances may exist or unforeseen events occur that could lead us to change those estimates and assumptions. Unless otherwise indicated below, at this time we are not able to estimate the possible loss or range of loss, if any, associated with these legal proceedings. In general, we intend to continue to vigorously prosecute and/or defend these proceedings, as appropriate; however, from time to time, we may settle or otherwise resolve these matters on terms and conditions that we believe are in the best interests of the Company. Resolution of any or all claims, investigations, and legal proceedings, individually or in the aggregate, could have a material adverse effect on our results of operations and/or cash flows in any given accounting period or on our overall financial condition.
Patent related matters
On April 28, 2006, CIMA Labs, Inc. (“CIMA”) and Schwarz Pharma, Inc. (“Schwarz Pharma”) filed separate lawsuits against us in the U.S. District Court for the District of New Jersey. CIMA and Schwarz Pharma each have alleged that we infringed U.S. Patent Nos. 6,024,981 (the “’981 patent”) and 6,221,392 (the “’392 patent”) by submitting a Paragraph IV certification to the FDA for approval of alprazolam orally disintegrating tablets. The complaints generally seek (i) a finding of infringement, validity and/or enforceability; (ii) a permanent injunction be entered, terminating at the expiration of the patents-in-suit; and (iii) unspecified damages. On July 10, 2008, the U.S. Patent and Trademark Office (“USPTO”) rejected all claims pending in both the ‘392 and ‘981 patents. On September 28, 2009, the USPTO’s Patent Trial and Appeal Board (“PTAB”) affirmed the Examiner’s rejection of all claims in the ‘981 patent, and on March 24, 2011, the PTAB affirmed the rejections pending for both patents and added new grounds for rejection of the ‘981 patent. On June 24, 2011, the plaintiffs re-opened prosecution on both patents at the USPTO. On May 13, 2013, the PTAB reversed outstanding rejections to the currently pending claims of the ’392 patent reexamination application and affirmed a conclusion by the Examiner that testimony offered by the patentee had overcome other rejections. On September 20, 2013, a reexamination certificate was issued for the ’392 patent, and on January 9, 2014, a reexamination certificate was issued for the ’981 patent, each incorporating narrower claims than the respective originally-issued patent. We intend to vigorously defend this lawsuit and pursue our counterclaims.
Unimed and Laboratories Besins Iscovesco filed a lawsuit on August 22, 2003 against Paddock Laboratories, Inc. in the U.S. District Court for the Northern District of Georgia alleging patent infringement as a result of Paddock’s submitting an ANDA with a Paragraph IV certification seeking FDA approval of testosterone 1% gel, a generic version of Unimed Pharmaceuticals, Inc.’s Androgel®. On September 13, 2006, we acquired from Paddock all rights to the ANDA, and the litigation was resolved by a settlement and license agreement that permits us to launch the generic version of the product no earlier than August 31, 2015, and no later than February 28, 2016, assuring our ability to market a generic version of Androgel® well before the expiration of the patents at issue. On January 30, 2009, the Bureau of Competition for the FTC filed a lawsuit against us in the U.S. District Court for the Central District of California, subsequently transferred to the Northern District of Georgia, alleging violations of antitrust laws stemming from our court-approved settlement, and several distributors and retailers followed suit with a number of private plaintiffs’ complaints beginning in February 2009. The FTC complaint generally seeks (i) a finding that our agreements with co-defendants violate Section 5(a) of the Federal Trade Commission Act; and (ii) a permanent injunction against our ability to engage in such conduct in the future. The private plaintiffs’ complaints generally seek (i) equitable relief; and (ii) single, treble, and/or multiple unspecified damages and costs. On February 23, 2010, the District Court granted our motion to dismiss the FTC’s claims and granted in part and denied in part our motion to dismiss the claims of the private plaintiffs. On September 28, 2012, the District Court granted our motion for summary judgment against certain of the private plaintiffs’ claims. On June 10, 2010, the FTC appealed the District Court’s dismissal of the FTC’s claims to the U.S. Court of Appeals for the 11th Circuit. On April 25, 2012, the Court of Appeals
F-111
Table of Contents
affirmed the District Court’s decision. On June 17, 2013, the Supreme Court of the United States reversed the Court of Appeals’ decision and remanded the case to the U.S. District Court for the Northern District of Georgia for further proceedings. On October 23, 2013, the District Court issued an order on indicative ruling on a request for relief from judgment, effectively remanding to the District Court the appeal of the grant of our motion for summary judgment against certain of the private plaintiffs’ claims and holding those claims in abeyance while the remaining issues pending before the Court are resolved. We believe we have complied with all applicable laws in connection with the court-approved settlement and intend to continue to vigorously defend these actions.
On September 13, 2007, Santarus, Inc. and The Curators of the University of Missouri (“Missouri”) filed a lawsuit against us in the U.S. District Court for the District of Delaware alleging infringement of U.S. Patent Nos. 6,699,885; 6,489,346; and 6,645,988 because we submitted an ANDA with a Paragraph IV certification seeking FDA approval of 20 mg and 40 mg omeprazole/sodium bicarbonate capsules. On December 20, 2007, Santarus and Missouri filed a second lawsuit alleging infringement of the patents because we submitted an ANDA with a Paragraph IV certification seeking FDA approval of 20 mg and 40 mg omeprazole/sodium bicarbonate powders for oral suspension. The complaints generally sought (i) a finding of infringement, validity, and/or enforceability; and (ii) a permanent injunction be entered, terminating at the expiration of the patents-in- suit. On October 20, 2008, plaintiffs amended their complaint to add U.S. Patent Nos. 6,780,882 and 7,399,722. On April 14, 2010, the District Court ruled in our favor, finding that the plaintiffs’ patents were invalid as being obvious and without adequate written description. On July 1, 2010, we launched our 20 mg and 40 mg generic omeprazole/sodium bicarbonate capsules product. Santarus and Missouri appealed the District Court’s decision to the U.S. Court of Appeals for the Federal Circuit, and we cross-appealed the District Court’s decision of enforceability of plaintiffs’ patents. On September 4, 2012, the Court of Appeals reversed the District Court’s finding of invalidity and remanded to the District Court for further proceedings, and we ceased further distribution of our 20 mg and 40 mg generic omeprazole/sodium bicarbonate capsules product. Santarus was acquired by Salix Pharmaceuticals, Inc. on January 2, 2014. On September 22, 2014, we entered into a settlement agreement with Salix, Santarus and Missouri to resolve all claims relating to this matter, and the dismissal stipulation was entered on September 26, 2014. As part of the settlement, Salix, Santarus and Missouri released all claims against us in exchange for a payment of $100.0 million. We recorded a charge of $91.0 million in the third quarter of 2014 in addition to the $9.0 million previously accrued.
On April 29, 2009, Pronova BioPharma ASA (“Pronova”) filed a lawsuit against us in the U.S. District Court for the District of Delaware. The complaint alleges infringement of U.S. Patent Nos. 5,502,077 and 5,656,667 because we submitted an ANDA with a Paragraph IV certification seeking FDA approval of omega-3-acid ethyl esters oral capsules. On May 29, 2012, the District Court ruled in favor of Pronova in the initial case, and we appealed to the U.S. Court of Appeals for the Federal Circuit on June 25, 2012. On September 12, 2013, the Court of Appeals ruled in our favor, reversing the lower District Court decision. On March 5, 2014, judgment in our favor was formally entered in the District Court. On April 16, 2014, Pronova petitioned for writ of certiorari to the U.S. Supreme Court, which was denied on October 6, 2014.
On August 10, 2011, Avanir Pharmaceuticals, Inc. et al. (“Avanir”) filed a lawsuit against us in the U.S. District Court for the District of Delaware. The complaint alleges infringement of U.S. Patent Nos. 7,659,282 and RE38,115 because we submitted an ANDA with a Paragraph IV certification seeking FDA approval of oral capsules of 20 mg dextromethorphan hydrobromide and 10 mg quinidine sulfate. The complaint generally seeks (i) a finding of infringement, validity, and/or enforceability; and (ii) a permanent injunction be entered, terminating at the expiration of the patents-in-suit. Our case was consolidated with those of other defendants, Actavis, Impax, and Wockhardt. On September 12, 2012, Avanir filed an additional complaint against us, adding U.S. Patent No. 8,227,484 to the case and seeking the same relief as the first complaint. A bench trial was held from September 9-13 and October 15, 2013. On April 30, 2014, a decision was entered in favor of Avanir. On
F-112
Table of Contents
August 20, 2014, the Court issued an order requiring that Avanir delist the ‘115 patent, leaving only the ‘484 and ‘282 to be addressed on appeal. We filed our notice of appeal following resolution of the delisting claim on September 12, 2014. We intend to prosecute our appeal of this decision vigorously.
On September 1, 2011, we, along with EDT Pharma Holdings Ltd. (now known as Alkermes Pharma Ireland Limited) (Elan), filed a complaint against TWi Pharmaceuticals, Inc. (“TWi”) of Taiwan in the U.S. District Court for the District of Maryland alleging infringement of U.S. Patent No. 7,101,576 because TWi filed an ANDA with a Paragraph IV certification seeking FDA approval of a generic version of Megace® ES. Our complaint seeks (i) a finding of infringement, validity, and/or enforceability; and (ii) a permanent injunction be entered, terminating at the expiration of the patents-in-suit. A bench trial was held from October 7-15, 2013. On February 21, 2014, the District Court issued a decision in favor of TWi, finding all asserted claims of the ‘576 patent invalid for obviousness, and we appealed to the U.S. Court of Appeals for the Federal Circuit. On August 12, 2014, the District Court granted our motion for preliminary injunction enjoining TWi’s launch of its generic product pending disposition of the case on appeal, requiring us to post a $10.0 million bond. On December 3, 2014, the Federal Circuit reversed the District Court’s decision, remanding for further findings of fact. On March 9, 2015, the District Court granted our motion for preliminary injunction enjoining TWi’s launch of its generic product pending disposition of the case on remand, requiring us to post a $6.0 million bond. We intend to continue to vigorously pursue our case.
On April 4, 2012, AR Holding Company, Inc. filed a lawsuit against us in the U.S. District Court for the District of Delaware. The complaint alleges infringement of U.S. Patent Nos. 7,619,004; 7,601,758; 7,820,681; 7,915,269; 7,964,647; 7,964,648; 7,981,938; 8,093,296; 8,093,297; and 8,097,655 (subsequently adding U.S. Patent Nos. 8,415,395 and 8,415,396) because we submitted an ANDA with a Paragraph IV certification seeking FDA approval of oral tablets of 0.6 mg colchicine. On November 1, 2012, Takeda Pharmaceuticals was substituted as the plaintiff and real party-in-interest in the case. On August 30, 2013, Takeda filed a second complaint in view of the same filing adding to the dispute U.S. Patent Nos. 7,906,519; 7,935,731; 7,964,648; 8,093,297; and 8,093,298. The complaint generally seeks (i) a finding of infringement, validity, and/or enforceability; and (ii) a permanent injunction be entered, terminating at the expiration of the patents-in-suit. On August 30, 2013, Takeda filed a new complaint against us in view of our change of the ANDA’s labeled indication. We intend to defend these actions vigorously.
On October 25, 2012, Purdue Pharma L.P. (“Purdue”) and Transcept Pharmaceuticals (“Transcept”) filed a lawsuit against us in the U.S. District Court for the District of New Jersey. The complaint alleged infringement of U.S. Patent Nos. 8,242,131 and 8,252,809 because we submitted an ANDA with a Paragraph IV certification seeking FDA approval of zolpidem tartrate sublingual tablets 1.75 and 3.5 mg. The complaint generally seeks (i) a finding of infringement, validity, and/or enforceability; and (ii) a permanent injunction be entered, terminating at the expiration of the patents-in-suit. On November 24, 2014, we reached an agreement with Purdue and Transcept to stay our case contingent upon our agreement to be bound by the District Court’s decision in Transcept’s trial against Actavis and Novel Laboratories, which commenced December 1, 2014. On March 27, 2015, the District Court issued an opinion in favor of Actavis and Novel Laboratories, and on April 9, 2015, the District Court accordingly entered judgment in favor of Par, finding the patents-in-suit invalid. We will continue to monitor the progress of any appeal of the District Court’s decision, to which judgment we would be subject.
On December 19, 2012, Endo Pharmaceuticals and Grünenthal GmbH filed a lawsuit against us in the U.S. District Court for the Southern District of New York. The complaint alleges infringement of U.S. Patent Nos. 7,851,482; 8,114,383; 8,192,722; 8.309, 060; 8,309,122; and 8,329,216 because we submitted an ANDA with a Paragraph IV certification to the FDA for approval of oxymorphone hydrochloride extended release tablets 40 mg. The complaint generally seeks (i) a finding of infringement, validity, and/or enforceability; and (ii) a permanent injunction be entered, terminating at the expiration of the patents-in-suit. On November 7, 2014,
F-113
Table of Contents
Endo and Mallinckrodt sued us on the same filing in the U.S. District Court for the District of Delaware, adding U.S. Patent Nos. 8,808,737 and 8,871,779 to the case. On January 15, 2015, the case in the Southern District of New York was dismissed by stipulation. On March 31, 2015, the case in the District of Delaware was dismissed by stipulation.
On January 8, 2013, we were substituted for Actavis as defendant in litigation then pending in the U.S. District Court for the District of Delaware. The action was brought by Novartis against Actavis for filing an ANDA with a Paragraph IV certification seeking FDA approval of rivastigmine transdermal extended release film 4.6 and 9.5 mg/24 hr. We assumed the rights to this ANDA. The complaint alleges infringement of U.S. Patents 5,602,176; 6,316,023; and 6,335,031 and generally seeks (i) a finding of infringement, validity, and/or enforceability; and (ii) a permanent injunction be entered, terminating at the expiration of the patents-in-suit. On August 22, 2013, Novartis filed an additional complaint in view of our submission of an ANDA supplement containing a Paragraph IV certification adding the 13.3 mg/24 hr. strength. A trial was held August 26-29, 2013, and a second bench trial directed to our non-infringement positions was held on May 1-2, 2014. On June 27, 2014, we filed a declaratory judgment action against Novartis in the same Court regarding all strengths, seeking judgment of non-infringement and invalidity on all asserted patents in view of all strengths embraced by our ANDA. On August 29, 2014, the Court in the first action entered judgment in our favor, finding that we do not infringe the asserted patents. On October 7, 2014, the Court entered judgment in our favor on the declaratory judgment complaint. On October 20, 2014 and October 30, 2014, Novartis filed notices of appeal to the U.S. Court of Appeals for the Federal Circuit from both the original case as well as the complaint initiated on the ANDA supplement. On November 7, 2014, Novartis filed an appeal from the declaratory judgment decision. We intend to defend these actions vigorously.
On February 7, 2013, Sucampo Pharmaceuticals, Takeda Pharmaceuticals, and R-Tech Ueno filed a lawsuit against us in the U.S. District Court for the District of Delaware. The complaint alleges infringement of U.S. Patent Nos. 6,414,016; 7,795,312; 8,026,393; 8,071,613; 8,097,653; and 8,338,639 because we submitted an ANDA with a Paragraph IV certification to the FDA for approval of lubiprostone oral capsules 8 mcg and 24 mcg. The complaint generally seeks (i) a finding of infringement; and (ii) a permanent injunction be entered, terminating at the expiration of the patents-in-suit. On July 3, 2013, an amended complaint was filed, adding U.S. Patent No. 8,389,542 to the case. On October 9, 2014, the parties entered into a settlement agreement resolving the dispute and allowing us to launch our generic lubiprostone product on January 1, 2021, or earlier in certain circumstances. The consent judgment terminating the case was entered December 2, 2014.
On May 15, 2013, Endo Pharmaceuticals filed a lawsuit against us in the U.S. District Court for the Southern District of New York. The complaint alleges infringement of U.S. Patent Nos. 7,851,482; 8,309,122; and 8,329,216 as a result of our November 2012 acquisition from Watson of an ANDA with a Paragraph IV certification seeking FDA approval of non-tamper resistant oxymorphone hydrochloride extended release tablets. The complaint generally seeks (i) a finding of infringement, validity, and/or enforceability; and (ii) a permanent injunction be entered, terminating at the expiration of the patents-in-suit. On March 20, 2015, the lawsuit was dismissed by stipulation.
On June 21, 2013, we, along with Alkermes Pharma Ireland Limited (Elan), filed a complaint against Breckenridge Pharmaceutical, Inc. in the U.S. District Court for the District of Delaware. In the complaint, we allege infringement of U.S. Patent Nos. 6,592,903 and 7,101,576 because Breckenridge filed an ANDA with a Paragraph IV certification seeking FDA approval of a generic version of Megace® ES. Our complaint seeks (i) a finding of infringement, validity, and/or enforceability; and (ii) a permanent injunction be entered, terminating at the expiration of the patents-in-suit. A stipulation to stay the proceedings was entered on July 22, 2014. We intend to prosecute this infringement case vigorously.
On September 23, 2013, Forest Labs and Royalty Pharma filed a lawsuit against us in the U.S. District Court for the District of Delaware. The complaint alleges infringement of U.S. Patent Nos., 6,602,911; 7,888,342; and
F-114
Table of Contents
7,994,220 because we submitted an ANDA with a Paragraph IV certification to the FDA for approval of 12.5, 25, 50, and 100 mg milnacipran HCl oral tablets. The complaint generally seeks (i) a finding of infringement; and (ii) a permanent injunction be entered, terminating at the expiration of the patents-in-suit. On May 4, 2015, the case was dismissed by stipulation pursuant to a confidentiality settlement agreement.
On August 20, 2013 and April 4, 2014, MonoSol RX and Reckitt Benckiser filed lawsuits against us in the U.S. District Court for the District of Delaware. The complaints allege infringement of U.S. Patent Nos. 8,017,150, 8,475,832 and 8,603,514, because we submitted an ANDA with a Paragraph IV certification to the FDA for approval of EQ 2/0.5, 8/2, 4/1, 12/3 mg base buprenorphine HCl/naloxone HCl sublingual films. The complaints generally seek (i) a finding of infringement; and (ii) a permanent injunction be entered, terminating at the expiration of the patents-in-suit. On December 31, 2014, the plaintiffs filed a complaint on the same ANDA filing, adding U.S. Patent Nos. 8,900,497 and 8,906,277. We intend to defend these actions vigorously.
On December 27, 2013, Jazz Pharmaceuticals filed a lawsuit against us in the U.S. District Court for the District of New Jersey. The complaint alleges infringement of U.S. Patent Nos. 6,472,431; 6,780,889; 7,262,219; 7,851,506; 8,263,650; 8,324,275; 8,461,203; 7,668,730; 7,765,106; 7,765,107; 7,895,059; 8,457,988; and 8,589,182 because we submitted an ANDA with a Paragraph IV certification to the FDA for approval of 500mg/ml sodium oxybate oral solution. On August 15, 2014, October 10, 2014, and January 8, 2015, Jazz filed additional complaints against us in view of the same ANDA filing, adding U.S. Patent Nos. 8,731,963; 8,772,306; and 8,859,619, respectively, to the case. The complaints generally seek (i) a finding of infringement; and (ii) a permanent injunction be entered, terminating at the expiration of the patents-in-suit. We intend to defend these actions vigorously.
On January 21, 2014, Lyne Laboratories, Fresenius USA Manufacturing and Fresenius Medical Care Holdings filed a lawsuit against us in the U.S. District Court for the District of Massachusetts. The complaint alleges infringement of U.S. Patent Nos. 8,591,938 and 8,592,480 because we submitted an ANDA with a Paragraph IV certification to the FDA for approval of 169mg/5ml calcium acetate oral solution. The complaint generally seeks (i) a finding of infringement; and (ii) a permanent injunction be entered, terminating at the expiration of the patents-in-suit. The case has been settled on confidential terms with a stipulation of dismissal, which was entered by the Court on April 29, 2015.
On February 14, 2014 and August 15, 2014, Forest Laboratories, Inc., Forest Laboratories Holdings, Ltd., and Adamas Pharmaceuticals, Inc., filed lawsuits against us and our Anchen subsidiary in the U.S. District Court for the District of Delaware. The complaints allege infringement of U.S. Patent Nos. 8,039,009; 8,168,209; 8,173,708; 8,283,379; 8,329,752; 8,362,085; and 8,598,233 because we submitted ANDAs with Paragraph IV certifications to the FDA for approval of 7, 14, 21, and 28 mg memantine hydrochloride extended release capsules. The complaints generally seek (i) a finding of infringement and (ii) a permanent injunction be entered, terminating at the expiration of the patents-in-suit. On January 14, 2015, a joint stipulation of dismissal was entered in the case pursuant to a confidential settlement agreement between the parties.
On April 23, 2014, Hyperion Therapeutics filed a lawsuit against us in the U.S. District Court for the Eastern District of Texas. The complaint alleges infringement of U.S. Patent Nos. 8,404,215 and 8,642,012 because we submitted an ANDA with Paragraph IV certifications to the FDA for approval of 1.1 g/ml glyceryl phenylbutyrate oral liquid. The complaint generally seeks (i) a finding of infringement and (ii) a permanent injunction be entered, terminating at the expiration of the patents-in-suit. We intend to defend this action vigorously. On April 29, 2015, we filed Inter Partes Review petitions seeking institution of a trial on invalidity at the U.S. Patent and Trademark Office for both of the patents asserted in the Texas litigation. We intend to defend and prosecute, as applicable, these actions vigorously.
On June 20, 2014, Otsuka Pharmaceutical Co. filed a lawsuit against us in the U.S. District Court for the District of Delaware. The complaint alleges infringement of U.S. Patent Nos. 5,753,677 and 8,501,730 relating to our
F-115
Table of Contents
Paragraph IV certification accompanying our ANDA for approval of 15 and 30 mg tolvaptan oral tablets. The complaint generally seeks (i) a finding of infringement; and (ii) a permanent injunction be entered, terminating at the expiration of the patents-in-suit. We intend to defend this action vigorously.
On June 30, 2014, AstraZeneca filed a lawsuit against us in the U.S. District Court for the District of Delaware. The complaint alleges infringement of U.S. Patent No. 7,951,400 because we submitted an ANDA with a Paragraph IV certification to the FDA for approval of eq 2.5 mg and eq 5 mg saxagliptin hydrochloride oral tablets. The complaint generally seeks (i) a finding of infringement and (ii) a permanent injunction be entered, terminating at the expiration of the patents-in-suit. The case has been settled on confidential terms with a stipulation of dismissal, which was entered by the Court on April 14, 2015.
On July 17, 2014, Glycyx Pharmaceuticals and Salix filed a lawsuit against us in the U.S. District Court for the District of Delaware. The complaint alleges infringement of U.S. Patent Nos. 6,197,341 and 8,497,256 because we submitted an ANDA with a Paragraph IV certification to the FDA for approval of 1.1 g balsalazide disodium oral tablets. The complaint generally seeks (i) a finding of infringement and (ii) a permanent injunction be entered, terminating at the expiration of the patents-in-suit. The case has been settled on confidential terms with a stipulation of dismissal, which was entered by the Court on March 30, 2015.
On August 6, 2014, Prometheus Labs filed a lawsuit against us in the U.S. District Court for the District of Delaware. The complaint alleges infringement of U.S. Patent No. 6,284,770 because we submitted an ANDA with a Paragraph IV certification to the FDA for approval of 0.5 and 1.0 mg alosetron hydrochloride tablets. The complaint generally seeks (i) a finding of infringement and (ii) a permanent injunction be entered, terminating at the expiration of the patents-in-suit. On November 17, 2014, the court stayed our case pending the outcome of the appeal of the first Paragraph IV filer’s victory in the District Court.
On August 19, 2014, Hospira, Inc. filed a declaratory judgment complaint against the FDA in the U.S. District Court for the District of Maryland in view of the FDA’s approval of our ANDA for dexmedetomidine hydrochloride injection, concentrate (100 mcg/ml) vials pursuant to our submission and statement under section viii. On August 20, 2014, we moved to intervene in the case on the side of the FDA. On August 25, 2014, we filed a declaratory judgment complaint against Hospira, Inc. in view of U.S. Patent No. 6,716,867 in the U.S. District Court for the District of New Jersey. On September 5, 2014, the Maryland Court ruled in favor of the FDA, Par and joint intervenor Mylan, Inc. on summary judgment, and Hospira, Inc. and its intervenor/co- complainant Sandoz appealed that judgment to the U.S. Court of Appeals for the Fourth Circuit. On October 29, 2014, all parties stipulated jointly to a dismissal of all of the cases (Maryland, New Jersey, and the Fourth Circuit) pursuant to a confidential settlement agreement.
On October 10, 2014, Novartis Pharmaceuticals Corporation and Novartis AG filed a lawsuit against us in the U.S. District Court for the District of Delaware. The complaint alleges infringement of U.S. Patent Nos. 5,665,772; 6,004,973; and 6,455,518 because we submitted an ANDA with a Paragraph IV certification to the FDA for approval of 0.25, 0.5, and 0.75 mg everolimus tablets. The complaint generally seeks (i) a finding of infringement and (ii) a permanent injunction be entered, terminating at the expiration of the patents-in-suit. We intend to defend this action vigorously.
On November 19, 2014, we filed a declaratory judgment action against GlaxoSmithKline and Aptalis in the U.S. District Court for the Eastern District of Pennsylvania, seeking declaratory judgment of non-infringement and invalidity of U.S. Patent No. 7,919,115 in view of our April 11, 2012 submission of an ANDA with a Paragraph IV certification to the FDA seeking approval for lamotrigine orally disintegrating tablets 25, 50, 100, and 200 mg. On January 30, 2015, the consent judgment was entered.
Under a Development and Supply Agreement between Pharmaceutics International, Inc. (“PII”) and Par Sterile, PII agreed to develop and manufacture, and Par Sterile agreed to market and sell, certain pharmaceutical
F-116
Table of Contents
products, including zoledronic acid, the generic version of Zometa® and Reclast®. Under the Agreement, the parties agreed to share equally all mutually agreed expenses and costs of Paragraph IV proceedings related to the product, including any costs and expenses related to any mutually agreed upon settlement. On February 20, 2013, Novartis Pharmaceuticals Corporation filed a lawsuit against PII, along with several other defendants, in the U.S. District Court for the District of New Jersey, for filing ANDAs with Paragraph IV certifications seeking FDA approval of both zoledronic acid eq 4 mg base/5 ml vials and zoledronic acid eq 5 mg base/100 ml bottles. The complaint alleges, among other things, that the sale of generic versions of Reclast® and Zometa® would infringe one or more of U.S. Patent Nos. 8,324,189; 7,932,241; and 8,052,987 and seeks (i) a finding of infringement, validity, and/or enforceability; (ii) a permanent injunction be entered, terminating at the expiration of the patents-in-suit; and (iii) damages or other monetary relief in light of commercial manufacture, use, offers to sell, or sale of the ANDA products. On March 1, 2013, the District Court denied Novartis’s request for a temporary restraining order against PII and the other defendants. On March 4, 2013, Par Sterile began distribution of PII’s generic Zometa® product and began distribution of the generic Reclast® product in December 2013. On December 3, 2014, in view of the foregoing, Novartis sued Par Sterile in the same court, seeking (i) a finding of infringement, validity, and/or enforceability; (ii) a permanent injunction be entered, terminating at the expiration of the patents-in-suit; and (iii) damages or other monetary relief in light of commercial manufacture, use, offers to sell, or sale of the ANDA products. We intend to defend this action vigorously.
On December 18, 2014, and January 23, 2015, Novartis Pharmaceuticals Corporation and Novartis AG filed lawsuits against us in the U.S. District Court for the District of Delaware. The complaints allege infringement of U.S. Patent Nos. 5,665,772; 7,297,703; and 7,741,338 518 because we submitted an ANDA with a Paragraph IV certification to the FDA for approval of 2.5, 5, 7.5, and 10 mg everolimus tablets. The complaints generally seek (i) a finding of infringement and (ii) a permanent injunction be entered, terminating at the expiration of the patents- in-suit. We intend to defend these actions vigorously.
On January 16, 2015, Supernus Pharmaceuticals filed a lawsuit against us in the U.S. District Court for the District of New Jersey. The complaint alleges infringement of U.S. Patent Nos. 8,298,576; 8,298,580; 8,663,683; and 8,877,248 because we submitted an ANDA with a Paragraph IV certification to the FDA for approval of 25, 50, 100, and 200 mg topiramate extended release capsules. The complaint generally seeks (i) a finding of infringement and (ii) a permanent injunction be entered, terminating at the expiration of the patents-in-suit. We intend to defend this action vigorously.
On January 21, 2015, Tris Pharma, Inc. filed a lawsuit against us in the U.S. District Court for the District of Delaware. The complaint alleges infringement of U.S. Patent Nos. 8,062,667; 8,287,903; 8,465,765; 8,563,033; and 8,778,390 because we submitted an ANDA with a Paragraph IV certification to the FDA for approval of 5 mg/ml methylphenidate hydrochloride extended release oral suspension. The complaint generally seeks (i) a finding of infringement and (ii) a permanent injunction be entered, terminating at the expiration of the patents-in-suit. We intend to defend this action vigorously.
On February 2, 2015, Cosmo Technologies, Ltd and Santarus, Inc. filed a lawsuit against us in the U.S. District Court for the District of Delaware. The complaint alleges infringement of U.S. Patent Nos. 7,410,651; 7,431,943; 8,293,273; 8,784,888; 8,895,064; and RE43,799 because we submitted an ANDA with a Paragraph IV certification to the FDA for approval of 9 mg budesonide tablets. The complaint generally seeks (i) a finding of infringement and (ii) a permanent injunction be entered, terminating at the expiration of the patents-in-suit. We intend to defend this action vigorously.
On February 20, 2015, Ferring Pharmaceuticals, Inc. and Ferring International Center S.A. filed a lawsuit against us in the U.S. District Court for the District of Delaware. The complaint alleges infringement of U.S. Patent Nos. 8,450,338 and 8,481,083 because we submitted an ANDA with a Paragraph IV certification to the FDA for
F-117
Table of Contents
approval of 10/3.5/12 g sodium picosulfate/magnesium oxide/citric acid packets for oral solution. The complaint generally seeks (i) a finding of infringement and (ii) a permanent injunction be entered, terminating at the expiration of the patents-in-suit. We intend to defend this action vigorously.
On February 26, 2015, Shire, LLC filed a lawsuit against us in the U.S. District Court for the District of New Jersey. The complaint alleges infringement of U.S. Patent Nos. RE41,148 and RE42,096 because we submitted an ANDA with a Paragraph IV certification to the FDA for approval of 5, 10, 15, 20, and 25 mg mixed amphetamine salts extended release capsules. The complaint generally seeks (i) a finding of infringement and (ii) a permanent injunction be entered, terminating at the expiration of the patents-in-suit. We intend to defend this action vigorously.
On March 6, 2015, BioMarin Pharmaceutical Inc. and Merck & Cie filed a lawsuit against us in the U.S. District Court for the District of New Jersey. The complaint alleges infringement of U.S. Patent Nos. 7,566,462; 7,566,714; 7,612,073; 7,727,987; 8,003,126; 8,067,416; RE43,797; and 8,318,745 because we submitted an ANDA with a Paragraph IV certification to the FDA for approval of 100 mg sapropterin dihydrochloride oral tablets. The complaint generally seeks (i) a finding of infringement and (ii) a permanent injunction be entered, terminating at the expiration of the patents-in-suit. We intend to defend this action vigorously.
On March 23, 2015, Helsinn Healthcare, Eisai, and Roche Palo Alto LLC filed a lawsuit against us in the U.S. District Court for the District of New Jersey. The complaint alleges infringement of U.S. Patent Nos. 7,947,724; 7,947,725; 7,960,424; 8,598,219; and 8,729,094, because we submitted an ANDA with a Paragraph IV certification to the FDA for approval of 0.25 mg/5 ml (0.05 mg/ml) palonosetron hydrochloride solution (sterile) for injection. The complaint generally seeks (i) a finding of infringement and (ii) a permanent injunction be entered, terminating at the expiration of the patents-in-suit. We intend to defend this action vigorously.
Industry related matters
Beginning in September 2003, we, along with numerous other pharmaceutical companies, have been named as a defendant in actions brought by the Attorneys General of Illinois, Kansas, and Utah, as well as a state law qui tam action brought on behalf of the state of Wisconsin by Peggy Lautenschlager and Bauer & Bach, LLC, alleging generally that the defendants defrauded the state Medicaid systems by purportedly reporting or causing the reporting of AWP and/or “Wholesale Acquisition Costs” that exceeded the actual selling price of the defendants’ prescription drugs. During the year ended December 31, 2013, we recorded $25.7 million as “Settlements and loss contingencies, net” on the consolidated statements of operations as we continued to periodically assess and estimate our remaining potential liability. On January 28, 2014, we settled the claims brought by the State of Kansas for $1.8 million. On February 5, 2014, we settled the claims brought by the State of Utah for $2.1 million. On June 2, 2014, we settled the claims brought by the State of Illinois for $28.5 million, including attorneys’ fees and costs. The amounts provided for 2013 represents the amounts settled, less amounts previously accrued. Other than as described below, all of the above AWP cases against the Company have been concluded.
On February 17, 2014, the Dane County Circuit Court for the State of Wisconsin dismissed the state law qui tam action brought on behalf of the state of Wisconsin by Peggy Lautenschlager and Bauer & Bach, LLC. On June 12, 2014, the Dane County Circuit Court denied the plaintiffs’ renewed motion to amend the complaint and issued a final order of dismissal on the merits, without prejudice. The plaintiffs subsequently appealed the ruling, and on September 22, 2014, the Wisconsin Court of Appeals dismissed the plaintiffs’ appeal. On August 11, 2014, plaintiffs filed a similar AWP qui tam action under seal in the Dane County Circuit Court, and the State of Wisconsin declined to intervene on December 19, 2014. On January 13, 2015, the Dane County Circuit Court unsealed the complaint. The complaint generally seeks (i) a judgment for qui tam plaintiffs; (ii) a declaration that defendants’ actions violated Wis. Stat. § 20.931; (iii) an award of treble damages to the State; (iv) an order
F-118
Table of Contents
that defendants pay civil penalties for statutory violations of not less than $5,000 for each violation; and (v) an award of an appropriate share of the proceeds to qui tam plaintiffs. We intend to vigorously defend this lawsuit.
The Attorneys General of Florida, Indiana and Virginia and the U.S. Office of Personnel Management (the “USOPM”) have issued subpoenas, and the Attorneys General of Michigan, Tennessee, Texas, and Utah have issued civil investigative demands, to us. The demands generally request documents and information pertaining to allegations that certain of our sales and marketing practices caused pharmacies to substitute ranitidine capsules for ranitidine tablets, fluoxetine tablets for fluoxetine capsules, and two 7.5 mg buspirone tablets for one 15 mg buspirone tablet, under circumstances in which some state Medicaid programs at various times reimbursed the new dosage form at a higher rate than the dosage form being substituted. We have provided documents in response to these subpoenas to the respective Attorneys General and the USOPM. The aforementioned subpoenas and civil investigative demands culminated in the federal and state law qui tam action brought on behalf of the United States and several states by Bernard Lisitza. The complaint was unsealed on August 30, 2011. Lisitza’s corrected second amended complaint generally seeks (i) a finding that defendants violated and be enjoined from future violations of the federal False Claims Act and state false claims acts; (ii) treble damages and maximum civil penalties for each violation of the federal False Claims Act and state false claims acts; (iii) an applicable percentage share of the proceeds; and (iv) expenses, fees, and costs. The United States intervened in this action on July 8, 2011 and filed a separate complaint on September 9, 2011, alleging claims for violations of the Federal False Claims Act and common law fraud. The United States’ second corrected complaint generally seeks (i) treble damages and civil penalties for violations under the federal False Claims Act and (ii) compensatory and punitive damages for common law fraud. The states of Michigan and Indiana have also intervened as to claims arising under their respective state false claims acts, common law fraud, and unjust enrichment. Michigan’s complaint generally seeks (i) treble damages and civil penalties and (ii) common law compensatory and punitive damages. Indiana’s amended complaint generally seeks treble damages, costs, and attorney’s fees. We intend to vigorously defend these lawsuits.
Other
On March 19, 2009, we were served with a subpoena by the DOJ requesting documents related to Par Specialty’s marketing of Megace® ES. The subpoena indicated that the DOJ was investigating promotional practices in the sales and marketing of Megace® ES. We cooperated with the DOJ in this inquiry. On March 5, 2013, we entered into a settlement agreement with the DOJ that terminated the DOJ’s investigation. The settlement agreement provided for our payment of $45.0 million (plus interest and fees) and included a plea agreement with the New Jersey Criminal Division of the DOJ in which the Company admitted to a single count of misdemeanor misbranding, a civil settlement with the DOJ, a state settlement encompassing forty-nine states (one state declined to participate due to the small amount of its potential recovery), and a release from each of these entities in favor of the Company related to the practices at issue in the terminated investigation. We accrued for the settlement in the period from January 1, 2012 through September 28, 2012 (Predecessor). The settlement was paid in 2013.
On August 6, 2014, we received a subpoena from the Office of the Attorney General of the State of Connecticut requesting documents related to our agreement with Covis Pharma S.a.r.l. to distribute an authorized generic version of Covis’s Lanoxin® (digoxin) oral tablets. We completed our response on October 28, 2014.
On December 5, 2014, we received a subpoena from the Antitrust Division of the DOJ requesting documents related to communications with competitors regarding our authorized generic version of Covis’s Lanoxin® (digoxin) oral tablets and our generic doxycycline products. We intend to cooperate fully with the Department of Justice’s inquiry.
F-119
Table of Contents
On February 3, 2015, we received a Civil Investigative Demand from Office of the Attorney General of the State of Alaska instructing production of, among other documents, all production in the on-going lawsuit filed against us in 2009 by the Bureau of Competition for the FTC and currently on remand to the U.S. District Court for the Northern District of Georgia, described above under “Patent related matters.” We intend to comply fully with the Civil Investigative Demand.
On February 9, 2015, we received a Civil Investigative Demand from the FTC instructing production of, among other documents, all documents related to our license agreement and manufacturing and supply agreement with Concordia Pharmaceuticals, Inc. (the “Concordia Agreements”) relating to our sale of clonidine hydrochloride extended release tablets, the generic version of Concordia’s Kapvay® (the “FTC Investigation”). The Company has negotiated a settlement of the FTC Investigation under which it will agree to entry of an FTC order prohibiting the Company from enforcing any provision of the Concordia Agreements that would prevent Concordia from marketing an authorized generic version of Kapvay® and prohibiting any future agreement between a brand-name company and us that would prevent the brand-name company from marketing an authorized generic version of a branded drug during any period of time when there is no patent in effect and listed in FDA’s publication Approved Drug Products with Therapeutic Equivalence Evaluations, also known as the “Orange Book,” covering the branded drug. Under the order, we will be subject to certain antitrust compliance and reporting requirements typical of FTC orders. The settlement and entry of the agreed-upon order are subject to initial acceptance by the FTC, publication of the settlement’s terms and a period of public comment, and the FTC’s final acceptance of the settlement.
We are, from time to time, a party to certain other litigations, including product liability litigations. We believe that these litigations are part of the ordinary course of our business and that their ultimate resolution will not have a material effect on our financial condition, results of operations or liquidity. We intend to defend or, in cases where we are the plaintiff, to prosecute these litigations vigorously.
Note 20—Segment Information:
We operate in two reportable business segments: generic pharmaceuticals (referred to as “Par Pharmaceutical” or “Par”) and branded pharmaceuticals (referred to as “Par Specialty Pharmaceuticals” or “Par Specialty”). Branded products are marketed under brand names through marketing programs that are designed to generate physician and consumer loyalty. Branded products generally are patent protected, which provides a period of market exclusivity during which they are sold with little or no direct competition. Generic pharmaceutical products are the chemical and therapeutic equivalents of corresponding brand drugs. The Drug Price Competition and Patent Term Restoration Act of 1984 provides that generic drugs may enter the market upon the approval of an ANDA and the expiration, invalidation or circumvention of any patents on corresponding brand drugs, or the expiration of any other market exclusivity periods related to the brand drugs. Our chief operating decision maker is our Chief Executive Officer.
Our business segments were determined based on management’s reporting and decision-making requirements in accordance with FASB ASC 280-10 Segment Reporting. We believe that our generic products represent a single operating segment because the demand for these products is mainly driven by consumers seeking a lower cost alternative to branded drugs. Par’s generic drugs are developed using similar methodologies, for the same purpose (e.g., seeking bioequivalence with a branded drug nearing the end of its market exclusivity period for any reason discussed above). Par’s generic products are produced using similar processes and standards mandated by the FDA, and Par’s generic products are sold to similar customers. Based on the similar economic characteristics, production processes and customers of Par’s generic products, management has determined that Par’s generic pharmaceuticals are a single reportable business segment. Our chief operating decision maker does not review the Par (generic) or Par Specialty (brand) segments in any more granularity, such as at the therapeutic or other classes or categories. Certain of our expenses, such as the direct sales force
F-120
Table of Contents
and other sales and marketing expenses and specific research and development expenses, are charged directly to either of the two segments. Other expenses, such as general and administrative expenses and non-specific research and development expenses are allocated between the two segments based on assumptions determined by management.
Our chief operating decision maker does not review our assets, depreciation or amortization by business segment at this time as they are not material to Par Specialty. Therefore, such allocations by segment are not provided.
The financial data for the two business segments are as follows ($ in thousands):
| Three months ended | ||||||||
| March 31, 2015 |
March 31, 2014 |
|||||||
| Revenues: |
||||||||
| Par Pharmaceutical |
$ | 346,629 | $ | 273,806 | ||||
| Par Specialty |
12,615 | 15,278 | ||||||
|
|
|
|||||||
| Total revenues |
$ | 359,244 | $ | 289,084 | ||||
| Gross margin: |
||||||||
| Par Pharmaceutical |
$ | 136,719 | $ | 83,644 | ||||
| Par Specialty |
8,354 | 10,670 | ||||||
|
|
|
|||||||
| Total gross margin |
$ | 145,073 | $ | 94,314 | ||||
| Operating income (loss): |
||||||||
| Par Pharmaceutical |
$ | 66,990 | $ | (23,260 | ) | |||
| Par Specialty |
(5,491 | ) | (10,895 | ) | ||||
|
|
|
|||||||
| Total operating income (loss) |
$ | 61,499 | $ | (34,155 | ) | |||
| Interest income |
17 | 14 | ||||||
| Interest expense |
(29,511 | ) | (25,467 | ) | ||||
| Loss on debt extinguishment |
— | (3,989 | ) | |||||
| Provision (benefit) for income taxes |
11,720 | (24,232 | ) | |||||
|
|
|
|||||||
| Net income (loss) |
$ | 20,285 | $ | (39,365 | ) | |||
|
|
||||||||
F-121
Table of Contents
Total revenues of our top selling products were as follows ($ in thousands):
| Three months ended | ||||||||
| March 31, 2015 |
March 31, 2014 |
|||||||
| Product |
||||||||
| Par Pharmaceutical |
||||||||
| Budesonide (Entocort®) |
$ | 28,878 | $ | 37,349 | ||||
|
Vasostrict® |
26,823 | — | ||||||
| Omega-3 acid ethyl esters (Lovaza®) |
23,434 | — | ||||||
| Bupropion ER (Wellbutrin®) |
21,562 | 16,342 | ||||||
| Amlodipine/Valsartan (Exforge®) |
18,762 | — | ||||||
| Propafenone (Rythmol SR®) |
12,171 | 21,112 | ||||||
|
Aplisol® |
11,500 | 4,070 | ||||||
| Metoprolol succinate ER (Toprol-XL®) |
11,022 | 14,117 | ||||||
| Divalproex (Depakote®) |
8,462 | 20,405 | ||||||
| Other |
179,038 | 154,972 | ||||||
| Other product related revenues |
4,977 | 5,439 | ||||||
|
|
|
|||||||
| Total Par Pharmaceutical Revenues |
$ | 346,629 | $ | 273,806 | ||||
|
|
|
|||||||
| Par Specialty |
||||||||
| Megace® ES |
$ | 4,986 | $ | 8,153 | ||||
| Nascobal® Nasal Spray |
6,504 | 6,325 | ||||||
| Other and other product related revenues |
1,125 | 800 | ||||||
|
|
|
|||||||
| Total Par Specialty Revenues |
$ | 12,615 | $ | 15,278 | ||||
|
|
||||||||
| (1) | The further detailing of revenues of the other approximately 80 generic drugs was not considered significant to the overall disclosure due to the lower volume of revenues associated with each of these generic products. No single product in the other category was significant to total generic revenues for the three-month periods ended March 31, 2015 and 2014. |
| (2) | Other product related revenues represents licensing and royalty related revenues from profit sharing agreements. |
Note 21—Restructuring:
Restructuring initiated in the first quarter of 2014
Subsequent to the Par Sterile Acquisition, we eliminated approximately 25 redundant positions within Par Pharmaceutical and accrued severance and other employee-related costs for those employees affected by the workforce reduction.
| ($ in thousands) Restructuring activities (Par Sterile) |
Initial charge |
Additional charge |
Cash payments |
Reversals, reclass or transfers |
Liabilities at March 31, 2015 |
|||||||||||||||
| Severance and employee benefits to be paid in cash |
$ | 1,146 | $ | 3,527 | $ | (3,610 | ) | $ | — | $ | 1,063 | |||||||||
|
|
|
|||||||||||||||||||
| Total restructuring costs line item |
$ | 1,146 | $ | 3,527 | $ | (3,610 | ) | $ | — | $ | 1,063 | |||||||||
|
|
||||||||||||||||||||
F-122
Table of Contents
Restructuring initiated in the fourth quarter of 2014
Due to the change in our product development strategy, we eliminated approximately 36 redundant positions within our Irvine location and accrued severance and other employee-related costs for these employees affected by the workforce reduction. During the three months ended March 31, 2015, we incurred approximately $0.4 million of additional net charges representing employees earning severance through their termination dates net of employees that were subsequently retained with their severance accruals reversed.
| ($ in thousands) Restructuring activities (Irvine) |
Initial charge |
Additional charge |
Cash payments |
Reversals, reclass or transfers |
Liabilities at March 31, 2015 |
|||||||||||||||
| Severance and employee benefits to be paid in cash |
$ | 740 | $ | 523 | $ | (266 | ) | $ | (160 | ) | $ | 837 | ||||||||
|
|
|
|||||||||||||||||||
| Total restructuring costs line item |
$ | 740 | $ | 523 | $ | (266 | ) | $ | (160 | ) | $ | 837 | ||||||||
|
|
||||||||||||||||||||
F-123
Table of Contents
Through and including , 2015 (the 25th day after the date of this prospectus), all dealers effecting transactions in the common stock, whether or not participating in this offering, may be required to deliver a prospectus. This delivery requirement is in addition to a dealer’s obligation to deliver a prospectus when acting as an underwriter and with respect to an unsold allotment or subscription.
shares
Par Pharmaceutical Holdings, Inc.
Common stock
Prospectus
| J.P. Morgan | Goldman, Sachs & Co. | |||||
| Citigroup | Morgan Stanley | |||||
| BofA Merrill Lynch | Deutsche Bank Securities | Evercore ISI | ||
| RBC Capital Markets |
TPG Capital BD, LLC |
BMO Capital Markets | Mizuho | |||
, 2015
Table of Contents
Part II
Information not required in prospectus
Item 13. Other expenses of issuance and distribution
The following table sets forth the costs and expenses, other than the underwriting discounts and commissions, payable by the Registrant in connection with the sale of common stock being registered. All amounts are estimates except for the SEC registration fee, the FINRA filing fee and listing fee.
| Item | Amount to be paid |
|||
| SEC registration fee |
$ | 11,620 | ||
| FINRA filing fee |
$ | 15,500 | ||
| listing fee |
* | |||
| Blue sky fees and expenses |
* | |||
| Printing and engraving expenses |
* | |||
| Legal fees and expenses |
* | |||
| Accounting fees and expenses |
* | |||
| Transfer Agent fees and expenses |
* | |||
| Miscellaneous expenses |
* | |||
|
|
|
|||
| Total |
$ | * | ||
|
|
||||
| * | To be completed by amendment. |
Item 14. Indemnification of directors and officers
Section 102(b)(7) of the DGCL enables a corporation to eliminate or limit the personal liability of a director for violations of the director’s fiduciary duty, except (i) for any breach of the director’s duty of loyalty to the corporation or its stockholders, (ii) for acts or omissions not in good faith or which involve intentional misconduct or a knowing violation of law, (iii) for liability of directors for unlawful payment of dividends or unlawful stock purchase or redemptions pursuant to Section 174 of the DGCL or (iv) for any transaction from which a director derived an improper personal benefit. Our certificate of incorporation includes a provision that eliminates the personal liability of directors for monetary damages for actions taken as a director to the fullest extent authorized by the DGCL.
Section 145(a) of the DGCL provides in relevant part that a corporation may indemnify any person who was or is a party or is threatened to be made a party to any threatened, pending or completed action, suit or proceeding, whether civil, criminal, administrative or investigative (other than an action by or in the right of the corporation), by reason of the fact that such person is or was a director or officer of the corporation, or is or was serving at the request of the corporation as a director or officer of another entity, against expenses (including attorneys’ fees), judgments, fines and amounts paid in settlement actually and reasonably incurred by such person in connection with such action, suit or proceeding if such person acted in good faith and in a manner such person reasonably believed to be in or not opposed to the best interests of the corporation, and, with respect to any criminal action or proceeding, had no reasonable cause to believe such person’s conduct was unlawful. The termination of any action, suit or proceeding by judgment, order, settlement, conviction or upon a plea of nolo contendere or its equivalent shall not, of itself, create a presumption that such person did not act in good faith and in a manner which such person reasonably believed to be in or not opposed to the best interests of the corporation, and, with respect to any criminal action or proceeding, had reasonable cause to believe that such person’s conduct was unlawful.
II-1
Table of Contents
Section 145(b) of the DGCL provides in relevant part that a corporation may indemnify any person who was or is a party or is threatened to be made a party to any threatened, pending or completed action or suit by or in the right of the corporation to procure a judgment in its favor by reason of the fact that the person is or was a director or officer of the corporation, or is or was serving at the request of the corporation as a director or officer of another entity, against expenses (including attorneys’ fees) actually and reasonably incurred by such person in connection with the defense or settlement of such action or suit if the person acted in good faith and in a manner the person reasonably believed to be in or not opposed to the best interests of the corporation and except that no indemnification shall be made in respect of any claim, issue or matter as to which such person shall have been adjudged to be liable to the corporation unless and only to the extent that the Court of Chancery of the State of Delaware or the court in which such action or suit was brought shall determine upon application that, despite the adjudication of liability but in view of all the circumstances of the case, such person is fairly and reasonably entitled to indemnity for such expenses which the Court of Chancery of the State of Delaware or such other court shall deem proper.
Our certificate of incorporation provides that we will indemnify our directors and officers to the fullest extent permitted by law. Our certificate of incorporation also provides that the indemnification and advancement of expenses provided by, or granted pursuant to the certificate of incorporation, are not exclusive of any other rights to which those seeking indemnification or advancement of expenses may be entitled under any bylaw, agreement, vote of stockholders or otherwise. Section 145(f) of the DGCL further provides that a right to indemnification or to advancement of expenses arising under a provision of the certificate of incorporation shall not be eliminated or impaired by an amendment to such provision after the occurrence of the act or omission which is the subject of the civil, criminal, administrative or investigative action, suit or proceeding for which indemnification or advancement of expenses is sought.
We have also entered into indemnification agreements with certain of our directors. Such agreements generally provide for indemnification by reason of being our director, as the case may be. These agreements are in addition to the indemnification provided by our certificate of incorporation and bylaws.
The underwriting agreement provides that the underwriters are obligated, under certain circumstances, to indemnify our directors, officers and controlling persons against certain liabilities, including liabilities under the Securities Act. Please refer to the form of underwriting agreement filed as Exhibit 1.1 hereto.
In connection with our acquisition by affiliates of TPG Global, LLC (together with its affiliates, “TPG”), we entered into an indemnification agreement pursuant to which we agreed to indemnify TPG, including the TPG funds invested in us and their respective affiliates, against liabilities, costs and expenses incurred by TPG arising out of or in connection with securities offerings, including liabilities under the securities laws, actions or failures to act by us or our affiliates generally, or the performance by TPG of services under the transaction and monitoring fee agreement described above.
We also maintain officers’ and directors’ liability insurance that insures against liabilities that our officers and directors may incur in such capacities. Section 145(g) of the DGCL provides that a corporation shall have power to purchase and maintain insurance on behalf of any person who is or was a director or officer of the corporation, or is or was serving at the request of the corporation as a director or officer of another entity, against any liability asserted against such person and incurred by such person in any such capacity, or arising out of such person’s status as such, whether or not the corporation would have the power to indemnify such person against such liability under that section.
II-2
Table of Contents
Item 15. Recent sales of unregistered securities
In the three years preceding the filing of this registration statement, we have issued the following securities that were not registered under the Securities Act. No underwriters were involved in any of the following transactions.
Equity securities
In connection with the Merger, we issued 703,701,017 shares of our common stock during 2012. Since January 1, 2013, we issued a total of 80,550,963 shares of our common stock. The common stock was issued without registration in reliance on the exemption afforded by Section 4(a)(2) of the Securities Act, as a transaction by an issuer not involving a public offering.
Since September 28, 2012, we granted options to purchase a total of 59,866,830 shares of our common stock to employees at a weighted average exercise price of $1.16 per share. Option grants were exempt pursuant to Section 4(a)(2) of the Securities Act, as a transaction by an issuer not involving a public offering.
Debt securities
In July 2012, Par Pharmaceutical Companies, our wholly-owned indirect subsidiary, issued $490.0 million aggregate principal amount of the Notes. The issuance of the Notes was conducted pursuant to the exemptions afforded by Section 4(a)(2) of the Securities Act, as a transaction by an issuer not involving a public offering. Par Pharmaceutical Companies and the guarantors of the Notes entered into a registration rights agreement in which they agreed, among other things, to file a registration statement to exchange the Notes for similar notes registered under the Securities Act. The registration statement on Form S-4 registering such notes was filed with the SEC on August 14, 2013 and declared effective on August 27, 2013.
Item 16. Exhibits and financial statement schedules
(a) Exhibits
See “Exhibit Index” following the signature page.
(b) Financial Statement Schedules
See the “Index to Consolidated Financial Statements and Financial Statement Schedules” included in the prospectus, which forms a part of this registration statement.
Item 17. Undertakings
The undersigned registrant hereby undertakes:
(1) That for purposes of determining any liability under the Securities Act of 1933, the information omitted from the form of prospectus filed as part of this registration statement in reliance upon Rule 430A and contained in a form of prospectus filed by the registrant pursuant to Rule 424(b)(1) or (4) or 497(h) under the Securities Act of 1933 shall be deemed to be part of this registration statement as of the time it was declared effective.
(2) That for the purpose of determining any liability under the Securities Act of 1933, each post-effective amendment that contains a form of prospectus shall be deemed to be a new registration statement relating to the securities offered therein, and the offering of such securities at that time shall be deemed to be the initial bona fide offering thereof.
II-3
Table of Contents
(3) For the purpose of determining liability under the Securities Act of 1933 to any purchaser, if the registrant is subject to Rule 430C, each prospectus filed pursuant to Rule 424(b) as part of a registration statement relating to an offering, other than registration statements relying on Rule 430B or other than prospectuses filed in reliance on Rule 430A, shall be deemed to be part of and included in the registration statement as of the date it is first used after effectiveness. Provided, however, that no statement made in a registration statement or prospectus that is part of the registration statement or made in a document incorporated or deemed incorporated by reference into the registration statement or prospectus that is part of the registration statement will, as to a purchaser with a time of contract of sale prior to such first use, supersede or modify any statement that was made in the registration statement or prospectus that was part of the registration statement or made in any such document immediately prior to such date of first use.
(4) The undersigned registrant undertakes that in a primary offering of securities of the undersigned registrant pursuant to this registration statement, regardless of the underwriting method used to sell the securities to the purchaser, if the securities are offered or sold to such purchaser by means of any of the following communications, the undersigned registrant will be a seller to the purchaser and will be considered to offer or sell such securities to such purchaser:
(i) Any preliminary prospectus or prospectus of the undersigned registrant relating to the offering required to be filed pursuant to Rule 424;
(ii) Any free writing prospectus relating to the offering prepared by or on behalf of the undersigned registrant or used or referred to by the undersigned registrant;
(iii) The portion of any other free writing prospectus relating to the offering containing material information about the undersigned registrant or its securities provided by or on behalf of the undersigned registrant; and
(iv) Any other communication that is an offer in the offering made by the undersigned registrant to the purchaser.
(5) Insofar as indemnification for liabilities arising under the Securities Act of 1933 may be permitted to directors, officers and controlling persons of the registrant pursuant to the foregoing provisions, or otherwise, the registrant has been advised that in the opinion of the Securities and Exchange Commission such indemnification is against public policy as expressed in the Act and is, therefore, unenforceable. In the event that a claim for indemnification against such liabilities (other than the payment by the registrant of expenses incurred or paid by a director, officer or controlling person of the registrant in the successful defense of any action, suit or proceeding) is asserted by such director, officer or controlling person in connection with the securities being registered, the registrant will, unless in the opinion of its counsel the matter has been settled by controlling precedent, submit to a court of appropriate jurisdiction the question whether such indemnification by it is against public policy as expressed in the Act and will be governed by the final adjudication of such issue.
(6) To provide to the underwriters at the closing specified in the underwriting agreement certificates in such denominations and registered in such names as required by the underwriters to permit prompt delivery to each purchaser.
II-4
Table of Contents
Signatures
Pursuant to the requirements of the Securities Act of 1933, the registrant has duly caused this registration statement to be signed on its behalf by the undersigned, thereunto duly authorized, in the city of Chestnut Ridge, New York on May 11, 2015.
| Par Pharmaceutical Holdings, Inc. | ||
| By: | /s/ Paul V. Campanelli | |
| Name: | Paul V. Campanelli | |
| Title: | Chief Executive Officer and Director | |
* * *
Pursuant to the requirements of the Securities Act of 1933, this registration statement has been signed by the following persons in the capacities and on the dates indicated.
| Signature | Title | Date | ||
| /s/ Paul V. Campanelli Paul V. Campanelli |
Chief Executive Officer and Director (Principal Executive Officer) | May 11, 2015 | ||
| /s/ Michael A. Tropiano Michael A. Tropiano |
Executive Vice President and Chief Financial Officer (Principal Financial Officer) |
May 11, 2015 | ||
| /s/ Stephen P. Carey Stephen P. Carey |
Senior Vice President and Controller (Principal Accounting Officer) | May 11, 2015 | ||
| * Patrick G. LePore |
Director | May 11, 2015 | ||
| * Todd B. Sisitsky |
Director | May 11, 2015 | ||
| * Jeffrey K. Rhodes |
Director | May 11, 2015 | ||
| * Sharad Mansukani |
Director | May 11, 2015 | ||
|
| ||||
| *By: |
/s/ Michael A. Tropiano | |
| Attorney-in-fact | ||
II-5
Table of Contents
Exhibit index
| Exhibit number |
Exhibit title | |||
| 1.1 | * | Form of Underwriting Agreement. | ||
| 2.1 | Agreement and Plan of Merger dated as of August 23, 2011 between Par Pharmaceutical, Inc. and Admiral Acquisition Corp., on the one hand, and Anchen Incorporated and Chih-Ming Chen, Ph.D. as securityholders representative on the other hand—previously filed as an exhibit to Par Pharmaceutical Companies’ Current Report on Form 8-K dated November 18, 2011 and incorporated herein by reference. | |||
| 2.2 | Agreement and Amendment to Agreement and Plan of Merger entered into as of November 17, 2011 between Par Pharmaceutical, Inc. and Admiral Acquisition Corp., on the one hand, and Anchen Incorporated and Chih-Ming Chen, Ph.D. as securityholders representative on the other hand—previously filed as an exhibit to Par Pharmaceutical Companies’ Current Report on Form 8-K dated August 24, 2011 and incorporated herein by reference. | |||
| 2.3 | Agreement and Plan of Merger by and between Par Pharmaceutical Companies, Inc., on the one hand, and Sky Growth Holdings Corporation and Sky Growth Acquisition Corporation, on the other hand—previously filed as an exhibit to Par Pharmaceutical Companies’ Current Report on Form 8-K dated July 16, 2012 and incorporated herein by reference. | |||
| 2.4 | Agreement and Plan of Merger dated as of January 17, 2014 by and among JHP Group Holdings, Inc., Par Pharmaceutical Companies, Inc., Juniper Mergeco, Inc. and WP JHP Representative, LLC, solely in its capacity as the Representative—previously filed as an exhibit to Par Pharmaceutical Companies’ Current Report on Form 8-K dated January 17, 2014 and incorporated herein by reference. | |||
| 3.1 | * | Amended and Restated Certificate of Incorporation of Par Pharmaceutical Holdings, Inc. | ||
| 3.2 | * | Amended and Restated Bylaws of Par Pharmaceutical Holdings, Inc. | ||
| 4.1 | * | Form of Stock Certificate. | ||
| 4.2 | Indenture, dated as of September 28, 2012, between Sky Growth Acquisition Corporation, which on September 28, 2012 was merged with and into Par Pharmaceutical Companies, Inc., and Wells Fargo Bank, National Association, as Trustee—previously filed as an exhibit to Par Pharmaceutical Companies’ Registration Statement on Form S-4 dated August 27, 2013 and incorporated herein by reference. | |||
| 4.3 | Supplemental Indenture, dated as of September 28, 2012, among Par Pharmaceutical Companies, Inc., the Guarantors party thereto and Wells Fargo Bank, National Association, as Trustee—previously filed as an exhibit to Par Pharmaceutical Companies’ Registration Statement on Form S-4 dated August 27, 2013 and incorporated herein by reference | |||
| 4.4 | Registration Rights Agreement, dated as of September 28, 2012, by and between Sky Growth Acquisition Corporation, which on September 28, 2012 was merged with and into Par Pharmaceutical Companies, Inc., and Goldman, Sachs & Co., as representative of the several initial purchasers set forth on Schedule A thereto—previously filed as an exhibit to Par Pharmaceutical Companies’ Registration Statement on Form S-4 dated August 27, 2013 and incorporated herein by reference. | |||
| 4.5 | Registration Rights Agreement Joinder, dated as of September 28, 2012, by and between Par Pharmaceutical Companies, Inc., the Guarantors party thereto and Goldman, Sachs & Co., as representative of the several initial purchasers set forth on Schedule A thereto—previously filed as an exhibit to Par Pharmaceutical Companies’ Registration Statement on Form S-4 dated August 27, 2013 and incorporated herein by reference. | |||
|
|
| |||
II-6
Table of Contents
| Exhibit number |
Exhibit title | |||
| 4.6 | Second Supplemental Indenture, dated as of February 20, 2014, among the Guarantors party thereto and Wells Fargo Bank, National Association, as Trustee—previously filed as an exhibit to Par Pharmaceutical Companies’ Annual Report on Form 10-K for the fiscal year 2013 and incorporated herein by reference. | |||
| 4.7 | ** | Management Rights Agreement, dated as of September 28, 2012, by and among Sky Growth Holdings Corporation, TPG Sky, L.P., a Delaware limited liability partnership, and TPG Partners VI, L.P., a Delaware limited partnership. | ||
| 5.1 | * | Opinion of Ropes & Gray LLP. | ||
| 10.1 | Lease Agreement, dated as of January 1, 1993, between Par Pharmaceutical, Inc. and Ramapo Corporate Park Associates—previously filed as an exhibit to Par Pharmaceutical Companies’ Annual Report on Form 10-K for the fiscal year 1996 and incorporated herein by reference. | |||
| 10.2 | Lease Extension and Modification Agreement, dated as of August 30, 1997, between Par Pharmaceutical, Inc. and Ramapo Corporate Park Associates—previously filed as an exhibit to Par Pharmaceutical Companies’ Annual Report on Form 10-K for the fiscal year 1997 and incorporated herein by reference. | |||
| 10.3 | Lease Agreement, dated as of May 24, 2002, between Par Pharmaceutical, Inc. and 300 Tice Realty Associates L.L.C.—previously filed as an exhibit to Par Pharmaceutical Companies’ Annual Report on Form 10-K for the fiscal year ended 2003 and incorporated herein by reference. | |||
| 10.4 | Second Amendment to Lease Agreement, dated as of December 19, 2002, between Par Pharmaceutical, Inc. and 300 Tice Realty Associates L.L.C.—previously filed as an exhibit to Par Pharmaceutical Companies’ Annual Report on Form 10-K for the fiscal year ended 2003 and incorporated herein by reference. | |||
| 10.5 | Third Amendment to Lease Agreement, dated as of December 20, 2002, between Par Pharmaceutical, Inc. and 300 Tice Realty Associates L.L.C.—previously filed as an exhibit to Par Pharmaceutical Companies’ Annual Report on Form 10-K for the fiscal year ended 2003 and incorporated herein by reference. | |||
| 10.6 | Seventh Amendment to Lease Agreement, dated as of February 24, 2010, between Par Pharmaceutical, Inc. and 300 Tice Realty Associates, Inc.—previously filed as an exhibit to Par Pharmaceutical Companies’ Annual Report on Form 10-K for the fiscal year 2009 and incorporated herein by reference | |||
| 10.7 | License and Supply Agreement, dated as of April 26, 2001, between Elan Transdermal Technologies, Inc. and Par Pharmaceutical, Inc.—previously filed as an exhibit to Amendment No. 1 to Par Pharmaceutical Companies’ Quarterly Report on Form 10-Q for the quarter ended September 29, 2001 and incorporated herein by reference. | |||
| 10.8 | Patent and Know How License Agreement, dated June 14, 2002, between Nortec Development Associates, Inc. and Par Pharmaceutical, Inc.—previously filed as an exhibit to Par Pharmaceutical Companies’ Quarterly Report on Form 10-Q/A Amendment No. 1 for the quarter ended June 30, 2002 and incorporated herein by reference. | |||
| 10.9 | License Agreement, dated as of August 12, 2003, by and between Mead Johnson & Company, Bristol-Myers Squibb Company and Par Pharmaceutical, Inc.—previously filed as an exhibit to Par Pharmaceutical Companies’ Quarterly Report on Form 10-Q for the quarter ended September 28, 2003 and incorporated herein by reference. | |||
|
|
| |||
II-7
Table of Contents
| Exhibit number |
Exhibit title | |||
| 10.10 | Product Development and Patent License Agreement, dated as of October 22, 2003, by and between Nortec Development Associates, Inc. and Par Pharmaceutical, Inc.—previously filed as an exhibit to Par Pharmaceutical Companies’ Annual Report on Form 10-K for the fiscal year 2003 and incorporated herein by reference. | |||
| 10.11 | Credit Agreement, dated as of September 28, 2012, among Sky Growth Acquisition Corporation, Par Pharmaceutical Companies, Inc., Par Pharmaceutical, Inc., Sky Growth Intermediate Holdings II Corporation, Bank of America, N.A., as administrative agent, and the other lenders party thereto—previously filed as an exhibit to Par Pharmaceutical Companies’ Registration Statement on Form S-4 dated August 27, 2013 and incorporated herein by reference. | |||
| 10.12 | Security Agreement, dated as of September 28, 2012, among Sky Growth Acquisition Corporation, Par Pharmaceutical Companies, Inc., Sky Growth Intermediate Holdings II Corporation, Par Pharmaceutical, Inc., the Subsidiary Guarantors party thereto, and Bank of America, N.A., as administrative agent—previously filed as an exhibit to Par Pharmaceutical Companies’ Registration Statement on Form S-4 dated August 27, 2013 and incorporated herein by reference. | |||
| 10.13 | Guaranty, dated as of September 28, 2012, among Sky Growth Intermediate Holdings II Corporation, the Other Guarantors party thereto, and Bank of America, N.A., as administrative agent—previously filed as an exhibit to Par Pharmaceutical Companies’ Registration Statement on Form S-4 dated August 27, 2013 and incorporated herein by reference. | |||
| 10.14 | Amendment No. 1, dated as of February 6, 2013, by and among Par Pharmaceutical Companies, Inc., Par Pharmaceutical, Inc., Sky Growth Intermediate Holdings II Corporation, the Lead Arrangers and Bank of America, N.A., as administrative agent—previously filed as an exhibit to Par Pharmaceutical Companies’ Registration Statement on Form S-4 dated August 27, 2013 and incorporated herein by reference. | |||
| 10.15 | Amendment No. 2, dated as of February 20, 2013, among Par Pharmaceutical Companies, Inc., the Revolving Credit Lenders party thereto and Bank of America, N.A., as administrative agent—previously filed as an exhibit to Par Pharmaceutical Companies’ Registration Statement on Form S-4 dated August 27, 2013 and incorporated herein by reference. | |||
| 10.16 | Amendment No. 3, dated as of February 28, 2013, among Par Pharmaceutical Companies, Inc., Par Pharmaceutical, Inc., Sky Growth Intermediate Holdings II Corporation, the Subsidiary Guarantors party thereto and Bank of America, N.A., as administrative agent—previously filed as an exhibit to Par Pharmaceutical Companies’ Registration Statement on Form S-4 dated August 27, 2013 and incorporated herein by reference. | |||
| 10.17 | Amendment No. 4, dated as of February 20, 2014, among Par Pharmaceutical Companies, Inc., Par Pharmaceutical, Inc., Sky Growth Intermediate Holdings II Corporation, the Subsidiary Guarantors party thereto and Bank of America, N.A., as administrative agent, and Bank of America, N.A., Goldman Sachs Bank USA and Deutsche Bank Securities Inc., as lead arrangers—previously filed as an exhibit to Par Pharmaceutical Companies’ Current Report on Form 8-K dated February 20, 2014 and incorporated herein by reference. | |||
| 10.18 | Amendment No. 5, dated February 20, 2015, among Par Pharmaceutical Companies, Inc., Par Pharmaceutical, Inc., Sky Growth Intermediate Holdings II Corporation, certain subsidiaries of Par Pharmaceutical Companies, Inc. party thereto, Bank of America, N.A., as administrative agent, swing line lender and L/C issuer, each lender from time to time party thereto, and the other parties from time to time party thereto—previously filed as an exhibit to Par Pharmaceutical Companies’ Current Report on Form 8-K dated February 25, 2015 and incorporated herein by reference. | |||
|
|
| |||
II-8
Table of Contents
| Exhibit number |
Exhibit title | |||
| 10.19 | Amendment No. 6, dated February 25, 2015, among Par Pharmaceutical Companies, Inc., Par Pharmaceutical, Inc., Sky Growth Intermediate Holdings II Corporation, certain subsidiaries of Par Pharmaceutical Companies, Inc. party thereto, Bank of America, N.A., as administrative agent, and Bank of America, N.A., Goldman Sachs Bank USA and Deutsche Bank Securities Inc., as lead arrangers—previously filed as an exhibit to Par Pharmaceutical Companies’ Current Report on Form 8-K dated February 25, 2015 and incorporated herein by reference. | |||
| 10.20 | Incremental Term B-2 Joinder Agreement, dated as of February 20, 2014, among Par Pharmaceutical Companies, Inc., Par Pharmaceutical, Inc., Sky Growth Intermediate Holdings II Corporation, the Subsidiary Guarantors party thereto and Bank of America, N.A., as administrative agent, and Bank of America, N.A., and Goldman Sachs Bank USA, as lead arrangers—previously filed as an exhibit to Par Pharmaceutical Companies’ Current Report on Form 8-K dated February 20, 2014 and incorporated herein by reference. | |||
| 10.21† | Amended and Restated Employment Agreement, dated as of September 28, 2012, by and between Par Pharmaceutical, Inc., Sky Growth Holdings Corporation and Paul Campanelli—previously filed as an exhibit to Par Pharmaceutical Companies’ Registration Statement on Form S-4 dated August 27, 2013 and incorporated herein by reference. | |||
| 10.22† | Amended and Restated Employment Agreement, dated as of September 28, 2012, by and between Par Pharmaceutical, Inc., Sky Growth Holdings Corporation and Thomas Haughey—previously filed as an exhibit to Par Pharmaceutical Companies’ Registration Statement on Form S-4 dated August 27, 2013 and incorporated herein by reference. | |||
| 10.23† | Amended and Restated Employment Agreement, dated as of September 28, 2012, by and between Par Pharmaceutical, Inc., Sky Growth Holdings Corporation and Michael Tropiano—previously filed as an exhibit to Par Pharmaceutical Companies’ Registration Statement on Form S-4 dated August 27, 2013 and incorporated herein by reference. | |||
| 10.24† | Management Services Agreement, dated as of September 28, 2012, by and among Sky Growth Acquisition Corporation, Sky Growth Intermediate Holdings I Corporation, Sky Growth Intermediate Holdings II Corporation, Sky Growth Holdings Corporation and TPG VI Management, LLC—previously filed as an exhibit to Par Pharmaceutical Companies’ Registration Statement on Form S-4 dated August 27, 2013 and incorporated herein by reference. | |||
| 10.25† | Sky Growth Holdings Corporation 2012 Equity Incentive Plan—previously filed as an exhibit to Par Pharmaceutical Companies’ Registration Statement on Form S-4 dated August 27, 2013 and incorporated herein by reference. | |||
| 10.26† | Form of Long-Term Cash Incentive Award Agreement—previously filed as an exhibit to Par Pharmaceutical Companies’ Registration Statement on Form S-4 dated August 27, 2013 and incorporated herein by reference. | |||
| 10.27† | Form of Non-Statutory Stock Option Agreement—previously filed as an exhibit to Par Pharmaceutical Companies’ Registration Statement on Form S-4 dated August 27, 2013 and incorporated herein by reference. | |||
| 10.28† | Form of Non-Statutory Rollover Option Agreement—previously filed as an exhibit to Par Pharmaceutical Companies’ Registration Statement on Form S-4 dated August 27, 2013 and incorporated herein by reference. | |||
|
|
| |||
II-9
Table of Contents
| Exhibit number |
Exhibit title | |||
| 10.29† | Form of Restricted Stock Unit Agreement—previously filed as an exhibit to Par Pharmaceutical Companies’ Registration Statement on Form S-4 dated August 27, 2013 and incorporated herein by reference. | |||
| 10.30† | Amended and Restated Employment Agreement, dated as of September 28, 2012, by and between Par Pharmaceutical, Inc., Sky Growth Holdings Corporation and Patrick LePore—previously filed as an exhibit to Par Pharmaceutical Companies’ Registration Statement on Form S-4 dated August 27, 2013 and incorporated herein by reference. | |||
| 10.31† | Separation Agreement and Release, dated January 31, 2013, among Patrick LePore, Par Pharmaceutical Companies, Inc. and Par Pharmaceutical, Inc.—previously filed as an exhibit to Par Pharmaceutical Companies’ Registration Statement on Form S-4 dated August 27, 2013 and incorporated herein by reference. | |||
| 10.32† | Employment Agreement, dated as of February 12, 2014, by and between Par Pharmaceutical, Inc., Sky Growth Holdings Corporation and Terrance Coughlin—previously filed as an exhibit to Par Pharmaceutical Companies’ Annual Report on Form 10-K for the fiscal year 2013 and incorporated herein by reference. | |||
| 10.33† | Form of Non-Statutory Stock Option Agreement-previously filed as an exhibit to Par Pharmaceutical Companies’ Annual Report on Form 10-K for the fiscal year 2014 and incorporated herein by reference. | |||
| 21.1** | List of subsidiaries of Par Pharmaceutical Holdings, Inc. | |||
| 23.1* | Consent of Ropes & Gray LLP (included in the opinion filed as Exhibit 5.1). | |||
| 23.2 | Consent of Ernst & Young LLP. | |||
| 23.3 | Consent of Deloitte & Touche LLP related to Par Pharmaceutical Holdings, Inc. (Successor). | |||
| 23.4 | Consent of Deloitte & Touche LLP related to Par Pharmaceutical Companies, Inc. (Predecessor). | |||
|
|
| |||
| † | Indicates management contract or compensatory plan or arrangement. |
| * | To be filed by amendment. |
| ** | Previously filed. |
II-10