Attached files
| file | filename |
|---|---|
| EXCEL - IDEA: XBRL DOCUMENT - IMMUCELL CORP /DE/ | Financial_Report.xls |
| EX-4.1 - AMENDMENT TO RIGHTS AGREEMENT - IMMUCELL CORP /DE/ | f10q0315ex4i_immucellcorp.htm |
| EX-32 - CERTIFICATION - IMMUCELL CORP /DE/ | f10q0315ex32_immucellcorp.htm |
| EX-31 - CERTIFICATION - IMMUCELL CORP /DE/ | f10q0315ex31_immucellcorp.htm |
UNITED STATES
SECURITIES AND EXCHANGE COMMISSION
Washington, D.C. 20549
FORM 10-Q
☒ QUARTERLY REPORT PURSUANT TO SECTION 13 OR 15(d) OF THE
SECURITIES EXCHANGE ACT OF 1934
For the quarterly period ended March 31, 2015
| 001-12934 | ||
| (Commission file number) |
| ImmuCell Corporation | ||
| (Exact name of registrant as specified in its charter) |
| Delaware | 01-0382980 | |
| (State of Incorporation) | (I.R.S. Employer | |
| Identification No.) |
| 56 Evergreen Drive, Portland, ME | 04103 | |
| (Address of principal executive office) | (Zip Code) |
| (207) 878-2770 | ||
| (Registrant's telephone number) |
Indicate by check mark whether the registrant (1) has filed all reports required to be filed by Section 13 or 15(d) of the Securities Exchange Act of 1934 during the preceding 12 months (or for such shorter period that the registrant was required to file such reports), and (2) has been subject to such filing requirements for the past 90 days. Yes☒ No ☐
Indicate by check mark whether the registrant has submitted electronically and posted on its corporate Web site, if any, every Interactive Data File required to be submitted and posted pursuant to Rule 405 of Regulation S-T during the preceding 12 months (or for such shorter period that the registrant was required to submit and post such files). Yes ☒ No ☐
Indicate by check mark whether the registrant is a large accelerated filer, an accelerated filer, a non-accelerated filer, or a smaller reporting company. See the definitions of “large accelerated filer,” “accelerated filer” and “smaller reporting company” in Rule 12b-2 of the Exchange Act.
Large accelerated filer ☐ Accelerated filer ☐ Non-accelerated filer ☐ Smaller reporting company ☒
Indicate by check mark whether the registrant is a shell company (as defined in Rule 12b-2 of the Exchange Act). Yes ☐ No ☒
The number of shares of the Registrant’s common stock outstanding at May 7, 2015 was 3,029,034.
ImmuCell Corporation
TABLE OF CONTENTS
March 31, 2015
PART I: FINANCIAL INFORMATION
| ITEM 1. | Financial Statements | |||||
| Balance Sheets as of March 31, 2015 and December 31, 2014 | 2 | |||||
| Statements of Operations for the three-month periods ended March 31, 2015 and 2014 | 3 | |||||
| Statements of Comprehensive Income (Loss) for the three-month periods ended March 31, 2015 and 2014 | 4 | |||||
| Statements of Stockholders’ Equity for the three-month periods ended March 31, 2015 and 2014 | 5 | |||||
| Statements of Cash Flows for the three-month periods ended March 31, 2015 and 2014 | 6 | |||||
| Notes to Unaudited Financial Statements | 7-15 | |||||
| ITEM 2. | Management’s Discussion and Analysis of Financial Condition and Results of Operations | 16-24 | ||||
| ITEM 3. | Quantitative and Qualitative Disclosures about Market Risk | 24 | ||||
| ITEM 4. | Controls and Procedures | 24 | ||||
| PART II: OTHER INFORMATION | ||||||
| ITEMS 1 THROUGH 6 | 25-31 | |||||
| Signature | 31 | |||||
| -1- |
ImmuCell Corporation
PART 1. FINANCIAL INFORMATION
ITEM 1. FINANCIAL STATEMENTS
BALANCE SHEETS
| (Unaudited) As of March 31, 2015 | As of December 31, 2014 | |||||||
| ASSETS | ||||||||
| CURRENT ASSETS: | ||||||||
| Cash and cash equivalents | $ | 2,470,088 | $ | 850,028 | ||||
| Short-term investments | 1,740,000 | 2,489,000 | ||||||
| Accounts receivable, net | 754,854 | 1,005,292 | ||||||
| Inventory | 578,663 | 945,755 | ||||||
| Prepaid expenses and other assets | 178,621 | 148,399 | ||||||
| Current portion of deferred tax asset | 17,673 | 30,463 | ||||||
| Total current assets | 5,739,899 | 5,468,937 | ||||||
| PROPERTY, PLANT AND EQUIPMENT, net | 4,558,596 | 3,837,647 | ||||||
| LONG-TERM PORTION OF DEFERRED TAX ASSET | 913,003 | 1,230,340 | ||||||
| LONG-TERM INVESTMENTS | 0 | 496,000 | ||||||
| OTHER ASSETS, net | 18,210 | 18,930 | ||||||
| TOTAL ASSETS | $ | 11,229,708 | $ | 11,051,854 | ||||
| LIABILITIES AND STOCKHOLDERS’ EQUITY | ||||||||
| CURRENT LIABILITIES: | ||||||||
| Accounts payable and accrued expenses | $ | 587,186 | $ | 851,677 | ||||
| Current portion of bank debt | 115,368 | 150,382 | ||||||
| Deferred revenue | 6,690 | 6,690 | ||||||
| Total current liabilities | 709,244 | 1,008,749 | ||||||
| LONG-TERM LIABILITIES: | ||||||||
| Long-term portion of bank debt | 731,877 | 745,920 | ||||||
| Interest rate swap | 45,315 | 38,817 | ||||||
| Total long-term liabilities | 777,192 | 784,737 | ||||||
| TOTAL LIABILITIES | 1,486,436 | 1,793,486 | ||||||
| STOCKHOLDERS’ EQUITY: | ||||||||
| Common stock, $0.10 par value per share, 8,000,000 shares authorized, 3,261,148 shares issued as of March 31, 2015 and December 31, 2014 | 326,115 | 326,115 | ||||||
| Capital in excess of par value | 10,049,845 | 10,042,305 | ||||||
| Accumulated deficit | (95,485 | ) | (574,567 | ) | ||||
| Treasury stock, at cost, 233,114 and 234,114 shares as of March 31, 2015 and December 31, 2014, respectively | (509,966 | ) | (512,154 | ) | ||||
| Accumulated other comprehensive loss | (27,237 | ) | (23,331 | ) | ||||
| Total stockholders’ equity | 9,743,272 | 9,258,368 | ||||||
| TOTAL LIABILITIES AND STOCKHOLDERS’ EQUITY | $ | 11,229,708 | $ | 11,051,854 | ||||
The accompanying notes are an integral part of these financial statements.
| -2- |
ImmuCell Corporation
(Unaudited)
STATEMENTS OF OPERATIONS
| For the Three-Month Periods Ended March 31, | ||||||||
| 2015 | 2014 | |||||||
| Product sales | $ | 3,101,491 | $ | 2,081,752 | ||||
| Costs of goods sold | 1,250,566 | 931,857 | ||||||
| Gross margin | 1,850,925 | 1,149,895 | ||||||
| Sales and marketing expenses | 388,903 | 285,305 | ||||||
| Product development expenses | 330,665 | 594,209 | ||||||
| Administrative expenses | 311,305 | 257,820 | ||||||
| Operating expenses | 1,030,873 | 1,137,334 | ||||||
| NET OPERATING INCOME | 820,052 | 12,561 | ||||||
| Other expenses, net | 5,450 | 11,407 | ||||||
| INCOME BEFORE INCOME TAXES | 814,602 | 1,154 | ||||||
| Income tax expense | 335,520 | 14,489 | ||||||
| NET INCOME (LOSS) | $ | 479,082 | ($ | 13,335 | ) | |||
| Weighted average common shares outstanding: | ||||||||
| Basic | 3,027,345 | 3,026,901 | ||||||
| Diluted | 3,143,576 | 3,026,901 | ||||||
| NET INCOME (LOSS) PER SHARE: | ||||||||
| Basic | $ | 0.16 | ($ | 0.00 | ) | |||
| Diluted | $ | 0.15 | ($ | 0.00 | ) | |||
The accompanying notes are an integral part of these financial statements.
| -3- |
ImmuCell Corporation
(Unaudited)
STATEMENTS OF COMPREHENSIVE INCOME (LOSS)
| For the Three-Month Periods Ended March 31, | ||||||||
| 2015 | 2014 | |||||||
| Net income (loss) | $ | 479,082 | ($ | 13,335 | ) | |||
| Other comprehensive (loss): | ||||||||
| Interest rate swap, before taxes | (6,498 | ) | (2,342 | ) | ||||
| Income tax applicable to interest rate swap | 2,592 | 934 | ||||||
| Other comprehensive (loss), net of taxes | (3,906 | ) | (1,408 | ) | ||||
| Total comprehensive income (loss) | $ | 475,176 | ($ | 14,743 | ) | |||
The accompanying notes are an integral part of these financial statements.
| -4- |
ImmuCell Corporation
(Unaudited)
STATEMENTS OF STOCKHOLDERS’ EQUITY
| Common Stock $0.10 Par Value | Capital in Excess of | Accumulated | Treasury Stock | Accumulated Other Comprehensive | Total Stockholders’ | |||||||||||||||||||||||||||
| Shares | Amount | Par Value | Deficit | Shares | Amount | (Loss) | Equity | |||||||||||||||||||||||||
| Balance as of December 31, 2014 | 3,261,148 | $ | 326,115 | $ | 10,042,305 | ($ | 574,567 | ) | 234,114 | ($ | 512,154 | ) | ($ | 23,331 | ) | $ | 9,258,368 | |||||||||||||||
| Net income | 0 | 0 | 0 | 479,082 | 0 | 0 | 0 | 479,082 | ||||||||||||||||||||||||
| Other comprehensive (loss), net of taxes | 0 | 0 | 0 | 0 | 0 | 0 | (3,906 | ) | (3,906 | ) | ||||||||||||||||||||||
| Exercise of stock options | 0 | 0 | 3,062 | 0 | (1,000 | ) | 2,188 | 0 | 5,250 | |||||||||||||||||||||||
| Stock-based compensation | 0 | 0 | 4,478 | 0 | 0 | 0 | 0 | 4,478 | ||||||||||||||||||||||||
| Balance as of March 31, 2015 | 3,261,148 | $ | 326,115 | $ | 10,049,845 | ($ | 95,485 | ) | 233,114 | ($ | 509,966 | ) | ($ | 27,237 | ) | $ | 9,743,272 | |||||||||||||||
| Common Stock $0.10 Par Value | Capital in Excess of | Accumulated | Treasury Stock | Accumulated Other Comprehensive | Total Stockholders’ | |||||||||||||||||||||||||||
| Shares | Amount | Par Value | Deficit | Shares | Amount | (Loss) | Equity | |||||||||||||||||||||||||
| Balance as of December 31, 2013 | 3,261,148 | $ | 326,115 | $ | 10,011,339 | ($ | 407,408 | ) | 235,114 | ($ | 514,341 | ) | ($ | 19,836 | ) | $ | 9,395,869 | |||||||||||||||
| Net (loss) | 0 | 0 | 0 | (13,335 | ) | 0 | 0 | 0 | (13,335 | ) | ||||||||||||||||||||||
| Other comprehensive (loss), net of taxes | 0 | 0 | 0 | 0 | 0 | 0 | (1,408 | ) | (1,408 | ) | ||||||||||||||||||||||
| Exercise of stock options | 0 | 0 | 962 | 0 | (1,000 | ) | 2,188 | 0 | 3,150 | |||||||||||||||||||||||
| Stock-based compensation | 0 | 0 | 7,358 | 0 | 0 | 0 | 0 | 7,358 | ||||||||||||||||||||||||
| Balance as of March 31, 2014 | 3,261,148 | $ | 326,115 | $ | 10,019,659 | ($ | 420,743 | ) | 234,114 | ($ | 512,153 | ) | ($ | 21,244 | ) | $ | 9,391,634 | |||||||||||||||
The accompanying notes are an integral part of these financial statements.
| -5- |
ImmuCell Corporation
(Unaudited)
STATEMENTS OF CASH FLOWS
| For the Three-Month Periods Ended March 31, | ||||||||
| 2015 | 2014 | |||||||
| CASH FLOWS FROM OPERATING ACTIVITIES: | ||||||||
| Net income (loss) | $ | 479,082 | ($ | 13,335 | ) | |||
| Adjustments to reconcile net income (loss) to net cash provided by operating activities: | ||||||||
| Depreciation | 115,664 | 112,362 | ||||||
| Amortization | 720 | 719 | ||||||
| Deferred income taxes | 332,718 | 14,236 | ||||||
| Stock-based compensation | 4,478 | 7,358 | ||||||
| Gain on disposal of fixed assets | (5,306 | ) | 0 | |||||
| Changes in: | ||||||||
| Receivables | 250,438 | (88,616 | ) | |||||
| Inventory | 367,092 | 259,183 | ||||||
| Prepaid expenses and other assets | (30,222 | ) | 1,028 | |||||
| Accounts payable and accrued expenses | (112,903 | ) | 11,904 | |||||
| Net cash provided by operating activities | 1,401,761 | 304,839 | ||||||
| CASH FLOWS FROM INVESTING ACTIVITIES: | ||||||||
| Purchase of property, plant and equipment | (988,459 | ) | (44,853 | ) | ||||
| Maturities of investments | 1,245,000 | 1,494,000 | ||||||
| Purchases of investments | 0 | (1,741,000 | ) | |||||
| Proceeds from sale of fixed assets | 5,565 | 0 | ||||||
| Net cash provided by (used for) investing activities | 262,106 | (291,853 | ) | |||||
| CASH FLOWS FROM FINANCING ACTIVITIES: | ||||||||
| Debt principal repayments | (49,057 | ) | (46,790 | ) | ||||
| Proceeds from exercise of stock options | 5,250 | 3,150 | ||||||
| Net cash (used for) financing activities | (43,807 | ) | (43,640 | ) | ||||
| NET INCREASE (DECREASE) IN CASH AND CASH EQUIVALENTS | 1,620,060 | (30,654 | ) | |||||
| BEGINNING CASH AND CASH EQUIVALENTS | 850,028 | 2,270,385 | ||||||
| ENDING CASH AND CASH EQUIVALENTS | $ | 2,470,088 | $ | 2,239,731 | ||||
| INCOME TAXES PAID | $ | 2,800 | $ | 252 | ||||
| INTEREST EXPENSE PAID | $ | 13,050 | $ | 15,175 | ||||
| NON-CASH ACTIVITIES: | ||||||||
| Change in capital expenditures included in accounts payable and accrued expenses | ($ | 151,588 | ) | $ | 191,862 | |||
| Net change in fair value of interest rate swap | $ | 3,906 | $ | 1,408 | ||||
The accompanying notes are an integral part of these financial statements.
| -6- |
ImmuCell Corporation
Notes to Unaudited Financial Statements
1. BUSINESS OPERATIONS
ImmuCell Corporation (the Company) is a growing animal health company whose purpose is to create scientifically-proven and practical products that result in a measurable economic impact on animal health and productivity in the dairy and beef industries. The Company was originally incorporated in Maine in 1982 and reincorporated in Delaware in 1987, in conjunction with its initial public offering of common stock. The Company has developed products that provide significant, immediate immunity to newborn dairy and beef cattle and is in the late stages of developing a new product that addresses mastitis, the most significant cause of economic loss to the dairy industry. The Company is subject to certain risks associated with its stage of development including dependence on key individuals, competition from other larger companies, the successful sale of existing products and the development and acquisition of additional commercially viable products with appropriate regulatory approvals, where applicable. These and other risks to our company are further detailed under PART II: OTHER INFORMATION, ITEM 1A – RISK FACTORS.
2. SUMMARY OF SIGNIFICANT ACCOUNTING POLICIES
(a) Basis of presentation
We have prepared the accompanying unaudited financial statements reflecting all adjustments, all of which are of a normal recurring nature, that are, in our opinion, necessary in order to ensure that the financial statements are not misleading. We follow accounting standards set by the Financial Accounting Standards Board (FASB). The FASB sets generally accepted accounting principles (GAAP) that we follow to ensure we consistently report our financial condition, results of operations, earnings per share and cash flows. References to GAAP in these footnotes are to the FASB Accounting Standards Codification™ (Codification). Certain prior year accounts have been reclassified to conform with the 2015 financial statement presentation. Certain information and footnote disclosures normally included in the annual financial statements have been condensed or omitted. Accordingly, we believe that although the disclosures are adequate to ensure that the information presented is not misleading, these financial statements should be read in conjunction with the financial statements for the year ended December 31, 2014 and the notes thereto, contained in our Annual Report on Form 10-K as filed with the Securities and Exchange Commission (SEC).
(b) Cash, Cash Equivalents and Short-Term Investments
We consider all highly liquid investment instruments that mature within three months of their purchase dates to be cash equivalents. Cash equivalents are principally invested in securities backed by the U.S. government. Certain cash balances in excess of Federal Deposit Insurance Corporation (FDIC) limits of $250,000 per financial institution per depositor are maintained in money market accounts at financial institutions that are secured, in part, by the Securities Investor Protection Corporation. Amounts in excess of these FDIC limits per bank that are not invested in securities backed by the U.S. government aggregated $1,969,788 and $566,637 as of March 31, 2015 and December 31, 2014, respectively. Short-term investments are classified as held to maturity and are comprised principally of certificates of deposit that mature in more than three months from their purchase dates and not more than twelve months from the balance sheet date and are held at different financial institutions that are insured by the FDIC, within the FDIC limits per financial institution. See Note 3.
(c) Inventory
Inventory includes raw materials, work-in-process and finished goods and is recorded at the lower of cost, on the first-in, first-out method, or market (net realizable value). Work-in-process and finished goods inventories include materials, labor and manufacturing overhead. See Note 4.
(d) Trade Receivables
Trade receivables are carried at the original invoice amount less an estimate made for doubtful collection. Management determines the allowance for doubtful accounts on a monthly basis by identifying troubled accounts and by using historical experience applied to an aging of accounts. Trade receivables are written off when deemed uncollectible. Recoveries of trade receivables previously written off are recorded as income when received. A trade receivable is considered to be past due if any portion of the receivable balance is outstanding for more than 30 days. Interest is charged on past due trade receivables. See Note 5.
| -7- |
ImmuCell Corporation
Notes to Unaudited Financial Statements (continued)
(e) Property, Plant and Equipment
We depreciate property, plant and equipment on the straight-line method by charges to operations in amounts estimated to expense the cost of the assets from the date they are first put into service to the end of the estimated useful lives of the assets. The cost of our building (which was acquired in 1993) and the 2001 and 2007 additions thereto are being depreciated through 2023. We are depreciating the building addition that was completed during the first quarter of 2015 over twenty-five years. Related building improvements are depreciated over ten year periods. Large and durable fixed assets are depreciated over their useful lives that are generally estimated to be five to ten years. Other fixed assets and computer equipment are depreciated over their useful lives that are generally estimated to be five and three years, respectively. See Note 7.
(f) Intangible Assets
We amortize intangible assets on the straight-line method by charges to operations in amounts estimated to expense the cost of the assets from the date they are first put into service to the end of the estimated useful lives of the assets. In connection with certain credit facilities entered into during the third quarter of 2010, we incurred debt issue costs of $26,489, which costs are being amortized to other expenses, net over the terms of the credit facilities. See Notes 6 and 9.
We continually assess the realizability of these assets in accordance with the impairment provisions of Codification Topic 360, Accounting for the Impairment or Disposal of Long-Lived Assets. If an impairment review is triggered, we evaluate the carrying value of long-lived assets by determining if impairment exists based on estimated undiscounted future cash flows over the remaining useful life of the assets and comparing that value to the carrying value of the assets. If the carrying value of the asset is greater than the estimated future cash flows, the asset is written down to its estimated fair value. The cash flow estimates that are used contain our best estimates, using appropriate and customary assumptions and projections at the time. We also review the estimated useful life of intangible assets at the end of each reporting period, making any necessary adjustments.
(g) Disclosure of Fair Value of Financial Instruments and Concentration of Risk
Financial instruments consist mainly of cash, cash equivalents, short-term investments, long-term investments, accounts receivable, accounts payable, bank debt and an interest rate swap. Financial instruments that potentially subject the Company to concentrations of credit risk are principally cash, cash equivalents, short-term investments, long-term investments and accounts receivable. We make short-term and long-term investments in financial instruments that are insured by the FDIC. We account for fair value measurements in accordance with Codification Topic 820, Fair Value Measurements and Disclosures, which defines fair value, establishes a framework for measuring fair value and requires additional disclosures about fair value measurements. The estimated fair value of cash, cash equivalents, short-term investments, long-term investments, accounts receivable and accounts payable approximate their carrying value due to their short maturities. The estimated fair value of bank debt approximates its carrying value because the interest rates are variable. The interest rate swap is carried at fair value. See Note 9.
Concentration of credit risk with respect to accounts receivable is principally limited to certain customers to whom we make substantial sales. To reduce risk, we routinely assess the financial strength of our customers and, as a consequence, believe that our accounts receivable credit risk exposure is limited. We maintain an allowance for potential credit losses, but historically we have not experienced significant credit losses related to an individual customer or groups of customers in any particular industry or geographic area.
We believe that supplies and raw materials for the production of our products are available from more than one vendor or farm. Our policy is to maintain more than one source of supply for the components used in our products. However, there is a risk that we could have difficulty in efficiently acquiring essential supplies.
(h) Interest Rate Swap Agreement
All derivatives are recognized on the balance sheet at their fair value. We entered into an interest rate swap agreement in 2010. On the date the agreement was entered into, we designated the derivative as a hedge of the variability of cash flows to be paid related to our long-term debt. The agreement has been determined to be highly effective in hedging the variability of identified cash flows, so changes in the fair market value of the interest rate swap agreement are recorded as comprehensive (loss) income, until earnings are affected by the variability of cash flows (e.g. when periodic settlements on a variable-rate asset or liability are recorded in earnings). We formally documented the relationship between the interest rate swap agreement and the related hedged items. We also formally assess, both at this interest rate swap agreement’s inception and on an ongoing basis, whether the agreement is highly effective in offsetting changes in cash flow of hedged items. See Note 9.
| -8- |
ImmuCell Corporation
Notes to Unaudited Financial Statements (continued)
(i) Revenue Recognition
We recognize revenue in accordance with Staff Accounting Bulletin (SAB) No. 104, “Revenue Recognition”, which supersedes SAB No. 101, “Revenue Recognition in Financial Statements”. SAB No. 104 requires that four criteria are met before revenue is recognized. These include i) persuasive evidence that an arrangement exists, ii) delivery has occurred or services have been rendered, iii) the seller’s price is fixed and determinable and iv) collectability is reasonably assured. We recognize revenue at the time of shipment (including to distributors) for substantially all products, as title and risk of loss pass to the customer on delivery to the common carrier after concluding that collectability is reasonably assured. We recognize service revenue at the time the service is performed.
(j) Expense Recognition
Advertising costs are expensed when incurred, which is generally during the month in which the advertisement is published. Advertising expenses amounted to $29,221 and $18,789 during the three-month periods ended March 31, 2015 and 2014, respectively. All product development expenses are expensed as incurred, as are all related patent costs.
(k) Income Taxes
We account for income taxes in accordance with Codification Topic 740, Income Taxes, which requires that we recognize a current tax liability or asset for current taxes payable or refundable and a deferred tax liability or asset for the estimated future tax effects of temporary differences and carryforwards to the extent they are realizable. We believe it is more likely than not that the deferred tax assets will be realized through future taxable income and future tax effects of temporary differences between book income and taxable income. Accordingly, we have not established a valuation allowance for the deferred tax assets. Codification Topic 740-10 clarifies the accounting for income taxes by prescribing a minimum recognition threshold that a tax position must meet before being recognized in the financial statements. In the ordinary course of business, there are transactions and calculations where the ultimate tax outcome is uncertain. In addition, we are subject to periodic audits and examinations by the Internal Revenue Service and other taxing authorities. We have evaluated the positions taken on our filed tax returns. We have concluded that no uncertain tax positions exist as of March 31, 2015. Although we believe that our estimates are reasonable, actual results could differ from these estimates. See Note 11.
(l) Stock-Based Compensation
We account for stock-based compensation in accordance with Codification Topic 718, Compensation-Stock Compensation, which generally requires us to recognize non-cash compensation expense for stock-based payments using the fair-value-based method. The fair value of each stock option grant has been estimated on the date of grant using the Black-Scholes option pricing model. Accordingly, we recorded $4,478 and $7,358 of compensation expense pertaining to stock-based compensation, which resulted in a decrease to income before income taxes of less than $0.01 per share during the three-month periods ended March 31, 2015 and 2014, respectively. Codification Topic 718 requires us to reflect gross tax savings resulting from tax deductions in excess of expense reflected in our financial statements as a financing cash flow.
(m) Net Income (Loss) Per Common Share
Net Income (Loss) per common share has been computed in accordance with Codification Topic 260-10, Earnings Per Share. The basic Net Income per share has been computed by dividing Net Income by the weighted average number of common shares outstanding during this period. Diluted Net Income per share has been computed by dividing Net Income by the weighted average number of shares outstanding during the period plus all outstanding stock options with an exercise price that is less than the average market price of the common stock during the period less the number of shares that could have been repurchased at this average market price with the proceeds from the hypothetical stock option exercises. The Net (Loss) per common share in 2014 has been computed by dividing the Net (Loss) by the weighted average number of common shares outstanding during the period, without giving consideration to outstanding stock options because the impact would be anti-dilutive.
| -9- |
ImmuCell Corporation
Notes to Unaudited Financial Statements (continued)
| Three-Month Period Ended March 31, | ||||||||
| 2015 | 2014 | |||||||
| Weighted average number of shares outstanding | 3,027,345 | 3,026,901 | ||||||
| Effect of dilutive stock options | 116,231 | 0 | ||||||
| Diluted number of shares outstanding | 3,143,576 | 3,026,901 | ||||||
| Outstanding stock options not included in the calculation | ||||||||
| because the effect would be anti-dilutive | 4,000 | 246,000 | ||||||
(n) Use of Estimates
The preparation of financial statements in conformity with GAAP requires management to make estimates and assumptions that affect the reported amounts of assets and liabilities and disclosure of contingent assets and liabilities at the date of the financial statements and the reported amounts of revenues and expenses during the period. Actual amounts could differ from those estimates.
(o) New Accounting Pronouncement
In May 2014, the FASB issued Accounting Standards Update No. 2014-09, Revenue from Contracts with Customers (ASU 2014-09), which requires an entity to recognize the amount of revenue to which it expects to be entitled for the transfer of promised goods or services to customers. ASU 2014-09 will replace most existing revenue recognition guidance in U.S. GAAP when it becomes effective. ASU 2014-09 is effective for the Company on January 1, 2017. Early application is not permitted. ASU 2014-09 permits the use of either the retrospective or cumulative effect transition method. We have evaluated the effect that ASU 2014-09 would have on our financial statements and related disclosures. We expect that ASU 2014-09 will have no significant effect on our ongoing financial reporting, but we continue to evaluate this pending accounting standard.
3. CASH, CASH EQUIVALENTS, SHORT-TERM INVESTMENTS AND LONG-TERM INVESTMENTS
Cash, cash equivalents, short-term investments and long-term investments consisted of the following:
| As of March 31, 2015 | As of December 31, 2014 | Increase (Decrease) | ||||||||||
| Cash and cash equivalents | $ | 2,470,088 | $ | 850,028 | $ | 1,620,060 | ||||||
| Short-term investments | 1,740,000 | 2,489,000 | (749,000 | ) | ||||||||
| Subtotal | 4,210,088 | 3,339,028 | 871,060 | |||||||||
| Long-term investments | 0 | 496,000 | (496,000 | ) | ||||||||
| Total | $ | 4,210,088 | $ | 3,835,028 | $ | 375,060 | ||||||
| -10- |
ImmuCell Corporation
Notes to Unaudited Financial Statements (continued)
4. INVENTORY
Inventory consisted of the following:
| As of March 31, 2015 | As of December 31, 2014 | Increase (Decrease) | ||||||||||
| Raw materials | $ | 314,317 | $ | 306,444 | $ | 7,873 | ||||||
| Work-in-process | 221,645 | 355,745 | (134,100 | ) | ||||||||
| Finished goods | 42,701 | 283,566 | (240,865 | ) | ||||||||
| Total | $ | 578,663 | $ | 945,755 | ($ | 367,092 | ) | |||||
5. ACCOUNTS RECEIVABLE
Accounts receivable consisted of the following:
| As of March 31, 2015 | As of December 31, 2014 | (Decrease) | ||||||||||
| Trade accounts receivable, gross | $ | 755,221 | $ | 1,004,990 | ($ | 249,769 | ) | |||||
| Accumulated allowance for bad debt and product returns | (16,637 | ) | (16,194 | ) | (443 | ) | ||||||
| Trade accounts receivable, net | 738,584 | 988,796 | (250,212 | ) | ||||||||
| Other receivables | 16,270 | 16,496 | (226 | ) | ||||||||
| Accounts receivable, net | $ | 754,854 | $ | 1,005,292 | ($ | 250,438 | ) | |||||
6. PREPAID EXPENSES AND OTHER ASSETS
Prepaid expenses and other assets consisted of the following:
| As of March 31, 2015 | As of December 31, 2014 | Increase (Decrease) | ||||||||||
| Prepaid expenses and other assets | $ | 163,341 | $ | 133,119 | $ | 30,222 | ||||||
| Security deposits | 15,280 | 15,280 | 0 | |||||||||
| Current subtotal | 178,621 | 148,399 | 30,222 | |||||||||
| Debt issue costs | 26,489 | 26,489 | 0 | |||||||||
| Accumulated amortization of debt issue costs | (17,199 | ) | (16,479 | ) | (720 | ) | ||||||
| Security deposits | 8,920 | 8,920 | 0 | |||||||||
| Long-term subtotal | 18,210 | 18,930 | (720 | ) | ||||||||
| Total | $ | 196,831 | $ | 167,329 | $ | 29,502 | ||||||
| -11- |
ImmuCell Corporation
Notes to Unaudited Financial Statements (continued)
7. PROPERTY, PLANT AND EQUIPMENT
Property, plant and equipment consisted of the following, at cost:
| As of March 31, 2015 | As of December 31, 2014 | Increase (Decrease) | ||||||||||
| Laboratory and manufacturing equipment | $ | 3,598,697 | $ | 3,522,465 | $ | 76,232 | ||||||
| Building and improvements | 4,418,964 | 2,969,891 | 1,449,073 | |||||||||
| Office furniture and equipment | 475,147 | 470,607 | 4,540 | |||||||||
| Construction in progress(1) | 530,526 | 1,270,672 | (740,146 | ) | ||||||||
| Land | 50,000 | 50,000 | 0 | |||||||||
| Property, plant and equipment, gross | 9,073,334 | 8,283,635 | 789,699 | |||||||||
| Accumulated depreciation | (4,514,738 | ) | (4,445,988 | ) | (68,750 | ) | ||||||
| Property, plant and equipment, net | $ | 4,558,596 | $ | 3,837,647 | $ | 720,949 | ||||||
(1) As of December 31, 2014, construction in progress consisted of a building addition that was completed during the first quarter of 2015. As of March 31, 2015, construction in progress consisted principally of payments towards new manufacturing equipment.
8. ACCOUNTS PAYABLE AND ACCRUED EXPENSES
Accounts payable and accrued expenses consisted of the following:
| As of March 31, 2015 | As of December 31, 2014 | (Decrease) | ||||||||||
| Accounts payable – capital | $ | 99,795 | $ | 251,383 | ($ | 151,588 | ) | |||||
| Accounts payable – trade | 203,972 | 204,810 | (838 | ) | ||||||||
| Accrued payroll | 124,867 | 145,176 | (20,309 | ) | ||||||||
| Accrued clinical studies | 68,428 | 131,945 | (63,517 | ) | ||||||||
| Accrued professional fees | 32,737 | 42,250 | (9,513 | ) | ||||||||
| Accrued other | 57,387 | 76,113 | (18,726 | ) | ||||||||
| Total | $ | 587,186 | $ | 851,677 | ($ | 264,491 | ) | |||||
| -12- |
ImmuCell Corporation
Notes to Unaudited Financial Statements (continued)
9. BANK DEBT
During the third quarter of 2010, we agreed to terms of certain credit facilities with TD Bank, N.A. (a wholly owned subsidiary of TD Financial Group, which is a multinational bank with approximately $944 billion in assets and over 22 million clients worldwide) aggregating up to approximately $2,100,000, which are secured by substantially all of our assets. These credit facilities are comprised of a $1,000,000 ten-year mortgage loan, a $600,000 fifty-four month note and a $500,000 line of credit, which is renewable annually. Proceeds from the $1,000,000 mortgage were received during the third quarter of 2010. Based on a 15-year amortization schedule, a balloon principal payment of $451,885 will be due in the third quarter of 2020. We hedged our interest rate exposure on this mortgage loan with an interest rate swap agreement that effectively converted a floating interest rate based on the London Interbank Offered Rate (LIBOR) of 3.43% as of March 31, 2015 to the fixed rate of 6.04%. All derivatives are recognized on the balance sheet at their fair value. The agreement has been determined to be highly effective in hedging the variability of the identified cash flows and has been designated as a cash flow hedge of the variability in the hedged interest payments. Changes in the fair value of the interest rate swap agreement are recorded in other comprehensive income (loss), net of taxes. The original notional amount of the interest rate swap agreement of $1,000,000 amortizes in accordance with the amortization of the mortgage loan. The notional amount of the interest rate swap was $786,719 as of March 31, 2015. Payments required by the interest rate swap totaled $5,219 and $5,566 during the three-month periods ended March 31, 2015 and 2014, respectively. As the result of our decision to hedge this interest rate risk, we recorded other comprehensive (loss), net of taxes, in the amount of ($3,906), and ($1,408) during the three-month periods ended March 31, 2015 and 2014, respectively, which reflects the change in fair value of the interest rate swap (liability) asset, net of taxes. The fair value of the interest rate swap has been determined using observable market-based inputs or unobservable inputs that are corroborated by market data. Accordingly, the interest rate swap is classified as level 2 within the fair value hierarchy provided in Codification Topic 820, Fair Value Measurements and Disclosures. Proceeds from the $600,000 note were received during the first quarter of 2011. Interest on the note is variable at the higher of 4.25% per annum or the LIBOR plus 3.25% per annum. As of March 31, 2015, the effective interest rate on this note was 4.25%. The $500,000 line of credit is available as needed and has been extended through May 31, 2016 and is renewable annually thereafter. The line of credit was unused as of March 31, 2015 and December 31, 2014. Interest on any borrowings against the line of credit would be variable at the higher of 4.25% per annum or the LIBOR plus 3.5% per annum. These credit facilities are subject to certain financial covenants. We are in compliance with all applicable covenants as of March 31, 2015. Principal payments due under debt outstanding as of March 31, 2015 are reflected in the following table by the year that payments are due:
| Period | $1,000,000 mortgage | $600,000 note | Total | |||||||||
| Nine months ending December 31, 2015 | $ | 40,799 | $ | 60,526 | $ | 101,325 | ||||||
| Year ending December 31, 2016 | 57,384 | 0 | 57,384 | |||||||||
| Year ending December 31, 2017 | 61,056 | 0 | 61,056 | |||||||||
| Year ending December 31, 2018 | 64,876 | 0 | 64,876 | |||||||||
| Year ending December 31, 2019 | 68,908 | 0 | 68,908 | |||||||||
| After December 31, 2019 | 493,696 | 0 | 493,696 | |||||||||
| Total | $ | 786,719 | $ | 60,526 | $ | 847,245 | ||||||
10. OTHER EXPENSES, NET
Other expenses, net, consisted of the following:
| Three-Month Periods Ended March 31, | ||||||||
| 2015 | 2014 | |||||||
| Interest income | ($ | 2,982 | ) | ($ | 3,954 | ) | ||
| Interest expense | 13,071 | 14,962 | ||||||
| Debt issuance amortization | 720 | 719 | ||||||
| Other (gains) | (5,359 | ) | (320 | ) | ||||
| Other expenses, net | $ | 5,450 | $ | 11,407 | ||||
11. INCOME TAXES
Our income tax expense aggregated $335,520 and $14,489 (amounting to 41% and 1,256% of our income before income taxes, respectively) for the three-month periods ended March 31, 2015 and 2014, respectively. Our income tax rate was unusually high during the first quarter of 2014 because the income before income taxes was very low during that period. As of December 31, 2014, we have a state net operating loss carryforward of approximately $1,858,000 that expires in 2028 through 2031, if not utilized before then, and a federal net operating loss carryforward of approximately $1,368,000 that expires in 2029 through 2031, if not utilized before then. The $965,000 licensing payment that we made during the fourth quarter of 2004 was treated as an intangible asset and is being amortized over 15 years, for tax return purposes only. Approximately $1,112,000 of our investment to produce pharmaceutical-grade Nisin for Mast Out® was expensed as incurred for our books. Included in this amount is approximately $820,000 ($65,000 during the fourth quarter of 2013 and $755,000 during the year ended December 31, 2014) that was capitalized and will be depreciated over statutory periods for tax return purposes only.
| -13- |
ImmuCell Corporation
Notes to Unaudited Financial Statements (continued)
Deferred tax assets are recognized only when it is probable that sufficient taxable income will be available in future periods against which deductible temporary differences and credits may be utilized. However, the amount of the deferred tax asset could be reduced if projected income is not achieved due to various factors, such as unfavorable business conditions. If projected income is not expected to be achieved, we would decrease the deferred tax asset to the amount that we believe can be realized.
Net operating loss carryforwards, credits, and other tax attributes are subject to review and possible adjustment by the Internal Revenue Service. Section 382 of the Internal Revenue Code contains provisions that could place annual limitations on the future utilization of net operating loss carryforwards and credits in the event of a change in ownership of the Company, as defined.
The Company files income tax returns in the U.S. federal jurisdiction and several state jurisdictions. With few exceptions, the Company is no longer subject to income tax examinations by tax authorities for years before 2011. We currently have no tax examinations in progress. We also have not paid additional taxes, interest or penalties as a result of tax examinations nor do we have any unrecognized tax benefits for any of the periods in the accompanying financial statements.
12. COMMITMENTS AND CONTINGENT LIABILITIES
Our bylaws, as amended, in effect provide that the Company will indemnify its officers and directors to the maximum extent permitted by Delaware law. In addition, we make similar indemnity undertakings to each director through a separate indemnification agreement with that director. The maximum payment that we may be required to make under such provisions is theoretically unlimited and is impossible to determine. We maintain directors’ and officers’ liability insurance, which may provide reimbursement to the Company for payments made to, or on behalf of, officers and directors pursuant to the indemnification provisions. Our indemnification obligations were grandfathered under the provisions of Codification Topic 460, Guarantees. Accordingly, we have recorded no liability for such obligations as of March 31, 2015. Since our incorporation, we have had no occasion to make any indemnification payment to any of our officers or directors for any reason.
As of March 31, 2015, we had committed approximately $766,794 principally related to the production of inventory and an additional $66,988 to other obligations.
We enter into agreements with third parties in the ordinary course of business under which we are obligated to indemnify such third parties from and against various risks and losses. The precise terms of such indemnities vary with the nature of the agreement. In many cases, we limit the maximum amount of our indemnification obligations, but in some cases those obligations may be theoretically unlimited. We have not incurred material expenses in discharging any of these indemnification obligations, and based on our analysis of the nature of the risks involved, we believe that the fair value of these agreements is minimal. Accordingly, we have recorded no liabilities for such obligations as of March 31, 2015.
The development, manufacturing and marketing of animal health care products entails an inherent risk that liability claims will be asserted against us. We feel that we have reasonable levels of liability insurance to support our operations.
13. SEGMENT AND SIGNIFICANT CUSTOMER INFORMATION
We principally operate in the business segment described in Note 1. Pursuant to Codification Topic 280, Segment Reporting, we operate in one reportable business segment, that being the development, acquisition, manufacture and sale of products that improve the health and productivity of cows for the dairy and beef industries. Almost all of our internally funded product development expenses are in support of such products. The significant accounting policies of this segment are described in Note 2.
Our primary customers for the majority of our product sales (83% and 79% for the three-month periods ended March 31, 2015 and 2014, respectively) are in the U.S. dairy and beef industries. Product sales to international customers, who are also in the dairy and beef industries, aggregated 16% and 14% of our total product sales for the three-month periods ended March 31, 2015 and 2014, respectively. Sales to significant customers that amounted to 10% or more of total product sales are detailed in the following table:
| Three-Month Periods Ended March 31, | ||||||||
| 2015 | 2014 | |||||||
| Animal Health International, Inc.(1) | 42 | % | 38 | % | ||||
| MWI Veterinary Supply Company(2) | 26 | % | 23 | % | ||||
| -14- |
ImmuCell Corporation
Notes to Unaudited Financial Statements (continued)
Accounts receivable due from significant customers amounted to the percentages of total trade accounts receivable as detailed in the following table:
| As of March 31, 2015 | As of December 31, 2014 | |||||||
| Animal Health International, Inc.(1) | 40 | % | 45 | % | ||||
| MWI Veterinary Supply Company(2) | 28 | % | 26 | % | ||||
(1) During May 2015, Patterson Companies, Inc. (NASDAQ: PDCO) announced its intent to aquire Animal Health International, Inc.
(2) During March 2015, AmerisourceBergen Corporation (NYSE: ABC) acquired MWI Veterinary Supply Company.
14. RELATED PARTY TRANSACTIONS
Dr. David S. Tomsche (Chair of our Board of Directors) is a controlling owner of Leedstone Inc. (formerly Stearns Veterinary Outlet, Inc.), a domestic distributor of ImmuCell products (First Defense®, Wipe Out® Dairy Wipes, and CMT) and of J-t Enterprises of Melrose, Inc., an exporter. His affiliated companies purchased $192,642 and $125,768 of products from ImmuCell during the three-month periods ended March 31, 2015 and 2014, respectively, on terms consistent with those offered to other distributors of similar status. We made marketing-related payments of $1,272 and $4,405 to these affiliate companies during the three-month periods ended March 31, 2015 and 2014, respectively. Our accounts receivable (subject to standard and customary payment terms) due from these affiliated companies aggregated $31,226 and $18,796 as of March 31, 2015 and December 31, 2014, respectively.
15. EMPLOYEE BENEFITS
We have a 401(k) savings plan (the Plan) in which all employees completing one month of service with the Company are eligible to participate. Participants may contribute up to the maximum amount allowed by the Internal Revenue Service. Since August 2012 we have matched 100% of the first 3% of each employee’s salary that is contributed to the Plan and 50% of the next 2% of each employee’s salary that is contributed to the Plan. Under this matching plan, we paid $16,726 and $16,167 into the plan for the three-month periods ended March 31, 2015 and 2014, respectively.
16. SUBSEQUENT EVENTS
We have adopted the disclosure provisions of Codification Topic 855-10-50-1, Subsequent Events, which provides guidance to establish general standards of accounting for and disclosures of events that occur after the balance sheet date but before financial statements are issued. Entities are required to disclose the date through which subsequent events were evaluated as well as the rationale for why that date was selected. This disclosure should alert all users of financial statements that an entity has not evaluated subsequent events after that date in the set of financial statements being presented. Codification Topic 855-10-50-1 requires additional disclosures only, and therefore did not have an impact on our financial condition, results of operations, earnings per share or cash flows. Public entities must evaluate subsequent events through the date that financial statements are issued. Accordingly, we have evaluated subsequent events through the time of filing on May 12, 2015, the date we have issued this Quarterly Report on Form 10-Q.
During April 2015, we amended our Common Stock Rights Plan by removing a provision that prevented a new group of directors elected following the emergence of an Acquiring Person (an owner of more than 20% of our stock) from controlling the Rights Plan by maintaining exclusive authority over the Rights Plan with pre-existing directors. We did this because subsequent to the adoption of the Rights Plan in 1995, such provisions have come to be viewed with disfavor by Delaware courts.
| -15- |
ImmuCell Corporation
ITEM 2 - MANAGEMENT'S DISCUSSION AND ANALYSIS OF FINANCIAL CONDITION AND RESULTS OF OPERATIONS
Financial Condition
We had approximately $4,210,000 in available cash, cash equivalents, short-term investments and long-term investments as of March 31, 2015. The table below summarizes the changes in selected, key balance sheet items (in thousands, except for percentages):
| As of March 31, | As of December 31, | Increase | ||||||||||||||
| 2015 | 2014 | $ | % | |||||||||||||
| Cash, cash equivalents, short-term investments and long-term investments | $ | 4,210 | $ | 3,835 | $ | 375 | 10 | % | ||||||||
| Net working capital | 5,031 | 4,460 | 570 | 13 | ||||||||||||
| Total assets | 11,230 | 11,052 | 178 | 2 | ||||||||||||
| Stockholders’ equity | $ | 9,743 | $ | 9,258 | $ | 485 | 5 | % | ||||||||
Net cash provided by operating activities amounted to $1,402,000 during the three month period ended March 31, 2015 compared to net cash provided by operating activities of $305,000 during the three-month period ended March 31, 2014. Capital investments of $988,000 during the three-month period ended March 31, 2015 compared to capital investments of $45,000 during the three-month period ended March 31, 2014. Together with gross margin earned from ongoing product sales, we believe that we have sufficient capital resources to meet our working capital requirements and to finance our ongoing business operations during at least the next twelve months.
During the third quarter of 2010, we agreed to terms of certain credit facilities with TD Bank, N.A. aggregating up to approximately $2,100,000, which are secured by substantially all of our assets. These credit facilities are comprised of a $1,000,000 ten-year mortgage loan, a $600,000 fifty-four month note and a $500,000 line of credit. Proceeds from the $1,000,000 mortgage loan were received during the third quarter of 2010. Proceeds from the $600,000 note were received during the first quarter of 2011. As of March 31, 2015, our outstanding bank debt balance was approximately $847,000. The $500,000 line of credit is available as needed. We chose debt financing because we believed that, in the market environment around 2010, the option to generate funds through the sale of equity securities at an acceptable level of stockholder dilution was unlikely.
Since 1999, our strategy has been focused on selling and developing products that improve animal health and productivity in the dairy and beef industries. These product opportunities are generally less expensive to develop than the human health product opportunities that we had worked on during the 1990’s. We have funded most of our product development expenses principally from product sales. Our cumulative investment of approximately $21,080,000 during the 16.25 year period ended March 31, 2015 was offset, in part, by $4,130,000 in licensing revenue, technology sales and grant income. Our strategic decision to continue developing Mast Out® after the product rights were returned to us in 2007 caused us to increase our spending on product development expenses that were previously funded by a former partner from late 2004 to mid-2007. As a result, we incurred net losses of $469,000, $216,000, $385,000 and $410,000 during the years ended December 31, 2008, 2009, 2010 and 2011, respectively. Having largely completed the significant clinical studies, we reduced product development expenses during 2012, as anticipated, and were profitable during 2012 and 2013. These product development expenses increased again, as we invested to complete the regulatory approval process, resulting in a net loss during the first half of 2014. After completing this investment, we returned to profitable results during the second half of 2014. We may, on occasion, seek additional research grant support as a means of leveraging the funds that we are able to spend developing new products.
| -16- |
ImmuCell Corporation
During the third quarter of 2013, our Board of Directors approved the aggregate investment of approximately $3,000,000 in two projects. The first investment involved acquiring processing equipment and modifying a portion of our facility to produce the Drug Substance (the active pharmaceutical ingredient, Nisin) at small-scale to complete the Mast Out® product development initiative. This project was substantially completed during the third quarter of 2014. We hope the work performed in this plant will support and facilitate the raising of capital (debt and/or equity) or the enlistment of a partner to fund expanded manufacturing capacity for the commercialization of Mast Out®. This specifically targeted increase in product development expenses resulted in a net loss during the first six months of 2014 and (despite a return to profitability during the last six months of 2014) during the year ended December 31, 2014. The purpose of this investment is discussed in greater detail under “Product Development Expenses” below. The second investment involved acquiring manufacturing equipment and constructing a two-story addition to our facility, providing us with approximately 7,100 square feet of cold storage, production and warehouse space to increase our commercial production capacity. Additionally, this investment allows us to better integrate the production of the Drug Substance at small-scale into our operations. This project was initiated in September 2014 and was completed during February 2015. The following table details the spending on these two projects:
| Expenses | Capital Expenditures | Total Expenses and Capital Expenditures | ||||||||||
| Three-month period ended December 31, 2013 | $ | 110,000 | $ | 21,000 | $ | 131,000 | ||||||
| Year ended December 31, 2014 | 973,000 | 1,492,000 | 2,465,000 | |||||||||
| Three-month period ended March 31, 2015 | 11,000 | 389,000 | 400,000 | |||||||||
| Eighteen-month period ended March 31, 2015 | 1,094,000 | 1,902,000 | 2,996,000 | |||||||||
| Budgeted and not yet spent | 0 | 2,000 | 2,000 | |||||||||
| Total investment | $ | 1,094,000 | $ | 1,904,000 | $ | 2,998,000 | ||||||
Separately, as of April 1, 2015, we had additional authorization from our Board of Directors to spend up to approximately $1,575,000 on new manufacturing equipment and other routine and necessary capital expenditures. Most of this investment authorization is intended to pay for the acquisition of First Defense® production equipment to increase our liquid processing capacity by approximately 50% and our freeze-drying capacity by approximately 100%. We have already begun to increase our production capacity, but due to the long order lead time on some of this critical equipment, we do not expect to fully complete this investment program until the first quarter of 2016. These investments, together with the 7,100 square foot facility addition, described above, are necessary to increase our commercial production capacity to fill our current backlog of orders created by the increased sales demand that we are experiencing.
Results of Operations
Product Sales
Our total product sales during the three-month period ended March 31, 2015 increased by 49%, or $1,020,000, to $3,101,000 from $2,082,000 during the three-month period ended March 31, 2014. Our total product sales during the six-month period ended March 31, 2015 increased by 46%, or $1,666,000 to $5,307,000 from $3,641,000 during the six-month period ended March 31, 2014. Our total product sales during the nine-month period ended March 31, 2015 increased by 45%, or $2,201,000, to $7,077,000 from $4,876,000 during the nine-month period ended March 31, 2014. Our total product sales during the twelve-month period ended March 31, 2015 increased by 38%, or $2,374,000, to $8,617,000 from $6,242,000 during the twelve-month period ended March 31, 2014. During the three-month period ended March 31, 2015, domestic product sales increased by 57%, or $936,000, and international sales increased by 19%, or $84,000, in comparison to the three-month period ended March 31, 2014. Growth in sales of our lead product, First Defense® and related product line extensions, is driving this increase in our total product sales.
Sales of First Defense® and related product line extensions continue to benefit from wide acceptance by dairy and beef producers as an effective tool to prevent bovine enteritis (scours) in newborn calves. We believe that our increased investment in sales and marketing personnel and efforts is helping us introduce First Defense® and related product line extensions to new customers. We launched a new communications campaign at the end of 2010 that continues to emphasize how the unique ability of First Defense® to provide Immediate ImmunityTM generates a dependable return on investment for dairy and beef producers. Preventing newborn calves from becoming sick helps them to reach their genetic potential. Our product sales benefited from the relatively strong prices of milk, cows and calves, as well as a stable to moderately lower cost of feed. We believe that our sales have also benefited from a lack of supply in the market of a competitive product sold by Elanco. We generally held our product selling prices without increase during the seven-year period ended December 31, 2007. During the first quarter of 2008, we implemented a modest increase to the selling price of First Defense®. We did not implement another price increase until the third quarter of 2014. We implemented a price increase for the tube delivery format of our First Defense Technology™ in a gel solution during the second quarter of 2015. This strategy recognizes that while selling a premium-priced product, we must be very efficient with our manufacturing costs to maintain a healthy gross margin.
| -17- |
ImmuCell Corporation
Competition for resources that dairy producers allocate to their calf enterprises has been increased by the many new products that have been introduced to the calf market. Our sales are normally seasonal, with higher sales expected during the first quarter. Warm and dry weather reduces the producer’s perception of the need for a disease preventative product like First Defense®, but heat stress on calves caused by extremely hot summer weather can increase the incidence of scours. The severe heat and drought conditions during the summer of 2012 in many key agricultural regions in North America caused a significant increase in the cost of feed. Harsher winter weather benefits our sales. The animal health distribution segment has been aggressively consolidating over the last few years. Larger distributors have been acquiring smaller distributors. Beef herd numbers were reduced because of the 2012 drought conditions in many parts of North America. This has resulted in an increase in the value of newborn calves, as producers re-build their herd levels. Such an upswing increases a producer’s likelihood to invest in First Defense® for their calf crop.
We are selling product line extensions of First Defense® under the description First Defense TechnologyTM, which is a unique whey protein concentrate that is processed utilizing our proprietary milk protein purification methods, for the nutritional and feed supplement markets without disease prevention claims approved by the U.S. Department of Agriculture (USDA). Through our First Defense TechnologyTM, we are selling concentrated whey proteins in different formats. During the first quarter of 2011, we initiated sales of First Defense TechnologyTM in a bulk powder format (no capsule), which is delivered with a scoop and mixed with colostrum for feeding to calves. During the fourth quarter of 2011, Milk Products, LLC of Chilton, Wisconsin launched commercial sales of their product, Ultra Start® 150 Plus, and other private label brands of colostrum replacers with First Defense TechnologyTM Inside. During the first quarter of 2012, we initiated a limited launch of a tube delivery format of our First Defense TechnologyTM in a gel solution.
Sales of First Defense® and related product line extensions aggregated 96% and 89% of our total product sales during the three-month periods ended March 31, 2015 and 2014, respectively. These sales increased by 62%, or $1,138,000 during the three-month period ended March 31, 2015, in comparison to the same period in 2014. Sales of First Defense® and related product line extensions increased by 27%, 14% and 5% during the years ended December 31, 2014, 2013 and 2012, respectively, in comparison to the immediately prior years. During the three-month period ended March 31, 2015, domestic sales of First Defense® and related product line extensions increased by 60%, and international sales increased by 70%, in comparison to the three-month period ended March 31, 2014. This new level of sales demand has exceeded our current production capacity and available inventory, resulting in a backlog of orders aggregating approximately $1,284,000 as of March 31, 2015. The 62% increase in sales of First Defense® and related product line extensions during the first quarter of 2015 would have been increased further to approximately 114% if we could have shipped the $1,284,000 backlog of orders before April 1, 2015, in comparison to $1,843,000 in sales during the first quarter of 2014 plus a backlog of orders aggregating approximately $155,000 as of March 31, 2014. We are making the investments necessary to increase our production capacity to meet the growing sales demand. With the single exception of the second quarter of 2012, we have realized consistently positive sales growth of First Defense® and related product line extensions during seventeen of the last eighteen quarters (including the last eleven consecutive quarters) in comparison to the same quarters of the prior year, as demonstrated in the following table:
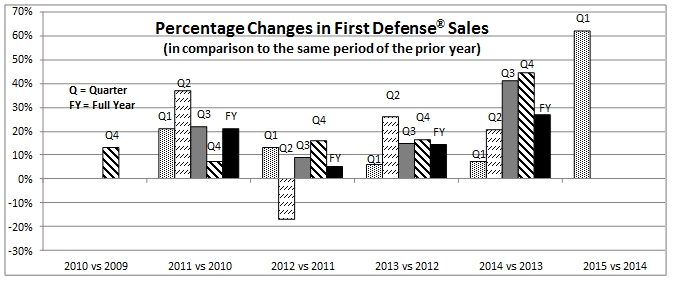
This sudden and significant increase in sales of First Defense® and related product line extensions has severely depleted our inventory levels, resulting in the backlog of orders discussed above. Looking forward into the second quarter of 2015, given our projection of inventory that should be available to sell, we expect to see a decrease in sales of approximately 15% to 20% in comparison to the second quarter of 2014, as we work to re-build our inventory levels. As noted above, we do not expect to fully complete the work needed to expand our manufacturing capacity until the first quarter of 2016. Despite this projected sales decrease during the second quarter of 2015, we do expect positive year-to-date sales growth throughout 2015, in comparison to the same periods during 2014.
| -18- |
ImmuCell Corporation
We sell topical wipes that are pre-moistened with a Nisin-based formulation in two product formats. Since 1999, we have been selling Wipe Out® Dairy Wipes (our second leading source of product sales) for use in preparing the teat area of a cow for milking. Sales of Wipe Out® Dairy Wipes increased by 3% during the three-month period ended March 31, 2015 in comparison to the same period during 2014. We are competing aggressively on selling price against less expensive products and alternative teat sanitizing methods. We believe that sales growth potential for Wipe Out® Dairy Wipes is limited because most of our sales of this product tend to be to smaller dairies that are under continued financial pressures, forcing many small dairy producers out of business. While our product is a high quality tool, there are less expensive ways to sanitize a cow’s udder prior to milking, and many producers choose a less expensive solution. During the first quarter of 2013, we initiated sales of Nisin-based wipes for pets in a 120-count canister (Preva™ wipes) to Bayer HealthCare Animal Health of St. Joseph, Missouri for commercial sales to pet owners. Because no sales of this product line extension were recorded during the three-month period ended March 31, 2015, sales of all topical product applications during the three-month period ended March 31, 2015 decreased by 49% in comparison to the same period during 2014.
Sales of our California Mastitis Test (CMT) (our third leading source of product sales) decreased by 3% during the three-month period ended March 31, 2015 in comparison to the same period during 2014. Sales of CMT aggregated approximately 1% of total product sales during both of the three-month periods ended March 31, 2015 and 2014. We make and sell bulk reagents for Isolate™ (formerly known as Crypto-Scan®), which is a drinking water test that is sold by our distributor in Europe. Sales of Isolate™ decreased by 67% during the three-month period ended March 31, 2015 in comparison to the same period during 2014. Sales of these bulk reagents aggregated slightly less than 1% and slightly more than 4% of total product sales during the three-month period ended March 31, 2015 and 2014, respectively.
Gross Margin
Changes in the gross margin from product sales are summarized in the following tables for the respective periods (in thousands, except for percentages):
| For the Three-Month Periods Ended March 31, | Increase | |||||||||||||||
| 2015 | 2014 | Amount | % | |||||||||||||
| Gross margin | $ | 1,851 | $ | 1,150 | $ | 701 | 61 | % | ||||||||
| Percent of product sales | 60 | % | 55 | % | 4 | % | 8 | % | ||||||||
| For the Six-Month Periods Ended March 31, | Increase | |||||||||||||||
| 2015 | 2014 | Amount | % | |||||||||||||
| Gross margin | $ | 3,194 | $ | 1,758 | $ | 1,436 | 82 | % | ||||||||
| Percent of product sales | 60 | % | 48 | % | 12 | % | 25 | % | ||||||||
| For the Nine-Month Periods Ended March 31, | Increase | |||||||||||||||
| 2015 | 2014 | Amount | % | |||||||||||||
| Gross margin | $ | 4,272 | $ | 2,374 | $ | 1,897 | 80 | % | ||||||||
| Percent of product sales | 60 | % | 49 | % | 12 | % | 24 | % | ||||||||
| For the Twelve-Month Periods Ended March 31, | Increase | |||||||||||||||
| 2015 | 2014 | Amount | % | |||||||||||||
| Gross margin | $ | 5,150 | $ | 3,157 | $ | 1,993 | 63 | % | ||||||||
| Percent of product sales | 60 | % | 51 | % | 9 | % | 18 | % | ||||||||
| -19- |
ImmuCell Corporation
The gross margin as a percentage of product sales was 59% and 51% during the years ended December 31, 2014 and 2013, respectively. This compares to gross margin percentages of 57% and 55% during the years ended December 31, 2012 and 2011, respectively. Our objective for the foreseeable future is to maintain the full-year gross margin percentage over 50%, and we have achieved this objective during all of the full-year periods being reported. We reduced production output during the last six months of 2013 in order to replace and repair certain pieces of critical process equipment, and we used more expensive subcontractors temporarily during this period, which collectively resulted in an increase in our cost of goods sold during that period. This production slow-down resulted in a few, short delays in shipping customer orders of First Defense® during the first quarter of 2014. These investments were completed during the fourth quarter of 2013, and our gross margin percentage was again in line with historical norms during 2014. Largely due to the significant increase in product sales experienced especially during the second half of 2014 and into the first quarter of 2015, our inventory balance was reduced to $946,000 and $579,000 as of December 31, 2014 and March 31, 2015, respectively. We are investing in production equipment during 2015 to increase our manufacturing capacity and bring our inventory levels back in line with growing sales. A number of factors account for the variability in our costs, resulting in some fluctuations in gross margin percentages from quarter to quarter. The gross margin on First Defense® is affected by biological yields from our raw material, which do vary over time. Like most U.S. manufacturers, we have been experiencing increases in the cost of raw materials that we purchase. The costs for production of First Defense® and Wipe Out® Dairy Wipes have increased due to increased labor costs and other expenses associated with our efforts to sustain compliance with current Good Manufacturing Practice (cGMP) regulations in our production processes. We have been able to minimize the impact of these cost increases by implementing yield improvements. Product mix also affects gross margin in that we earn a higher gross margin on First Defense® and a lower gross margin on Wipe Out® Dairy Wipes.
Sales and Marketing Expenses
Sales and marketing expenses during the three-month period ended March 31, 2015 increased by approximately 36%, or $104,000, to $389,000, in comparison to $285,000 during the three-month period ended March 31, 2014, amounting to 12.5% of product sales during the 2015 period and 13.7% of product sales during the 2014 period. We continue to leverage the efforts of our small sales force by using veterinary distributors. These expenses have increased due principally to a strategic decision to invest more to support First Defense® sales. Our sales and marketing team currently consists of one vice president and five regional managers. Our inside sales and customer service representative performs all order entry and inside sales duties, and our facility manager processes all shipments. This investment may have created, at least in part, our recent increase in product sales. Our current budgetary objective in 2015 is to invest up to 20% of product sales in sales and marketing expenses on an annual basis.
Product Development Expenses
Product development expenses decreased by 44%, or $264,000, to $331,000 during the three-month period ended March 31, 2015, as compared to $594,000 during the same period in 2014. Product development expenses aggregated 11% and 29% of product sales during the three-month periods ended March 31, 2015 and 2014, respectively. The majority of our product development budget from 2000 through 2014 has been focused on the development of Mast Out®. The balance of our efforts have been primarily focused on other improvements, extensions or additions to our First Defense® product line. The other improvements, extensions, or additions to our current product line include the potential to prevent scours in calves caused by pathogens other than those within the current First Defense® disease claims (E. coli K99 and coronavirus) such as rotavirus. We also remain interested in acquiring other new products and technologies that fit with our sales focus on the dairy and beef industries.
Our lead product development initiative is Mast Out®, a Nisin-based intramammary treatment of subclinical mastitis in lactating dairy cows. During 2000, we acquired an exclusive license from Nutrition 21, Inc. (formerly Applied Microbiology Inc. or AMBI) to develop and market Nisin-based products for animal health applications, which allowed us to initiate the development of Mast Out®. In 2004, we paid Nutrition 21 approximately $965,000 to buy out this royalty and milestone-based license to Nisin, thereby acquiring control of the animal health applications of Nisin. Nisin, the same active ingredient contained in Wipe Out® Dairy Wipes, is an antibacterial peptide known to be effective against most gram positive and some gram negative bacteria. In our pivotal effectiveness study, statistically significant Mast Out® cure rates were associated with a statistically significant reduction in milk somatic cell count, which is an important measure of milk quality. Nisin is a well characterized substance, having been used in food preservation applications for over 50 years. Food-grade Nisin, however, cannot be used in pharmaceutical applications because of its low purity. Our Nisin technology includes methods to achieve pharmaceutical-grade purity.
| -20- |
ImmuCell Corporation
During the fifteen-year period that began on January 1, 2000 (the year we began the development of Mast Out®) and ended on December 31, 2014, we invested the aggregate of approximately $11,032,000 in the development of Mast Out®. This estimated allocation to Mast Out® reflects only direct expenditures and includes no allocation of product development or administrative overhead expenses. Approximately $2,891,000 of this investment was offset by product licensing revenues and grant income related to Mast Out®.
In 2004, we entered into a product development and marketing agreement with Pfizer Animal Health (now doing business as Zoetis since 2013) covering Mast Out®. Under that agreement (as amended and supplemented and later terminated), we received $2,375,000 in payments. Zoetis elected to terminate the agreement in 2007. Soon thereafter, Zoetis returned to us all rights, data, information, files, regulatory filings, materials and stocks of Nisin and Nisin producing cultures relating to the development of Mast Out®. We believe that the decision of Zoetis to terminate the agreement was not based on any unanticipated efficacy or regulatory issues. Rather, we believe the decision was primarily driven by a marketing concern relating to their fear that the milk from treated cows could interfere with the manufacture of certain cultured dairy products.
Milk from cows treated with any of the intramammary mastitis treatment products on the market today must be discarded for a specified period of time during and after treatment. We believe that all milk from cows treated with Mast Out® will be saleable in the United States. This is a significant competitive advantage for our product. Due to this zero milk discard feature, there is a risk that Nisin from the milk of cows treated with Mast Out® could interfere with the manufacture of certain (but not all) commercial cultured dairy products, such as some kinds of cheese and yogurt, if a process tank contains a high enough percentage of milk from treated cows. The impact of this potential interference ranges from a delay in the manufacturing process, which does happen at times for other reasons, to the less likely stopping of a cheese starter culture. Milk from cows that have been treated with Mast Out® that is sold exclusively for fluid milk products presents no such risk. We worked with scientists and mastitis experts to conduct a formal risk assessment to quantify the impact that milk from treated cows may have on cultured dairy products. This study concluded that the dilution of milk from treated cows through comingling with milk from untreated cows during normal milk hauling and storage practices reduces the risk of interference with commercial dairy cultures to a negligible level when Mast Out® is used in accordance with the product label. Monitoring of several important variables relevant to the manufacture of cheese would be advisable if Mast Out® were to be used as part of a whole herd (“blitz”) treatment protocol. We do not see this as a significant problem as modern “precision dairying” practices support reducing the indiscriminate use of drug treatments.
We continue to believe in the potential value of making this unique treatment option available to dairy producers in order to reduce their reliance on penicillin and cephalosporin-based products. Regulators are phasing out the use of antibiotics in feed and water that are medically important for human health out of concern that the overuse of traditional antibiotics can lead to the spread of drug resistant microbes. Several major food processors and retailers are implementing policies consistent with those new regulations. We believe that this changing environment of new regulations and public opinion is very favorable towards the introduction of new alternatives to traditional antibiotics, such as Nisin. We believe that our drug development plan has incorporated the necessary flexibility and creativity required to bring this ground-breaking product innovation to market. We intend to take all appropriate steps to pursue a successful commercialization of Mast Out®.
Commercial introduction of Mast Out® in the United States is subject to approval of our New Animal Drug Application (NADA) by the U.S. Food and Drug Administration’s Center for Veterinary Medicine (FDA), which approval cannot be assured. Foreign regulatory approvals would be required for sales in key markets outside of the United States, which would involve some similar and some different requirements. The NADA is comprised of five principal Technical Sections that are subject to the FDA’s phased review. By statute, each Technical Section submission is generally subject to a six-month review cycle by the FDA. Each Technical Section can be reviewed and approved separately. Upon review and assessment by the FDA that all requirements for a Technical Section have been met, the FDA may issue a Technical Section Complete Letter. The current status of our work on these Technical Sections is as follows:
1) Environmental Impact: During the third quarter of 2008, we received the Environmental Impact Technical Section Complete Letter from the FDA.
2) Target Animal Safety: During the second quarter of 2012, we received the Target Animal Safety Technical Section Complete Letter from the FDA.
3) Effectiveness: During the third quarter of 2012, we received the Effectiveness Technical Section Complete Letter from the FDA. The draft product label carries claims for the treatment of subclinical mastitis associated with Streptococcus agalactiae, Streptococcus dysgalactiae, Streptococcus uberis, and coagulase-negative staphylococci in lactating dairy cattle.
| -21- |
ImmuCell Corporation
4) Human Food Safety (HFS): The HFS Technical Section submission was made during the fourth quarter of 2010. This Technical Section includes several subsections such as: a) toxicology, b) total metabolism, c) effects of drug residues in food on human intestinal microbiology, d) effects on bacteria of human health concern (antimicrobial resistance) and e) pivotal residue chemistry. During the second quarter of 2011, we announced that the FDA had accepted the subsections described above and granted Mast Out® a zero milk discard period and a zero meat withhold period during and after treatment. Before we can obtain this Technical Section Complete Letter, we must adapt our analytical method that measures Nisin residues in milk around the assigned tolerance limit and transfer that method to a FDA laboratory. We first submitted the validated analytical method to the FDA during the fourth quarter of 2012. We submitted additional data, which we believe to be responsive to the FDA’s review comments, during the third quarter of 2013 and the first quarter of 2014. We are working to complete the method transfer to the FDA laboratory. Due to additional regulatory requirements and unexpected review delays, completion of the HFS Technical Section is currently anticipated around the middle of 2016.
5) Chemistry, Manufacturing and Controls (CMC): Obtaining FDA approval of the CMC Technical Section defines the critical path to FDA approval and to initial commercial sales. During the third quarter of 2014, we substantially completed an investment in facility modifications and processing equipment necessary to produce Drug Substance (Active Pharmaceutical Ingredient, which is our pharmaceutical-grade Nisin) at small-scale. The four primary goals of this investment are to: 1) establish the equivalence of the Drug Substance produced in this plant to the Drug Substance that was used in our clinical studies, 2) optimize process yields and verify the related cost of production, 3) produce the validation batches required to complete the CMC Technical Section and 4) produce inventory for test marketing and limited initial sales in the United States after FDA approval. We aim to secure regulatory approval of the product and demonstrate its commercial viability. We believe that success with these efforts will enhance our position in any further financing or partnering discussions, should we elect to pursue either of these paths to fund a commercial-scale manufacturing capacity for the Drug Substance. This strategy allows us to advance the regulatory approval process while controlling our decision of whether and when to invest in commercial-scale production on our own, or with a partner.
We are party to a long-term, exclusive supply agreement with Plas-Pak Inc. of Norwich, Connecticut covering the proprietary syringe that was developed specifically for treating cows with Mast Out®. These syringes were used for all pivotal studies of Mast Out®.
We are party to long-term exclusive Contract Manufacture Agreement with Norbrook Laboratories Limited of Newry, Northern Ireland, an FDA-approved Drug Product manufacturer, covering the formulation of the Drug Substance into Drug Product, the sterile-fill of syringes and the final packaging. Norbrook provided these services for clinical material used in all pivotal studies of Mast Out®. Recent communications with Norbrook have given us significant concern about Norbrook’s readiness to provide the services needed to address the FDA regulatory requirements followed by commercial-scale production services. We intend to continue to seek to work with Norbrook to arrive at a resolution satisfactory to us. However, there can be no assurance that we will be able to reach a workable arrangement with Norbrook on a timely basis or at all. As a result, we have begun to explore alternative ways of fulfilling these needs (while expressly reserving our legal rights under our contract with Norbrook). Because we have not yet identified another third party ready, willing and able to do so, we may need to conduct further modifications to our own facilities in order to perform the sterile-fill of syringes. Due to the preliminary status of this contingency planning, we are unsure as to the cost of such alternatives or the impact of an alternative approach on our desired and previously projected timing for completing the CMC Technical Section and commercialization of Mast Out®. During the fourth quarter of 2012, we withdrew our first submission to the FDA of the CMC Technical Section because of changes we have made to our regulatory filing and manufacturing strategies. Our goal is to make the first submission of the CMC Technical Section to the FDA during the fourth quarter of 2015. Given our concerns with Norbrook as our Drug Product manufacturer, we may elect to submit the Drug Substance portion of the CMC Technical Section first and follow with the Drug Product (formulation, sterile-fill and packaging) portion after the first FDA review of the Drug Substance submission. It is common for each CMC Technical Section submission to require two, six-month review periods by the FDA.
| -22- |
ImmuCell Corporation
The selection of and (if applicable) the financing for the commercial-scale Drug Substance production facility is the most critical decision in front of us. We have considered four options: 1) having this work done by a qualified contract manufacturer, 2) building a new facility, 3) modifying an existing facility or 4) transferring our technology to a partner’s facility. Our initial plan was to have the Drug Substance produced for us under a Development and Manufacturing Agreement with Lonza Sales, Ltd. of Basel, Switzerland, in order to avoid the investment in a manufacturing facility. By the end of 2011, we determined that the cost of goods under this contract would not be commercially feasible and that the required minimum volumes were too large to permit efficient, continuous production. This contract was terminated during the fourth quarter of 2014 by mutual consent. During the latter part of 2012, we engaged an engineering firm to estimate the cost of controlling the production of the Drug Substance ourselves in a plant that we either built or leased. We do not have the estimated amount of approximately $13,000,000 to pay for this investment (without some combination of new debt, equity or partner funding), and there is a risk that the actual cost could be higher than we estimated. Alternatively, a somewhat smaller plant could cost a few million dollars less and still be able to meet market demand at launch and for a few years thereafter. We have presented this product opportunity to a variety of large and small animal health companies. During the second quarter of 2013, we received a non-refundable $250,000 exclusive license option fee from a prospective partner that considered manufacturing the Drug Substance in a plant of its own. During the third quarter of 2013, this prospective partner decided not to execute a development and marketing license because it had determined that, in its opinion, it could not cost effectively commercialize the product. We are encouraged by the feedback from prospective partners, following their due diligence, that our novel mastitis treatment can achieve FDA approval and have a significant, positive impact on the dairy industry. We believe that, among the currently available options, the greatest long-term value for our stockholders could be achieved by retaining full product ownership through an independent strategy at this stage. However, given the need to find funding for the commercial-scale Drug Substance plant described above, we are open to considering alternative partnering arrangements.
After obtaining the final Technical Section Complete Letter and after preparing materials responsive to other administrative requirements, the administrative NADA submission will be assembled for review by the FDA. This final administrative submission is subject to a statutory sixty-day review period. Given all the variables discussed above, we believe we could be in a position to achieve the NADA approval and test market the product in 2017. The concerns discussed above related to the sterile-filling of the Mast Out® syringes could cause this timeline to be extended by at least one year. Given the uncertainties discussed in the two preceding paragraphs regarding producing and selling Mast Out® both at small-scale and at commercial-scale, we are not able to provide more precise timing estimates or expectations at this point.
In addition to our work on Mast Out®, we are actively exploring further improvements, extensions or additions to our current First Defense® product line. For example, we currently are developing treatments that could prevent calf scours caused by enteric pathogens in addition to E. coli K99 and bovine coronavirus (the current disease claims for First Defense®). In connection with that effort, during the second quarter of 2009 we entered into an exclusive license with the Baylor College of Medicine covering the underlying rotavirus vaccine technology used to generate the specific antibodies. This perpetual license (if not terminated for cause) is subject to milestone and royalty payments. Results from pilot studies completed during the first quarter of 2009 justified continued product development. We completed a pivotal effectiveness study of this experimental formulation during the third quarter of 2011 without seeing the anticipated level of effectiveness needed for regulatory approval and market acceptance. After optimizing the challenge model, we directed our efforts to conducting additional pilot studies of different formulations of this antibody preparation. Having achieved positive results from these pilot studies, we initiated a second pivotal effectiveness study at Cornell University College of Veterinary Medicine during the second quarter of 2014 and completed the enrollment of calves during the fourth quarter of 2014. During the first quarter of 2015, we announced positive results from this pivotal study. If approved by the USDA, this would be the first passive antibody product with disease claims against the three leading causes of calf scours, E. coli, coronavirus and rotavirus, providing Immediate Immunity™ to newborn calves. Having submitted these results to the USDA for review, we are working to complete the other laboratory and manufacturing objectives required for product license approval. This could position us to achieve product licensure and market launch in 2016. During April 2015, we entered into an exclusive option agreement to license new bacteriocin technology from the University of Massachusetts Amherst. This technology focuses on bacteriocins having activity against Gram negative infections for use in combating mastitis in dairy cattle. As additional opportunities arise to commercialize our own technology, or licensable technology, we may (subject to the availability of needed financial and other resources) begin new development projects.
Administrative Expenses
Administrative expenses increased by approximately 21%, or $53,000, to $311,000 during the three-month period ended March 31, 2015 as compared to $258,000 during the three-month period ended March 31, 2014. We strive to be efficient with these expenses while funding costs associated with complying with the Sarbanes-Oxley Act of 2002 and other costs associated with being a publicly-held company. Prior to 2014, we had limited our investment in investor relations spending. Beginning in the second quarter of 2014, we initiated an investment in a more actively managed investor relations program. Additionally, we continue to provide full disclosure of the status of our business and financial condition in three quarterly reports and one annual report each year, as well as in Current Reports on Form 8-K when legally required or deemed appropriate by management. Additional information about us is available in our annual Proxy Statement. All of these reports are filed with the SEC and are available on-line or upon request to the Company.
| -23- |
ImmuCell Corporation
Net Operating Income (Loss)
The net operating income of $820,000 during the three-month period ended March 31, 2015 compares to net operating income of $13,000 during the three-month period ended March 31, 2014. We recorded net operating (losses) of ($206,000) and ($20,000) during the years ended December 31, 2014 and 2013, respectively.
Other expenses, net
Interest income decreased by approximately 25%, or $1,000, to $3,000 during the three-month period ended March 31, 2015, in comparison to $4,000 during the three-month period ended March 31, 2014. Interest expense decreased by approximately 13%, or $2,000, to $13,000 during the three-month period ended March 31, 2015, in comparison to $15,000 during the three-month period ended March 31, 2014.
Income Before Income Taxes and Net Income (Loss)
Our income before income taxes of $815,000 during the three-month period ended March 31, 2015, compares to income before income taxes of just $1,000 during the same period in 2014. We recorded income tax expense equal to 41% of our income before income taxes during the three-month period ended March 31, 2015. The income tax rate during the three-month period ended March 31, 2014 was unusually high because our income before income taxes was just over $1,000. Our net income of $479,000, or $0.15 per diluted share, during the three-month period ended March 31, 2015, is in contrast to net (loss) of ($13,000), or ($0.00) per share, during the same period in 2014. The first quarter of 2015 was our most profitable quarter since the first quarter of 2003.
ITEM 3 - QUANTITATIVE AND QUALITATIVE DISCLOSURES ABOUT MARKET RISK
None
ITEM 4 - CONTROLS AND PROCEDURES
Disclosure Controls and Procedures. Our management, with the participation of the individual who serves as our principal executive and principal financial officer, evaluated the effectiveness of our disclosure controls and procedures as of March 31, 2015. Based on this evaluation, that officer concluded that our disclosure controls and procedures were effective as of that date. Disclosure controls and procedures are designed to ensure that information required to be disclosed by us in the reports that we file or submit under the Exchange Act is (i) recorded, processed, summarized and reported within the time periods specified in the Securities and Exchange Commission’s rules and forms and (ii) accumulated and communicated to our management, including our principal executive and principal financial officer, as appropriate to allow timely decisions regarding required disclosures.
Changes in Internal Controls over Financial Reporting. The individual who serves as our principal executive and principal financial officer periodically evaluates any change in internal control over financial reporting which has occurred during the prior fiscal quarter. Management has concluded that there was no change in our internal control over financial reporting that occurred during the quarter ended March 31, 2015 that has materially affected, or is reasonably likely to materially affect, our internal control over financial reporting.
| -24- |
ImmuCell Corporation
PART II. OTHER INFORMATION
ITEM 1 - LEGAL PROCEEDINGS
None
ITEM 1A - RISK FACTORS
Safe Harbor Statement
This Quarterly Report on Form 10-Q contains “forward-looking statements” within the meaning of Section 27A of the Securities Act of 1933 and Section 21E of the Securities Exchange Act of 1934. Such statements include, but are not limited to, any statements relating to: projections of future financial performance; the scope and timing of future product development work and commercialization of our products; future costs of product development efforts; the estimated prevalence rate of subclinical mastitis; future market share of and revenue generated by products still in development; future sources of financial support for our product development, manufacturing and marketing efforts; the future adequacy of our own manufacturing facilities or those of third parties with which we have contractual relationships to meet demand for our products on a timely basis; the amount and timing of future investments in facility modifications and production equipment; the future adequacy of our working capital and the availability of third party financing; timing and future costs of a facility to produce the Drug Substance (active pharmaceutical ingredient) for Mast Out®; the timing and outcome of pending or anticipated applications for future regulatory approvals; future regulatory requirements relating to our products; future expense ratios and margins; future compliance with bank debt covenants; future realization of deferred tax assets; costs associated with sustaining compliance with cGMP regulations in our current operations and attaining such compliance for the facility to produce the Drug Substance for Mast Out®; factors that may affect the dairy and beef industries and future demand for our products; the cost-effectiveness of additional sales and marketing expenditures and resources; the accuracy of our understanding of our distributors’ ordering patterns; anticipated changes in our manufacturing capabilities and efficiencies; anticipated competitive and market conditions; and any other statements that are not historical facts. Forward-looking statements can be identified by the use of words such as “expects”, “may”, “anticipates”, “aims”, “intends”, “would”, “could”, “should”, “will”, “plans”, “believes”, “estimates”, “targets”, “projects”, “forecasts” and similar words and expressions. In addition, there can be no assurance that future developments affecting us will be those that we anticipate. Such statements involve risks and uncertainties, including, but not limited to, those risks and uncertainties relating to difficulties or delays in development, testing, regulatory approval, production and marketing of our products, competition within our anticipated product markets, alignment between our manufacturing resources and product demand, the uncertainties associated with product development and Drug Substance manufacturing, our potential reliance upon third parties for financial support, products and services, changes in laws and regulations, decision making by regulatory authorities, currency fluctuations and other risks detailed from time to time in filings we make with the Securities and Exchange Commission, including our Quarterly Reports on Form 10-Q, our Annual Reports on Form 10-K and our Current Reports on Form 8-K. Such statements are based on our current expectations, but actual results may differ materially due to various factors, including the risk factors summarized below and uncertainties otherwise referred to in this Quarterly Report.
Projection of net income: Generally speaking, our financial performance can differ significantly from management projections, due to numerous factors that are difficult to predict or that are beyond our control. Stronger than expected sales of First Defense®, for example, could increase our net income. Conversely, weaker than expected sales of First Defense® or continued or extended shortfalls in production relative to the growing product sales demand could lead to less profits or an operating loss. Large investments in product development can result in a net loss. After nine consecutive years of reporting net income, we reported net losses for the years ended December 31, 2008, 2009, 2010 and 2011, due in large part to our product development strategy. By reducing our investment in the development of Mast Out® and increasing sales of First Defense®, we were able to record net operating income of $245,000 and net income of $90,000 during the year ended December 31, 2012. We continued this positive trend by recording a net operating (loss) of just ($20,000) and net income of $117,000 during the year ended December 31, 2013. The 2013 results included a $250,000 exclusive license option fee. Given our strategic decision to invest approximately $973,000 during 2014 in facilities for the manufacture of the Drug Substance at small-scale, we recorded a net (loss) of ($167,000) during the year ended December 31, 2014 as expected, despite a return to profitability during the last six months of 2014. We continued to be profitable during the first quarter of 2015. Subject to the temporary production constraints described above, we expect the sales growth trend for First Defense® and the recent profitability trend to continue.
| -25- |
ImmuCell Corporation
Reliance on sales of First Defense®: We are heavily reliant on the market acceptance of First Defense® to generate product sales and fund our operations. Our business would not have been profitable during the nine consecutive years in the period ended December 31, 2007, or during the years ended December 31, 2012 and 2013, or during the nine-month period ended March 31, 2015, without the gross margin that we earned on sales of First Defense®.
Product risks generally: The sale of our products is subject to financial, efficacy, regulatory, competitive and other market risks. We cannot be sure that we will be able to maintain the regulatory compliance required to continue selling our products. There is no assurance that we will continue to achieve market acceptance at a profitable price level or that we can continue to manufacture our products at a low enough cost to result in a sufficient gross margin to justify their continued manufacture and sale.
Product liability: The manufacture and sale of our products entails a risk of product liability. Our exposure to product liability is mitigated to some extent by the fact that our products are principally directed towards the animal health market. We have maintained product liability insurance in an amount which we believe is reasonable in relation to our potential exposure in this area. We have no history of claims of this nature being made.
Regulatory requirements for First Defense®: First Defense® is sold in the United States subject to a product license from the Center for Veterinary Biologics, USDA, which was first obtained in 1991. The potency of serial lots is directly traceable to the original serial used to obtain the product performance claims (the “Reference Standard”). Due to the unique nature of the First Defense® label claims, host animal re-testing is not required as long as periodic laboratory analyses continue to support the stability of stored Reference Standard. To date, these analyses have demonstrated strong stability. However, if the USDA were not to approve requalification of the Reference Standard, additional clinical studies could be required to meet regulatory requirements and allow for continued sales of the product. Similar regulatory oversight risks exist in territories outside of the United States where we sell our products.
Regulatory requirements for Wipe Out® Dairy Wipes: While the FDA regulates the manufacture and sale of Wipe Out® Dairy Wipes, this type of product is permitted to be sold without a NADA approval, in accordance with the FDA’s Compliance Policy Guide 7125.30 (“Teat Dips and Udder Washes for Dairy Cows and Goats”). This policy guide could be withdrawn at the FDA’s discretion, in which case we would likely discontinue sales of the product. The manufacture of Wipe Out® Dairy Wipes is subject to Part 211 of the cGMP regulations. As a result, our operations are subject to inspection by the FDA. During the second quarter of 2007, the FDA inspected our facilities and operations and issued a Warning Letter to us, citing deficiencies in specific areas of the cGMP regulations. We filed an initial response to the FDA during the second quarter of 2007, and we responded to a request for additional information during the second quarter of 2008. During the first quarter of 2013, the FDA again inspected our facilities and operations. The report from this inspection was very favorable, and we responded to the few, minor observations that were noted. We remain subject to the risk of adverse action by the FDA in this respect.
Regulatory requirements for Mast Out®: The commercial introduction of Mast Out® in the United States will require us to obtain appropriate FDA approval for this product. It presently is uncertain when or if this approval will be achieved. We are exposed to additional regulatory compliance risks through the subcontractors that we choose to work with to produce Mast Out®, who also need to satisfy certain regulatory requirements in order to provide us with the products and services we need. International regulatory approvals would be required for sales outside of the United States. European regulatory authorities are not expected to approve a product with a zero milk discard claim, which would remove a significant competitive advantage of Mast Out® in that territory. However, the assigned milk discard period may be shorter for Mast Out® than it is for other products on the market in Europe.
Concentration of sales: Approximately 83% of our product sales were made to customers in the U.S. dairy and beef industries during both of the years ended December 31, 2014 and 2013. Approximately 83% and 79% of our product sales were made to customers in the U.S. dairy and beef industries during the three-month periods ended March 31, 2015 and 2014, respectively. During the year ended December 31, 2014, 96% of our product sales were made to customers in the dairy and beef industries throughout the world, in comparison to 97% during 2013. During the three-month period ended March 31, 2015, 99% of our product sales were made to customers in the dairy and beef industries throughout the world, in comparison to 93% during the same period in 2014. A large portion of our product sales (61%, 60% and 55% for the years ended December 31, 2014, 2013, and 2012, respectively) was made to two large distributors (adjusting for an acquisition made by one of these distributors). These two distributors accounted for 69% of our product sales during the three-month period ended March 31, 2015. A large portion of our trade accounts receivable (71% and 65% as of December 31, 2014 and 2013, respectively) was due from these two distributors. These two distributors accounted for 68% of our trade accounts receivable as of March 31, 2015. We have a good history with these distributors, but the concentration of sales and accounts receivable with a small number of customers does present a risk to us, including risks related to such customers experiencing financial difficulties or altering the basis on which they do business with us.
| -26- |
ImmuCell Corporation
Economics of the dairy and beef industries:
| ● | All cattle and calves in the United States as of July 1, 2014 totaled 95,000,000 head, which is 3% below the 97,800,000 head reported on July 1, 2012 (this data point was not reported as of July 1, 2013). The July 2014 amount was the lowest inventory count as of July 1st in decades. All cattle and calves in the United States as of January 1, 2015 totaled 89,800,000, which is 1.5% higher than January 1, 2014. This is the first increase in the cattle inventory since 2007, suggesting the rebuilding of the U.S. herd has begun. | |
| ● | From 1998 through 2014, the size (annual average) of the U.S. dairy herd ranged from approximately the low of 9,011,000 (2004) to the high of 9,315,000 (2008). The average for 2013 was 9,215,000 which represents a slight reduction from the average of 9,232,000 reported for 2012. This average increased slightly to 9,256,000 during 2014. This average increased further during the first three months of 2015 to 9,304,000. | |
| ● | While the number of cows in the U.S. herd and the production of milk per cow directly influence the supply of milk, demand for milk is also influenced by very volatile international demand for milk products. The Class III milk price (an industry benchmark that reflects the value of product used to make cheese) is an important indicator because it defines our customers’ revenue level. This milk price (measured in dollars per hundred pounds of milk) in each of the first eleven months of 2014 was the highest ever for those months, and nine out of ten of the highest Class III milk prices of all time occurred during 2014. The annual average price level for 2011 of $18.37 was higher than the annual average reached in any of the previous 30 years. This annual average price level for 2014 of $22.34 (peaking at $24.60 in September 2014) was the highest level since these records were first reported in 1980. This strong price level has declined recently to $15.56 during March 2015, which is down 37% in six months since the September 2014 high point. The recent annual fluctuations in this milk price level are demonstrated in the following table: |
| Average Class III Milk Price for the year ended December 31, | (Decrease) Increase | |||
| 2011 | 2012 | |||
| $18.37 | $17.44 | (5%) | ||
| 2012 | 2013 | |||
| $17.44 | $17.99 | 3% | ||
| 2013 | 2014 | |||
| $17.99 | $22.34 | 24% | ||
The actual level of milk prices may be less important than its level relative to feed costs. The 2014 improvement in milk prices was matched by slightly lower feed costs. One measure of this relationship is known as the milk-to-feed price ratio, which represents the amount of feed that one pound of milk can buy. It is considered profitable to buy feed and produce milk if this ratio meets or exceeds 3.0. This benchmark level means that a dairy producer could buy 3.0 pounds of feed for every pound of milk sold. The 2012 ratio of 1.52 was the lowest recorded since this ratio was first reported in 1985. The highest annual average this ratio has ever reached since 1985 was 3.64 in 1987. Since this ratio reached 3.24 in 2005, it has not exceeded this benchmark level of 3.0. The annual average of 2.54 for 2014 was the highest this ratio has been since 2007 (2.81). This ratio dropped to an average of 2.04 during the first quarter of 2015. The following table demonstrates the annual volatility and the low values of this ratio recently:
| Average Milk-To-Feed Price Ratio for the year ended December 31, | (Decrease) Increase | |||
| 2011 | 2012 | |||
| 1.88 | 1.52 | (19%) | ||
| 2012 | 2013 | |||
| 1.52 | 1.75 | 15% | ||
| 2013 | 2014 | |||
| 1.75 | 2.54 | 45% | ||
| -27- |
ImmuCell Corporation
Approximately half of all U.S. dairy farms (more than 23,000) representing more than 60% of the nation’s total milk production signed up for the Margin Protection Program (MPP) under the 2014 federal farm bill. This voluntary program provides financial assistance to participating farmers when the margin (the difference between the price of milk and feed costs) falls below the selected coverage level. To display the margin between milk revenue and the MPP feed cost over the years, Dr. D. Scott Brown of the University of Missouri charted the relationship of revenue to expenses in the following table (the 2014 figures are preliminary and the 2015 figures are projected):
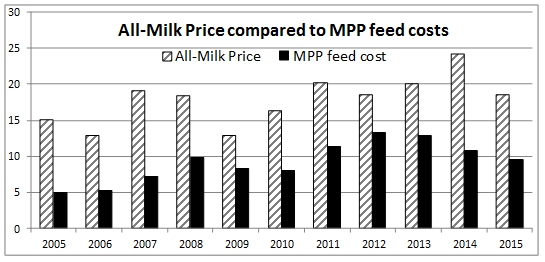
Reprinted by permission from the December 2014 issue of Hoard’s Dairyman.
Copyright 2014 by W.D. Hoard and Sons Company, Fort Atkinson, Wisconsin.
An increase in feed costs also has a negative impact on the beef industry. Widespread severe drought conditions in key U.S. agricultural regions during 2012 drove feed costs higher and the inventory of all cattle and calves lower. The recent positive trend in these market indices has resulted in an increase in the value of milk cows. The 2014 annual average price for a milk cow increased to $1,835. This annual average price since 1970 was only higher when it reached $1,840 in 2007 and $1,953 in 2008. The price for January 2015 was $1,990, which is down 6% from the peak level for 2014 in October of $2,120. The industry data referred to above is compiled from USDA databases. Recently, the value of newborn bull calves has risen to the unusually high level of approximately $300 to $400. At this price, producers are more likely to invest in First Defense® for their bull calves. Given our focus on the dairy and beef industries, the financial insecurity of our primary end users is a risk to our ability to maintain and grow sales at a profitable level. It also heightens the challenge of selling premium-priced animal health products (such as Mast Out®) into the dairy market.
Product development risks: The development of new products is subject to financial, scientific, regulatory and market risks. Our current business growth strategy relies heavily on the development of Mast Out®, which requires (and will continue to require) a substantial investment. Our efforts will be subject to inspection and approval by the FDA. There is no assurance whether or when we will obtain all of the data necessary to support regulatory approval for this product.
Risks associated with Mast Out® funding strategy: Completing the development of Mast Out® through to the submission of the administrative NADA to the FDA involves a great deal of risk. Our current strategy is to build our own small-scale Drug Substance production plant in order to gain NADA approval, obtain better production cost data and test market the product. This facility must be approved by the FDA. Uncertainty concerning the availability and terms of financing to develop a larger-scale commercial production plant or, alternatively, the availability and terms of potential partnering arrangements is a risk that, if materialized, could delay or preclude meaningful commercialization of Mast Out®.
Uncertainty of market size and product sales estimates: Even assuming that Mast Out® achieves regulatory approval in the United States with a zero milk discard requirement, estimating the size of the market for this product is subject to numerous uncertainties. Some of the uncertainties surrounding our product include the development of the subclinical mastitis treatment market, coverage of relevant pathogens, the effect of a premium selling price on market penetration, cost of manufacture, integration of milk from treated cows with susceptible cheese starter cultures and market acceptance.
| -28- |
ImmuCell Corporation
Competition from others: Many of our competitors are significantly larger and more diversified in the relevant markets than we are and have substantially greater financial, marketing, manufacturing and human resources and more extensive product development capabilities than we do, including greater ability to withstand adverse economic or market conditions and declining revenues and/or profitability. Zoetis, Elanco and Boehringer Ingelheim, among other companies, sell products that compete directly with First Defense® in preventing scours in newborn calves, although the product sold by Elanco has not been readily available in the market recently. The market for the treatment of mastitis in dairy cows is highly competitive, and presently is dominated by large companies such as Zoetis, Merck and Boehringer Ingelheim. There is no assurance that Mast Out® will compete successfully in this market. We may not be aware of other companies that compete with us or intend to compete with us in the future.
Access to raw materials: Our policy is to maintain more than one source of supply for the components used to manufacture and test our products. However, there is a risk that we could have difficulty in efficiently acquiring essential supplies. The loss of farms from which we buy raw material for First Defense® could make it difficult for us to produce enough inventory until supply agreements are reached with replacement farms on suitable terms. We are dependent on our manufacturing facility and operations at 56 Evergreen Drive in Portland, Maine for the production of First Defense® and Wipe Out® Dairy Wipes. The specific antibodies that we purify for First Defense® and the Nisin we produce by fermentation for Wipe Out® Dairy Wipes are not readily available from other sources. We will also be reliant on this facility for the production of the Drug Substance required to obtain regulatory approval of Mast Out®. We expect to be dependent on Plas-Pak and (subject to the performance issues discussed above under PART I: FINANCIAL INFORMATION, ITEM 2- MANAGEMENT’S DISCUSSION AND ANALYSIS OF FINANCIAL CONDITION AND RESULTS OF OPERATIONS, subtitled, “Product Development Expenses”) on Norbrook for a significant portion of the commercial manufacture of Mast Out®. Any significant damage to or other disruption in the services at these facilities could adversely affect the production of inventory and result in significant added expenses and loss of future sales.
Risk of sales order backlog: Given our recent and significant increase in sales demand, our manufacturing resources (internal and third party) are no longer sufficient to avoid a backlog of orders. Until we complete the additional investments required to further increase our production capacity, we are at risk of losing customers that are unable to acquire our product on a timely basis. We understand that the competitive product marketed by Elanco is experiencing a disruption in supply to the market.
Small size; dependence on key personnel: We are a small company with 37 employees (including 3 part-time employees). As such, we rely on certain key employees to support different operational functions, with limited redundancy in capacity. The loss of any of these key employees could adversely affect our operations until a qualified replacement is hired and trained. Our competitive position will be highly influenced by our ability to attract and retain key scientific, managerial and sales and marketing personnel, to develop proprietary technologies and products, to obtain USDA or FDA approval for new products and to continue to profitably sell our current products. We currently compete on the basis of product performance, price and distribution capability. We continue to monitor our network of independent distributors to maintain our competitive position.
Failure to protect intellectual property: In some cases, we have chosen (and may choose in the future) not to seek patent protection for certain products or processes. Instead, we have sought (and may seek in the future) to maintain the confidentiality of any relevant proprietary technology through operational safeguards and contractual agreements. Reliance upon trade secret, rather than patent, protection may cause us to be vulnerable to competitors who successfully replicate our manufacturing techniques and processes. Additionally, there can be no assurance that others may not independently develop similar trade secrets or technology or obtain access to our unpatented trade secrets or proprietary technology. Other companies may have filed patent applications and may have been issued patents involving products or technologies potentially useful to us or necessary for us to commercialize our products or achieve our business goals. There can be no assurance that we will be able to obtain licenses to such patents on terms that are acceptable. There is also a risk that competitors could challenge the claims in patents that have been issued to us.
No expectation to pay any dividends or repurchase stock for the foreseeable future: We do not anticipate paying any dividends to, or repurchasing stock from, our stockholders for the foreseeable future. Instead, we expect to use cash to fund product development costs and investments in our facility and production equipment. Any debt or equity financing we obtain to assist in funding our product development programs may include terms prohibiting or restricting our paying dividends or repurchasing stock for a lengthy period. Stockholders must be prepared to rely on sales of their common stock after price appreciation to earn an investment return, which may never occur. Any determination to pay dividends in the future will be made at the discretion of our Board of Directors and will depend on our financial condition, results of operations, contractual restrictions, restrictions imposed by applicable laws, current and anticipated needs for liquidity and other factors our Board of Directors deems relevant.
| -29- |
ImmuCell Corporation
Market for common stock: Our common stock trades on the NASDAQ Stock Market (NASDAQ: ICCC). Our average daily trading volume is lower than the volume for most other companies and the bid/ask stock price spread can be larger, which could result in investors facing difficulty selling their stock for proceeds that they may expect or desire. There has been a significant increase in the stock market activity of animal health companies since early 2013 in comparison to years past. Listed in chronological order by date of financing, companies such as Zoetis (ZTS), Aratana Therapeutics (PETX), Kindred (KIN), Phibro (PAHC), Parnell (PARN) and Nexvet Biopharma (NVET) have completed initial public offerings since 2013. The stock price of some of these companies has been volatile.
Stock market valuation: There are companies in the animal health sector with market capitalization values that greatly exceed our current market capitalization of approximately $20,000,000. Some of these companies have no product sales. We currently have annual product sales approaching $8,000,000. Before gross margin from the sale of new products is achieved, our market capitalization may be heavily dependent on the perceived potential for growth from our products under development.
Certain provisions might discourage, delay or prevent a change in control of our Company or changes in our management: Provisions of our certificate of incorporation, our bylaws, our Common Stock Rights Plan or Delaware law may discourage, delay or prevent a merger, acquisition or other change in control that stockholders may consider favorable, including transactions in which stockholders might otherwise receive a premium for their shares of our common stock. These provisions may also prevent or frustrate attempts by our stockholders to replace or remove our management. These provisions include:
| ● | limitations on the removal of directors; advance notice requirements for stockholder proposals and nominations; | |
| ● | the ability of our Board of Directors to alter or repeal our bylaws; | |
| ● | the ability of our Board of Directors to refuse to redeem rights issued under our Common Stock Rights Plan or otherwise to limit or suspend its operation that would work to dilute the stock ownership of a potential hostile acquirer, likely preventing acquisitions that have not been approved by our Board of Directors; and | |
| ● | Section 203 of the Delaware General Corporation Law, which prohibits a publicly-held Delaware corporation from engaging in a business combination with an interested stockholder (generally defined as a person which together with its affiliates owns, or within the last three years has owned, 15% of our voting stock, for a period of three years after the date of the transaction in which the person became an interested stockholder) unless the business combination is approved in a prescribed manner. |
The existence of the foregoing provisions and anti-takeover measures could depress the trading price of our common stock or limit the price that investors might be willing to pay in the future for shares of our common stock. They could also deter potential acquirers of our Company, thereby reducing the likelihood of obtaining a premium for our common stock in an acquisition. During April 2015, we amended our Common Stock Rights Plan by removing a provision that prevented a new group of directors elected following the emergence of an Acquiring Person (an owner of more than 20% of our stock) from controlling the Rights Plan by maintaining exclusive authority over the Rights Plan with pre-existing directors. We did this because subsequent to the adoption of the Rights Plan in 1995, such provisions have come to be viewed with disfavor by Delaware courts.
Exposure to risks associated with the financial downturn and global economic crisis: The U.S. economy appears to be coming out of a recession, which was caused principally by the housing, credit and financial crises of the late 2000’s. However, such recent positive indications could prove temporary and further downturn could occur, and the European economy remains sluggish and precarious. The credit markets continue to be very turbulent and uncertain. This extraordinary period of instability in the U.S. economy and the financial markets has been troubling for nearly all Americans. Some observers believe that the national unemployment rate is too high, the housing market remains problematic for the overall U.S. economy, the United States has taken on too much national debt and the equity markets are overvalued. A continued and prolonged economic downturn could have a corresponding negative effect on our business and operations, including the demand for our products in the U.S. market and our ability to penetrate international markets.
Bovine diseases: The potential for epidemics of bovine diseases such as Foot and Mouth Disease, Bovine Tuberculosis, Brucellosis and Bovine Spongiform Encephalopathy (BSE) presents a risk to us and our customers. Documented cases of BSE in the United States have led to an overall tightening of regulations pertaining to ingredients of animal origin, especially bovine. First Defense® is considered a veterinary medicine rather than a feed ingredient, and it is manufactured from bovine milk (colostrum), which is not considered a BSE risk material. Future regulatory action to increase protection of the human food supply could affect First Defense®, although presently we do not anticipate that this will be the case.
| -30- |
ImmuCell Corporation
Biological terrorism: The threat of biological terrorism is a risk to both the economic health of our customers and our ability to economically acquire and collect good quality raw material from our contract farms. Any act of widespread bioterrorism against the dairy industry could adversely affect our operations.
Cost burdens of our reporting obligations as a public company: Operating a public company involves substantial costs to comply with reporting obligations under federal securities laws and the provisions of the Sarbanes-Oxley Act of 2002.
ITEM 2 - UNREGISTERED SALES OF EQUITY SECURITIES AND USE OF PROCEEDS
None
ITEM 3 - DEFAULTS UPON SENIOR SECURITIES
None
ITEM 4 - MINE SAFETY DISCLOSURES
None
ITEM 5 - OTHER INFORMATION
None
ITEM 6 - EXHIBITS
| Exhibit 4.1 | Amendment to Rights Agreement. | |||
| Exhibit 31 | Certifications required by Rule 13a-14(a). | |||
| Exhibit 32 | Certification pursuant to Section 1350, as adopted pursuant to Section 906 of the Sarbanes- Oxley Act of 2002. | |||
| 101.INS | XBRL Instance Document. | |||
| 101.SCH | XBRL Taxonomy Extension Schema Document. | |||
| 101.CAL | XBRL Taxonomy Extension Calculation Linkbase Document. | |||
| 101.DEF | XBRL Taxonomy Extension Definition Linkbase Document. | |||
| 101.LAB | XBRL Taxonomy Extension Label Linkbase Document. | |||
| 101.PRE | XBRL Taxonomy Extension Presentation Linkbase Document. |
SIGNATURE
Pursuant to the requirements of Section 13 or 15(d) of the Securities Exchange Act of 1934, the registrant has duly caused this report to be signed on its behalf by the undersigned thereunto duly authorized.
| ImmuCell Corporation | ||
| Registrant | ||
| Date: May 12, 2015 | By: | /s/ Michael F. Brigham |
| Michael F. Brigham | ||
| President, Chief Executive Officer | ||
| and Principal Financial Officer |
| -31- |
ImmuCell Corporation
EXHIBIT INDEX
| Exhibit 4.1 | Amendment to Rights Agreement. | ||
| Exhibit 31 | Certifications required by Rule 13a-14(a). | ||
| Exhibit 32 | Certification pursuant to Section 1350, as adopted pursuant to Section 906 of the Sarbanes-Oxley Act of 2002. | ||
| 101.INS | XBRL Instance Document. | ||
| 101.SCH | XBRL Taxonomy Extension Schema Document. | ||
| 101.CAL | XBRL Taxonomy Extension Calculation Linkbase Document. | ||
| 101.DEF | XBRL Taxonomy Extension Definition Linkbase Document. | ||
| 101.LAB | XBRL Taxonomy Extension Label Linkbase Document. | ||
| 101.PRE | XBRL Taxonomy Extension Presentation Linkbase Document. |