Attached files
| file | filename |
|---|---|
| 8-K - 8-K - Guaranty Bancorp | gbnk-20150512x8k.htm |
 D.A. Davidson 17th Annual Financial Institutions Conference Denver, CO May 12-13, 2015
 Forward Looking Statements This presentation contains forward-looking statements, which are included in accordance with the “safe harbor” provisions of the Private Securities Litigation Reform Act of 1995. In some cases, you can identify forward-looking statements by terminology such as “may,” “will,” “should,” “could,” “expects,“plans,“intends,” “anticipates,” “believes,” “estimates,” “predicts,” “potential,” or “continue,” or the negative of such terms and other comparable terminology. These forward-looking statements involve known and unknown risks, uncertainties and other factors that may cause the Company’s actual results, performance or achievements to be materially different from any future results, performance or achievements expressed or implied by such forward-looking statements. Such factors include, among others, the following: failure to maintain adequate levels of capital and liquidity to support the Company’s operations; general economic and business conditions in those areas in which the Company operates, including the impact of global and national economic conditions on our local economy; demographic changes; competition; fluctuations in interest rates; continued ability to attract and employ qualified personnel; ability to receive regulatory approval for the bank subsidiary to declare dividends to the Company; adequacy of the allowance for loan losses, changes in credit quality and the effect of credit quality on the provision for credit losses and allowance for loan losses; changes in governmental legislation or regulation, including, but not limited to, any increase in FDIC insurance premiums; changes in accounting policies and practices; changes in business strategy or development plans; changes in the securities markets; changes in consumer spending, borrowing and savings habits; the availability of capital from private or government sources; competition for loans and deposits and failure to attract or retain loans and deposits; failure to recognize expected cost savings; changes in the financial performance and/or condition of our borrowers and the ability of our borrowers to perform under the terms of their loans and terms of other credit agreements; political instability, acts of war or terrorism and natural disasters; and additional “Risk Factors” referenced in the Company’s most recent Annual Report on Form 10-K filed with the Securities and Exchange Commission, as supplemented from time to time. When relying on forward-looking statements to make decisions with respect to the Company, investors and others are cautioned to consider these and other risks and uncertainties. The Company can give no assurance that any goal or plan or expectation set forth in any forward-looking statement can be achieved and readers are cautioned not to place undue reliance on such statements, which speak only as of the date made. The forward-looking statements are made as of the date of this presentation, and, except as may otherwise be required by law, the Company does not intend, and assumes no obligation, to update the forward-looking statements or to update the reasons why actual results could differ from those projected in the forward-looking statements. Investors and security holders are urged to read the Company’s Annual Report on Form 10-K, Quarterly Reports on Form 10-Q and other documents filed by the Company with the SEC. The documents filed by the Company with the SEC may be obtained at the Company’s website at www.gbnk.com or at the SEC's website at www.sec.gov. These documents may also be obtained free of charge from the Company by directing a request to: Guaranty Bancorp, 1331 Seventeenth St.Suite 200, Denver, CO 80202, Attention: Christopher Treece/Investor Relations; Telephone 303-675-1194.
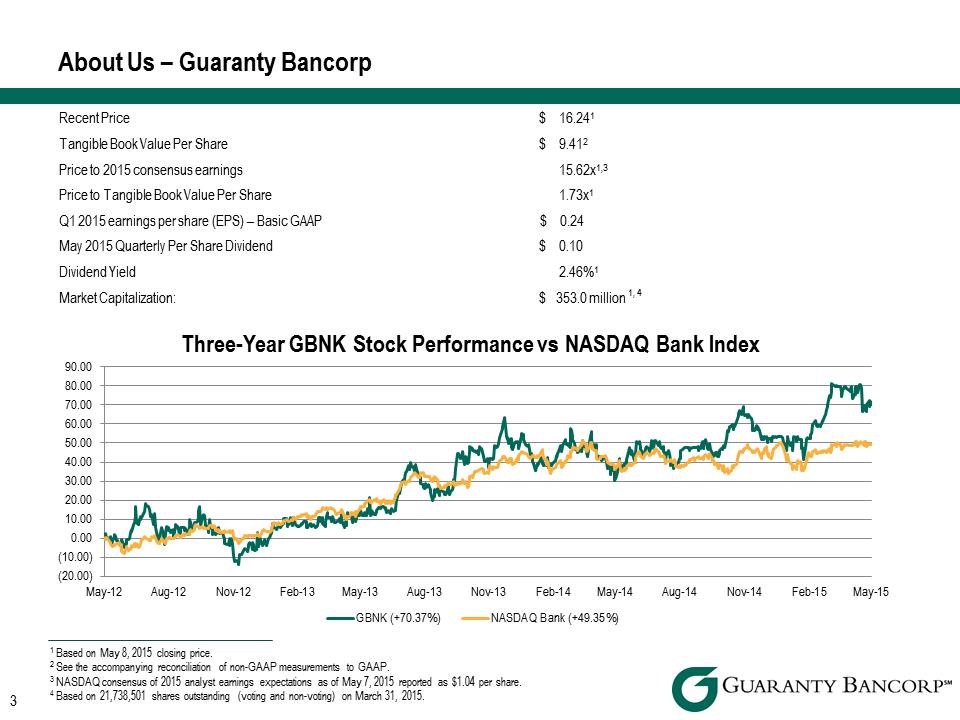 About Us – Guaranty Bancorp Recent Price $ 16.241 Tangible Book Value Per Share $ 9.412 Price to 2015 consensus earnings 15.62x1,3 Price to Tangible Book Value Per Share 1.73x1 Q1 2015 earnings per share (EPS) – Basic GAAP $ 0.24 May 2015 Quarterly Per Share Dividend $ 0.10 Dividend Yield 2.46%1 Market Capitalization: $ 353.0 million 1, 4 Three-Year GBNK Stock Performance vs NASDAQ Bank Index 90.00 80.00 70.00 60.00 50.00 40.00 30.00 20.00 10.00 0.00 (10.00) (20.00) May-12 Aug-12 Nov-12 Feb-13 May-13 Aug-13 Nov-13 Feb-14 May-14 Aug-14 Nov-14 Feb-15 May-15 GBNK (+70.37%) NASDAQ Bank (+49.35%) 1 Based on May 8, 2015 closing price. 2 See the accompanying reconciliation of non-GAAP measurements to GAAP. 3 NASDAQ consensus of 2015 analyst earnings expectations as of May 7, 2015 reported as $1.04 per share. 4 Based on 21,738,501 shares outstanding (voting and non-voting) on March 31, 2015.
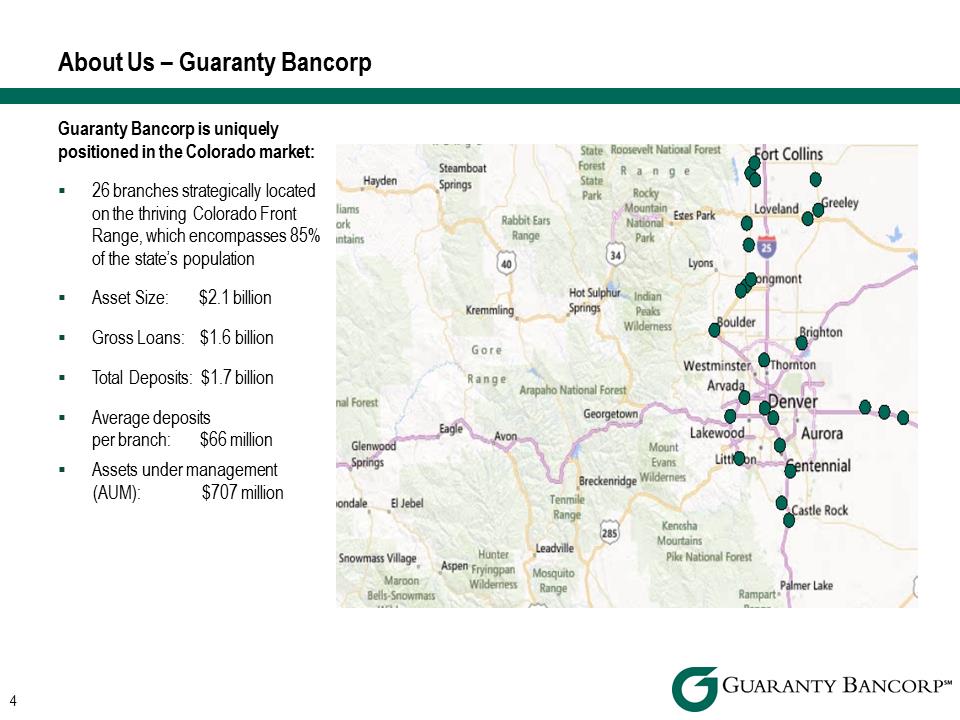 About Us – Guaranty Bancorp Guaranty Bancorp is uniquely positioned in the Colorado market: . 26 branches strategically located on the thriving Colorado Front Range, which encompasses 85% of the state’s population . Asset Size: $2.1 billion . Gross Loans: $1.6 billion . Total Deposits: $1.7 billion . Average deposits per branch: $66 million . Assets under management (AUM): $707 million
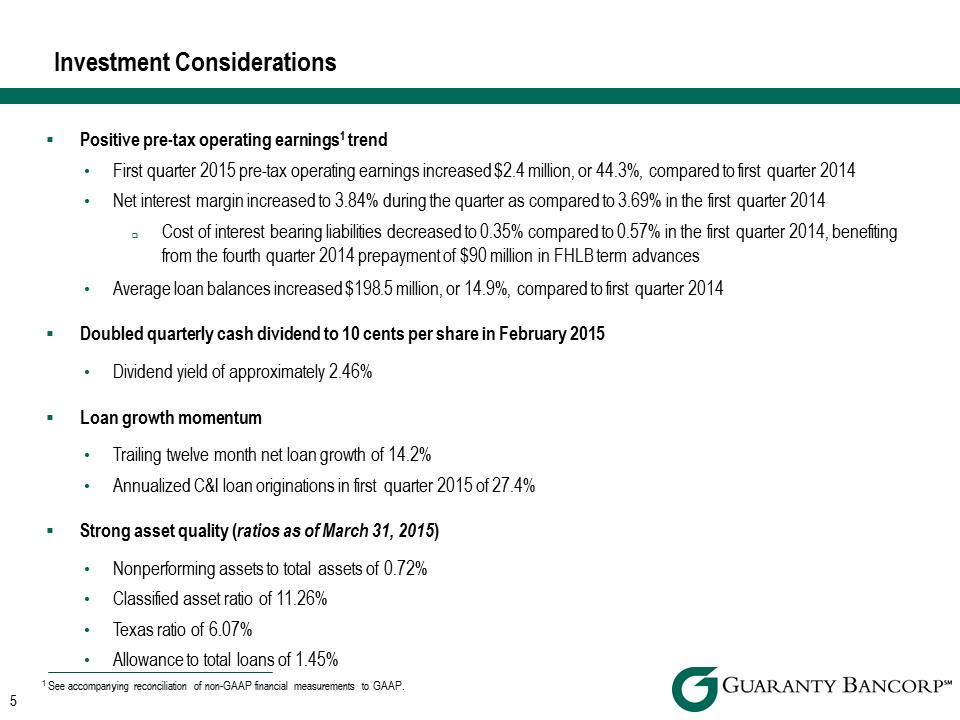 Investment Considerations . Positive pre-tax operating earnings1 trend • First quarter 2015 pre-tax operating earnings increased $2.4 million, or 44.3%, compared to first quarter 2014 • Net interest margin increased to 3.84% during the quarter as compared to 3.69% in the first quarter 2014 Cost of interest bearing liabilities decreased to 0.35% compared to 0.57% in the first quarter 2014, benefiting from the fourth quarter 2014 prepayment of $90 million in FHLB term advances • Average loan balances increased $198.5 million, or 14.9%, compared to first quarter 2014 . Doubled quarterly cash dividend to 10 cents per share in February 2015 • Dividend yield of approximately 2.46% . Loan growth momentum • Trailing twelve month net loan growth of 14.2% • Annualized C&I loan originations in first quarter 2015 of 27.4% . Strong asset quality (ratios as of March 31, 2015) • Nonperforming assets to total assets of 0.72% • Classified asset ratio of 11.26% • Texas ratio of 6.07% • Allowance to total loans of 1.45% 1 See accompanying reconciliation of non-GAAP financial measurements to GAAP.
 Investment Considerations . Strong core deposit mix • Noninterest bearing deposits comprised 38.3% of total deposits at March 31, 2015 • Time deposits comprised 11.2% of total deposits at March 31, 2015 • Core deposits increased $35.5 million, or 9.7%, on an annualized basis during the first quarter 2015 • Average cost of deposits remains low at 0.16% during the first quarter 2015 . Noninterest income growth • Investment advisory fees Total AUM at March 31, 2015 of $706.8 million, an annualized increase of 14.1%, from December 31, 2014 Continued focus on growth in investment management and trust fee income through organic growth, fee enhancement and acquisitions • Growth of SBA originations and premium income • Continued growth of treasury management fees in 2015 due mostly to growth in our C&I customer base
 Investment Considerations . Strong capital structure supportive of future growth (ratios as of March 31, 2015) • Tangible Common Equity Ratio of 9.56%1 • GAAP Equity Ratio of 9.84% • Total Risk-Based Capital Ratio of 13.76% • Leverage Ratio of 11.09% • Tier 1 Common Equity Ratio of 11.32% . Expense management • Improvement in efficiency ratio to 62.82% in the first quarter 2015 compared to 68.65% in the first quarter 2014 • Consolidated eight branches between 2012 and 2014 with estimated annual savings of approximately $2.4 million • Recent renegotiation of corporate office lease with savings of $1.0 million annually, starting in 2016 • Currently renegotiating certain contracts across all areas, which are expected to result in cost savings . Continue to pursue bank and non-bank acquisition opportunities 1 See accompanying reconciliation of non-GAAP financial measurements to GAAP.
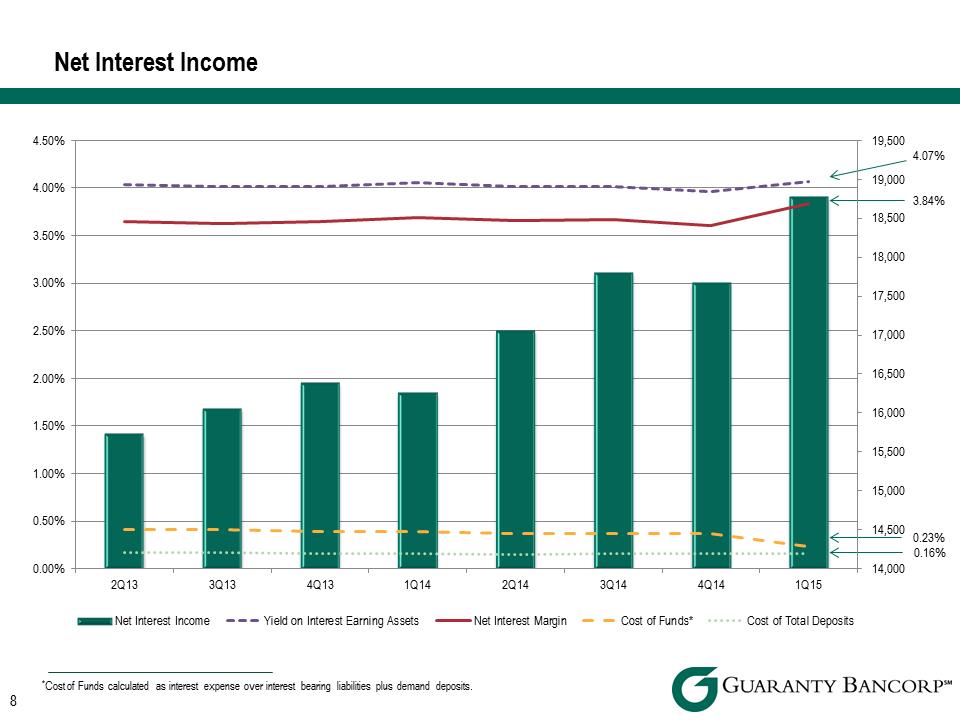 Net Interest Income 4.50% 19,500 4.07% 19,000 4.00% 3.84% 18,500 3.50% 18,000 3.00% 17,500 2.50% 17,000 16,500 2.00% 16,000 1.50% 15,500 1.00% 15,000 0.50% 14,500 0.23% 0.16% 0.00% 14,000 2Q13 3Q13 4Q13 1Q14 2Q14 3Q14 4Q14 1Q15 Net Interest Income Yield on Interest Earning Assets Net Interest Margin Cost of Funds* Cost of Total Deposits *Cost of Funds calculated as interest expense over interest bearing liabilities plus demand deposits.
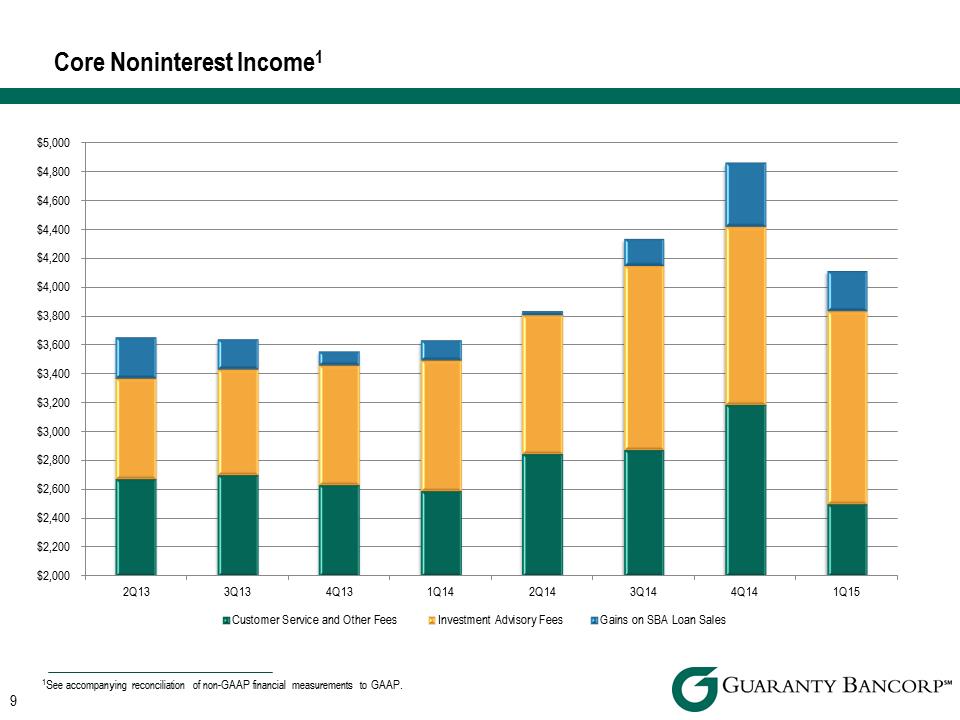 Core Noninterest Income1 $2,000$2,200$2,400$2,600$2,800$3,000$3,200$3,400$3,600$3,800$4,000$4,200$4,400$4,600$4,800$5,0002Q133Q134Q131Q142Q143Q144Q141Q15Customer Service and Other Fees Investment Advisory Fees Gains on SBA Loan Sales 1See accompanying reconciliation of non-GAAP financial measurements to GAAP.
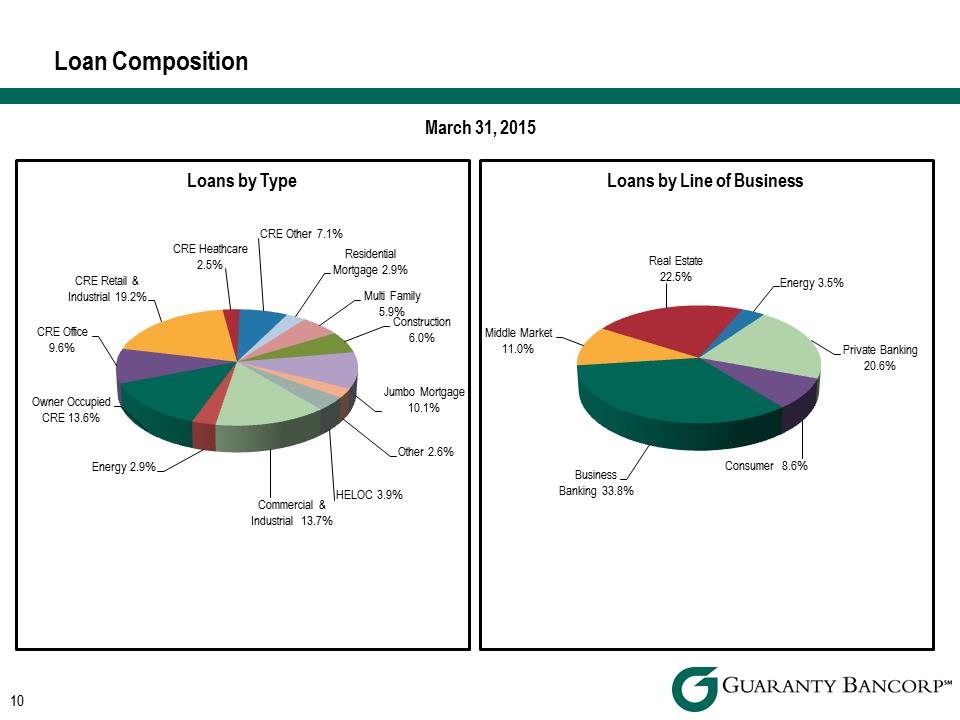 Loan Composition March 31, 2015 Consumer8.6%BusinessBanking33.8%MiddleMarket11.0%RealEstate22.5%Energy3.5%PrivateBanking20.6%LoansbyLineofBusinessCommercial&Industrial13.7%Energy2.9%OwnerOccupiedCRE13.6%CREOffice9.6%CRERetail&Industrial19.2%CREHeathcare2.5%CREOther7.1%ResidentialMortgage2.9%MultiFamily5.9%Construction6.0%JumboMortgage10.1%Other2.6%HELOC3.9%LoansbyType
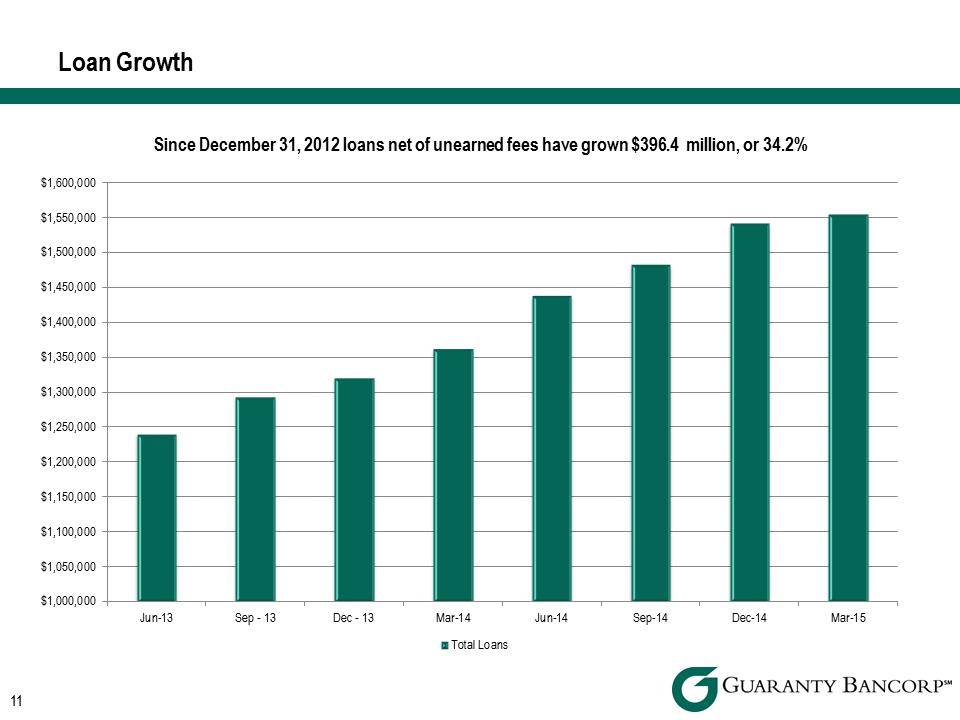 Loan Growth $1,000,000$1,050,000$1,100,000$1,150,000$1,200,000$1,250,000$1,300,000$1,350,000$1,400,000$1,450,000$1,500,000$1,550,000$1,600,000Since December 31, 2012 loans net of unearned fees have grown $396.4 million, or 34.2% Jun-13 Sep -13 Dec -13 Mar-14 Jun-14 Sep-14 Dec-14 Mar-15 Total Loans
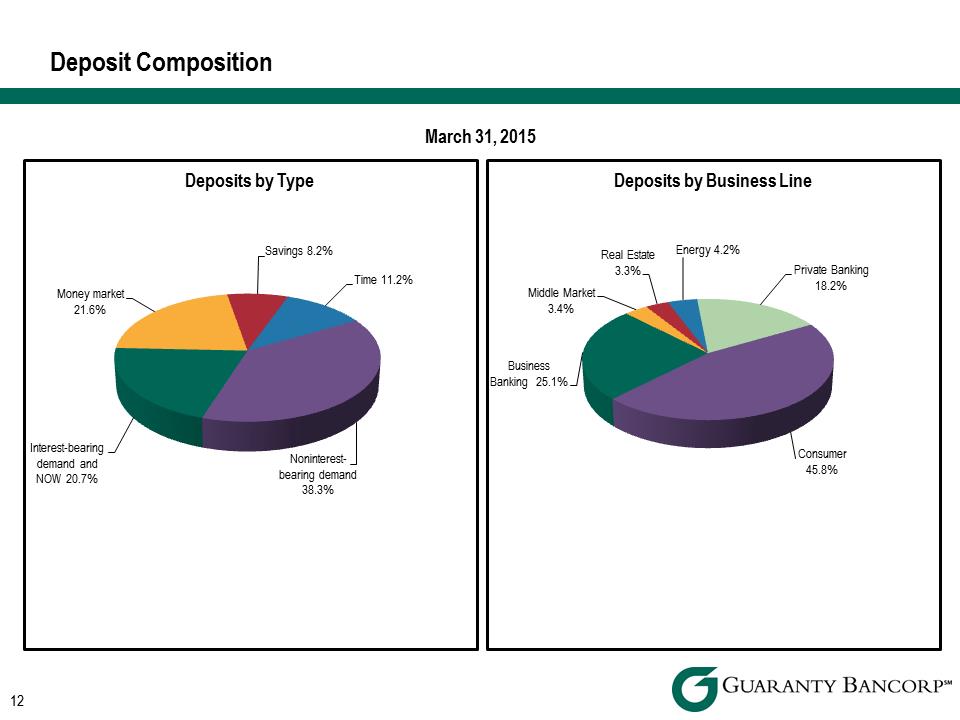 Deposit Composition March 31, 2015 Consumer45.8%BusinessBanking25.1%MiddleMarket3.4%RealEstate3.3%Energy4.2%PrivateBanking18.2%DepositsbyBusinessLineNoninterest-bearingdemand38.3%Interest-bearingdemandandNOW20.7%Moneymarket21.6%Savings8.2%Time11.2%DepositsbyType
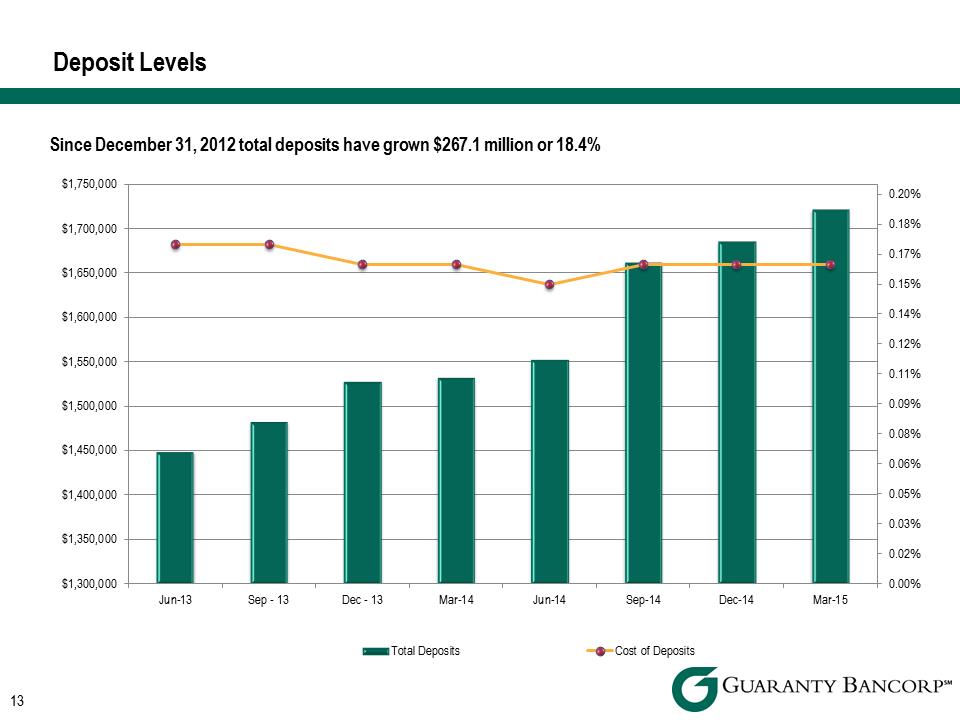 Deposit Levels Since December 31, 2012 total deposits have grown $267.1 million or 18.4% 0.00%0.02%0.03%0.05%0.06%0.08%0.09%0.11%0.12%0.14%0.15%0.17%0.18%0.20%$1,300,000$1,350,000$1,400,000$1,450,000$1,500,000$1,550,000$1,600,000$1,650,000$1,700,000$1,750,000Jun-13Sep-13Dec-13Mar-14Jun-14Sep-14Dec-14Mar-15Total Deposits Cost of Deposits
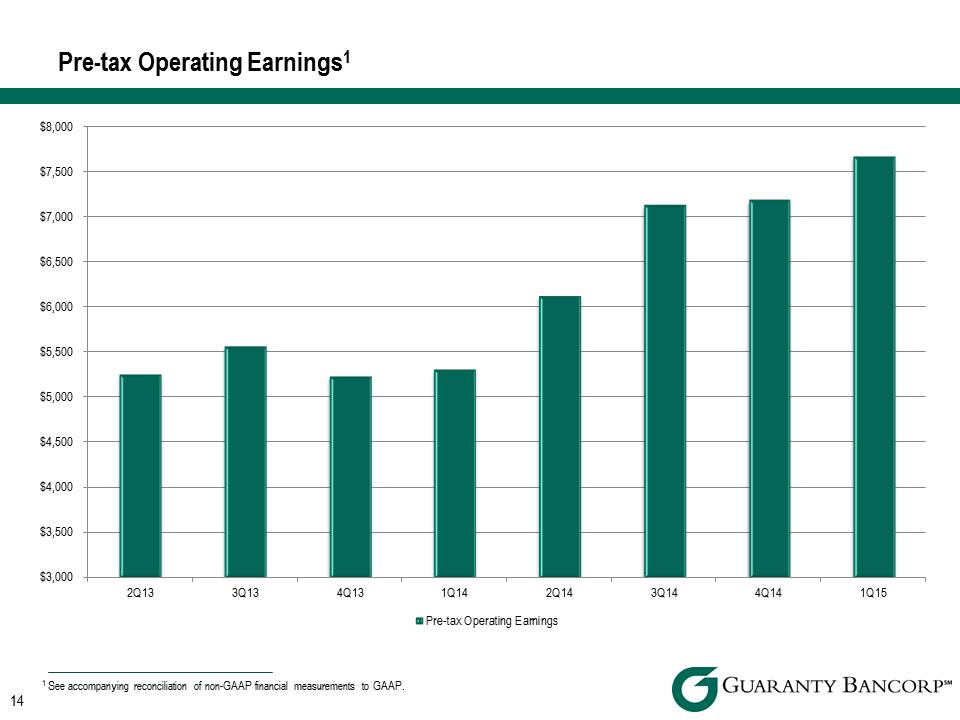 Pre-tax Operating Earnings1 $3,000$3,500$4,000$4,500$5,000$5,500$6,000$6,500$7,000$7,500$8,0002Q133Q134Q131Q142Q143Q144Q141Q15Pre-tax Operating Earnings 1 See accompanying reconciliation of non-GAAP financial measurements to GAAP.
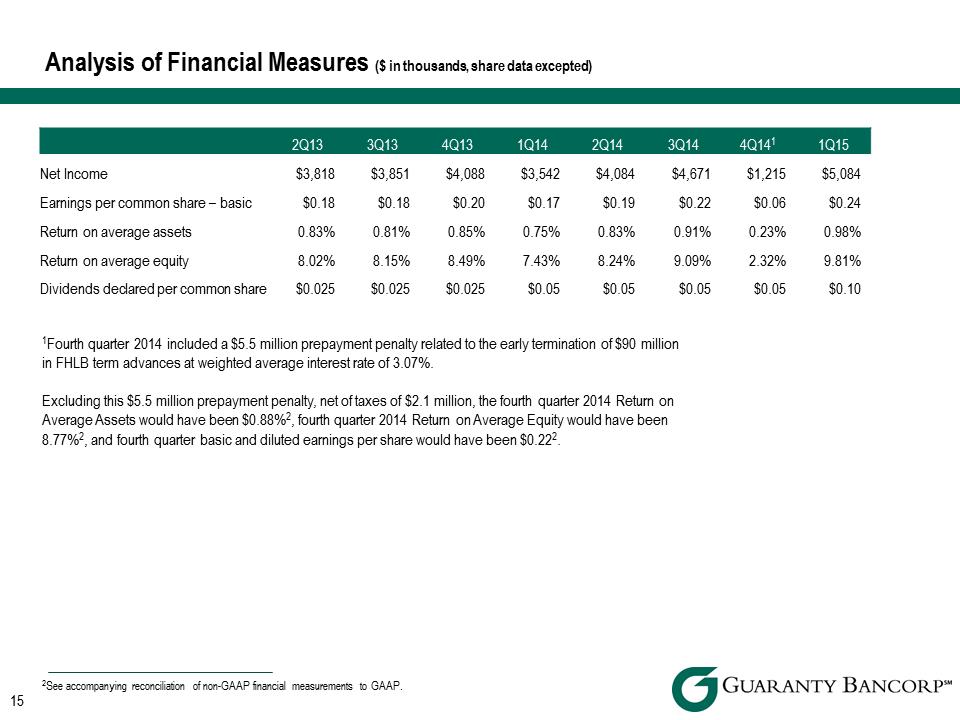 Analysis of Financial Measures ($ in thousands, share data excepted) 2Q13 3Q13 4Q13 1Q14 2Q14 3Q14 4Q141 1Q15 Net Income $3,818 $3,851 $4,088 $3,542 $4,084 $4,671 $1,215 $5,084 Earnings per common share – basic Return on average assets Return on average equity Dividends declared per common share $0.18 0.83% 8.02% $0.025 $0.18 0.81% 8.15% $0.025 $0.20 0.85% 8.49% $0.025 $0.17 0.75% 7.43% $0.05 $0.19 0.83% 8.24% $0.05 $0.22 0.91% 9.09% $0.05 $0.06 0.23% 2.32% $0.05 $0.24 0.98% 9.81% $0.10 1Fourth quarter 2014 included a $5.5 million prepayment penalty related to the early termination of $90 million in FHLB term advances at weighted average interest rate of 3.07%. Excluding this $5.5 million prepayment penalty, net of taxes of $2.1 million, the fourth quarter 2014 Return on Average Assets would have been $0.88%2, fourth quarter 2014 Return on Average Equity would have been 8.77%2, and fourth quarter basic and diluted earnings per share would have been $0.222 . 2See accompanying reconciliation of non-GAAP financial measurements to GAAP.
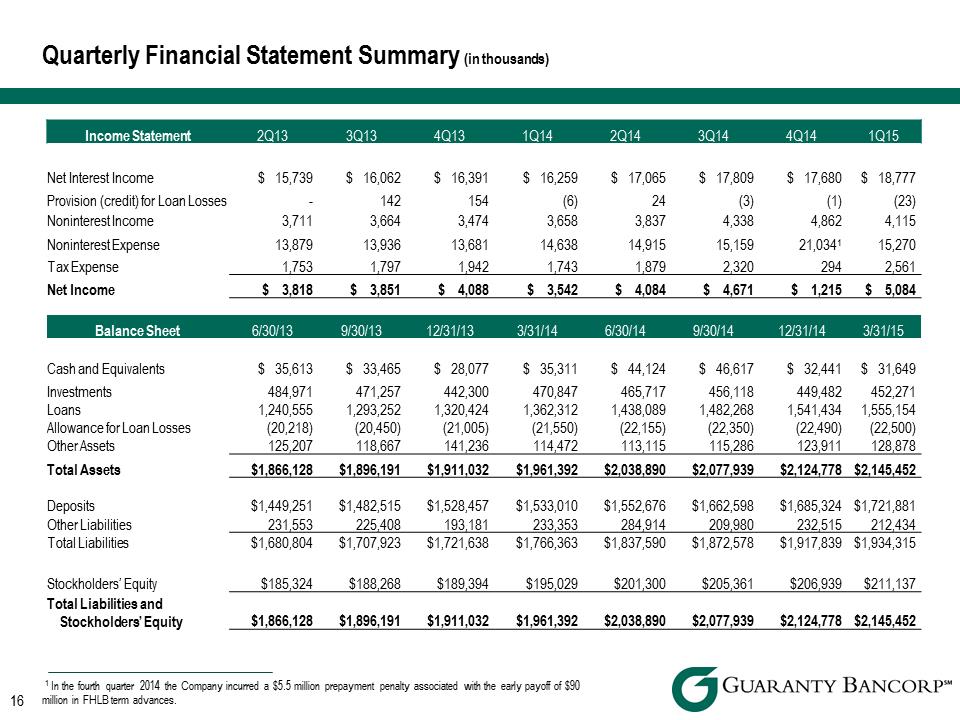 Quarterly Financial Statement Summary (in thousands) Income Statement 2Q13 3Q13 4Q13 1Q14 2Q14 3Q14 4Q14 1Q15 Net Interest Income $ 15,739 $ 16,062 $ 16,391 $ 16,259 $ 17,065 $ 17,809 17,680 18,777 Provision (credit) for Loan Losses -142 154 (6) 24 (3) (1) (23) Noninterest Income 3,711 3,664 3,474 3,658 3,837 4,338 4,862 4,115 Noninterest Expense 13,879 13,936 13,681 14,638 14,915 15,159 21,0341 15,270 Tax Expense 1,753 1,797 1,942 1,743 1,879 2,320 294 2,561 Net Income $ 3,818 $ 3,851 $ 4,088 $ 3,542 $ 4,084 $ 4,671 1,215 5,084 BalanceSheet6/30/139/30/1312/31/133/31/146/30/149/30/1412/31/143/31/15Cash and Equivalents $ 35,613 $ 33,465 $ 28,077 $ 35,311 $ 44,124 $ 46,617 32,441 31,649 Investments 484,971 471,257 442,300 470,847 465,717 456,118 449,482 452,271 Loans 1,240,555 1,293,252 1,320,424 1,362,312 1,438,089 1,482,268 1,541,434 1,555,154 Allowance for Loan Losses (20,218) (20,450) (21,005) (21,550) (22,155) (22,350) (22,490) (22,500) Other Assets 125,207 118,667 141,236 114,472 113,115 115,286 123,911 128,878 Total Assets $1,866,128 $1,896,191 $1,911,032 $1,961,392 $2,038,890 $2,077,939 $2,124,778 $2,145,452 Deposits $1,449,251 $1,482,515 $1,528,457 $1,533,010 $1,552,676 $1,662,598 $1,685,324 $1,721,881 Other Liabilities 231,553 225,408 193,181 233,353 284,914 209,980 232,515 212,434 Total Liabilities $1,680,804 $1,707,923 $1,721,638 $1,766,363 $1,837,590 $1,872,578 $1,917,839 $1,934,315 Stockholders’ Equity $185,324 $188,268 $189,394 $195,029 $201,300 $205,361 $206,939 $211,137 Total Liabilities and Stockholders’ Equity $1,866,128 $1,896,191 $1,911,032 $1,961,392 $2,038,890 $2,077,939 $2,124,778 $2,145,452 1 In the fourth quarter 2014 the Company incurred a $5.5 million prepayment penalty associated with the early payoff of $90 16 million in FHLB term advances.
 Colorado Market
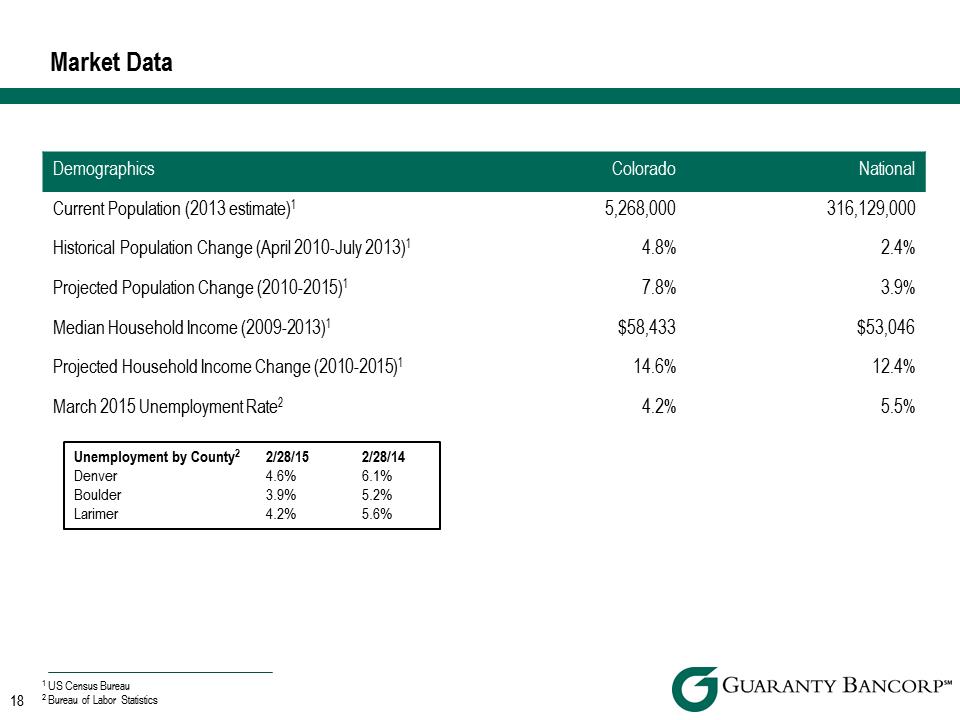 Market Data DemographicsColoradoNationalCurrent Population (2013 estimate)1 5,268,000 316,129,000 Historical Population Change (April 2010-July 2013)1 4.8% 2.4% Projected Population Change (2010-2015)1 7.8% 3.9% Median Household Income (2009-2013)1 $58,433 $53,046 Projected Household Income Change (2010-2015)1 14.6% 12.4% March 2015 Unemployment Rate2 4.2% 5.5% Unemployment by County2 2/28/15 2/28/14 Denver 4.6% 6.1% Boulder 3.9% 5.2% Larimer 4.2% 5.6% 1 US Census Bureau 18 2 Bureau of Labor Statistics
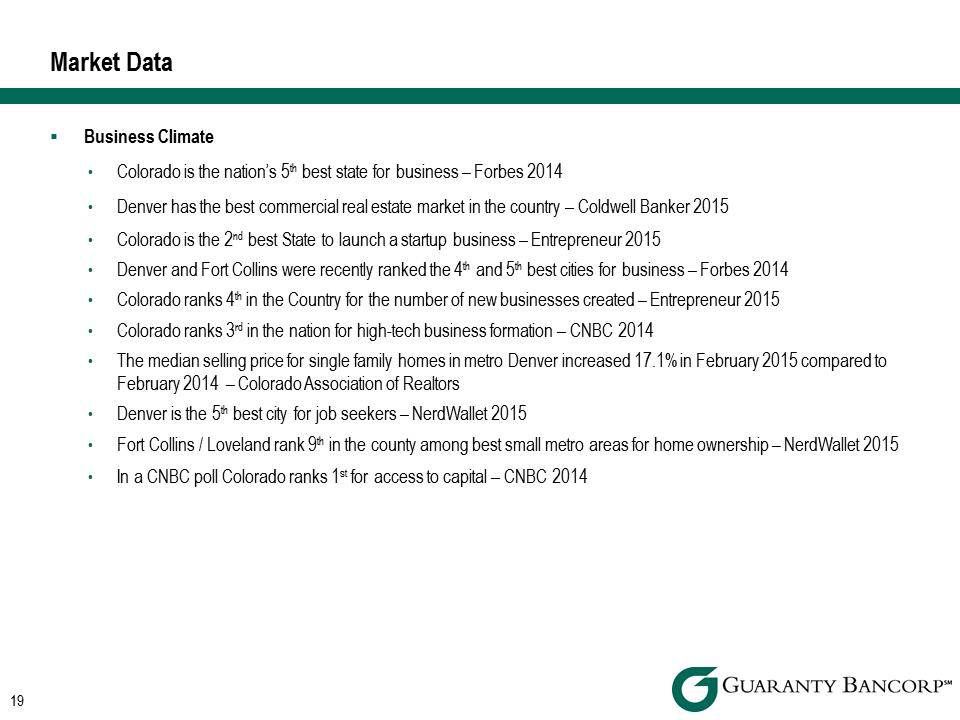 Market Data . Business Climate • Colorado is the nation’s 5th best state for business – Forbes 2014 • Denver has the best commercial real estate market in the country – Coldwell Banker 2015 • Colorado is the 2nd best State to launch a startup business – Entrepreneur 2015 • Denver and Fort Collins were recently ranked the 4th and 5th best cities for business – Forbes 2014 • Colorado ranks 4th in the Country for the number of new businesses created – Entrepreneur 2015 • Colorado ranks 3rd in the nation for high-tech business formation – CNBC 2014 • The median selling price for single family homes in metro Denver increased 17.1% in February 2015 compared to February 2014 – Colorado Association of Realtors • Denver is the 5th best city for job seekers – NerdWallet 2015 • Fort Collins / Loveland rank 9th in the county among best small metro areas for home ownership NerdWallet 2015 • In a CNBC poll Colorado ranks 1st for access to capital – CNBC 2014
 Market Data . Growth • Denver is the 6th fastest growing metro area in the country – Forbes 2014 • Boulder ranked 1st for Economic Growth out of 506 cities – NerdWallet 2014 • Colorado is the number one state for economic growth – Business Insider 2014 • Colorado had the 3rd highest employment growth rate – Metro Denver Economic Development Corporation 2015 • Colorado’s population is projected to grow by 13.4% from 2010 through 2020 versus an estimated national growth rate of 7.1% -USA Today 2015 . Highly Educated Workforce • Colorado residents have the 2nd highest level of college attainment – Forbes 2014 • Denver ranked 1st for the largest increase in residents with college degrees – U.S. Census Bureau 2014 • Colorado ranks first for its supply of high-quality labor – Forbes 2014 • Denver’s population ranks 4th for its percentage of young and educated residents – New York Times 2014
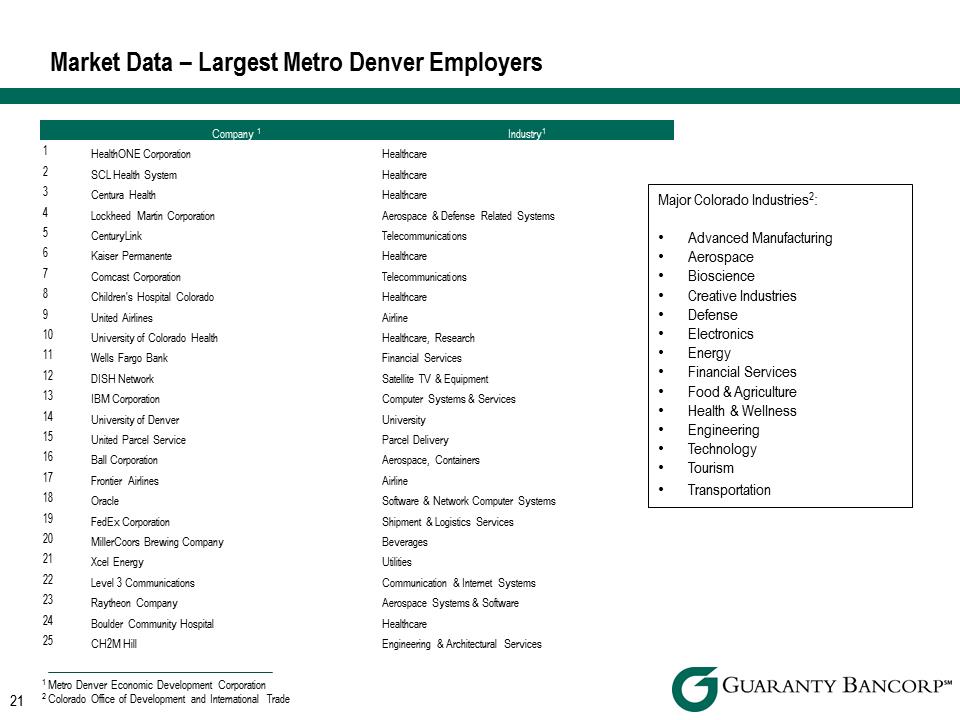 Market Data – Largest Metro Denver Employers Company1Industry11 HealthONE Corporation Healthcare 2 SCL Health System Healthcare 3 Centura Health Healthcare 4 Lockheed Martin Corporation Aerospace & Defense Related Systems CenturyLink Telecommunications 6 Kaiser Permanente Healthcare 7 Comcast Corporation Telecommunications 8 Children's Hospital Colorado Healthcare 9 United Airlines Airline University of Colorado Health Healthcare, Research 11 Wells Fargo Bank Financial Services 12 DISH Network Satellite TV & Equipment 13 IBM Corporation Computer Systems & Services 14 University of Denver University United Parcel Service Parcel Delivery 16 Ball Corporation Aerospace, Containers 17 Frontier Airlines Airline 18 Oracle Software & Network Computer Systems 19 FedEx Corporation Shipment & Logistics Services MillerCoors Brewing Company Beverages 21 Xcel Energy Utilities 22 Level 3 Communications Communication & Internet Systems 23 Raytheon Company Aerospace Systems & Software 24 Boulder Community Hospital Healthcare CH2M Hill Engineering & Architectural Services MajorColoradoIndustries2:•AdvancedManufacturing•Aerospace•Bioscience•CreativeIndustries•Defense•Electronics•Energy•FinancialServices•Food&Agriculture•Health&Wellness•Engineering•Technology•Tourism•Transportation1 Metro Denver Economic Development Corporation 2 Colorado Office of Development and International Trade
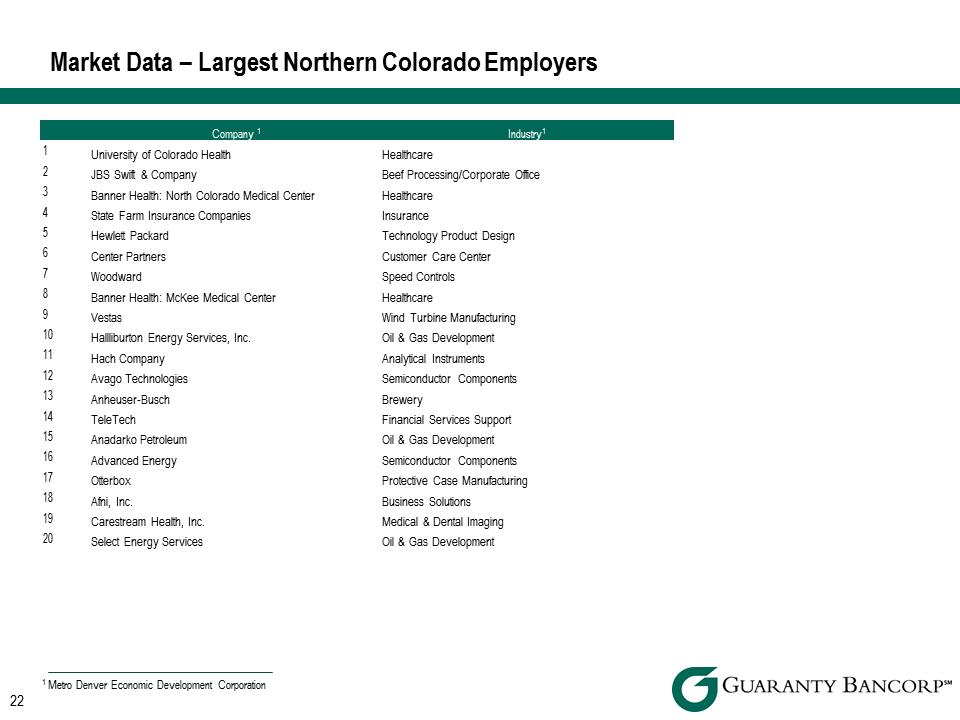 Market Data – Largest Northern Colorado Employers Company1Industry11 University of Colorado Health Healthcare 2 JBS Swift & Company Beef Processing/Corporate Office 3 Banner Health: North Colorado Medical Center Healthcare 4 State Farm Insurance Companies Insurance 5 Hewlett Packard Technology Product Design 6 Center Partners Customer Care Center 7 Woodward Speed Controls 8 Banner Health: McKee Medical Center Healthcare 9 Vestas Wind Turbine Manufacturing 10 Hallliburton Energy Services, Inc. Oil & Gas Development 11 Hach Company Analytical Instruments 12 Avago Technologies Semiconductor Components 13 Anheuser-Busch Brewery 14 TeleTech Financial Services Support 15 Anadarko Petroleum Oil & Gas Development 16 Advanced Energy Semiconductor Components 17 Otterbox Protective Case Manufacturing 18 Afni, Inc. Business Solutions 19 Carestream Health, Inc. Medical & Dental Imaging 20 Select Energy Services Oil & Gas Development 1 Metro Denver Economic Development Corporation
 Reconciliation of Non-GAAP Financial Measures
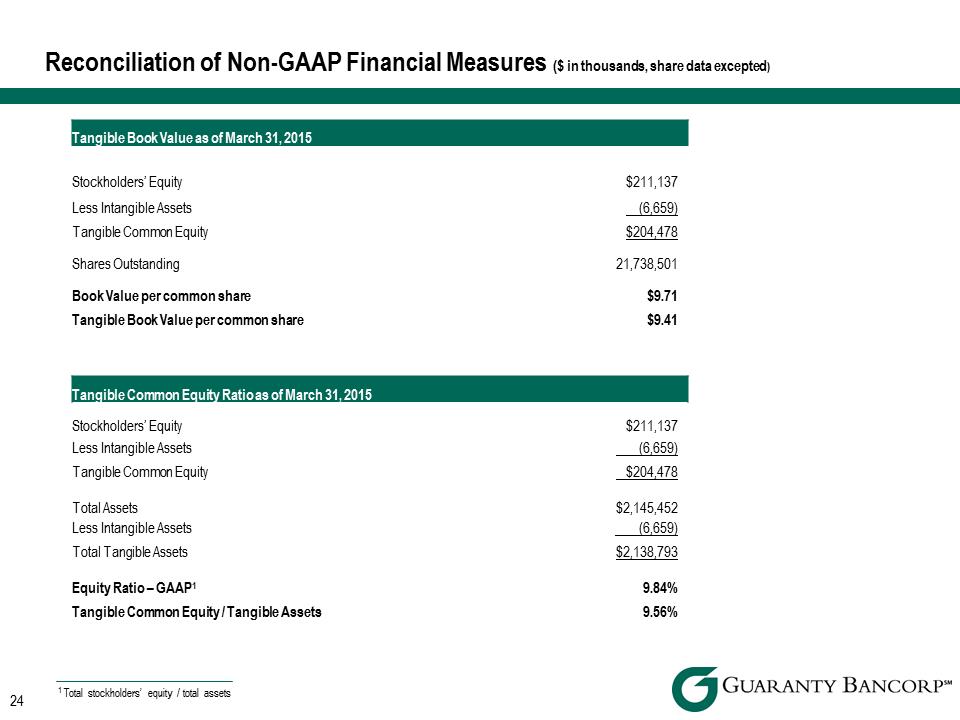 Reconciliation of Non-GAAP Financial Measures ($ in thousands, share data excepted) TangibleBookValueasofMarch31,2015Stockholders’ Equity $211,137 Less Intangible Assets (6,659) Tangible Common Equity $204,478 Shares Outstanding 21,738,501 Book Value per common share $9.71 Tangible Book Value per common share $9.41 TangibleCommonEquityRatioasofMarch31,2015Stockholders’ Equity $211,137 Less Intangible Assets (6,659) Tangible Common Equity $204,478 Total Assets $2,145,452 Less Intangible Assets (6,659) Total Tangible Assets $2,138,793 Equity Ratio – GAAP1 9.84% Tangible Common Equity / Tangible Assets 9.56% 1 Total stockholders’ equity / total assets
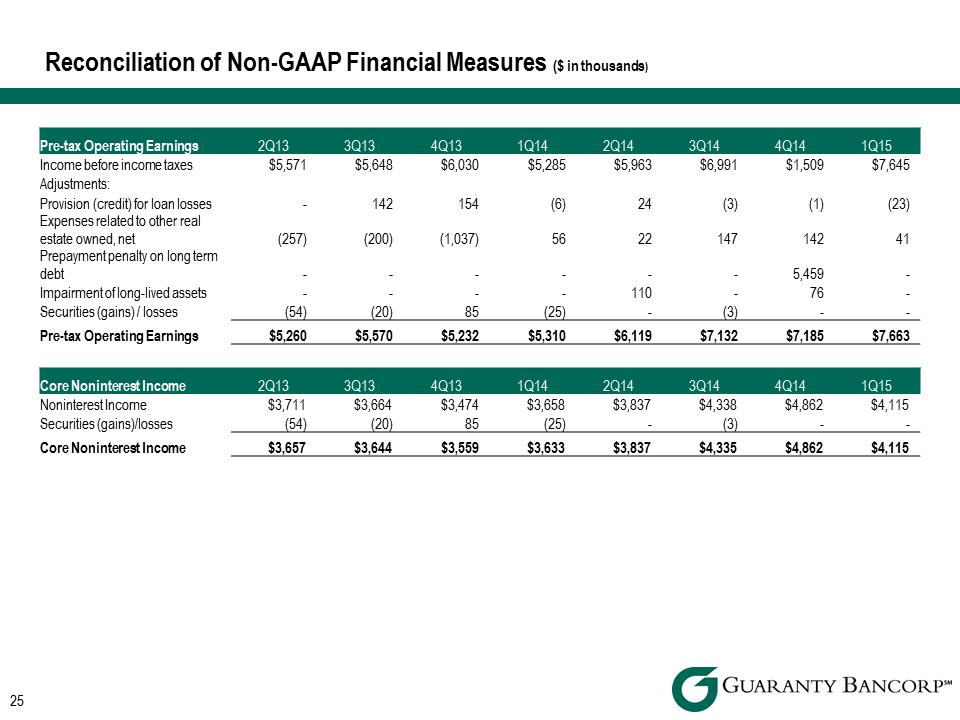 Reconciliation of Non-GAAP Financial Measures ($ in thousands) Pre tax Operating Earnings 2Q13 3Q13 4Q13 1Q14 2Q14 3Q14 4Q14 1Q15 Income before income taxes $5,571 $5,648 $6,030 $5,285 $5,963 $6,991 $1,509 $7,645 Adjustments: Provision (credit) for loan losses -142 154 (6) 24 (3) (1) (23) Expenses related to other real estate owned, net (257) (200) (1,037) 56 22 147 142 41 Prepayment penalty on long term debt 5,459 -Impairment of long-lived assets ----110 -76 -Securities (gains) / losses (54) (20) 85 (25) -(3) --Pre-tax Operating Earnings $5,260 $5,570 $5,232 $5,310 $6,119 $7,132 $7,185 $7,663 Noninterest Income $3,711 $3,664 $3,474 $3,658 $3,837 $4,338 $4,862 $4,115 Securities (gains)/losses (54) (20) 85 (25) -(3) --Core Noninterest Income $3,657 $3,644 $3,559 $3,633 $3,837 $4,335 $4,862 $4,115 Core Noninterest Income 2Q13 3Q13 4Q13 1Q14 2Q14 3Q14 4Q14 1Q15
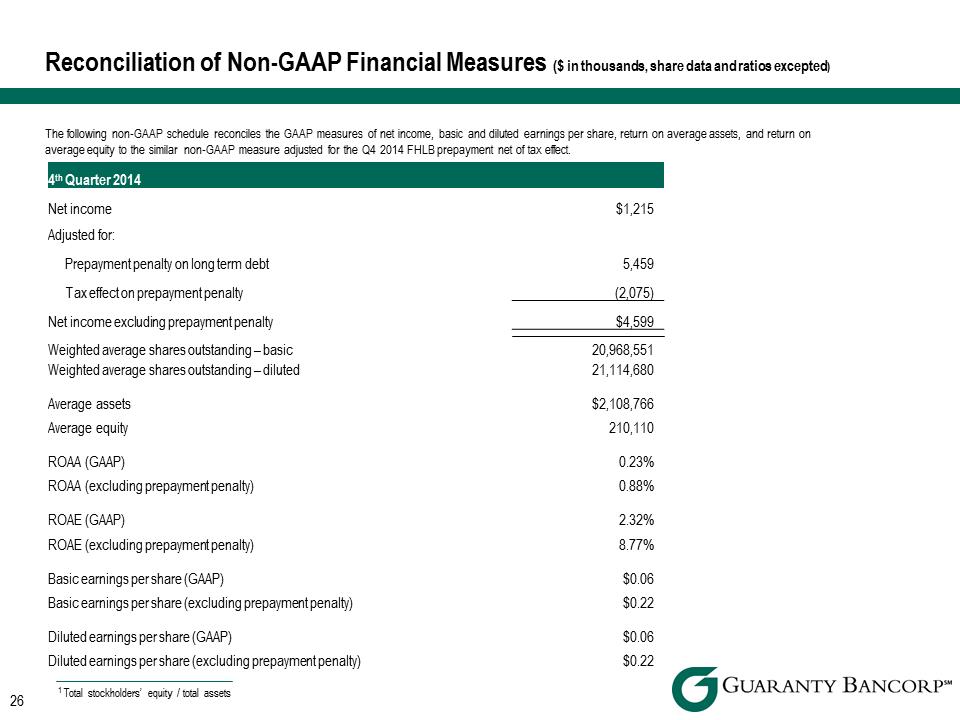 Reconciliation of Non-GAAP Financial Measures ($ in thousands, share data and ratios excepted) The following non-GAAP schedule reconciles the GAAP measures of net income, basic and diluted earnings per share, return on average assets, and return on average equity to the similar non-GAAP measure adjusted for the Q4 2014 FHLB prepayment net of tax effect. 4thQuarter2014Net income Adjusted for: $1,215 Prepayment penalty on long term debt 5,459 Tax effect on prepayment penalty (2,075) Net income excluding prepayment penalty $4,599 Weighted average shares outstanding – basic Weighted average shares outstanding – diluted 20,968,551 21,114,680 Average assets Average equity $2,108,766 210,110 ROAA (GAAP) ROAA (excluding prepayment penalty) 0.23% 0.88% ROAE (GAAP) ROAE (excluding prepayment penalty) 2.32% 8.77% Basic earnings per share (GAAP) Basic earnings per share (excluding prepayment penalty) $0.06 $0.22 Diluted earnings per share (GAAP) Diluted earnings per share (excluding prepayment penalty) $0.06 $0.22 26 1 Total stockholders’ equity / total assets