Attached files
| file | filename |
|---|---|
| 8-K - FORM 8-K - FIRST INTERSTATE BANCSYSTEM INC | d924091d8k.htm |
 Page 1
presenting at the
DA Davidson
17
th
Annual
Financial Services Conference
Denver, Colorado
May 12-13, 2015
Exhibit 99.1 |
 First Interstate
BancSystem Safe Harbor
This
presentation
contains
“forward-looking
statements”
within
the
meaning
of
Section
27A
of
the
Securities
Act
of
1933,
as
amended,
and
Rule
175
promulgated
thereunder,
and
Section
21E
of
the
Securities
Exchange
Act
of
1934,
as
amended,
and
Rule
3b-6
promulgated
thereunder,
that
involve
inherent
risks
and
uncertainties.
Any
statements
about
our
plans,
objectives,
expectations,
strategies,
beliefs,
or
future
performance
or
events
constitute
forward-looking
statements.
Forward-looking
statements
involve
known
and
unknown
risks,
uncertainties,
assumptions,
estimates
and
other
important
factors
that
could
cause
actual
results
to
differ
materially
from
any
results,
performance
or
events
expressed
or
implied
by
such
forward-looking
statements.
Such
forward-looking
statements
include
but
are
not
limited
to
statements
about
revenues,
income
from
the
origination
and
sale
of
loans,
net
interest
margin,
quarterly
provisions
for
loan
losses,
non-interest
expense,
loan
growth,
non-performing
assets
and
net
charge-off
of
loans
and
other
statements
that
are
not
historical
facts.
These
forward-looking
statements
are
subject
to
risks
and
uncertainties
that
may
cause
actual
results
to
differ
materially
from
those
projected,
including
but
not
limited
to
the
following:
the
factors
described
in
our
Form
10-K
and
subsequent
filings
with
the
Securities
and
Exchange
Commission
(“SEC”),
including
under
the
sections
entitled
“Risk
Factors”.
The
risk
factors
described
in
Forms
10-K
are
not
necessarily
all
of
the
important
factors
that
could
cause
our
actual
results,
performance
or
achievements
to
differ
materially
from
those
expressed
in
or
implied
by
any
of
the
forward-looking
statement
contained
in
this
presentation.
Other
unknown
or
unpredictable
factors
also
could
affect
our
results.
All
forward-looking
statements
attributable
to
us
or
persons
acting
on
our
behalf
are
expressly
qualified
in
their
entirety
by
the
cautionary
statements
set
forth
above.
Forward-looking
statements
speak
only
as
of
the
date
they
are
made
and
we
do
not
undertake
or
assume
any
obligation
to
update
publicly
any
of
these
statements
to
reflect
actual
results,
new
information
or
future
events,
changes
in
assumptions
or
changes
in
other
factors
affecting
forward-looking
statements,
except
to
the
extent
required
by
applicable
laws.
If
we
update
one
or
more
forward-looking
statements,
no
inference
should
be
drawn
that
we
will
make
additional
updates
with
respect
to
those
or
other
forward-looking
statements.
Page 2 |
 Why invest in
First Interstate BancSystem? Committed to increasing Shareholder Value
Long Track Record of Profitability
Low-Cost Core Deposit Funding
Conservative Credit Strategy which Limits Exposure to
Large Losses
Diversified Customer Base tempers Economic Volatility
Significant Market Share provides Leverage in Pricing
Growth Opportunities
First Interstate
BancSystem Page 3
|
 First Interstate
BancSystem Total Return to
Shareholders Page 4
Since the IPO in March 2010 over 100% increase in shareholder value
|
 First Interstate
BancSystem Maximizing
Shareholder Value Page 5
Management’s priority is to achieve growth through: |
 First Interstate
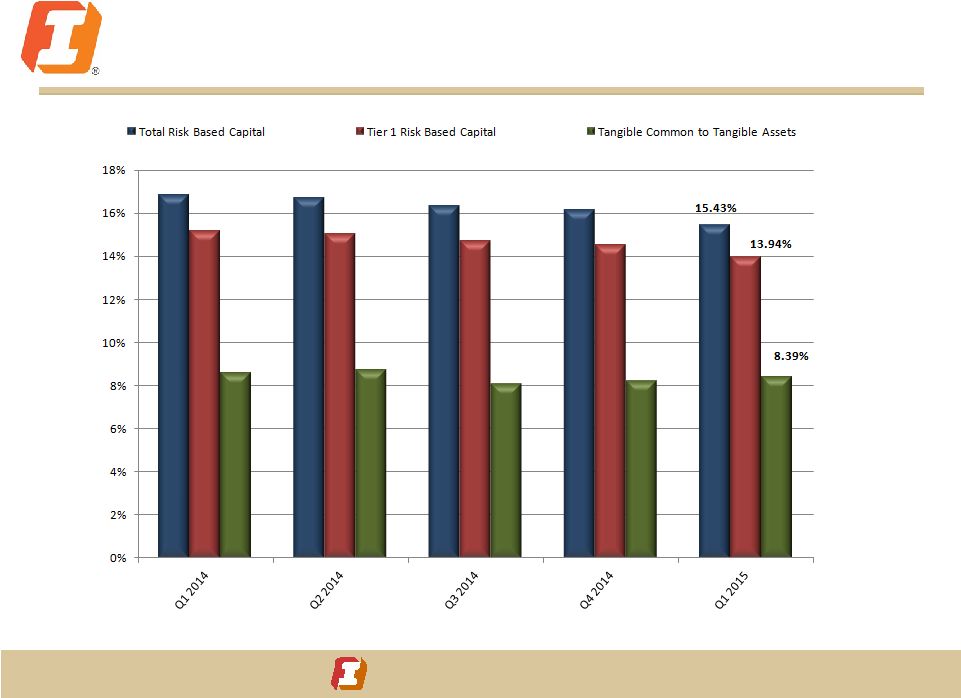
BancSystem Strong Capital allows
Growth Page 6 |
 First Interstate
BancSystem Page 7
Our History:
Strong Earnings
Performance
and
Stable Balance Sheet
First Interstate
BancSystem |
 First Interstate
BancSystem Core Pre-tax
Pre-Provision Income exclusive of acquisition and litigation costs
Page 8
(in thousands) |
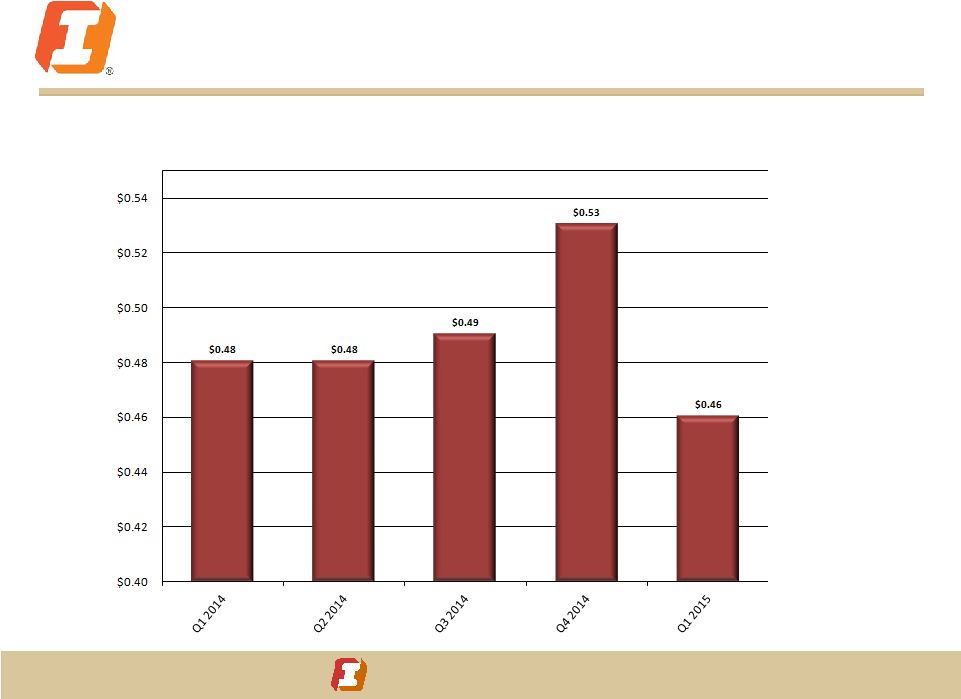 First Interstate
BancSystem Core Earnings Per
Share exclusive of acquisition and litigation costs
Page 9 |
 First Interstate
BancSystem Stable Earnings
Ratios Page 10
Annualized Return on Avg. Common Equity
Annualized Return on Avg. Assets |
 First Interstate
BancSystem Low-risk
Investment Portfolio Effective Duration of
the portfolio is 2.61
years
Average yield of the
portfolio is 1.70%
Strategy: Maintain
short duration with
minimal credit risk
and an emphasis on
stable cash flows
and extension risk
mitigation.
Page 11
$2.3 Billion
(as of 3/30/15) |
 First Interstate
BancSystem Page 12
Diversified Loan Portfolio
$4.9 Billion in Loans
$4.9 Billion in Loans
Loan growth
12.9% year over year, including the
acquisition of Mountain West Bank
4.6% year over year organic growth
Positive economic indicators
Low unemployment
Increasing demand
Strong indirect lending network
Conservative credit practices
In-house limit of $15 Million versus
legal lending limit over $90 Million |
 Returning to
a Normalized Credit Environment (In thousands)
1.11% of Total Assets
First Interstate
BancSystem Page 13
|
 First Interstate
BancSystem Strong Core Deposit
Base First Interstate
BancSystem Page 14
(as of 3/31/2015)
Low Cost of Funds
24 basis points |
 First Interstate
BancSystem Page 15
Growth Strategy
First Interstate
BancSystem |
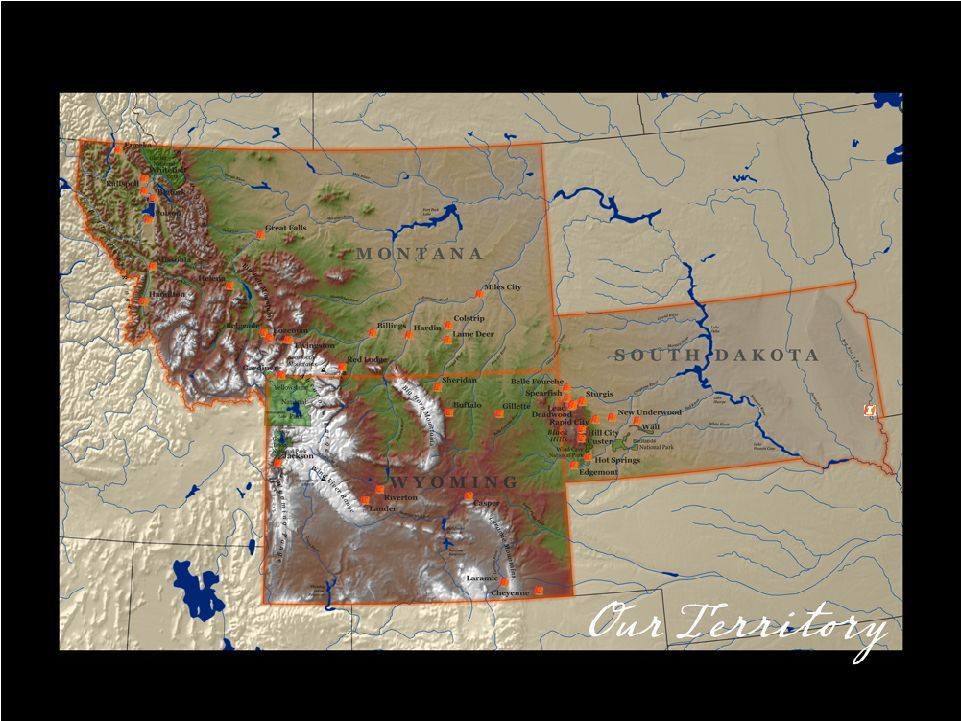 Page
16 A Unique Footprint |
 First Interstate
BancSystem Diversified
Industries soften impact of Economic Volatility Agriculture
Cattle
Crops
Page 17
Energy
Oil and Natural Gas
Greater Williston Basin Area
Bakken formation
Powder River Basin
Coal
MT Ranked #1 and WY ranked #3 in demonstrated Coal Reserves
WY Ranked #1 in Production
Wind
MT, WY and SD in the top 10 for potential wind energy development
MT has the fastest national growth rate for wind energy |
 First Interstate
BancSystem Tourism
Glacier National Park, MT
Yellowstone National Park, WY
Major National Parks
Summer/Winter Opportunities
Mount Rushmore, SD
Page 18
Healthcare
Aging population base
Regional healthcare centers
Veterans Administration healthcare
Military /Government
Ellsworth Air Force Base, SD
Malmstrom Air Force Base, MT
F.E. Warren Air Force Base, WY
B1B Lancer,
Ellsworth Air Force Base |
 First Interstate
BancSystem Low Unemployment
allows room for expansion Page 19 |
 First Interstate
BancSystem Market Share
– a “sweet spot”
First Interstate
BancSystem (June 30,
2014) Locations
Market Share*
Riverton, WY
44%
Sheridan, WY
40%
Laramie, WY
33%
Missoula, MT
31%
Gillette, WY
30%
Casper, WY
27%
Billings, MT
23%
Great Falls, MT
23%
Helena, MT
23%
Spearfish, SD
21%
Jackson, WY-ID
17%
Bozeman, MT
16%
Kalispell, MT
13%
Cheyenne, WY
8%
Rapid City, SD
7%
Page 20
* The market share percentages are per the FDIC, adjusted for credit union deposits within
each community, including deposits attributable to the Mountain West Bank acquisition.
Market share allows us to influence cost of funds and still leaves room for growth:
|
 First Interstate
BancSystem Page 21
Delivering what the Customer Needs:
Wealth Management
AUM -
$4.6 Billion and growing
Bakken influence creating wealth
Wealth advisors positioned across our
footprint
Mortgage Lending
Strong purchase activity within our
markets
Ability to expand our market share
Recently opened a mortgage office in
Sioux Falls, SD
Payment Services
Focused strategy to increase business
card usage
Local reward program attracts personal
card usage
Non-Interest Income Strategy for Growth |
 First Interstate
BancSystem Moving forward
Page 22
Customer
Centric
Technology
Expectations
Reduce Bricks
and Mortar
Becoming flexible and responsive to the changing environment |
 Why invest in
First Interstate BancSystem? Because we’re: Committed to increasing
Shareholder Value Have a Long Track Record of Profitability
Provide Low-Cost Core Deposit Funding
Our Conservative Credit Strategy Limits Exposure to
Large Losses
We have a Diversified Customer Base that tempers
Economic Volatility
Our Significant Market Share provides Leverage
There are Great Growth Opportunities
First Interstate
BancSystem Page 23
|
 First Interstate
BancSystem Page 24
Appendix
First Interstate
BancSystem |
 First Interstate
BancSystem Long Term History
with Solid Performance Company Snap Shot
Headquartered in Billings, MT with 80 banking offices across
Montana, Wyoming and South Dakota.
Total Assets of $8.5 Billion; Total Loans of $4.9 Billion.
Regional bank offering retail and commercial banking, along
with wealth management, cash management, credit card
and mortgage services.
NASDAQ:
FIBK Market Cap: $1.3B
Company
Performance
Q1 2015 net income to common shareholders of $21.0
million, or $0.46 per share;
Pre-tax, Pre-Provision net income of $32.5 million, a 16.5%
increase from Q1 2014.
Recently announced 25% increase in dividend to $.20 per
share.
Continued improvement in credit quality trends
Page 25 |
 First Interstate
BancSystem Balance Sheet
Page 26
2015
2014
2014
2014
2014
BALANCE SHEET SUMMARIES
31-Mar
31-Dec
30-Sep
30-Jun
31-Mar
Assets:
Cash and cash equivalents
$
637,803
$
798,670
$
819,963
$
503,648
$
610,531
Investment securities
2,340,904
2,287,110
2,169,774
2,093,985
2,095,088
Total loans
4,927,306
4,897,443
4,854,382
4,506,362
4,364,838
Less allowance for loan losses
75,336
74,200
74,231
78,266
81,371
Net loans
4,851,970
4,823,243
4,780,151
4,428,096
4,283,467
Premises and equipment, net
192,748
195,212
207,181
180,341
179,942
Goodwill and intangible assets (excluding mortgage servicing
rights)
216,815
218,870
218,799
187,502
187,858
Company owned life insurance
154,741
153,821
152,761
138,899
138,027
Other real estate owned, net
15,134
13,554
18,496
16,425
16,594
Mortgage servicing rights, net
14,093
14,038
13,894
13,443
13,474
Other assets
104,334
105,418
100,333
89,040
92,844
Total assets
$
8,528,542
$
8,609,936
$
8,481,352
$
7,651,379
$
7,617,825
Liabilities and stockholders' equity:
Deposits:
Non-interest bearing
$
1,757,664
$
1,791,364
$
1,637,151
$
1,533,484
$
1,458,460
Interest bearing
5,210,495
5,214,848
5,322,348
4,645,558
4,676,677
Total deposits
6,968,159
7,006,212
6,959,499
6,179,042
6,135,137
Securities sold under repurchase agreements
462,073
502,250
432,478
462,985
488,898
Accounts payable, accrued expenses and other liabilities
58,335
72,006
63,713
51,456
48,770
Long-term debt
43,048
38,067
36,882
36,893
36,905
Subordinated debentures held by subsidiary trusts
82,477
82,477
102,916
82,477
82,477
Total liabilities
7,614,092
7,701,012
7,595,488
6,812,853
6,792,187
Stockholders' equity:
Common stock
310,544
323,596
321,132
283,697
286,553
Retained earnings
599,727
587,862
572,362
560,469
546,444
Accumulated other comprehensive income (loss)
4,179
(2534)
(7630)
(5640)
(7359)
Total stockholders' equity
914,450
908,924
885,864
838,526
825,638
Total liabilities and stockholders' equity
$
8,528,542
$
8,609,936
$
8,481,352
$
7,651,379
$
7,617,825 |
 First Interstate
BancSystem Income
Statement Page 27
2015
2014
INCOME
STATEMENT
SUMMARIES
1st Qtr
4th Qtr
3rd Qtr
2nd Qtr
1st Qtr
Net interest income
$
64,325
$
65,516
$
65,082
$
59,727
$
58,136
Net interest income on a fully-taxable equivalent ("FTE")
basis
65,381
66,585
66,129
60,806
59,243
Provision for loan losses
1,095
118
261
(2,001)
(5,000)
Non-interest income:
Other service charges, commissions and fees
9,867
11,429
10,458
9,699
9,156
Income from the origination and sale of loans
5,906
5,554
7,346
6,380
4,660
Wealth management revenues
4,937
4,775
5,157
4,609
4,455
Service charges on deposit accounts
3,944
4,432
4,331
3,929
3,875
Investment securities gains (losses), net
6
(19)
(8)
17
71
Other income
3,122
5,190
2,079
1,937
1,889
Total non-interest income
27,782
31,361
29,363
26,571
24,106
Non-interest expense:
Salaries and wages
25,349
23,717
25,914
24,440
22,442
Employee benefits
7,780
6,812
7,841
7,164
8,313
Occupancy, net
4,492
4,770
4,534
4,253
4,239
Furniture and equipment
3,793
4,120
3,338
3,157
3,201
Outsourced technology services
2,463
2,468
2,346
2,309
2,300
Other real estate owned income, net
(61)
(61)
(58)
(134)
(19)
Core deposit intangible amortization
854
855
688
354
354
Non-core expenses
70
2,368
5,052
597
—
Other expenses
14,852
16,604
15,303
13,780
13,508
Total non-interest expense
59,592
61,653
64,958
55,920
54,338
Income before taxes
31,420
35,106
29,226
32,379
32,904
Income taxes
10,440
12,330
10,071
11,302
11,511
Net income
$
20,980
$
22,776
$
19,155
$
21,077
$
21,393
Core net income**
$
21,020
$
24,260
$
22,302
$
21,438
$
21,349 |
 First Interstate
BancSystem Performance
Metrics Page 28
PER
COMMON
SHARE
DATA
Net income -
basic
$
0.46
$
0.50
$
0.43
$
0.48
$
0.49
Net income -
diluted
0.46
0.49
0.42
0.47
0.48
Core net income -
diluted
0.46
0.53
0.49
0.48
0.48
Cash dividend paid
0.20
0.16
0.16
0.16
0.16
Book value at period end
20.13
19.85
19.40
18.95
18.60
Tangible book value at period end**
15.36
15.07
14.61
14.71
14.37
OUTSTANDING
COMMON
SHARES
At period-end
45,429,468
45,788,415
45,672,922
44,255,012
44,390,095
Weighted-average
shares
-
basic
45,378,230
45,485,548
44,911,858
44,044,260
43,997,815
Weighted-average
shares
-
diluted
45,840,191
46,037,344
45,460,288
44,575,963
44,620,776
SELECTED
ANNUALIZED
RATIOS
Return on average assets
1.00
%
1.05
%
0.93
%
1.12
%
1.16
%
Core return on average assets**
1.00
1.12
1.09
1.14
1.16
Return on average common equity
9.38
10.09
8.55
10.18
10.74
Core return on average common equity**
9.40
10.75
9.96
10.36
10.72
Return on average tangible common equity**
12.35
13.34
11.17
13.16
14.00
Net FTE interest income to average earning assets
3.43
3.38
3.55
3.54
3.52 |
 First Interstate
BancSystem Asset Quality
Page 29
2015
2014
ASSET QUALITY
Mar 31
Dec 31
Sep 30
Jun 30
Mar 31
Allowance for loan losses
$
75,336
$
74,200
$
74,231
$
78,266
$
81,371
As a percentage of period-end loans
1.53
%
1.52
%
1.53
%
1.74
%
1.86
%
Net charge-offs (recoveries) during quarter
$
(41)
$
149
$
4,296
$
1,104
$
(1,032)
Annualized as a percentage of average loans
0.00
%
0.01
%
0.36
%
0.10
%
(0.10
)%
Non-performing assets:
Non-accrual loans
$
73,941
$
62,182
$
71,915
$
79,166
$
88,114
Accruing loans past due 90 days or more
5,175
2,576
1,348
1,494
1,664
Total non-performing loans
79,116
64,758
73,263
80,660
89,778
Other real estate owned
15,134
13,554
18,496
16,425
16,594
Total non-performing assets
94,250
78,312
91,759
97,085
106,372
As a percentage of:
Total loans and OREO
1.91
%
1.59
%
1.88
%
2.15
%
2.43
%
Total assets
1.11
%
0.91
%
1.08
%
1.27
%
1.40
% |