Attached files
| file | filename |
|---|---|
| 8-K - 8-K - PAR PACIFIC HOLDINGS, INC. | i8-knvestorpres5_2015.htm |

Investor Presentation May 2015
2 Forward-Looking Statements The information contained in this presentation has been prepared to assist you in making your own evaluation of the company and does not purport to contain all of the information you may consider important. Any estimates or projections with respect to future performance have been provided to assist you in your evaluation but should not be relied upon as an accurate representation of future results. Certain statements, estimates and financial information contained in this presentation constitute forward-- ‐looking statements. Such forward-looking statements involve known and unknown risks and uncertainties that could cause actual events or results to differ materially from the results implied or expressed in such forward-‐looking statements. While presented with numerical specificity, certain forward-looking statements are based (1) upon assumptions that are inherently subject to significant business, economic, regulatory, environmental, seasonal and competitive uncertainties, contingencies and risks including, without limitation, the ability to successfully integrate the Mid Pac acquisition, maintain adequate liquidity, realize the potential benefit of our net operating loss tax carryforwards, obtain sufficient debt and equity financings, capital costs, well production performance, operating costs, commodity pricing, differentials or crack spreads and other known and unknown risks (all of which are difficult to predict and many of which are beyond the company's control) some of which are further discussed in the company’s periodic and other filings with the SEC and (2) upon assumptions with respect to future business decisions that are subject to change. There can be no assurance that the results implied or expressed in such forward-looking statements or the underlying assumptions will be realized and that actual results of operations or future events will not be materially different from the results implied or expressed in such forward-looking statements. Under no circumstances should the inclusion of the forward-looking statements be regarded as a representation, undertaking, warranty or prediction by the company or any other person with respect to the accuracy thereof or the accuracy of the underlying assumptions, or that the company will achieve or is likely to achieve any particular results. The forward-looking statements are made as of the date hereof and the company disclaims any intent or obligation to update publicly or to revise any of the forward-looking statements, whether as a result of new information, future events or otherwise. Recipients are cautioned that forward-looking statements are not guarantees of future performance and, accordingly, recipients are expressly cautioned not to put undue reliance on forward-looking statements due to the inherent uncertainty therein.

3 Overview of Par Petroleum Hawaii Refining System • 94,000 bpd capacity refinery • 50% distillate yield configuration • 5.4 MM barrels of storage • 27 miles of clean / black oil product pipelines • Single Point Mooring (SPM) Hawaii Marketing System • Serve 128 retail locations • Tesoro, 76 & 7-Eleven brands • 8 refined product terminals Texadian Trading Arm • Historical shipper status on Express-Platte and Mustang-Enbridge pipelines • Terminal and dock access in St. Louis area to move Canadian crude Natural Gas Production (Piceance Energy 34%) • 40,165 net acres across Colorado's Piceance Basin • Over 3,500 available well locations held by production • Approximately 19% by volume is liquids Map of Hawaiian Operations: Integrated refiner and marketer in the Mid Pacific Refinery Terminal Retail brands on island
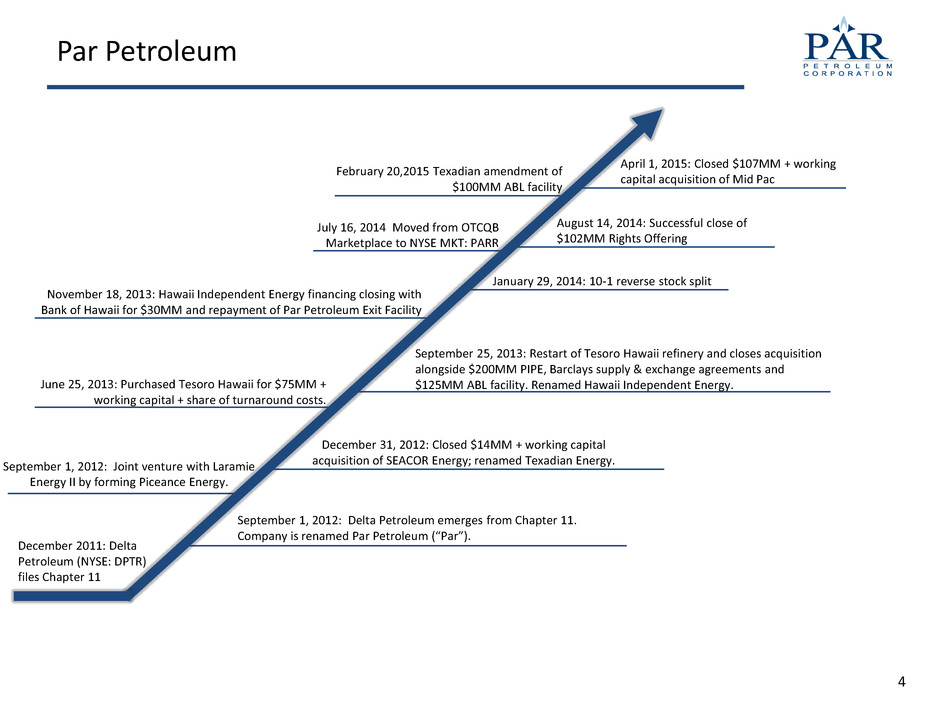
4 Par Petroleum December 2011: Delta Petroleum (NYSE: DPTR) files Chapter 11 September 1, 2012: Joint venture with Laramie Energy II by forming Piceance Energy. June 25, 2013: Purchased Tesoro Hawaii for $75MM + working capital + share of turnaround costs. November 18, 2013: Hawaii Independent Energy financing closing with Bank of Hawaii for $30MM and repayment of Par Petroleum Exit Facility April 1, 2015: Closed $107MM + working capital acquisition of Mid Pac July 16, 2014 Moved from OTCQB Marketplace to NYSE MKT: PARR September 1, 2012: Delta Petroleum emerges from Chapter 11. Company is renamed Par Petroleum (“Par”). December 31, 2012: Closed $14MM + working capital acquisition of SEACOR Energy; renamed Texadian Energy. September 25, 2013: Restart of Tesoro Hawaii refinery and closes acquisition alongside $200MM PIPE, Barclays supply & exchange agreements and $125MM ABL facility. Renamed Hawaii Independent Energy. January 29, 2014: 10-1 reverse stock split February 20,2015 Texadian amendment of $100MM ABL facility August 14, 2014: Successful close of $102MM Rights Offering
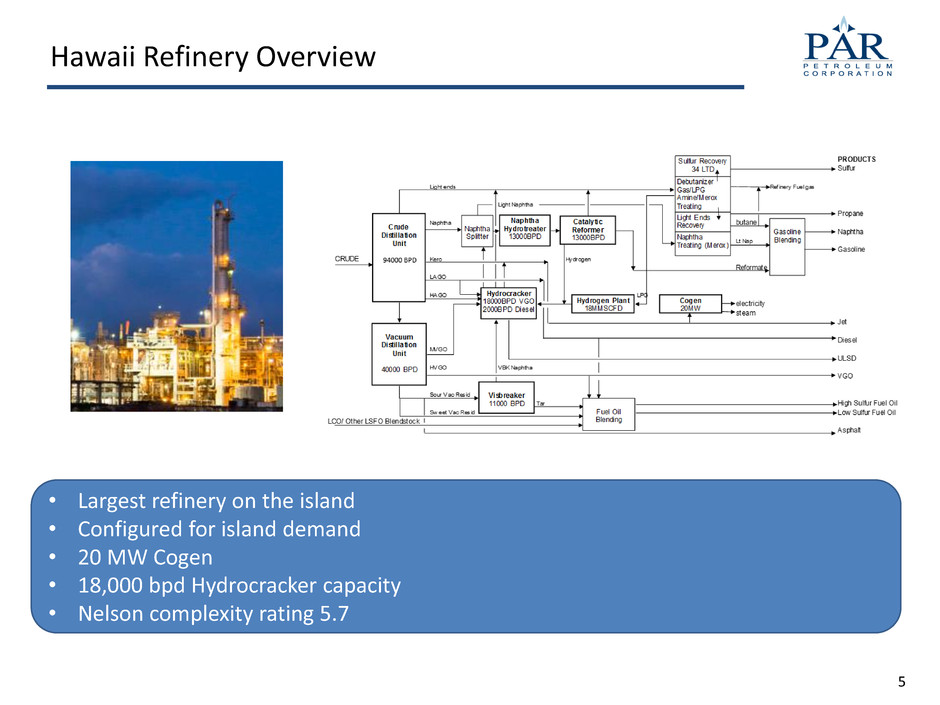
5 Hawaii Refinery Overview • Largest refinery on the island • Configured for island demand • 20 MW Cogen • 18,000 bpd Hydrocracker capacity • Nelson complexity rating 5.7

6 Hawaii Refinery Overview 1Q 2015 Crude Mix by Source 1Q 2015 Product Yield Crude flexibility and heavily weighted distillate configuration
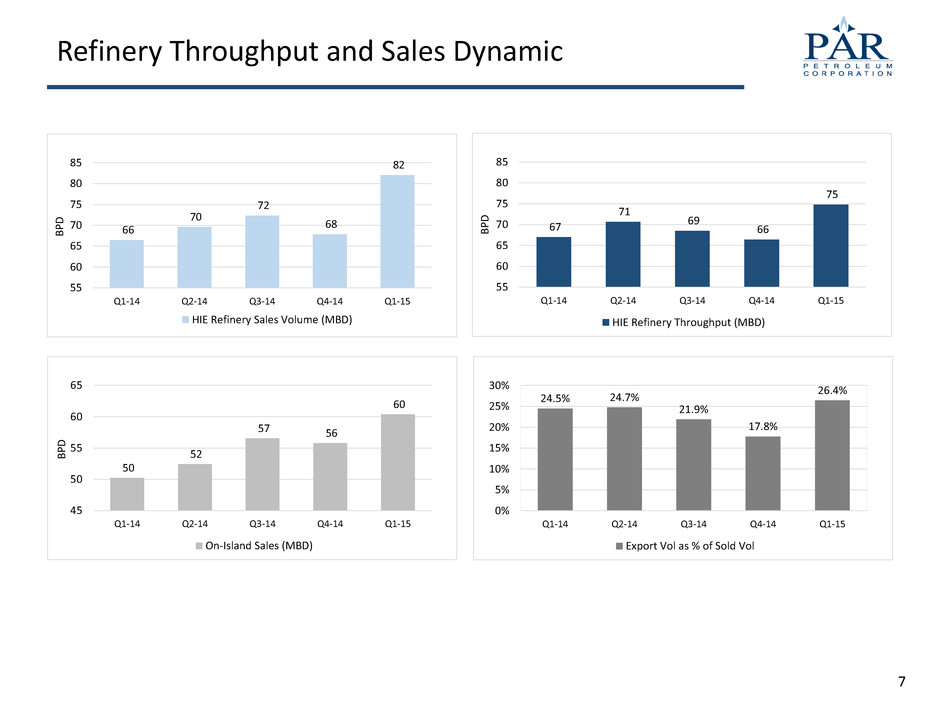
7 Refinery Throughput and Sales Dynamic 66 70 72 68 82 55 60 65 70 75 80 85 Q1-14 Q2-14 Q3-14 Q4-14 Q1-15 BP D HIE Refinery Sales Volume (MBD) 67 71 69 66 75 55 60 65 70 75 80 85 Q1-14 Q2-14 Q3-14 Q4-14 Q1-15 BP D HIE Refinery Throughput (MBD) 50 52 57 56 60 45 50 55 60 65 Q1-14 Q2-14 Q3-14 Q4-14 Q1-15 BP D On-Island Sales (MBD) 24.5% 24.7% 21.9% 17.8% 26.4% 0% 5% 10% 15% 20% 25% 30% Q1-14 Q2-14 Q3-14 Q4-14 Q1-15 Export Vol as % of Sold Vol

8 Retail and Logistics Retail Stores & Storage Capacity 77 9 17 12 30,000 bbls 185,000 Bbls 138,000 bbls 135,000 bbls 12,000 bblsLogistics • Single point mooring (SPM) one of only four import locations • 2.4MM barrels crude and 3MM barrels of product storage • 27 miles of clean / black oil product pipelines • 2 Barges delivering products to 8 refined product terminals and ocean vessels Marketing • Serve 128 retail locations • Total sales volume 135MM gallons/year (8,800 bpd) • Wholesale and bulk provider on the islands 1

9 Hawaii Market Refining need on island Hawaii Net Electricity Generation by Source * Based on company analysis On Island Demand 110-120 MBpdDistillate Import 5-15 MBpd Fuel Oil Export 5-15 MBpd Other Refinery 54 MBpd Par 94 MBpd 20-25 MBpd Source: EIA Source: DBEDT Visitor Arrivals by Air 2013-2015 estimated increase 4% (In thousands)

10 Market Dynamics North American crude production increase has supported Mid Pacific crude differentials * company calculation based on a 3 year average for the 4-1-2-1 Mid Pacific Crack Spread plus Mid Pacific Crude Blend Combined Mid Cycle* $8.43 Crude Differential $0.49 Purchased Refinery

11 Piceance Energy Overview • 40,165 net acres across Colorado’s Piceance Basin • Over 300 producing wells in one of the lowest cost gas weighted basins in the continental U.S. • Over 3,500 undeveloped locations held by production • 99% success rate on wells in basin • Current well costs of $1.25MM shows capability of creating a repeatable gas inventory with 20%+ IRR profile • 2015 exit production estimated to increase 33% to 60 MMcfe/d Company acreage Current Cost Structure 1.8 Bcf Gross EUR/Well $1.25MM D&C Cost Midpoint Nymex Gas Price ($/MMBtu) Oil Price ($/bbl) NGL Price ($/gal) NPV10 ($M/Well) IROR $2.00 $50.00 $0.36 (270) 4% $2.50 $50.00 $0.36 41 11% $3.00 $50.00 $0.36 352 18% $3.50 $50.00 $0.36 663 27% 3/6/2015 NYMEX Strip 807 29% $4.00 $50.00 $0.36 974 35% $4.50 $50.00 $0.36 1,285 44% $5.00 $50.00 $0.36 1,596 55% $5.50 $50.00 $0.36 1,907 70% $6.00 $50.00 $0.36 2,218 81% -20% 0% 20% 40% 60% 80% 100% (500) - 500 1,000 1,500 2,000 2,500 $2.0 0 $2.5 0 $3.0 0 $3.5 0 $4.0 0 $4.5 0 $5.0 0 $5.5 0 $6.0 0 IRO R NPV ($M ) NYMEX Gas Price ($/MMBtu) 21 Well Pad ($1.25MM/Well D&C) NPV10 ($M/Well) IROR Strip Pricing

12 1Q 2015 Balance Sheet Highlights • Total debt $112.5 million / Net debt ($11.8 million) • Total Cash balance $124.3 million • Total liquidity $206.3 million Summarized Consolidated Balance Sheet As of March 31, 2015 (in thousands) LIABILITIES AND STOCKHOLDERS' EQUITY Current portion of long-term debt $ 40,485 Other current liabilities 240,329 ASSETS Total current liabilities 280,814 Cash and cash equivalents $ 124,305 Long-term debt, excluding current portion 72,014 Other current assets 266,212 Other liabilities 40,696 Total current assets 390,517 Total liabilities 393,524 Other assets 297,072 Total stockholders' equity 294,065 Total assets $ 687,589 Total liabilities and stockholders' equity $ 687,589
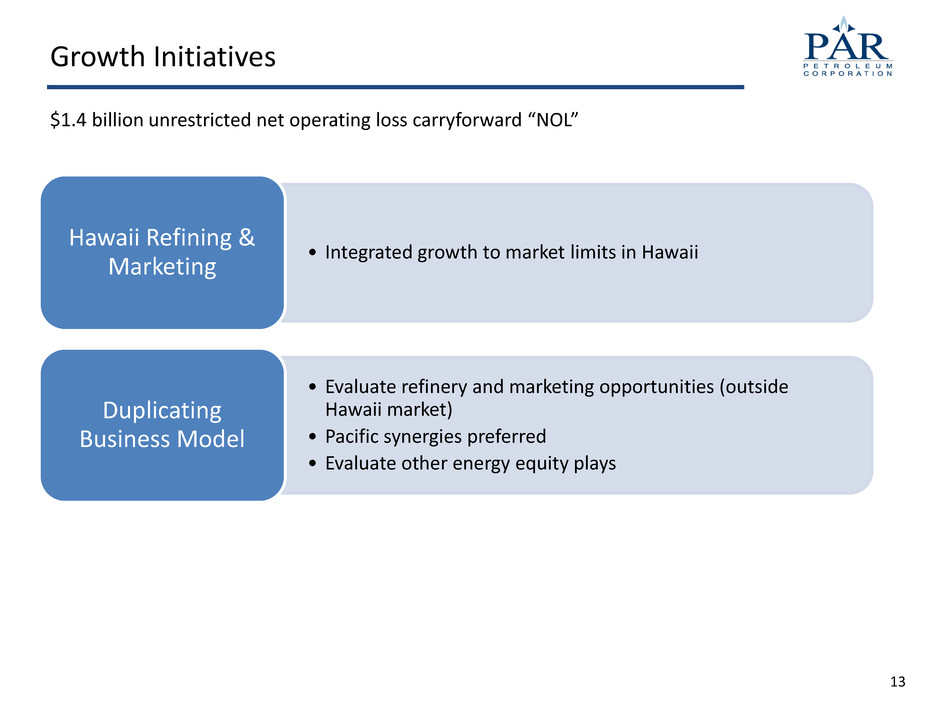
13 Growth Initiatives • Integrated growth to market limits in Hawaii Hawaii Refining & Marketing • Evaluate refinery and marketing opportunities (outside Hawaii market) • Pacific synergies preferred • Evaluate other energy equity plays Duplicating Business Model $1.4 billion unrestricted net operating loss carryforward “NOL”
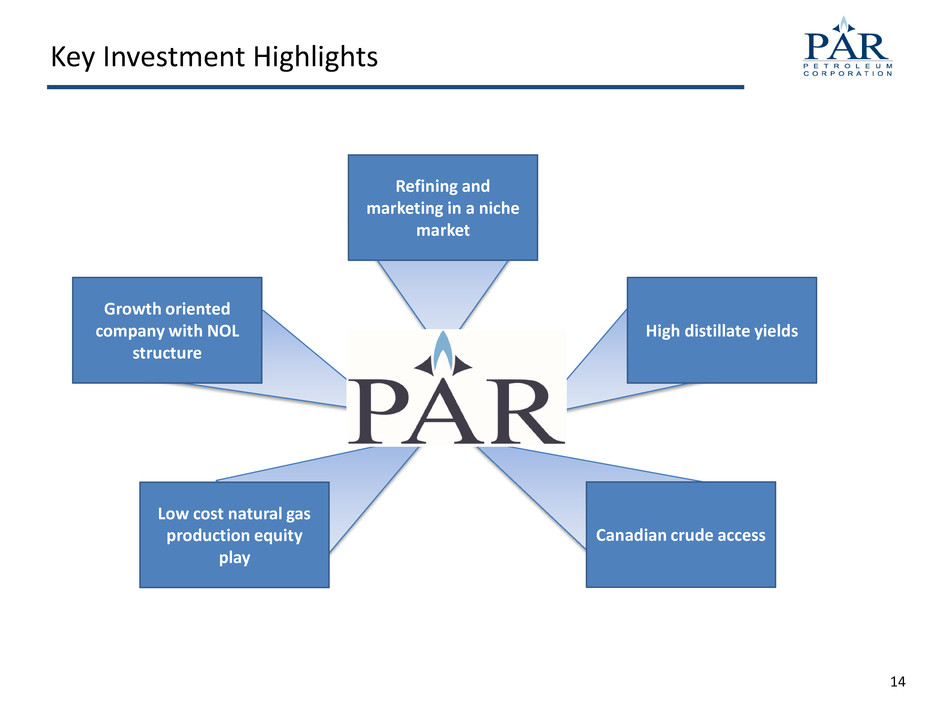
14 Key Investment Highlights Refining and marketing in a niche market High distillate yields Growth oriented company with NOL structure Low cost natural gas production equity play Canadian crude access
Appendix

16 Enhanced Operating Stats (1) Calculated using a ratio of 80% Singapore and 20% San Francisco indexes. (2) Weighted average differentials, excluding shipping costs, of a blend of crudes with an API of 31.98 and sulphur wt% of 0.65% that is indicative of our typical crude mix quality. (3) Management uses gross refining margin per barrel to evaluate performance and compare profitability to other companies in the industry. There are a variety of ways to calculate gross refining margin per barrel; different companies within the industry may calculate it in different ways. We calculate gross refining margin per barrel by dividing gross refining margin (revenues less feedstocks, purchased refined products, refinery fuel burn, and transportation and distribution costs) by total refining throughput. (4) Management uses production costs before DD&A expense per barrel to evaluate performance and compare efficiency to other companies in the industry. There are a variety of ways to calculate production cost before DD&A expense per barrel; different companies within the industry calculate it in different ways. We calculate production costs before DD&A expense per barrel by dividing all direct production costs by total refining throughput. (5) Calculated as gross refining margin less production costs before DD&A expense. Three Months Ended March 31, 2015 2014 Refining and Distribution Segment Total Crude Oil Throughput (Mbpd) 74.8 67.0 Source of Crude Oil: North America 45.9 % 52.3 % Latin America 13.1 % 29.4 % Africa 11.4 % 0.3 % Russia 20.9 % 5.2 % Middle East 8.7 % 12.8 % Total 100.0 % 100.0 % Yield (% of total throughput) Gasoline and gasoline blendstocks 27.1 % 23.7 % Distillate 44.5 % 37.7 % Fuel oils 21.0 % 33.4 % Other products 4.5 % 2.3 % Total Yield 97.1 % 97.1 % Refined product sales volume (Mbpd) On-island sales volume 60.4 50.2 Exports sale volume 21.7 16.3 Total refined product sales volume 82.1 66.5 4-1-2-1 Mid Pacific Crack Spread (1) $9.09 $6.84 Mid Pacific Crude Differential (2) $(2.42) $(0.69) Gross refining margin (in millions) $52.3 $19.1 Gross refining margin per bbl ($/throughput bbl) (3) $7.77 $3.17 Production costs before DD&A expense per barrel ($/throughput bbl) (4) $4.12 $4.53 Net operating margin per bbl ($/throughput bbl) (5) $3.65 $(1.36) Retail Segment Retail sales volumes (thousands of gallons) 12,166 11,336

17 Condensed Balance Sheet March 31, December 31, (in thousands) 2015 2014 ASSETS Cash and cash equivalents 124,305$ 89,210$ Restricted cash 749 749 Trade accounts receivable 64,780 112,968 Inventories 185,074 243,853 Prepaid and other current assets 15,609 14,009 Total current assets 390,517 460,789 Property and equipment Total property and equipment 128,916 124,445 Property and equipment, net 114,807 112,935 Long-term assets Investment in Piceance Energy, LLC 116,595 104,657 Other assets 65,670 62,626 Total assets 687,589$ 741,007$ LIABILITIES AND STOCKHOLDERS' EQUITY Current liabilities Current maturities of long-term debt 40,485$ 29,100$ Obligations under supply and exchange agreements 181,899 197,394 Accounts payable 21,891 33,064 Other accrued liabilities 36,539 51,248 Total current liabilities 280,814 310,806 Long-term liabilities Long-term debt, net of current maturities and unamortized discount 72,014 107,510 Other liabilities 40,696 30,532 Total liabilities 393,524$ 448,848$ Total stockholders' equity 294,065 292,159 Total liabilities and stockholders' equity 687,589$ 741,007$ Strong Capital Structure
