Attached files
| file | filename |
|---|---|
| 8-K - FORM 8-K - Del Taco Restaurants, Inc. | v410197_8k.htm |
| EX-99.2 - EXHIBIT 99.2 - Del Taco Restaurants, Inc. | v410197_ex99-2.htm |
Exhibit 99.1
Investor Presentation May 2015

i Disclaimer This Investor Presentation (the “Investor Presentation”) is for informational purposes only and does not constitute an offer to sell, a solicitation of an offer to buy, or a recommendation to purchase any equity, debt or other financial instruments of Del Taco Holdings, Inc . (“Del Taco” or the "Company") or Levy Acquisition Corporation (“LAC”) or any of Del Taco’s or LAC’s affiliates' securities (as such term is defined under the U . S . Federal Securities Laws) . This Investor Presentation has been prepared to assist interested parties in making their own evaluation with respect to the proposed business combination of Del Taco and LAC and for no other purpose . The information contained herein does not purport to be all - inclusive . The data contained herein is derived from various internal and external sources . No representation is made as to the reasonableness of the assumptions made within or the accuracy or completeness of any projections, modelling or back - testing or any other information contained herein . All levels, prices and spreads are historical and do not represent current market levels, prices or spreads, some or all of which may have changed since the issuance of this document . Any data on past performance, modeling or back - testing contained herein is no indication as to future performance . Del Taco and LAC assume no obligation to update the information in this Investor Presentation . Forward - Looking Statements This Investor Presentation includes financial forecasts, projections, and other forward - looking statements regarding Del Taco, its business and prospects that, unless other indicated, were provided by Del Taco to LAC, and are within the meaning of the “safe harbor” provisions of the United States Private Securities Litigation Reform Act of 1995 . Forward - looking statements may be identified by the use of words such as “anticipate”, “believe”, “expect”, “estimate”, “plan”, “outlook”, “target”, and “project” and other similar expressions that predict or indicate future events or trends or that are not statements of historical matters . Such forward - looking statements with respect to revenues, earnings, performance, strategies, prospects and other aspects of the businesses of LAC, Del Taco and the combined company after completion of the proposed business combination are based on current expectations that are subject to risks and uncertainties . Accordingly, actual results and performance may materially differ from results or performance expressed or implied by the forward - looking statements . These factors include, but are not limited to : ( 1 ) the occurrence of any event, change or other circumstances that could give rise to the termination of the Agreement and Plan of Merger for the business combination (the “Business Combination Agreement”) ; ( 2 ) the outcome of any legal proceedings that may be instituted against LAC, Del Taco or others following announcement of the Business Combination Agreement and transactions contemplated therein ; ( 3 ) the inability to complete the transactions contemplated by the Business Combination Agreement due to the failure to obtain approval of the stockholders of the LAC or other conditions to closing in the Business Combination Agreement ; ( 4 ) the risk that the proposed transaction disrupts current plans and operations as a result of the announcement and consummation of the transactions described herein ; ( 5 ) the ability of Del Taco to meet its financial and strategic goals, due to, among other things, competition, the ability of the combined company to grow and manage growth profitability, maintain relationships with suppliers and obtain adequate supply of products and retain its key employees ; ( 6 ) costs related to the proposed business combination ; ( 7 ) changes in applicable laws or regulations ; ( 8 ) the possibility that Del Taco may be adversely affected by other economic, business, and/or competitive factors ; and ( 9 ) other risks and uncertainties indicated from time to time in the proxy statement, including those under “Risk Factors” therein, and other filings with the Securities and Exchange Commission (“SEC”) by LAC . You are cautioned not to place undue reliance upon any forward - looking statements, which speak only as of the date made, and LAC and Del Taco undertake no obligation to update or revise the forward - looking statements, whether as a result of new information, future events or otherwise . Financial Presentation This presentation includes non - GAAP financial measures, including EBITDA and Adjusted EBITDA . EBITDA is calculated as earnings before interest and taxes (“EBIT”) plus depreciation and amortization (“EBITDA”) . Non - GAAP financial measures should not be considered as alternatives to generally accepted accounting principles in the United States of America (“GAAP”), measures such as net income, operating income, net cash flows provided by operating activities or any other GAAP measure of liquidity or financial performance . Adjusted EBITDA is calculated as net income (loss) before interest expense, provision for income taxes, depreciation, amortization and items that we do not consider representative of our ongoing operating performance . A reconciliation of net income (loss) to Adjusted EBITDA for Q 1 2015 , Q 1 2014 , Fiscal 2014 , 2013 and 2012 is set forth in the Appendix on page 33 . Furthermore, “Enterprise value” represents total enterprise value, which is calculated as equity value plus debt outstanding minus cash . For purposes of calculating Enterprise value, we have assumed that post Step 2 the enterprise value ( 1 ) will be $ 561 million . (1) Includes all estimated fees & expenses and founders shares . Excludes founder share earnout of 0.9375 million shares that are subject to forfeiture .
ii Del Taco believes that these non - GAAP measures of financial results provide useful information to management and investors regarding certain financial and business trends relating to Del Taco’s financial condition and results of operations . Del Taco’s management uses these non - GAAP measures to compare Del Taco’s performance to that of prior periods for trend analyses, for purposes of determining management incentive compensation, and for budgeting and planning purposes . These measures are used in monthly financial reports prepared for management and Del Taco’s board of directors . Del Taco believes that the use of these non - GAAP financial measures provides an additional tool for investors to use in evaluating ongoing operating results and trends and in comparing Del Taco’s financial measures with other similar companies, many of which present similar non - GAAP financial measures to investors . Management of Del Taco does not consider these non - GAAP measures in isolation or as an alternative to financial measures determined in accordance with GAAP . The principal limitation of these non - GAAP financial measures is that they exclude significant expenses and income that are required by GAAP to be recorded in Del Taco’s financial statements . In addition, they are subject to inherent limitations as they reflect the exercise of judgments by management about which expenses and income are excluded or included in determining these non - GAAP financial measures . In order to compensate for these limitations, management presents non - GAAP financial measures in connection with GAAP results . You should review Del Taco’s audited financial statements, which are presented in LAC’s preliminary proxy statement filed with the SEC, and not rely on any single financial measure to evaluate Del Taco’s business . The delivery of this this Investor Presentation does not at any time imply that there has been no change in the operations, financial condition, prospects, creditworthiness and status or affairs of LAC or Del Taco since the date shown on this document . LAC and Del Taco do not accept any liability whatsoever for any losses arising from the use of this document or reliance on the information contained herein . Nothing herein shall be deemed to constitute investment, legal, tax, financial, accounting or other advice . Additional Information In connection with the proposed business combination between Del Taco and LAC, LAC has filed with the SEC a preliminary proxy statement and will mail a definitive proxy statement and other relevant documents to LAC stockholders . This presentation does not contain all the information that should be considered concerning the proposed business combination . It is not intended to form the basis of any investment decision or any other decision in respect of the proposed business combination . LAC stockholders and other interested persons are advised to read, when available, the preliminary proxy statement and any amendments thereto, and the definitive proxy statement in connection with LAC’s solicitation of proxies for the special meeting to be held to approve the transactions contemplated by the proposed business combination because these materials will contain important information about Del Taco, LAC and the proposed transactions . The definitive proxy statement will be mailed to LAC stockholders as of a record date to be established for voting on the proposed business combination when it becomes available . Stockholders may obtain a copy of the preliminary proxy statement (and will be able to obtain a copy of the definitive proxy statement once it is available) , without charge, at the SEC’s website at http : //sec . gov or by directing a request to : Levy Acquisition Corp . , 444 North Michigan Avenue, Suite 3500 , Chicago, IL 60611 , attention : Sophia Stratton . This presentation shall not constitute a solicitation of a proxy, consent or authorization with respect to any securities or in respect of the proposed business combination . Participants in the Solicitation LAC and its directors and officers may be deemed participants in the solicitation of proxies to LAC’s stockholders with respect to the transaction . A list of the names of those directors and officers and a description of their interests in LAC is contained in LAC’s proxy statement for its 2014 annual meeting, which was filed with the SEC on November 21 , 2014 , and will also be contained in the preliminary proxy statement for the proposed business combination when it is filed with the Securities and Exchange Commission . Disclaimer (Continued)

Management Attendees Management Background Paul J.B. Murphy , III President & CEO ▪ Joined Del Taco in 2009 ▪ Former CEO & President of Einstein Noah Restaurant Group ▪ More than 30 years of restaurant experience with a focus on limited service chains and a proven track record for brand growth, strategic planning and operations Larry Levy Chairman of the Board for both LAC and Del Taco ▪ Over 37 years of experience in the food service industry ▪ Co - Founder and Former Chairman of Levy Restaurants, an international food service organization with over $ 1.0 billion in annual revenue ▪ Founder and Managing Partner of Levy Family Partners, which has made over 200 investments (including 30 in the restaurant/hospitality industry) Steven L. Brake EVP & CFO ▪ Joined Del Taco in 2003 and was promoted to CFO in 2010 ▪ Previously worked at Arthur Andersen and KPMG LLP John D. Cappasola, Jr . EVP & Chief Brand Officer ▪ Joined Del Taco in 2008 and was promoted to Chief Brand Officer in 2011 ▪ Previously spent 16 years with Blockbuster in strategic marketing and concept development, field marketing and various operational roles Ari Levy President & Chief Investment Officer of LAC ▪ Managing Partner of Levy Family Partners ▪ Managing Partner and Chief Investment Officer of Lakeview Investment Group, a multi - strategy hedge fund 1

Larry Levy: Proven Leader & Experienced Restaurateur Larry Levy Co - Founded Levy Restaurants in 1978 and Grew It from a Single Chicago Delicatessen into an International Food Service Company that Generates over $ 1 Billion in Revenue Operational and Investing Experience ; Deep restaurant and real estate experience focused on : ─ Guiding strategic decisions and growth ─ Credibly and creatively enhancing marketing strategy ─ Creating n urturing company culture ─ Leveraging vast global network to further develop strategic relationships Proven Ability as a Value Adding Partner Food Service 2
▪ Investment Highlights ▪ Growth Strategies ▪ Financial Overview ▪ Transaction Overview Agenda 3

Investment Highlights ▪ Leading Mexican QSR Chain with Loyal Following ▪ Successful New Brand Strategy: “Combined Solutions” in Early Stages ▪ Our Position: We Start with Fresh & Serve with Value ▪ Our Food: Un Freshing Believable® ▪ Our Menu: Diverse Menu Targets Broad Consumer Base ▪ Our Price: High Quality Food at a Tremendous Value ▪ Significant Whitespace for Growth in Both Existing and New Markets ▪ Attractive Financial Profile ▪ Proven & Experienced Management Team Delivering Results 4

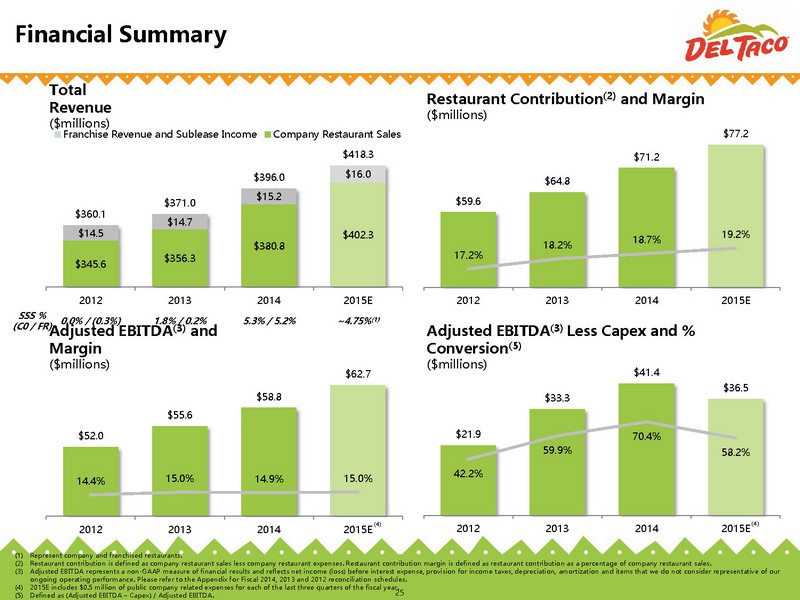
Del Taco at a Glance (1) Based on unit count. (2) Represents FY2014 data. ▪ #2 Mexican QSR concept in the U.S. (1) ▪ Regional icon on West Coast ▪ Differentiated menu showcases a mix of Mexican - inspired cuisine and American classics Our Concept Positioned for Growth ▪ Attractive balance of traffic and check growth driving sales momentum ▪ Strong unit economics ▪ Optimized balance sheet Key Statistics ▪ System - wide sales of $656 million (2 ) ▪ 304 Company / 242 Franchised Restaurants ▪ $1.2 million System - wide / $1.3 million Company Average Unit Volume (2) ▪ $ 6.49 System - wide Average Check (2 ) ▪ 11 consecutive quarters of Company - owned SSS Growth Regional Icon with Whitespace for Growth Significant Same Store Sales (“SSS”) Momentum 1.5 % 0.9 % 0.4 % 2.0 % 0.4 % 3.8 % 4.6 % 4.9 % 5.6 % 5.9 % 7.9 % 0.8% (0.2%) (1.7%) (0.1%) (1.3%) 2.7% 3.9% 4.6% 5.6% 5.6% 7.5% Q3 2012 Q4 2012 Q1 2013 Q2 2013 Q3 2013 Q4 2013 Q1 2014 Q2 2014 Q3 2014 Q4 2014 Q1 2015 Company-owned Franchised Implemented Combined Solutions 5 243 122 39 1 3 7 3 33 6 28 22 5 12 2 2 6 1 2 5 1 2 Company - owned: 304 Franchised: 241 (1 ) (1) Excludes one franchised restaurant in Guam.
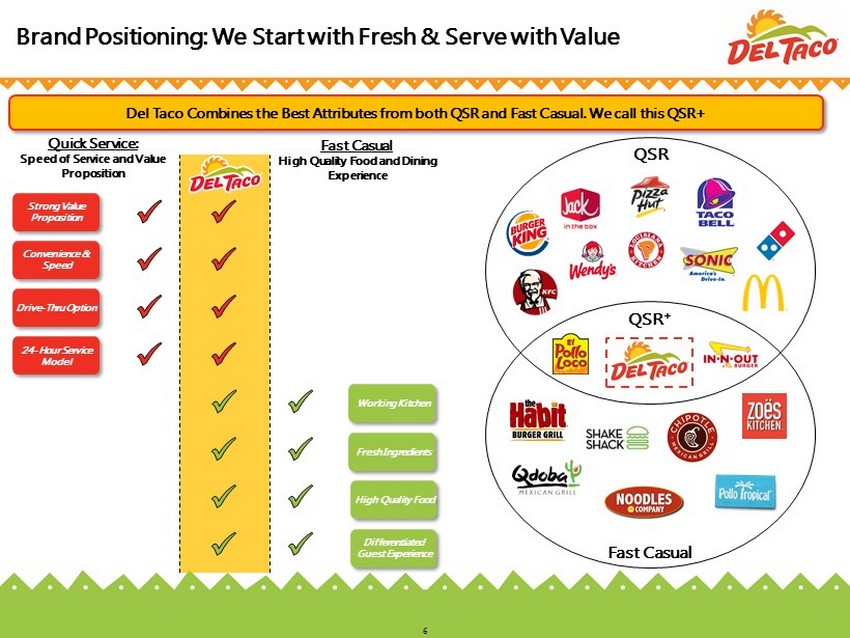
Brand Positioning: We Start with Fresh & Serve with Value Del Taco Combines the Best Attributes from both QSR and Fast Casual. We call this QSR+ Quick Service: Speed of Service and Value Proposition Fast Casual High Quality Food and Dining Experience Strong Value Proposition Convenience & Speed Drive - Thru Option 24 - Hour Service Model Working Kitchen Fresh Ingredients High Quality Food Differentiated Guest Experience QSR Fast Casual QSR + 6

Attractive Positioning in the Growing Mexican Category Mexican QSR 2014 System - wide Units System wide 2014 Sales ($millions) $8,200 $656 $730 $329 $316 $303 $81 $78 5,921 545 415 393 174 173 150 125 Source : Industry data provided by Technomic Top 500 report . (1) Represents Del Taco’s U.S. footprint. Excludes 1 franchised restaurant in Guam. (1) Value / Affordability Quality Positioned at the Intersection of Quality & Value ; Mexican limited service restaurants (“LSR”) sales are outperforming the broader restaurant industry ; Del Taco has a differentiated QSR + positioning with advantages over Taco Bell and Chipotle ─ Exceeds QSR standards by offering a high quality, fresh made - to - order menu ─ Advantages over Fast Casual concepts with superior convenience, speed and value proposition ($Billions) $18.0 $19.7 $21.4 2013 2014 2015E Top 500 LSR Mexican Sales $221.8 $230.7 $239.7 2013 2014 2015E Top 500 Total LSR Sales Favorable Industry Tailwinds 7

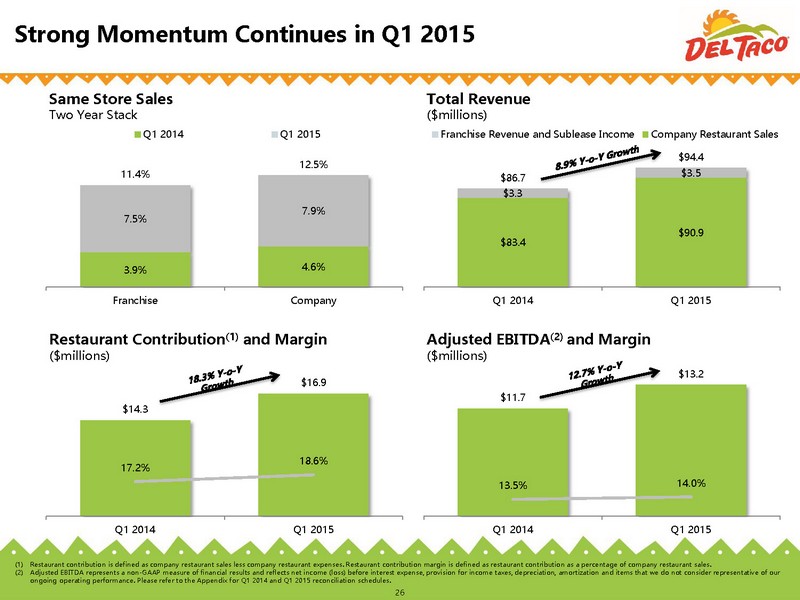
Accelerating Financial Performance Across the System 1.5% 0.9% 0.4% 2.0% 0.4% 3.8% 4.6% 4.9% 5.6% 5.9% 7.9% 0.8% (0.2%) (1.7%) (0.1%) (1.3%) 2.7% 3.9% 4.6% 5.6% 5.6% 7.5% Q3 2012 Q4 2012 Q1 2013 Q2 2013 Q3 2013 Q4 2013 Q1 2014 Q2 2014 Q3 2014 Q4 2014 Q1 2015 Company-operated Franchised Weighted QSR Average Same Store Sales Momentum Driven by Attractive Balance of Growth in Traffic and Check Source: Public company filings. Note: Weighted QSR average includes Burger King, Jack in the Box, Kentucky Fried Chicken, McDonald’s, Popeye’s, Sonic, Taco Bell and Wendy’s . Weighted average based on unit count. 8

; Real working kitchens ; High quality food made - to - order ─ Marinated chicken freshly grilled in restaurant ─ 100% real cheddar cheese grated fresh daily ─ Whole pinto beans slow cooked in our kitchens ─ Salsa made from scratch with fresh tomatoes and cilantro ; Working kitchens and made - to - order offerings support QSR+ positioning and provide competitive and structural cost advantages Our Food: Fresh and High Quality 9

Our Price: Compelling Value Proposition Priced at a Discount to Both QSR and Fast Casual Competitors $10.93 $10.17 $7.20 $6.83 $6.49 Average Check Sources: Average check data is from public company filings (JACK) and NPD (CMG and Taco Bell). 10

High Quality Food at a Tremendous Value Source: Company internal price survey as well as self - conducted survey of Los Angeles restaurant prices as of February 2015 and are subject to change. Freshly grilled chicken, seasoned black beans, diced onions, fresh cilantro, and handmade pico de gallo, served over Fresca Lime rice Pollo Asado Grilled Chicken Bowl Chicken Cantina Bowl Menu Item Description Price $4.00 Fire - grilled chicken , lettuce , guacamole, pico de gallo, avocado ranch dressing, cheddar cheese and cool sour cream, all served with Latin rice and black beans Chicken Burrito Bowl $4.99 $6.70 Freshly grilled chicken, choice of cilantro - lime rice, pinto or black beans, salsa, cheese and sour cream Grilled Chicken Taco Chicken Soft Taco Freshly grilled, marinated chicken, savory secret sauce, crisp lettuce, and freshly hand - grated cheddar cheese, in a warm flour tortilla Menu Item Description Price $1.00 A warm, soft flour tortilla filled with shredded chicken, topped with crisp lettuce and real cheddar cheese Chicken Burrito $1.87 $6.70 Flour tortilla, choice of cilantro - lime rice, pinto or black beans, grilled chicken, salsa and cheese or sour cream Epic Chicken Chipotle Ranch Marinated grilled chicken, fresca lime rice, tangy chipotle and cool ranch sauces, crisp bacon, freshly - grated cheddar cheese, crisp lettuce, tangy guacamole and handmade pico de gallo salsa $4.99 11

Foundation of Our Model: Combined Solutions Accelerating Operations Improvements Best Practice Improvement Fresh Value Pricing Platform New Engagement Platform & Advertising Campaign Guest Experience Measurement Menu and New Product Development Ambience Shake - Up Reimaged Stores with New Fresh Image Create a dramatically better guest experience Elevate the brand promise through new positioning, products and branded platforms Holistic Strategy Implemented in April 2013 that was Designed to Leverage Brand Strengths & Align Guest Experiences with an Elevated Brand Promise 12
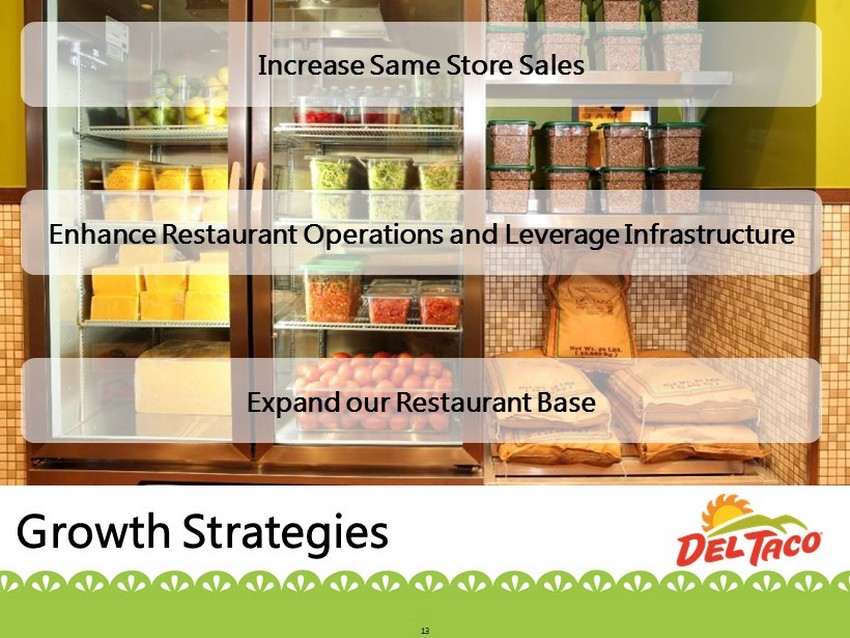
Increase Same Store Sales Expand our Restaurant Base Enhance Restaurant Operations and Leverage Infrastructure Growth Strategies 13

Increasing SSS through Our Tiered Menu Strategy Buck & Under® Leverages Price Variety to Drive Traffic and Build Check Profit Growth Mid - Tier Leverages Variety and Targets Occasions to Grow Check Premium Leverages Freshness and Quality to Drive New Growth 14 Tiered Menu Strategy Provides Something for All Budgets and Dining Occasions
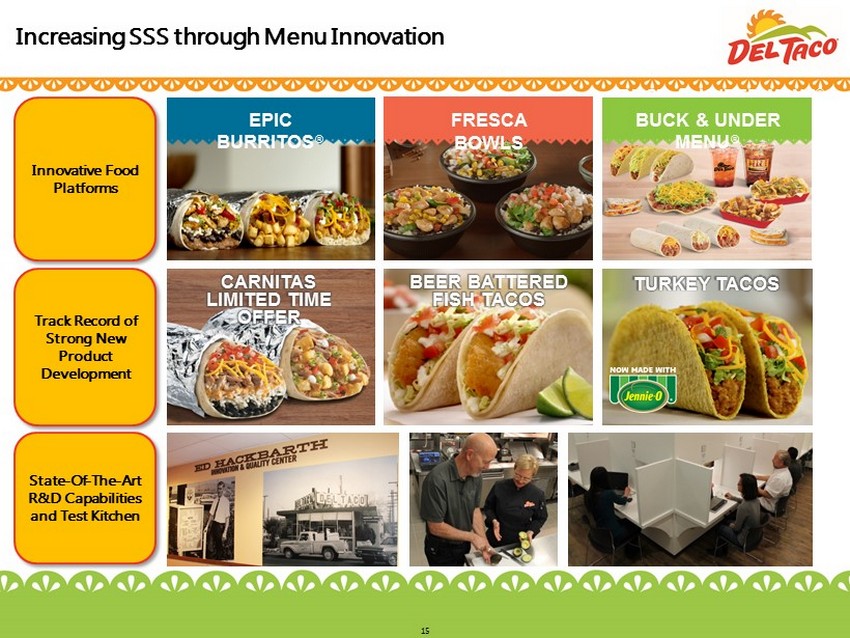
Increasing SSS through Menu Innovation Innovative Food Platforms Track Record of Strong New Product Development State - Of - The - Art R&D Capabilities and Test Kitchen BUCK & UNDER MENU ® EPIC BURRITOS ® FRESCA BOWLS BUCK & UNDER MENU ® CARNITAS LIMITED TIME OFFER BEER BATTERED FISH TACOS TURKEY TACOS 15

Increasing SSS through Day - Part and Occasion Expansion Late - Night Day - Part ; Aligned day - part with brand position combined with leveraging value and new product platforms ; Expanded breakfast menu with Mid - Tier and Premium offerings Epic Scrambler Burrito Bacon & Egg Quesadilla Breakfast Day - Part #Never2Late4Del Occasion Expansion 16

Increasing SSS through Guest Engagement High Quality Food Fresh Ingredients Working Kitchen Value Affordability Speed & Convenience Changing the Conversation Surrounding Del Taco from Price Value to Quality… We Start with Fresh… …And Serve with Value “I’ve been going to Del Taco for years and I didn’t know they prepared the food fresh, on site… unbelievable .” - Food for Fueler “A freshly prepared bean and cheese burrito for $0.69, that’s unbelievable .” - Fast Food Fanatic “A 42 pound block of cheese, shredded throughout the day? Unbelievable .” - Fast Food Fanatic Latent Strengths Known Strengths In the Restaurant… On the Packaging… And in External Marketing Crunchtada ; Pa ckaging ; ; Featured ; #Crunchtada ; to ; fur ther ; con s umer ; enga g ement ; Crunchtada ; Pa ckaging ; ; Featured ; #Crunchtada ; to ; fur ther ; con s umer ; enga g ement ; Featured #CrunChtada to Further Consumer engagement 17

Increasing and Sustaining SSS through Our Ambiance Shake - Up ; Ambience Shake - Up: High impact restaurant reimage program focused on critical guest - facing elements ─ Exterior refresh and interior upgrades signaled change and communicated Fresh, Quality and Value ; 100% of Company - owned restaurants completed by Summer 2013 and 85% of system - wide restaurants reimaged to date Revitalized Exteriors Visual “Freshness Cues” More Inviting Dining Space 18

Operations Improvements Creating a Better Guest Experience ; We significantly improved overall guest satisfaction and generated higher “likelihood to return” and “recommend” scores among targeted guest segments through operations - focused Combined Solutions elements Best Practice Improvement Accelerating Operations Improvement Guest Experience Measurement 19 Balanced Scorecard Focused on Top and Bottom Line ; Improvements being driven by an operating system that provides a consistent framework for planning , execution and measurement Guest Top Box Rating Improvement

Accelerating Our Unit Growth ; 50-year heritage in core Southern California market with strong brand presence and meaningful new unit in-fill upside ─ Success in multiple markets beyond Southern California, including Sacramento , Las Vegas, Denver, Salt Lake City and Phoenix ; Near - term growth will largely be focused in lower - risk existing markets that leverage Del Taco’s brand awareness, scale and efficiencies ; Significant in - fill opportunity with 400+ company and franchise restaurant identified in established markets (1) In - Fill Opportunities ; Selectively enter new geographies with attractive demographics ─ Multiple new untapped markets identified in a study prepared by a leading national consulting firm ; Clustering of locations in new market entry to drive brand awareness and establish local critical mass New Markets ; Continue to grow franchise base through both existing franchisees and the recruitment of new franchisees ; Del Taco has recently announced new franchise development agreements in New Jersey in addition to a robust pipeline of existing franchise development agreements ; Outreach efforts through brand public relations, trade shows , publications and lead generation has stimulated an increase in attendance and pace of Discovery Days Franchise Growth ; Serves as a catalyst to attract well qualified franchisees to accelerate growth in established and emerging markets ; Provides flexibility to optimize the existing restaurant base to generate recurring revenue and cash flows while driving margin improvement and a migration toward a more asset light model Strategic Refranchising Opportunity (1) Based on internal analysis and a study prepared by a leading national consulting firm. 20

Significant Unit Growth Opportunity Source: Public company filings. (1) Based on internal analysis and a study prepared by a leading national consulting firm . (2) Excludes 1 franchised restaurant in Guam. Percentage of Domestic Potential Unit Growth Remaining 82% 73% 68% 56% 26% 0% 25% 50% 75% 100% Unit Potential 2,000+ 2,300 2,000 4,000 8,000 # of States 16 5 47 44 50 Units 545 (2) 415 641 1,755 5,921 (1) 545 400+ 1,055 2,000+ Existing U.S. Footprint Established Market Opportunity Emerging / New Markets Opportunity Total U.S. Store Potential Del Taco’s New Restaurant Opportunity Total U.S. Store Potential of 2,000+ Stores, Including 400+ Additional Units in Established Markets 21

Our New Restaurant Prototype ; Design aligns brand Identity and QSR+ positioning ; Provides restaurant design needed to execute growth strategy ; New restaurant incorporates: ─ Modern exterior with attractive interior features ─ Quality cues evolved to include freshness cooler ─ More open view of our fresh cooking processes ─ Flexible prototype with potential sizes of 2,000 – 2,400 square feet 22

Year 3 Target ($Thousands) Average Unit Volume ~$1,350 Restaurant Contribution Margin (1) ~17% Net Investment Cost ~$900 Cash - on - Cash Return ~25% Attractive Company - Operated Unit Economic Model 23 (1) Restaurant contribution is defined as company restaurant sales less company restaurant expenses. Restaurant contribution margin is defined as restaurant contribution as a percentage of company restaurant sales.

Financial Overview 24
28
29

Industry Leading Food Cost Management 27 29.7% 29.6% 29.1% 28.6% 2012 2013 2014 Q1 2015 Historical Food Costs as a Percentage of Company Restaurant Sales 2014 Food Costs as a Percentage of Company Restaurant Sales 28.7% 29.1% 29.7% 30.3% 30.3% 31.8% 32.6% 32.7% 33.7% 34.6% This image cannot currently be displayed. Sources: Public company filings and Wall Street Research.

Post Step 1 Closing As Adjusted Post Step 2 Close (1) ($millions) 2014A As of 3/20/2015 As of 3/20/2015 - Assuming No Redemptions Cash & Cash Equivalents $8.6 $8.4 $8.4 Revolving Credit Facility (2) -- 10.0 -- Term Loan Facility (Including Accrued / Unpaid Interest) 203.8 228.5 173.5 Capital Leases and Deemed Landlord Financing 17.9 17.5 17.5 Total Senior Debt $221.7 $256.0 $191.0 OpCo Senior Subordinated Notes 35.9 -- -- HoldCo Senior Subordinated Notes 72.2 -- -- Total Debt $329.8 $256.0 $191.0 Total Debt / 2014 Adjusted EBITDA 5.6x 4.4x 3.2x 2014 Adjusted EBITDA $58.8 $58.8 $58.8 Total Debt / Estimated 2015 Adjusted EBITDA (3) 5.3x 4.1x 3.0x Estimated 2015 Adjusted EBITDA (3) $62.7 $62.7 $62.7 28 Optimized Balance Sheet for Future Growth (1) Assumes no free cash flow generation in time elapsed between closing of step 1 and step 2. (2) Revolving Credit Facility commitment is $40.0 million . (3) Includes estimated public company expenses per management estimates. ; Transaction dramatically reduces Del Taco’s overall debt balance and cost of debt, creating interest savings of over $13 million after Step 1 and with potential to further delever by approximately one full turn of Adjusted EBITDA after Step 2

Transaction Overview 29

Transaction Overview: Designed to De - Risk Merger Transaction Summary ; Step 1 closed on March 20, 2015 ; Preliminary proxy statement filed with the SEC on April 2, 2015 and amendment filed May 11, 2015 ; Shareholder Vote and Completion of Step 2 expected in late June or early July 2015 Timing ; Del Taco has signed a definitive agreement to merge with a subsidiary of Levy Acquisition Corp. (formally NASDAQ:“LEVY”). The merged company will retain Del Taco’s name and currently trades under the NASDAQ ticker: “TACO” ; Transaction was structured to de - risk the closing by means of a two - step transaction Step 1: Recapitalization of Del Taco Step 2: Public Merger Resulting in Del Taco Becoming Publicly Traded ; LAC acquisition of Del Taco at the same valuation as the investment by the Levy Newco Parties ; Private investors (“Step 2 Co - Investors”) will invest an additional $35 million at $10.00 per share into the merged company, which will be used to fund the cash portion of the merger consideration . The transaction implies an enterprise value (1) of $ 561 million or 8.9x estimated 2015 Adj . EBITDA for the merged company ; Our $150 million of cash in Trust, after redemptions, will be used according to the following waterfall: 1 st : Pay Step 2 transaction fees and expenses 2 nd : Acquire up to $60 million of incremental shares of Del Taco from legacy Del Taco shareholders 3 rd : General corporate purposes including potential further pay down of senior debt ; The Levy Family and a group of strategic investors (“Levy Newco Parties”) invested $120 million in Del Taco as part of the Step 1 recapitalization ; Levy Newco Parties’ investment and additional senior debt delevered Del Taco by retiring approximately $111 million of 13% PIK Subordinated Notes ; Larry Levy named Chairman of Del Taco (1) Includes all estimated fees & expenses and founders shares. Excludes founder share earnout of 0.9375 million shares that are subject to forfeiture. 30 ; Del Taco’s senior executives were given the opportunity to substantially cash out at the merger, but each has elected to disproportionately re - invest their equity into the public company ; Larry Levy’s Family Office and children contributed over $17 million into Del Taco at Step 1 with no promote or added benefits ; A majority of the future Board is affiliated with significant stockholders of the Company, as well as being highly credentialed Committed Stakeholders

Illustrative Transaction Terms Step 1 - Sources and Uses Capitalization ( Estimated ) Pro Forma Ownership (1) (Estimated) 8.4% 12.0% 30.7% 9.2% 39.6% Levy Family Entities Legacy Del Taco Shareholders Non-Levy Family Step 1 Investors Step 2 Co-Investors LAC Public Shareholders (1) Assumes a share price of $10.00. (2) Includes 1.4 million of founders shares and 0.46 million earnout promote shares that vest at $13.00 / share. (3) Includes 1.4 million of founders shares and 0.48 million earnout promote shares that vest at $13.00 / share. (4) Assumes treasury stock method for calculating dilution impact of warrants. (5) $24 represents share price at which public warrants can be called for redemption. Step 2 - Sources and Uses (Estimated) (2) (3) 31 (5) (2) (3) (shares and dollars in millions) Sources of Funds ($millions) LAC Cash in Trust $150.0 Additional New Investor Equity 35.0 Issuance of New Unregistered Shares 165.5 Total Sources of Funds $350.5 Uses of Funds ($millions) Estimated Cash for Redemptions $0.0 Estimated Step 2 Fees & Expenses 25.0 Reduce Seller Roll-over Equity 95.0 Potential Term Loan Paydown 65.0 Exchanging Del Taco Holdings for LAC 165.5 Total Uses of Funds $350.5 (4) (4) Sources of Funds ($millions) Rollover Term Loan and Unpaid / Accrued Interest $203.4 Revolver 10.0 Term Loan Add-on 25.1 New Investor Equity 120.0 Seller Rollover Equity 140.5 Rollover Capital Leases 17.5 Cash from Balance Sheet 9.0 Total Sources of Funds $525.6 Uses of Funds ($millions) Rollover Term Loan and Unpaid / Accrued Interest $203.4 Rollover Capital Leases 17.5 Retire Subordinated Debt 111.2 Purchase Shares of Del Taco (Seller Cash-out) 28.8 Remaining Equity Value Rollover 140.5 Estimated Tax Withholding on Vested Management Equity 7.5 Step 1 Fees & Expenses 8.2 Excess Cash on Balance Sheet 8.4 Total Uses of Funds $525.6 At $10.00 / Share At $13.00 / Share At $24.00 / Share Shares % Shares % Shares % Levy Family Entities 3.2 8.4% 3.7 9.1% 3.7 8.1% Net Shares from Warrant Exercise 0.0 0.0% 0.5 1.4% 2.5 5.5% Legacy Del Taco Shareholders 4.6 12.0% 4.6 11.3% 4.6 10.1% Non-Levy Family Step 1 Investors 11.6 30.7% 12.1 30.1% 12.1 26.8% Step 2 Co-Investors 3.5 9.2% 3.5 8.7% 3.5 7.7% LAC Public Shareholders 15.0 39.6% 15.0 37.3% 15.0 33.2% Net Shares from Warrant Exercise 0.0 0.0% 0.9 2.2% 3.9 8.6% Total Shares Outstanding 37.9 100.0% 40.2 100.0% 45.2 100.0% Total Equity Value $378.7 $522.8 $1,084.4 Revolver and Term Loan, Net of Cash $165.2 $165.2 $165.2 Capital Leases 17.5 17.5 17.5 Total Net Debt $182.7 $182.7 $182.7 Total Capitalization $561.3 $705.5 $1,267.1
Appendix 32

Adjusted EBITDA Reconciliation ($Thousands) Twelve Weeks Ended Fiscal Year Ended March 24, 2015 March 25, 2014 2014 2013 2012 Net Loss $(4,940) $(1,887) $(9,255) $(6,539) $(8,222) Non - GAAP adjustments: Provision for income taxes 458 440 1,098 80 1,939 Interest expense, net 6,811 7,993 30,895 35,613 38,291 Depreciation and amortization 3,792 4,588 18,752 19,850 17,699 EBITDA $6,121 $11,134 $41,490 $49,004 $49,707 Stock based compensation expense (1) 532 287 954 1,290 3,087 (Gain) / Loss on Disposal of Assets (2) -- (199) (151) 209 35 Impairment of long - lived assets (3) -- -- 9,617 -- -- Restaurant Closure Charges, net (4) 22 28 82 298 716 Debt Modification Costs (5) 135 -- 1,241 4,178 -- Transaction Costs (6) 6,316 -- 1,936 -- -- Change in Fair Value of Warrant Liability (7) (35) -- 1,417 33 (2,634) Pre - opening Costs (8) 119 105 462 596 1,080 Insurance reserves adjustment (9) -- 362 1,800 -- -- Adjusted EBITDA $13,210 $11,717 $58,848 $55,608 $51,991 (1) Includes non - cash, stock - based compensation. (2) Loss on disposal of assets includes the loss on disposal of assets related to retirements and replacement or write - off of leaseh old improvements or equipment. (3) Includes costs related to impairment of long - lived assets. (4) Includes costs related to closing restaurants, consisting solely of accretion expense during Q1 2014 and Q1 2015. (5) Includes costs associated with our debt refinancing transactions in April 2013 and April 2014 . (6) Includes costs related to the strategic sale process which commenced during 2014 and resulted in the stock purchase agreement with Levy Acquisition Company. (7) Relates to our fair value adjustments to the outstanding warrants issued to GSMP . (8) Pre - opening costs consist of costs directly associated with the opening of new restaurants and incurred prior to opening, includ ing restaurant labor, supplies, rent expense and other related pre - opening costs. These are generally incurred over the three to five months prior to opening . (9) Includes a $1.8 million increase in workers’ compensation expense during Fiscal 2014 due to higher payments and reserves related to underlying claims activity. 33