Attached files
| file | filename |
|---|---|
| EXCEL - IDEA: XBRL DOCUMENT - China Green Agriculture, Inc. | Financial_Report.xls |
| EX-31.1 - EXHIBIT 31.1 - China Green Agriculture, Inc. | v409309_ex31-1.htm |
| EX-31.2 - EXHIBIT 31.2 - China Green Agriculture, Inc. | v409309_ex31-2.htm |
| EX-32.1 - EXHIBIT 32.1 - China Green Agriculture, Inc. | v409309_ex32-1.htm |
UNITED STATES
SECURITIES AND EXCHANGE COMMISSION
WASHINGTON, D.C. 20549
FORM 10-Q
(Mark One)
| x | QUARTERLY REPORT PURSUANT TO SECTION 13 or 15(d) OF THE SECURITIES EXCHANGE ACT OF 1934. |
For the quarterly period ended March 31, 2015
| ¨ | TRANSITION REPORT PURSUANT TO SECTION 13 OR 15(d) OF THE SECURITIES EXCHANGE ACT OF 1934. |
For the transition period from ____________ to ____________
Commission File Number 001-34260
CHINA GREEN AGRICULTURE, INC.
(Exact name of registrant as specified in its charter)
| Nevada | 36-3526027 |
| (State or other jurisdiction of | (IRS Employer |
| incorporation or organization) | Identification No.) |
| 300 Walnut Street Suite 245 | ||
| Des Moines, IA 50309 | ||
| (Address of principal executive offices) (Zip Code) |
| (515) 897-2421 | ||
| (Issuer's telephone number, including area code) |
Indicate by check mark whether the issuer (1) filed all reports required to be filed by Section 13 or 15(d) of the Securities Exchange Act of 1934 during the preceding 12 months (or for such shorter period that the registrant was required to file such reports), and (2) has been subject to such filing requirements for the past 90 days. Yes x No ¨
Indicate by check mark whether the registrant has submitted electronically and posted on its corporate Web site, if any, every Interactive Data File required to be submitted and posted pursuant to Rule 405 of Regulation S-T (§232.405 of this chapter) during the preceding 12 months (or for such shorter period that the registrant was required to submit and post such files). Yes x No ¨
Indicate by check mark whether the registrant is a large accelerated filer, an accelerated filer, a non-accelerated filer, or a smaller reporting company. See the definitions of “large accelerated filer,” “accelerated filer” and “smaller reporting company” in Rule 12b-2 of the Exchange Act.
| Large accelerated filer ¨ | Accelerated filer x |
|
Non-accelerated filer ¨ ( Do not check if a smaller reporting company ) |
Smaller reporting company ¨ |
Indicate by check mark whether the registrant is a shell company (as defined in Rule 12b-2 of the Exchange Act). Yes ¨ No x
APPLICABLE ONLY TO CORPORATE ISSUERS:
Indicate the number of shares outstanding of each of the issuer's classes of common stock, as of the latest practicable date: 35,088,594 shares of common stock, $.001 par value, as of May 1, 2015.
TABLE OF CONTENTS
PART I – FINANCIAL INFORMATION
CHINA GREEN AGRICULTURE INC. AND SUBSIDIARIES
CONSOLIDATED CONDENSED BALANCE SHEETS
(UNAUDITED)
| March 31, 2015 | June 30, 2014 | |||||||
| ASSETS | ||||||||
| Current Assets | ||||||||
| Cash and cash equivalents | $ | 74,785,851 | $ | 26,890,321 | ||||
| Accounts receivable, net | 71,832,200 | 88,781,608 | ||||||
| Other receivable, net | 4,634,224 | 3,942,542 | ||||||
| Inventories | 123,627,598 | 75,486,898 | ||||||
| Prepaid expenses and other current assets | 605,939 | 480,432 | ||||||
| Advances to suppliers, net | 16,156,459 | 32,630,865 | ||||||
| Total Current Assets | 291,642,271 | 228,212,666 | ||||||
| Plant, Property and Equipment, Net | 45,608,632 | 48,061,611 | ||||||
| Other Receivables, Net of current portion | - | 2,628,361 | ||||||
| Deferred Asset, Net | 61,740,441 | 83,680,425 | ||||||
| Other Assets | 215,093 | 98,018 | ||||||
| Intangible Assets, Net | 24,166,706 | 25,225,143 | ||||||
| Goodwill | 5,236,030 | 5,203,986 | ||||||
| Total Assets | $ | 428,609,173 | $ | 393,110,210 | ||||
| LIABILITIES AND STOCKHOLDERS' EQUITY | ||||||||
| Current Liabilities | ||||||||
| Accounts payable | $ | 4,339,791 | $ | 3,378,248 | ||||
| Customer deposits | 26,108,848 | 25,700,586 | ||||||
| Accrued expenses and other payables | 4,823,644 | 4,309,073 | ||||||
| Amount due to related parties | 2,065,940 | 1,758,336 | ||||||
| Taxes payable | 8,346,523 | 1,921,455 | ||||||
| Short term loans | 21,438,080 | 24,002,720 | ||||||
| Total Current Liabilities | 67,122,826 | 61,070,418 | ||||||
| Commitment and Contingencies | ||||||||
| Stockholders' Equity | ||||||||
| Preferred Stock, $.001 par value, 20,000,000 shares authorized, zero shares issued and outstanding | - | - | ||||||
| Common stock, $.001 par value, 115,197,165 shares authorized, 35,088,594 and 32,362,534 shares issued and outstanding as of March 31, 2015 and June 30, 2014, respectively | 35,088 | 32,362 | ||||||
| Additional paid-in capital | 120,819,179 | 114,605,214 | ||||||
| Statutory reserve | 24,634,790 | 22,540,394 | ||||||
| Retained earnings | 190,995,744 | 172,021,331 | ||||||
| Accumulated other comprehensive income | 25,001,546 | 22,840,491 | ||||||
| Total Stockholders' Equity | 361,486,347 | 332,039,792 | ||||||
| Total Liabilities and Stockholders' Equity | $ | 428,609,173 | $ | 393,110,210 | ||||
The accompanying notes are an integral part of these unaudited consolidated condensed financial statements.
| 1 |
CHINA GREEN AGRICULTURE INC. AND SUBSIDIARIES
CONSOLIDATED CONDENSED STATEMENTS OF INCOME AND COMPREHENSIVE INCOME
(UNAUDITED)
| Three Months Ended March 31, | Nine Months Ended March 31, | |||||||||||||||
| 2015 | 2014 | 2015 | 2014 | |||||||||||||
| Sales | ||||||||||||||||
| Jinong | $ | 33,289,393 | $ | 30,210,579 | $ | 98,946,251 | $ | 88,261,203 | ||||||||
| Gufeng | 45,022,730 | 39,080,111 | 82,787,611 | 70,318,209 | ||||||||||||
| Yuxing | 1,175,092 | 1,005,291 | 3,106,317 | 2,654,517 | ||||||||||||
| Net sales | 79,487,215 | 70,295,981 | 184,840,179 | 161,233,929 | ||||||||||||
| Cost of goods sold | ||||||||||||||||
| Jinong | 13,623,964 | 12,174,848 | 39,318,627 | 37,013,941 | ||||||||||||
| Gufeng | 36,814,676 | 31,258,885 | 67,448,840 | 54,759,629 | ||||||||||||
| Yuxing | 858,058 | 701,533 | 2,298,767 | 1,978,441 | ||||||||||||
| Cost of goods sold | 51,296,698 | 44,135,266 | 109,066,234 | 93,752,011 | ||||||||||||
| Gross profit | 28,190,517 | 26,160,715 | 75,773,945 | 67,481,918 | ||||||||||||
| Operating expenses | ||||||||||||||||
| Selling expenses | 2,054,025 | 932,594 | 4,770,727 | 2,145,231 | ||||||||||||
| Selling expenses - amortization of deferred asset | 10,604,586 | 10,188,098 | 31,587,102 | 23,578,746 | ||||||||||||
| General and administrative expenses | 2,606,749 | 3,463,127 | 8,920,360 | 11,368,835 | ||||||||||||
| Impairment of assets | - | 1,659,729 | - | 1,659,729 | ||||||||||||
| Total operating expenses | 15,265,360 | 16,243,548 | 45,278,189 | 38,752,541 | ||||||||||||
| Income from operations | 12,925,157 | 9,917,167 | 30,495,756 | 28,729,377 | ||||||||||||
| Other income (expense) | ||||||||||||||||
| Other income (expense) | 10,651 | 65,563 | 57,355 | (120,877 | ) | |||||||||||
| Interest income | 161,625 | 37,587 | 229,979 | 114,675 | ||||||||||||
| Interest expense | (363,958 | ) | (472,104 | ) | (1,179,617 | ) | (1,009,528 | ) | ||||||||
| Total other income (expense) | (191,682 | ) | (368,954 | ) | (892,283 | ) | (1,015,730 | ) | ||||||||
| Income before income taxes | 12,733,475 | 9,548,213 | 29,603,473 | 27,713,647 | ||||||||||||
| Provision for income taxes | 2,817,281 | 2,339,082 | 6,372,760 | 6,450,322 | ||||||||||||
| Net income | 9,916,194 | 7,209,131 | 23,230,713 | 21,263,325 | ||||||||||||
| Other comprehensive income | ||||||||||||||||
| Foreign currency translation gain (loss) | 1,534,901 | (2,838,362 | ) | 2,161,055 | 803,434 | |||||||||||
| Comprehensive income | $ | 11,451,095 | $ | 4,370,769 | $ | 25,391,768 | $ | 22,066,759 | ||||||||
| Basic weighted average shares outstanding | 34,783,456 | 31,825,562 | 33,471,214 | 31,201,076 | ||||||||||||
| Basic net earnings per share | $ | 0.29 | $ | 0.23 | $ | 0.69 | $ | 0.68 | ||||||||
| Diluted weighted average shares outstanding | 34,783,456 | 31,825,562 | 33,471,214 | 31,201,076 | ||||||||||||
| Diluted net earnings per share | 0.29 | 0.23 | 0.69 | 0.68 | ||||||||||||
The accompanying notes are an integral part of these unaudited consolidated condensed financial statements.
| 2 |
CHINA GREEN AGRICULTURE INC. AND SUBSIDIARIES
CONSOLIDATED CONDENSED STATEMENTS OF CASH FLOWS
(UNAUDITED)
| Nine Months Ended March 31, | ||||||||
| 2015 | 2014 | |||||||
| Cash flows from operating activities | ||||||||
| Net income | $ | 23,230,713 | $ | 21,263,325 | ||||
| Adjustments to reconcile net income to net cash provided by operating activities | ||||||||
| Issuance of common stock and stock options for compensation | 4,344,098 | 6,703,781 | ||||||
| Depreciation and amortization | 35,902,903 | 23,327,564 | ||||||
| Impairment of assets | 1,659,729 | |||||||
| Loss on disposal of property, plant and equipment | 26,152 | - | ||||||
| Changes in operating assets | ||||||||
| Accounts receivable | 17,421,141 | (1,781,938 | ) | |||||
| Other current assets | (122,023 | ) | 8,004 | |||||
| Inventories | (47,471,638 | ) | (37,860,726 | ) | ||||
| Advances to suppliers | 16,603,898 | (1,056,615 | ) | |||||
| Other assets | (96,445 | ) | 27,485 | |||||
| Changes in operating liabilities | ||||||||
| Accounts payable | 938,026 | (348,288 | ) | |||||
| Customer deposits | 248,937 | 4,954,312 | ||||||
| Tax payables | 6,385,762 | (16,208,503 | ) | |||||
| Accrued expenses and other payables | 505,846 | 593,844 | ||||||
| Amount due to related parties | - | - | ||||||
| Net cash provided by operating activities | 57,917,370 | 1,281,974 | ||||||
| Cash flows from investing activities | ||||||||
| Purchase of plant, property, and equipment | (415,768 | ) | (1,127,458 | ) | ||||
| Proceeds from other receivables | 1,968,670 | - | ||||||
| Deferred assets | (9,228,043 | ) | (64,964,848 | ) | ||||
| Net cash used in investing activities | (7,675,141 | ) | (66,092,306 | ) | ||||
| Cash flows from financing activities | ||||||||
| Proceeds from the sale of common stock | 1,872,593 | - | ||||||
| Proceeds from loans | 19,702,970 | 28,633,885 | ||||||
| Repayment of loans | (22,403,790 | ) | (15,870,985 | ) | ||||
| Payment of dividends | (2,161,904 | ) | ||||||
| Advance from related party | 300,400 | 450,000 | ||||||
| Net cash provided by (used in ) financing activities | (2,689,731 | ) | 13,212,900 | |||||
| Effect of exchange rate change on cash and cash equivalents | 343,032 | 453,302 | ||||||
| Net increase (decrease) in cash and cash equivalents | 47,895,530 | (51,144,130 | ) | |||||
| Cash and cash equivalents, beginning balance | 26,890,321 | 75,031,489 | ||||||
| Cash and cash equivalents, ending balance | $ | 74,785,851 | $ | 23,887,359 | ||||
| Supplement disclosure of cash flow information | ||||||||
| Interest expense paid | $ | 1,179,637 | $ | 1,009,506 | ||||
| Income taxes paid | $ | 836,913 | $ | 22,658,825 | ||||
| Supplemental Disclosure of Non-Cash Financing Activities: | ||||||||
| Issuance 118,778 shares of common stock for repayment of amount due to related party | $ | - | $ | 525,000 | ||||
The accompanying notes are an integral part of these unaudited consolidated condensed financial statements.
| 3 |
CHINA GREEN AGRICULTURE, INC. AND SUBSIDIARIES
NOTES TO CONSOLIDATED FINANCIAL STATEMENTS
MARCH 31, 2015
NOTE 1 – ORGANIZATION AND DESCRIPTION OF BUSINESS
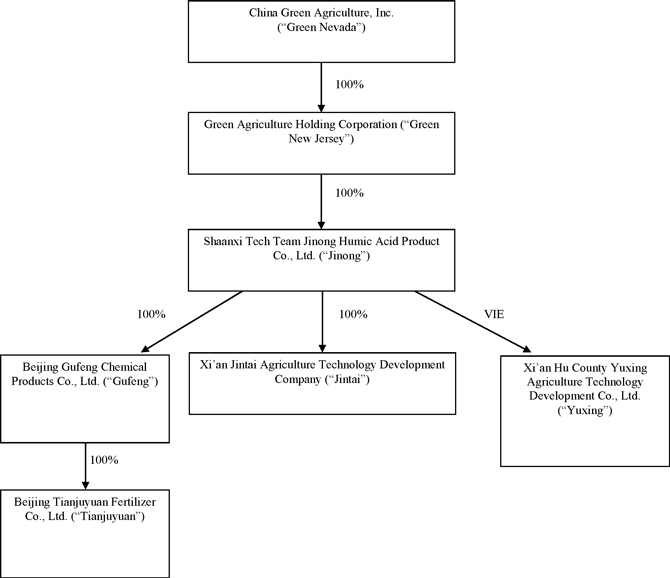
China Green Agriculture, Inc. (the “Company”, “Parent Company” or “Green Nevada”), through its subsidiaries, is engaged in the research, development, production, distribution and sale of humic acid-based compound fertilizer, compound fertilizer, blended fertilizer, organic compound fertilizer, slow-release fertilizers, highly-concentrated water-soluble fertilizers and mixed organic-inorganic compound fertilizer and the development, production and distribution of agricultural products.
Unless the context indicates otherwise, as used in the notes to the financial statements of the Company, the following are the references herein of all the subsidiaries of the Company (i) Green Agriculture Holding Corporation (“Green New Jersey”), a wholly-owned subsidiary of Green Nevada incorporated in the State of New Jersey; (ii) Shaanxi TechTeam Jinong Humic Acid Product Co., Ltd. (“Jinong”), a wholly-owned subsidiary of Green New Jersey organized under the laws of the PRC; (iii) Xi’an Jintai Agriculture Technology Development Company (“Jintai”), wholly-owned subsidiary of Jinong in the PRC, (iv) Xi’an Hu County Yuxing Agriculture Technology Development Co., Ltd. (“Yuxing”), a Variable Interest Entity (“VIE”) in the PRC controlled by Jinong through contractual agreements; (v) Beijing Gufeng Chemical Products Co., Ltd., a wholly-owned subsidiary of Jinong in the PRC (“Gufeng”), and (vi) Beijing Tianjuyuan Fertilizer Co., Ltd., Gufeng’s wholly-owned subsidiary in the PRC (“Tianjuyuan”).
The Company’s corporate structure as of March 31, 2015 is set forth in the diagram below:
| 4 |
CHINA GREEN AGRICULTURE, INC. AND SUBSIDIARIES
NOTES TO CONSOLIDATED FINANCIAL STATEMENTS
MARCH 31, 2015
The unaudited consolidated financial statements were prepared by Company pursuant to the rules and regulations of the Securities Exchange Commission (“SEC”). The information furnished herein reflects all adjustments (consisting of normal recurring accruals and adjustments) which are, in the opinion of management, necessary to fairly present the operating results for the respective periods. Certain information and footnote disclosures normally present in annual consolidated financial statements prepared in accordance with accounting principles generally accepted in the United States of America (“US GAAP”) were omitted pursuant to such rules and regulations. These consolidated financial statements should be read in conjunction with the audited consolidated financial statements and footnotes included in the Company’s Annual Report on Form 10-K. The results for the nine months ended March 31, 2015, are not necessarily indicative of the results to be expected for the year ending June 30, 2015.
NOTE 2 – BASIS OF PRESENTATION AND SUMMARY OF SIGNIFICANT ACCOUNTING POLICIES
Principle of consolidation
The accompanying consolidated financial statements include the accounts of the Company and its wholly-owned subsidiaries, Green New Jersey, Jinong, Gufeng, Tianjuyuan and VIE Yuxing. All significant inter-company accounts and transactions have been eliminated in consolidation.
Use of estimates
The preparation of consolidated financial statements in conformity with accounting principles generally accepted in the United States of America requires management to make estimates and assumptions that affect the reported amounts of assets and liabilities and disclosure of contingent assets and liabilities at the date of the consolidated financial statements and the amount of revenues and expenses during the reporting periods. Management makes these estimates using the best information available at the time the estimates are made. However, actual results could differ materially from those results.
Deferred assets
Deferred assets represent amounts that the distributors owed to the Company in their marketing efforts and developing standard stores to expand the Company’s products’ competitiveness and market shares. The amount owed to the Company to assist its distributors will be expensed over three years commencing from December 2013 which is the term as stated in the cooperation agreement, as long as the distributors are actively selling the Company’s products. For the nine months ended March 31, 2015 and 2014, the Company amortized $31,587,102 and $23,578,746, respectively, of the deferred assets. If a distributor breaches, defaults, or terminates the agreement with the Company within the three-year period, the outstanding unamortized portion of the amount owed will become payable to the Company immediately. The Company’s Chairman, Mr. Li, guaranteed to the Company of amounts remaining unpaid due from the distributors. These deferred assets are subject to annual impairment testing. The estimated amortization expense of the deferred assets for the twelve months ending March 31, 2016, 2017 and 2018 is $38,870,316, $20,237,200 and $2,632,925, respectively.
The deferred assets consist of items inside the distributors’ stores such as furniture, racks, cabinets, and display units, and items outside or attached to the distributors’ stores such as signage and billboards. These types of assets would be capitalized as fixed assets if the Company actually owned the stores or utilized the assets for its own operations. These assets would also be capitalized as leasehold improvements if the Company leased these stores from the distributors. Therefore, the Company believes that under the U.S.GAAP, these types of assets purchases are properly capitalized. In addition, the Company believes that these assets are properly classified as deferred assets because if a distributor breaches, defaults, or terminates the agreement with the Company within a three-year period, a proportionate amount expended by the Company is to be repaid by the distributor. The Chairman of the Board of Directors of the Company guaranteed to the Company of amounts remaining unpaid due from distributors.
The assets inside the distributors’ stores are custom made to fit the layout of each individual store and the signage and billboards are also custom designed to fit the specific location. The assets were purchased by the Company directly from the manufacturers and installed in the distributors’ stores. The Company wants to maintain control over the quality of the items being purchased as well as to make them uniform among all the distributor locations.
Earnings per share
Basic earnings per share is computed based on the weighted average number of shares of common stock outstanding during the period. Diluted earnings per share is computed based on the weighted average number of shares of common stock plus the effect of dilutive potential common shares outstanding during the period using the treasury stock method. Dilutive potential common shares include outstanding stock options and stock awards.
| 5 |
CHINA GREEN AGRICULTURE, INC. AND SUBSIDIARIES
NOTES TO CONSOLIDATED FINANCIAL STATEMENTS
MARCH 31, 2015
The components of basic and diluted earnings per share consist of the following:
| For the Three Months Ended March 31, | ||||||||
| 2015 | 2014 | |||||||
| Net Income for Basic Earnings Per Share | $ | 9,916,194 | $ | 7,209,131 | ||||
| Basic Weighted Average Number of Shares | 34,783,456 | 31,825,562 | ||||||
| Net Income Per Share – Basic | $ | 0.29 | $ | 0.23 | ||||
| Net Income for Diluted Earnings Per Share | $ | 9,916,194 | $ | 7,209,131 | ||||
| Diluted Weighted Average Number of Shares | 34,783,456 | 31,825,562 | ||||||
| Net Income Per Share – Diluted | $ | 0.29 | $ | 0.23 | ||||
| For the Nine Months Ended March 31, | ||||||||
| 2015 | 2014 | |||||||
| Net Income for Basic Earnings Per Share | $ | 23,230,713 | $ | 21,263,325 | ||||
| Basic Weighted Average Number of Shares | 33,471,214 | 31,201,076 | ||||||
| Net Income Per Share – Basic | $ | 0.69 | $ | 0.68 | ||||
| Net Income for Diluted Earnings Per Share | $ | 23,230,713 | $ | 21,263,325 | ||||
| Diluted Weighted Average Number of Shares | 33,471,214 | 31,201,076 | ||||||
| Net Income Per Share – Diluted | $ | 0.69 | $ | 0.68 | ||||
Reclassification
Certain reclassifications have been made to the prior year’s consolidated financial statements to conform to the 2015 consolidated financial statement presentation. Such reclassifications did not affect total revenues, operating income or net income or cash flows as previously reported.
Recent accounting pronouncements
FASB Accounting Standards Update No. 2014-08
In April 2014, the FASB issued ASU 2014-08, "Presentation of Financial Statements (Topic 205) and Property, Plant and Equipment (Topic 360)." ASU 2014-08 amends the requirements for reporting discontinued operations and requires additional disclosures about discontinued operations. Under the new guidance, only disposals representing a strategic shift in operations or that have a major effect on the Company's operations and financial results should be presented as discontinued operations. This new accounting guidance is effective for annual periods beginning after December 15, 2014. The Company is currently evaluating the impact of adopting ASU 2014-08 on the Company's results of operations or financial condition.
FASB Accounting Standards Update No. 2014-09
In May 2014, the FASB issued Accounting Standards Update No. 2014-09, “Revenue from Contracts with Customers” (ASU 2014-09), which supersedes nearly all existing revenue recognition guidance under U.S. GAAP. The core principle of ASU 2014-09 is to recognize revenues when promised goods or services are transferred to customers in an amount that reflects the consideration to which an entity expects to be entitled for those goods or services. ASU 2014-09 defines a five step process to achieve this core principle and, in doing so, more judgment and estimates may be required within the revenue recognition process than are required under existing U.S. GAAP. The standard is effective for annual periods beginning after December 15, 2016, and interim periods therein, using either of the following transition methods: (i) a full retrospective approach reflecting the application of the standard in each prior reporting period with the option to elect certain practical expedients, or (ii) a retrospective approach with the cumulative effect of initially adopting ASU 2014-09 recognized at the date of adoption (which includes additional footnote disclosures). Early adoption is not permitted. The Company is currently evaluating the impact of the pending adoption of ASU 2014-09 on its consolidated financial statements and has not yet determined the method by which it will adopt the standard beginning January 1, 2017.
| 6 |
CHINA GREEN AGRICULTURE, INC. AND SUBSIDIARIES
NOTES TO CONSOLIDATED FINANCIAL STATEMENTS
MARCH 31, 2015
FASB Accounting Standards Update No. 2015-01
In January 2015, the FASB issued Accounting Standards Update No. 2015-01, Income Statement – Extraordinary and Unusual items (Subtopic 225-20), Simplifying Income Statement Presentation by Eliminating the Concept of Extraordinary Items (ASU 2015-01). The amendment eliminates from U.S. GAAP the concept of extraordinary items. This guidance is effective for the Company in the first quarter of fiscal 2017. Early adoption is permitted and allows the Company to apply the amendment prospectively or retrospectively. The adoption of this guidance is not expected to have a material impact on the Company’s consolidated financial statements.
Other recent accounting pronouncements issued by the FASB, including its Emerging Issues Task Force, the American Institute of Certified Public Accountants, and the Securities and Exchange Commission did not or are not believed by management to have a material impact on the Company's present or future financial statements
NOTE 3 – INVENTORIES
Inventories consisted of the following:
| March 31, | June 30, | |||||||
| 2015 | 2014 | |||||||
| Raw materials | $ | 71,353,452 | $ | 24,618,225 | ||||
| Supplies and packing materials | $ | 770,218 | $ | 492,954 | ||||
| Work in progress | $ | 328,864 | $ | 440,935 | ||||
| Finished goods | $ | 51,175,064 | $ | 49,934,784 | ||||
| Total | $ | 123,627,598 | $ | 75,486,898 | ||||
NOTE 4 - PROPERTY, PLANT AND EQUIPMENT
Property, plant and equipment consisted of the following:
| March 31, | June 30, | |||||||
| 2015 | 2014 | |||||||
| Building and improvements | $ | 30,114,539 | $ | 29,930,240 | ||||
| Auto | 737,197 | 732,684 | ||||||
| Machinery and equipment | 36,766,795 | 36,193,501 | ||||||
| Agriculture assets | 831,639 | 826,549 | ||||||
| Total property, plant and equipment | 68,450,170 | 67,682,974 | ||||||
| Less: accumulated depreciation | (22,841,538 | ) | (19,621,363 | ) | ||||
| Total | $ | 45,608,632 | $ | 48,061,611 | ||||
NOTE 5 - INTANGIBLE ASSETS
Intangible assets consisted of the following:
| March 31, | June 30, | |||||||
| 2015 | 2014 | |||||||
| Land use rights, net | $ | 11,599,242 | $ | 11,723,976 | ||||
| Technology patent, net | 313,184 | 498,027 | ||||||
| Customer relationships, net | 5,593,116 | 6,350,586 | ||||||
| Non-compete agreement | 10,784 | 42,874 | ||||||
| Trademarks | 6,650,380 | 6,609,680 | ||||||
| Total | $ | 24,166,706 | $ | 25,225,143 | ||||
| 7 |
CHINA GREEN AGRICULTURE, INC. AND SUBSIDIARIES
NOTES TO CONSOLIDATED FINANCIAL STATEMENTS
MARCH 31, 2015
LAND USE RIGHT
On September 25, 2009, Yuxing was granted a land use right for approximately 88 acres (353,000 square meters or 3.8 million square feet) by the People’s Government and Land & Resources Bureau of Hu County, Xi’an, Shaanxi Province. The fair value of the related intangible asset was determined to be the respective cost of RMB73,184,895 (or $11,958,412). The intangible asset is being amortized over the grant period of 50 years using the straight line method.
On August 13, 2003, Tianjuyuan was granted a certificate of Land Use Right for a parcel of land of approximately 11 acres (42,726 square meters or 459,898 square feet) at Ping Gu District, Beijing. The purchase cost was recorded at RMB1,045,950 (or $170,908). The intangible asset is being amortized over the grant period of 50 years using the straight line method.
On August 16, 2001, Jinong received a land use right as a contribution from a shareholder, which was granted by the People’s Government and Land & Resources Bureau of Yangling District, Shaanxi Province. The fair value of the related intangible asset at the time of the contribution was determined to be RMB7,285,099 (or $1,190,385). The intangible asset is being amortized over the grant period of 50 years.
The Land Use Rights consisted of the following:
| March 31, | June 30, | |||||||
| 2015 | 2014 | |||||||
| Land use rights | $ | 13,319,705 | $ | 13,238,189 | ||||
| Less: accumulated amortization | (1,720,463 | ) | (1,514,213 | ) | ||||
| Total land use rights, net | $ | 11,599,242 | $ | 11,723,976 | ||||
TECHNOLOGY PATENT
On July 2, 2010, the Company acquired Gufeng and its wholly-owned subsidiary Tianjuyuan. The preliminary fair value on the acquired technology patent was estimated to be RMB 9,200,000 (or $1,503,280) and is amortized over the remaining useful life of six years using the straight line method.
The technology know-how consisted of the following:
| March 31, | June 30, | |||||||
| 2015 | 2014 | |||||||
| Technology know-how | $ | 2,463,266 | $ | 2,448,191 | ||||
| Less: accumulated amortization | (2,150,082 | ) | (1,950,164 | ) | ||||
| Total technology know-how, net | $ | 313,184 | $ | 498,027 | ||||
CUSTOMER RELATIONSHIP
On July 2, 2010, the Company acquired Gufeng and its wholly-owned subsidiary Tianjuyuan. The preliminary fair value on the acquired customer relationships was estimated to be RMB65,000,000 (or $10,621,000) and is amortized over the remaining useful life of ten years.
| March 31, | June 30, | |||||||
| 2015 | 2014 | |||||||
| Customer relationships | $ | 10,621,000 | $ | 10,556,000 | ||||
| Less: accumulated amortization | (5,027,884 | ) | (4,205,414 | ) | ||||
| Total customer relationships, net | $ | 5,593,116 | $ | 6,350,586 | ||||
| 8 |
CHINA GREEN AGRICULTURE, INC. AND SUBSIDIARIES
NOTES TO CONSOLIDATED FINANCIAL STATEMENTS
MARCH 31, 2015
NON-COMPETE AGREEMENT
On July 2, 2010, the Company acquired Gufeng and its wholly-owned subsidiary Tianjuyuan. The preliminary fair value on the acquired non-compete agreement was estimated to be RMB 1,320,000 (or $215,688) and is amortized over the remaining useful life of five years using the straight line method.
| March 31, | June 30, | |||||||
| 2015 | 2014 | |||||||
| Non-compete agreement | $ | 215,688 | $ | 214,368 | ||||
| Less: accumulated amortization | (204,904 | ) | (171,494 | ) | ||||
| Total non-compete agreement, net | $ | 10,784 | $ | 42,874 | ||||
TRADEMARKS
On July 2, 2010, the Company acquired Gufeng and its wholly-owned subsidiary Tianjuyuan. The preliminary fair value on the acquired trademarks was estimated to be RMB40,700,000 (or $6,650,380) and is subject to an annual impairment test.
AMORTIZATION EXPENSE
Estimated amortization expenses of intangible assets for the next five twelve months periods ended March 31, are as follows:
| AMORTIZATION TABLE | ||||
| Year Ends | Expense ($) | |||
| March 31, 2016 | 1,589,825 | |||
| March 31, 2017 | 1,391,131 | |||
| March 31, 2018 | 1,328,494 | |||
| March 31, 2019 | 1,328,494 | |||
| March 31, 2020 | 1,328,494 | |||
NOTE 6 - ACCRUED EXPENSES AND OTHER PAYABLES
Accrued expenses and other payables consist of the following:
| March 31, | June 30, | |||||||
| 2015 | 2014 | |||||||
| Payroll payable | $ | 9,647 | $ | 7,964 | ||||
| Welfare payable | 167,753 | 166,727 | ||||||
| Accrued expenses | 3,457,708 | 2,948,727 | ||||||
| Other payables | 1,051,827 | 1,049,783 | ||||||
| Other levy payable | 136,709 | 135,872 | ||||||
| Total | $ | 4,823,644 | $ | 4,309,073 | ||||
NOTE 7 - AMOUNT DUE TO RELATED PARTIES
As of March 31, 2015 and June 30, 2014, the amount due to related parties was $2,065,940 and $1,758,336, respectively. As of March 31, 2015 and June 30, 2014, $1,182,543 and $1,136,800, respectively were amounts that Gufeng borrowed from a related party, Xi’an Techteam Science & Technology Industry (Group) Co. Ltd., a company controlled by Mr. Tao Li, Chairman and CEO of the Company, representing unsecured, non-interest bearing loans that are due on demand. These loans are not subject to written agreements.
On November 1, 2013, Yuxing entered into an agreement with Xi'an Techteam Investment Holding Group (“Techteam Investment”), a holding company owned and controlled by Mr. Tao Li, Chairman and CEO of the Company, to delegate Techteam Investment to procure certain inventories from the market from November 1, 2013 to June 30, 2014 (the “Agreement Period”). During the Agreement Period, Techteam Investment advanced procurement payment to vendors, and Yuxing repaid the outstanding procurement amount to Techteam Investment periodically. Techteam Investment received no commission or compensation in this process. The total amount under this Agreement is $133,168.
| 9 |
CHINA GREEN AGRICULTURE, INC. AND SUBSIDIARIES
NOTES TO CONSOLIDATED FINANCIAL STATEMENTS
MARCH 31, 2015
On August 10, 2010, Yuxing entered into an agreement with Xi’an Kingtone Information Technology Co., Ltd. (“Kingtone Information”), the contractually-controlled operating subsidiary of Kingtone Wirelessinfo Solution Holding Ltd (“Kingtone”), whose Chairman is Mr. Tao Li, the Company’s Chairman and CEO. Pursuant to the agreement, Kingtone Information was responsible for developing certain electronic control systems for Yuxing. The total contracted value of this agreement, including value-added taxes and other taxes, is RMB3,030,000, or approximately $492,072. On September 28, 2013, the contract was terminated based on mutual agreement and Yuxing had paid Kingtone Information a total of $364,806 under the agreement.
On June 29, 2014, Jinong signed an office lease with Kingtone Information. Pursuant to the lease, Jinong rented 612 square meters (approximately 6,588 square feet) of office space from Kingtone Information. The lease provided for a two-year term effective as of July 1, 2014 with monthly rent of RMB24,480 (approximately $4,000).
NOTE 8- LOAN PAYABLES
As of March 31, 2015, the short-term loan payables consisted of nine loans which mature on dates ranging from August 6, 2014 through March 15, 2016 with interest rates ranging from 5.60% to 7.80%. The loans No 6 is collateralized by Tianjuyuan’s land use right and building ownership right. The loan No.8 is collateralized by Gufeng’s deposit. The loan No.7 is collateralized by Jinong’s land use right and Jinong’s credit. The loan No. 2 and 9 are guaranteed by Jinong’s credit. The loans No.3, 4 and 5 are guaranteed by a bonding company in Zhongguancun Beijing, and counter guaranteed by Jinong’s credit. The loan No.1 is guaranteed by Jinong and Tianjuyuan’s deposit.
| No. | Payee | Loan period per agreement | Interest Rate | March 31, 2015 | ||||||||
| 1 | Bank of Beijing- Pinggu Branch | Aug 6, 2014 - Aug 5, 2015 | 6.72 | % | 1,634,000 | |||||||
| 2 | China Merchants Bank- Chaoyangmen Branch | Aug 27, 2014 - Aug 26, 2015 | 7.80 | % | 1,634,000 | |||||||
| 3 | Beijing International Trust Co., Ltd | Sep 24, 2014 - Sep 23, 2015 | 7.80 | % | 1,634,000 | |||||||
| 4 | Beijing International Trust Co., Ltd | Oct 28 , 2014 - Oct 27, 2015 | 7.80 | % | 1,634,000 | |||||||
| 5 | Beijing International Trust Co., Ltd | Dec 16, 2014- Dec 15, 2015 | 7.28 | % | 1,634,000 | |||||||
| 6 | Agriculture Bank of China-Pinggu Branch | Jan 21, 2015- Jan 20, 2016 | 6.16 | % | 1,307,200 | |||||||
| 7 | Bank of Tianjin- Beijing Branch | Feb 3, 2015 - Jan 27, 2016 | 6.16 | % | 6,536,000 | |||||||
| 8 | Bank of Tianjin- Beijing Branch | Feb 11, 2015 - Feb 10, 2016 | 5.60 | % | 4,607,880 | |||||||
| 9 | China Merchants Bank- Chaoyangmen Branch | Mar 16, 2015 - Mar 15, 2016 | 6.96 | % | 817,000 | |||||||
| Total | $ | 21,438,080 | ||||||||||
As of June 30, 2014, the short-term loan payables consisted of eleven loans which mature on dates ranging from August 16, 2013 through April 24, 2015 with interest rates ranging from 6.00% to 7.80%. The loans No. 7, 10 and 11 below are collateralized by Tianjuyuan’s land use right and building ownership right. The loan No. 2 is collateralized by Gufeng and Tianjuyuan. The loan No.8 is collateralized by Gufeng’ deposit. The loans No. 1, 3, 4, 5 and 9 are guaranteed by Jinong’s credit. The loan No. 6 is collateralized by the land use rights of Jinong. The loans No. 1 and 2 were subsequently paid off during August 2014.
| No. | Payee | Loan period per agreement | Interest Rate | June 30, 2014 | ||||||||
| 1 | China Merchants Bank Chaoyang Branch | Feb 25, 2014 - Aug 14, 2014 | 6.90 | % | $ | 2,030,000 | ||||||
| 2 | Beijing Bank Pinggu Branch | Aug 16, 2013 - Aug 15, 2014 | 7.20 | % | 1,624,000 | |||||||
| 3 | Beijing International Trust Co., Ltd | Sep 25, 2013 - Sep 24, 2014 | 7.80 | % | 1,624,000 | |||||||
| 4 | Beijing International Trust Co., Ltd | Oct 30, 2013 - Oct 29, 2014 | 7.80 | % | 1,624,000 | |||||||
| 5 | Beijing International Trust Co., Ltd | Dec 12, 2013 - Dec 11, 2014 | 7.80 | % | 1,624,000 | |||||||
| 6 | Tianjin Bank Beijing Branch | Jan 08, 2014 - Jan 07, 2015 | 6.60 | % | 5,684,000 | |||||||
| 7 | Agriculture Bank of China-Pinggu Branch | Jan 15, 2014 - Jan 14, 2015 | 6.60 | % | 1,364,160 | |||||||
| 8 | Tianjin Bank Beijing Branch | Jan 23, 2014 - Jan 22, 2015 | 6.00 | % | 3,053,120 | |||||||
| 9 | China Merchants Bank Chaoyang Branch | Feb 19, 2014 - Feb 18, 2015 | 7.20 | % | 2,436,000 | |||||||
| 10 | Agriculture Bank of China-Pinggu Branch | Mar 24, 2014 - Mar 23, 2015 | 6.60 | % | 1,299,200 | |||||||
| 11 | Agriculture Bank of China-Pinggu Branch | Apr 25, 2014 - Apr 24, 2015 | 6.60 | % | 1,640,240 | |||||||
| Total | $ | 24,002,720 | ||||||||||
| 10 |
CHINA GREEN AGRICULTURE, INC. AND SUBSIDIARIES
NOTES TO CONSOLIDATED FINANCIAL STATEMENTS
MARCH 31, 2015
The interest expense from short-term loans were $1,179,637 and $1,009,528 for the nine months ended March 31, 2015 and 2014, respectively.
NOTE 9 – TAXES PAYABLE
Enterprise Income Tax
Effective January 1, 2008, the Enterprise Income Tax (“EIT”) law of the PRC replaced the tax laws for Domestic Enterprises (“DEs”) and Foreign Invested Enterprises (“FIEs”). The EIT rate of 25% replaced the 33% rate that was applicable to both DEs and FIEs. The two year tax exemption and three year 50% tax reduction tax holiday for production-oriented FIEs was eliminated. Since January 1, 2008, Jinong became subject to income tax in China at a rate of 15% as a high-tech company, as a result of the expiration of its tax exemption on December 31, 2007. Accordingly, it made provision for income taxes for the nine months ended March 31, 2015 and 2014 of $3,581,931 and $3,698,296, respectively, which is mainly due to the operating income from Jinong. Gufeng is subject to 25% EIT rate and thus it made provision for income taxes of $2,790,829 and $2,752,026 for the nine months ended March 31, 2015 and 2014, respectively.
Value-Added Tax
All of the Company’s fertilizer products that are produced and sold in the PRC were subject to a Chinese Value-Added Tax (VAT) of 13% of the gross sales price. On April 29, 2008, the PRC State of Administration of Taxation (SAT) released Notice #56, “Exemption of VAT for Organic Fertilizer Products”, which allows certain fertilizer products to be exempt from VAT beginning June 1, 2008. The Company submitted the application for exemption in May 2009, which was granted effective September 1, 2009, continuing through December 31, 2015. The VAT exemption applies to all but a nominal amount of agricultural products sold by Jinong.
Income Taxes and Related Payables
Taxes payable consist of the following:
| March 31, | June 30, | |||||||
| 2015 | 2014 | |||||||
| VAT provision | $ | 72,201 | $ | 61,506 | ||||
| Income tax payable | 7,560,792 | 1,166,683 | ||||||
| Other levies | 713,530 | 693,266 | ||||||
| Total | $ | 8,346,523 | $ | 1,921,455 | ||||
Tax Rate Reconciliation
Our effective tax rates were approximately 21.5% and 23.3% for the nine months ended March 31, 2015 and 2014, respectively. Substantially all of the Company’s income before income taxes and related tax expense are from PRC sources. Actual income tax benefit reported in the consolidated statements of income and comprehensive income differ from the amounts computed by applying the US statutory income tax rate of 34% to income before income taxes for the nine months ended March 31, 2015 and 2014, for the following reasons:
| 11 |
CHINA GREEN AGRICULTURE, INC. AND SUBSIDIARIES
NOTES TO CONSOLIDATED FINANCIAL STATEMENTS
MARCH 31, 2015
| March 31, 2015 | ||||||||||||||||||||||||
| China | United States | |||||||||||||||||||||||
| 15% - 25% | 34% | Total | ||||||||||||||||||||||
| Pretax income (loss) | $ | 35,092,679 | (5,489,206 | ) | $ | 29,603,473 | ||||||||||||||||||
| Expected income tax expense (benefit) | 8,773,170 | 25.0 | % | (1,866,330 | ) | 34.0 | % | 6,906,840 | ||||||||||||||||
| High-tech income benefits on Jinong | (2,275,985 | ) | (6.5 | )% | - | - | (2,275,985 | ) | ||||||||||||||||
| Losses from subsidiaries in which no benefit is recognized | (124,425 | ) | (0.4 | )% | - | - | (124,425 | ) | ||||||||||||||||
| Change in valuation allowance on deferred tax asset from US tax benefit | - | 1,866,330 | (34.0 | )% | 1,866,330 | |||||||||||||||||||
| Actual tax expense | $ | 6,372,760 | 18.2 | % | $ | - | - | % | $ | 6,372,760 | 21.5 | % | ||||||||||||
| March 31, 2014 | ||||||||||||||||||||||||
| China | United States | |||||||||||||||||||||||
| 15% - 25% | 34% | Total | ||||||||||||||||||||||
| Pretax income (loss) | $ | 35,186,323 | $ | (7,472,676 | ) | $ | 27,713,647 | |||||||||||||||||
| Expected income tax expense (benefit) | 8,796,581 | 25.0 | % | (2,540,710 | ) | 34.0 | % | 6,255,871 | ||||||||||||||||
| High-tech income benefits on Jinong | (2,305,732 | ) | (6.6 | )% | - | - | (2,305,732 | ) | ||||||||||||||||
| Losses from subsidiaries in which no benefit is recognized | (40,527 | ) | (0.1 | )% | - | - | (40,527 | ) | ||||||||||||||||
| Change in valuation allowance on deferred tax asset from US tax benefit | - | 2,540,710 | (34.0 | )% | 2,540,710 | |||||||||||||||||||
| Actual tax expense | $ | 6,450,322 | 18.3 | % | $ | - | - % | $ | 6,450,322 | 23.3 | % | |||||||||||||
NOTE 10 – STOCKHOLDERS’ EQUITY
Common Stock
On September 26, 2013, the Company issued 118,778 shares of common stock at the market price of $4.42 per share to Mr. Tao Li as the repayment for $200,000 he previously advanced to the Company and $325,000 for the unpaid compensation.
On September 28, 2013, the Company granted an aggregate of 1,750,000 shares of restricted stock under the Company’s 2009 Equity Incentive Plan, as amended (the “2009 Plan”) to certain executive officers, directors and employees. among which (i) 480,000 shares of restricted stock to Mr. Tao Li, the CEO; (ii) 200,000 shares of restricted stock to Mr. Ken Ren, the CFO, (iii) 40,000 shares of restricted stock to Mr. Yizhao Zhang, 30,000 shares of restricted stock to Ms. Yiru Shi, and 20,000 shares of restricted stock to Mr. Lianfu Liu, each an independent director of the Company; and (iv) 980,000 shares of restricted stock to 220 employees. The stock grants are subject to time-based vesting schedules, vesting in various installments until March 31, 2014 for the CFO and the three independent directors, until March 31, 2015 for the CEO and until December 31, 2015 for the employees. The value of the restricted stock awards was $7,490,000 and is based on the fair value of the Company’s common stock on the grant date. This amount is being amortized to compensation expense over the vesting periods for the various awards. As of March 31, 2015 the unamortized portion of the compensation expense was $823,728 which will be amortized to expense through December 15, 2015.
| 12 |
CHINA GREEN AGRICULTURE, INC. AND SUBSIDIARIES
NOTES TO CONSOLIDATED FINANCIAL STATEMENTS
MARCH 31, 2015
On September 30, 2014, the Company granted an aggregate of 1,750,000 shares of restricted stock under the 2009 Plan to certain executive officers, directors and employees, among which (i) 240,000 shares of restricted stock to Mr. Tao Li, the CEO; (ii) 100,000 shares of restricted stock to Mr. Ken Ren, the CFO, (iii) 40,000 shares of restricted stock to Mr. Yizhao Zhang, 30,000 shares of restricted stock to Ms. Yiru Shi, and 20,000 shares of restricted stock to Mr. Lianfu Liu, each an independent director of the Company; and (iv) 1,320,000 shares of restricted stock to key employees. The stock grants are subject to time-based vesting schedules, vesting in various installments until March 31, 2015 for the CFO and the three independent directors, until June 30, 2015 for the CEO and until December 31, 2016 for the employees. The value of the restricted stock awards was $3,675,000 and is based on the fair value of the Company’s common stock on the grant date. This amount is being amortized to compensation expense over the vesting periods for the various awards. As of March 31, 2015 the unamortized portion of the compensation expense was $1,805,036 which will be amortized to expense through December 15, 2016.
The following table sets forth changes in compensation-related restricted stock awards during nine months ended March 31, 2015:
| Grant | ||||||||||||
| Date | ||||||||||||
| Fair Value | Fair | |||||||||||
| Number of | of | Value | ||||||||||
| Shares | Shares | Per share | ||||||||||
| Outstanding (unvested) as of June 30, 2014 | 1,714,000 | 3,104,759 | ||||||||||
| Granted | 1,750,000 | 3,675,000 | $ | 2.10 | ||||||||
| Forfeited | - | - | ||||||||||
| Vested | (1,463,500 | ) | (4,150,995 | ) | ||||||||
| Outstanding (unvested) as of March 31, 2015 | 2,000,500 | 2,628,764 | ||||||||||
As of March 31, 2015, the unamortized expense related to the grant of restricted shares of common stock of $2,628,764 will be amortized into expense through December 31, 2016. The fair value of the restricted common stock awards was based on the closing price of the Company’s common stock on the grant date. The fair value of the common stock awarded is amortized over the various vesting terms of each grant.
During the year ended June 30, 2014, the Company issued 17,356 shares of common stock for consulting services valued at $65,535. The shares were valued at the market price on the date of issuance.
During the nine months ended March 31, 2015, the Company issued 97,082 shares of common stock for professional fees valued at $193,103.The shares were valued at the market price on the date of issuance.
In addition, during the nine months ended March 31, 2015, the Company issued 552,495 shares of common stock to its employees under the Company’s Employee Stock Purchase Plan (the “ESPP”) for cash of $1,246,746 and the Company sold 326,483 shares of common stock to its Chairman, Mr. Li, for cash proceeds of $626,847 under the ESPP.
Dividend
On October 1, 2014, the Company's Board of Directors declared a cash dividend of $0.10 per share to the Company's stockholders of common stock. The dividend payable represents a total payment to the stockholders of $3,296,156. The cash dividend of $2,161,904 was paid on January 30, 2015 to stockholders of record as of the close of business on the record date of October 31, 2014. Certain stockholders, including the Company’s Chairman, Mr. Li, elected to waive the dividend payment due to them and directed the Company to retain the funds for working capital purposes.
Preferred Stock
Under the Company’s Articles of Incorporation, the Board has the authority, without further action by stockholders, to designate up to 20,000,000 shares of preferred stock in one or more series and to fix the rights, preferences, privileges, qualifications and restrictions granted to or imposed upon the preferred stock, including dividend rights, conversion rights, voting rights, rights and terms of redemption, liquidation preference and sinking fund terms, any or all of which may be greater than the rights of the common stock. If the Company sells preferred stock under its registration statement on Form S-3, it will fix the rights, preferences, privileges, qualifications and restrictions of the preferred stock of each series in the certificate of designation relating to that series and will file the certificate of designation that describes the terms of the series of preferred stock the Company offers before the issuance of the related series of preferred stock.
| 13 |
CHINA GREEN AGRICULTURE, INC. AND SUBSIDIARIES
NOTES TO CONSOLIDATED FINANCIAL STATEMENTS
MARCH 31, 2015
As of March 31, 2015, the Company had 20,000,000 shares of preferred stock authorized, with a par value of $.001 per share, of which no shares are issued or outstanding.
NOTE 11 – STOCK OPTIONS
There were no issuances of stock options during the nine months ended March 31, 2015.
Options outstanding and related weighted average price and intrinsic value are as follows:
| Weighted | ||||||||||||
| Average | ||||||||||||
| Number | Exercise | Aggregate | ||||||||||
| of Shares | Price | Intrinsic Value | ||||||||||
| Outstanding, June 30, 2014 | 115,099 | $ | 14.66 | $ | - | |||||||
| Granted | - | |||||||||||
| Forfeited/Canceled | - | |||||||||||
| Exercised | - | |||||||||||
| Outstanding, March 31, 2015 | 115,099 | $ | 14.66 | $ | - | |||||||
NOTE 12 –CONCENTRATIONS AND LITIGIATION
Market Concentration
All of the Company's revenue-generating operations are conducted in the PRC. Accordingly, the Company's business, financial condition and results of operations may be influenced by the political, economic and legal environments in the PRC, and by the general state of the PRC's economy.
The Company's operations in the PRC are subject to specific considerations and significant risks not typically associated with companies in North America and Western Europe. These include risks associated with, among other things, the political, economic and legal environment and foreign currency exchange. The Company’s results may be adversely affected by, among other things, changes in governmental policies with respect to laws and regulations, anti-inflationary measures, currency conversion and remittance abroad, and rates and methods of taxation.
Vendor and Customer Concentration
There were three vendors from which the Company purchased 17.0%, 12.4% and 11.6% of its raw materials for the nine months ended March 31, 2015. Total purchase from these three venders amounted to $9,322,106 as of March 31, 2015.
There were two vendors from which the Company purchased 21.9% and 17.2% of its raw materials for the nine months ended
March 31, 2014. Total purchase from these two venders amounted to $21,559,360 as of March 31, 2014.
There was one customer that accounted over 28.0% of the total sales of fertilizer products as of nine months ended March 31,
2015 and there was no customer that accounted over 10% of the total sales of fertilizer products as of nine months ended March 31, 2014.
| 14 |
CHINA GREEN AGRICULTURE, INC. AND SUBSIDIARIES
NOTES TO CONSOLIDATED FINANCIAL STATEMENTS
MARCH 31, 2015
Litigation
On October 15, 2010, a class action lawsuit was filed against the Company and certain of its current and former officers in the United States District Court for the District of Nevada (the "Nevada Federal Court") on behalf of purchasers of the Company’s common stock between November 12, 2009 and September 1, 2010. The last version of the complaint alleges that the Company and certain current and former officers and directors violated Sections 10(b) and 20(a) of the Securities Exchange Act of 1934 and Sections 11, 12(a)(2), and 15 of the Securities Act of 1933, as amended, by making material misstatements and omissions in the Company’s financial statements, securities offering documents, and related disclosures during the class period. On October 7, 2011, the defendants moved to dismiss the amended complaint and to strike portions of it. On November 2, 2012, the Court issued an order dismissing the claims for violation of sections 11, 12(a)(2) and 15 of the Securities Act of 1933 as to all defendants and dismissing two individual defendants from the complaint but allowing the claims for violations of section 10(b) and 20(a) of the Securities Exchange Act of 1934 to continue with respect to the Company and the remaining of the individual defendants. The Nevada Federal Court also denied the defendants’ motion to strike. The parties to the securities class action held mediation on March 7, 2013, which led to an agreement in principle to settle the case for a payment of $ 2.5 million by the Company’s insurers in exchange for a release of all claims against all defendants. On August 12, 2014, the Nevada Federal Court entered an order and final judgment granting final approval to the settlement and dismissing all claims in accordance with the settlement agreement. The Company’s insurers funded the full amount of the settlement of $2.5 million.
NOTE 13 – SEGMENT REPORTING
As of March 31, 2015, the Company was organized into three main business segments based on location and product: Jinong (fertilizer production), Gufeng (fertilizer production), and Yuxing (agricultural products production). Each of the three operating segments referenced above has separate and distinct general ledgers. The chief operating decision maker (“CODM”) receives financial information, including revenue, gross margin, operating income and net income produced from the various general ledger systems to make decisions about allocating resources and assessing performance; however, the principal measure of segment profitability or loss used by the CODM is net income by segment.
| Three months ended March 31, | Nine months ended March 31, | |||||||||||||||
| Revenues from unaffiliated customers: | 2014 | 2013 | 2014 | 2013 | ||||||||||||
| Jinong | $ | 33,289,393 | $ | 30,210,579 | $ | 98,946,251 | $ | 88,261,203 | ||||||||
| Gufeng | 45,022,730 | 39,080,111 | 82,787,611 | 70,318,209 | ||||||||||||
| Yuxing | 1,175,092 | 1,005,291 | 3,106,317 | 2,654,517 | ||||||||||||
| Consolidated | $ | 79,487,215 | $ | 70,295,981 | $ | 184,840,179 | $ | 161,233,929 | ||||||||
| Operating income : | ||||||||||||||||
| Jinong | $ | 7,263,622 | $ | 5,487,505 | $ | 23,322,997 | $ | 23,924,484 | ||||||||
| Gufeng | 6,999,283 | 6,355,545 | 12,126,494 | 12,059,529 | ||||||||||||
| Yuxing | 125,021 | 111,507 | 535,592 | 218,049 | ||||||||||||
| Reconciling item (1) | - | - | - | - | ||||||||||||
| Reconciling item (2) | (381,644 | ) | (203,393 | ) | (1,338,332 | ) | (834,439 | ) | ||||||||
| Reconciling item (2)—stock compensation | (1,081,125 | ) | (1,833,997 | ) | (4,150,995 | ) | (6,638,246 | ) | ||||||||
| Consolidated | $ | 12,925,157 | $ | 9,917,167 | $ | 30,495,756 | $ | 28,729,377 | ||||||||
| Net income: | ||||||||||||||||
| Jinong | $ | 6,202,243 | $ | 4,658,433 | $ | 19,849,731 | $ | 20,317,816 | ||||||||
| Gufeng | 5,048,243 | 4,419,560 | 8,223,840 | 8,142,956 | ||||||||||||
| Yuxing | 128,397 | 168,523 | 646,347 | 275,229 | ||||||||||||
| Reconciling item (1) | 80 | 5 | 122 | 9 | ||||||||||||
| Reconciling item (2) | (1,462,769 | ) | (2,037,390 | ) | (5,489,327 | ) | (7,472,685 | ) | ||||||||
| Consolidated | $ | 9,916,194 | $ | 7,209,131 | $ | 23,230,713 | $ | 21,263,325 | ||||||||
| Depreciation and Amortization: | ||||||||||||||||
| Jinong | $ | 10,831,046 | $ | 6,333,478 | $ | 32,319,450 | $ | 19,808,803 | ||||||||
| Gufeng | 840,225 | 924,689 | 2,539,935 | 2,521,225 | ||||||||||||
| Yuxing | 349,952 | 336,211 | 1,043,518 | 997,536 | ||||||||||||
| Consolidated | $ | 12,021,223 | $ | 7,594,378 | $ | 35,902,903 | $ | 23,327,564 | ||||||||
| Interest expense: | ||||||||||||||||
| Gufeng | 363,958 | 472,104 | 1,179,617 | 1,009,528 | ||||||||||||
| Consolidated | $ | 363,958 | $ | 472,104 | $ | 1,179,617 | $ | 1,009,528 | ||||||||
| Capital Expenditure: | ||||||||||||||||
| Jinong | $ | 9,893 | $ | 143,874 | $ | 9,232,410 | $ | 65,028,679 | ||||||||
| Gufeng | 544 | 70,257 | 13,578 | 81,036 | ||||||||||||
| Yuxing | 27,630 | 10,974 | 397,823 | 982,591 | ||||||||||||
| Consolidated | $ | 38,067 | $ | 225,105 | $ | 9,643,811 | $ | 66,092,306 | ||||||||
| 15 |
CHINA GREEN AGRICULTURE, INC. AND SUBSIDIARIES
NOTES TO CONSOLIDATED FINANCIAL STATEMENTS
MARCH 31, 2015
| As of March 31, | As of June 30, | |||||||
| 2015 | 2014 | |||||||
| Identifiable assets: | ||||||||
| Jinong | $ | 218,047,068 | $ | 195,331,283 | ||||
| Gufeng | 165,593,590 | 153,655,110 | ||||||
| Yuxing | 44,525,538 | 44,003,970 | ||||||
| Reconciling item (1) | 445,747 | 123,753 | ||||||
| Reconciling item (2) | (2,770 | ) | (3,906 | ) | ||||
| Consolidated | $ | 428,609,173 | $ | 393,110,210 | ||||
(1) Reconciling amounts refer to the unallocated assets or expenses of Green New Jersey.
(2) Reconciling amounts refer to the unallocated assets or expenses of the Parent Company.
NOTE 14- COMMITMENTS AND CONTINGENCIES
On June 29, 2014, Jinong signed an office lease with Kingtone Information. Pursuant to the lease, Jinong rented 612 square meters (approximately 6,588 square feet) of office space from Kingtone Information. The lease provided for a two-year term effective as of July 1, 2014 with monthly rent of $4,000 (RMB 24,480).
In February 2004, Tianjuyuan signed a fifty-year lease with the village committee of Dong Gao Village and Zhen Nan Zhang Dai Village in the Beijing Ping Gu District, at a monthly rent of $483 (RMB 2,958).
Accordingly, the Company recorded an aggregate of $40,347 and $35,758 as rent expenses for the nine months ended March 31, 2015 and 2014, respectively. Rent expenses for the next five years ended March 31, are as follows:
| Years ending March 31, | ||||
| 2016 | $ | 53,800 | ||
| 2017 | 17,800 | |||
| 2018 | 5,800 | |||
| 2019 | 5,800 | |||
| 2020 | 5,800 | |||
| 16 |
CHINA GREEN AGRICULTURE, INC. AND SUBSIDIARIES
NOTES TO CONSOLIDATED FINANCIAL STATEMENTS
MARCH 31, 2015
NOTE 15 VARIABLE INTEREST ENTITIES
Green Nevada through one of its subsidiaries, Jinong, entered into a series of agreements (the “VIE Agreements”) with Yuxing for it to qualify as a VIE, effective June 16, 2013. The VIE Agreements are as follows:
Entrusted Management Agreement
Pursuant to the terms of a certain Entrusted Management Agreement dated June 16, 2013 among Yuxing, Jinong and the shareholder of Yuxing (the “Entrusted Management Agreement”), Yuxing and its shareholder agreed to entrust the operations and management of its business to Jinong. According to the Entrusted Management Agreement, Jinong possesses the full and exclusive right to manage Yuxing’s operations, assets and personnel, has the right to control all of Yuxing's cash flows through an entrusted bank account, is entitled to Yuxing's net profits as a management fee, is obligated to pay all of Yuxing’s payables and loan payments, and bears all losses of Yuxing. The Entrusted Management Agreement will remain in effect until (i) the parties mutually agree to terminate the agreement; (ii) the dissolution of Yuxing or (iii) Jinong acquires all of the assets or equity of Yuxing (as more fully described below under “Exclusive Option Agreement”).
Exclusive Product Supply Agreement
Pursuant to the terms of a certain Exclusive Product Supply Agreement dated June 16, 2013 between Yuxing and Jinong (“the Exclusive Product Supply Agreement”), Jinong is the exclusive product provider to Yuxing. Yuxing agreed to pay Jinong all fees payable for products supply prior to making any payments under the Entrusted Management Agreement. Any payment from Yuxing to Jinong must comply with applicable Chinese laws. The Exclusive Product Supply Agreement shall remain in effect until (i) the parties mutually agree to terminate the agreement; (ii) the dissolution of Yuxing or (iii) Jinong acquires Yuxing (as more fully described below under “Exclusive Option Agreement”).
Shareholder’s Voting Proxy Agreement
Pursuant to the terms of a certain Shareholder’s Voting Proxy Agreement dated June 16, 2013 among Jinong and the shareholder of Yuxing (the “Shareholder’s Voting Proxy Agreement”), the shareholder of Yuxing irrevocably appointed Jinong as their proxy to exercise on such shareholder’s behalf all of her voting rights as shareholder pursuant to PRC law and the Articles of Association of Yuxing, including the appointment and election of directors of Yuxing. Jinong agreed that it shall maintain a board of directors the composition of which will be the members of the Board of Green Nevada, except those directors that are employed solely for the purpose of satisfying listing or financing requirements of Green Nevada, if any. The Shareholder’s Voting Proxy Agreement will remain in effect until Jinong acquires all of the assets or equity of Yuxing.
Exclusive Option Agreement
Pursuant to the terms of a certain Exclusive Option Agreement dated June 16, 2013 among Jinong, Yuxing and the shareholder of Yuxing (the “Exclusive Option Agreement”), the shareholder of Yuxing granted Jinong an irrevocable and exclusive purchase option (the “Option”) to acquire Yuxing’s equity interests and/or remaining assets, but only to the extent that the acquisition does not violate limitations imposed by PRC law on such transactions. The Option is exercisable at any time at Jinong’s discretion so long as such exercise and subsequent acquisition of Yuxing does not violate PRC law. The consideration for the exercise of the Option is to be determined by the parties and memorialized in the future by definitive agreements setting forth the kind and value of such consideration. To the extent Yuxing shareholder receive any of such consideration, the Option requires them to transfer (and not retain) the same to Yuxing or Jinong. The Exclusive Option Agreement may be terminated by mutual agreement or by 30 days written notice by Jinong.
Equity Pledge Agreement
Pursuant to the terms of a certain Equity Pledge Agreement dated June 16, 2013 among Jinong and the shareholder of Yuxing (the “Pledge Agreement”), the shareholder of Yuxing pledged all of her equity interests in Yuxing, including the proceeds thereof, to guarantee all of Jinong's rights and benefits under the Entrusted Management Agreement, the Exclusive Product Supply Agreement, the Shareholder’ Voting Proxy Agreement and the Exclusive Option Agreement. Prior to termination of the Pledge Agreement, the pledged equity interests cannot be transferred without Jinong's prior written consent. The Pledge Agreement may be terminated only upon the written agreement of the parties.
| 17 |
CHINA GREEN AGRICULTURE, INC. AND SUBSIDIARIES
NOTES TO CONSOLIDATED FINANCIAL STATEMENTS
MARCH 31, 2015
As a result of these contractual arrangements, Green Nevada is able to exercise control over Yuxing and was entitled to substantially all of the economic benefits of Yuxing through its subsidiary, Jinong. Therefore, Green Nevada consolidates Yuxing in accordance with ASC 810-10 (“Consolidation of Variable Interest Entities”) since the date of the VIE Agreements.
The following financial statement amounts and balances of the VIE were included in the accompanying consolidated financial statements as of March 31, 2015 and June 30, 2014:
| March 31, | June 30, | |||||||
| 2015 | 2014 | |||||||
| ASSETS | ||||||||
| Current Assets | ||||||||
| Cash and cash equivalents | $ | 130,530 | $ | 102,777 | ||||
| Accounts receivable, net | 150,784 | 61,248 | ||||||
| Inventories | 17,360,979 | 16,538,621 | ||||||
| Other current assets | 79,048 | 12,745 | ||||||
| Advances to suppliers | 49,554 | 53,168 | ||||||
| Total Current Assets | 17,770,895 | 16,768,559 | ||||||
| Plant, Property and Equipment, Net | 16,062,792 | 16,450,206 | ||||||
| Construction In Progress | 68,795 | 48,883 | ||||||
| Intangible Assets, Net | 10,623,056 | 10,736,322 | ||||||
| Total Assets | $ | 44,525,538 | $ | 44,003,970 | ||||
| LIABILITIES AND STOCKHOLDERS' EQUITY | ||||||||
| Current Liabilities | ||||||||
| Accounts payable | $ | 150,297 | $ | 739,526 | ||||
| Accrued expenses and other payables | 197,803 | 3,086 | ||||||
| Amount due to related parties | 43,408,500 | 43,142,280 | ||||||
| Total Current Liabilities | 43,756,600 | 43,884,892 | ||||||
| Stockholders' equity | 768,938 | 119,078 | ||||||
| Total Liabilities and Stockholders' Equity | $ | 44,525,538 | $ | 44,003,970 | ||||
| Three months ended March 31, | Nine months ended March 31, | |||||||||||||||
| 2015 | 2014 | 2015 | 2014 | |||||||||||||
| Revenue | $ | 1,175,092 | $ | 1,005,291 | $ | 3,106,317 | $ | 2,654,517 | ||||||||
| Expenses | 1,046,695 | 836,768 | 2,459,970 | 2,379,288 | ||||||||||||
| Net income | $ | 128,397 | $ | 168,523 | $ | 646,347 | $ | 275,229 | ||||||||
| 18 |
Item 2. Management’s Discussion and Analysis of Financial Condition and Results of Operations
The following discussion and analysis of our financial condition and results of operations should be read in conjunction with our consolidated financial statements and the notes to those financial statements appearing elsewhere in this report. This discussion and analysis contains forward-looking statements that involve significant risks and uncertainties. As a result of many factors, such as the slow-down of the macro-economic environment in China and its impact on economic growth in general, the competition in the fertilizer industry and the impact of such competition on pricing, revenues and margins, the weather conditions in the areas where our customers are based, the cost of attracting and retaining highly skilled personnel, the prospects for future acquisitions, and the factors set forth elsewhere in this report, our actual results may differ materially from those anticipated in these forward-looking statements. In light of these risks and uncertainties, there can be no assurance that the forward-looking statements contained in this report will in fact occur. You should not place undue reliance on the forward-looking statements contained in this report.
The forward-looking statements speak only as of the date on which they are made, and, except to the extent required by U.S. federal securities laws, we undertake no obligation to update any forward-looking statement to reflect events or circumstances after the date on which the statement is made or to reflect the occurrence of unanticipated events. Further, the information about our intentions contained in this report is a statement of our intention as of the date of this report and is based upon, among other things, the existing regulatory environment, industry conditions, market conditions and prices, and our assumptions as of such date. We may change our intentions, at any time and without notice, based upon any changes in such factors, in our assumptions or otherwise.
Unless the context indicates otherwise, as used in the following discussion, “Company”, “we,” “us,” and “our,” refer to (i) China Green Agriculture, Inc. (“Green Nevada”), a corporation incorporated in the State of Nevada; (ii) Green Agriculture Holding Corporation (“Green New Jersey”), a wholly-owned subsidiary of Green Nevada incorporated in the State of New Jersey; (iii) Shaanxi TechTeam Jinong Humic Acid Product Co., Ltd. (“Jinong”), a wholly-owned subsidiary of Green New Jersey organized under the laws of the PRC; (iv) Xi’an Jintai Agriculture Technology Development Company (“Jintai”), a wholly-owned subsidiary of Jinong in the PRC, (v) Xi’an Hu County Yuxing Agriculture Technology Development Co., Ltd. (“Yuxing”), a Variable Interest Entity (“VIE”) controlled by Jinong in the PRC; (vi) Beijing Gufeng Chemical Products Co., Ltd. (“Gufeng”), a wholly-owned subsidiary of Jinong in the PRC, and (vii) Beijing Tianjuyuan Fertilizer Co., Ltd. (“Tianjuyuan”), a wholly-owned subsidiary of Gufeng in the PRC.
Unless the context otherwise requires, all references to (i) “PRC” and “China” are to the People’s Republic of China; (ii) “U.S. dollar,” “$” and “US$” are to United States dollars; and (iii) “RMB”, “Yuan” and Renminbi are to the currency of the PRC or China.
Overview
We are engaged in the research, development, production and sale of various types of fertilizers and agricultural products in the PRC through our wholly-owned Chinese subsidiaries, Jinong and Gufeng (including Gufeng’s subsidiary Tianjuyuan), and our VIE, Yuxing. Our primary business is fertilizer products, specifically humic-acid based compound fertilizer produced by Jinong and compound fertilizer, blended fertilizer, organic compound fertilizer, slow-release fertilizer, highly-concentrated water-soluble fertilizer and mixed organic-inorganic compound fertilizer produced by Gufeng. In addition, through Yuxing, we develop and produce various agricultural products, such as top-grade fruits, vegetables, flowers and colored seedlings. For financial reporting purposes, our operations are organized into three business segments: fertilizer products (Jinong), fertilizer products (Gufeng) and agricultural products (Yuxing).
Fertilizer Products
The fertilizer business conducted by Jinong and Gufeng generated approximately 98.5% and 98.6% of our total revenues for the nine months ended March 31, 2015 and 2014, respectively. As of March 31, 2015, we had developed and produced a total of 453 different fertilizer products in use, of which 121 were developed and produced by Jinong and 332 by Gufeng.
| 19 |
Below is a table that shows the metric tons of fertilizer sold by Jinong and Gufeng and the revenue per ton for the periods indicated:
| Three Months Ended March 31, | Change 2014 to 2015 | |||||||||||||||
| 2015 | 2014 | Amount | % | |||||||||||||
| (metric tons) | ||||||||||||||||
| Jinong | 15,147 | 14,719 | 428 | 2.9 | % | |||||||||||
| Gufeng | 103,135 | 93,687 | 9,448 | 10.5 | % | |||||||||||
| 118,282 | 108,406 | 9,876 | 9.1 | % | ||||||||||||
| Three Months Ended March 31, | ||||||||||||||||
| 2015 | 2014 | |||||||||||||||
| (revenue per ton) | ||||||||||||||||
| Jinong | $ | 2,198 | $ | 2,052 | ||||||||||||
| Gufeng | 437 | 417 | ||||||||||||||
| Nine Months Ended March 31, | Change 2014 to 2015 | |||||||||||||||
| 2015 | 2014 | Amount | % | |||||||||||||
| (metric tons) | ||||||||||||||||
| Jinong | 60,374 | 48,101 | 12,273 | 25.5 | % | |||||||||||
| Gufeng | 179,291 | 161,630 | 17,661 | 10.9 | % | |||||||||||
| 239,665 | 209,731 | 29,934 | 14.3 | % | ||||||||||||
| Nine Months Ended March 31, | ||||||||||||||||
| 2015 | 2014 | |||||||||||||||
| (revenue per ton) | ||||||||||||||||
| Jinong | $ | 1,639 | $ | 1,835 | ||||||||||||
| Gufeng? | 462 | 435 | ||||||||||||||
For the three months ended March 31, 2015, we sold approximately 118,282 metric tons of fertilizer products, as compared to 108,406 metric tons for the three months ended March 31, 2014. For the three months ended March 31, 2015, Jinong sold approximately 15,147 metric tons of fertilizer products, as compared to 14,719 metric tons for the three months ended March 31, 2014. This increase was mainly attributable to the greater sales of humic acid fertilizer products during this period as a result of the increased number of our distributors and our marketing efforts. For the three months ended March 31, 2015, Gufeng sold approximately 103,135 metric tons of fertilizer products, as compared to 93,687 metric tons for the three months ended March 31, 2014. The increase was mainly due to the large amount sales to China National Agricultural Means of Production Group Corporation ("Sino-agri Group") during the last three months compared with the same period last year.
For the nine months ended March 31, 2015, we sold approximately 239,665 metric tons of fertilizer products, as compared to 209,731 metric tons for the nine months ended March 31, 2014. For the nine months ended March 31, 2015, Jinong sold approximately 60,374 metric tons of fertilizer products, as compared to 48,101 metric tons for the nine months ended March 31, 2014. This increase was mainly attributable to the greater sales of humic acid fertilizer products during this period as a result of the increased number of our distributors and our marketing efforts. For the nine months ended March 31, 2015, Gufeng sold approximately 179,291 metric tons of fertilizer products, as compared to 161,630 metric tons for the nine months ended March 31, 2014. The increase was mainly due to the large amount sales to Sino-agri Group during the last nine months compared with the same period last year.
| 20 |
Our sales of fertilizer products to five provinces accounted for approximately 54.8% of our fertilizer revenue for the three months ended March 31, 2015. Specifically, the provinces and their respective percentage contributed to our fertilizer revenues were: Beijing (28.3%), Shaanxi (8.0%), Hebei (6.6%), Guangdong (6.5%), and Heilongjiang (5.4%).
As of March 31, 2015, we had a total of 1,256 distributors covering 27 provinces, four autonomous regions and three central government-controlled municipalities in China. Jinong had 978 distributors in China. Jinong’s sales are not dependent on any single distributor or any group of distributors. Jinong’s top five distributors accounted for 1.4% of its fertilizer revenues for the three months ended March 31, 2015. Gufeng had 278 distributors, including some large state-owned enterprises. Gufeng’s top five distributors accounted for 75.3% of its revenues for the three months ended March 31, 2015.
Agricultural Products
Through Yuxing, we develop, produce and sell high-quality flowers, green vegetables and fruits to local marketplaces and various horticulture and planting companies. We also use certain of Yuxing’s greenhouse facilities to conduct research and development activities for our fertilizer products. The three PRC provinces that accounted for 95.6% of our agricultural products revenue for the three months ended March 31, 2015 were Shaanxi (92.0%), Sichuan (1.4%), and Gansu (2.2%).
Recent Developments
New Products
During the three months ended March 31, 2015, Jinong launched one new fertilizer product. Jinong’s new products generated approximately $7,224, or 0.02% of Jinong’s fertilizer revenue for the three months ended March 31, 2015. Jinong added six new distributors for the three months ended March 31, 2015. Jinong’s new distributors accounted for approximately $236,068, or 0.7% of Jinong’s fertilizer revenue for the three months ended March 31, 2015.
During the three months ended March 31, 2015, Gufeng added seven new distributors, which accounted for approximately $768,668, or 1.7%, of Gufeng’s fertilizer revenue.
Business Development
Cooperation with Sino-agri Group
During the quarter ended December 31, 2014, the Company's wholly-owned subsidiaries organized under the laws of the PRC, Gufeng and Jinong, both entered into a strategic cooperation agreement with Sino-agri Mining Resource Exploration Co., Ltd. ("Sino-agri"), a key subsidiary of Sino-agri Group, respectively.
Sino-agri Group is a nationwide large-scale enterprise group that integrates production, circulation and service as well as specializes in the agricultural means of production, such as chemical fertilizers, pesticides, seeds, agricultural machinery & implements, etc. It is an enterprise with the corresponding level of the All China Federation of Supply and Marketing Cooperatives and an exclusively-invested enterprise of China CO-OP Group (http://www.chinacoop.coop/English/About%20China%20co-ops), which have the total assets of RMB30 billion, sales revenue of more than RMB72 billion, and the sales volume of more than 25 million tons for the agricultural materials. (For more information, please visit: http://english.sino-agri.com/show.php?id=10).
The objective of the strategic cooperation agreement between Sino-argi and Gufeng is for Sino-argi and Gufeng to work together with sales goals in three years. Specifically, pursuant to the agreement, Sino-agri shall sell 150,000 metric tons of compound fertilizers produced by Gufeng ("Gufeng Fertilizers") during the calendar year 2015; 300,000-metric-ton Gufeng fertilizers during 2016 and 500,000-metric-ton Gufeng Fertilizers in 2017 to promote Gufeng's flagship products.
| 21 |
To accomplish the sales goals of the agreement, Sino-agri and Gufeng are committed to strengthen the production and marketing of Gufeng Fertilizers comprehensively. Specifically, Gufeng will team up with Sino-agri to secure raw materials supplies by leveraging Sino-agri's global access to related raw materials. With that, Gufeng will deliver Sino-agri customized Gufeng Fertilizers upon the orders from Sino-agri's heterogeneous customers. In the next three-year period, Gufeng will be able to tap needed financial credit facilities from Sino-agri to fill the Sino-agri orders. In addition to Gufeng Fertilizers, Gufeng is committed to offer product support for Sino-agri's clients. The support includes, but not limit to, soil testing, fertilizer comparison and testing, as well as fertilizer solutions. In parallel, Sino-agri will give priority to purchase Gufeng Fertilizer to replenish its compound fertilizer inventory.
The objective of the strategic cooperation agreement between Sino-argi and Jinong is to require both parties to achieve the following sales goals in the next three years: Sino-agri Group sells 10,000 metric tons high-concentrated fertilizer produced by Jinong in the calendar year of 2015; 20,000 metric tons in 2016 and 50,000 metric tons in 2017.
The mission under the agreement is to establish a long-term strategic partnership that is mutually beneficial to both parties. To take advantage of Sino-agri Group's state-owned advantage in fertilizer distribution both domestic and overseas, Jinong will work with Sino-agri Group to improve Jinong's supply chain management in the procurement of raw material, and the sale of concentrated fertilizer products. Specifically, Sino-agri Group will provide quality raw materials and favorite lead time to Jinong. In return, Jinong will deliver to Sino-agri quality concentrated fertilizer at fair market price. In addition, Sino-agri Group will offer large support of working capital and investment to Jinong if Jinong needs liquidity and capital investment to expand production. In the meantime, Jinong concentrates on differentiating the market demand for Sino-agri and will customize corresponding product development and production process respectively.
We are very excited for having entered this partnership with Sino-agri, and the result is satisfactory Sino-agri has purchased a total of at $21,930,000 fertilizer products during the last three months ended March 31, 2015, which accounted for 28.0% of the total sales of fertilizer products from Company. We believe our partnership with Sino-agri will be extraordinary These agreements are win-win showcases between us and the large state-owned enterprise in China.
Cooperation with 900LH.com
As of the date of this report, the Company’s affiliate, 900LH.com Food Co., Ltd. ("900LH.com", previously announced as Xi'an Gem Grain Co., Ltd) has entered into an agreement to jointly build an “Agricultural Comprehensive Development Base Project” (the “Project”) with the Shiquan County Government in China. The total investment on the Project is expected to be three billion RMB (about 480 million USD).
900LH.com is a subsidiary of Xi'an Techteam Investment Holding (Group) Co., Ltd, ("Techteam Investment"). Techteam Investment is a holding company owned and controlled by Mr. Tao Li, Chairman and CEO of the Company. 900LH.com focuses on the production and sales of high-end organic agricultural products. It has contracted with more than 200 planting and breeding bases globally and prefers to utilize and promote the Company's fertilizers. The scope of the Project includes the development of Panlong Valley farm of 900LH.com, where the Company showcases its products. Panlong Valley is located at Shiquan County, Shaanxi Province, 150 miles southwest of Xi'an.
During the first phase of the foregoing project, 900LH.com will focus on building an ecological farm base. The base will include leisure farming, sightseeing, and sales of agriculture products. The total investment of the first phase would be one billion RMB (160 million USD approximately) including the cost of relocating local residents. In the second phase, the ecological farm will develop into a modern agriculture farm. The modern farm’s operation will include but not limit to, planting, breeding, agricultural products processing, and tourism. The investment of the second phase would be two billion RMB (320 million USD approximately).
The Company and 900LH.com have entered into an agreement that the Company’s fertilizers will be exclusively supplied to all plants and agricultural products in the Project and 900LH.com will promote the Company’s fertilizers to all its affiliated farms. In the Project, 900LH.com, the Company, and the government in Shaanxi Province will collaborate closely.
| 22 |
A New Business Model
The Company has made progress on its proprietary online sales platform of agriculture basic materials. Distributors of the Company will be able to set up stores on the platform to sell the Company’s products and other types of products such as pesticides and seeds they distribute for various manufacturers. The Company will compensate the distributors for their online sales performance of the Company's products accordingly. The platform began operating in March 2015.
Results of Operations
Three months ended March 31, 2015 compared to the three months ended March 31, 2014.
| For the Three Months Ended March 31, | ||||||||||||||||
| 2015 | 2014 | change $ | change % | |||||||||||||
| Sales | ||||||||||||||||
| Jinong | $ | 33,289,393 | $ | 30,210,579 | $ | 3,078,814 | 10.2 | % | ||||||||
| Gufeng | 45,022,730 | 39,080,111 | 5,942,619 | 15.2 | % | |||||||||||
| Yuxing | 1,175,092 | 1,005,291 | 169,801 | 16.9 | % | |||||||||||
| Net sales | 79,487,215 | 70,295,981 | 9,191,234 | 13.1 | % | |||||||||||
| Cost of goods sold | ||||||||||||||||
| Jinong | 13,623,964 | 12,174,848 | 1,449,116 | 11.9 | % | |||||||||||
| Gufeng | 36,814,676 | 31,258,885 | 5,555,791 | 17.8 | % | |||||||||||
| Yuxing | 858,058 | 701,533 | 156,525 | 22.3 | % | |||||||||||
| Cost of goods sold | 51,296,698 | 44,135,266 | 7,161,432 | 16.2 | % | |||||||||||
| Gross profit | 28,190,517 | 26,160,715 | 2,029,802 | 7.8 | % | |||||||||||
| Operating expenses | ||||||||||||||||
| Selling expenses | 2,054,025 | 932,594 | 1,121,431 | 120.2 | % | |||||||||||
| Selling expenses - amortization of deferred asset | 10,604,586 | 10,188,098 | 416,488 | 4.1 | % | |||||||||||
| General and administrative expenses | 2,606,749 | 3,463,127 | (856,378 | ) | -24.7 | % | ||||||||||
| Impairment of assets | 0 | 1,659,729 | (1,659,729 | ) | -100.0 | % | ||||||||||
| Total operating expenses | 15,265,360 | 16,243,548 | (978,188 | ) | -6.0 | % | ||||||||||
| Income from operations | 12,925,157 | 9,917,167 | 3,007,990 | 30.3 | % | |||||||||||
| Other income (expense) | ||||||||||||||||
| Other income (expense) | 10,651 | 65,563 | (54,912 | ) | -83.8 | % | ||||||||||
| Interest income | 161,625 | 37,587 | 124,038 | 330.0 | % | |||||||||||
| Interest expense | (363,958 | ) | (472,104 | ) | 108,146 | -22.9 | % | |||||||||
| Total other income (expense) | (191,682 | ) | (368,954 | ) | 177,272 | -48.0 | % | |||||||||
| Income before income taxes | 12,733,475 | 9,548,213 | 3,185,262 | 33.4 | % | |||||||||||
| Provision for income taxes | 2,817,281 | 2,339,082 | 478,199 | 20.4 | % | |||||||||||
| Net income | 9,916,194 | 7,209,131 | 2,707,063 | 37.6 | % | |||||||||||
| Other comprehensive income | ||||||||||||||||
| Foreign currency translation gain | 1,534,901 | (2,838,362 | ) | 4,373,263 | -154.1 | % | ||||||||||
| Comprehensive income | $ | 11,451,095 | $ | 4,370,769 | $ | 7,080,326 | 162.0 | % | ||||||||
| Basic weighted average shares outstanding | 34,783,456 | 31,825,562 | 2,957,894 | 9.3 | % | |||||||||||
| Basic net earnings per share | $ | 0.29 | $ | 0.23 | $ | 0.06 | 25.9 | % | ||||||||
| Diluted weighted average shares outstanding | 34,783,456 | 31,825,562 | 2,957,894 | 9.3 | % | |||||||||||
| Diluted net earnings per share | $ | 0.29 | $ | 0.23 | $ | 0.06 | 25.9 | % | ||||||||
| 23 |
Net Sales
Total net sales for the three months ended March 31, 2015 were $79,487,215, an increase of $9,191,234, or 13.1%, from $70,295,981 for the three months ended March 31, 2014. This increase was due to an increase in Gufeng’s and Jinong’s net sales.
For the three months ended March 31, 2015, Jinong’s net sales increased $3,078,813, or 10.2%, to $33,289,392 from $30,210,579 for the three months ended March 31, 2014. This increase was mainly attributable to the greater sales of humic acid fertilizer products including our liquid and powder fertilizers with a higher unit price during this period as a result of our aggressive marketing strategy and the increased number of our distributors.
For the three months ended March 31, 2015, net sales at Gufeng were $45,022,731, an increase of $5,942,620, or 15.2% from $39,080,111 for the three months ended March 31, 2014. The increase was mainly attributable to Gufeng’s expanded marketing promotion strategy, especially one large amount sale to Sino-agri Group during the last three months.
For the three months ended March 31, 2015, Yuxing’s net sales were $1,175,092, an increase of $169,801 or 16.9%, from $1,005,291 during the three months ended March 31, 2014. The increase was mainly attributable to the increase in market demand on Yuxing’s top grade flowers during the last three months.
Cost of Goods Sold
Total cost of goods sold for the three months ended March 31, 2015 was $51,296,698, an increase of $7,161,432, or 16.2%, from $44,135,266 for the three months ended March 31, 2014. This increase was mainly due to the 13.1% increase in net sales.
Cost of goods sold by Jinong for the three months ended March 31, 2015 was $13,623,964, an increase of $1,449,116, or 11.9%, from $12,174,848 for the three months ended March 31, 2014. The increase in cost of goods was primarily attributable to Jinong’s higher net sales.
Cost of goods sold by Gufeng for the three months ended March 31, 2015 was $36,814,676, an increase of $5,555,791, or 17.8%, from $31,258,885 for the three months ended March 31, 2014. This increase was primarily attributable to an increase in the cost of raw materials and an increase in the sales of fertilizer products.
For the three months ended March 31, 2015, cost of goods sold by Yuxing was $858,058, an increase of $156,525, or 22.3%, from $701,533 for the three months ended March 31, 2014. This increase was mainly due to the increase in Yuxing’s net sales and raw materials costs.
Gross Profit
Total gross profit for the three months ended March 31, 2015 increased by $2,029,802 to $28,190,517, as compared to $26,160,715 for the three months ended March 31, 2014. Gross profit margin was 35.5% and 37.2% for the three months ended March 31, 2015 and 2014, respectively.
Gross profit generated by Jinong increased by $1,629,698, or 9.0%, to $19,655,429 for the three months ended March 31, 2015 from $18,035,731 for the three months ended March 31, 2014. Gross profit margin from Jinong’s sales was approximately 59.1% and 59.7% for the three months ended March 31, 2015 and 2014, respectively. The slight decrease in gross profit margin was mainly due to a small increase in product costs.
For the three months ended March 31, 2015, gross profit generated by Gufeng was $8,208,054, an increase of $386,828, or 4.9%, from $7,821,226 for the three months ended March 31, 2014. Gross profit margin from Gufeng’s sales was approximately 18.2% and 20.0% for the three months ended March 31, 2015 and 2014, respectively. The decrease in gross profit percentage was mainly due to the increased weight for lower-margin products sales in Gufeng’s total sales answering to market demand.
| 24 |
For the three months ended March 31, 2015, gross profit generated by Yuxing was $317,034, an increase of $13,276, or 4.4% from $303,758 for the three months ended March 31, 2014. The gross profit margin was approximately 27.0% and 30.2% for the three months ended March 31, 2015 and 2014, respectively. This decrease in gross profit margin was mainly due to an increase in the cost of raw materials for the three months ended March 31, 2015, compared to the same period in 2014.
Selling Expenses
Our selling expenses consisted primarily of salaries of sales personnel, advertising and promotion expenses, freight-out costs and related compensation. Selling expenses were $2,054,025, or 2.6%, of net sales for the three months ended March 31, 2015, as compared to $932,594 or 1.3% of net sales for the three months ended March 31, 2014, an increase of $1,121,431, or 120.2%. The selling expenses of Yuxing were $11,615 or 1.0% of Yuxing’s net sales for the three months ended March 31, 2015, as compared to $12,831, or 1.3% of Yuxing’s net sales for the three months ended March 31, 2014. The selling expenses of Gufeng were $435,347 or 1.0% of Gufeng’s net sales for the three months ended March 31, 2015, as compared to $518,400, or 1.3% of Gufeng’s net sales for the three months ended March 31, 2014. The selling expenses of Jinong for the three months ended March 31, 2015 were $1,607,063 or 4.8% of Jinong’s net sales, as compared to selling expenses of $401,362, or 1.3% of Jinong’s net sales for the three months ended March 31, 2014. The increase in Jinong’s selling expenses was due to Jinong’s expanded marketing efforts and the increase in shipping costs.
Selling Expenses – amortization of deferred assets
Our selling expenses - amortization of our deferred assets were $10,604,586, or 13.3%, of net sales for the three months ended March 31, 2015, as compared to $10,188,098 or 14.5% of net sales for the three months ended March 31, 2014, an increase of $416,488, or 4.1%. This increase was due to the increased amortization of the deferred tax assets for the three months ended March 31, 2015 related to our business strategy implemented since December 2013 that assists distributors in certain marketing efforts and develops standard stores to expand our competitive advantages and market shares.
General and Administrative Expenses
General and administrative expenses consisted primarily of related salaries, rental expenses, business development, depreciation and travel expenses incurred by our general and administrative departments and legal and professional expenses including expenses incurred and accrued for certain litigations. General and administrative expenses were $2,606,749, or 3.3% of net sales for the three months ended March 31, 2015, as compared to $3,463,127, or 4.9%, of net sales for the three months ended March 31, 2014, a decrease of $856,378, or 24.7%. The decrease in general and administrative expenses was mainly due to the related expenses in the stock compensation awarded to the employees which amounted to $1,081,125 for the three months ended March 31, 2015 as compared to $1,833,997 for the three months ended March 31, 2014.
Impairment of assets
During the quarter ended March 31, 2014, we determined that the fair value of the Jintai’s assets held for sale less disposal costs was less than the carrying amounts of the assets and took an impairment charge of $1,659,729. The carrying value of the assets held for sale at March 31, 2014 was reduced to $10,060,219 which is fair value less disposal costs. There was no such impairment charge during the three months ended March 31, 2015.
Total Other Expenses
Total other expenses consisted of income from subsidies received from the PRC government, interest income, interest expenses and bank charges. The total other expense for the three months ended March 31, 2015 was $191,682, as compared to $368,954 for the three months ended March 31, 2014, a decrease of $177,272, or 48.0%, Other income during the three months ended March 31, 2015 was $10,651, as compared to $65,563 during the three months ended March 31, 2014; a decrease of $54,912 or 83.8%. Interest income during the three months ended March 31, 2015 was $161,625, as compared to $37,587 during the three months ended March 31, 2014, an increase of $124,038 or 330.0%. This increase was due to the increased deposit in the banks as a result of our increased net income. Interest expenses during the three months ended March 31, 2015 was $363,958, as compared to $472,104 during the three months ended March 31, 2014, a decrease of $108,146 or 22.9%. This decrease is due to a lesser amount of short term loans outstanding in 2015 as compared to 2014.
| 25 |
Income Taxes
Jinong is subject to a preferred tax rate of 15% as a result of its business being classified as a High-Tech project under the PRC Enterprise Income Tax Law (“EIT”) that became effective on January 1, 2008. Jinong incurred income tax expenses of $1,119,876 for the three months ended March 31, 2015, as compared to $849,003 for the three months ended March 31, 2014, an increase of $270,873, or 31.9%. The increase was mainly due to Jinong’s higher net income.
Gufeng, subject to a tax rate of 25%, incurred income tax expenses of $1,697,405 for the three months ended March 31, 2015, as compared to $1,490,079 for the three months ended March 31, 2014, an increase of $207,326, or 13.9%, which was primarily due to Gufeng’s increased net income.
Yuxing has no income tax for the three months ended March 31, 2015 as a result of being exempted from paying income tax due to the fact its products fall into the tax exemption list set out in the EIT.
Net Income
Net income for the three months ended March 31, 2015 was $9,916,194, an increase of $2,707,063, or 37.6%, compared to $7,209,131 for the three months ended March 31, 2014. The increase was attributable to the increase in sales offset lower general and administrative expenses and no impairment of assets in the quarter ended March 31, 2015. Net income as a percentage of total net sales was approximately 12.5% and 10.3% for the three months ended March 31, 2015 and 2014, respectively.
Nine months ended March 31, 2015 compared to the nine months ended March 31, 2014.
| For the Nine Months Ended March 31, | ||||||||||||||||
| 2015 | 2014 | change $ | change % | |||||||||||||
| Sales | ||||||||||||||||
| Jinong | $ | 98,946,251 | $ | 88,261,203 | $ | 10,685,048 | 12.1 | % | ||||||||
| Gufeng | 82,787,611 | 70,318,209 | 12,469,402 | 17.7 | % | |||||||||||
| Yuxing | 3,106,317 | 2,654,517 | 451,800 | 17.0 | % | |||||||||||
| Net sales | 184,840,179 | 161,233,929 | 23,606,250 | 14.6 | % | |||||||||||
| Cost of goods sold | ||||||||||||||||
| Jinong | 39,318,627 | 37,013,941 | 2,304,686 | 6.2 | % | |||||||||||
| Gufeng | 67,448,840 | 54,759,629 | 12,689,211 | 23.2 | % | |||||||||||
| Yuxing | 2,298,767 | 1,978,441 | 320,326 | 16.2 | % | |||||||||||
| Cost of goods sold | 109,066,234 | 93,752,011 | 15,314,223 | 16.3 | % | |||||||||||
| Gross profit | 75,773,945 | 67,481,918 | 8,292,027 | 12.3 | % | |||||||||||
| Operating expenses | ||||||||||||||||
| Selling expenses | 4,770,727 | 2,145,231 | 2,625,496 | 122.4 | % | |||||||||||
| Selling expenses - amortization of deferred asset | 31,587,102 | 23,578,746 | 8,008,356 | 34.0 | % | |||||||||||
| General and administrative expenses | 8,920,360 | 11,368,835 | (2,448,475 | ) | -21.5 | % | ||||||||||
| Impairment of assets | 0 | 1,659,729 | (1,659,729 | ) | -100.0 | % | ||||||||||
| Total operating expenses | 45,278,189 | 38,752,541 | 6,525,648 | 16.8 | % | |||||||||||
| Income from operations | 30,495,756 | 28,729,377 | 1,766,379 | 6.1 | % | |||||||||||
| Other income (expense) | ||||||||||||||||
| Other income (expense) | 57,355 | (120,877 | ) | 178,232 | -147.4 | % | ||||||||||
| Interest income | 229,979 | 114,675 | 115,304 | 100.5 | % | |||||||||||
| Interest expense | (1,179,617 | ) | (1,009,528 | ) | (170,089 | ) | 16.8 | % | ||||||||
| Total other income (expense) | (892,283 | ) | (1,015,730 | ) | 123,447 | -12.2 | % | |||||||||
| Income before income taxes | 29,603,473 | 27,713,647 | 1,889,826 | 6.8 | % | |||||||||||
| Provision for income taxes | 6,372,760 | 6,450,322 | (77,562 | ) | -1.2 | % | ||||||||||
| Net income | 23,230,713 | 21,263,325 | 1,967,388 | 9.3 | % | |||||||||||
| Other comprehensive income | ||||||||||||||||
| Foreign currency translation gain | 2,161,055 | 803,434 | 1,357,621 | 169.0 | % | |||||||||||
| Comprehensive income | $ | 25,391,768 | $ | 22,066,759 | $ | 3,325,009 | 15.1 | % | ||||||||
| Basic weighted average shares outstanding | 33,471,214 | 31,201,076 | 2,270,138 | 7.3 | % | |||||||||||
| Basic net earnings per share | $ | 0.69 | $ | 0.68 | $ | 0.01 | 1.8 | % | ||||||||
| Diluted weighted average shares outstanding | 33,471,214 | 31,201,076 | 2,270,138 | 7.3 | % | |||||||||||
| Diluted net earnings per share | $ | 0.69 | $ | 0.68 | $ | 0.01 | 1.8 | % | ||||||||
| 26 |
Net Sales
Total net sales for the nine months ended March 31, 2015 were $184,840,179, an increase of $23,606,250 or 14.6%, from $161,233,929 for the nine months ended March 31, 2014. This increase was largely due to the increase in Jinong’s and Gufeng’s net sales.
For the nine months ended March 31, 2015, Jinong’s net sales increased $10,685,047, or 12.1%, to $98,946,250 from $88,261,203 for the nine months ended March 31, 2014. This increase was mainly attributable to the greater sales of humic acid fertilizer products including our liquid and powder fertilizers during this period as a result of the increased number of our distributors and our marketing efforts.
For the nine months ended March 31, 2015, net sales at Gufeng were $82,787,612, an increase of $12,469,403, or 17.7%, from $70,318,209 for the nine months ended March 31, 2014. The increase was mainly attributable to Gufeng’s expanded marketing promotion strategy, especially one large amount sale to Sino-agri Group during the last nine months.
For the nine months ended March 31, 2015, Yuxing’s net sales were $3,106,317, an increase of $451,800, or 17.0%, from $2,654,517 during the nine months ended March 31, 2014. The increase was mainly due to the increase in sales demand on Yuxing’s top-grade flowers during the last three months.
Cost of Goods Sold
Total cost of goods sold for the nine months ended March 31, 2015 was $109,066,234, an increase of $15,314,223, or 16.3%, from $93,752,011 for the nine months ended March 31, 2014. This increase was mainly due to the 14.6% increase in net sales.
Cost of goods sold by Jinong for the nine months ended March 31, 2015 was $39,318,627, an increase of $2,304,686, or 6.2%, from $37,013,941 for the nine months ended March 31, 2014. Although Jinong lowered the product costs for the mix of products being sold, the increase was primarily attributable to its higher net sales.
Cost of goods sold by Gufeng for the nine months ended March 31, 2015 was $67,448,840, an increase of $12,689,211, or 23.2%, from $54,759,629 for the nine months ended March 31, 2014. This increase was primarily attributable to an increase in the cost of raw materials and an increase in the sales of fertilizer products.
| 27 |
For the nine months ended March 31, 2015, cost of goods sold by Yuxing was $2,298,767, an increase of $320,326, or 16.2%, from $1,978,441 for the nine months ended March 31, 2014. This increase was mainly due to the 17.0% increase in Yuxing’s net sales.
Gross Profit
Total gross profit for the nine months ended March 31, 2015 increased by $8,292,027 to $75,773,945, as compared to $67,481,918 for the nine months ended March 31, 2014. Gross profit margin was 41.0% and 41.9% for the nine months ended March 31, 2015 and 2014, respectively.
Gross profit generated by Jinong increased by $8,380,362, or 16.4%, to $59,627,624 for the nine months ended March 31, 2015 from $51,247,262 for the nine months ended March 31, 2014. Gross profit margin from Jinong’s sales was approximately 60.3% and 58.1% for the nine months ended March 31, 2015 and 2014, respectively. The increase in gross profit margin was mainly due to the increased weight for higher-margin products sales in Jinong’s total sales due to Jinong’s sales strategy. Jinong has adjusted its production process to focus on producing the high-margin liquid fertilizer during the last nine months.
For the nine months ended March 31, 2015, gross profit generated by Gufeng was $15,338,771, a decrease of $219,809, or 1.4%, from $15,558,580 for the nine months ended March 31, 2014. Gross profit margin from Gufeng’s sales was approximately 18.5% and 22.1% for the nine months ended March 31, 2015 and 2014, respectively. The decrease in gross profit percentage was mainly due to the increased weight for lower-margin products sales in Gufeng’s total sales answering to market demand.
For the nine months ended March 31, 2015, gross profit generated by Yuxing was $807,550, an increase of $131,474, or 19.4% from $676,076 for the nine months ended March 31, 2014. The gross profit margin was approximately 26.0% and 25.5% for the nine months ended March 31, 2015 and 2014, respectively. This slight increase in gross profit percentage was mainly due to the increase in price of the flowers Yuxing sold during the nine months ended March 31, 2015, compared to the same period in 2014.
Selling Expenses
Our selling expenses consisted primarily of salaries of sales personnel, advertising and promotion expenses, freight-out costs and related compensation. Selling expenses were $4,770,727, or 2.6%, of net sales for the nine months ended March 31, 2015, as compared to $2,145,231 or 1.3% of net sales for the nine months ended March 31, 2014, an increase of $2,625,496, or 122.4%. The selling expenses of Yuxing were $32,688 or 1.1% of Yuxing’s net sales for the nine months ended March 31, 2015, as compared to $38,598, or 1.5% of Yuxing’s net sales for the nine months ended March 31, 2014.The selling expenses of Gufeng were $849,813 or 1.0% of Gufeng’s net sales for the nine months ended March 31, 2015, as compared to $986,548, or 1.4% of Gufeng’s net sales for the nine months ended March 31, 2014. The selling expenses of Jinong for the nine months ended March 31, 2015 were $3,888,226 or 3.9% of Jinong’s net sales, as compared to selling expenses of $1,120,085, or 1.3% of Jinong’s net sales for the nine months ended March 31, 2014. The increase in Jinong’s selling expenses was due to Jinong’s expanded marketing efforts and the increase in shipping costs.
Selling Expenses – amortization of deferred assets
Our selling expenses - amortization of our deferred assets were $31,587,102, or 17.1%, of net sales for the nine months ended March 31, 2015, as compared to $23,578,746 or 14.6% of net sales for the nine months ended March 31, 2014, an increase of $8,008,356, or 34.0%. This increase was due to the increased amortization of the deferred tax assets for the nine months ended March 31, 2015 related to our business strategy implemented since the first quarter of fiscal year of 2014 that assists distributors in certain marketing efforts and develops standard stores to expand our competitive advantages and market shares.
| 28 |
General and Administrative Expenses
General and administrative expenses consisted primarily of related salaries, rental expenses, business development, depreciation and travel expenses incurred by our general and administrative departments and legal and professional expenses including expenses incurred and accrued for certain litigations. General and administrative expenses were $8,920,360, or 4.8% of net sales for the nine months ended March 31, 2015, as compared to $11,368,835, or 7.1%, of net sales for the nine months ended March 31, 2014, a decrease of $2,448,475, or 21.5%. The decrease in general and administrative expenses was mainly due to the related expenses in the stock compensation awarded to the employees which amounted to $4,150,995 for the nine months ended March 31, 2015 as compared to $6,638,246 for the nine months ended March 31, 2014.
Total Other Expenses
Total other expenses consisted of income from subsidies received from the PRC government, interest income, interest expenses and bank charges. The total other expense for the nine months ended March 31, 2015 was $892,283, as compared to $1,015,730 for the nine months ended March 31, 2014, a decrease of $123,447, or 12.2%. Other income during the nine months ended March 31, 2015 was $57,355, as compared to other expense of $120,877 during the nine months ended March 31, 2014; an increase of $178,232 or 147.4%. Interest income during the nine months ended March 31, 2015 was $229,979, as compared to $114,675 during the nine months ended March 31, 2014, an increase of $115,304 or 100.5%. This increase was due to the increased deposit in the banks as a result of our increased net income. Interest expenses during the nine months ended March 31, 2015 was $1,179,617, as compared to $1,009,528 during the nine months ended March 31, 2014, an increase of $170,089 or 16.8%. This increase is due to a more of short term loans outstanding in 2015 as compared to 2014.
Income Taxes
Jinong is subject to a preferred tax rate of 15% as a result of its business being classified as a High-Tech project under the PRC Enterprise Income Tax Law (“EIT”) that became effective on January 1, 2008. Jinong incurred income tax expenses of $3,581,931 for the nine months ended March 31, 2015, as compared to $3,698,296 for the nine months ended March 31, 2014, a decrease of $116,365, or 3.1% due to Jinong’s decreased net income.
Gufeng, subject to a tax rate of 25%, incurred income tax expenses of $2,790,829 for the nine months ended March 31, 2015, as compared to $2,752,026 for the nine months ended March 31, 2014, an increase of $38,803, or 1.4% which was primarily due to Gufeng’s increased net income.
Yuxing has no income tax for the nine months ended March 31, 2015 as a result of being exempted from paying income tax due to its products fall into the tax exemption list set out in the EIT.
Net Income
Net income for the nine months ended March 31, 2015 was $23,230,713, an increase of $1,967,388, or 9.3%, compared to $21,263,325 for the nine months ended March 31, 2014. The increase was attributable to the increase in net sales offset by an increase in selling expenses and selling expenses – amortization of deferred asset. Net income as a percentage of total net sales was approximately 12.6% and 13.2% for the nine months ended March 31, 2015 and 2014, respectively.
Discussion of Segment Profitability Measures
As of March 31, 2015, we were engaged in the following businesses: the production and sale of fertilizers through Jinong and Gufeng and the production and sale of high-quality agricultural products by Yuxing. For financial reporting purpose, our operations were organized into three main business segments based on locations and products: Jinong (fertilizer production), Gufeng (fertilizer production) and Yuxing (agricultural products production). Each of the segments has its own annual budget with regard to development, production and sales. Jintai is in its final migrating process into Yuxing which expected to complete by the next quarter.
Each of the three operating segments referenced above has separate and distinct general ledgers. The chief operating decision maker (“CODM”) makes decisions with respect to resources allocation and performance assessment upon receiving financial information, including revenue, gross margin, operating income and net income produced from the various general ledger systems; however, net income by segment is the principal benchmark to measure profit or loss adopted by the CODM.
| 29 |
For Jinong, the net income decreased by $468,085 or 2.3% to $19,849,731 for the nine months ended March 31, 2015 from $20,317,816 for the nine months ended March 31, 2014.
For Gufeng, the net income increased by $80,884 or 1.0% to $8,223,840 for the nine months ended March 31, 2015 from $8,142,956 for the nine months ended March 31, 2014.
For Yuxing, the net income increased by $371,118 or 134.8% to $646,347 for the nine months ended March 31, 2015 from $275,229 for the nine months ended March 31, 2014. The increase was mainly due to the decrease in its general and administrative expenses as a result of Yuxing’s more cost-control measures taken for the nine months ended March 31, 2015, compare to the same period a year before.
Liquidity and Capital Resources
Our principal sources of liquidity include cash from operations, borrowings from local commercial banks and net proceeds of offerings of our securities consummated in July 2009 and November/December 2009 (collectively the “Public Offerings”).
As of March 31, 2015, cash and cash equivalents were $74,785,851, an increase of $47,895,530, or 178.1%, from $26,890,321 as of June 30, 2014.
On January 30, 2015, we paid $2,161,904 on dividend previously announced on October 1, 2014 to our stockholders of common stock on the record date of October 31, 2014. Certain stockholders, including the Company’s Chairman, Mr. Li, elected to waive the dividend payment due to them and directed the Company to retain the funds for working capital purposes.
We intend to use our working capital to acquire new businesses, upgrade production lines and complete Yuxing’s new greenhouse facilities for agriculture products located on 88 acres of land in Hu County, 18 kilometers southeast of Xi’an city. Our liquidity needs have generally consisted of working capital necessary to finance receivables, raw material and finished goods inventory. We believe that we have sufficient cash on hand and positive projected cash flow from operations to support our business growth for the next twelve months to the extent we do not have further significant acquisitions or expansions. However, if events or circumstances occur and we do not meet our operating plan as expected, we may be required to seek additional capital and/or to reduce certain discretionary spending, which could have a material adverse effect on our ability to achieve our business objectives. Notwithstanding the foregoing, we may seek additional financing as necessary for expansion purposes and when we believe market conditions are most advantageous, which may include additional debt and/or equity financings. There can be no assurance that any additional financing will be available on acceptable terms, if at all. Any equity financing may result in dilution to existing stockholders and any debt financing may include restrictive covenants.
The following table sets forth a summary of our cash flows for the periods indicated:
| Nine Months Ended March 31, | ||||||||
| 2015 | 2014 | |||||||
| Net cash provided by operating activities | $ | 57,917,370 | $ | 1,281,974 | ||||
| Net cash used in investing activities | (7,675,141 | ) | (66,092,306 | ) | ||||
| Net cash provided by (used in) financing activities | (2,689,731 | ) | 13,212,900 | |||||
| Effect of exchange rate change on cash and cash equivalents | 343,032 | 453,302 | ||||||
| Net increase (decrease) in cash and cash equivalents | 47,895,530 | (51,144,130 | ) | |||||
| Cash and cash equivalents, beginning balance | 26,890,321 | 75,031,489 | ||||||
| Cash and cash equivalents, ending balance | $ | 74,785,851 | $ | 23,887,359 | ||||
| 30 |
Operating Activities
Net cash provided in operating activities was $57,917,370 for the nine months ended March 31, 2015, an increase of $56,635,396 compared to $1,281,974 for the nine months ended March 31, 2014. The increase was mainly attributable to the decrease in accounts receivable and advances to suppliers, increase in account payable and an increase in depreciation and amortization, offset by an increase in inventories and a decrease in customer deposits during the nine months ended March 31, 2015 as compared to the same period in 2014.
Investing Activities
Net cash used in investing activities for the nine months ended March 31, 2015 was $7,675,141, a decrease of $58,417,165, or 88.4% from $66,092,306 for the nine months ended March 31, 2014. During the nine months ended March 31, 2015, Jinong assisted its distributors in marketing to expand its competitive product advantage and market share by advancing them $9,228,043 during the nine months ended March 31, 2015 compared to $64,964,848 during the nine months ended March 31, 2014.
Financing Activities
Net cash used in financing activities for the nine months ended March 31, 2015 was $2,689,731, a decrease of $15,902,631 or 120.4% compared to cash provided by financing activities of $13,212,900 for the nine months ended March 31, 2014. During the nine months ended March 31, 2015, we received $19,702,970 from the proceeds from loans and repaid loans of $22,403,790 compared to $28,633,885 of proceeds and $15,870,985 repayments during the nine months ended March 31, 2014. In addition, during the nine months ended March 31, 2015, we sold 552,495 shares of our common stock for proceeds of $1,245,746 to our employees under our employee stock purchase plan and received $626,847 from the sale of 326,483 shares of our common stock to our Chairman, Mr. Li. In addition, we paid $2,161,904 cash dividend during the nine months ended March 31, 2015.
As of March 31, 2015 and June 30, 2014, our loans payable were as follows:
| March 31, 2015 | June 30, 2014 | |||||||
| Short term loans payable: | $ | 21,438,080 | $ | 24,002,720 | ||||
| Total | $ | 21,438,080 | $ | 24,002,720 | ||||
Accounts Receivable
We had accounts receivable of $71,832,200 as of March 31, 2015, as compared to $88,781,608 as of June 30, 2014, a decrease of $16,949,408 or 19.1%, which is mainly attributable to Gufeng. As of March 31, 2015, Gufeng had accounts receivable of $1,118,448, a decrease of $17,538,710, or 94.0%, comparing to $18,657,158 as of June 30, 2014. The decrease is mainly due to a number of large clients paid up their account payable to Gufeng during the last nine months.
Allowance for doubtful accounts in accounts receivable for the nine months ended March 31, 2015 was $285,077, an increase of $47,483 or 20.0% from $237,594 as of June 30, 2014. The allowance for doubtful accounts as a percentage of accounts receivable was 0.40% as of March 31, 2015 and 0.27% as of June 30, 2014.
Deferred assets
We had deferred assets of $61,740,441 as of March 31, 2015, as compared to $83,680,425 as of June 30, 2014. We have been assisting our distributors in certain marketing efforts and developing standard stores to enhance our competitive advantages and market shares since December 31, 2013. Based on the cooperation agreement, the amount owed by the distributors in certain marketing efforts and store development will be expensed over three years as long as the distributors are actively selling our products. If a distributor defaults, breaches, or terminates the agreement with us earlier than the realization of contractual terms, the unamortized portion of the amount owed by the distributor has to be refunded to us immediately. The Company’s Chairman and CEO, Mr. Li, guaranteed to the Company of amounts remaining unpaid due from the distributors.
| 31 |
Inventories
We had an inventory of $123,627,598 as of March 31, 2015, as compared to $75,486,898 as of June 30, 2014, an increase of $48,140,700, or 63.8%. The increase is mainly due to Gufeng’s $105,125,704 inventory as of March 31, 2015. Such seasonal increase was largely attributable to the preparatory replenishment of raw material at a lower price for the expected large production of fertilizer in the incoming winter to meet the anticipated large orders, as well as the accumulation of finished fertilizer products in expecting a huge demand in the near future.
Advances to Suppliers
We had advances to suppliers of $16,156,459 as of March 31, 2015 as compared to $32,630,865 as of June 30, 2014, representing a decrease of $16,474,406 or 50.5%.The decrease in the amount of advances to suppliers is a result of Gufeng’s higher inventory level. Gufeng’s compound fertilizer business is seasonal, which may result in carrying significant amounts of inventory and seasonal variations in working capital. To ensure our ability to deliver compound fertilizer to the distributor timely prior to the planting season, we need to have sufficient raw material in stock to stabilize the production. To build up the inventory, we typically make advance payment to the suppliers to secure the supply of raw material of basic fertilizer. Our inventory level may fluctuate from time to time, depending how fast the raw material gets consumed and replenished during the production process, and how fast the finished goods get sold. The replenishment of raw material relies on the management’s estimate of numerous factors, including but not limited to, the raw material’s future price, and spot price along with their volatility, as well as the seasonal demand and future price of finished fertilizer products. Such estimate may not be accurate, and the purchase decision of raw materials based on the estimate can cause excessive inventories in slow sales and insufficient inventories in peak times.
Accounts Payable
We had accounts payable of $4,339,791 as of March 31, 2015 as compared to $3,378,248 as of June 30, 2014, representing an increase of $961,543, or 28.5%. The increase was primarily due to the increase in Gufeng’s account payable from $1,296,965 as of June 30, 2014 to $2,773,334 as of March 31, 2015.
Unearned Revenue (Customer Deposits)
We had unearned revenue of $26,108,848 as of March 31, 2015 as compared to $25,700,586 as of June 30, 2014, representing an increase of $408,262, or 1.6%. We expect to deliver products to our customers during the next three months at which time we will recognize the revenue.
Off-Balance Sheet Arrangements
We do not have any off-balance sheet arrangements.
Critical Accounting Policies and Estimates
Management’s discussion and analysis of its financial condition and results of operations are based upon our consolidated financial statements, which have been prepared in accordance with United States generally accepted accounting principles. Our financial statements reflect the selection and application of accounting policies which require management to make significant estimates and judgments. See Note 2 to our consolidated financial statements, “Basis of Presentation and Summary of Significant Accounting Policies.” We believe that the following paragraphs reflect the most critical accounting policies that currently affect our financial condition and results of operations:
Use of estimates
The preparation of consolidated financial statements in conformity with accounting principles generally accepted in the United States of America requires management to make estimates and assumptions that affect the reported amounts of assets and liabilities and disclosure of contingent assets and liabilities at the date of the consolidated financial statements and the amount of revenues and expenses during the reporting periods. Management makes these estimates using the best information available at the time the estimates are made. However, actual results could differ materially from those estimates.
| 32 |
Revenue recognition
Sales revenue is recognized at the date of shipment to customers when a formal arrangement exists, the price is fixed or determinable, the delivery is completed, we have no other significant obligations and collectability is reasonably assured. Payments received before all of the relevant criteria for revenue recognition are satisfied are recorded as unearned revenue.
Our revenue consists of invoiced value of goods, net of a value-added tax (VAT). No product return or sales discount allowance is made as products delivered and accepted by customers are normally not returnable and sales discounts are normally not granted after products are delivered.
Cash and cash equivalents
For statement of cash flows purposes, we consider all cash on hand and in banks, certificates of deposit and other highly-liquid investments with maturities of three months or less, when purchased, to be cash and cash equivalents.
Accounts receivable
Our policy is to maintain reserves for potential credit losses on accounts receivable. Management reviews the composition of accounts receivable and analyzes historical bad debts, customer concentrations, customer credit worthiness, current economic trends and changes in customer payment patterns to evaluate the adequacy of these reserves. Any accounts receivable of Jinong and Gufeng that is outstanding for more than 180 days will be accounted as allowance for bad debts, and any accounts receivable of Yuxing that is outstanding for more than 90 days will be accounted as allowance for bad debts.
Deferred assets
Deferred assets represent amounts the Company advanced to the distributors in their marketing and stores development to expand our competitive advantage and market shares. Based on the cooperation agreement, the amount owed by the distributors in certain marketing efforts and store development will be expensed over three years as long as the distributors are actively selling our products. If a distributor defaults, breaches, or terminates the agreement with us earlier than the realization the contractual terms, the unamortized portion of the amount owed by the distributor has to be refunded to us immediately. The Company’s Chairman and CEO, Mr. Li, guaranteed to the Company of amounts remaining unpaid due from the distributors.
Segment reporting
FASB ASC 280 requires use of the “management approach” model for segment reporting. The management approach model is based on the way a company’s management organizes segments within the company for making operating decisions and assessing performance. Reportable segments are based on products and services, geography, legal structure, management structure, or any other manner in which management disaggregates a company.
As of March 31, 2015, we were organized into three main business segments: Jinong (fertilizer production), Gufeng (fertilizer production) and Yuxing (agricultural products production).
| 33 |
Item 3. Quantitative and Qualitative Disclosures About Market Risk
Disclosures About Market Risk
We may be exposed to changes in financial market conditions in the normal course of business. Market risk generally represents the risk that losses may occur as a result of movements in interest rates and equity prices. We currently do not, in the normal course of business, use financial instruments that are subject to changes in financial market conditions.
Currency Fluctuations and Foreign Currency Risk
Substantially all of our revenues and expenses are denominated in the RMB. However, we use the U.S. dollar for financial reporting purposes. Conversion of the RMB into foreign currencies is regulated by the People’s Bank of China through a unified floating exchange rate system. Although the PRC government has stated its intention to support the value of the RMB, there can be no assurance that such exchange rate will not again become volatile or that the RMB will not devalue significantly against the U.S. dollar. Exchange rate fluctuations may adversely affect the value, in U.S. dollar terms, of our net assets and income derived from our operations in the PRC.
Our reporting currency is the U.S. dollar. Except for the U.S. holding companies, all of our consolidated revenues, consolidated costs and expenses, and our assets are denominated in the RMB. As a result, we are exposed to foreign exchange risk as our revenues and results of operations may be affected by fluctuations in the exchange rate between U.S. dollars and RMB. If the RMB depreciates against the U.S. dollar, the value of our RMB revenues, earnings and assets as expressed in our U.S. dollar financial statements will decline. Assets and liabilities are translated at the exchange rates as of the balance sheet dates, revenues and expenses are translated at the average exchange rates, and shareholders’ equity is translated at historical exchange rates. Any resulting translation adjustments are not included in determining net income but are included in determining other comprehensive income, a component of shareholders’ equity. As of March 31, 2015, our accumulated other comprehensive income was $25.4 million. We have not entered into any hedging transactions in an effort to reduce our exposure to foreign exchange risk. The value of the RMB against the U.S. dollar and other currencies is affected by, among other things, changes in the PRC’s political and economic conditions. Since July 2005, the RMB has not been pegged to the U.S. dollar. Although the People’s Bank of China regularly intervenes in the foreign exchange market to prevent significant short-term fluctuations in the exchange rate, the RMB may appreciate or depreciate significantly in value against the U.S. dollar in the medium to long term. Moreover, it is possible that, in the future, PRC authorities may lift restrictions on fluctuations in the RMB exchange rate and lessen intervention in the foreign exchange market.
Interest Rate Risk
We deposit surplus funds with Chinese banks earning daily interest. We do not invest in any instruments for trading purposes. All of our outstanding debt instruments carry fixed rates of interests. The amount of short-term debt outstanding as of March 31, 2015 and June 30, 2014 was $21.4 million and $24.0 million, respectively. We are exposed to interest rate risk primarily with respect to our short-term bank loans. Although the interest rates, which are based on the banks’ prime rates with respect to our short-term loans, are fixed for the terms of the loans, the terms are typically three to twelve months for short-term bank loans and interest rates are subject to change upon renewal. There were no material changes in interest rates for short-term bank loans renewed during the three months ended March 31, 2015. The original loan term on average is one year, and the remaining average life of the short term-loans is approximately five months.
| 34 |
Management monitors the banks’ prime rates in conjunction with our cash requirements to determine the appropriate level of debt balances relative to other sources of funds. We have not entered into any hedging transactions in an effort to reduce our exposure to interest rate risk.
Credit Risk
We have not experienced significant credit risk, as most of our customers are long-term customers with superior payment records. Our receivables are monitored regularly by our credit managers.
Inflation Risk
Inflationary factors such as increases in the cost of our products and overhead costs may adversely affect our operating results. Although we do not believe that inflation has had a material impact on our financial position or results of operations to date, a high rate of inflation in the future may have an adverse effect on our ability to maintain current levels of gross margin and selling, general and administrative expenses as a percentage of net revenues if the selling prices of our products do not increase with these increased costs.
Item 4. Controls and Procedures
(a) Evaluation of disclosure controls and procedures
At the conclusion of the period ended March 31, 2015 we carried out an evaluation, under the supervision and with the participation of our management, including our Chief Executive Officer (“CEO”) and Chief Financial Officer (“CFO”), of the effectiveness of the design and operation of our disclosure controls and procedures (as such term is defined in Rules 13a-15(e) and 15d-15(e) under the Securities Exchange Act of 1934 (the “Exchange Act”)). Based upon that evaluation, our CEO and CFO concluded that as of the end of the period covered by this Quarterly Report, our disclosure controls and procedures were effective and adequately designed to ensure that the information required to be disclosed by us in the reports we file or submit under the Exchange Act is recorded, processed, summarized and reported within the time periods specified in the applicable rules and forms, and that such information was accumulated and communicated to our management, including our CEO and CFO, in a manner that allowed for timely decisions regarding required disclosure.
(b) Changes in internal controls
There were no changes in our internal control over financial reporting identified in connection with the evaluation required by paragraph (d) of Exchange Act Rules 13a-15 or 15d-15 that occurred during the quarter ended March 31, 2015 that have materially affected, or are reasonably likely to materially affect, our internal control over financial reporting.
| 35 |
The exhibits required by this item are set forth in the Exhibit Index attached hereto.
| 36 |
Pursuant to the requirements of the Securities Exchange Act of 1934, the Registrant has duly caused this report to be signed on its behalf by the undersigned thereunto duly authorized.
| CHINA GREEN AGRICULTURE, INC. | |||
| Date: May 11, 2015 | By: | /s/ Tao Li | |
| Name: Tao Li | |||
| Title: President and Chief Executive Officer | |||
| (principal executive officer) | |||
| Date: May 11, 2015 | By: | /s/ Ken Ren | |
| Name: Ken Ren | |||
| Title: Chief Financial Officer | |||
| (principal financial officer and principal accounting officer) | |||
| 37 |
| No. | Description | |
| 31.1 | Certification of Principal Executive Officer pursuant to Section 302 of the Sarbanes-Oxley Act of 2002. | |
| 31.2 | Certification of Principal Financial Officer pursuant to Section 302 of the Sarbanes-Oxley Act of 2002. | |
| 32.1 | Certification of Principal Executive Officer and Principal Financial Officer pursuant to Section 906 of the Sarbanes-Oxley Act of 2002. | |
| 101.INS | XBRL Instance Document | |
| 101.SCH | XBRL Taxonomy Extension Schema Document | |
| 101.CAL | XBRL Taxonomy Extension Calculation Linkbase Document | |
| 101.DEF | XBRL Taxonomy Extension Definition Linkbase Document | |
| 101.LAB | XBRL Taxonomy Extension Label Linkbase Document | |
| 101.PRE | XBRL Taxonomy Extension Presentation Linkbase Document |
| 38 |