Attached files
| file | filename |
|---|---|
| EX-99.1 - EARNINGS RELEASE - REPUBLIC AIRWAYS HOLDINGS INC | ex991-er2015q1.htm |
| 8-K - 8-K - REPUBLIC AIRWAYS HOLDINGS INC | a1stquarter2015er.htm |

Investor Update May 7, 2015

2 Safe Harbor Disclosure DISCLAIMER Statements in this presentation, as well as oral statements that may be made by officers or directors of Republic Airways Holdings Inc., its advisors, affiliates or subsidiaries (collectively or separately the “Company”), that are not historical fact constitute “forward-looking statements”. Such forward-looking statements involve known and unknown risks, uncertainties and other factors that could cause the actual results of the Company to differ materially from historical results or from any results expressed or implied by the forward-looking statements. Such risks and uncertainties are outlined in the Company’s Annual Report on Form 10-K, most recent Quarterly Report and other documents filed with the SEC from time to time. The Company cautions users of this presentation not to place undue reliance on forward-looking statements, which may be based on assumptions and anticipated events that do not materialize.

3 Updated Operating Fleet Plan 2015 (End of Period) 31 23 23 22 38 38 38 44 58 58 58 58 41 47 47 47 30 30 30 30 41 41 41 41 20 53 58 47 30 41 244 YE 2014 5 249 0 4Q15 247 5 242 5 2Q15 3Q15 5 1Q15 242 UA Ejet (E170/175) Q400US Ejet (E170/175)DL Ejet (E170/175) DL ERJ (E145) AA Ejet (E175) E190

4 Expected Operating Statistics 540,650 596,388 736,000 137,621 104,735 117,000 23,000 0 2016 876,000 74,087 2015 5,372 761,569 55,0749,633 2014 761,991 +15.0% -0.1% Q400 ERJ E190 E-Jet 279,337 311,253 380,000 88,498 68,712 71,000 51,601 425,067 5,631 2016 467,000 16,000 0 2015 421,227 37,718 3,544 2014 -0.9% +10.9% 15,757 11,682 12,802 +16.3% 1,219 2015 1,332 162 14,975 2016 17,420 2014 14,628 792 01,119 220 331 1,607 +2.4% BLOCK HOURS DEPARTURES AVAILABLE SEAT MILES (millions)

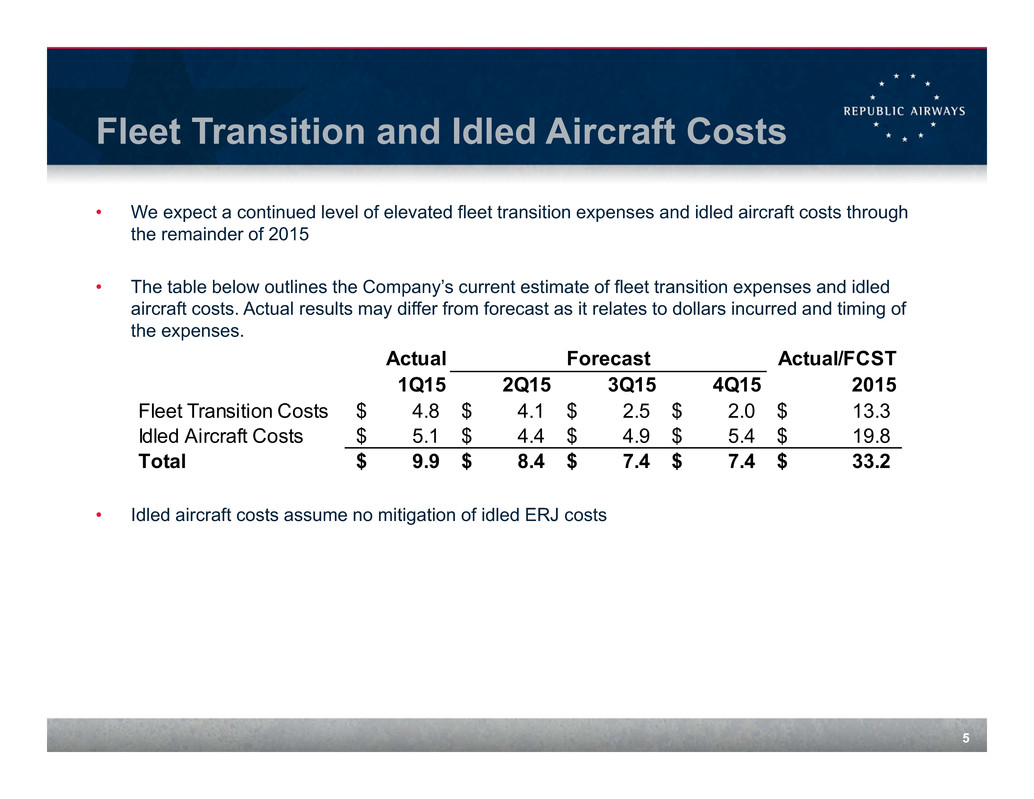
5 Fleet Transition and Idled Aircraft Costs • We expect a continued level of elevated fleet transition expenses and idled aircraft costs through the remainder of 2015 • The table below outlines the Company’s current estimate of fleet transition expenses and idled aircraft costs. Actual results may differ from forecast as it relates to dollars incurred and timing of the expenses. • Idled aircraft costs assume no mitigation of idled ERJ costs Actual Actual/FCST 1Q15 2Q15 3Q15 4Q15 2015 Fleet Transition Costs 4.8$ 4.1$ 2.5$ 2.0$ 13.3$ Idled Aircraft Costs 5.1$ 4.4$ 4.9$ 5.4$ 19.8$ Total 9.9$ 8.4$ 7.4$ 7.4$ 33.2$ Forecast

6 2nd Quarter and Full Year 2015 Guidance ($ in millions, except per share amounts) Guidance Low High Low High Low High Operating revenues $345 $355 $1,400 $1,460 $1,375 $1,435 Pretax margin % * 5.0% 7.0% 7.0% 8.5% 5.0% 7.0% Diluted earnings per share * $0.20 $0.30 $1.20 $1.50 $0.85 $1.15 Block hours Departures -1% 0% Available seat miles (millions) 4% 6% 2% 3% * includes the fleet transition expenses and idled aircraft costs detailed on slide 5 of this presentation Note: the above guidance does not include any costs associated with a new pilot CBA or signing bonus ~ 105,000 not provided ~ 3,660 Flat vs. prior year Flat vs. prior year~ 189,000 Full Year 2015 Old New Full Year 20152Q15
