Attached files
| file | filename |
|---|---|
| EX-99.1 - EXHIBIT 99.1 - Dealertrack Technologies, Inc | v409973_ex99-1.htm |
| 8-K - 8-K - Dealertrack Technologies, Inc | v409973_8k.htm |
Exhibit 99.2

1 May 8, 2015 Investor Presentation

2 Safe Harbor for Forward - Looking Statements ■ Statements in this investor presentation regarding Dealertrack’s expected 2015 performance based on both GAAP and non - GAAP measures, estimated or forecasted information for periods in or after 2015 , the long - term outlook for its business, and all other statements in this release other than the recitation of historical facts are forward - looking statements (as defined in the Private Securities Litigation Reform Act of 1995 ) . These statements involve a number of risks, uncertainties and other factors that could cause actual results, performance or achievements of Dealertrack to be materially different from any future results, performance or achievements expressed or implied by these forward - looking statements . ■ Factors that might cause such a difference include : economic trends that affect the automotive retail industry or the indirect automotive financing industry including the number of new and used cars sold ; credit availability ; reductions in automotive dealerships ; increased competitive pressure from other industry participants, including CDK Global (formerly ADP), Cox Automotive, Dominion Dealer Solutions, Open Dealer Exchange, Reynolds and Reynolds, RouteOne and Solera Holdings ; the impact of some vendors of software products for automotive dealers making it more difficult for our customers to use our solutions and services ; security breaches, interruptions, failures and/or other errors involving our systems or networks ; the failure or inability to execute any element of our business strategy, including selling additional products and services to existing and new customers ; our success in implementing an ERP and CRM systems ; the volatility of our stock price ; new regulations or changes to existing regulations ; the integration of recent acquisitions and the expected benefits, as well as the integration and expected benefits of any future acquisitions that we may pursue ; our success in expanding our customer base and product and service offerings, the impact of recent economic trends, and difficulties and increased costs associated with raising additional capital ; the impairment of intangible assets, such as trademarks and goodwill ; the possibility that the expected benefits of our acquisition of incadea may not materialize as expected ; failure to successfully integrate the business, infrastructure and employees of incadea ; and other risks listed in our reports filed with the Securities and Exchange Commission (SEC), including our most recent Annual Report on Form 10 - K . These filings can be found on our website at www . dealertrack . com and the SEC’s website at www . sec . gov . Forward - looking statements included herein speak only as of the date hereof and Dealertrack disclaims any obligation to revise or update such statements to reflect events or circumstances after the date hereof or to reflect the occurrence of unanticipated events or circumstances, except as required by law .

3 ▪ Founded in 2001, IPO in 2005, Global presence in 2015 ▪ Headquartered in Lake Success, New York ▪ ~ 4, 5 00 employees ▪ 2015 Estimated Revenue: $ 1.1 billion (mid - point of guidance) ▪ 2015 Estimated Adjusted EBITDA: $ 225 million (mid - point of guidance) ▪ S ervices customers in more than 90 countries Business Description: ■ Dealertrack’s SaaS software solutions and services enhance efficiency and profitability for all major segments of the automotive retail industry, including dealers, lenders, OEMs, third - party retailers, aftermarket providers and other service providers ■ Operates the largest online credit application network in the United States and Canada ■ In 2015, acquired incadea , a leading global provider of DMS software and services Dealertrack Overview
4 ▪ Most comprehensive suite of solutions in the industry ▪ Leading provider of SaaS software solutions and services that enhance the efficiency and profitability for all major segments of the U.S. automotive retail industry ▪ Successfully integrating and leveraging Dealer.com’s innovative digital marketing solutions with Dealertrack’s in - store and online solutions ▪ A leading provider of a Dealer Management System on a single global platform in over 90 countries through incadea ▪ ~ $7 billion SaaS and transaction market opportunity ▪ ~$10 billion digital marketing market opportunity anticipated to double by end of 2018 ▪ ~$4 billion international market opportunity ▪ Consistent track record of growth and profitability ▪ Double - digit organic revenue growth ▪ Predictable business model with highly visible, recurring revenue ▪ Seasoned management team with extensive industry experience Investment Highlights

5 Our Vision Deliver the market leading suite of integrated technologies capable of transforming automotive retailing… globally . 2001 2007 2014 Revolutionized automotive credit. Offered end - to - end tools to drive efficiency. Provided our clients with the power to transform automotive retail. 1999 Elevated the role of digital in car buying. 2015+ Global expansion.

6 Dealertrack’s Network Aftermarket providers, accessory providers, OEMs and OpenTrack partners Third Party Participants Other Information and Service Providers Lenders 1,500+ U.S. lenders connected to Dealertrack’s network Credit bureaus, used car value guides, identity verification services Dealers 20,600+ active U.S. auto dealers on Dealertrack’s network 24,700+ dealers with Dealertrack subscriptions (U.S. & Canada) Reflects business as of March 31 , 2015.

7 Technology Is Transforming The Auto Industry SELF DIRECTED Personalized Shopping Experience TEDIOUS 3 to 4 Hours in the Dealership FAST Process is Measured in Minutes not Hours RIGID / PROTIFABLE Limited Options FLEXIBLE / PROFITABLE Transparent and Predictable UNCOMFORTABLE Unpleasant Interactions and Negotiation ENJOYABLE Building & Strengthening Relationships TODAY TRANSFORMED CONTROLLED Dealerships Driving the Process

8 4,500+ Team members worldwide 20,600+ Dealerships 94%+ of U.S. franchise dealers 20+ OEMs 1,500+ Lenders 100M+ Transactions Annually Generating $1 B + In Expected 2015 Revenue Connecting with supporting and o ver 4 5M + Unique visitors / month on 13,000+ Dealer Websites “Touching” 3 of 4 Cars sold in the U.S. and Canada and hosting “Insight into” 1 out of 4 Buy/Sell Lists & 5M+ Inventory Listings and and Managing 41M+ Financed Titles 3M+ Vehicles Transported We Have Unique Capabilities To Enable Change in 90+ Countries Investing $175M+ In R&D / IDS by

9 Subscription - Based Solutions Dealer Management Solutions DMS ERP system for dealers that provides easy - to - use tools and data to enhance efficiency. Digital Marketing Solutions Digital marketing and digital retailing solutions enabling dealers to move more of the in - store sales process online. F&I Solutions Streamlines the entire vehicle sales and purchase process, while helping dealers meet legal and regulatory requirements. Inventory Solutions Desktop and mobile tools to help manage and merchandise inventory to achieve faster turns and higher profits.

10 Facilitating Workflow in the Dealership
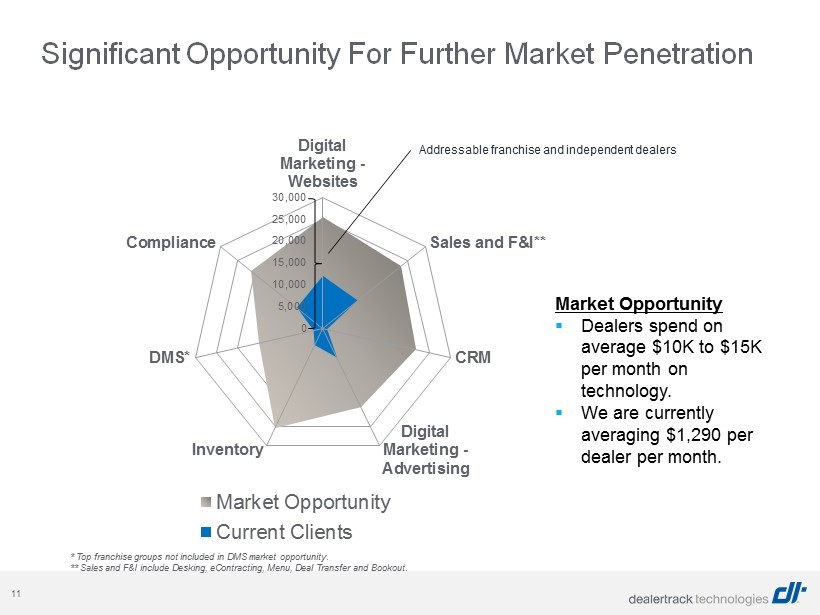
11 0 5,000 10,000 15,000 20,000 25,000 30,000 Digital Marketing - Websites Sales and F&I** CRM Digital Marketing - Advertising Inventory DMS* Compliance Market Opportunity Current Clients Significant Opportunity For Further Market Penetration * Top franchise groups not included in DMS market opportunity. ** Sales and F&I include Desking, eContracting, Menu, Deal Transfer and Bookout. Addressable franchise and independent dealers Market Opportunity ▪ Dealers spend on average $10K to $15K per month on technology. ▪ We are currently averaging $1,290 per dealer per month.

12 U.S. Market Opportunity Has Increased 2006 Compliance eContracting Menu Desking Bookout Deal Transfer 2008 Inventory DMS 2014 Dealer.com ASR Pro CRM / CFM Digital Retailing 2010 Central Dispatch AAX 2012 eCarlist ClickMotive $1,700 $3,400 $ 4,500 $6,000 $13,000 Monthly subscription revenue opportunity per Dealership
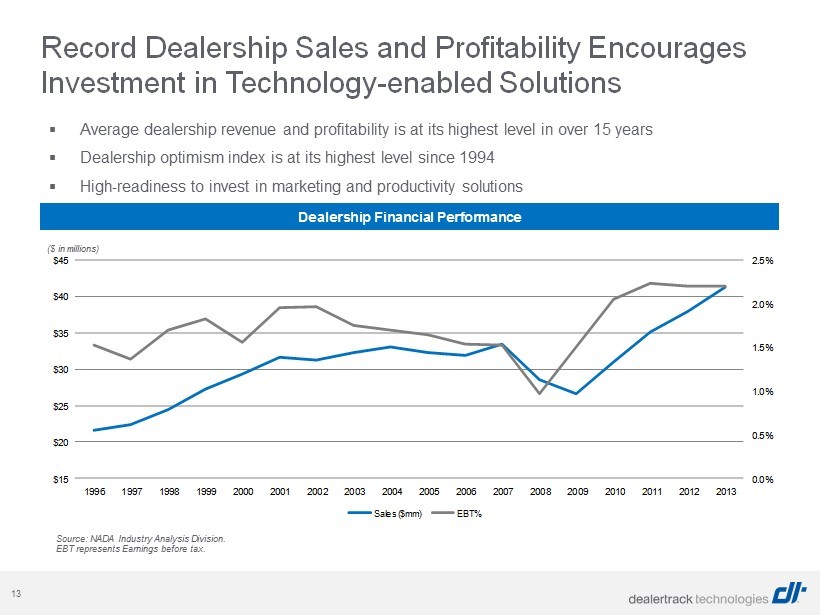
13 ▪ Average dealership revenue and profitability is at its highest level in over 15 years ▪ Dealership optimism index is at its highest level since 1994 ▪ High - readiness to invest in marketing and productivity solutions Source: NADA Industry Analysis Division. EBT represents Earnings before tax. Record Dealership Sales and Profitability Encourages Investment in Technology - enabled Solutions Dealership Financial Performance 0.0% 0.5% 1.0% 1.5% 2.0% 2.5% $15 $20 $25 $30 $35 $40 $45 1996 1997 1998 1999 2000 2001 2002 2003 2004 2005 2006 2007 2008 2009 2010 2011 2012 2013 Sales ($mm) EBT% ( $ in millions)
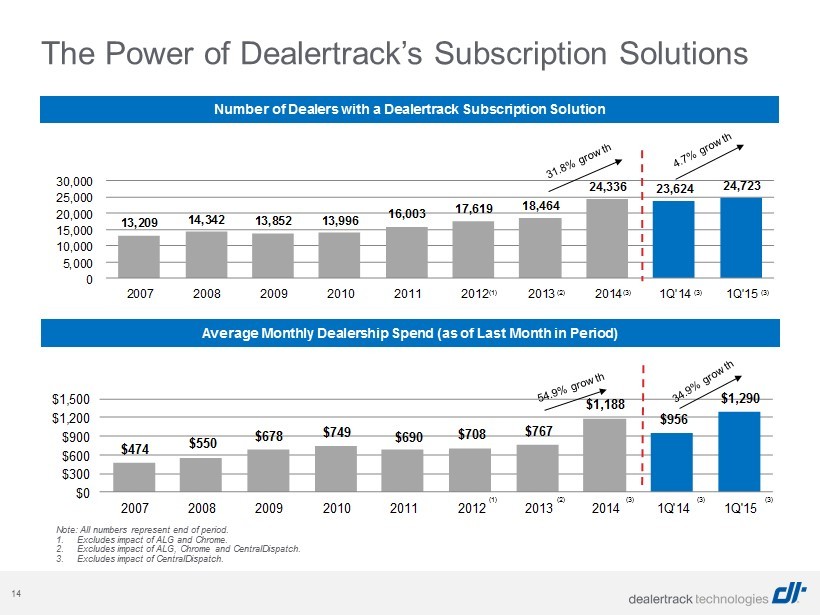
14 $474 $550 $678 $749 $690 $708 $767 $1,188 $956 $1,290 $0 $300 $600 $900 $1,200 $1,500 2007 2008 2009 2010 2011 2012 2013 2014 1Q'14 1Q'15 13,209 14,342 13,852 13,996 16,003 17,619 18,464 24,336 23,624 24,723 0 5,000 10,000 15,000 20,000 25,000 30,000 2007 2008 2009 2010 2011 2012 2013 2014 1Q'14 1Q'15 The Power of Dealertrack’s Subscription Solutions Note: All numbers represent end of period. 1. Excludes impact of ALG and Chrome. 2. Excludes impact of ALG, Chrome and CentralDispatch. 3. Excludes impact of CentralDispatch. Number of Dealers with a Dealertrack Subscription Solution Average Monthly Dealership Spend (as of Last Month in Period) (1) (2) (3) (3) (3) (1) (2) (3) (3) (3)

15 Transaction - Based Solutions F&I Solutions Largest online credit application processing networks in the U.S. and Canada Processing Solutions Electronic motor vehicle registration, lien and titling, and digital document services

16 Growing Number of Transactions in Car Buying Process Processing an increasing number of transactions on a single car sale through Dealertrack’s network * Verification services can either be transaction or subscription revenue. ** Additional contract related transactions can occur based on lenders’ participation in digital document services. Note: Not all cars sold are processed through the Dealertrack’s network. Dollar amounts are illustrative of US pricing and may not reflect actual pricing. Dealer Dealer Lender Lender Lender Verify ID* and pull credit bureau Submit credit application Process contract** Vehicle registration Title and lien administration ~1 to 2 transactions ~2 to 4 transactions ~1 to 2 transactions ~1 transaction ~1 to 2 transactions $0.05 to $1.00 $1.50 to $5.00 $2.50 to $5.00 $2.00 to $25.00 $1.50 to $5.00 $29.00 Revenue Potential per Car Sold

17 0.60 0.65 0.70 0.75 0.80 0.85 0.90 0.95 1.00 Jan-08 Apr-08 Jul-08 Oct-08 Jan-09 Apr-09 Jul-09 Oct-09 Jan-10 Apr-10 Jul-10 Oct-10 Jan-11 Apr-11 Jul-11 Sep-11 Dec-11 Mar-12 Jun-12 Sep-12 Dec-12 Mar-13 Jun-13 Sep-13 Dec-13 Mar-14 Jun-14 Sep-14 Dec-14 Mar-15 Submissions per unique applicant have been rising back to 2008 levels. Source: New car sales – Automotive News. Used car sales – CNW Research. Today: 0.91 Trough, July 2009: 0.67 Transaction Revenue Drivers Increasing Application Submissions Monthly Submissions per Applicant for New and Used Cars

18 Dealertrack’s Opportunity To Grow Electronic Lien & Registration Revenue Dealertrack ELT Dealertrack Electronic Registrations Both ELT and Electronic Registrations (Market) Electronic Registrations Only (Market) ELT Only (Market) NM CO UT NV OR MT ND WY KS OK AR MO LA MS AL TN KY MN WI MI IL IN OH CA AR AZ TX WA ID SD NE IA FL GA SC NC VA WV PA NY ME NH VT HI MD DE NJ CT RI MA √ √ √ √ √ √ √ √ √ √ √ √ √ √ √ √ √ √ √ √ √ √ √ √ √ √ √ √ √ √ √ √ √ √ √ √

19 16.5 14.3 14.3 13.2 12.8 12.8 13.8 14.9 15.7 15.6 0.0 2.0 4.0 6.0 8.0 10.0 12.0 14.0 16.0 18.0 2005 2006 2007 2008 2009 2010 2011 2012 2013 2014 2015E 17.0 16.5 16.2 13.2 10.4 11.6 12.8 14.5 15.6 16.5 0.0 2.0 4.0 6.0 8.0 10.0 12.0 14.0 16.0 18.0 2005 2006 2007 2008 2009 2010 2011 2012 2013 2014 2015E Transaction Revenue Drivers: Car Sales Continue to Improve U.S. New Car Sales by Franchised Dealers U.S. Used Car Sales by Franchised Dealers (units in millions) TRAK Guidance (units in millions) Two primary drivers of Dealertrack’s transaction revenue are car sales and consumer credit availability. TRAK Guidance Source: New car sales – Automotive News. Used car sales – CNW Research and DT estimates. 2014 car sales (new + used) from franchise dealers were 32.1 million units and we expect a 2 - 3% increase for 2015

20 0.5 22.5 25.0 27.5 30.0 32.5 35.0 $5.50 123.8 137.5 151.3 165.0 178.8 192.5 $6.00 135.0 150.0 165.0 180.0 195.0 210.0 $6.50 146.3 162.5 178.8 195.0 211.3 227.5 $7.00 157.5 175.0 192.5 210.0 227.5 245.0 $7.50 168.8 187.5 206.3 225.0 243.8 262.5 $8.00 180.0 200.0 220.0 240.0 260.0 280.0 Predictable Transaction Revenue with Baseline Approaching $200 Million Annually North American Cars by Franchise Dealers (units in millions) Source: New car sales – Automotive News. Used car sales – CNW Research and DT estimates, Canada New – Desrosiers, Canada Used – DT Estimates. Average Transaction Revenue per Car Sold Approx. Exclusivity: Credit Apps 20%, Contracting 30%, CMS 25% Baseline car sales of 25.0 to 27.5 million annually and revenue generated per car sold of $7.00 to $7.50 equates to expected minimum annual recurring transaction revenue of $175 million to $206 million . * Increase reflects addition of RTS and CMS solutions. ** Increase reflects addition of Casey & Casey and VINtek solutions. 33.9 33.5 29.7 26.5 27.7 29.5 32.9 34.8 35.8 0.0 8.0 16.0 24.0 32.0 40.0 2006 2007 2008 2009 2010 2011 2012 2013 2014 $4.4 $5.6 $6.0 $5.4 $5.5 $6.6 $7.0 $8.1 $9.4 $0.0 $2.0 $4.0 $6.0 $8.0 $10.0 2006 2007 2008 2009 2010 2011* 2012 2013** 2014**

21 Late - Model Used Vehicle Supply Forecast

22 Digital Marketing Solutions Websites An optimal experience from every device - desktop, mobile or tablet Digital Retailing Flexible workflow solutions for online transacting Advertising Retargeting, paid search, display, and social media to reach the most relevant audience everywhere
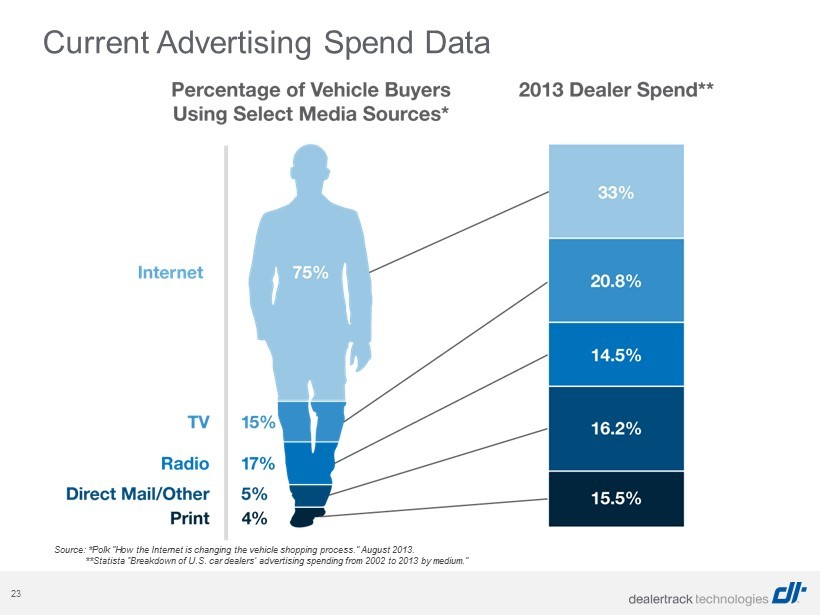
23 Source: *Polk ”How the Internet is changing the vehicle shopping process.” August 2013. **Statista “Breakdown of U.S. car dealers’ advertising spending from 2002 to 2013 by medium.” Current Advertising Spend Data

24 Source: comScore (June 2014) Proven Leader in Driving Consumer Engagement Unique Visitors – 2014 YTD Monthly Average Desktop Mobile Our 13,000+ websites attract over 45+ million unique visitors per month

25

26 Advertising Channels Our combination of paid search, network and premium display, and social provides complete coverage across all digital ad opportunities. Unified Advertising Dashboard Connects cross - channel campaign results with market intelligence, providing performance transparency and forecasting, and precise customization of ad spending. Media Consultants Align campaigns with your strategy and leverage Real Time Bidding technology to maximize every campaign’s effectiveness. 99 The Dealer.com UAX covers of the Web % Dealer.com Advertising Overview
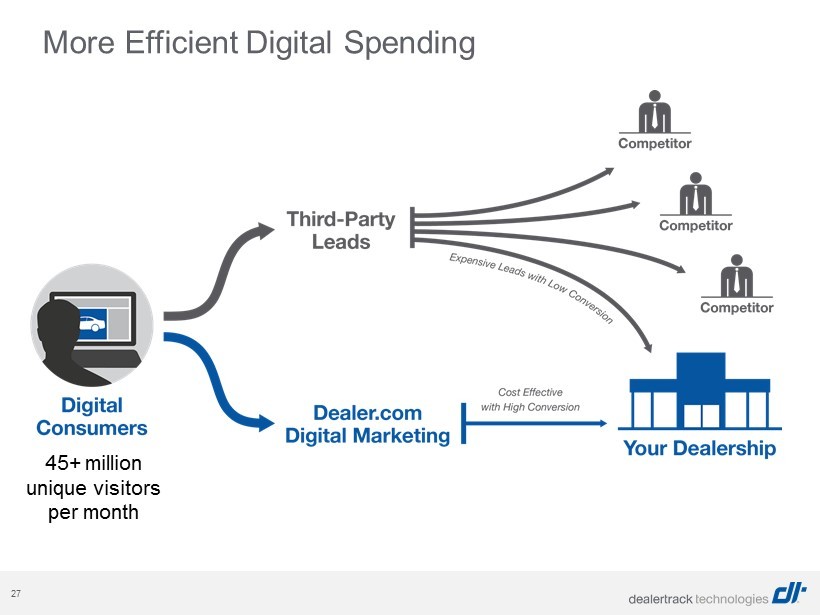
27 More Efficient Digital Spending 45+ million unique visitors per month

28 Growth Strategy & Financial Results

29 Dealertrack’s Core Growth Strategy • New lender relationships (credit, title, lien and BPO) • New subscribing dealer relationships • Additional states and expanding geographic market (entering new countries) Additional Market Share Gains • Providing a comprehensive suite of solutions makes marketing and cross - selling easier • Increases stickiness of customer relationships • Better facilitates end - to - end workflow solutions Greater Wallet Share of Existing Customers • Innovate new features, functions and integration for products • Add value to subscription products to improve dealership efficiency and profitability • Enhance core credit application functionality New Products and Services • Acquire complementary technologies and services to increase operating leverage • Use our networks for distribution of new products and services Strategic Acquisitions
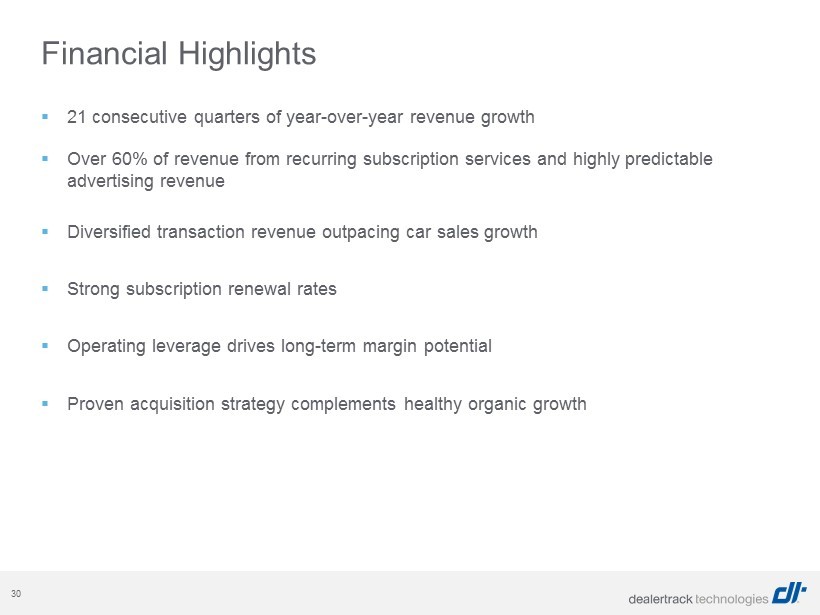
30 ▪ 21 consecutive quarters of year - over - year revenue growth ▪ Over 60% of revenue from recurring subscription services and highly predictable advertising revenue ▪ Diversified transaction revenue outpacing car sales growth ▪ Strong subscription renewal rates ▪ Operating leverage drives long - term margin potential ▪ Proven acquisition strategy complements healthy organic growth Financial Highlights
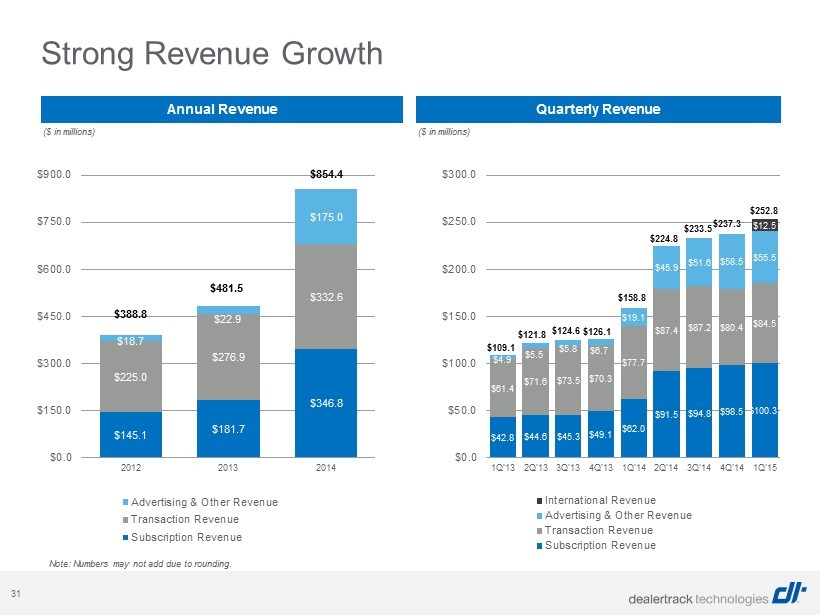
31 Strong Revenue Growth Annual Revenue Quarterly Revenue ($ in millions) ($ in millions) Note: Numbers may not add due to rounding. $145.1 $181.7 $346.8 $225.0 $276.9 $332.6 $18.7 $22.9 $175.0 $0.0 $150.0 $300.0 $450.0 $600.0 $750.0 $900.0 2012 2013 2014 Advertising & Other Revenue Transaction Revenue Subscription Revenue $388.8 $481.5 $854.4 $42.8 $44.6 $45.3 $49.1 $62.0 $91.5 $94.8 $98.5 $100.3 $61.4 $71.6 $73.5 $70.3 $77.7 $87.4 $87.2 $80.4 $84.5 $4.9 $5.5 $5.8 $6.7 $19.1 $45.9 $51.6 $58.5 $55.5 $12.5 $0.0 $50.0 $100.0 $150.0 $200.0 $250.0 $300.0 1Q'13 2Q'13 3Q'13 4Q'13 1Q'14 2Q'14 3Q'14 4Q'14 1Q'15 International Revenue Advertising & Other Revenue Transaction Revenue Subscription Revenue $109.1 $121.8 $124.6 $126.1 $158.8 $224.8 $233.5 $237.3 $252.8

32 $86 $97 $118 $193 24% 25% 24% 23% 20% 25% 30% 35% 40% $0 $50 $100 $150 $200 2011 2012 2013 2014 Adj. EBITDA Adj. EBITDA Margin $24 $33 $33 $28 $31 $50 $57 $55 $40 22% 27% 26% 22% 19% 22% 24% 23% 16% 0% 15% 30% 45% 60% $0 $15 $30 $45 $60 1Q'13 2Q'13 3Q'13 4Q'13 1Q'14 2Q'14 3Q'14 4Q'14 1Q'15 Adj. EBITDA Adj. EBITDA Margin $65 $71 $82 $30 18% 18% 17% 4% 0% 10% 20% 30% 40% 50% $0 $20 $40 $60 $80 $100 2011 2012 2013 2014 Cash Flow from Operations Operating Cash Flow Margin $43 $49 $59 $82 $0 $25 $50 $75 $100 2011 2012 2013 2014 ($ in millions) ($ in millions) Annual Adj. EBITDA and Margin Annual Cash Flow from Operations Quarterly Adj. EBITDA and Margin Annual Adjusted Net Income ($ in millions) ($ in millions) Strong Adj. EBITDA and Cash Flow Trends $134* * After adjusting for the impact of acquisition and acquisition - related costs.

33 Appendix

34 Other niche players (Compliance / Menu / Desking) Other niche players Note: Selected list does not include all competitors. DMS / Sales Subscription Products Credit Application Network Vehicle Registration / Title Management Inventory Management Solutions Digital Marketing Solutions (Websites & Advertising) Selected Competitive Landscape

35 22,043 19,652 16,690 16,829 17,543 19,067 20,046 19,770 20,719 20,661 536 733 823 823 1,120 1,261 1,410 1,539 1,443 1,557 0 500 1,000 1,500 2,000 2,500 0 5,000 10,000 15,000 20,000 25,000 2007 2008 2009 2010 2011 2012 2013 2014 1Q'14 1Q'15 Active Dealers Lenders Active Dealers and Lenders in Dealertrack’s U.S. Network Note: Numbers represent end of period. Number of Transactions (in millions) 71.5 90.9 79.7 51.4 49.4 74.5 87.8 101.9 119.4 28.6 30.6 0.0 30.0 60.0 90.0 120.0 2006 2007 2008 2009 2010 2011 2012 2013 2014 1Q'14 1Q'15 The Power of Dealertrack’s Network - Growth in Dealers, Lenders and Number of Transactions

36 New and Used Car Sales 2015 Growth 1Q14 2Q14 3Q14 4Q14 Jan-15 Feb-15 Mar-15 1Q15 Y/Y Q/Q SAAR 1 15,650 16,572 16,823 16,873 16,660 16,240 17,110 16,670 6.5% (1.2%) Actual Units 1 3,741 4,423 4,268 4,092 1,152 1,259 1,546 3,957 5.8% (3.3%) Fleet 2 783 878 650 680 230 290 311 832 6.3% 22.3% Retail 2,958 3,545 3,618 3,412 922 968 1,235 3,125 5.6% (8.4%) Financed 3 2,446 3,060 3,127 2,914 756 810 1,040 2,606 6.5% (10.6%) Cash 4 513 486 491 498 166 132 195 493 (3.7%) (1.0%) USED Actual Units 5 2,677 4,662 4,628 3,661 890 740 1,113 2,743 2.5% (25.1%) Actual Units 6,418 9,085 8,896 7,752 2,042 1,999 2,659 6,700 4.4% (13.6%) TOTAL Retail Units 5,635 8,207 8,246 7,073 1,812 1,708 2,348 5,868 4.1% (17.0%) Fleet 783 878 650 680 230 290 311 832 6.3% 22.3% NEW (1) Source: Automotive News. (2) Source: JD Power. (3) Estimated. (4) Source: AutoCount. (5) Source: CNW marketing and DT’s estimates. CNW no longer available as a source after January 2015. U.S. - New and Used Car Sales (in 000s) Note: Numbers may not add due to rounding.

37 The recession and OEM bankruptcies resulted in franchised dealership closures and consolidation. We believe the level of U.S. auto dealerships has stabilized after decreasing from 2007 to 2012. 21,725 21,650 21,640 21,495 21,200 20,770 20,010 18,460 17,700 17,540 17,635 17,930 2003 2004 2005 2006 2007 2008 2009 2010 2011 2012 2013 2014 Source: NADA. Number of dealerships as of January 1 each year . * As of 12/31/2014. Number of U.S. Franchised Auto Dealerships Number of U.S. Franchised Auto Dealerships *

38 Reconciliation of GAAP Net Income to Non - GAAP Financial Measures Adjusted EBITDA Reconciliation ($ millions) 2011 2012 2013 2014 1Q15 Net income (loss) $65.1 $20.5 $5.9 ($17.3) ($22.7) Interest income (0.3) (0.7) (0.5) (0.5) (0.1) Interest expense - cash 0.9 3.4 3.8 20.9 6.4 Interest expense - non-cash - 7.4 9.5 13.1 3.2 Provision for (benefit from) income tax (2.4) 12.2 (1.3) (11.4) (8.8) Depreciation of property and equipment and amortization of capitalized software and website costs 21.0 23.3 31.0 50.3 15.9 Amortization of acquired identifiable intangibles 29.7 28.3 31.5 86.2 23.2 EBITDA $114.0 $94.4 $79.9 $141.4 $17.1 Stock-based Compensation 11.5 13.6 14.4 17.1 5.3 Gain on disposal of subsidiary and sale of other assets (47.3) (33.2) - (9.8) - Restructuring, integration and other related costs 1.2 1.5 6.8 19.0 5.7 Acquisition-related and other professional fees 4.8 2.7 5.2 13.3 9.5 Change in fair value of warrants (1.0) 6.3 - - - Acquisition related consideration changes and compensation (1.1) 1.8 2.0 4.2 0.2 Rebranding expense - 1.9 2.1 - - Amortization of equity method investment basis difference - 4.0 2.8 2.2 0.4 Realized (gain) loss on securities (0.4) - (0.4) - - Contra-revenue 4.2 4.2 4.9 5.3 1.5 Adjusted EBITDA (non-GAAP) $85.9 $97.2 $117.7 $192.6 $39.8

39 Reconciliation of GAAP Net Income to Non - GAAP Financial Measures (cont.) Adjusted Net Income Reconciliation ($ millions) 2011 2012 2013 2014 1Q15 Net income (loss) $65.1 $20.5 $5.9 ($17.3) ($22.7) Deferred tax asset valuation allowance (non-taxable) (25.1) - - - - Amended state tax returns – benefits (non-taxable) (0.2) - (0.0) - - Stock-based compensation expense (excluding restructuring costs) 11.5 13.6 14.4 17.1 5.3 Integration and other related costs (including stock-based compensation) 1.2 1.6 7.0 19.8 5.7 Amortization of acquired identifiable intangibles 29.7 28.3 31.5 86.2 23.2 Acquisition-related and other non-recurring professional fees 4.7 2.7 5.2 13.5 9.5 Realized (gain) on securities (non-taxable) (0.4) - (0.4) - - Gain on sale or disposal of subsidiary (47.3) (33.2) - (9.8) - Change in fair value of warrants (1.0) 6.3 - - - Acquisition related earn-out compensation expense, net (1.1) 1.8 2.0 4.2 0.2 Contra-revenue 4.2 4.2 4.9 5.3 1.5 Interest expense - non-cash (not tax impacted) - 7.4 9.5 13.1 3.2 Amortization of equity method investment basis difference - 4.0 2.8 2.2 0.4 Accelerated depreciation of certain technology assets - 1.0 - - - Rebranding expense - 1.9 2.1 - - Tax impact of adjustments 2.1 (11.1) (26.2) (51.9) (16.1) Adjusted Net Income (non-GAAP) $43.4 $49.1 $58.8 $82.3 $10.3

40 Reconciliation of GAAP Net Income to Non - GAAP Financial Measures by Income Statement Category GAAP Non-GAAP As Reported Adjusted 2015 Ref 2014 Three Months Ended March 31, 2015 Net Loss Ref Adjustments Net Income Ref Net loss (GAAP) (22,728)$ (11,642)$ Net revenue 252,754$ A 1,486 254,240$ Adjustments: Cost of revenue 143,468 B (24,560) 118,908 Interest expense - non-cash (not tax-impacted) 3,191 E 3,170 Research and development 33,260 C (1,247) 32,013 Amortization of acquired identifiable intangibles 23,201 1 20,696 Selling, general and administrative 94,465 D (18,215) 76,250 Stock-based compensation 5,315 2 4,123 Total operating expenses 271,193 (44,022) 227,171 Contra-revenue 1,486 A 1,157 Income from operations (18,439) 45,508 27,069 Acquisition-related and other professional fees 9,545 D 6,974 Interest expense, net (9,557) E 3,191 (6,366) H Acquisition-related contingent consideration changes and compensation expense, net 248 3 929 Other income, net (5,712) - (5,712) Integration and other related costs 5,713 4 6,481 Earnings from equity method investment, net 2,200 F 437 2,637 Gain on sale of investment K (9,828) Loss before benefit from income taxes, net (31,508) 49,136 17,628 Amortization of equity method investment basis difference 437 F 547 Benefit from income taxes, net 8,780 G (16,090) (7,310) I Tax impact of adjustments (16,090) G (11,120) Net loss (22,728)$ 33,046$ 10,318$ Adjusted net income (non-GAAP) 10,318$ 11,487$ EBITDA Adjustments: Additional classification details: Depreciation and amortization 15,896$ J Amortization of acquired identifiable intangibles 23,201$ 1 20,696$ Interest expense, net 6,366 H Revenue - A - Acquisition related interest expense, net (75) D Cost of revenue 23,201 B 20,696 Provision for income taxes, net 7,310 I Adjusted EBITDA 39,815$ Stock-based compensation 5,315$ 2 4,123$ Cost of revenue 327 B 276 Research and development 923 C 752 GAAP Non-GAAP Selling, general and administrative 4,065 D 3,095 As Reported Adjusted Three Months Ended March 31, 2014 Net Loss Ref Adjustments Net Income Ref Acquisition-related contingent consideration changes and compensation expense, net 248$ 3 929$ Cost of revenue - B 36 Net revenue 158,808$ A 1,157 159,965$ Research and development 36 C - Cost of revenue 89,907 B (24,957) 64,950 Selling, general and administrative 212 D 893 Research and development 24,048 C (1,812) 22,236 Selling, general and administrative 67,486 D (12,434) 55,052 Integration and other related costs 5,713$ 4 6,481$ Total operating expenses 181,441 (39,203) 142,238 Cost of revenue 1,032 B 3,949 Income from operations (22,633) 40,360 17,727 Research and development 288 C 1,060 Interest expense, net (5,810) E 3,170 (2,640) H Selling, general and administrative 4,393 D 1,472 Other income, net 709 - 709 Gain on sale of investment 9,828 K (9,828) - Depreciation and amortization 15,896$ J 9,906$ Earnings from equity method investment, net 1,625 F 547 2,172 Cost of revenue 10,831 7,802 Income before provision for income taxes, net (16,281) 34,249 17,968 Research and development 1,545 806 Provision for income taxes, net 4,639 G (11,120) (6,481) I Selling, general and administrative 3,520 1,987 Net income (11,642)$ 23,129$ 11,487$ Fixed asset accelerated amortization / depreciation - (689) EBITDA Adjustments: Depreciation and amortization 9,906$ J Interest expense, net 2,640 H Provision for income taxes, net 6,481 I Adjusted EBITDA 30,514$ (Unaudited) (Unaudited) Three Months Ended March 31, DEALERTRACK TECHNOLOGIES, INC. DEALERTRACK TECHNOLOGIES, INC. Reconciliation of GAAP Net (Loss) Income to Non-GAAP Adjusted Net Income Proforma Reconciliation of GAAP Net (Loss) Income to Non-GAAP Measures (Dollars in thousands) (Dollars in thousands)

41 Revenue Adjusted for Acquisitions 1. Adjustments for Dealer.com and ASR Pro acquisitions. 2. Subscription and advertising revenue was adjusted for pro forma revenue as if acquisition of Dealer.com was included in prior results. ($ in millions) Year over Year Comparison Acquisitions Acquisitions Acquisitions Y/Y Comparison As Reported Adj'ments (3) Adjusted As Reported Adj'ments (1) Adjusted Transaction Revenue $77.7 $0.0 $77.7 $84.5 $0.0 $84.5 Subscription Revenue 62.0 $24.5 $86.5 100.3 (0.8) 99.5 Advertising & Other Revenue 19.1 $22.8 $41.9 55.4 (0.1) 55.4 Total Revenue $158.8 $47.3 $206.1 $240.2 ($0.9) $239.3 As Reported '15 As Reported vs vs Organic Growth, Y/Y Adjusted '14 As Reported Growth Transaction Revenue 8.7% 8.7% 8.7% Subscription Revenue 15.9% 61.8% 15.0% Advertising & Other Revenue 32.5% 190.3% 32.3% Total Revenue 16.6% 51.3% 16.1% Sequential Quarterly Comparison Acquisitions Acquisitions AcquiSitionS Q/Q Comparison As Reported Adj'ments Adjusted As Reported Adj'ments (2) Adjusted Transaction Revenue $80.4 $0.0 $80.4 $84.5 $0.0 $84.5 Subscription Revenue 98.5 0.0 98.5 100.3 (0.8) 99.5 Advertising & Other Revenue 58.5 0.0 58.5 55.4 (0.1) 55.4 Total Revenue $237.3 $0.0 $237.3 $240.2 ($0.9) $239.3 As Reported '15 As Reported vs vs Organic Growth, Q/Q Adjusted '14 As Reported Growth Transaction Revenue 5.1% 5.1% 5.1% Subscription Revenue 1.8% 1.8% 1.0% Advertising & Other Revenue (5.1%) (5.1%) (5.3%) Total Revenue 1.2% 1.2% 0.8% 3 Months Ended March 31, 2014 3 Months Ended December 31, 2014 3 Months Ended March 31, 2015 3 Months Ended March 31, 2015

42 Non - GAAP Net Cash Provided by Operating Activities 1. Assumes amounts are paid in same period as incurred. 2. Acquisition related contingent consideration and compensation expense are generally accrued over multiple periods (included in adjustment s a t (1 )). The adjustment reflects payment of such staypay and earnout amounts . 3. Adjustment Includes the impact of payment of significant acquired liabilities. ($ in thousands) YTD QTD Q1 Q2 Q3 Q4 Q4 Q1 March 31, 2014 June 30, 2014 September 30, 2014 December 31, 2014 December 31, 2014 March 31, 2015 Net cash (used) provided by operating activities (92,864) 30,179 48,074 45,001 30,390 (23,246) Integration and other related costs (1) 5,792 3,542 3,410 6,213 18,957 5,713 Acquisition-related and other professional fees (1) 6,974 900 315 5,143 13,332 9,470 Acquisition related contingent consideration and compensation expense, net (2) - 250 709 1,856 2,815 1,945 Purchase accounting and other acquisition related impacts (3) 69,000 - - - 69,000 6,693 Non-GAAP net cash provided by operating activities (11,098) 34,871 52,508 58,213 134,494 575 QTD

43 2015 Estimated Full Year Earnings Guidance and Assumptions Total New & Used Car Sales by Franchise Dealers 32.7 - 33.1 million units Weighted Average Shares Outstanding 57.2 million (Non - GAAP) 56 million (GAAP) Additional potential impact of dilution from the combination of convertible debt above warrant trigger and / or changes in current stock price are not included in share count. Cost Addbacks for Non - GAAP Measures $24.5 - $26.5 million Includes certain acquisition related foreign exchange gains / losses, professional fees, integration and other related costs, acquisition related compensation expense, and fair value adjustments Effective Tax Rate on Add - backs for Non - GAAP Measures 38% Effective Tax Rate on for GAAP Net Income 28% Revenue $1.085 - $1.105 billion Net of $4 million contra revenue. Expected $56 million contribution of incadea . GAAP Net Loss $(25.0) - $(21) million GAAP Net Loss per Share (Basic) $(0.45) - $(0.38) Adjusted EBITDA $222 - $227 million Adjusted Net Income (ANI) $80 - $85 million ANI per Share (Diluted) $1.40 - $1.49 Capital Expenditures $96 - $100 million . Guidance Measure Range Comments Guidance Assumption Assumption Comments